the impact of the asian miracle on the theory of … impact of the asian miracle on the theory of...
TRANSCRIPT

NBER WORKING PAPER SERIES
THE IMPACT OF THE ASIAN MIRACLE ON THE THEORY OF ECONOMIC GROWTH
Robert W. Fogel
Working Paper 14967http://www.nber.org/papers/w14967
NATIONAL BUREAU OF ECONOMIC RESEARCH1050 Massachusetts Avenue
Cambridge, MA 02138May 2009
In writing this paper, I have made use of previous research reported in Fogel 1989a, 2004a, and 2005.Some of the previous findings have been updated. I have benefitted from the comments of Paul A.David, Stanley Engerman, Roderick Floud, Nathaniel Grotte, Mark Guglielmo, Bernard Harris, AllanMeltzer, Dwight Perkins, and Peter Temin. The views expressed herein are those of the author(s) anddo not necessarily reflect the views of the National Bureau of Economic Research.
NBER working papers are circulated for discussion and comment purposes. They have not been peer-reviewed or been subject to the review by the NBER Board of Directors that accompanies officialNBER publications.
© 2009 by Robert W. Fogel. All rights reserved. Short sections of text, not to exceed two paragraphs,may be quoted without explicit permission provided that full credit, including © notice, is given tothe source.

The Impact of the Asian Miracle on the Theory of Economic GrowthRobert W. FogelNBER Working Paper No. 14967May 2009JEL No. B2,O4,O53
ABSTRACT
This paper, divided into seven sections, considers the development of economic growth theory in lightof the spectacular advances of the economies of China, India, and Southeast Asia. Section 1 reviewsthe debate over the sources of technological change and the measurement of total factor productivitythat emerged during the second half of the 1950s. Section 2, “Convergence and Divergence,” dealswith the closing of the economic gap between the U.S. and other OECD nations that existed after WorldWar II and the increasing economic gap between OECD and Third World nations. Section 3, “TheAsian Miracle,” describes the new recognition among Western economists that the sustained, veryrapid growth in China and Southeast Asia was changing the global economic balance. Section 4, “EndogenousEconomic Growth,” deals with the work of a group of mainly verbal theorists, including Simon Kuznetsand T.W. Schultz, who sought to define social, political, demographic, religious, and ideological conditionsthat preceded the epoch of modern economic growth, which began in the late eighteenth or early nineteenthcenturies. That line of thought was extended by more mathematical economists who studied the inventionand modeled the diffusion of new technologies in agriculture (Zvi Griliches) and industry (EdwinMansfield). Section 5, “Bridges between Two Cohorts of Theorists on Technological Change,” comparesthe work of Griliches, Richard Nelson, and Dale W. Jorgenson, whose quantitative analysis of endogenoustechnological change spanned the period from the mid-1950s to the new cohort of growth theoriststhat emerged during the mid- to late-1980s. Section 6, “The Economic Historians,” focuses on theirinvestigations of the interrelationships of the evolution of social, economic, and political institutionsand on findings about the impact of institutional changes on invention, innovation, the process of technologicalchange, and economic growth. Section 7, “The Impact of the Asian Economic Miracle on GrowthTheory,” focuses on the theorizing about the likely impact of the rapidly expanding Asian economieson the shaping of the global economy over the next several decades.
Robert W. FogelDirector, Center for Population EconomicsUniversity of Chicago, Booth School of Business5807 S. Woodlawn Avenue, Suite 367Chicago, IL 60637and [email protected]

2
Before considering the impact of the “Asian Miracle” on growth theory, I need to consider when
the term Asian Miracle became common among economists and what ideas preceded it. I also need to
review the concept of growth theory, tracing its origins and its evolution. This is not an easy task
because of the complex way that theory, measurement, and the needs of economic policy have
interacted in the work of growth economists since World War II.
Nevertheless, I believe there is widespread agreement that two papers by Robert M. Solow,
both published in the second half of the 1950s (Solow 1956 and 1957) are nodal points in the huge
literature on the theory and measurement of long‐term economic growth.1 They became nodal points
despite the fact that similar growth models by others had been published about the same time. Solow
(2007) has recently singled out a paper by the Australian economist Trevor Swan (1956) that embodied
all of the elements of his model, but that had little impact on subsequent research.
1. Aggregate Production Functions, Total Factor Productivity, and Exogenous Technological Change
In his 2007 paper, Solow mused on this discrepancy. Why, he asked, did his paper become so
influential? The way to do it, he said, was to:
(i) keep it simple; (ii) get it right; and (iii) make it plausible. (By getting it right, I mean finding a
clear, intuitive formulation, not merely avoiding algebraic errors.) I suspect that all three of
these maxims were working for the 1956 paper. It was certainly simple; it didn’t get lost in the
complications and blind alleys that beset Trevor Swan’s attempt; and it was plausible in the
1 See also Solow (1958).

3
sense that it fitted the stylized facts, offered opportunities to test and calibrate, and didn’t
require you to believe in something unbelievable. (p. 4)
In his 1957 paper, Solow applied a Cobb‐Douglas production function to the explanation of the
growth of U.S. output, with the astounding result that increases in the inputs of labor and capital
explained only about 13 percent of the increase in output between 1909 and 1949. Eighty‐seven percent
was unexplained. Solow attributed this unexplained portion to improvements in technology, which he
treated as being outside of the model; hence the term: exogenous technological change.
From an empirical standpoint, perhaps the most important consequence of the Solow papers
was to shift the attention of economists from labor productivity to total factor productivity as the
principal measure of changes in economic efficiency or technological change. However, Solow’s analysis
did not emerge, like Athena, fully grown from the head of Zeus.
Economists had been struggling with the concept of total factor productivity for several
decades. Some such measure was, as pointed out by Griliches in 1996, much discussed in the 1930s,
especially in connection with the National Bureau of Economic Research programs on developing time
series in national income. 2 This concern led the Bureau to launch projects that produced long‐term time
series on the measurement of capital formation in various sectors and in the economy as a whole. An
interim report on the progress of this work was published by Goldsmith (1952). Bureau economists were
constructing indexes of output divided by total input in the late 1930s, the 1940s, and the 1950s, and
they identified such indexes as measures of the efficiency of the economy (see, for example, Copeland
and Martin 1938, Stigler 1947, Fabricant 1954, Kendrick 1955).
2 In Europe, Jan Tinbergen, in a 1942 paper published in German, used a Cobb‐Douglas function with an exponential time trend, which he interpreted as a measure of changes in efficiency for Germany, Great Britain, France, and the United States. But Tinbergen’s paper did not become known in the U.S. until much later.

4
Perhaps the most important Bureau paper on total factor productivity prior to Solow’s work was
published by Moses Abramovitz in 1956 under the title “Resource and Output Trends in the United
States since 1870.” Making use of Simon Kuznets’s data on real national income, he estimated that real
net product per capita had increased at an annual rate of 1.9 percent, quadrupling over the 75 years
between 1869–1878 and 1944–1953. He also computed an index of all resources, labor, and various
forms of property, weighted by their shares in national income. To his surprise, this index of inputs
explained only 14 percent of the increase in output over the 75 years. The remaining 86 percent was
due to an unexplained increase in productivity.
The results were not only surprising to Abramovitz, but also defied adequate explanation. He
called the unexplained rise in total factor productivity “the residual,” and also a “measure of our
ignorance.” He attributed much of the residual to errors in the measurement of the inputs. With respect
to labor, he singled out changes in the age structure of the labor force, which concentrated hours of
work at the most productive ages. He also noted the neglect of increases in skills and of investments in
health and education and in on‐the‐job training of labor.
On the side of capital, he emphasized the failure to measure the increased stock of knowledge,
improvements in the organization and technique of production, and greater investments in research and
development. He also pointed to, but did not attempt to measure, the contributions of increasing
returns to scale, which Edward Denison later put at 10 percent of the increase in total factor
productivity (Dension 1962).

5
2. Convergence and Divergence
In 1945, the idea of high‐performing Asian economies was not in the mind of American or
European economists. In the United States, economists worried about the problems created by the
demobilization of over 20 million people (half from military ranks and half from war industries) and their
integration into the civilian labor force. There were widespread fears that America might slide into a
severe new depression. In Europe, the central issues turned around the Allied occupation of Germany
and Italy and the restoration of the war‐devastated economies. In Asia, the central issues were the
demilitarization of Japan and the restoration of the nations that had been occupied by Japan. On the
horizon were problems related to the dismantling of the colonial empires of Britain, France, and other
European powers.
Several events between 1945 and 1950 set the stage for the political economy of the remainder
of the twentieth century. One was the outbreak of the Cold War and the strategy of containing the
expansionist ambitions of the Soviet Union. Another was the rapid recovery of Western Europe and the
transformation of West Germany into an ally in the anti‐communist coalition. A third was the
communist victory in the Chinese civil war that followed the defeat of Japan. Still another important
event was the partition of India into independent Hindu and Muslim nations. There was also the
emergence of newly independent governments throughout South and Southeast Asia3 that were each
struggling to find its road to rapid economic growth.
As Table 1 shows, the countries of South and Southeast Asia were at different economic levels in
1950, at the beginning of this quest. Japan, an occupied nation, had suffered severe reversals in fortune
and had slipped to a level of per capita income characteristic of a low middle‐income economy. Even the
3 As used in this paper, the term Southeast Asia applies to the first group of eight nations in Table 2.

6
more prosperous Asian nations shown in Table 1 had per capita incomes that were less than a quarter of
that of the United States. In contrast, the war‐ravaged economies of Europe were by 1950 already on
their way to a quarter century of unprecedented economic growth that would raise standards of living,
health, and life expectancy for ordinary people to levels that few would have predicted (Crafts and
Toniolo 1996). Thus, the stage was set for intense debates among economists and policymakers about
the way to deal with global disparities. Among the points at issue were the virtues of centralized and
decentralized planning and whether international trade was a handmaiden of domestic economic
growth or an obstacle to it.
When Western economists began talking and writing about convergence in the 1950s and
1960s, the focus of their conversation was not convergence between the West and the East, but
convergence between Western Europe and the United States. Immediately after World War II, the U.S.
was by far the richest country in the world, not only by per capita income but also by total income. With
just 7 percent of the world’s population, the U.S. accounted for a quarter of global GDP (cf. Nelson
1991).
This does not mean that Western economists lost sight of the rest of the world. During the
1950s and 1960s, they developed an increasing interest in the progress of the ex‐colonies of Asia,
particularly India and China. The political leadership of both countries was heavily influenced by the
Soviet model of centralized planning. Both countries developed successive five‐year plans for the
economic growth of their countries. These plans sought rapid economic growth by placing special
emphasis on the rapid development of heavy industry. Both taxed rural areas to subsidize cities and
urban industries.
However, India sought to achieve its objectives under a political democracy, in which some
industries would have government backing but the bulk of economic production and distribution would

7
be left to the private sector. It also embarked on a protectionist policy aimed at promoting infant
industries. New financial institutions were set up that placed the supply of capital largely under the
control of the government, which directed investment into sectors given prominence by the plan. The
first five‐year plan, which ran from 1951–1956, was successful in meeting its goals, and private
enterprise expanded. As indicated by Table 2, the annual rate of growth in per capita income during the
plan was in the neighborhood of 2 percent. However, annual net investment was in the neighborhood of
just 6 or 7 percent (Pepelases, Mears, and Adelman 1961, Malenbaum 1959, 1982).
By the early 1960s, the Indian economy began to stumble. Not all of the problems were due to
errors by policymakers. Some problems arose from border clashes with Pakistan and China. Some of the
food shortages were due to droughts. But the main pressure on the food supply was due to explosive
growth of population as mortality rates fell sharply. As a result of the successful public health measures
undertaken during the 1950s and 1960s, such killer diseases as cholera, malaria, and smallpox were
brought under control, helping life expectancy at birth to rise from 32 to 51 years between 1950 and
1968 (Chandrasekhar 1968). Moreover, growth of per capita income also raised the demand for food,
putting upward pressure on food prices that pinched both the urban and rural poor. Government efforts
at land reform may actually have increased rural inequality (Mellor et al. 1968, Blyn 1971). Attempts at
government‐controlled industrialization thwarted private investment and promoted uncompetitive
enterprises (Shenoy 1968, Sklaeiwitz 1966, Healy 1972, cf. Bhagwati and Chakravarty 1969). As a result,
Indian growth slipped badly during the first half of the 1960s (see Table 2).
Although India and China were the cases most frequently discussed by economists, attention
was also paid to other nations in Southeast Asia. During the 1960s, there was considerable pessimism
about Indonesia’s future. Although there was a spurt of economic growth immediately after
independence, during which the nation recovered from the setbacks associated with the Japanese

8
occupation, the economy stagnated between 1955 and 1965, a period long enough to make economists
wonder if Indonesia could overcome its problems (Mears 1961). Beginning with the mid‐1960s,
however, the country began vigorous growth that lasted for three decades (see Table 2). Malaysia and
Singapore also stagnated during the decade of the 1950s, contributing to the sense among some
Western economists that adverse institutional factors might thwart their development. But in these
countries, fortunes changed decisively in the 1960s.
Table 2 shows that eight Southeast Asian nations all grew vigorously from 1965 on, and that
several of them (Hong Kong, Taiwan and Thailand) had vigorous economic growth throughout the
second half of the twentieth century. Indeed, their growth rates far exceeded the previous growth rates
of the industrialized countries. Few American or European economists anticipated growth rates that
would double, triple, or quadruple the long‐term rates of the industrial leaders between 1820 and 1950.
The most startling change of fortune was in Japan. With the outbreak of the Korean War, United
Nations forces placed large orders with Japan, greatly stimulating its industrial growth. Even after the
end of fighting, Japan’s economy benefited from large orders for the build‐up of the U.S. military
establishment in the Pacific region. The Japanese export boom powered the dramatic rise in the
Japanese economy. In one industry after another, including scientific instruments, cameras, sewing
machines, and shipbuilding, Japanese firms displayed their command of the latest technology. During
the 1960s, Japan moved from producing under a half million cars to becoming the world’s second‐
largest supplier, displacing Germany and France among others. The rise of auto production helped
promote the expansion of steel and moved the country toward world preeminence in that basic product
(Allen 1972). As Table 2 shows, from 1950 through 1970, the growth of Japanese per capita income
exceeded that of all the other high‐performing economies. In the space of two decades, Japanese per
capita income increased more than fivefold, a feat that had required more than a century for the

9
nations that led the industrial revolution (Kuznets 1971a, Maddison 1995). Although the growth of
Japanese per capita income slowed after 1970, it still increased by about 40 percent between 1970 and
1980, making it the second largest economy in the world, bigger than France and the UK combined
(Maddison 1995).
During the late 1960s and early 1970s, many analysts became alarmed at what appeared to be
the unchecked growth of population in Asia. It was widely predicted that such growth would not only
swamp the capacity of South and Southeast Asia to feed itself, but would also smother the tenuous
economic growth of the region. In the 1950s, many demographers had predicted that population growth
would moderate because a decline in fertility would soon follow the decline in the death rate, which had
caused the Asian population explosion. That view was called the theory of the demographic transition.
But fertility rates remained high through the end of the 1960s, causing some demographers to declare
that the theory of the demographic transition was dead (Coale 1975). As it turned out, that gloomy
forecast was incorrect. As Table 3 shows, between 1970 and 1980, total fertility rates fell sharply in all
Southeast Asian nations. Today all of these nations, except for Malaysia and Indonesia, have total
fertility rates below replacement. Indeed, fertility rates in most of these nations are below the fertility
rates of three of the five rich nations shown in Table 3.
The forecast that Southeast Asia would be unable to feed itself because of the unbridled growth
of population also turned out be erroneous. Table 4 shows the food situation throughout South and
Southeast Asia in 1961. Per capita consumption of calories in China, even after the famine, was at or
below the level of consumption in England and France toward the end of the eighteenth century (cf.
Fogel, Floud, Harris, and Hong 2009). The same desperate situation prevailed in India, Thailand, and
Korea. By 2000, the food situation had changed dramatically. Despite the erroneous agricultural policies
that precipitated the famine of 1960–1961, and again slowed agriculture during the “Cultural

10
Revolution” of 1966–1967, China’s progress in agriculture between 1962 and 2000 has been remarkable
(Clark 1976, Lin 1998). China not only found a way to feed itself, but did so well enough to increase its
average daily consumption of calories by 73 percent, despite the near doubling of its population.
Although not as dramatic, there were also substantial gains in caloric consumption in the rest of South
and Southeast Asia, ranging from 12 to 68 percent. Another point worth noting is the improvement in
the quality of the diet, as indicated by the increase in the proportion of nutrients coming from animals.
In China, the rise was from under 4 to over 19 percent of total caloric consumption. Only Indonesia and
India still have levels of the consumption of animal products that hearken back to eighteenth‐century
conditions in England and France (cf. Fogel et al, forthcoming). Still another problem is the unequal
distribution of food in many of the nations of South and Southeast Asia. In these countries, the
proportion of low birth weights is still high, which implies the early onset of chronic disabilities at middle
and late ages, a problem that will contribute to the high cost of medical care for the elderly in future
years (Barker 1998, Doblhammer and Vaupel 2001, Fogel 2003, 2004b).
Let us now consider expectations of economic growth right after World War II, viewing them
from the standpoint of the present. At the close of World War II, there were wide‐ranging debates about
the future of capitalist economies that pivoted on the Keynesian proposition that a macroeconomic
equilibrium is possible at less than full employment and, in particular, the interpretation of that
proposition by Alvin Hansen in his 1938 presidential address to the American Economic Association
(Hansen 1939). Hansen argued that secular stagnation was likely because of: (1) the end of the frontier,
(2) the end of rapid population increase, and (3) the end of capital‐intensive technological change. The
key issue, as the stagnationists defined it, was not whether the growth of the GDP would come to an
end, but whether a high level of government spending was necessary to prevent a high level of
permanent unemployment, even if GDP did grow.
11
That such a debate would erupt in anticipation of the peace is not surprising. The alarm about
massive unemployment was widespread in 1943 and 1944 because the country was demobilizing over
11 million soldiers from the armed forces and there were some 9 million or more workers in defense
industries that were simultaneously being let go. So there were about 21 million people thrown on a job
market of about 60 million, including the armed forces and the defense establishment (U.S. Bureau of
the Census 1955, Table 220). But as it turned out, the recession of 1945 only lasted eight months and
was followed by a robust expansion that lasted 37 months. Moreover, the recession of 1949–1950
lasted 11 months and was followed by another robust expansion that lasted 45 months (U.S. Bureau of
the Census 2003, Table 771). The peak came in 1953 after the economy had already absorbed 20 million
potentially unemployed workers, and unemployment was below 3 percent by 1953. Total civilian
employment was up by 15 percent over the wartime peak (cf. Bratt 1953).
Although unemployment remained over 5 percent during some of the years of the long 106‐
month Kennedy‐Johnson expansion, it dropped to 3.5 percent in 1969. So even a quarter of a century
after the war, there were still economists who believed that the U.S. could not have an economy with
both growth and low unemployment unless there was a very big government sector. By the late 1950s,
the U.S. and other OECD countries were well into the post‐World War II expansion, now called “the
Golden Age,” with growth rates twice the long‐term average of the world leaders during 1840–1940.
Measured by per capita income, the long‐term average growth rate of the leaders prior to 1940 was
about 1.9 percent per annum and the growth rate during the Golden Age was, for Western Europe,
about 3.8 percent (Kuznets 1971a, Maddison 1995, Crafts and Toniolo 1996). Over the whole period
from 1950 to 1999, expansion multiples for GDP averaged about fivefold in Western Europe and the
United States (see Table 5). The wide‐ranging debates over the causes for the accelerated growth rates
of the Golden Age suggested some points of consensus. These included the reduction of barriers to

12
international trade, successful macroeconomic policies, and opportunities for catch‐up growth following
the end of World War II, especially in France, Germany, and Italy. The destruction of much of the pre‐
war capital stock, the reconstruction aid that rebuilt industry with a more advanced technology, the
successes of macroeconomic policy, the elasticity of the labor supply, high levels of education, and the
weakness of vested interests have all been advanced as explanatory factors (Abramovitz 1990, Mills and
Crafts 2000, Crafts and Toniolo 1996, Denison 1967, Maddison 1987, 1991, 1995, Olson 1982). 4
The eventual fading away of the stagnation thesis, of the notion that there was something in the
operation of capitalistic economies that made them inherently unstable, brought to the fore several
new concerns. These included the growing gap in income between developed and less developed
nations, and a new emphasis on cultural and ideological barriers to economic growth in poor countries.
In contrast to some of the early theories associated with the Harrod‐Domar model, which suggested
that poor countries would grow rapidly if there were large injections of capital from rich countries, by
the 1960s, the emphasis was that the export of capital would fail to promote growth unless the deep
cultural barriers that made these countries unreceptive to the conditions needed for economic growth
were somehow overcome. Some commentators, most notably Gunnar Myrdal, in his three‐volume work
on the Asian economies, said that India would have difficulty in sustaining high growth because it
promoted asceticism and thus undermined the acquisitive culture that spurred Western Europe (Myrdal
1968, c.f. Lau 1969).
There was also a shift from worries about over‐saving, which I must say, never caught on at
certain universities. It didn’t catch on at Chicago or at Columbia. Nor did it catch on at the National
Bureau of Economic Research. Analysts such as Simon Kuznets, Arthur Burns, and others thought that
savings were not a threat to economic growth, but were a necessary condition for economic growth
4 When the value of increased longevity and improved health are added to GDP, growth rates increase significantly (cf. Fogel 1989b, 2000, 2004a, Murphy and Topel 2005).

13
because you needed the savings to build both infrastructure in developing countries and also to get a
thriving public sector growing (Kuznets 1961, Colm 1962, Samuelson 1992).
There was, about this time, a new emphasis on export‐led growth. The practice of poor
countries selling their exports to rich countries got a bad name during the interwar period and was
widely viewed as exploitation of these countries by imperial powers. The later view, looking at the
Canadian and American experiences, was quite the contrary (North 1966, Kravis 1970). Selling raw
materials and other labor‐intensive products to the rest of the world is a way to get capital and
entrepreneurship from the developed countries to provide those same talents and qualities to the less‐
developed countries. One of the great discoveries of economic historians during the 1960s and
confirmed in the 1980s and 1990s was that the Hobson‐Hilferding‐Lenin thesis that English coupon‐
clippers got rich from investments in poor countries such as India, and then withdrew large sums of
annual earnings, was wrong. After the computer revolution, it was possible to put the whole late
nineteenth‐century portfolio of British overseas investments into machine‐readable form (Simon 1970,
Davis and Huttenback 1986, Stone 1999). Lo and behold, it turned out that there was a strong
correlation between a country’s per capita income and the share of the British overseas portfolio
invested in it. The United States received the largest share, followed by Canada and Argentina (which at
the turn of the twentieth century had one of the highest per capita incomes in the world). Of course,
that did not stop diehard critics of Western imperialism, who then denounced Britain for failing to have
invested in underdeveloped nations (cf. Davis and Huttenback 1986).
14
3. The Asian Miracle
As remarkable as what was widely forecast in the post‐World War II debates were the things not
foreseen in the 1940s, 1950s, or even the early 1960s. One of these was the extraordinary economic
growth in Southeast and East Asia, beginning first with Japan, which in four decades went from a poor,
defeated country to the second largest economy in the world, increasing per capita income tenfold. This
was a feat that took leaders of the industrial revolution about 150 years to accomplish (Kuznets 1971a).
The economic miracle of the high‐performing Asian economies other than Japan was also unforeseen,
and that state of mind persisted into the 1970s. It wasn’t that economists didn’t know that per capita
income was rising, but there was a widespread opinion that it couldn’t last, that somehow it was a fluke.
That view was based on the uneven economic performances of several of the Southeast Asian nations.
Indonesia, for example, had some catch‐up growth during the first half of the 1950s but faltered in the
1960s. Of the “Four Asian Dragons,” only Taiwan did better than Italy or Germany between 1950 and
1970 (see Table 2). The idea that all of the Southeast Asian nations, including China, were in the midst of
an unprecedented expansion that might affect the global economic balance did not emerge until the
early 1990s.
So, except for Japan, there was little excitement about the growth rates elsewhere in East Asia
until the late 1970s and early 1980s, when some analysts began taking note of the Korean economic
miracle (GNP per capita tripled in less than two decades) (Krishnan 1982) and comparable accelerations
in the growth rates of Hong Kong, Singapore, and Taiwan. These four economies began to be called “The
Four Asian Dragons” or “The Four Asian Tigers” (Hicks 1989).
The phrase “Southeast/East Asian Economic Miracle” and the acronym HPAE (for “high‐
performing Asian economies”) were added to the economic lexicon by the World Bank when it

15
published a book, The East Asian Miracle: Economic Growth and Public Policy, in 1993. The term was
almost immediately embraced by economists, some of whom felt it neatly summarized a new phase of
global economic development, and by a few, such as Paul Krugman, who wrote about “The Myth of the
Asian Miracle” (1994), arguing that the marginal productivity of capital would soon decline because the
miracle depended mainly on investment in capital and not on efficiency growth. In later work, Krugman
modified his predictions (1998, Krugman and Wells 2005), allowing for a longer period of growth, but
still maintained his earlier skepticism.
However, Chinese economic growth did not slow down for reasons delineated by Abramovitz in
his 1955 paper. The new investments embodied new technologies that greatly improved the efficiency
of the productive process. Moreover, China invested heavily in raising the educational level of the
population, concentrating first on primary education. As early as 1980, the gross enrollment ratio5 of
primary schools reached 113 (see Table 6). The extension of secondary school has also been impressive,
with the enrollment ratio rising from 46 in 1980 to 76 in 2006. The sharpest rate of increase has been at
the tertiary level (colleges and universities), where the enrollment ratio tripled between 1980 and 1997,
and tripled again between 1997 and 2004, reaching 19 in the latter year. This rapid increase in
educational levels was promoted both by business and political leaders who recognized not only that
they had to expand the supply of highly trained technicians, but that the demand for high‐tech
consumer products required well‐educated consumers.
Hence, the marginal productivity of physical capital has risen, not only because of the advanced
technology embodied in new physical investment, but also because of the greater investment in raising
the quality of labor. The quality of labor has risen, not only because of formal education, but also
because of on‐the‐job training, increased experience, improved health, and increased longevity. Rather
5 Persons in school x 100 ÷ persons of school age.

16
than declining, the rate of increase in Chinese per capita income rose to 9.2 percent per year between
1990 and 2005, which is more than a third higher than the growth rate during the previous 15 years.
Indeed, there is no convincing evidence that long‐term Chinese economic growth is faltering (cf. Fogel
2007).
4. Endogenous Economic Growth
To those who know the non‐mathematical literature of the pre‐1975 growth theorists, the belief
that endogenous theories of economic growth are an invention of the late 1980s is surprising. While it is
true that Solow and some other modelers treated technological change as exogenous in papers written
in the 1950s and 1960s, verbal theorists such as Simon Kuznets, Moses Abramowitz, Theodore W.
Schultz, and Douglass C. North paid a great deal of attention to endogenous technological change,
emphasizing the synergies between improvements in the quality and quantity of labor and of physical
capital.
Kuznets (1966, 1971a, 1971b), for example, stressed that economic growth both required and
produced major changes in the structure of the economy (defined as the distribution of inputs or output
among the major sectors of the economy). Not only were increases in agricultural productivity a
condition for the rapid growth of manufacturing, but new manufacturing technologies, which produced
more efficient agricultural equipment or new varieties of seeds and fertilizer, were major factors in the
growth of agricultural productivity and stimulated changes in agricultural technology.
According to Kuznets, many current economic opportunities and problems were determined by
economic conditions and relationships that evolved slowly, often taking many decades to work out. At a
time when Keynes declared that “in the long run we are all dead,” an aphorism reiterated by many

17
economists not only during the 1930s but during the 1940s and 1950s, Kuznets continued to call
attention to the role of long‐term factors that had to be taken into account by policymakers, factors
which led him to conclude that the opportunities for returning to high employment levels and rapid
economic growth were greater than generally believed in the decades immediately following World War
II.
Current social problems, Kuznets emphasized, in the late 1960s and 1970s, were often the result
of past growth—the consequence of past desirable attainments, which at a later time produce socially
undesirable consequences that require remedial policy action. Of his numerous illustrations of this
principle, one is particularly cogent: the explosion of population growth in the less developed nations of
Asia, Africa, Oceania, and Latin America in the quarter century following World War II. This population
explosion threatened to thwart efforts to raise per capita incomes from their dismally low levels
because birth rates remained traditionally high, while public health policies and improved nutrition cut
death rates in these regions by more than 50 percent in less than a generation. One obvious solution to
the problem was to reduce fertility, yet there was a web of traditional patterns of behavior and belief
that tended to keep fertility high. Nevertheless, Kuznets believed that properly designed public policies
could hasten the social and ideological changes required to reduce fertility and to lead these societies to
prefer a greater investment in a fewer number of children (cf. Becker 1960, 1981, Becker and Lewis
1973). Such a program required not only government and private campaigns to disseminate the
technology of birth control but a restructuring of social and economic incentives that would provide
rewards for families with fewer children.
Yet, as the experience of the U.S. and other developed nations has shown, the success of the
program to curtail fertility is bound, much further down the line, to create a new set of issues, similar to
those that have become the center of the modern women’s movement: the restructuring of society in

18
such a way as to promote equal opportunity for women in all occupational markets. The rapid economic
growth of 1945–1970 also produced new concerns about equity issues, particularly between whites,
blacks, and Hispanics, and gave momentum to the movement for equal rights for women. 6
Economic growth creates social problems because it is profoundly disruptive to traditional
values and religious beliefs, to longstanding social and family patterns of organization, and to numerous
monopolies of privilege. Despite the fact that modern economic growth has brought with it tremendous
increases in longevity and good health, has brought to the lower classes standards of living as well as
social and economic opportunities previously available only to a tiny minority, and has greatly reduced
the inequality in the income distribution of developed nations, the social restructuring of society
required by modern economic growth has been fiercely resisted—sometimes because of an
unwillingness to give up traditional values and ways of life, sometimes by entrenched classes
determined to protect their ancient privileges. Because of the complex responses to change and
because the epoch of modern economic growth was still unfolding, many aspects of the social
restructuring that were underway were still obscure and difficult to predict (Kuznets 1966, p. 15). As late
as 1972, Kuznets felt compelled to point out that despite the multitude of tentative partial
generalizations, cross‐sectional studies, and econometric exercises, there was as yet no “tested
generalization, significantly specific to permit the quantitative prediction of aggregate growth, or even
of changes in the structural parameters in the course of growth” (Kuznets 1972, p. 58).
Kuznets was particularly concerned with longitudinal issues, such as the length of the period of
observation that was needed to identify the underlying process at work in any specific aspect of
economic growth. How, he asked, can one determine whether such a process, once identified, is
sufficiently stable to provide a reliable basis for prediction? These problems are illustrated by an issue
6 Further down the line, the drop in fertility rates creates new problems as the population ages. See Fogel 2003 and 2004b, cf. Fogel et al. 2009.

19
on which Kuznets was the preeminent investigator of his age: the interrelationship between
demographic processes and modern economic growth.
A particularly important aspect of the issue was the concentration of the decline of death rates
at early ages, which contributed to the reduction in fertility rates. The reduced fertility rate released a
large proportion of the female labor force to gainful occupations, accelerated the transition to modern
families, mobile and responsive to economic incentives, and promoted new ideologies conducive to
economic growth (1966, p. 56–62). In subsequent work, Kuznets noted the increase in the share of
women in the U.S. labor force from 17 percent in 1890 to nearly half in the 1980s, which he attributed
to the lower fertility rates, the shift in employment opportunities from manual to service sector
positions, and urbanization, which made organized labor markets more accessible to women (Kuznets
1989, Fogel 1989a). He also called attention to the fact that the most rapidly growing occupations—
those in the professional, technical, clerical, sales, and other services—were the ones in which women
had made the greatest inroads. Nevertheless, in the late 1950s and early 1960s, when the new women’s
movement was still incipient, Kuznets did not anticipate fully the explosive entry of women into the
labor force during the next quarter century, nor the new ideology that would facilitate that
development (1966, p. 193–195).
Ideas of endogenous technological change were also deeply embedded in the work of
economists who studied the diffusion of new technologies. Among the earliest of these studies was the
dissertation of Zvi Griliches (1956) and papers based on it (particularly 1957 and 1960), which analyzed
the factors affecting the rate of diffusion of hybrid corn. Griliches traced that process from the early
scientific research of agricultural experimental stations to the sequential adoption of various strains of
these seeds by commercial producers. He also analyzed the rate of spread of this type of seed by

20
farmers, looking at the difference in the characteristics of early and late adopters within and across
states. Indeed, it took more than half a century for hybrid corn to displace its rivals everywhere.
Consequently, at any point in time, the existing average technology was a weighted average of
technologies of different vintages, not merely of the prehybrid seeds per se. Seed manufacturers
produced new vintages of hybrid seeds as technology adapted to the climate and soil types of particular
regions and subregions. Griliches also related the educational level, institutional connections, and
income of individual farmers to the rate at which they changed over to the new strains of corn.
What Griliches did for the diffusion of new technologies in agriculture, Edwin Mansfield did for
diffusion of industrial technologies. Mansfield (1971) measured the lag between invention and
innovation for 46 inventions. The lag varied from one year for Freon refrigerants to 79 years for
florescent lamps. The lag for some other notable inventions was 24 years for the distillation of
hydrocarbons with heat and pressure, 22 years for television, 27 years for zippers, 13 years for radar,
and 14 years for jet engines.
He then turned to the factors that influence the decision to innovate. After emphasizing the
risks associated with innovation (only two out of 10 new products that emerge from research and
development become commercial successes), he set forth the costs and benefits of both leading and
waiting for others to lead. The investment needed to bring a new innovation to market is usually in the
range of 10 to 20 times the original research costs.
Mansfield then analyzed the rates of diffusion of 12 innovations in four industries (coal, iron and
steel, brewing, and railroads). He found that the diffusion of a new technique was generally a slow
process. Among the factors that affected the rate of diffusion were the size of the firm, the expected

21
rate of profit from investing in the innovation, the growth rate of the firm, the overall profit level of the
firm, and the liquidity of the firm. 7
It was not only characteristics of the firms but also characteristics of the managers that
influenced rates of diffusion of new technologies. Presidents of early adopters of complex new
technologies were younger and better educated than heads of firms that were late adopters.
In subsequent studies, Mansfield (1980) found that both firm and industry expenditures on
research and development had a substantial impact on firm and industry rates of growth in productivity.
Both basic and applied research, individually and in conjunction, increased productivity growth. With
respect to interfirm, interindustry, and international transfers of technology, Mansfield (1975)
delineated among material, design, and capacity transfers. Capacity transfers often involved the
transfers of people, since there was often “no substitute for person to person training and assistance”
(p. 373). That was especially the case when the transferred technology had to be adapted to take
account of local conditions, including differences in relative costs, abilities, cultures, and climates (cf.
Mansfield 1972).
The notion of endogenous technological change did not begin with the cohort of Griliches and
Mansfield. Walt W. Rostow (1990, especially chapters 15–17 and 20) has summarized the known
theories of technological change, endogenous and exogenous, going back several centuries. More
relevant to the issues in this paper is the work of Joseph Schumpeter, who was the most important
growth theorist between the deaths of Smith and Malthus and his own death in 1950. His earlier work
focused on long cycles in economic output, which he attributed to fluctuations in the rate of inventions
and innovations (Schumpeter 1934). His analysis led him to single out entrepreneurs as the dynamic
agents of change, to point to the equity effects of economic growth (embodied in his concept of
7 See Perkins 2006a and Maddison 1998 for discussions of the lag of China and India in adapting modern technology.

22
“creative destruction”), and to make the creative clusters of innovations inherently inflationary. Later in
his career, Schumpeter focused on the conflict between economic concentration and competitive
markets, and between the capitalist system of economic organization and the political, social, and
intellectual movements that were hostile to capitalism for ideological reasons. It was these conflicts, he
argued, rather than the secular diminution of investment opportunities that threatened the
continuation of economic growth under a system of political democracy (cf. Rostow 1990, especially p.
233–242).
Theodore W. Schultz was another major motivator of the theory of endogenous technological
change. He received the most acclaim for his contributions to the theory of human capital (Schultz 1962,
1971). But that was only one aspect of his broader concern with economic growth and the elimination of
poverty. These broader concerns led him to examine closely the impact of government fiscal policies
and specific interventions into agriculture in both developed and developing countries, policies that
distorted agricultural production and had perverse effects on the distribution of income. Like
Schumpeter, Schultz was concerned about new sources of future income growth, and this concern led
him to recognize that in the 20th century, human capital had become more important than physical
capital in explaining both economic growth and the inequality of the income distribution. His theory of
human capital led him to conclude that unregulated high fertility was a major factor in destabilizing an
agricultural sector. Such considerations also caused him to emphasize the importance of the investment
in improving nutrition and health as a key to economic growth in poor nations and to identify
investment in “allocative skills” as a key to dealing with problems of disequilibria (cf. Bowman 1980).
Schultz was influenced in his thinking about human capital by his experiences with postwar
reconstruction. Despite the devastation of Europe, all of the war‐ravaged countries experienced rapid
economic growth in the 1950s, quickly exceeding their prewar levels. This led Schultz to dwell on the

23
central role of human capital in modern economic growth, to consider the possibility that a significant
share of the so‐called residual factor in economic growth was due to improvements in the quality of the
inputs, particularly in the quantity of capital embodied in human labor. Although his empirical work on
this question focused on education, Schultz recognized that improvements in health, in the capacity to
process information, in the development of allocative skills, and in on‐the‐job training might be more
important than the effects of formal education per se.
Abramovitz was another of the nonmathematical theorists who grappled with issues of
endogenous technological change throughout his career. In papers published in 1972 and 1993, he
called attention to the shifting bias of technological change, which was intensive in physical capital
between 1850 and 1950 (the era of the building of railroads and the electrical grid) but became human
capital‐intensive thereafter. Since 1950, “technological change tended to raise the marginal productivity
of capital in the form of education and training of the labor force at all levels; in the form of practical
knowledge acquired by deliberate investment of resources in research and development; and in other
forms of intangible capital, such as the creation and support of corporate structures and cultures and
the development of product markets, which are the infrastructure of economies of scale and scope”
(Abramovitz 1993, p. 229).
Abramovitz also stressed the interdependence of technological progress and both tangible and
human capital accumulation. He noted both tangible and intangible capital formation influenced the
pattern of technological progress. But he cautioned Lucas, Romer, and other contributors to the “new
growth theory” from overemphasizing the impact of capital accumulation on the direction of
technological change. Although the bias of technological change was influenced by capital accumulation,
it was also influenced by the evolution of scientific and technological knowledge that was “quite
unrelated to the terms of factor supply,” including the influence of relative factor costs, the evolution of

24
science and technology, and the “impact of political and economic institutions and modes of
organization on which the discovery and acquisition of new knowledge depend” (Abramovitz 1993, p.
237).
5. Bridges between Two Cohorts of Theorists on Technological Change
This section compares the work of Zvi Griliches, Richard Nelson, and Dale W. Jorgenson, whose
research on technological change spanned the period from the mid‐1950s to the present. All of these
investigators focused on the difficulties of measuring technological change. All three were concerned
with endogenous as well as exogenous sources of technological change. All three were deeply involved
in problems of the identification and measurement of endogenous technological change. Although they
dealt with national patterns of change, much of their research was focused at the level of industries and
on the characteristics of the firms that comprised the industries. All three welcomed the new
enthusiasm brought to the studies of technological change and economic growth by a younger cohort of
investigators led by Romer, Lucas, Helpman, Barro, Acemoglu, Aghion, Howitt, Krugman, and Young,
among others.8
Griliches’s studies were notable for their display of statistical skills. He made important
contributions to econometric modeling of specification biases, to models of distributed lags, and to
models that dealt with “unobserved” or “omitted” variables, such as ability. He also developed the
hedonic technique for separating changes in the prices of complex products into components due to
improvement in qualities of such products (such as automobiles and pharmaceuticals) and to inflation.
He was also one of the pioneers in the study of the impact of investments in research and development
8 Helpman (2004) provides an insightful tour of the new growth theory, pointing out its major issues and evaluating its foundations (cf. Helpman 2008).

25
on productivity at the firm, industry, and aggregate levels. He emphasized that much of the unmeasured
residual in productivity gains was due to the “spillover” effects in one firm or industry on the inputs and
outputs of other firms and industries (Heckman 2006, cf. Trajtenberg and Berndt 2001, David 2003).
These are all key points in the explanation of the Asian Miracle (see section 7 below).
Richard Nelson has been a thoughtful analyst of the economics of invention and the processes
by which inventions become incorporated in the process of production and marketing. In the late 1950s,
he critically surveyed the economic literature on these topics and pointed to numerous unresolved
issues. Among the points he stressed were the high risks in research and development, and the few
initiatives launched by firms that ever got to the point of yielding commercially viable projects (1959).
He also delved into the problem of explaining changes in total factor productivity and attributed much
of the difference between Solow and Denison to such issues as the rate of improvement in the quality of
labor and capital and the average age of the capital stock. But he also emphasized that interactions
between these variables had not been sufficiently explored, and he also stressed the need to focus on
the processes, which differed among firms, that affected incentives and their feedback (1964). In later
papers (1981, 1988, Nelson and Wright 1992), Nelson stressed the need to focus on the processes that
generate, screen, and spread new technology at the firm, interfirm, and interindustry levels. Along with
Stanley Fischer (1993) and others, Nelson placed much emphasis on the role of macroeconomic policy in
creating favorable contexts for rapid technological progress. Nelson collaborated with Harold Pack
(1999) on an insightful discussion of the interrelationship of “The Asian Miracle and Modern Growth
Theory” (see section 7 below).
Jorgenson has been at the forefront of the elaboration of the theory of production and in the
measurement of the improvements in the quality of inputs, the improvements in the economic and
social organization of production, and the identification of spillover effects that account for a significant

26
part of unmeasured inputs. Jorgenson’s early work made important contributions to the theory of
economic growth in dual economies: two‐sector models with an advanced and a backward sector
(1961a, 1961b). Indeed, much of his work has focused on the movement from a highly aggregated level
of analysis to disaggregated levels.
Thus, he has placed a great deal of emphasis on moving to the industry and firm levels for
purposes of both analysis and measurement, demonstrating that in so doing, one could explain much of
Solow and Denison’s unmeasured residual. In this connection, he pointed to the need to recognize that
much of the change in total factor productivity was explained by measuring the substitution of higher
qualities of labor for lower ones as well as the substitution of improved vintages of capital for earlier
ones. He also sought to measure unmeasured spillover effects from one industry or one firm to another
(1967 [with Griliches], 1969 [with Christenson], 1980 and 1986 [with Fraumeni], and 1980 [with Gollup]).
Jorgenson also called attention to the need to take account of changes in the quality of intermediate
goods at the sectoral level, estimating that these changes explained more of the change in sectoral
output than improvements in the quality of labor and capital (1990).
Jorgenson has led the way in explaining the sharp increase in U.S. productivity growth that
began in the 1990s. In his presidential address to the American Economic Association (2001) and in
papers with Stiroh (1999 and 2000), he attributed the rapid diffusion of information technology (IT)
between 1990 and 2000 to the decline in IT prices, which he said was triggered by an earlier and even
sharper decline in the prices of semiconductors. Moreover, all of the increase in U.S. total factor
productivity during 1990–1995 and two‐thirds of the increase during 1995–2000 was due to
improvements in IT.
In several of his recent papers (e.g. 2001, 2005, 2005 [with Nomura]), he found that in the U.S.,
IT‐using industries were leading economic growth, and through wage effects, were promoting

27
improvements in labor quality, and that IT was having a similar effect on other G7 countries (cf. Crafts
2004). Improvements in the quality of inputs, best measured at the industry level, were major factors in
output growth (e.g. 1992 [with Gallop], 1999 and 2000 [with Stiroh], 2005 [with Nomura], 2005).
In a paper with Dougherty (1996), Jorgenson characterized the recent work on endogenous
economic growth as an effort to account for spillover effects. He linked unexplained productivity to
spillover effects that increase output in unrelated firms and industries but were normally unmeasured.
Jorgenson provided a direct accounting of the benefits of such spillovers. In his most recent paper with
Vu, Jorgenson finds that the accelerated pace of globalization and IT penetration between 1989 and
2006 may be important factors in explaining the jump in output productivity. He estimates that
developing Asia accounted for 40 percent of global economic growth during this period (Jorgenson and
Vu, forthcoming).
6. The Economic Historians
No students of economic growth have been more absorbed in issues of endogenous
technological change than economic historians. Their interest in these issues is as old as the concept of
the Industrial Revolution of the second half of the eighteenth and the first half of the nineteenth
centuries. They traced out the succession of inventions in textiles and iron that transformed these
industries, as well as successive improvements in steam engines going back to the early seventeenth
century, that made it possible to substitute mechanical power for human power in mining and
manufacturing and for animal power in transportation.
This progress turned partly on accidents, but mainly on the creation of an economic, social, and
political environment that encouraged and supported new technologies by ethical and religious dictums

28
and by pro‐growth ideologies. As David Landes put it, Britain’s large lead in technology over France
(citing Joel Mokyr [1985] and Walt Rostow [1979]), was no accident. With one innovation after another,
repeatedly, England was the leader, and France and others were followers.
British inventors, Landes said, were responding to the high cost of labor (in the case of textile
inventions) and the vicissitudes of deep coal mines (in the case of steam engines). Moreover, the British
pool of skills in such areas as millwork and machine building was apparently larger than in Continental
countries. It was not that Britain had a large monopoly of skills, but “the size of the pool, its free, non‐
corporate character, and direction (provenance) of its efforts and experience. These seem to have made
a difference” (Landes 1994, p. 650, c.f. Crafts 1997 and 1995, see also Harley 1992 and Temin 1997).
Landes (1994) continued:
The key invention falls within the Smithian paradigm: the adoption of rural putting‐out. This
goes back to the middle ages and represents a crucial departure from the town‐based,
corporate (guild) mode of production. The key is the division of labour and the recruitment
into the production process of women and children. Say no more: the effect is to reduce costs
and prices, increase demand, widen the market, promote further division of labour, lay the
basis in specialization for small but cumulative improvements in technique…. The effect of
this fall in prices and increase in markets at home and abroad was to turn Britain into the
workshop of the world. (p. 651)
Among economic historians writing about changes in patterns of U.S. economic growth, no one
has done more to emphasize the critical role of institutions in affecting economic growth than Douglass
C. North. In an article published in 1968, North estimated the substantial increases in the total factor

29
productivity, on the order of 300 percent, in ocean shipping between 1600 and 1850. The principal
technological change was the increase in payload capacity brought about by the changes in the design of
the ships, which became larger and swifter. The more efficient ships (called flutes) had been in use in
the Baltic trade since the early seventeenth century. Why did it take so long for ships of this design to
become dominant in the Atlantic trade? The answer, said North, was the threat of piracy located in the
Caribbean. As long as the pirate threat existed, freighters had to be armed, and arming required smaller,
sturdier ships that could withstand the recoil of the canons. It was not until the elimination of pirates
from their shelters in the Caribbean that the faster, longer, lower‐cost ships became dominant in the
trans‐Atlantic trade.
Two years later, together with Robert Paul Thomas, North published an “Economic Theory of
the Growth of the Western World” (1970). In that essay, they argued that changes in product and factor
prices, promoted by population growth and the increased size of markets, led to a set of institutional
changes that channeled incentives toward “productivity‐raising types of economic activity…. These
institutional innovations and accompanying changes in property rights built productivity into the system,
enabling Western man to finally escape the Malthusian cycle” (p. 1). North and Thomas collaborated
again on articles explaining the rise and fall of the manorial system (1971) and on the substitution of
settled agriculture for hunting and gathering (1977).
In a highly influential paper with Barry R. Weingast, a political scientist, North (1989)
investigated the impact of the English Glorious Revolution of 1688, which “fundamentally redesigned”
fiscal and governmental institutions to limit the confiscatory power of the crown. The elevation of the
role of Parliament and introduction of an independent judiciary “produced a marked increase in the
security of private rights” (p. 804). As a result, private capital markets flourished and the government
was able, within a decade, to increase borrowing by an order of magnitude. The institution also created

30
more favorable conditions for economic growth, including the growth and development of banks, the
creation of new instruments of private credit, and the promotion of a wide array of businesses (cf. North
2005).
Several other economic historians have had a substantial influence on the recent wave of
growth theory. Papers by Stanley Engerman and Kenneth Sokoloff called attention to the importance of
distant history in establishing institutions and pathways that influence patterns of current economic
growth (Engerman and Sokoloff 1997, Sokoloff and Engerman 2000). This theme has resonated with
growth theorists such as Acemoglu, Johnson, and Robertson (2001, 2002) and Ray (2008). Paul David’s
emphasis on the impact of path dependency, which links particular inventions and the large investments
by their users to explain the difficulty of getting users to switch to more efficient substitutes for the
original innovation, has also been influential (David 1985).
In another important paper, David (1990) explained the long lag between the invention of new
technologies and their impact on economic growth using the electrical dynamo as a case in point. Even
when engineers correctly foresaw the potential usefulness of electricity, a wide range of businesses
were still based on mechanical power, and numerous details had to be addressed to make the new type
of power advantageous for many different products and in various locales. Moreover, architects,
engineers, and managers had to be trained to design, install, and operate the new systems. The risks
perceived by capitalists were large enough to cause many to hesitate to invest. These problems were
worked on slowly. It took about four decades to go from the construction of the first generating stations
to the 50‐percent point in the diffusion of electricity to users.
Economic historians have also made major contributions to the study of industrial organization
and its synergy with economic growth. Carefully tracing the growth of big business in the United States,
Alfred Chandler Jr., the doyen of managerial history, laid out the circumstances that led to the rise of

31
large‐scale enterprises led by professional managerial hierarchies. He also compared the U.S. corporate
structure with large enterprises in England and Germany (Chandler 1977, 1990). Chandler had a strong
influence on the theory of industrial organization as it was developing during the last third of the
twentieth century (Teece 1993, c.f. Caves 1990). Efforts to reassess Chandler’s legacy began to appear in
the late 1990s and have continued, aimed at taking account of new industrial structures brought on by
changes in technology, markets, business strategy, and communications (Galambos 1997, Ghemawat
2002).
It remained for Lamoreaux, Raff, and Temin (2003) to provide a new synthesis of the evolution
of industrial organization as it stood at the beginning of the new millennium. Their aim was not only to
take account of the changed circumstances that led the classical Chandlerian firm—vertically integrated
and diversified—to be outperformed by more specialized and vertically disintegrated firms, but to also
provide a theory of the new tendencies in firms and markets. They developed a dual perspective that
brought to the fore the economic logic behind business choices. Changes in industrial structures and
markets reflected the vast increases in per capita income, the huge declines in the cost of processing
information, and the large decrease in transportation costs that altered spatial maps and permitted
products to be designed again for individual needs.
7. The Impact of the Asian Miracle on Growth Theory
The Asian Miracle began to have a profound impact on growth theory well before the full scope
of that miracle was apparent. The early papers in the new wave of theoretical work, those which
appeared between 1986 and 1990, were responding mainly to European and U.S. developments in the
period between 1950 and 1980. When theorists shifted some of their focus to Asia during the first half
32
of the 1990s, they concentrated mainly on the Four Little Dragons, sometimes adding such new
contenders for the title of “miracle” as Indonesia, Malaysia, and Thailand. China and India did not move
to center stage until the second half of the 1990s.
The extraordinarily high growth rates of China since 1980 and of India since the middle of the
1990s have profoundly challenged the discussion of theorists and policymakers. These extraordinary
growth rates, if they persist for two or three decades, will radically alter the global economic playing
field, transforming China and India from merely “newly industrializing countries” to titans of the global
economy.
Tables 7 and 8 compare the global economy in 2000 with a possible, perhaps probable,
restructuring less than a generation from now. In the year 2000, the global economy was dominated by
six groupings of countries: the United States, the European Union (which then consisted of 15 countries
[EU15]), India, China, Japan, and a group of six Southeast Asian countries (Singapore, Malaysia,
Indonesia, Thailand, South Korea, and Taiwan [SE6]). As measured by gross domestic product (GDP),
these six groupings accounted for 73 percent of the world’s economic output and 57 percent of the
global population (see Table 7). The balance of the world (including Latin America, Africa, and Eastern
Europe) accounted for about 28 percent of GDP and 42 percent of the global population.
Table 8 presents a not improbable set of forecasts for 2040. The population forecasts are those
of the United Nations. The economic forecasts are mine but were influenced by the forecasts of the
C.I.A. and The Economist. To my mind, the most unsettling of the forecasts in Table 8 is the relative
decline of the European Union implied by its stagnation in population and its modest growth in GDP.
Although the EU population in 2000 exceeded that of the U.S. by about a third, by 2040 the EU
population will be somewhat smaller than that of the U.S. The projected stagnation of the EU15
population is based primarily on the persistence of extremely low fertility rates. The total fertility rate

33
(roughly the average number of children a woman is expected to have during the course of her
childbearing years) has fallen far below the level required for the reproduction of the population (2.1
children) in most EU15 countries, and has been below reproduction for several decades.
One implication of the low fertility rate is that the population of the EU15 is aging rapidly. In the
year 2000, the median age in Italy and Germany, for example, was about 40, which is a decade higher
than in China and half a decade higher than in the U.S. By 2040, the median age in Italy and Germany is
predicted to be about 50. This rapid aging of many EU15 countries means that their dependency ratios
(the ratio of economically inactive to economically active persons) will soar. These demographic factors
will, by themselves, significantly curtail the capacity for economic growth. However, political and
cultural factors appear to be reinforcing the impediments to economic growth. These include limitations
on the length of the work week and increasingly heavy taxes on businesses to support large social
welfare programs (that are nevertheless facing bankruptcy) and are threatening to make EU15 firms
uncompetitive in the global market. 9
I do not mean to imply that labor productivity and per capita income in the EU15 will not grow.
They will grow at a rate that, by past standards, was not bad (about 1.8 percent per annum), but they
will not be able to match the surge in growth that will prevail in South and East Asia. The European
market will be about 60 percent larger in 2040 than it was in 2000. But the U.S. market will be over 300
percent larger, India’s will be over 1,400 percent larger, and China’s will be 2,400 percent larger. Indeed,
the Chinese market in 2040 by itself will probably be larger than the combined markets of the U.S., the
EU15, India beyond and Japan. It may well be the case that English will survive as the principal
9 The expansion of the EU15 to EU27 will help to invigorate the EU15 through increased cross‐country migration. However, it is unlikely that the migration rate will be large enough to offset the low fertility rates in Italy, France, and other EU15 countries. Moreover, resistance to immigration is likely to increase in low‐fertility country as fears of loss of national identity increase.

34
commercial language beyond 2040, but I suspect that there will be an explosion of business managers in
the West who also speak Mandarin.
The possibility of such a massive restructuring of the global economy has substantially changed
the conversation of growth theorists of the late 1980s. The debates of those years were aimed at
altering the canon of growth models to allow for slighted variables (such as knowledge and experience),
changed parameters (such as large capital shares and different elasticities), to rethink the implications of
returns to scale and externalities in different contexts suggested by new analyses of available empirical
information, and to introduce such new terminology as “absolute” and “conditional” convergences10.
The old set of issues has not been abandoned, but the locus has shifted, and a number of new issues
have emerged.
One of the central issues among growth theorists is whether increases in factor inputs or in total
factor productivity has been the main source of economic growth in the surging Asian economies (cf.
Perkins and Rawski 2008). A companion issue is the role of governments and of macroeconomic policy in
encouraging, permitting, and sustaining economic growth (Young 1995, Krugman 1994, Krugman 1998,
Stiglitz 1996, Stiglitz 2001, Kim and Lau 1994, Park 2002). Growth theorists are also grappling with the
implications of uneven economic growth across the provinces and socioeconomic groupings of both
China and India, for the long run economic and political stability of both countries (Chaudhuri and
Ravallion 2006, Zakaria 2005, Zakaria 2006, Pei 2006, Pei 2007, Lopez 2004).
Jere Berhman, an old hand in the study of economic growth among developing nations,
surveyed the literature (2001) on growth in Asia and elsewhere, pointing out changing viewpoints since
the end of World War II. In the 1950s, he wrote, the key issues raised by growth economists were (1) the
10 See Barro and Sala‐i‐Martin (2004) for an excellent review of growth theory and its empirical findings. For the foundational basis of the new work, see Romer (1986), Lucas (1988), and Barro (1991), c.f. Barro and Sali‐i‐Martin 1997. See also Jones (1997). For a critique of the empirical underpinning of this work, see Srinivasan and Bhagwati (2001).

35
need to raise capital‐to‐labor ratios; (2) the problem of overcoming the inefficiency of markets; (3) the
key role of industrialization in overcoming low growth rates; (4) the belief that international trade was
harmful to developing countries because the benefits of trade were siphoned off by monopolistic
producers in rich countries; and (5) the belief that governments were unbiased, had good information,
and pursued policies appropriate to promoting growth. By the beginning of the 21st century, most of
these ideas had been jettisoned. Among the ideas that replaced them were the proposition that merely
throwing capital at the problems was not enough; that markets are better than bureaucrats (many of
whom were rent‐seekers) in allotting resources; and that international trade stimulated rather than
retarded growth.
Dwight H. Perkins, who has been studying economic, social and political developments in China
and other Southeast Asian nations for more than half a century, recently put the accelerated growth in
Chinese per capita income since 1978 in perspective (2006a). The available evidence suggests that
China’s decline from relative prosperity in the thirteenth century to relative poverty at the end of World
War II was due partly to its lag in applying science to the development of modern technology, partly to
destructive invasions, and partly to civil wars that prevented the emergence of a strong central
government needed to provide the institutional foundation for modern economic growth. While some
of these problems were solved after the accession of Mao Zedong, mistakes in economic policy,
combined with Mao’s desire to launch a cultural revolution that would transform Chinese values, led to
nearly two decades of sluggish growth and to various economic and social calamities.
Perkins attributes the high rate of growth in Chinese per capita income during the past three
decades to reforms that began in 1978. As a result of these reforms, the government was able to
generate a high internal rate of investment, promote foreign trade, open China to foreign investment
(with its accompanying advanced technology and know‐how), and transform China into a market

36
economy. However, these processes of transformation are not complete, and the future rate of growth
will depend on success in completing the necessary reforms. The main future challenge, he argues, will
be “to maintain a stable environment” for economic growth while the Chinese “political system evolves
to one more suitable for an educated, increasingly high income country” (Perkins 2006b, p. 263).
Perkins’s historical perspective helps to inform recent efforts to resolve the conflicting views of
growth theorists (cf. Maddison 1998). In a 1999 paper, Nelson and Pack stressed that it was not merely
the introduction of advanced technology into East and South Asia that accounted for their rapid growth.
More crucial was the restructuring of the economy to effectively absorb the new technologies. Such
absorption required a policy regime that encouraged the development not only of an educational
system that helped entrepreneurs and technicians to begin the process of mastering and deploying the
new technologies, but also of an industrial structure that permitted this new cadre to gain the
experience needed to effectively exploit the new technologies. “To learn to use new technologies,” they
wrote, “and to function effectively in new sectors required the development of new sets of skills, new
ways of organizing activities, and becoming familiar and competent in new markets” (p. 418). They also
stressed that “only a small portion of what one needs to know…is codified in machine manuals,
textbooks, and blueprints; much of it is tacit and learning is as much by doing and using as by reading
and studying” (p. 418, cf. Nelson and Winter 1982, Rosenberg 1994). The usual growth accounting
procedures, they argued, “would attribute the major share of growth simply to the growth of capital,”
when assimilation and industrial restructuring were the main forces driving growth (p. 426).
Beyond these technical issues about how to interpret the available information, there is a lively
debate about how long China can continue growth at rates greater than ever before achieved for long
periods of time. China has emerged as a major global factor in an array of product markets. Now second
only to the U.S. in oil consumption, and accounting for 40 percent of all the growth in global oil

37
consumption in recent years, China has also become the world’s largest consumer of steel, cement, and
copper (OECD 2005, Kato 2004, Morrison 2006).
Most of China’s growth in terms of per capita income (69 percent between 1978 and 2002) is
due to increases in labor productivity. Within industry, the increase in labor productivity was 6.2 percent
per annum and 5.7 percent per annum in agriculture. About 30 percent of China’s growth rate is likely to
continue to come from modest increases in the labor force participation rate and inter‐industry shifts.
Much of China’s labor force is still in agriculture, so there is substantial potential for growth through a
shift to industry and services as it moves toward the current technological frontier.
Investment in capital—especially human capital—is capable of rapid development in the next
several decades. The increases in enrollment ratios outlined in Table 6, combined with the knowledge
that a college‐educated worker is 3.1 times as productive, and a high‐school graduate is 1.8 times as
productive, as a worker with less than a ninth‐grade education, underlie the potential for growth (Fogel
2005).
As a result of its rapid growth in per capita income, China has also emerged as a major player in
the production and sale of manufacturing products. As indicated by Table 9, Chinese production of autos
in 2007 exceeded all of the major national producers except the U.S. and Japan. Moreover, given the
current rates of increase in the auto production of all the nations, it is likely that China will be the global
leader in auto production by 2010 or 2011.11
Ownership of other major consumer durable products has also been increasing at spectacular
rates. Between 1990 and 2007, Chinese households have increased ownership of air conditioners
11 Despite the slowdown in the production of China’s automobile industry in 2008, it has been estimated by the China Association of Automobile Manufacturers (CAAM) that annual production will increase by 5 percent in 2009 (Li 2009). In February 2009, new car sales increased by 25 percent in China, partially due to reduced sales taxes on small passenger cars (Ying 2009).

38
annually by 15 percent, computers by 32 percent, and cell phones by 48 percent (National Bureau of
Statistics of China 2008).
The rapidly expanding economies of China and India have led many analysts to speculate on the
reemergence of these two economic giants as global political players. The most recent assessment of
the U.S. National Intelligence Council (2008) conjectures that, by 2025, U.S. political dominance will be
replaced by what it calls “multipolarity.” This multipolarity it predicts is “unlikely to produce a single
dominant nation‐state with the overwhelming power and legitimacy to act as an agent of institutional
overhaul” (p. 81).
However, we are already in a multipolar world, which the U.S. helped to create. Our ability to
influence international affairs is already constrained by the desires of Europe, Russia, India, and China.
Diplomacy under the Clinton and Bush administrations was shaped by such recognition.12
My own view of future U.S. global influence is more conditional. A lot depends on the future
rate of growth in U.S. labor productivity. If that continues at the annual rate of 2 to 4 percent, then it is
possible that the U.S. will remain well ahead of its competitors in economic and political influence down
to 2025 and beyond. Much will depend on the willingness of the U.S. to invest heavily in scientific
research and development, and to increase the share of the population educated in the sciences. I am
optimistic on both of these counts. Unlike China, whose past growth has depended on its ability to adapt
to the existing technology of the U.S. and other OECD nations to China’s conditions, the U.S. is at the
current production frontier. Hence, its continued growth depends on the rate at which it can develop
new technologies, which requires a plentiful supply of engineers to design new systems of production
and distribution, and new science on which these new systems will depend. Industry will respond to the
12 See Zakaria (2006) and Morrison (2006).

39
new technologies, as they have in the past, because they will increase labor productivity and raise
profits.

40
References
Abramovitz M. 1956. Resource and output trends in the United States since 1870. American Economic Review 46: 5–23. Abramovitz M. 1972. Manpower, capital, and technology. In Human Resources and Economic Welfare: Essays in Honor of Eli Ginzberg, ed. I Berg, 50–70. New York: Columbia University Press. Abramovitz M. 1990. The catch‐up factor in postwar economic growth. Economic Inquiry 28: 1–18. Abramovitz M. 1993. The search for the sources of growth: Areas of ignorance, old and new. Journal of Economic History 53: 217–243. Acemoglu D, Johnson S, Robinson JA. 2000. The colonial origins of comparative development: An empirical investigation. NBER Working Paper w7771. Acemoglu D, Johnson S, Robinson JA. 2001. Reversal of fortune: Geography and institutions in the making of the modern world income distribution. NBER Working Paper w8460. Allen GC. 1972. A Short Economic History of Modern Japan. London: Allen & Unwin. Asian Development Bank. 2003a. Asian Development 2003 Statistical Appendix. Oxford: Oxford University Press. Asian Development Bank. 2003b. Key Indicators 2003, vol. 34. Manila: Asian Development Bank. Barker DJP. 1998. Mothers, Babies, and Health in Later Life. Edinburgh: Churchill Livingstone. Barrow RJ. 1991. Economic growth in a cross section of countries. Quarterly Journal of Economics 106: 407‐443. Barro RJ, Sala‐i‐Martin X. 1997. Technological diffusion, convergence, and growth. Journal of Economic Growth 2: 1–27. Barro RJ, Sala‐i‐Martin X. 2004. Economic Growth. Cambridge: MIT Press. Becker G. 1960. An economic analysis of fertility. In Demographic and Economic Change in Developed Countries: Conference of the Universities‐National Bureau Committee for Economic Research: a Report of the National Bureau of Economic Research, 209–240. Princeton: Princeton University Press. Becker G. 1981. A Treatise on the Family. Cambridge: Harvard University Press. Becker G, Lewis HG. 1973. On the interaction between quantity and quality of children. Journal of Political Economy 81: S279‐S288.

41
Berhman J. 2001. Development, economics of. In International Encyclopedia of the Social and Behavioral Sciences, ed. NJ Smelser, PB Baltes, 3566–3574. Oxford: Elsevier Science. Bhagwati JN, Chakravarty S. 1969. Contributions to Indian economic analysis: A survey. American Economic Review 59 (suppl.): 1–73 Blyn G. 1971. Review of Developing Rural India: Plan and Practice. Economic Development and Cultural Change 19: 334–337. Bowman MJ. 1980. On Theodore W. Schultz’s contributions to economics. Scandinavian Journal of Economics 82: 80–107. Bratt EC. 1953. A reconsideration of the postwar forecasts. Journal of Business of the University of Chicago 28: 1–18. Caves RE. 1990. The transformation of corporate control by Neil Fligstein. Business History Review 64: 352–355. Chandler AD. 1977. The Visible Hand. Cambridge, Mass.: Harvard University Press. Chandler AD. 1990. Response to contributors to the review colloquium on “Scale and Scope.” Business History Review 64: 736–758. Chandrasekhar S. 1968. How India is tackling her population problem. Foreign Affairs 47: 138–150. Chaudhuri S, Ravallion M. 2006. Partially awakened giants: Uneven growth in China and India. World Bank Policy Research Working Paper 4069. Clark C. 1976. Economic development in communist China. Journal of Political Economy 84: 239–264. Coale AJ. 1975. The demographic transition. In The Population Debate: Dimensions and Perspectives. Papers of the World Population Conference, Bucharest, 1974. New York: United Nations, 347–355. Colm G. 1962. Capital in the American economy: Its formation and financing. Journal of the American Statistical Association 57: 693–696. Copeland MA, Martin EM. 1938. The correction of wealth and income estimates for price changes. In Studies in Income and Wealth, vol. II. New York: National Bureau of Economic Research, 85–131. Crafts NFR. 1995. The golden age of economic growth in western Europe, 1950–1973. Economic History Review 48: 429–447. Crafts NFR . 1997. Some dimensions of the “quality of life” during the British industrial revolution. Economic History Review 50: 690–712.

42
Crafts NFR. 2004. Social savings as a measure of the contribution of a new technology to economic growth. Working Paper 06/04. Department of Economic History, London School of Economics, July 2004. Crafts NFR, Toniolo G. 1996. Economic Growth in Europe since 1945. Cambridge: Cambridge University Press. David PA. 1985. Clio and the economics of QWERTY. American Economic Review 75: 32–337. David PA. 1990. The dynamo and the computer: An historical perspective on the modern productivity paradox. American Economic Review 80: 355–361. David, PA. 2003. Zvi Griliches on diffusion, lags and productivity growth: Connecting the dots. Presented at the Conference on R&D, Education and Productivity held in memory of Zvi Griliches, Carré des Sciences, Ministere de la Rechèrce, August 25–27. Paris, France. Davis LE, Huttenback RA. 1986. Mammon and the Pursuit of Empire: The Political Economy of British Imperialism, 1860–1912. Cambridge: Cambridge University Press. Denison, EF. 1962. The sources of economic growth in the United States and the alternatives before us. Supplementary Paper no. 13. New York: Committee for Economic Development. Denison EF. 1967. Sources of postwar growth in nine western countries. American Economic Review 57: 325–332. Doblhammer G, Vaupel JW. 2001. Life span depends on month of birth. Proceedings of the National Academy of Sciences USA 98: 2934–2939. Dougherty C, Jorgenson DW. 1996. International comparisons of the sources of economic growth. The American Economic Review 86: 25–29. Engerman SL, Sokoloff K. 1997. Factor endowments, institutions, and differential paths of growth among New World economies: A view from economic historians of the United States. In How Latin America Fell Behind, ed. S Haber, 260–304. Palo Alto: Stanford University Press. Fabricant S. 1954. Economic progress and economic change. In 34th Annual Report of the National Bureau of Economic Research. New York: National Bureau of Economic Research. Fischer S. 1993. The role of macroeconomic factors in growth. Journal of Monetary Economics 32: 485–512 Fogel RW. 1989a. Afterword: Some notes on the scientific methods of Simon Kuznets. In Economic Development, the Family, and Income Distribution: Selected Essays. Cambridge: Cambridge University Press: 413–438. Fogel RW. 1989b. Without Consent or Contract: The Rise and Fall of American Slavery. New York: W.W. Norton.

43
Fogel RW. 1994. Economic growth, population theory, and physiology: The bearing of long‐term processes on the making of economic policy. American Economic Review 84: 369–395. Fogel RW. 2000. The Fourth Great Awakening and the Future of Egalitarianism. Chicago: University of Chicago Press. Fogel RW. 2003. Forecasting the demand for health care in OECD nations and China. Contemporary Economic Policy 21: 1–10. Fogel RW. 2004a. High performing Asian economies. NBER Working Paper 10752: National Bureau of Economic Research. Fogel RW. 2004b. The Escape from Hunger and Premature Death, 1700–2100: Europe, America, and the Third World. New York: Cambridge University Press. Fogel RW. 2004c. Changes in the process of aging during the twentieth century: Findings and procedures of the Early Indicators project. Population and Development Review 30: 19–47. Fogel RW. 2005. Why China is likely to achieve its growth objectives. NBER Working Paper 12122: National Bureau of Economic Research. Fogel RW. 2007. Capitalism and democracy in 2040. Daedalus 136: 87–95. Fogel RW, Costa DL. 1997. A theory of technophysio evolution, with some implications for forecasting population, health care costs, and pension costs. Demography 34: 49–66. Fogel RW, Engerman SL. 1969. A model for the explanation of industrial expansion during the nineteenth century: With an application to the American iron industry. Journal of Political Economy 77: 306–328. Fogel RW, Engerman SL. 1974. Time on the Cross: The Economics of American Negro Slavery. Boston: Little, Brown. Fogel RW, Floud R, Harris B, Hong SC. 2009. The Changing Body: Health, Nutrition, and Human Development in the Western World since 1700. Cambridge: Cambridge University Press. Galambos L. 1997. Global perspectives on modern business. Business History Review 71: 287–290. Ghemawat P. 2002. Competition and business strategy in historical perspective. Business History Review 76: 37–74. Goldsmith RW. 1952. Income and Wealth of the United States: Trends and Structure. Baltimore: Johns Hopkins Press. Griliches Z. 1956. Hybrid corn: An exploration in the economics of technological change. Phd. diss, University of Chicago.

44
Griliches Z. 1957. Hybrid corn: An exploration in the economics of technological change. Econometrica 25: 501–522. Griliches Z. 1960. Hybrid corn and the economics of innovation. Science 132: 275–280. Griliches Z. 1996. The discovery of the residual: A historical note. Journal of Economic Literature 34: 1324–1330. Harley CK. 1992. International competitiveness of the antebellum American cotton textile industry. Journal of Economic History 52: 559–584. Healy DT. 1972. Development policy: New thinking about an interpretation. Journal of Economic Literature 10: 757–797. Heckman J. 2006. Contributions of Zvi Griliches. NBER Working Paper 12318: National Bureau of Economic Research. Helpman E. 2004. The Mystery of Economic Growth. Cambridge: Belknap Press. Helpman E. 2008. Institutions and Economic Performance. Cambridge: Harvard University Press. Hicks G. 1989. The four little dragons: An enthusiast’s reading guide. Asian‐Pacific Economic Literature 3: 35–49. Jones CI. 1997. On the evolution of the world income distribution. Journal of Economic Perspectives 11: 19–36. Jorgenson DW. 1961a. The development of a dual economy. Economic Journal 71: 309–344. Jorgenson DW. 1961b. The structure of multi‐sector dynamic models. International Economic Review 2: 276–291. Jorgenson DW. 1990. Productivity and international competitiveness in Japan and the United States, 1960–1985. In Productivity in the U.S. and Japan: Studies in Income and Wealth, Volume 51 ed. CR Hulten. Chicago: University of Chicago Press. Jorgenson DW. 2001. Information technology and the U.S. economy. The American Economic Review 91: 1–32. Jorgenson DW. 2005. Information technology and the G7 economies. Accessed December 12, 2008 at http://www.isae.it/Jorgenson_Information.pdf. Jorgenson DW, Christensen LR. 1969. The measurement of U.S. real capital input, 1929–1967. Review of Income and Wealth 15: 293–390.

45
Jorgenson DW, Dougherty C. 1996. International comparisons of the sources of economic growth. American Economic Review 86: 25–29. Jorgenson DW, Fraumeni BM. 1980. Capital formation and U.S. productivity growth, 1948–1976. In Productivity Analysis, ed. A Dogramaci, 49–70. Boston: Martinus Nijhoff. Jorgenson DW, Fraumeni BM. 1986. The role of capital in U.S. economic growth. In Measurement Issues and Behavior of Productivity Variables, ed. A Dogramaci, 161–244. Boston: Martinus Nijhoff. Jorgenson DW, Gollup FM. 1980. U.S. productivity growth by industry, 1947–1973. In New Developments in Productivity Measurement and Analysis, Studies in Income and Wealth, Volume 41, ed. JW Kendrick, B Vaccara. Chicago: University of Chicago Press. Jorgenson DW, Gollop, FM. 1992. Growth in U.S. agriculture: A postwar perspective. American Journal of Agricultural Economics 74: 745–750. Jorgenson DW, Griliches Z. 1967. The explanation of productivity change. Review of Economic Studies 34: 249–280. Jorgenson, DW, Nomura K. 2005. The industry origins of Japanese economic growth. NBER Working Paper 11800: National Bureau of Economic Research. Jorgenson DW, Stiroh KJ. 1999. Information technology and growth. American Economic Review 89: 109–115. Jorgenson DW, Stiroh KJ. 2000. U.S. economic growth at the industry level. American Economic Review 90: 161–167. Jorgenson DW, Vu KM. Forthcoming. Growth accounting within the international comparison program. ICP Bulletin 6 (March). Kato T. 2004. Can the East Asian miracle persist? Remarks by Takatoshi Kato, Deputy Managing Director, International Monetary Fund. Accessed February 2, 2009 at http://www.imf.org/external/np/speeches/2004/120204.htm. Kendrick JW. 1955. Productivity. In Government in Economic Life: 35th Annual Report, ed. S Fabricant. New York: National Bureau of Economic Research. Keyfitz N, Flieger W. 1990. World Population Growth and Aging: Demographic Trends in the Twentieth Century. Chicago: University of Chicago Press. Kim JI, Lau L J. 1994. The sources of economic growth of the East Asian newly industrialized countries. Journal of the Japanese and Industrial Economies 8: 235–271. Kravis IB. 1970. Trade as a handmaiden of growth: Similarities between the nineteenth and twentieth centuries. Economic Journal 80: 850–872.

46
Krishnan RR. 1982. The South Korean “miracle”: Sell‐out to Japan, US. Social Scientist 10: 25–37. Krugman P. 1994. The myth of Asia’s miracle. Foreign Affairs 73, accessed November 10, 2008 at http://fullaccess.foreignaffairs.org/19941101faessay5151/paul‐krugman/the‐myth‐of‐asia‐s‐miracle.html Krugman P. 1998. What happened to Asia? Accessed November 17, 2008 at http://web.mit.edu/krugman/www/DISINTER.html Krugman P, Wells R. 2005. Macroeconomics. New York: Worth Publishers. Kuznets S. 1961. Capital in the American Economy: Its Formation and Financing. Princeton: Princeton University Press. Kuznets S. 1966. Modern Economic Growth. New Haven: Yale University Press. Kuznets S. 1971a. Economic Growth of Nations: Total Output and Production Structure. Chicago: University of Chicago Press. Kuznets S. 1971b. Modern economic growth: Findings and reflections. Lecture to the Memory of Alfred Nobel, December 11, 1971. Accessed December 30, 2008 at http://nobelprize.org/nobel_prizes/ economics/laureates/1971/kuznets‐lecture.html Kuznets S. 1972. Quantitative Economic Research: Trends and Problems. Fiftieth Anniversary Colloquium. New York: NBER. Kuznets S. 1989. Economic Development, the Family, and Income Distribution: Selected Essays. New York: Cambridge University Press. Lamoreaux NR, Raff DMG, Temin P. 2003. Beyond markets and hierarchies: Toward a new synthesis of American business history. American Historical Review 108: 404–433. Landes DS. 1994. What room for accident in history? Explaining big changes by small events. Economic History Review 47: 637–656. Lau LJ. 1969. Asian drama: An inquiry into The Poverty of Nations by Gunnar Myrdal. Stanford Law Review 21: 967–976. Li P. 2009. China to outstrip USA in 2009 auto sales. China.org.cn February 11; accessed March 29, 2009 at http://www.china.org.cn/business/2009‐02/11/content_17260994.htm. Lin JY. 1998. How did China feed itself in the past? How will China feed itself in the future? Second Distinguished Economist Lecture presented at Centro Internacional Mejoramiento de Maiz y Trigo, Mexico, D.F., Medico, January 9, 1998.

47
Lopez JH. 2004. Pro‐growth, pro‐poor: Is there a tradeoff? World Bank Policy Research Working Paper Series 3378. Lucas RE. 1988. On the mechanics of economic development. Journal of Monetary Economics 22: 3–42. Maddison A. 1987. Growth and slowdown in advanced capitalist economies: Techniques of quantitative assessment. Journal of Economic Literature 25: 649–698. Maddison A. 1991. Dynamic Forces in Capitalist Development: A Long‐Run Comparative View. Oxford: Oxford University Press. Maddison A. 1995. Monitoring the World Economy. Paris: Organisation for Economic Cooperation and Development. Maddison A. 1998. Chinese Economic Performance in the Long Run. Paris: OECD Development Centre. Maddison A. 2001. The World Economy: A Millennial Perspective. Paris and Washington, DC: Organisation for Economic Cooperation and Development. Malenbaum W. 1959. India and China: Contrasts in development performance. American Economic Review 49: 284–309. Malenbaum W. 1982. Modern economic growth in India and China: The comparison revisited, 1950–1980. Economic Development and Cultural Change 31: 45–84. Mansfield E. 1971. Technological Change. New York: W.W. Norton and Co. Mansfield E. 1972. Contribution of R&D to economic growth in the United States. Science 175: 477–486. Mansfield E. 1975. International technology transfer: Forms, resource requirements, and policies. American Economic Review 65: 372–376. Mansfield E. 1980. Research and development, productivity, and inflation. Science 209: 1091–1093. Mears LA. 1961. Indonesia. In Economic Development: Analysis and Case Studies, ed. A Pepelases, LA Mears, I Adelman. New York: Harper and Brothers. Mellor JW, Weaver TF, Lele UJ, Simon SR. 1968. Developing Rural India: Plan and Practice. Ithaca: Cornell University Press. Mills TC, Crafts NFR. 2000. After the golden age: A long‐run perspective on growth rates that speeded up, slowed down, and still differ. Manchester School 68: 68–91. Mokyr J. 1985. The Economics of the Industrial Revolution. Totowa, NJ: Rowman and Allanheld.

48
Morrison WM. 2006. CRS Issue Brief for Congress: China’s Economic Conditions. Accessed February 2, 2009 at http://www.fas.org/sgp/crs/row/IB98014.pdf. Murphy KM, Topel RH. The value of health and longevity. NBER Working Paper w11405. Myrdal G. 1968. Asian Drama: An Inquiry into the Poverty of Nations. New York: Pantheon. National Bureau of Statistics of China. 2008. China Statistical Yearbook 2008. China Statistics Press. Nelson RR. 1959. The economics of invention: A survey of the literature. Journal of Business 32: 101–127. Nelson RR. 1964. Aggregate production functions and medium‐range growth projections. American Economic Review 54: 575–606. Nelson RR. 1981. Research on productivity growth and productivity differences: Dead ends and new departures. Journal of Economic Literature 19: 1029–1064. Nelson RR. 1988. Modelling the connections in the cross section between technical progress and R&D intensity. RAND Journal of Economics 19: 478–485. Nelson RR. 1991. Diffusion of development: Post‐World War II convergence among advanced industrial nation. American Economic Review 81: 271–275. Nelson RR, Pack H. 1999. The Asian miracle and economic growth theory. Economic Journal 109: 416‐436. Nelson RR, Winter SG. 1982. An evolutionary theory of economic capabilities. American Economic Review 68: 440–449. Nelson RR, Wright G. 1992. The rise and fall of American technological leadership: The postwar era in historical perspective. Journal of Economic Literature 30: 1931–1964. North DC. 1966. Growth and Welfare in the American Past: A New Economic History. Englewood Cliffs: Prentice Hall. North DC. 1968. Sources of productivity change in ocean shipping 1600–1850. Journal of Political Economy 76: 953–970. North DC. 2005. Understanding the Process of Economic Change. Princeton: Princeton University Press. North DC, Thomas RP. 1970. An economic theory of the growth of the Western world. Economic History Review 23: 1–17.

49
North DC, Thomas RP. 1971. The rise and fall of the manorial system: A theoretical model. Journal of Economic History 31: 777–803. North DC, Thomas RP. 1977. The first economic revolution. Economic History Review 30: 229–241. North DC, Weingast BR. 1989. Constitutions and commitment: The evolution of institutions governing public choice in 17th century England. Journal of Economic History 49: 803–832. OECD. 2005. Policy brief: Economic survey of China, 2005. Accessed on February 2, 2009 at http://www.oecd.org/dataoecd/10/25/35294862.pdf. Olson M. 1982. The Rise and Decline of Nations: Economic Growth, Stagflation, and Social Rigidities. New Haven: Yale University Press. Park JH. 2002. The East Asian model of economic development and developing countries. Journal of Developing Societies 18: 330–353. Pei M. 2006. The dark side of China’s rise. Accessed on February 2, 2009 at http://www.foreignpolicy.com/users/login.php?story_id=3373&URL=http://www.foreignpolicy.com/story/cms.php?story_id=3373&print=1. Pei M. 2007. The high cost of prosperity. Accessed February 2, 2009 at http://www.carnegieendowment.org/publications/index.cfm?fa=view&id=19059&prog=zch. Pepelases A, Mears LA, Adelman I. 1961. Economic Development: Analysis and Case Studies. New York: Harper and Brothers. Perkins DH. 2006a. China’s recent economic performance and future prospects. Asian Economic Policy Review 1: 15–40. Perkins DH. 2006b. Stagnation and growth in China over the millennium: A comment on Angus Maddison’s “China in the World Economy, 1300–2030.” International Journal of Business 11: 255–264. Perkins D, Rawski TG. 2008. Forecasting China’s economic growth to 2025. In China’s Great Economic Transformation, ed. L Brandt, TG Rawksi, 829–886. Cambridge: Cambridge University Press. Ray D. 2008. Development economics. In The New Palgrave Dictionary of Economics, Second Edition, ed. SN Durlaf, L Blume, 468–479. New York: Palgrave Macmillan. Ripley WZ. 1915. Railroads: Finance and Organization. New York: Longmans, Green. Romer P. 1986. Increasing returns and long‐run growth. Journal of Political Economy 94: 1002‐1037. Rosenberg N. 1994. How the developed countries became rich. Daedalus 123: 127–140. Rostow WW. 1979. Getting from Here to There. New York: McGraw‐Hill.

50
Rostow, W.W. 1990. Theorists of Economic Growth from David Hume to the Present. New York: Oxford University Press. Samuelson PA. 1992. Interview conducted by Robert W. Fogel and Enid M. Fogel. Taped recording. Schultz TW. 1962. Investment in Human Beings. Chicago: University of Chicago Press. Schultz TW. 1971. Investment in Human Capital: The Role of Education and Research. New York: Free Press. Schumpter J. 1934. The Theory of Economic Development: An Inquiry into Profits, Capital, Credit, Interest, and the Business Cycle. Cambridge: Harvard University Press. Shenoy BR. 1968. India: Planning for economic disaster. Wall Street Journal, 23 May. Simon M. 1970. New British investment in Canada, 1865–1914. Canadian Journal of Economics 3: 238–254. Sklaeiwitz N. 1966. India’s food plight. Wall Street Journal, 7 June. Sokoloff K, Engerman SL. 2000. History lessons: Institutions, factor endowments, and paths of development in the New World. Journal of Economic Perspectives 14: 217–232. Solow RM. 1957. Technical change and the aggregate production function. Review of Economics and Statistics 39: 312–320. Solow R. 1958. A skeptical note on the constancy of relative shares. American Economic Review 48: 618–631. Solow RM. 2007. The last 50 years in growth theory and the next 10. Oxford Review of Economic Policy 23: 3–14. Srinivasan TN, Bhagwati J. 2001. Outward orientation and development: Are revisionists right? In Trade, Development, and Political Economy: Essays in Honour of Anne Krueger, ed. D Lau, R Shape. London: Palgrave. Stigler GJ. 1947. The Kinky demand curve and rigid prices. Journal of Political Economy 55: 432. Stiglitz JE. 1996. Some lessons from the East Asian miracle. World Bank Research Observer 11: 151–177. Stiglitz JE. 2001. From miracle to crisis to recovery: Lessons from four decades of East Asian experience. In Rethinking the East Asian Miracle, ed. J Stiglitz, S Yusuf, 509–526. Oxford: Oxford University Press. Stone I. 1999. The Global Export of Capital from Great Britain, 1865–1914: A Statistical Survey. New York: St. Martin’s Press.

51
Swan TW. 1956. Economic growth and capital accumulation. Economic Record 11: 334–336. Temin P. 1997. Two views of the British industrial revolution. Journal of Economic History 57: 63–82. Tinbergen J. 1942. Zur theorie der Langfirstigen wirtschaftsentwicklung. Welwirts Archive 1: 511–549. Trajtenberg M, Berndt ER. 2001. In memoriam: Zvi Griliches, 1930–1999. Journal of Economic and Social Measurement 27: 93–97. Teece DJ. 1993. The dynamics of industrial capitalism: Perspectives on Alfred Chandler’s scale and scope. Journal of Economic Literature 31: 199–255. U.S. Bureau of the Census. 1955. Statistical Abstract of the United States 1955. Washington, DC: Government Printing Office. U.S. Bureau of the Census. 2003. Statistical Abstract of the United States 2003. Washington, DC: Government Printing Office. U.S. Intelligence Council. 2008. Global Trends 2025: A Transformed World. Accessed February 3, 2009 at http://www.dni.gov/nic/NIC_2025_project.html. Ying T. 2009. China February auto sales rise 25% after tax cuts. Bloomberg. com March 10; accessed March 27, 2009 at http://www.bloomberg.com/apps /news?pid=20601087&sid=aDCOM2mACDYY&refer=home Young A. 1995. The tyranny of numbers: Confronting the statistical realities of the East Asian growth experience. Quarterly Journal of Economics 110: 641–680. Zakaria F. 2005. Does the future belong to China? Newsweek May 9, accessed February 3, 2009 at http://www.fareedzakaria.com/articles/newsweek/050905.html. Zakaria F. 2006. How long will America lead the world? Newsweek June 12, accessed February 3, 2009 at http://www.fareedzakaria.com/articles/newsweek/061206.html.

Table 1
A Comparison of the Per Capita Income of 15 Nations in 1950 (International Dollars of 1990)
China 439*
Hong Kong 2218**
Indonesia 840**
Korea (South) 770**
Malaysia 1559**
Singapore 2219**
Taiwan 936**
Thailand 817**
India 619*
Japan 1926**
France 5270***
Germany 3881**
Italy 3502**
United Kingdom 6907***
United States 9561***
Source: Maddison 2001.
Rank by World Bank standards of 1990: * low‐income
** lower‐middle income *** upper‐middle income

Table 2
Average Annual Percentage Rates of Growth in Per Capita Income 10 HPAEs Compared with 5 Rich Nations by Quinquenna, 1950–2005
1950‐‐55 1955‐‐60 1960‐‐65 1965‐‐70 1970‐‐75 1975‐‐80 1980‐‐85 1985‐‐90 1990‐‐95
1995‐‐2000 2000‐‐05
China 5.5 3.2 1.0 2.1 2.2 5.1 9.1 6.2 11.1 7.6 8.9Hong Kong 3.5 3.5 9.0 3.4 4.2 8.9 4.0 6.7 3.1 1.0 3.7Indonesia 3.3 0.7 ‐0.6 3.8 4.7 5.9 3.9 5.1 5.8 ‐0.7 3.3Korea (South) 6.5 1.0 3.2 8.6 10.1 5.4 6.5 7.8 6.4 3.5 4.0Malaysia ‐
1.3 0.9 3.4 2.9 5.0 6.2 3.2 3.1 6.9 2.3 2.4
Singapore 1.2 ‐0.4 2.9 10.7 7.7 8.2 2.2 6.2 5.9 3.5 2.8Taiwan* 6.0 3.7 6.6 7.7 6.0 8.3 6.7 3.9 5.6 6.8Thailand 3.0 2.7 3.9 5.3 2.9 5.6 3.7 8.4 7.6 ‐0.6 4.3
India 1.8 2.2 0.5 2.4 0.7 0.7 3.3 4.2 3.2 4.0 5.4Japan 7.6 7.5 8.3 10.4 3.2 3.5 2.6 4.3 1.2 0.8 1.2
France 3.7 3.6 4.4 4.5 2.6 2.6 1.4 2.7 0.7 2.4 1.0Germany 8.3 5.8 3.6 3.4 2.1 3.3 1.3 2.9 1.8 1.9 0.6Italy 6.0 4.8 5.1 5.0 2.1 5.8 1.8 3.0 1.1 1.9 0.1United Kingdom 2.5 2.0 2.4 2.0 1.9 2.1 1.8 3.1 1.3 2.9 2.0United States 2.7 0.8 3.4 2.3 1.6 2.6 2.1 2.3 1.2 2.9 1.4
Sources: 1950‐‐1975: Maddison 2001 1975‐‐2005: World Bank, World Development Indicators Online. (http://web.worldbank.org/WBSITE/EXTERNAL/ DATASTATISTICS/0,,contentMDK:21725423~pagePK:64133150~piPK:64133175~theSitePK:239419,00.html) *1950: Maddison 2001 *1995‐‐2002: Asian Development Bank 2003a and 2003b.

Table 3
Secular Trends in Total Fertility Rates
1950 1960 1970 1980 1990 2000 2005 2007 China 6.24 5.93 4.76 2.68 2.10 1.89 1.60 1.60Hong Kong 4.43 4.97# 3.49 2.06 1.27 1.04 1.00 1.00Indonesia 5.49 5.42 5.10 4.10 3.04 2.42 2.60 2.40Korea (South) 5.18 5.60 5.24 4.02 1.77 1.47 1.20 1.10Malaysia 6.83 6.72 5.15 3.91 3.77 2.96 3.30 2.90Singapore 6.41 5.43## 3.10 1.74 1.87 1.44 1.30 1.30Taiwan* 5.79 4.00 2.51 2.27 1.76 1.20 1.10Thailand 6.62 6.42 5.01 3.52 2.10 1.86 1.70 1.70
India 5.97 5.81 5.43 4.75 3.80 3.07 3.00 2.90Japan 3.30** 2.01 2.07 1.74 1.54 1.36 1.30 1.30
France 2.86** 2.80# 2.48 1.95 1.78 1.88 1.90 2.00Germany (West) 2.10 2.41 2.01 1.46 1.45 1.38 1.30 1.30Italy 2.40 2.42# 2.38 1.64 1.26 1.24 1.30 1.40United Kingdom 2.18 2.82 2.45 1.89 1.83 1.64 1.70 1.80United States 3.08 3.65 2.47 1.84 2.08 2.06 2.00 2.10
Sources: Keyfitz and Flieger 1990; Population Reference Bureau (see http://www.prb.org/datafind/ datafinder.htm; World Bank, World Development Indicators Online (see http://www.worldbank.org/data/wdi2004/index.htm); CIA World Factbook (see https://www.cia.gov/library/publications/the‐world‐factbook/)
* 1981 ** 1951 # 1961 ## 1962

Table 4
Trends in Caloric Consumption
In calories per capita per day Percentage increase Percentage of calories from animals 1961 2000 2003 1961‐‐2000 1961‐‐2003 1961 2000 2003
China 1725* 2979 2940 72.7 70.4 3.8 19.4 21.9Hong Kong Indonesia 1727 2913 2891 68.7 67.4 2.9 4.1 4.8Korea (South) 2147 3093 3035 44.1 41.4 2.7 15.0 6.2Malaysia 2401 2917 2867 21.5 19.4 10.5 17.8 17.9Singapore Taiwan* Thailand 1938 2459 2424 26.8 25.1 8.8 11.7 12.5
India 2073 2489 2473 20.1 19.3 5.5 7.9 8.2Japan 2468 2753 2768 11.5 12.2 9.6 20.5 20.6
France 3194 3597 3623 12.6 13.4 31.7 37.7 36.8Germany (West) 2889 3505 3484 21.3 20.6 32.7 30.0 30.7Italy 2914 3663 3675 25.7 26.1 15.5 25.5 25.7United Kingdom 3240 3312 3450 2.2 6.5 38.8 30.1 30.6United States 2883 3814 3754 32.3 30.2 35.1 27.4 27.8
World 2255 2805 2809 24.4 24.6 15.0 16.5 17.0
Source: FAOSTAT nutritional data, 2004 (http://apps.fao.org/default.jsp), using the "Food Balance Sheets" data collection. *1962
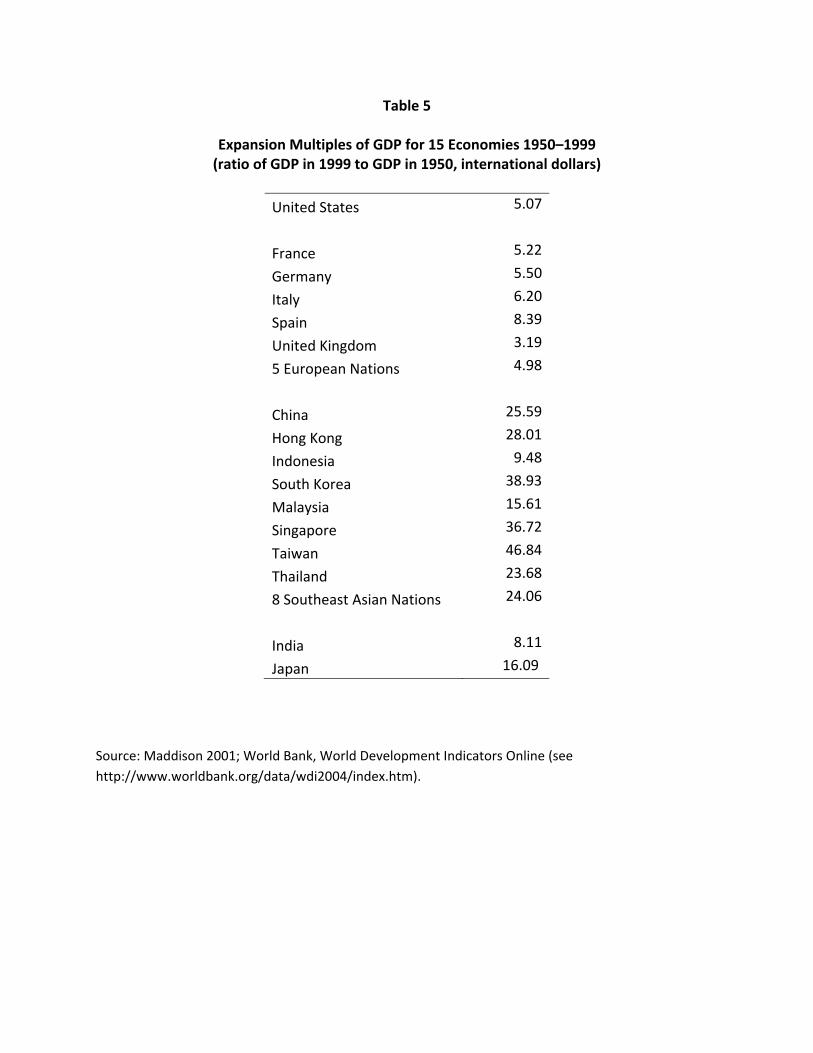
Table 5
Expansion Multiples of GDP for 15 Economies 1950–1999 (ratio of GDP in 1999 to GDP in 1950, international dollars)
United States 5.07
France 5.22
Germany 5.50
Italy 6.20
Spain 8.39
United Kingdom 3.19
5 European Nations 4.98
China 25.59
Hong Kong 28.01
Indonesia 9.48
South Korea 38.93
Malaysia 15.61
Singapore 36.72
Taiwan 46.84
Thailand 23.68
8 Southeast Asian Nations 24.06
India 8.11
Japan 16.09
Source: Maddison 2001; World Bank, World Development Indicators Online (see http://www.worldbank.org/data/wdi2004/index.htm).

Table 6
Gross Enrollment Ratios
Age for compulsory attendance
Primary School Secondary School Tertiary School#
1980 1997 2006 1980 1997 2006 1980 1997 2005
China 113 123 111 46 70 76 2 6 19** 7–15Hong Kong 107 94 98* 64 73 85 10 22 32 Indonesia 107 113 114 20 56 64 4 11 17 7–15Korea (South)
110 94 105 78 102 96 15 68 90 6–15
Malaysia 94 101 101* 48 64 69* 4 12 Singapore Taiwan* Thailand 99 87 108 35 58 78 5 21 43 6–14
India 83 100 112 30 49 54* 5 7 12** 6–14Japan 101 101 100 93 103 101 31 41 54** 6–15
France 111 105 110 85 111 114 25 51 56** 6–16Germany (West) 104 103 104 101 27 47 6–18Italy 103 101 103 72 95 100 27 47 63** 6–14United Kingdom
104 116 105 83 129 98 19 52 60** 5–16
United States
99 102 98 91 97 94 56 81 82** 6–16
Sources: National Center for Education Statistics 2002 (1980, 1997), World Resources Institute EarthTrend ((http://earthtrends.wri.org/searchable_db/ index.php?step=countries&cID[]=63&cID[]=91&cID[]=189&cID[]=190&theme=4 &variable_ID=423&action=select_years))
Unesco.org (http://stats.uis.unesco.org/unesco/ReportFolders/ReportFolders.aspx)
* = 2005 ** = 2004 # It has been argued that the high U.S. figures for tertiary education are misleading because of the wide range of educational content in U.S. institutions at the junior college and four‐year undergraduate schools. While it is true that European gymnasiums provide educations equivalent to the first two years of many U.S. colleges, the elite American universities provide educations that surpass those of the gymnasiums. At the doctoral and postdoctoral level, elite American universities are superb—hence, the large number of foreign students who flock to U.S. programs.

Table 7
The Global Distribution of Gross Domestic Product (GDP) in 2000, by Grouping of Nations
Grouping Population (in millions)
Percent of total GDP in billions of $
(PPP) Percent of total
United States 282 5 9,601 22
European Union (EU 15)
378 6 9,264 21
India 1,003 16 2,375 5
China 1,369 22 4,951 11
Japan 127 2 3,456 8
6 South East Asian Countries (SE6)
381 6 2,552 6
Subtotals 3,540 57 32,199 73
Rest of the world 2,546 42 12,307 28
World 6,086 99 44,506 101
Source: Fogel 2007.

Table 8
The Global Distribution of Gross Domestic Product (GDP) in 2040, by Grouping of Nations
Grouping Population (in millions)
Percent of total GDP in billions of $ (PPP)
Percent of total
United States 392 5 41,944 14
European Union (EU 15)
376 4 15,040 5
India 1,522 17 36,528 12
China 1,455 17 123,675 40
Japan 108 1 5,292 2
6 South East Asian Countries
(SE6) 516 6 35,604 12
Subtotals 4,369 50 258,083 85
Rest of the world
4,332 50 49,774 16
World 8,701 100 307,857 101
Source: Fogel 2007.

Table 9
Automobile Production in Southeast and South Asia Compared with 5 Western Nations and Japan
Production in 2007 (thousands) Production Increase over 2006 (%)
China 8883 22Hong Kong Indonesia 412 39Korea (South) 4086 6Malaysia 442 ‐12Singapore Taiwan 283 ‐7Thailand 1287 8
India 1708 14Japan 11596 1
France 3016 ‐5Germany 6214 7Italy 1284 6United Kingdom 1750 6United States 10781 ‐5
World 73153 5.7
Source: Organisation International des Constructeurs d’Automobiles, survey for 2006–2007 (http://ww.oica.net).