the impact of universal service funds on fixed … access and... · the impact of universal service...
TRANSCRIPT
The Impact of Universal Service Funds
on Fixed-Broadband Deployment and
Internet Adoption in Asia and the Pacific
Asia-Pacific Information Superhighway (AP-IS) Working Paper Series
1
The Impact of Universal Service Funds
on Fixed-Broadband Deployment and
Internet Adoption in Asia and the Pacific
Asia-Pacific Information Superhighway (AP-IS) Working Paper Series
2
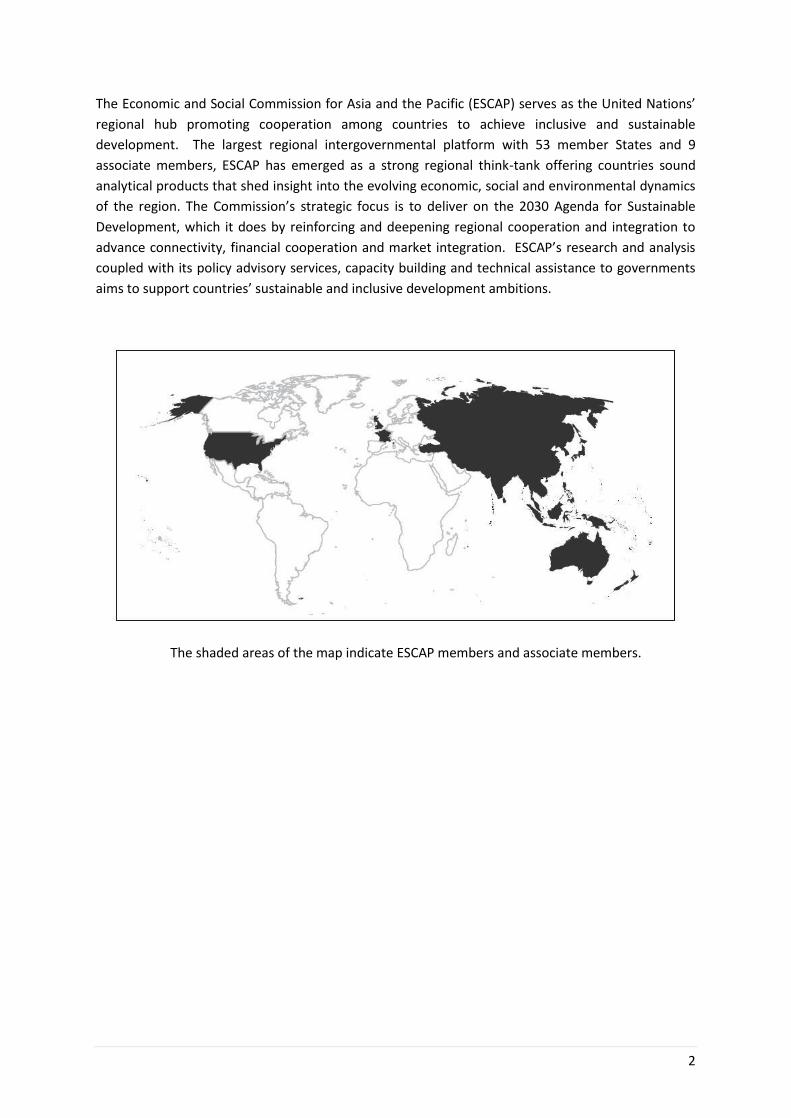
The Economic and Social Commission for Asia and the Pacific (ESCAP) serves as the United Nations’
regional hub promoting cooperation among countries to achieve inclusive and sustainable
development. The largest regional intergovernmental platform with 53 member States and 9
associate members, ESCAP has emerged as a strong regional think-tank offering countries sound
analytical products that shed insight into the evolving economic, social and environmental dynamics
of the region. The Commission’s strategic focus is to deliver on the 2030 Agenda for Sustainable
Development, which it does by reinforcing and deepening regional cooperation and integration to
advance connectivity, financial cooperation and market integration. ESCAP’s research and analysis
coupled with its policy advisory services, capacity building and technical assistance to governments
aims to support countries’ sustainable and inclusive development ambitions.
The shaded areas of the map indicate ESCAP members and associate members.
3
Acknowledgements
This working paper was prepared by Atsuko Okuda, Dongjong Lee, Siope Vakataki ‘Ofa, Eric Roeder, Achara Jantarasaengaram and Jeremy Marand of the Information and Communications Technology and Development Section, under the guidance of Tiziana Bonapace, Director, Information and Communications Technology and Disaster Risk Reduction Division (IDD) of the United Nations Economic and Social Commission for Asia and the Pacific (ESCAP). This working paper was reviewed by an external peer review panel that provided very useful comments on an earlier draft. We therefore acknowledge useful comments received from Rohan Samarajiva (LirneAsia), Diana Korka and Torbjorn Fredriksson (UNCTAD), Darlington Etim Akaiso (IFC), Natasha Beschorner (World Bank), Tientip Subhanij, Aiko Akiyama and Yusuke Tateno (ESCAP). The Asia-Pacific Information Superhighway (AP-IS) Working Papers provide policy-relevant analysis on regional trends and challenges in support of the development of the Asia-Pacific Information Superhighway (AP-IS) and inclusive development. The views expressed herein are those of the authors, and do not necessarily reflect the views of the United Nations. The designations employed and material presented do not imply the expression of any opinion whatsoever on the part of the Secretariat of the United Nations concerning the legal status of any country, territory, city or area, or of its authorities, or concerning the delimitation of its frontiers or boundaries. The paper has been issued without formal editing. Correspondence concerning this paper should be addressed to the email: [email protected]. Cover Design: Jonas Flake Cover Photo: Siribao / ShutterStock October 2017 Contact: ICT and Development Section Information and Communications Technology and Disaster Risk Reduction Division United Nations Economic and Social Commission for Asia and the Pacific United Nations Building Rajadamnern Nok Avenue Bangkok 10200, Thailand Email: [email protected]

4

5
Table of Contents
Acknowledgements ................................................................................................................................. 3
List of Figures .......................................................................................................................................... 6
List of Tables ........................................................................................................................................... 6
Abbreviations and Acronyms .................................................................................................................. 7
Executive Summary ................................................................................................................................. 8
1. Introduction .................................................................................................................................... 9
2. UASFs and their Objectives ........................................................................................................... 10
3. Mechanisms for UASF Implementation ........................................................................................ 11
4. UASFs in the Asia-Pacific Region ................................................................................................... 13
5. Empirical Analysis: Examining the Magnitude of Rural and Urban Gaps...................................... 19
6. Preliminary Analysis for Internet and Broadband Adoption......................................................... 22
6.1 Econometric Analysis to Corroborate the Results ...................................................................... 23
7. Detailed Analysis at Different Phases of Broadband and Internet Development ........................ 30
8. Analysis of Internet Adoption ....................................................................................................... 33
9. Challenges in Implementing UASFs ............................................................................................... 36
9.1 Disbursement and Time Lag Challenges ..................................................................................... 36
9.2 Structural and Operational Challenges ....................................................................................... 37
9.3 Additional Considerations ........................................................................................................... 37
10. Other Perspectives .................................................................................................................... 38
11. Good Examples from Asia and the Pacific ................................................................................ 38
12. Conclusion ................................................................................................................................. 41
6
List of Figures
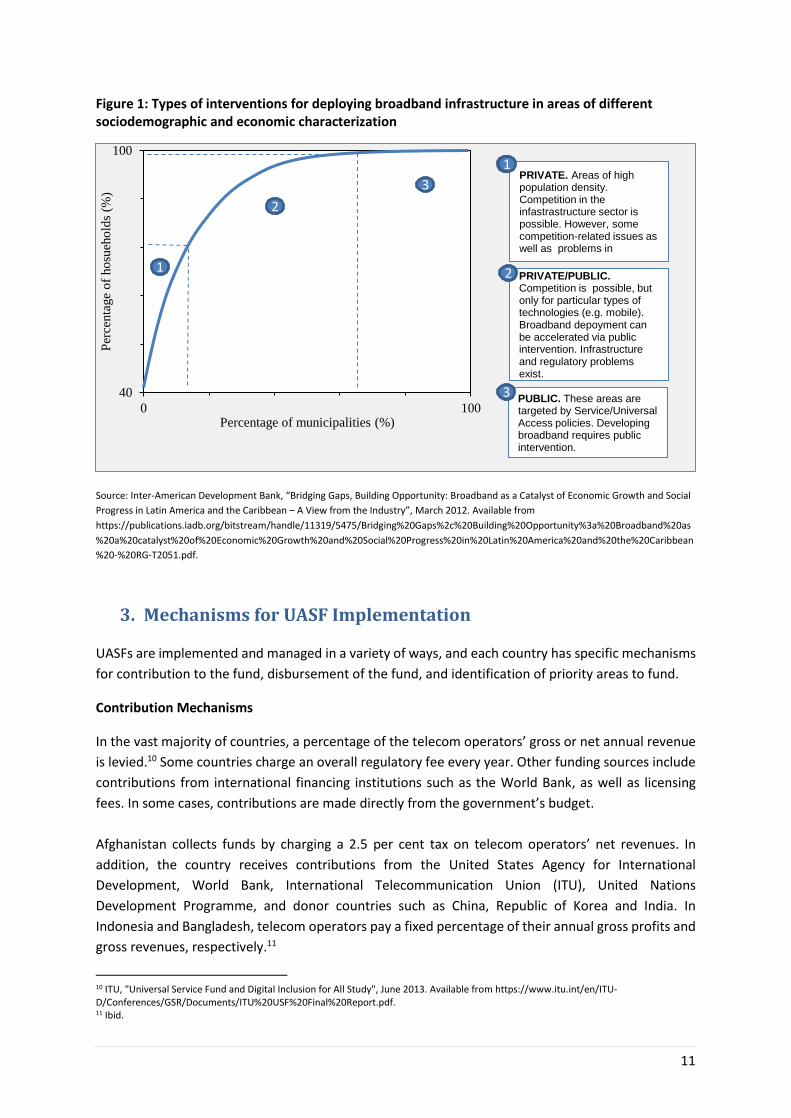
Figure 1: Types of interventions for deploying broadband infrastructure in areas of different
sociodemographic and economic characterization .............................................................................. 11
Figure 2: UASFs’ areas of focus by technology types in different regions ............................................ 13
Figure 3: Percentage of claimed Internet users in India, 2008-2015 .................................................... 20
Figure 4: Number of mobile Internet users in India, 2012-2016 .......................................................... 20
Figure 5: Average annual growth rates of fixed-broadband subscriptions per 100 inhabitants and
Internet users per 100 inhabitants in middle-income countries with and without a UASF, 2010-2015
.............................................................................................................................................................. 23
Figure 6: Average annual growth rates of fixed-broadband subscriptions per 100 inhabitants in
middle-income countries, by three-year intervals ............................................................................... 30
Figure 7: Average annual growth rates of Internet users per 100 inhabitants in middle-income
countries, by three-year intervals ......................................................................................................... 33
Figure 8: Household access to the Internet in Pakistan 2012-2016, rural and urban areas ................. 39
Figure 9: Share of rural and urban Internet users in Malaysia, 2009-2015 .......................................... 41
List of Tables
Table 1: National broadband policies and UASF broadband projects .................................................. 14
Table 2: Key ICT indicators in rural and urban areas of selected countries .......................................... 21
Table 3: Regression analysis of fixed-broadband adoption .................................................................. 26
Table 4: Regression analysis of Internet users ...................................................................................... 27
Table 5: Average annual growth rates of fixed-broadband subscriptions per 100 inhabitants in
selected countries, by three-year intervals .......................................................................................... 31
Table 6: Fixed-broadband subscriptions per 100 inhabitants in selected countries, by three-year
intervals................................................................................................................................................. 33
Table 7: Average annual growth rates of Internet users per 100 inhabitants in selected countries, by
three-year intervals............................................................................................................................... 34
Table 8: Internet users per 100 inhabitants in selected countries, by three-year intervals................. 34
Table 9: Internet projects financed by UASFs in selected countries .................................................... 35
7
Abbreviations and Acronyms
AP-IS Asia-Pacific Information Superhighway
CBC Community Broadband Centre (Malaysia)
CBL Community Broadband Library (Malaysia)
ESCAP Economic and Social Commission for Asia and the Pacific (United Nations)
GDP Gross Domestic Product
ICT Information and Communications Technology
ITU International Telecommunication Union
PPP Purchasing Power Parity
UASF Universal Access and Service Fund
USF Universal Service Fund
USO Universal Service Obligation
USOF Universal Service Obligation Fund
8
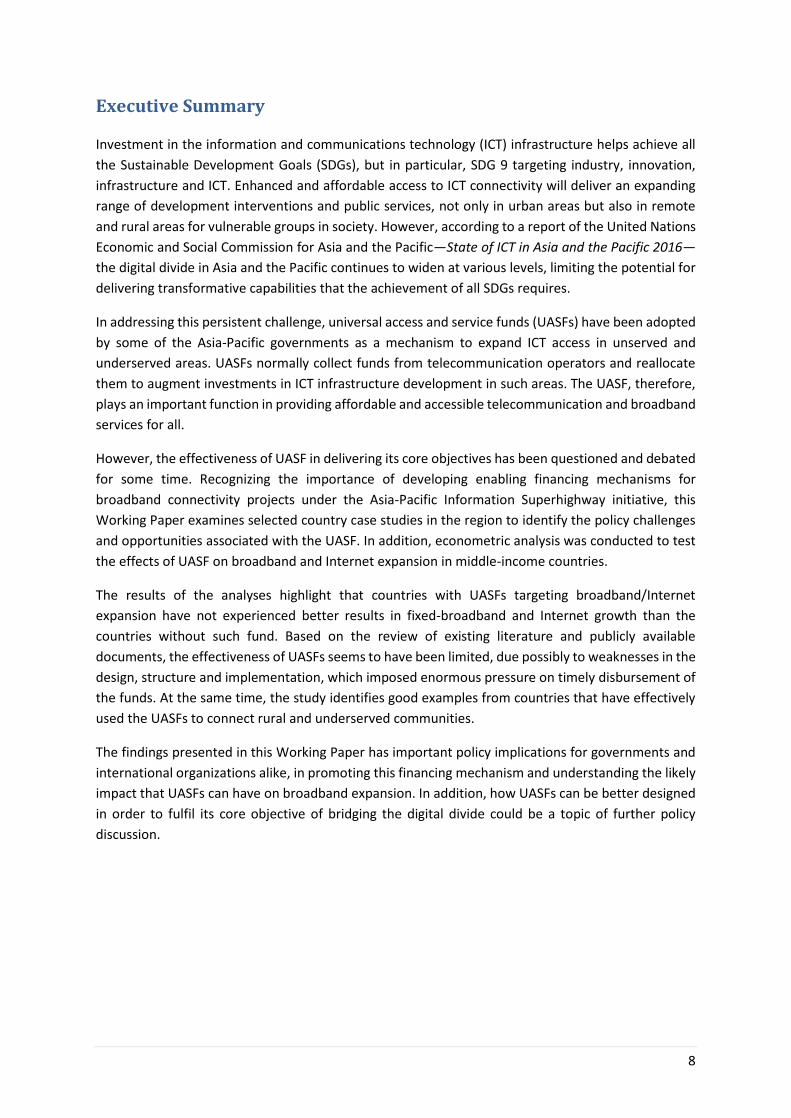
Executive Summary
Investment in the information and communications technology (ICT) infrastructure helps achieve all
the Sustainable Development Goals (SDGs), but in particular, SDG 9 targeting industry, innovation,
infrastructure and ICT. Enhanced and affordable access to ICT connectivity will deliver an expanding
range of development interventions and public services, not only in urban areas but also in remote
and rural areas for vulnerable groups in society. However, according to a report of the United Nations
Economic and Social Commission for Asia and the Pacific—State of ICT in Asia and the Pacific 2016—
the digital divide in Asia and the Pacific continues to widen at various levels, limiting the potential for
delivering transformative capabilities that the achievement of all SDGs requires.
In addressing this persistent challenge, universal access and service funds (UASFs) have been adopted
by some of the Asia-Pacific governments as a mechanism to expand ICT access in unserved and
underserved areas. UASFs normally collect funds from telecommunication operators and reallocate
them to augment investments in ICT infrastructure development in such areas. The UASF, therefore,
plays an important function in providing affordable and accessible telecommunication and broadband
services for all.
However, the effectiveness of UASF in delivering its core objectives has been questioned and debated
for some time. Recognizing the importance of developing enabling financing mechanisms for
broadband connectivity projects under the Asia-Pacific Information Superhighway initiative, this
Working Paper examines selected country case studies in the region to identify the policy challenges
and opportunities associated with the UASF. In addition, econometric analysis was conducted to test
the effects of UASF on broadband and Internet expansion in middle-income countries.
The results of the analyses highlight that countries with UASFs targeting broadband/Internet
expansion have not experienced better results in fixed-broadband and Internet growth than the
countries without such fund. Based on the review of existing literature and publicly available
documents, the effectiveness of UASFs seems to have been limited, due possibly to weaknesses in the
design, structure and implementation, which imposed enormous pressure on timely disbursement of
the funds. At the same time, the study identifies good examples from countries that have effectively
used the UASFs to connect rural and underserved communities.
The findings presented in this Working Paper has important policy implications for governments and
international organizations alike, in promoting this financing mechanism and understanding the likely
impact that UASFs can have on broadband expansion. In addition, how UASFs can be better designed
in order to fulfil its core objective of bridging the digital divide could be a topic of further policy
discussion.

9
1. Introduction
Extending information and communications technology (ICT) connectivity to remote and rural areas
has been a perennial challenge in the development community. While the socioeconomic benefits
created by ICT have been widely recognized over the past decades, ICT connectivity has not reached
the group of people that would benefit most from it. The State of ICT in Asia and the Pacific 20161
highlighted the widening broadband digital divide at regional, subregional and national levels. What
is most worrying is the trend among 18 ESCAP member countries2 with fixed-broadband subscriptions
of less than 2 per cent in the past decade.
Rural and remote areas are often not connected because they are not commercially viable for private
operators. Private sector investments in ICT infrastructure tends to be targeted at the more densely
populated, and hence more profitable, urban areas. Although various approaches, such as public-
private partnerships, have been used to encourage telecom operators to provide services in rural and
remote areas, the lack of financial resources has remained a barrier.
The universal access and service fund (UASF) is one of the key financing mechanisms used to connect
the sparsely populated rural areas, where there is neither the density nor the capital for telecom
operators to justify private sector infrastructure investments. Initially, the UASFs’ focus has been on
providing basic telecommunication services such as fixed telephones to unserved and underserved
areas. But as countries formulate their national broadband strategies, the role of UASFs has shifted to
the building of the broadband infrastructure and providing universal broadband access.
This paper examines the extent to which UASFs have contributed to increased access to fixed
broadband and the Internet3 in countries of Asia and the Pacific.4 The opportunities and challenges of
using UASFs to achieve universal broadband access are also discussed. Fixed broadband is defined as
“high-speed access to the public Internet [via a TCP/IP connection] at downstream speeds equal to or
greater than 256 kbit/s.”5 Econometric analysis, descriptive statistics and case studies are the methods
used in this paper.
The emphasis will be placed on fixed broadband in the paper for the following reasons. First, fixed
broadband is the transmission technology that is most likely to meet the rising bandwidth demand
generated by emerging technologies, such as the Internet of Things and cloud computing. These
emerging technologies and Artificial Intelligence are analyzed in detail in the upcoming report, State
of ICT in Asia and the Pacific 2017. Second, mobile broadband is highly dependent on fixed broadband
infrastructure. In 2016, it was estimated that 60% of mobile data traffic was offloaded to a wired
network via technologies such as femtocell or WiFi and the trend is expected to increase in coming
years.6 Third, mobile broadband growth has been driven mainly by the private sector, while fixed
1 ESCAP, State of ICT in Asia and the Pacific 2016: Uncovering the Widening Broadband Divide (Bangkok, 2016). Available from http://www.unescap.org/resources/state-ict-asia-and-pacific-2016-uncovering-widening-broadband-divide. 2 Afghanistan, Cambodia, Fiji, India, Indonesia, Kiribati, Lao P.D.R., Marshall Islands, Myanmar, Nepal, Pakistan, Papua New Guinea, Samoa, Solomon Islands, Tajikistan, Timor-Leste, Turkmenistan and Vanuatu. 3 Fixed broadband projects examined in the paper mostly include fibre-optic cables. By definition, Internet projects include broadband projects as well as any projects aiming at increasing Internet use such as public Internet Community Centres and Wi-Fi hotspots. 4 UASFs may have obtained sizeable results for other technologies such as fixed telephone and mobile telephony, but this is outside the scope of this study. 5 ITU, “Definitions of World Telecommunication/ICT Indicators”, 2010. Available from http://www.itu.int/en/ITUD/Statistics/Documents/publications/handbook/2010/TelecomICT_Indicators_Definition_March2010_for_web_E.pdf. 6 https://www.cisco.com/c/en/us/solutions/collateral/service-provider/visual-networking-index-vni/mobile-white-paper-c11-520862.html
10
broadband development is more capital intensive, and thus may justify specific and targeted public
sector interventions. Fourth, for this reason, the objectives of the UASFs seem to focus more on the
development of fixed broadband infrastructure, or fiber cables, although it is hard to distinguish
between mobile and fixed broadband in a funded project.
The paper will mostly focus on UASFs in middle-income countries7, but the insights emanating from
the findings could apply to other financing schemes. It is assumed that UASFs may not be an effective
means to provide funds among low-income countries due to their market size, the income level of the
population and reliance on public sector funding. High-income countries, on the other hand, may
prefer a private sector driven approach to rural connectivity expansion.
2. UASFs and their Objectives
UASFs8 are funding mechanisms established by national governments to promote universal access to
telecommunication services. They financially motivate telecommunication service operators to
provide service in locations that would not be commercially viable otherwise.
Depending on the country where they are implemented, UASFs are designed to help address gender,
age and geographical gaps in terms of access, price and quality.9 UASFs are often used with market-
based reforms to correct access gaps that market mechanisms may generate. As Figure 1 clearly
illustrates, providing broadband access in rural and remote areas requires public sector intervention,
as deploying infrastructure in these areas is costly and the potential return on investments is low.
7 With the exceptions of New Zealand and Australia, all countries having a UASF targeting broadband in the region are classified as middle-income countries by the World Bank as of July 2016. Australia is not included in the econometric analysis as broadband has been added as an objective very recently (see Table 1). Afghanistan is the only low-income country included in this paper as its UASF has led Internet-related projects. 8 Different countries use different terms to refer to the UASF. Other terms include: universal access fund (UAF), universal service and access fund (USAF), universal service fund (USF), and universal service obligation fund (USOF). This paper refers to these funds as UASFs in general. In the case that a specific fund is referenced, the actual fund name will be used, for example, India’s Universal Service Obligation Fund. 9 GSMA, "Survey of Universal Service Funds: Key Findings", April 2013, http://www.gsma.com/publicpolicy/wp-content/uploads/2013/04/GSMA-USF-Key-findings-final.pdf.
11
Figure 1: Types of interventions for deploying broadband infrastructure in areas of different sociodemographic and economic characterization
Source: Inter-American Development Bank, “Bridging Gaps, Building Opportunity: Broadband as a Catalyst of Economic Growth and Social
Progress in Latin America and the Caribbean – A View from the Industry”, March 2012. Available from
https://publications.iadb.org/bitstream/handle/11319/5475/Bridging%20Gaps%2c%20Building%20Opportunity%3a%20Broadband%20as
%20a%20catalyst%20of%20Economic%20Growth%20and%20Social%20Progress%20in%20Latin%20America%20and%20the%20Caribbean
%20-%20RG-T2051.pdf.
3. Mechanisms for UASF Implementation
UASFs are implemented and managed in a variety of ways, and each country has specific mechanisms
for contribution to the fund, disbursement of the fund, and identification of priority areas to fund.
Contribution Mechanisms
In the vast majority of countries, a percentage of the telecom operators’ gross or net annual revenue
is levied.10 Some countries charge an overall regulatory fee every year. Other funding sources include
contributions from international financing institutions such as the World Bank, as well as licensing
fees. In some cases, contributions are made directly from the government’s budget.
Afghanistan collects funds by charging a 2.5 per cent tax on telecom operators’ net revenues. In
addition, the country receives contributions from the United States Agency for International
Development, World Bank, International Telecommunication Union (ITU), United Nations
Development Programme, and donor countries such as China, Republic of Korea and India. In
Indonesia and Bangladesh, telecom operators pay a fixed percentage of their annual gross profits and
gross revenues, respectively.11
10 ITU, "Universal Service Fund and Digital Inclusion for All Study", June 2013. Available from https://www.itu.int/en/ITU-D/Conferences/GSR/Documents/ITU%20USF%20Final%20Report.pdf. 11 Ibid.
40
100
0 100
Per
centa
ge
of
ho
sueh
old
s (%
)
Percentage of municipalities (%)3
1
2
3
1
PRIVATE. Areas of high population density. Competition in the infastrastructure sector is possible. However, some competition-related issues as well as problems in
1
PRIVATE/PUBLIC. Competition is possible, but only for particular types of technologies (e.g. mobile). Broadband depoyment can be accelerated via public intervention. Infrastructure and regulatory problems exist.
PUBLIC. These areas are targeted by Service/Universal Access policies. Developingbroadband requires public intervention.
2
3
12
Disbursement of Funds
Funds are disbursed by the government through direct subsidies given to a pre-chosen UASF provider
or through competitive bidding.12 With competitive bidding, the project is undertaken by the operator
that accepts the lowest subsidy. In a single-operator system, all funds go to a single company as is the
case in the Russian Federation where it shifted from a competitive tender process between 21
operators to a single-operator model.13
Priority Areas of Focus
While most UASFs focus on remote and rural areas, they can also target specific types of populations
or technologies. For example, some UASFs take gender inclusion into consideration (e.g., in India and
Malaysia), or design services for persons with disabilities (e.g., in India, Malaysia, New Zealand,
Pakistan and Thailand).
On the technology types, some funds only focus on providing fixed telephone services (e.g., in
Australia, Hong Kong, China and Nepal) while others include the Internet (e.g., in Viet Nam) or more
specifically, broadband (e.g., in Pakistan). Depending on the institutional arrangements of the UASF,
amendments can be introduced to incorporate new types of services as is the case in India where
broadband and mobile services were included later.14
Whereas a variety of fund collection systems, disbursement mechanisms and focus areas exist, most
UASFs share similar principles. Funds are generally collected via percentage levies on telecom
operators’ revenues. Commonly through the implementation of a competitive bidding process, UASFs
aim to create financial incentives for private companies to deploy telecommunication infrastructure
and operate services in remote and rural areas, or for marginalized groups such as students, women
and persons with disabilities.
Theoretically, UASFs are supposed to create a shared contribution mechanism for telecom operators
to invest in infrastructure, which should generate positive returns in the longer run. It is expected that
after the initial fixed investment is subsidized, the infrastructure/service becomes commercially viable
as demand for telecom services and ICT products increase, although in some cases, the subsidy
becomes permanent.15 However, it is often argued that considerable market distortions are generated
by UASFs in the reallocation process, and these distortions should therefore be minimized by
regulators.16
12 Stephen L. Magiera, "Managing Universal Service Funds for Telecommunications: An ASEAN Manual for Output-Based Aid", United States Agency for International Development, September 2009. Available from http://pdf.usaid.gov/pdf_docs/pnaeb219.pdf. 13 Asia-Pacific Economic Cooperation, "Russia – Telecommunications Services". Available from http://www.servicestradeforum.org/Russia/tabid/97/ctl/FurtherInfoDetails/mid/607/details/594/summary/97/Default.aspx. 14 GSMA, "Survey of Universal Service Funds: Key Findings", April 2013, http://www.gsma.com/publicpolicy/wp-content/uploads/2013/04/GSMA-USF-Key-findings-final.pdf. 15 Alliance for Affordable Internet, "Universal Access and Service Funds in the Broadband Era: The Collective Investment Imperative", May 2015. Available from http://a4ai.org/wp-content/uploads/2015/06/A4AI-USAF_06.2015_FINAL.pdf. 16 Rohan Samarajiva and Ayesha Zainudeen, eds., ICT Infrastructure in Emerging Asia: Policy and Regulatory Roadblocks (New Delhi, Sage Publications and International Development Research Centre, 2008), p. 222. Available from https://www.idrc.ca/en/book/ict-infrastructure-emerging-asia-policy-and-regulatory-roadblocks.
13
4. UASFs in the Asia-Pacific Region
The Asia-Pacific region has a considerable number of functioning UASFs, and is one of the two leading
regions in which there is a high level of activity amongst the funds. In comparison with many other
regions, Asia and the Pacific is placing a greater focus on deploying broadband and wireless
infrastructure and services through the UASFs. However, as shown in Figure 2, their proportions are
small compared to the use of the UASFs for fixed-line infrastructure, which is a technology that is
becoming obsolete and costly relative to other alternatives.17
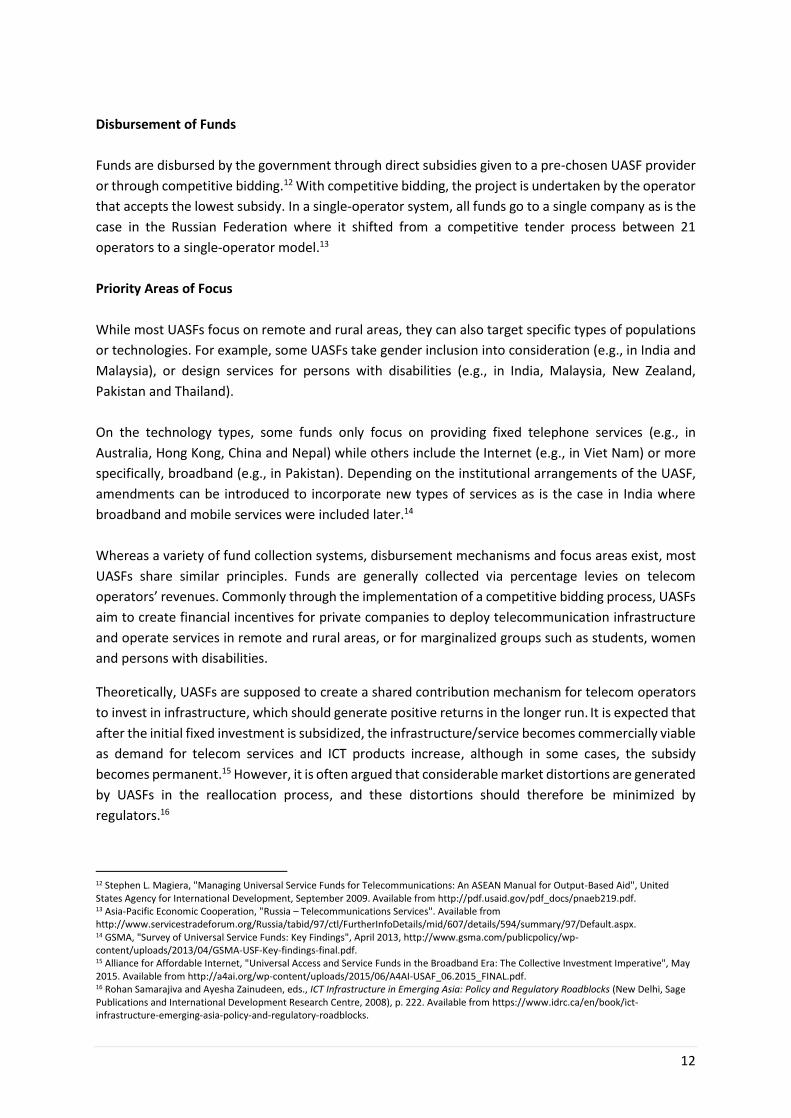
Figure 2: UASFs’ areas of focus by technology types in different regions
Source: GSMA, "Survey of Universal Service Funds: Key Findings", April 2013, http://www.gsma.com/publicpolicy/wp-
content/uploads/2013/04/GSMA-USF-Key-findings-final.pdf.
In the Asia-Pacific region, 44 per cent and 38 per cent of the UASFs cover wireless and broadband
respectively, while 94 per cent of the funds are aimed at reducing fixed-line gaps.18 A study by
Regulatel and others19 recommend adjustments to UASF policies to prioritize investments in
broadband, especially the backbone infrastructure to reach rural and unserved areas.
There are nine UASFs in the Asia-Pacific region that have financed fixed-broadband projects20. These
UASFs are in India, Indonesia, Malaysia, Mongolia, New Zealand, Pakistan, Thailand, Turkey and the
17 Stephen L. Magiera, "Managing Universal Service Funds for Telecommunications: An ASEAN Manual for Output-Based Aid", United States Agency for International Development, September 2009. Available from http://pdf.usaid.gov/pdf_docs/pnaeb219.pdf. 18 A fund may cover more than one technology, thereby resulting in percentage shares of less than 100. 19 Peter A. Stern and David N. Townsend, New Models for Universal Access to Telecommunications Services in Latin America: Lessons from the Past and Recommendations for a New Generation of Universal Access Programs for the 21st Century (Bogota, Regulatel, 2006), pp. 186-198. 20 Countries that have only implemented pilot projects or recognize broadband as an objective but do not have an active UASF are not counted.
94100
89
100 100 10097
44
52
0
42
67
33
4138
19
33
42
67
33 33
0
25
50
75
100
Asia Pacific Africa Europe LatinAmerica
Middle East NorthAmerica
Total
Per
cen
tage
of
fun
ds
in t
he
regi
on
(%
)
cover fixed line cover wireless cover broadband
14
Russian Federation21. When the Regional Broadband Scheme comes into existence in July 2018,
Australia will also have a fund regime to facilitate broadband deployment in rural areas. These UASFs
are either classified as having a moderate (e.g., in Mongolia) or high level of activity (e.g., India,
Indonesia, Malaysia, Pakistan, Thailand and the Russian Federation), according to ITU.22
India, Mongolia and Pakistan are the early implementers of broadband projects through their UASFs
since 2006. India successfully amended its Universal Service Obligation (USO) Policy in 2006 to support
broadband projects. In the same year, the UASFs in Mongolia and Pakistan were created to support
broadband projects. Malaysia's Universal Service Provision Fund officially included broadband in 2008,
followed by Turkey in 2009 and Indonesia in 2010.
More recently, countries with relatively higher fixed-broadband penetration rates have started
incorporating broadband financing through their UASFs—New Zealand in 2011, Thailand in 2012 and
the Russian Federation in 2013 (see Table 1 for more details).
Table 1: National broadband policies and UASF broadband projects
Countries Existing national broadband plan/policy linked to UASF
Milestones for broadband deployment funded by UASF
Australia The Australian Government introduced a new law in June 2017 to establish the Regional Broadband Scheme. This plan imposes the requirement to provide broadband speed of minimum 25 Mbps to all premises using fixed wireless and satellite networks. A tax of USD 5.4 per fixed-line connection collected from all carriers will be used to fund the scheme from July 2018 onwards. The cost of establishing the high-speed broadband infrastructure in rural and remote areas is estimated at USD 7.46 billion. All funds will be paid to NBN Co. Ltd.—the “infrastructure provider of last resort”.23
2016: The Australian Government Productivity Commission recommended the inclusion of broadband to the USO regime. This included supporting rollout of the National Broadband Network infrastructure.24
India The first National Broadband Policy was adopted in 2004. The target was
2006: India’s Act and Rules on the USOF amended to incorporate broadband.27
21 There are several other ESCAP countries with Legislations on Universal Access Service Fund, but not implemented yet, such as Tonga and Samoa, other USAF have been active but with very limited projects in rural areas (Vanuatu). 22 ITU, "Universal Service Fund and Digital Inclusion for All Study", June 2013. Available from https://www.itu.int/en/ITU-D/Conferences/GSR/Documents/ITU%20USF%20Final%20Report.pdf. 23 Australia, Department of Communications and the Arts, "The Regional Broadband Scheme", 22 June 2017. Available from https://www.communications.gov.au/documents/regional-broadband-scheme; TeleGeography, "DCA announces 'Telecommunication Reform Package'", 23 June 2017. Available from https://www.telegeography.com/products/commsupdate/articles/2017/06/23/dca-announces-telecommunication-reform-package/index.html; and Australia, Telecommunications (Regional Broadband Scheme) Charge Bill 2017. Available from https://www.legislation.gov.au/Details/C2017B00146/Download. 24 Australia, Productivity Commission, “Telecommunications Universal Service Obligation: Productivity Commission Draft Report - Overview", November 2016. Available from http://www.pc.gov.au/inquiries/current/telecommunications/draft/telecommunications-draft-overview.pdf. 27 India, Department of Telecommunications, "Presentation on Telecom Sector", 8 December 2011. Available from http://mdoner.gov.in/sites/default/files/silo3_content/telecommunications/Telecom_presentation_before_NAC_8.12.2011.ppt.
15
to provide 20 million broadband connections by 2010 through India’s USOF.25 In 2010, a new National Broadband Plan was released by the Telecom Regulatory Authority of India. The plan indicated the USOF as the funding mechanism for rolling out the fibre-optic network.26
2009: The Rural Wire Line Broadband Scheme initiated. To implement the scheme, the USOF signed an eight-year agreement with BSNL. The objective was to provide 888,832 connections to individual users. In 2015, 656,345 connections were provided.28 2010: USOF signed agreement to support the augmentation, creation and management of the fibre-optic network in Assam over a seven-year period.29 2012: USOF signed agreement to support the augmentation, creation and management of the fibre-optic network in Manipur, Nagaland and Arunachal Pradesh.30
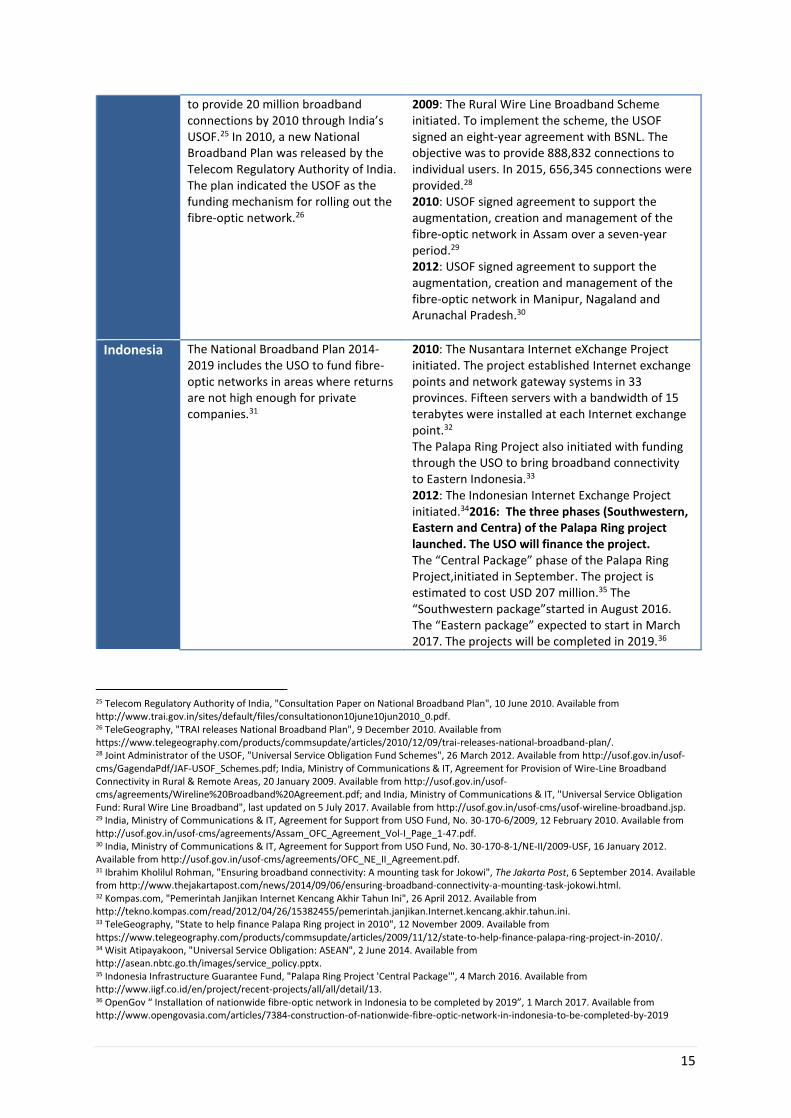
Indonesia The National Broadband Plan 2014-2019 includes the USO to fund fibre-optic networks in areas where returns are not high enough for private companies.31
2010: The Nusantara Internet eXchange Project initiated. The project established Internet exchange points and network gateway systems in 33 provinces. Fifteen servers with a bandwidth of 15 terabytes were installed at each Internet exchange point.32 The Palapa Ring Project also initiated with funding through the USO to bring broadband connectivity to Eastern Indonesia.33 2012: The Indonesian Internet Exchange Project initiated.342016: The three phases (Southwestern, Eastern and Centra) of the Palapa Ring project launched. The USO will finance the project. The “Central Package” phase of the Palapa Ring Project,initiated in September. The project is estimated to cost USD 207 million.35 The “Southwestern package”started in August 2016. The “Eastern package” expected to start in March 2017. The projects will be completed in 2019.36
25 Telecom Regulatory Authority of India, "Consultation Paper on National Broadband Plan", 10 June 2010. Available from http://www.trai.gov.in/sites/default/files/consultationon10june10jun2010_0.pdf. 26 TeleGeography, "TRAI releases National Broadband Plan", 9 December 2010. Available from https://www.telegeography.com/products/commsupdate/articles/2010/12/09/trai-releases-national-broadband-plan/. 28 Joint Administrator of the USOF, "Universal Service Obligation Fund Schemes", 26 March 2012. Available from http://usof.gov.in/usof-cms/GagendaPdf/JAF-USOF_Schemes.pdf; India, Ministry of Communications & IT, Agreement for Provision of Wire-Line Broadband Connectivity in Rural & Remote Areas, 20 January 2009. Available from http://usof.gov.in/usof-cms/agreements/Wireline%20Broadband%20Agreement.pdf; and India, Ministry of Communications & IT, "Universal Service Obligation Fund: Rural Wire Line Broadband", last updated on 5 July 2017. Available from http://usof.gov.in/usof-cms/usof-wireline-broadband.jsp. 29 India, Ministry of Communications & IT, Agreement for Support from USO Fund, No. 30-170-6/2009, 12 February 2010. Available from http://usof.gov.in/usof-cms/agreements/Assam_OFC_Agreement_Vol-I_Page_1-47.pdf. 30 India, Ministry of Communications & IT, Agreement for Support from USO Fund, No. 30-170-8-1/NE-II/2009-USF, 16 January 2012. Available from http://usof.gov.in/usof-cms/agreements/OFC_NE_II_Agreement.pdf. 31 Ibrahim Kholilul Rohman, "Ensuring broadband connectivity: A mounting task for Jokowi", The Jakarta Post, 6 September 2014. Available from http://www.thejakartapost.com/news/2014/09/06/ensuring-broadband-connectivity-a-mounting-task-jokowi.html. 32 Kompas.com, "Pemerintah Janjikan Internet Kencang Akhir Tahun Ini", 26 April 2012. Available from http://tekno.kompas.com/read/2012/04/26/15382455/pemerintah.janjikan.Internet.kencang.akhir.tahun.ini. 33 TeleGeography, "State to help finance Palapa Ring project in 2010", 12 November 2009. Available from https://www.telegeography.com/products/commsupdate/articles/2009/11/12/state-to-help-finance-palapa-ring-project-in-2010/. 34 Wisit Atipayakoon, "Universal Service Obligation: ASEAN", 2 June 2014. Available from http://asean.nbtc.go.th/images/service_policy.pptx. 35 Indonesia Infrastructure Guarantee Fund, "Palapa Ring Project 'Central Package'", 4 March 2016. Available from http://www.iigf.co.id/en/project/recent-projects/all/all/detail/13. 36 OpenGov “ Installation of nationwide fibre-optic network in Indonesia to be completed by 2019”, 1 March 2017. Available from http://www.opengovasia.com/articles/7384-construction-of-nationwide-fibre-optic-network-in-indonesia-to-be-completed-by-2019
16
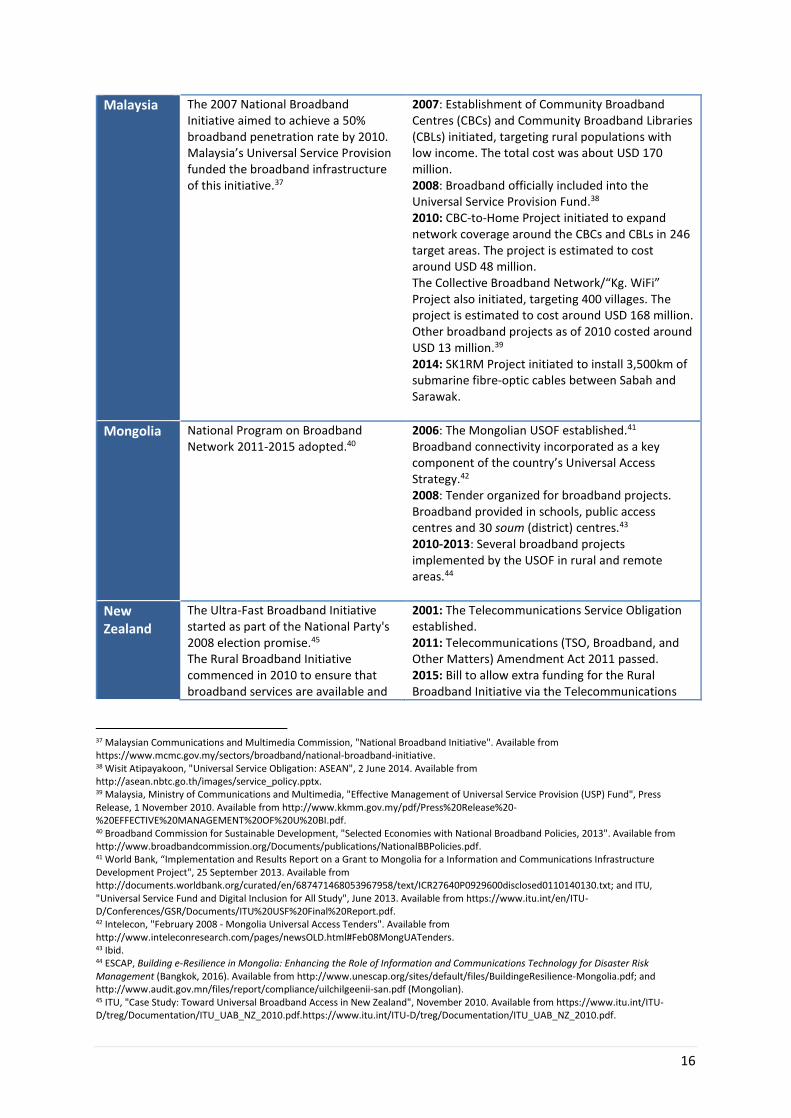
Malaysia The 2007 National Broadband Initiative aimed to achieve a 50% broadband penetration rate by 2010. Malaysia’s Universal Service Provision funded the broadband infrastructure of this initiative.37
2007: Establishment of Community Broadband Centres (CBCs) and Community Broadband Libraries (CBLs) initiated, targeting rural populations with low income. The total cost was about USD 170 million. 2008: Broadband officially included into the Universal Service Provision Fund.38 2010: CBC-to-Home Project initiated to expand network coverage around the CBCs and CBLs in 246 target areas. The project is estimated to cost around USD 48 million. The Collective Broadband Network/“Kg. WiFi” Project also initiated, targeting 400 villages. The project is estimated to cost around USD 168 million. Other broadband projects as of 2010 costed around USD 13 million.39 2014: SK1RM Project initiated to install 3,500km of submarine fibre-optic cables between Sabah and Sarawak.
Mongolia National Program on Broadband Network 2011-2015 adopted.40
2006: The Mongolian USOF established.41 Broadband connectivity incorporated as a key component of the country’s Universal Access Strategy.42 2008: Tender organized for broadband projects. Broadband provided in schools, public access centres and 30 soum (district) centres.43 2010-2013: Several broadband projects implemented by the USOF in rural and remote areas.44
New Zealand
The Ultra-Fast Broadband Initiative started as part of the National Party's 2008 election promise.45 The Rural Broadband Initiative commenced in 2010 to ensure that broadband services are available and
2001: The Telecommunications Service Obligation established. 2011: Telecommunications (TSO, Broadband, and Other Matters) Amendment Act 2011 passed. 2015: Bill to allow extra funding for the Rural Broadband Initiative via the Telecommunications
37 Malaysian Communications and Multimedia Commission, "National Broadband Initiative". Available from https://www.mcmc.gov.my/sectors/broadband/national-broadband-initiative. 38 Wisit Atipayakoon, "Universal Service Obligation: ASEAN", 2 June 2014. Available from http://asean.nbtc.go.th/images/service_policy.pptx. 39 Malaysia, Ministry of Communications and Multimedia, "Effective Management of Universal Service Provision (USP) Fund", Press Release, 1 November 2010. Available from http://www.kkmm.gov.my/pdf/Press%20Release%20-%20EFFECTIVE%20MANAGEMENT%20OF%20U%20BI.pdf. 40 Broadband Commission for Sustainable Development, "Selected Economies with National Broadband Policies, 2013". Available from http://www.broadbandcommission.org/Documents/publications/NationalBBPolicies.pdf. 41 World Bank, “Implementation and Results Report on a Grant to Mongolia for a Information and Communications Infrastructure Development Project", 25 September 2013. Available from http://documents.worldbank.org/curated/en/687471468053967958/text/ICR27640P0929600disclosed0110140130.txt; and ITU, "Universal Service Fund and Digital Inclusion for All Study", June 2013. Available from https://www.itu.int/en/ITU-D/Conferences/GSR/Documents/ITU%20USF%20Final%20Report.pdf. 42 Intelecon, "February 2008 - Mongolia Universal Access Tenders". Available from http://www.inteleconresearch.com/pages/newsOLD.html#Feb08MongUATenders. 43 Ibid. 44 ESCAP, Building e-Resilience in Mongolia: Enhancing the Role of Information and Communications Technology for Disaster Risk Management (Bangkok, 2016). Available from http://www.unescap.org/sites/default/files/BuildingeResilience-Mongolia.pdf; and http://www.audit.gov.mn/files/report/compliance/uilchilgeenii-san.pdf (Mongolian). 45 ITU, "Case Study: Toward Universal Broadband Access in New Zealand", November 2010. Available from https://www.itu.int/ITU-D/treg/Documentation/ITU_UAB_NZ_2010.pdf.https://www.itu.int/ITU-D/treg/Documentation/ITU_UAB_NZ_2010.pdf.
17
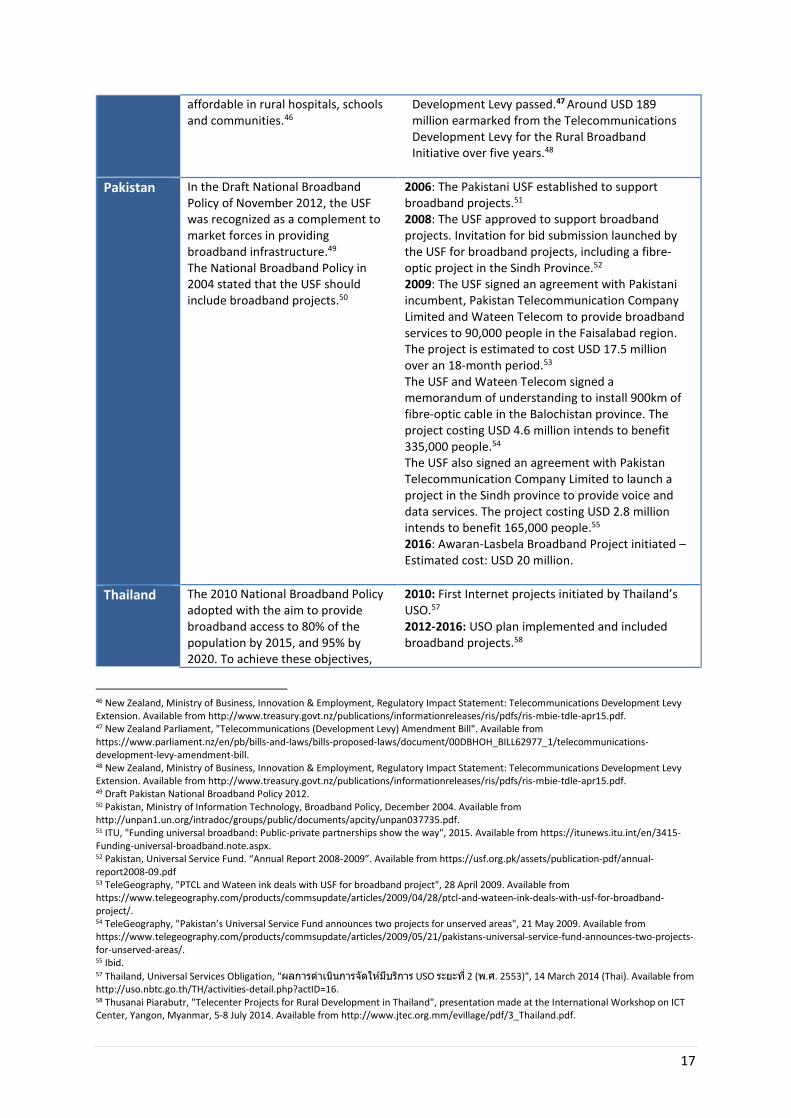
affordable in rural hospitals, schools and communities.46
Development Levy passed.47 Around USD 189 million earmarked from the Telecommunications Development Levy for the Rural Broadband Initiative over five years.48
Pakistan In the Draft National Broadband Policy of November 2012, the USF was recognized as a complement to market forces in providing broadband infrastructure.49 The National Broadband Policy in 2004 stated that the USF should include broadband projects.50
2006: The Pakistani USF established to support broadband projects.51 2008: The USF approved to support broadband projects. Invitation for bid submission launched by the USF for broadband projects, including a fibre-optic project in the Sindh Province.52 2009: The USF signed an agreement with Pakistani incumbent, Pakistan Telecommunication Company Limited and Wateen Telecom to provide broadband services to 90,000 people in the Faisalabad region. The project is estimated to cost USD 17.5 million over an 18-month period.53 The USF and Wateen Telecom signed a memorandum of understanding to install 900km of fibre-optic cable in the Balochistan province. The project costing USD 4.6 million intends to benefit 335,000 people.54 The USF also signed an agreement with Pakistan Telecommunication Company Limited to launch a project in the Sindh province to provide voice and data services. The project costing USD 2.8 million intends to benefit 165,000 people.55 2016: Awaran-Lasbela Broadband Project initiated – Estimated cost: USD 20 million.
Thailand The 2010 National Broadband Policy adopted with the aim to provide broadband access to 80% of the population by 2015, and 95% by 2020. To achieve these objectives,
2010: First Internet projects initiated by Thailand’s USO.57 2012-2016: USO plan implemented and included broadband projects.58
46 New Zealand, Ministry of Business, Innovation & Employment, Regulatory Impact Statement: Telecommunications Development Levy Extension. Available from http://www.treasury.govt.nz/publications/informationreleases/ris/pdfs/ris-mbie-tdle-apr15.pdf. 47 New Zealand Parliament, "Telecommunications (Development Levy) Amendment Bill". Available from https://www.parliament.nz/en/pb/bills-and-laws/bills-proposed-laws/document/00DBHOH_BILL62977_1/telecommunications-development-levy-amendment-bill. 48 New Zealand, Ministry of Business, Innovation & Employment, Regulatory Impact Statement: Telecommunications Development Levy Extension. Available from http://www.treasury.govt.nz/publications/informationreleases/ris/pdfs/ris-mbie-tdle-apr15.pdf. 49 Draft Pakistan National Broadband Policy 2012. 50 Pakistan, Ministry of Information Technology, Broadband Policy, December 2004. Available from http://unpan1.un.org/intradoc/groups/public/documents/apcity/unpan037735.pdf. 51 ITU, "Funding universal broadband: Public-private partnerships show the way", 2015. Available from https://itunews.itu.int/en/3415-Funding-universal-broadband.note.aspx. 52 Pakistan, Universal Service Fund. “Annual Report 2008-2009”. Available from https://usf.org.pk/assets/publication-pdf/annual-report2008-09.pdf 53 TeleGeography, "PTCL and Wateen ink deals with USF for broadband project", 28 April 2009. Available from https://www.telegeography.com/products/commsupdate/articles/2009/04/28/ptcl-and-wateen-ink-deals-with-usf-for-broadband-project/. 54 TeleGeography, "Pakistan’s Universal Service Fund announces two projects for unserved areas", 21 May 2009. Available from https://www.telegeography.com/products/commsupdate/articles/2009/05/21/pakistans-universal-service-fund-announces-two-projects-for-unserved-areas/. 55 Ibid. 57 Thailand, Universal Services Obligation, "ผลการด าเนนิการจัดใหม้บีรกิาร USO ระยะที ่2 (พ.ศ. 2553)", 14 March 2014 (Thai). Available from http://uso.nbtc.go.th/TH/activities-detail.php?actID=16. 58 Thusanai Piarabutr, "Telecenter Projects for Rural Development in Thailand", presentation made at the International Workshop on ICT Center, Yangon, Myanmar, 5-8 July 2014. Available from http://www.jtec.org.mm/evillage/pdf/3_Thailand.pdf.
18
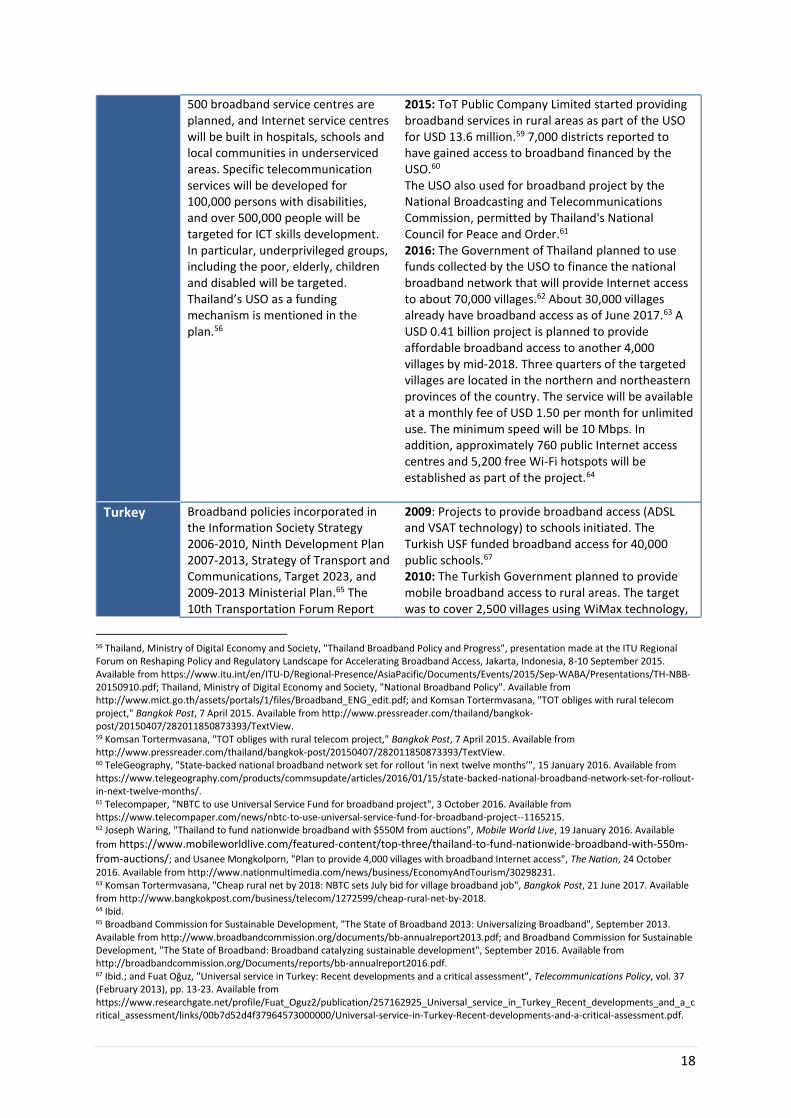
500 broadband service centres are planned, and Internet service centres will be built in hospitals, schools and local communities in underserviced areas. Specific telecommunication services will be developed for 100,000 persons with disabilities, and over 500,000 people will be targeted for ICT skills development. In particular, underprivileged groups, including the poor, elderly, children and disabled will be targeted. Thailand’s USO as a funding mechanism is mentioned in the plan.56
2015: ToT Public Company Limited started providing broadband services in rural areas as part of the USO for USD 13.6 million.59 7,000 districts reported to have gained access to broadband financed by the USO.60 The USO also used for broadband project by the National Broadcasting and Telecommunications Commission, permitted by Thailand's National Council for Peace and Order.61 2016: The Government of Thailand planned to use funds collected by the USO to finance the national broadband network that will provide Internet access to about 70,000 villages.62 About 30,000 villages already have broadband access as of June 2017.63 A USD 0.41 billion project is planned to provide affordable broadband access to another 4,000 villages by mid-2018. Three quarters of the targeted villages are located in the northern and northeastern provinces of the country. The service will be available at a monthly fee of USD 1.50 per month for unlimited use. The minimum speed will be 10 Mbps. In addition, approximately 760 public Internet access centres and 5,200 free Wi-Fi hotspots will be established as part of the project.64
Turkey Broadband policies incorporated in the Information Society Strategy 2006-2010, Ninth Development Plan 2007-2013, Strategy of Transport and Communications, Target 2023, and 2009-2013 Ministerial Plan.65 The 10th Transportation Forum Report
2009: Projects to provide broadband access (ADSL and VSAT technology) to schools initiated. The Turkish USF funded broadband access for 40,000 public schools.67 2010: The Turkish Government planned to provide mobile broadband access to rural areas. The target was to cover 2,500 villages using WiMax technology,
56 Thailand, Ministry of Digital Economy and Society, "Thailand Broadband Policy and Progress", presentation made at the ITU Regional Forum on Reshaping Policy and Regulatory Landscape for Accelerating Broadband Access, Jakarta, Indonesia, 8-10 September 2015. Available from https://www.itu.int/en/ITU-D/Regional-Presence/AsiaPacific/Documents/Events/2015/Sep-WABA/Presentations/TH-NBB-20150910.pdf; Thailand, Ministry of Digital Economy and Society, "National Broadband Policy". Available from http://www.mict.go.th/assets/portals/1/files/Broadband_ENG_edit.pdf; and Komsan Tortermvasana, "TOT obliges with rural telecom project," Bangkok Post, 7 April 2015. Available from http://www.pressreader.com/thailand/bangkok-post/20150407/282011850873393/TextView. 59 Komsan Tortermvasana, "TOT obliges with rural telecom project," Bangkok Post, 7 April 2015. Available from http://www.pressreader.com/thailand/bangkok-post/20150407/282011850873393/TextView. 60 TeleGeography, "State-backed national broadband network set for rollout ‘in next twelve months’", 15 January 2016. Available from https://www.telegeography.com/products/commsupdate/articles/2016/01/15/state-backed-national-broadband-network-set-for-rollout-in-next-twelve-months/. 61 Telecompaper, "NBTC to use Universal Service Fund for broadband project", 3 October 2016. Available from https://www.telecompaper.com/news/nbtc-to-use-universal-service-fund-for-broadband-project--1165215. 62 Joseph Waring, "Thailand to fund nationwide broadband with $550M from auctions", Mobile World Live, 19 January 2016. Available
from https://www.mobileworldlive.com/featured-content/top-three/thailand-to-fund-nationwide-broadband-with-550m-from-auctions/; and Usanee Mongkolporn, "Plan to provide 4,000 villages with broadband Internet access", The Nation, 24 October 2016. Available from http://www.nationmultimedia.com/news/business/EconomyAndTourism/30298231. 63 Komsan Tortermvasana, "Cheap rural net by 2018: NBTC sets July bid for village broadband job", Bangkok Post, 21 June 2017. Available from http://www.bangkokpost.com/business/telecom/1272599/cheap-rural-net-by-2018. 64 Ibid. 65 Broadband Commission for Sustainable Development, "The State of Broadband 2013: Universalizing Broadband", September 2013. Available from http://www.broadbandcommission.org/documents/bb-annualreport2013.pdf; and Broadband Commission for Sustainable Development, "The State of Broadband: Broadband catalyzing sustainable development", September 2016. Available from http://broadbandcommission.org/Documents/reports/bb-annualreport2016.pdf. 67 Ibid.; and Fuat Oğuz, "Universal service in Turkey: Recent developments and a critical assessment", Telecommunications Policy, vol. 37 (February 2013), pp. 13-23. Available from https://www.researchgate.net/profile/Fuat_Oguz2/publication/257162925_Universal_service_in_Turkey_Recent_developments_and_a_critical_assessment/links/00b7d52d4f37964573000000/Universal-service-in-Turkey-Recent-developments-and-a-critical-assessment.pdf.

19
indicated every household should have access to fibre-optic network by 2023.66
and 2,000 rural zones with less than 500 inhabitants using 3G.68
Russian Federation
The National Broadband Plan adopted in 2012. The goal was to provide high-speed Internet connection (+100 Mbps) to 80% of households.69
2013: The Russian Ministry of Communications and Mass Media used the USF for broadband projects in rural and remote areas. USD 150 million allocated annually over a ten-year period to connect rural areas with 250-500 inhabitants to fibre-optic networks.70 2014: Rostelecom became Russia’s single universal service provider. The target was to provide broadband services to 4 million people and 13,000 towns.71
In addition to the countries mentioned in Table 1, Afghanistan, Vanuatu and Viet Nam have used their
respective UASFs to extend access to the Internet. These initiatives have mainly been focused around
providing Internet access to educational institutions, enhancing digital literacy and establishing
Internet access centres for underserved populations/areas. While the vast majority of UASFs targeting
broadband initiated their first broadband projects in the first half of the 2010s, most Internet-related
projects started earlier, in the second half of the 2000s.
An ITU study found that the main constraint for the successful implementation of a UASF is
transparency of fund spending. Of the Asia-Pacific countries mentioned in Table 1, only four has
conducted financial reporting—Australia, India, Malaysia and New Zealand—as of 2013.72
5. Empirical Analysis: Examining the Magnitude of Rural and
Urban Gaps
In the Asia-Pacific region, very few countries with a UASF have published ICT adoption statistics that
are disaggregated by rural and urban locations. Besides, countries are not using standardized
66 Organisation for Economic Co-operation and Development, "Universal Service Policies in the Context of National Broadband Plans", 27 July 2012. Available from http://www.oecd.org/officialdocuments/publicdisplaydocumentpdf/?cote=DSTI/ICCP/CISP%282011%2910/FINAL&docLanguage=En. 68 Organisation for Economic Co-operation and Development, "Universal Service Policies in the Context of National Broadband Plans", 27 July 2012. Available from http://www.oecd.org/officialdocuments/publicdisplaydocumentpdf/?cote=DSTI/ICCP/CISP%282011%2910/FINAL&docLanguage=En; and World Bulletin, "Turkey says to bring telephone, internet services to villages", 30 March 2010. Available from http://www.worldbulletin.net/haber/56214/turkey-says-to-bring-telephone-Internet-services-to-villages. 69 World Bank, "Russia’s Ambitious Broadband Goal: Is the Progress Sustainable?", 3 March 2016. Available from http://www.worldbank.org/en/topic/ict/brief/russias-ambitious-broadband-goal-is-the-progress-sustainable. 70 Asia-Pacific Economic Cooperation, "Russia – Telecommunications Services". Available from http://www.servicestradeforum.org/Russia/tabid/97/ctl/FurtherInfoDetails/mid/607/details/594/summary/97/Default.aspx. 71 Ibid. 72 ITU, "Universal Service Fund and Digital Inclusion for All Study", June 2013. Available from https://www.itu.int/en/ITU-D/Conferences/GSR/Documents/ITU%20USF%20Final%20Report.pdf.
20
indicators to collect data, which makes comparison between countries difficult. The different
indicators being used include: (1) the percentage of households having access to the Internet; (2) the
percentage of households using the Internet; (3) the percentage of individuals who have used the
Internet at least once in their life; and (4) the percentage of active Internet users. Setting a target for
UASFs without baselines is another challenge.
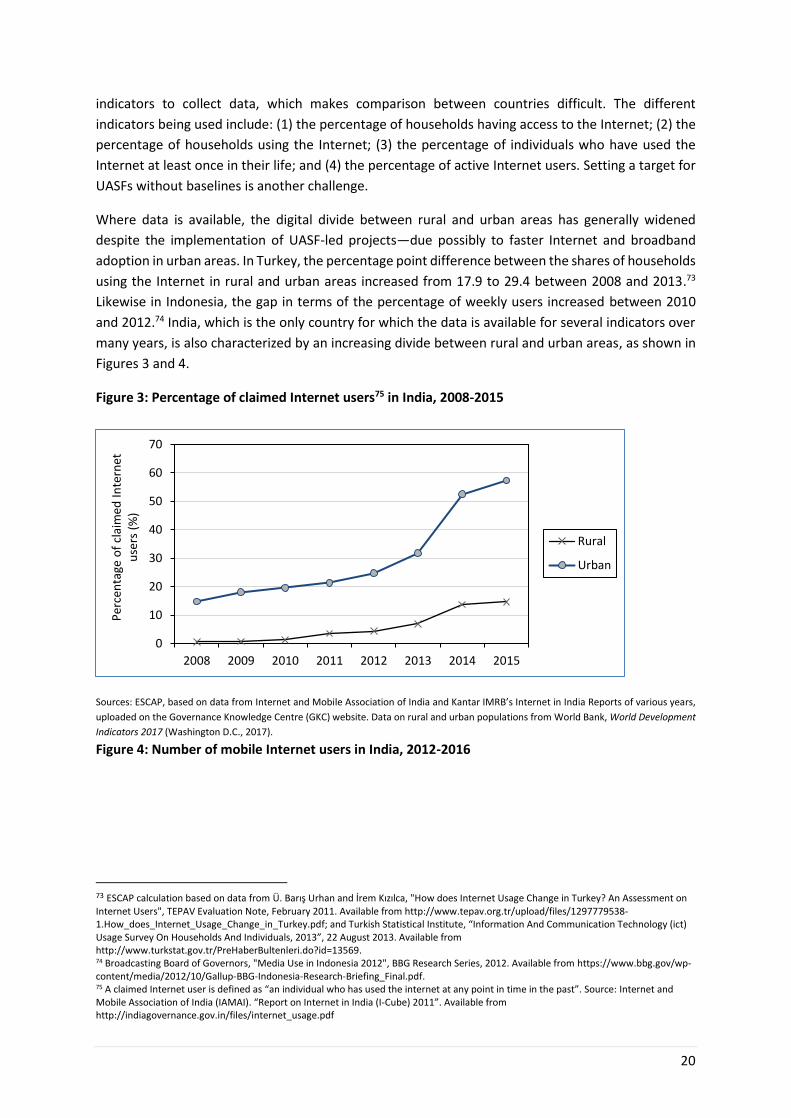
Where data is available, the digital divide between rural and urban areas has generally widened
despite the implementation of UASF-led projects—due possibly to faster Internet and broadband
adoption in urban areas. In Turkey, the percentage point difference between the shares of households
using the Internet in rural and urban areas increased from 17.9 to 29.4 between 2008 and 2013.73
Likewise in Indonesia, the gap in terms of the percentage of weekly users increased between 2010
and 2012.74 India, which is the only country for which the data is available for several indicators over
many years, is also characterized by an increasing divide between rural and urban areas, as shown in
Figures 3 and 4.
Figure 3: Percentage of claimed Internet users75 in India, 2008-2015
Sources: ESCAP, based on data from Internet and Mobile Association of India and Kantar IMRB’s Internet in India Reports of various years,
uploaded on the Governance Knowledge Centre (GKC) website. Data on rural and urban populations from World Bank, World Development
Indicators 2017 (Washington D.C., 2017).
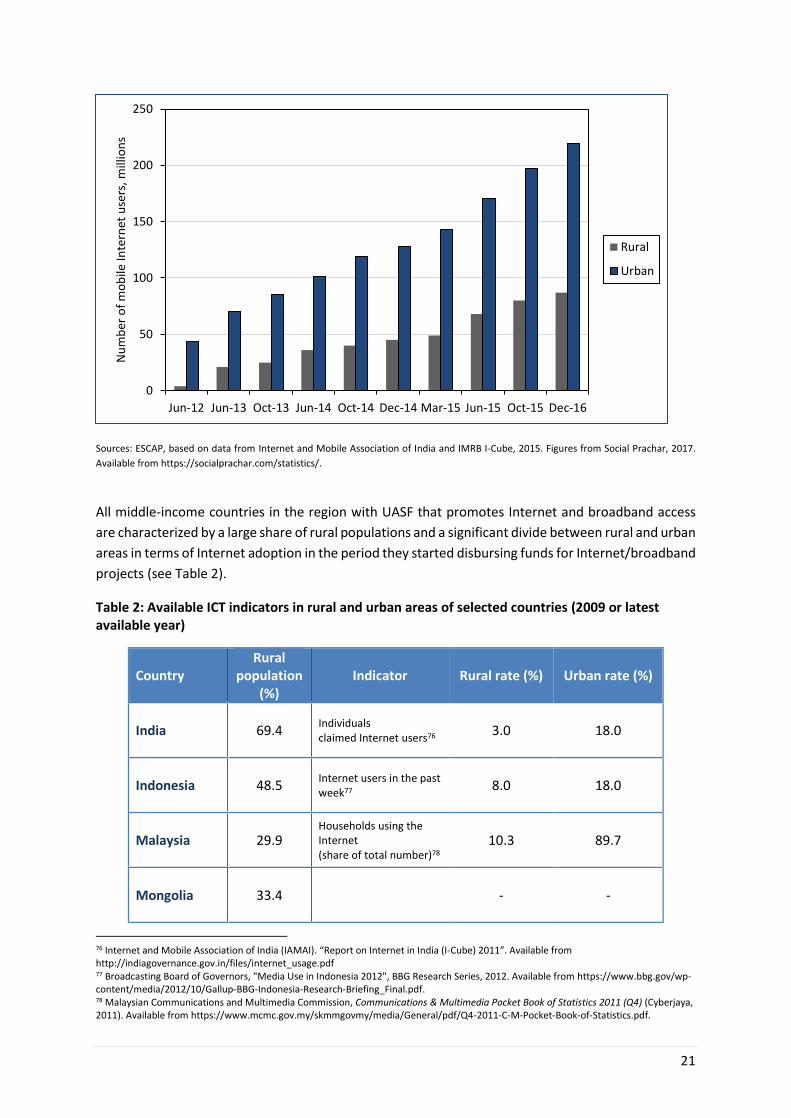
Figure 4: Number of mobile Internet users in India, 2012-2016
73 ESCAP calculation based on data from Ü. Barış Urhan and İrem Kızılca, "How does Internet Usage Change in Turkey? An Assessment on Internet Users", TEPAV Evaluation Note, February 2011. Available from http://www.tepav.org.tr/upload/files/1297779538-1.How_does_Internet_Usage_Change_in_Turkey.pdf; and Turkish Statistical Institute, “Information And Communication Technology (ict) Usage Survey On Households And Individuals, 2013”, 22 August 2013. Available from http://www.turkstat.gov.tr/PreHaberBultenleri.do?id=13569. 74 Broadcasting Board of Governors, "Media Use in Indonesia 2012", BBG Research Series, 2012. Available from https://www.bbg.gov/wp-content/media/2012/10/Gallup-BBG-Indonesia-Research-Briefing_Final.pdf. 75 A claimed Internet user is defined as “an individual who has used the internet at any point in time in the past”. Source: Internet and Mobile Association of India (IAMAI). “Report on Internet in India (I-Cube) 2011”. Available from http://indiagovernance.gov.in/files/internet_usage.pdf
0
10
20
30
40
50
60
70
2008 2009 2010 2011 2012 2013 2014 2015
Per
cen
tage
of
clai
med
Inte
rnet
u
sers
(%
)
Rural
Urban
21
Sources: ESCAP, based on data from Internet and Mobile Association of India and IMRB I-Cube, 2015. Figures from Social Prachar, 2017.
Available from https://socialprachar.com/statistics/.
All middle-income countries in the region with UASF that promotes Internet and broadband access
are characterized by a large share of rural populations and a significant divide between rural and urban
areas in terms of Internet adoption in the period they started disbursing funds for Internet/broadband
projects (see Table 2).
Table 2: Available ICT indicators in rural and urban areas of selected countries (2009 or latest available year)
Country Rural
population (%)
Indicator Rural rate (%) Urban rate (%)
India 69.4 Individuals claimed Internet users76
3.0 18.0
Indonesia 48.5 Internet users in the past week77
8.0 18.0
Malaysia 29.9 Households using the Internet (share of total number)78
10.3 89.7
Mongolia 33.4
- -
76 Internet and Mobile Association of India (IAMAI). “Report on Internet in India (I-Cube) 2011”. Available from http://indiagovernance.gov.in/files/internet_usage.pdf 77 Broadcasting Board of Governors, "Media Use in Indonesia 2012", BBG Research Series, 2012. Available from https://www.bbg.gov/wp-content/media/2012/10/Gallup-BBG-Indonesia-Research-Briefing_Final.pdf. 78 Malaysian Communications and Multimedia Commission, Communications & Multimedia Pocket Book of Statistics 2011 (Q4) (Cyberjaya, 2011). Available from https://www.mcmc.gov.my/skmmgovmy/media/General/pdf/Q4-2011-C-M-Pocket-Book-of-Statistics.pdf.
0
50
100
150
200
250
Jun-12 Jun-13 Oct-13 Jun-14 Oct-14 Dec-14 Mar-15 Jun-15 Oct-15 Dec-16
Nu
mb
er o
f m
ob
ile In
tern
et u
sers
, mill
ion
s
Rural
Urban
22
Pakistan 62.6 Household access to the Internet79
1.0 17.0
Thailand 57.3 Internet users80 14.5 32.7
Turkey 29.9 Household access to the Internet81
15.9 35.9
Vanuatu 75.7 Respondents claimed Internet users82
3.0 15.9
Viet Nam 70.1 Percentage of people who already use the Internet83
- >50.0%
Notes: Indonesia’s data is for 2010; Pakistan’s data is for 2012; and Viet Nam’s data is for 2011.
Sources: Data on rural population from World Bank, World Development Indicators 2017 (Washington D.C., 2017). Data sources for
Internet adoption rates are in the footnotes.
If UASFs have effectively managed to reduce the rural-urban gap and digital divide over time, the
growth rates of broadband and Internet adoption should logically be higher than in other countries
on average, all other factors being constant. To verify this assumption, the next section examines the
impact of UASFs on broadband and Internet adoption average growth rates.
6. Preliminary Analysis for Broadband and Internet Adoption
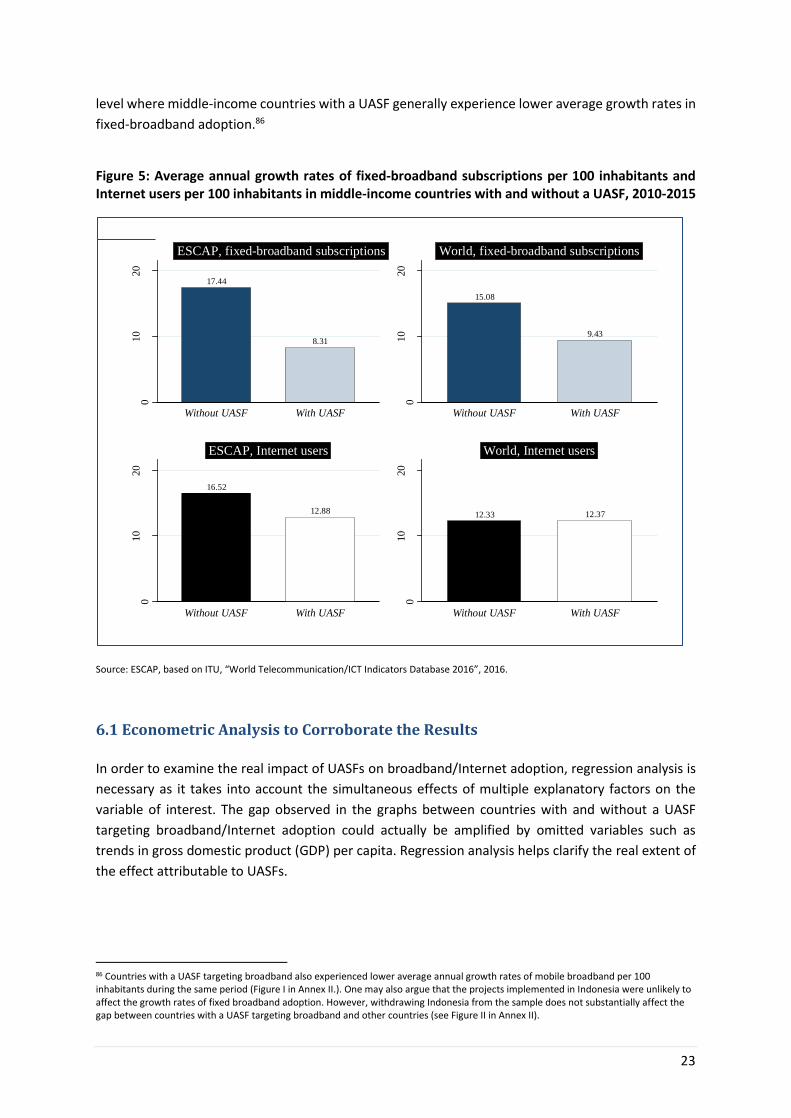
Comparing the average annual growth of fixed-broadband adoption per 100 inhabitants in the period
2010-2015, there is a significant gap between six middle-income countries with a UASF incorporating
broadband as an objective (namely India, Indonesia, Malaysia, Mongolia, Pakistan and Turkey)84 and
other middle-income countries in the region.85 The six countries, taken together, have experienced
lower average growth rates in fixed-broadband adoption than their middle-income counterparts (see
Figure 5). This is not unique to the Asia-Pacific region—a similar observation can be made at the global
79Pakistan, National Institute of Population Studies, Pakistan Demographic and Health Survey 2012-13 (Islamabad, 2013). Available from http://dhsprogram.com/pubs/pdf/FR290/FR290.pdf. 80 Sureerat Santipaporn, "Information and Communication Technology Statistics in Thailand", paper presented at the International Seminar on Information and Communication Technology Statistics, Seoul, Republic of Korea, 19-21 July 2010. Available from https://unstats.un.org/unsd/economic_stat/ICT-Korea/Documents/Santipaporn_Thailand.pdf. 81 Ü. Barış Urhan and İrem Kızılca, "How does Internet Usage Change in Turkey? An Assessment on Internet Users", TEPAV Evaluation Note, February 2011. Available from http://www.tepav.org.tr/upload/files/1297779538-1.How_does_Internet_Usage_Change_in_Turkey.pdf. 82 Pacific Institute of Public Policy, Social and economic impact of introducing telecommunications throughout Vanuatu: Research Findings (Port Vila, 2009). Available from http://pacificpolicy.org/wp-content/blogs.dir/2/files/2009/12/2009-telco-lr.pdf. 83 Cimigo, "2011 Vietnam NetCitizens Report: Internet Usage and Development in Vietnam", April 2011. Available from http://www.cimigo.com/en/download/research_report/348. 84 Thailand and the Russian Federation are not included as they started allowing broadband later. 85 The following formula is used to calculate the average annual growth: 𝐺 =
ln(𝑌𝑖+𝑛)−ln(𝑌𝑖)
𝑛 where 𝑌𝑖+𝑛 is the number of fixed-broadband
subscriptions per 100 inhabitants, at time i + n, and 𝑌𝑖 is the number of fixed-broadband subscriptions per 100 inhabitants at the initial time period. n is the number of time periods between i and i + n. See World Bank, "Data & Statistics: Growth Rates". Available from http://go.worldbank.org/8P105LUGN0.
23
level where middle-income countries with a UASF generally experience lower average growth rates in
fixed-broadband adoption.86
Figure 5: Average annual growth rates of fixed-broadband subscriptions per 100 inhabitants and Internet users per 100 inhabitants in middle-income countries with and without a UASF, 2010-2015
Source: ESCAP, based on ITU, “World Telecommunication/ICT Indicators Database 2016”, 2016.
6.1 Econometric Analysis to Corroborate the Results
In order to examine the real impact of UASFs on broadband/Internet adoption, regression analysis is
necessary as it takes into account the simultaneous effects of multiple explanatory factors on the
variable of interest. The gap observed in the graphs between countries with and without a UASF
targeting broadband/Internet adoption could actually be amplified by omitted variables such as
trends in gross domestic product (GDP) per capita. Regression analysis helps clarify the real extent of
the effect attributable to UASFs.
86 Countries with a UASF targeting broadband also experienced lower average annual growth rates of mobile broadband per 100 inhabitants during the same period (Figure I in Annex II.). One may also argue that the projects implemented in Indonesia were unlikely to affect the growth rates of fixed broadband adoption. However, withdrawing Indonesia from the sample does not substantially affect the gap between countries with a UASF targeting broadband and other countries (see Figure II in Annex II).
17.44
8.31
010
20
Av
erag
e A
nn
ual
Gro
wth
Rat
es (
%)
Without UASF With UASF
ESCAP, fixed-broadband subscriptions
15.08
9.43
010
20
Without UASF With UASF
World, fixed-broadband subscriptions
16.52
12.88
010
20
Av
erag
e A
nn
ual
Gro
wth
Rat
es (
%)
Without UASF With UASF
ESCAP, Internet users
12.33 12.37
010
20
Without UASF With UASF
World, Internet users
24
Methodology
a. Variables
The average annual growth rates of fixed-broadband/Internet adoption87 was regressed against a
number of variables, namely GDP per capita growth, the price of fixed-broadband services, the
adoption of a broadband plan, average population density, and a dummy variable taking the value
one if the country has a UASF targeting broadband/Internet adoption at the beginning of the period
examined, or zero otherwise88. Only broadband projects that can potentially increase the number of
subscriptions were taken into consideration in the regressions examining fixed-broadband adoption.
Therefore, broadband community centers and projects aiming to provide broadband to educational
institutions were excluded in the fixed broadband regression analysis.
Average population density was included as sparsely-populated countries were expected to
experience lower growth rates in Internet and fixed-broadband adoption, since it could require more
investments to reach small numbers of people scattered in numerous remote areas. Population
density is often used as a covariate in studies examining the determinants of broadband adoption.89
The analysis took into account the level of broadband/Internet adoption at the beginning of the period
as it could influence the magnitude of the average annual growth rates (i.e., faster growth at the start
and then gradually slowing down).
Variables reflecting competition in Internet services and international gateways90 were initially
included in the regressions for broadband, but subsequently removed because they were
systematically associated with statistically insignificant coefficients for the periods examined. It is
however common practice in the existing literature to include variables reflecting the degree of
competition in the ICT market.91
GDP per capita growth, institutional quality, as well as fixed-broadband prices were treated as
endogenous variables in the instrumental variable frameworks as they could be influenced by the
dependent variables, namely Internet/fixed-broadband adoption indicators.
87 The method used to calculate the percentage of Internet users in each country is debatable, see e.g. Roshanthi Lucas Gunaratne and Rohan Samarajiva. "Estimating internet users: an evidence-based alternative in the absence of survey data." info 15.5 (2013): 20-33. In this paper, Lucas Gunaratne and Samarajiva argue that estimating Internet adoption rates by using the number of subscriptions in conjunction with a multiplier to include people who use the Internet in public places such as schools and Public Internet Access Points (PIAPs) can underestimate effects. Instead, surveys should be used to collect the data. However, in the absence of data calculated by using alternative methods, the data from ITU is used in the present study. 88 A dummy variable is used to assess the impact of UASF-led policies on broadband/Internet adoption as it is difficult to find variables measuring the magnitude of UASFs’ activities. Very few countries publish the total amount of funds disbursed or report UASF-led projects undertaken every year. 89 See for example Sangwon Lee, Mircea Marcu, and Seonmi Lee. "An empirical analysis of fixed and mobile broadband diffusion." Information Economics and Policy 23.3 (2011): 227-233. 90 World Bank, The Little Data Book on Information Communication and Technology 2017 (Washington D.C., 2017). Available from http://data.worldbank.org/products/data-books/little-data-book-on-info-communication-tech. 91 See for example Briglauer, Wolfgang. "The impact of regulation and competition on the adoption of fiber-based broadband services: recent evidence from the European union member states." Journal of Regulatory Economics 46.1 (2014): 51-79.
25
b. Econometric Models
Empirical techniques based on average annual growth rates were selected in order to avoid
econometric problems induced by panel data structures, such as time effects identification or the unit
root bias.92
Two growth periods (2008-2015 and 2010-2015) were used in the econometric analysis. 2008 was
chosen as the initial year as most UASFs started disbursements for broadband/Internet projects in the
late 2000s. However, to ensure robust findings, the period 2010-2015 was also examined. Countries
that initiated disbursements for UASF-led broadband/Internet projects for the first time after 2011
were excluded from the analysis.
Several alternative specifications were used. In particular, Lewbel's instrumental variable method was
adopted as it addressed the presence of endogenous explanatory variables such as growth in GDP per
capita and potential omitted-variable bias.93 Lewbel’s method is based on instruments that are
internally generated by using the heteroscedastic errors of the first stage regression. This is a
significant advantage as it is generally problematic to find appropriate external instruments that
satisfy the exclusion restriction and the orthogonality conditions, and are strongly correlated with the
endogenous covariates.94 Robust standard errors were used to find evidence of heteroscedasticity in
the regressions.
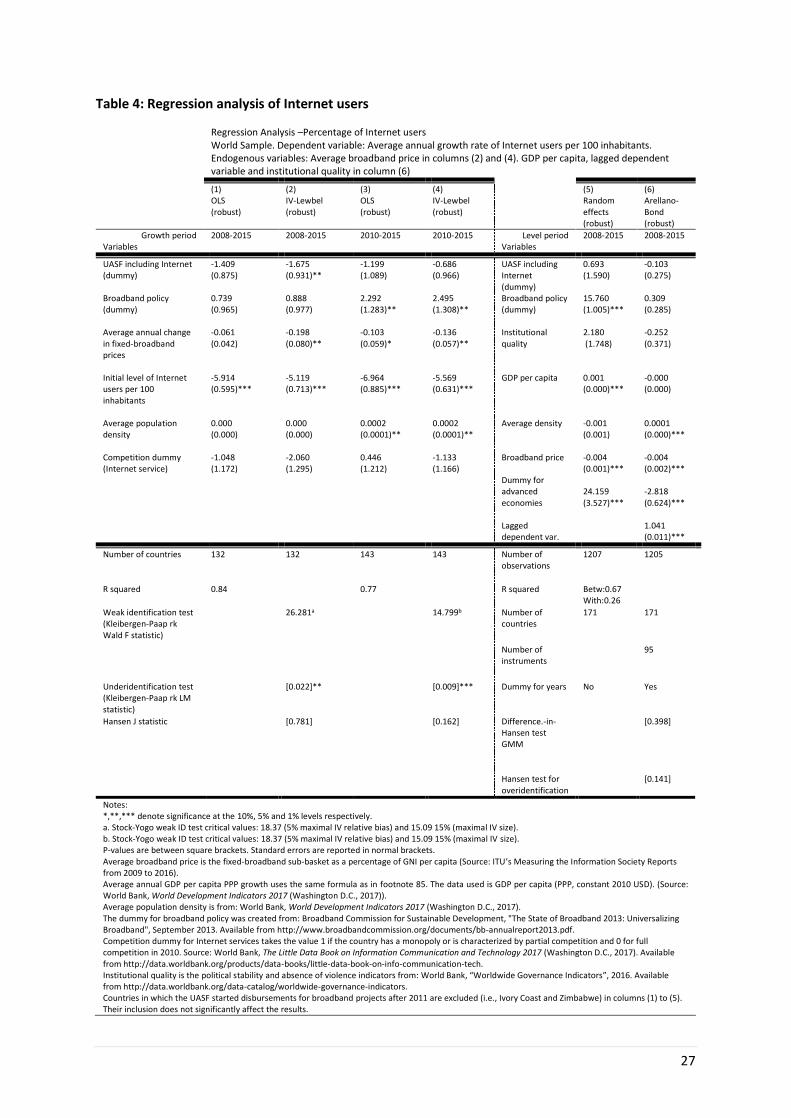
In addition to the econometric specifications based on growth rates, estimates for two panel data
models were made for the Internet adoption analysis. In contrast to the random effect model95 in
column (5) of Table 4, the Arellano-Bond framework addressed the endogeneity bias.96 The limited
number of time periods and the large number of cross-sectional observations offered ideal conditions
to implement this dynamic panel data technique.97 Following Roodman’s recommendations,98
dummies for years were included. The orthogonal deviation transformation was also used because
the panel had some gaps. The two-step robust estimation was preferred as it corrected the downward
biased standard errors and ensured more efficiency at the same time.99 However, the panel data
techniques were not used for fixed broadband and for the period 2010-2015 as the models were found
92 See Z. Csereklyei and D. I. Stern, “Global energy use: Decoupling or convergence?” Energy Economics, vol. 51 (2015), pp. 633-641. 93 Arthur Lewbel, “Using heteroskedasticity to identify and estimate mismeasured and endogenous regressor models”, Journal of Business & Economic Statistics, vol. 30, no. 1 (2012), pp. 67-80; and Christopher F. Baum and others, “Instrumental variables estimation using heteroskedasticity-based instruments”, presentation made at the German Stata Users Group Meeting, Potsdam, 2013. Available from http://www.stata.com/meeting/germany13/abstracts/materials/de13_baum.pdf. 94 Christopher F. Baum and others, “Instrumental variables estimation using heteroskedasticity-based instruments”, presentation made at the German Stata Users Group Meeting, Potsdam, 2013. Available from http://www.stata.com/meeting/germany13/abstracts/materials/de13_baum.pdf. 95 After running the Hausman test, random effects were preferred over fixed effects. 96 Manuel Arellano and Stephen Bond, “Some tests of specification for panel data: Monte Carlo evidence and an application to employment equations”, The Review of Economic Studies, vol. 58, no. 2 (April 1991), pp. 277-297. 97 David Roodman, “How to do xtabond2: An introduction to difference and system GMM in Stata”, The Stata Journal, vol. 9, no. 1 (2006), pp. 86-136. 98 Ibid. 99 Help for xtabond2: "Difference" and "system" GMM dynamic panel estimator. Available from http://fmwww.bc.edu/RePEc/bocode/x/xtabond2.html.
26
to be incorrectly specified in these particular cases.100 The econometric analysis was not restricted to
middle-income countries in order to maximize the sample size.
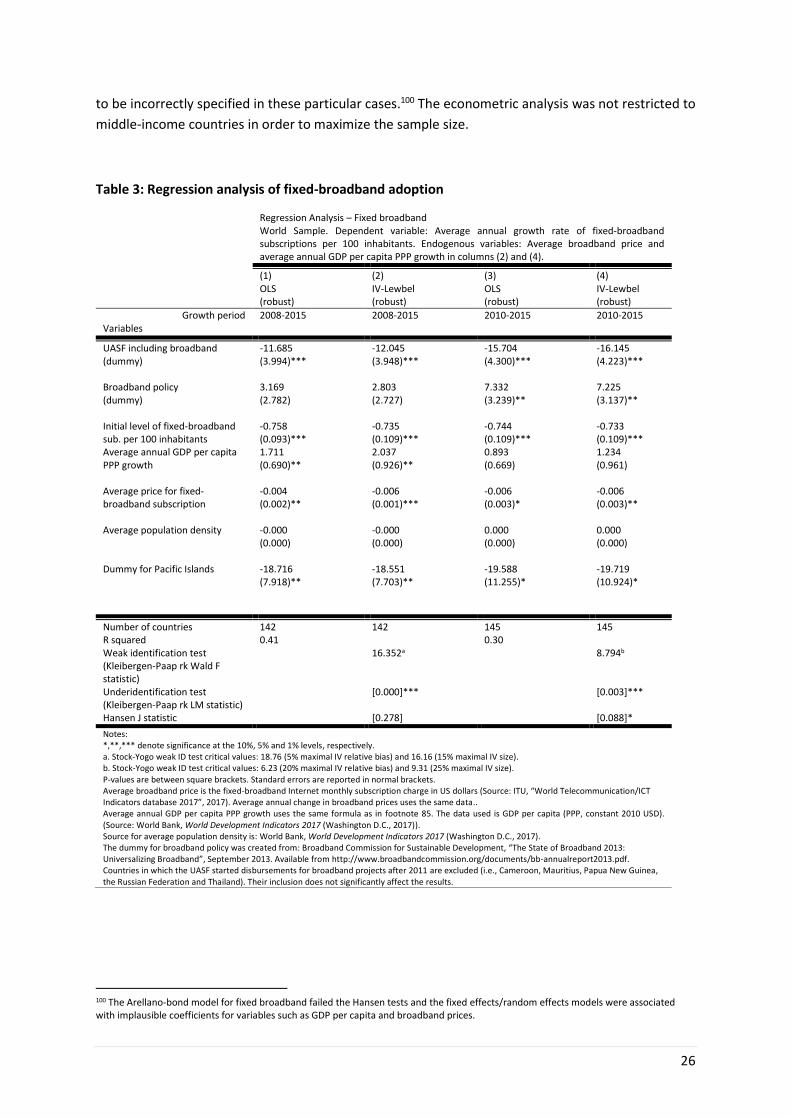
Table 3: Regression analysis of fixed-broadband adoption
Regression Analysis – Fixed broadband World Sample. Dependent variable: Average annual growth rate of fixed-broadband subscriptions per 100 inhabitants. Endogenous variables: Average broadband price and average annual GDP per capita PPP growth in columns (2) and (4).
(1) OLS (robust)
(2) IV-Lewbel (robust)
(3) OLS (robust)
(4) IV-Lewbel (robust)
Growth period Variables
2008-2015 2008-2015 2010-2015 2010-2015
UASF including broadband (dummy)
-11.685 (3.994)***
-12.045 (3.948)***
-15.704 (4.300)***
-16.145 (4.223)***
Broadband policy (dummy)
3.169 (2.782)
2.803 (2.727)
7.332 (3.239)**
7.225 (3.137)**
Initial level of fixed-broadband sub. per 100 inhabitants
-0.758 (0.093)***
-0.735 (0.109)***
-0.744 (0.109)***
-0.733 (0.109)***
Average annual GDP per capita PPP growth
1.711 (0.690)**
2.037 (0.926)**
0.893 (0.669)
1.234 (0.961)
Average price for fixed-broadband subscription
-0.004 (0.002)**
-0.006 (0.001)***
-0.006 (0.003)*
-0.006 (0.003)**
Average population density -0.000 (0.000)
-0.000 (0.000)
0.000 (0.000)
0.000 (0.000)
Dummy for Pacific Islands -18.716 (7.918)**
-18.551 (7.703)**
-19.588 (11.255)*
-19.719 (10.924)*
Number of countries 142 142 145 145 R squared 0.41 0.30 Weak identification test (Kleibergen-Paap rk Wald F statistic)
16.352a 8.794b
Underidentification test (Kleibergen-Paap rk LM statistic)
[0.000]*** [0.003]***
Hansen J statistic [0.278] [0.088]*
Notes: *,**,*** denote significance at the 10%, 5% and 1% levels, respectively. a. Stock-Yogo weak ID test critical values: 18.76 (5% maximal IV relative bias) and 16.16 (15% maximal IV size). b. Stock-Yogo weak ID test critical values: 6.23 (20% maximal IV relative bias) and 9.31 (25% maximal IV size). P-values are between square brackets. Standard errors are reported in normal brackets. Average broadband price is the fixed-broadband Internet monthly subscription charge in US dollars (Source: ITU, “World Telecommunication/ICT Indicators database 2017”, 2017). Average annual change in broadband prices uses the same data.. Average annual GDP per capita PPP growth uses the same formula as in footnote 85. The data used is GDP per capita (PPP, constant 2010 USD). (Source: World Bank, World Development Indicators 2017 (Washington D.C., 2017)). Source for average population density is: World Bank, World Development Indicators 2017 (Washington D.C., 2017). The dummy for broadband policy was created from: Broadband Commission for Sustainable Development, “The State of Broadband 2013: Universalizing Broadband”, September 2013. Available from http://www.broadbandcommission.org/documents/bb-annualreport2013.pdf. Countries in which the UASF started disbursements for broadband projects after 2011 are excluded (i.e., Cameroon, Mauritius, Papua New Guinea, the Russian Federation and Thailand). Their inclusion does not significantly affect the results.
100 The Arellano-bond model for fixed broadband failed the Hansen tests and the fixed effects/random effects models were associated with implausible coefficients for variables such as GDP per capita and broadband prices.
27
Table 4: Regression analysis of Internet users
Regression Analysis –Percentage of Internet users World Sample. Dependent variable: Average annual growth rate of Internet users per 100 inhabitants. Endogenous variables: Average broadband price in columns (2) and (4). GDP per capita, lagged dependent variable and institutional quality in column (6)
(1) OLS (robust)
(2) IV-Lewbel (robust)
(3) OLS (robust)
(4) IV-Lewbel (robust)
(5) Random effects (robust)
(6) Arellano-Bond (robust)
Growth period Variables
2008-2015 2008-2015 2010-2015 2010-2015 Level period Variables
2008-2015 2008-2015
UASF including Internet (dummy)
-1.409 (0.875)
-1.675 (0.931)**
-1.199 (1.089)
-0.686 (0.966)
UASF including Internet (dummy)
0.693 (1.590)
-0.103 (0.275)
Broadband policy (dummy)
0.739 (0.965)
0.888 (0.977)
2.292 (1.283)**
2.495 (1.308)**
Broadband policy (dummy)
15.760 (1.005)***
0.309 (0.285)
Average annual change in fixed-broadband prices
-0.061 (0.042)
-0.198 (0.080)**
-0.103 (0.059)*
-0.136 (0.057)**
Institutional quality
2.180 (1.748)
-0.252 (0.371)
Initial level of Internet users per 100 inhabitants
-5.914 (0.595)***
-5.119 (0.713)***
-6.964 (0.885)***
-5.569 (0.631)***
GDP per capita 0.001 (0.000)***
-0.000 (0.000)
Average population density
0.000 (0.000)
0.000 (0.000)
0.0002 (0.0001)**
0.0002 (0.0001)**
Average density
-0.001 (0.001)
0.0001 (0.000)***
Competition dummy (Internet service)
-1.048 (1.172)
-2.060 (1.295)
0.446 (1.212)
-1.133 (1.166)
Broadband price
-0.004 (0.001)***
-0.004 (0.002)***
Dummy for advanced economies
24.159 (3.527)***
-2.818 (0.624)***
Lagged dependent var.
1.041 (0.011)***
Number of countries 132 132 143 143 Number of observations
1207 1205
R squared 0.84 0.77 R squared
Betw:0.67 With:0.26
Weak identification test (Kleibergen-Paap rk Wald F statistic)
26.281a 14.799b Number of countries
171 171
Number of instruments
95
Underidentification test (Kleibergen-Paap rk LM statistic)
[0.022]** [0.009]*** Dummy for years
No Yes
Hansen J statistic [0.781] [0.162] Difference.-in-Hansen test GMM
[0.398]
Hansen test for overidentification
[0.141]
Notes: *,**,*** denote significance at the 10%, 5% and 1% levels respectively. a. Stock-Yogo weak ID test critical values: 18.37 (5% maximal IV relative bias) and 15.09 15% (maximal IV size). b. Stock-Yogo weak ID test critical values: 18.37 (5% maximal IV relative bias) and 15.09 15% (maximal IV size). P-values are between square brackets. Standard errors are reported in normal brackets. Average broadband price is the fixed-broadband sub-basket as a percentage of GNI per capita (Source: ITU’s Measuring the Information Society Reports from 2009 to 2016). Average annual GDP per capita PPP growth uses the same formula as in footnote 85. The data used is GDP per capita (PPP, constant 2010 USD). (Source: World Bank, World Development Indicators 2017 (Washington D.C., 2017)). Average population density is from: World Bank, World Development Indicators 2017 (Washington D.C., 2017). The dummy for broadband policy was created from: Broadband Commission for Sustainable Development, "The State of Broadband 2013: Universalizing Broadband", September 2013. Available from http://www.broadbandcommission.org/documents/bb-annualreport2013.pdf. Competition dummy for Internet services takes the value 1 if the country has a monopoly or is characterized by partial competition and 0 for full competition in 2010. Source: World Bank, The Little Data Book on Information Communication and Technology 2017 (Washington D.C., 2017). Available from http://data.worldbank.org/products/data-books/little-data-book-on-info-communication-tech. Institutional quality is the political stability and absence of violence indicators from: World Bank, “Worldwide Governance Indicators”, 2016. Available from http://data.worldbank.org/data-catalog/worldwide-governance-indicators. Countries in which the UASF started disbursements for broadband projects after 2011 are excluded (i.e., Ivory Coast and Zimbabwe) in columns (1) to (5). Their inclusion does not significantly affect the results.
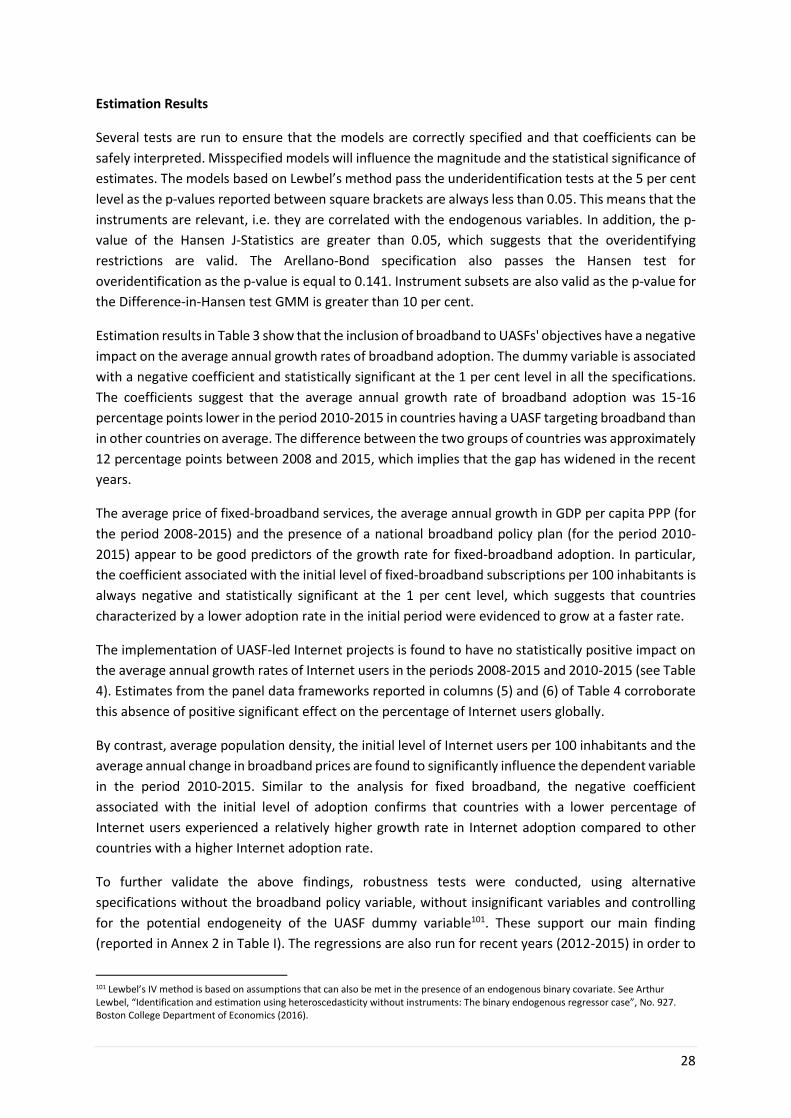
28
Estimation Results
Several tests are run to ensure that the models are correctly specified and that coefficients can be
safely interpreted. Misspecified models will influence the magnitude and the statistical significance of
estimates. The models based on Lewbel’s method pass the underidentification tests at the 5 per cent
level as the p-values reported between square brackets are always less than 0.05. This means that the
instruments are relevant, i.e. they are correlated with the endogenous variables. In addition, the p-
value of the Hansen J-Statistics are greater than 0.05, which suggests that the overidentifying
restrictions are valid. The Arellano-Bond specification also passes the Hansen test for
overidentification as the p-value is equal to 0.141. Instrument subsets are also valid as the p-value for
the Difference-in-Hansen test GMM is greater than 10 per cent.
Estimation results in Table 3 show that the inclusion of broadband to UASFs' objectives have a negative
impact on the average annual growth rates of broadband adoption. The dummy variable is associated
with a negative coefficient and statistically significant at the 1 per cent level in all the specifications.
The coefficients suggest that the average annual growth rate of broadband adoption was 15-16
percentage points lower in the period 2010-2015 in countries having a UASF targeting broadband than
in other countries on average. The difference between the two groups of countries was approximately
12 percentage points between 2008 and 2015, which implies that the gap has widened in the recent
years.
The average price of fixed-broadband services, the average annual growth in GDP per capita PPP (for
the period 2008-2015) and the presence of a national broadband policy plan (for the period 2010-
2015) appear to be good predictors of the growth rate for fixed-broadband adoption. In particular,
the coefficient associated with the initial level of fixed-broadband subscriptions per 100 inhabitants is
always negative and statistically significant at the 1 per cent level, which suggests that countries
characterized by a lower adoption rate in the initial period were evidenced to grow at a faster rate.
The implementation of UASF-led Internet projects is found to have no statistically positive impact on
the average annual growth rates of Internet users in the periods 2008-2015 and 2010-2015 (see Table
4). Estimates from the panel data frameworks reported in columns (5) and (6) of Table 4 corroborate
this absence of positive significant effect on the percentage of Internet users globally.
By contrast, average population density, the initial level of Internet users per 100 inhabitants and the
average annual change in broadband prices are found to significantly influence the dependent variable
in the period 2010-2015. Similar to the analysis for fixed broadband, the negative coefficient
associated with the initial level of adoption confirms that countries with a lower percentage of
Internet users experienced a relatively higher growth rate in Internet adoption compared to other
countries with a higher Internet adoption rate.
To further validate the above findings, robustness tests were conducted, using alternative
specifications without the broadband policy variable, without insignificant variables and controlling
for the potential endogeneity of the UASF dummy variable101. These support our main finding
(reported in Annex 2 in Table I). The regressions are also run for recent years (2012-2015) in order to
101 Lewbel’s IV method is based on assumptions that can also be met in the presence of an endogenous binary covariate. See Arthur Lewbel, “Identification and estimation using heteroscedasticity without instruments: The binary endogenous regressor case”, No. 927. Boston College Department of Economics (2016).
29
check the robustness of the results obtained in Tables 3 and 4. The size of the coefficient associated
with the UASF dummy and its statistical significance remain stable.
Another concern could be the fact that UASFs targeting broadband/the Internet are only adopted by
countries facing similar specific barriers to broadband adoption. In other words, the dummy for UASF
could be a proxy for challenging geographic natural features or poor institutional quality (spurious
effect). We applied a maximum likelihood model to test for this potential problem. The estimates
obtained from maximum likelihood models are reported in Annex 2 (Table II) and provide evidence
against this concern. Countries characterized by a better institutional quality were more likely to have
a UASF targeting broadband in 2010. Moreover, terrain ruggedness and the distance from the nearest
coast do not appear to influence the likelihood of adopting a UASF targeting broadband/the Internet.
In addition, the concern that UASFs targeting broadband mostly impact mobile broadband instead of
fixed broadband is also addressed. The UASF dummy remains statistically significant and associated
with a negative coefficient when the growth rate of mobile broadband is included in the fixed-
broadband models as a covariate (see Table III in Annex 2).102 Running the regressions for the average
annual growth rate of mobile-broadband subscriptions per 100 inhabitants also show that the UASF
variable is systematically insignificant and also has a negative coefficient (see Table IV in Annex 2).
Interestingly, Table III also demonstrates an interesting feature on mobile and fixed broadband
subscriptions. Despite the concern that fixed broadband subscription growth might be negatively
affected by mobile broadband growth, the analysis shows no statistical significance and a slightly
positive coefficient associated with the growth variable is systematically found.
102 The growth periods examined start in 2010 due to limited number of countries for which data on mobile broadband is available prior to 2010.
30
7. Detailed Analysis at Different Phases of Broadband and Internet
Development
The broadband and Internet growth patterns show a different picture when these technologies are
first introduced and when the markets mature. Would it be possible that UASFs are more effective in
the inception phase, but over a longer period of time, the effect becomes indiscernible? To answer
these questions, this section presents more granular analyses at different phases of broadband and
Internet development and market maturity.
Since many middle-income countries introduced broadband infrastructure after 2005, the growth
rates of fixed broadband adoption were analysed at three-year intervals of 2007-2009, 2010-2012 and
2013-2015 (see Figure 6).103
Figure 6: Average annual growth rates of fixed-broadband subscriptions per 100 inhabitants in middle-income countries, by three-year intervals104
Source: ESCAP, based on ITU, “World Telecommunication/ICT Indicators Database 2016”, 2016.
103 One may also argue that the projects implemented in Indonesia were unlikely to affect the growth rates of fixed broadband adoption. However, withdrawing Indonesia from the sample does not substantially affect the gap between countries with a UASF targeting broadband and other countries (see Figure III in Annex II). 104 Countries assigned to the “with UASF” category for each subperiod depend on the year of the first broadband project financed by the UASF.
34.10
16.62 16.37
10.5712.67
3.11
010
20
30
40
Av
erag
e A
nn
ual
Gro
wth
Rat
es (
%)
2007/2009 2010/2012 2013/2015
ESCAP
26.53
13.9615.46
4.78
9.97
4.09
05
10
15
20
25
Av
erag
e A
nn
ual
Gro
wth
Rat
es (
%)
2007/2009 2010/2012 2013/2015
World
Without UASF With UASF
31
Generally, both regional and global results show faster growth between 2007 and 2009, followed by
a gradual slowing down towards 2015. Even at these three-year intervals, it is clear that countries
without UASFs outperformed those with UASFs in terms of broadband adoption.
It is interesting to note that the gap between countries without and with UASFs has widened over
time in the Asia-Pacific region. In the period 2007-2009, the average annual growth rate of broadband
adoption experienced by countries without a UASF was 34.10 per cent—that is about double the
growth rate of countries with a UASF (16.62 per cent). However, in the period 2013-2015, the average
annual growth rate of countries without a UASF was 12.67 per cent—approximately four times the
growth rate of countries with a UASF (3.11 per cent). This trend is also observable globally, albeit at
different rates.
Additionally, results show significant disparities between countries in the Asia-Pacific region. Only
Mongolia and Pakistan had average annual growth rates higher than the average for countries without
a UASF in at least one of the three periods. Moreover, Mongolia is the only country in the group to
have experienced a double-digit growth over all the three periods (see Table 5).
Table 5: Average annual growth rates of fixed-broadband subscriptions per 100 inhabitants in selected countries, by three-year intervals
Country 2007/2009 2010/2012 2013/2015
India 29.32 9.48 3.43
Indonesia 28.16 8.11 -5.94
Malaysia 12.34 9.92 0.36
Mongolia 55.36 11.03 12.30
Pakistan 70.78 20.63 2.14
Turkey 9.35 2.59 1.44
Source: ESCAP, based on ITU, “World Telecommunication/ICT Indicators Database 2016”, 2016.
Yet, the high average annual growth rates exhibited by Mongolia and Pakistan in 2007-2009 seem not
to have been induced by their UASFs. The first large-scale broadband project facilitated by the
Pakistani USF officially started in 2009 (see Table 1). Similarly, the Mongolian USOF is classified as
having only a moderate level of activity by ITU105 and the fund mainly supported pilot projects before
2011. Hence, the real influence of the Mongolian and Pakistani UASFs on the growth of broadband
penetration rates is debatable for the period 2007-2009. This high growth may be attributable to the
low levels of fixed-broadband subscriptions per 100 inhabitants both countries shown in 2007 (0.28
for Mongolia and 0.03 for Pakistan).
Furthermore, the influence of the UASF on the rapid rise in fixed-broadband subscriptions in Mongolia
for the period 2010-2015 remains unclear. To a large extent, the high growth exhibited by Mongolia
over the period 2007-2015, relative to the five other countries in Table 5, is likely due to investments
in the fibre-optic infrastructure by the Information Communication Network Company, the state-
105 ITU, "Universal Service Fund and Digital Inclusion for All Study", June 2013. Available from https://www.itu.int/en/ITU-D/Conferences/GSR/Documents/ITU%20USF%20Final%20Report.pdf.
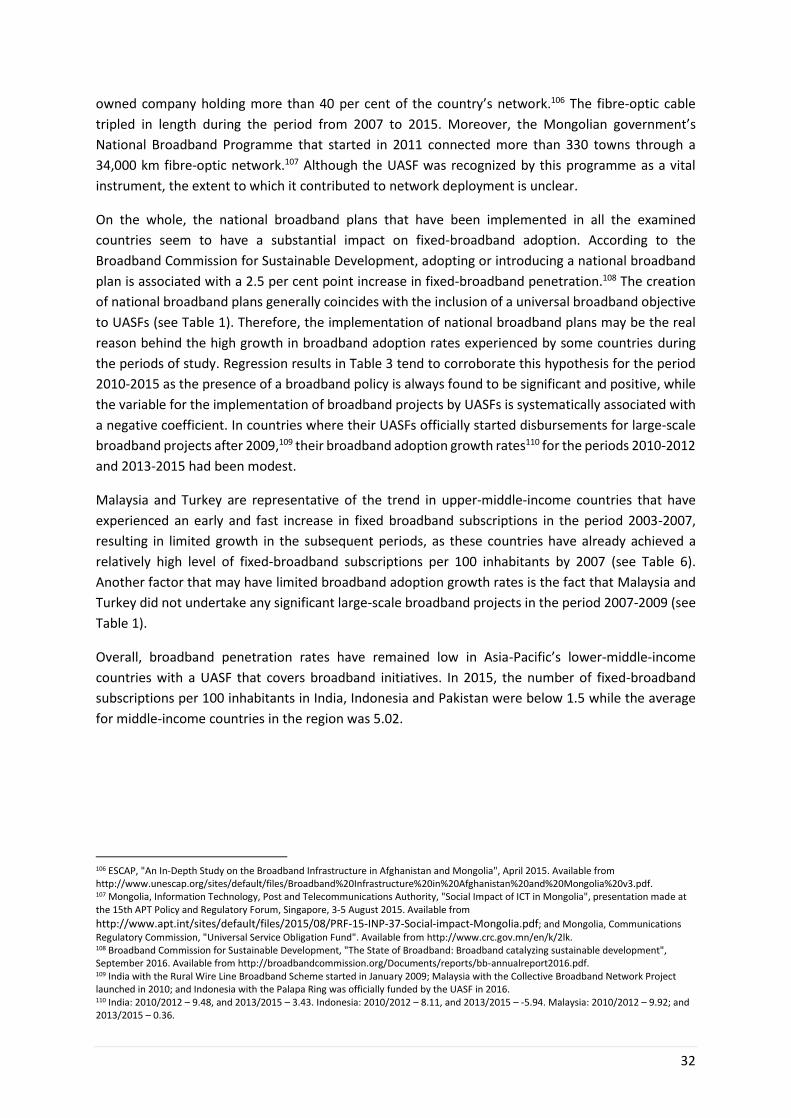
32
owned company holding more than 40 per cent of the country’s network.106 The fibre-optic cable
tripled in length during the period from 2007 to 2015. Moreover, the Mongolian government’s
National Broadband Programme that started in 2011 connected more than 330 towns through a
34,000 km fibre-optic network.107 Although the UASF was recognized by this programme as a vital
instrument, the extent to which it contributed to network deployment is unclear.
On the whole, the national broadband plans that have been implemented in all the examined
countries seem to have a substantial impact on fixed-broadband adoption. According to the
Broadband Commission for Sustainable Development, adopting or introducing a national broadband
plan is associated with a 2.5 per cent point increase in fixed-broadband penetration.108 The creation
of national broadband plans generally coincides with the inclusion of a universal broadband objective
to UASFs (see Table 1). Therefore, the implementation of national broadband plans may be the real
reason behind the high growth in broadband adoption rates experienced by some countries during
the periods of study. Regression results in Table 3 tend to corroborate this hypothesis for the period
2010-2015 as the presence of a broadband policy is always found to be significant and positive, while
the variable for the implementation of broadband projects by UASFs is systematically associated with
a negative coefficient. In countries where their UASFs officially started disbursements for large-scale
broadband projects after 2009,109 their broadband adoption growth rates110 for the periods 2010-2012
and 2013-2015 had been modest.
Malaysia and Turkey are representative of the trend in upper-middle-income countries that have
experienced an early and fast increase in fixed broadband subscriptions in the period 2003-2007,
resulting in limited growth in the subsequent periods, as these countries have already achieved a
relatively high level of fixed-broadband subscriptions per 100 inhabitants by 2007 (see Table 6).
Another factor that may have limited broadband adoption growth rates is the fact that Malaysia and
Turkey did not undertake any significant large-scale broadband projects in the period 2007-2009 (see
Table 1).
Overall, broadband penetration rates have remained low in Asia-Pacific’s lower-middle-income
countries with a UASF that covers broadband initiatives. In 2015, the number of fixed-broadband
subscriptions per 100 inhabitants in India, Indonesia and Pakistan were below 1.5 while the average
for middle-income countries in the region was 5.02.
106 ESCAP, "An In-Depth Study on the Broadband Infrastructure in Afghanistan and Mongolia", April 2015. Available from http://www.unescap.org/sites/default/files/Broadband%20Infrastructure%20in%20Afghanistan%20and%20Mongolia%20v3.pdf. 107 Mongolia, Information Technology, Post and Telecommunications Authority, "Social Impact of ICT in Mongolia", presentation made at the 15th APT Policy and Regulatory Forum, Singapore, 3-5 August 2015. Available from
http://www.apt.int/sites/default/files/2015/08/PRF-15-INP-37-Social-impact-Mongolia.pdf; and Mongolia, Communications Regulatory Commission, "Universal Service Obligation Fund". Available from http://www.crc.gov.mn/en/k/2lk. 108 Broadband Commission for Sustainable Development, "The State of Broadband: Broadband catalyzing sustainable development", September 2016. Available from http://broadbandcommission.org/Documents/reports/bb-annualreport2016.pdf. 109 India with the Rural Wire Line Broadband Scheme started in January 2009; Malaysia with the Collective Broadband Network Project launched in 2010; and Indonesia with the Palapa Ring was officially funded by the UASF in 2016. 110 India: 2010/2012 – 9.48, and 2013/2015 – 3.43. Indonesia: 2010/2012 – 8.11, and 2013/2015 – -5.94. Malaysia: 2010/2012 – 9.92; and 2013/2015 – 0.36.
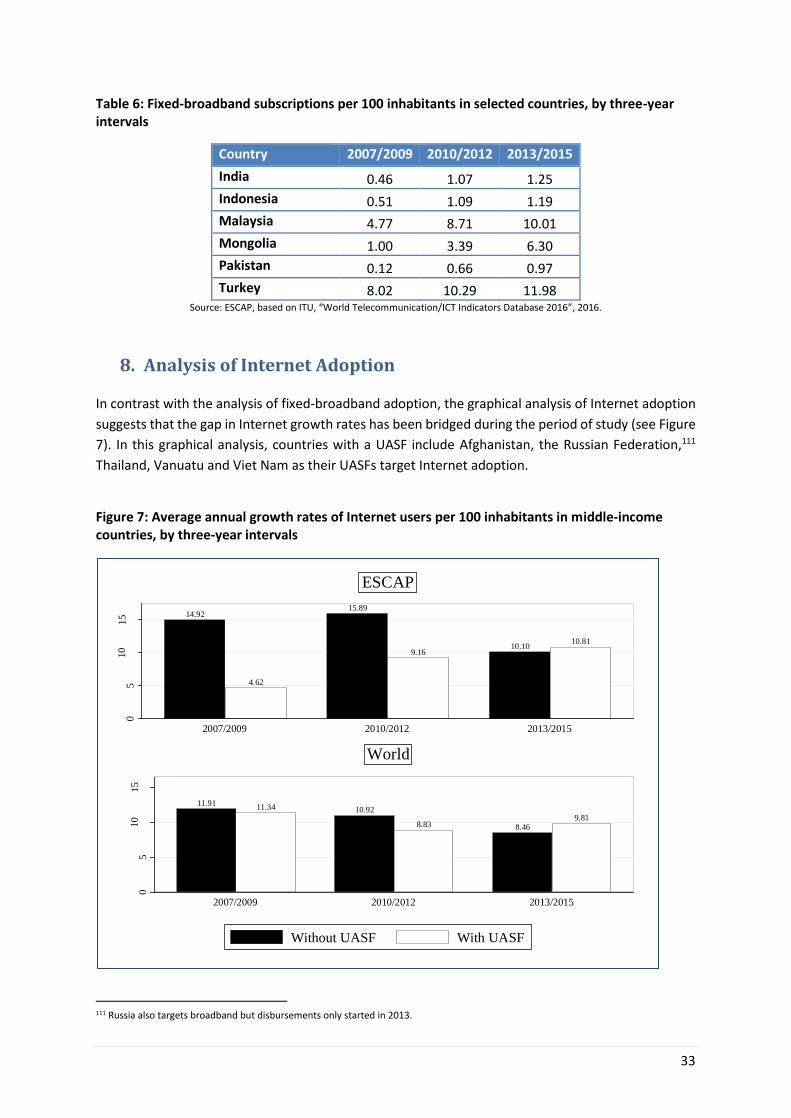
33
Table 6: Fixed-broadband subscriptions per 100 inhabitants in selected countries, by three-year intervals
Country 2007/2009 2010/2012 2013/2015
India 0.46 1.07 1.25
Indonesia 0.51 1.09 1.19
Malaysia 4.77 8.71 10.01
Mongolia 1.00 3.39 6.30
Pakistan 0.12 0.66 0.97
Turkey 8.02 10.29 11.98 Source: ESCAP, based on ITU, “World Telecommunication/ICT Indicators Database 2016”, 2016.
8. Analysis of Internet Adoption
In contrast with the analysis of fixed-broadband adoption, the graphical analysis of Internet adoption
suggests that the gap in Internet growth rates has been bridged during the period of study (see Figure
7). In this graphical analysis, countries with a UASF include Afghanistan, the Russian Federation,111
Thailand, Vanuatu and Viet Nam as their UASFs target Internet adoption.
Figure 7: Average annual growth rates of Internet users per 100 inhabitants in middle-income countries, by three-year intervals
111 Russia also targets broadband but disbursements only started in 2013.
14.92
4.62
15.89
9.1610.10
10.81
05
10
15
2007/2009 2010/2012 2013/2015
ESCAP
11.9111.34 10.92
8.83 8.469.81
05
10
15
Aver
age
ann
ual
gro
wth
rat
e (%
), I
nte
rnet
use
rs p
er 1
00 i
nh
abit
ants
2007/2009 2010/2012 2013/2015
World
Without UASF With UASF
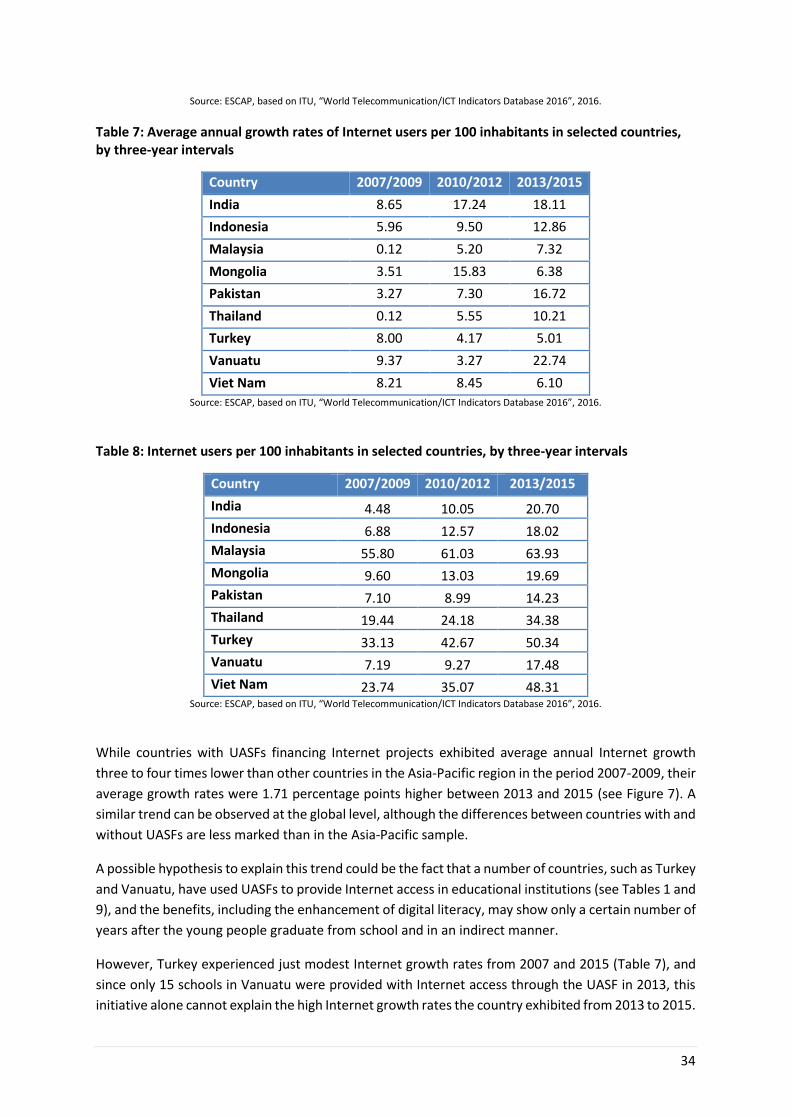
34
Source: ESCAP, based on ITU, “World Telecommunication/ICT Indicators Database 2016”, 2016.
Table 7: Average annual growth rates of Internet users per 100 inhabitants in selected countries, by three-year intervals
Country 2007/2009 2010/2012 2013/2015
India 8.65 17.24 18.11
Indonesia 5.96 9.50 12.86
Malaysia 0.12 5.20 7.32
Mongolia 3.51 15.83 6.38
Pakistan 3.27 7.30 16.72
Thailand 0.12 5.55 10.21
Turkey 8.00 4.17 5.01
Vanuatu 9.37 3.27 22.74
Viet Nam 8.21 8.45 6.10
Source: ESCAP, based on ITU, “World Telecommunication/ICT Indicators Database 2016”, 2016.
Table 8: Internet users per 100 inhabitants in selected countries, by three-year intervals
Country 2007/2009 2010/2012 2013/2015
India 4.48 10.05 20.70
Indonesia 6.88 12.57 18.02
Malaysia 55.80 61.03 63.93
Mongolia 9.60 13.03 19.69
Pakistan 7.10 8.99 14.23
Thailand 19.44 24.18 34.38
Turkey 33.13 42.67 50.34
Vanuatu 7.19 9.27 17.48
Viet Nam 23.74 35.07 48.31 Source: ESCAP, based on ITU, “World Telecommunication/ICT Indicators Database 2016”, 2016.
While countries with UASFs financing Internet projects exhibited average annual Internet growth
three to four times lower than other countries in the Asia-Pacific region in the period 2007-2009, their
average growth rates were 1.71 percentage points higher between 2013 and 2015 (see Figure 7). A
similar trend can be observed at the global level, although the differences between countries with and
without UASFs are less marked than in the Asia-Pacific sample.
A possible hypothesis to explain this trend could be the fact that a number of countries, such as Turkey
and Vanuatu, have used UASFs to provide Internet access in educational institutions (see Tables 1 and
9), and the benefits, including the enhancement of digital literacy, may show only a certain number of
years after the young people graduate from school and in an indirect manner.
However, Turkey experienced just modest Internet growth rates from 2007 and 2015 (Table 7), and
since only 15 schools in Vanuatu were provided with Internet access through the UASF in 2013, this
initiative alone cannot explain the high Internet growth rates the country exhibited from 2013 to 2015.
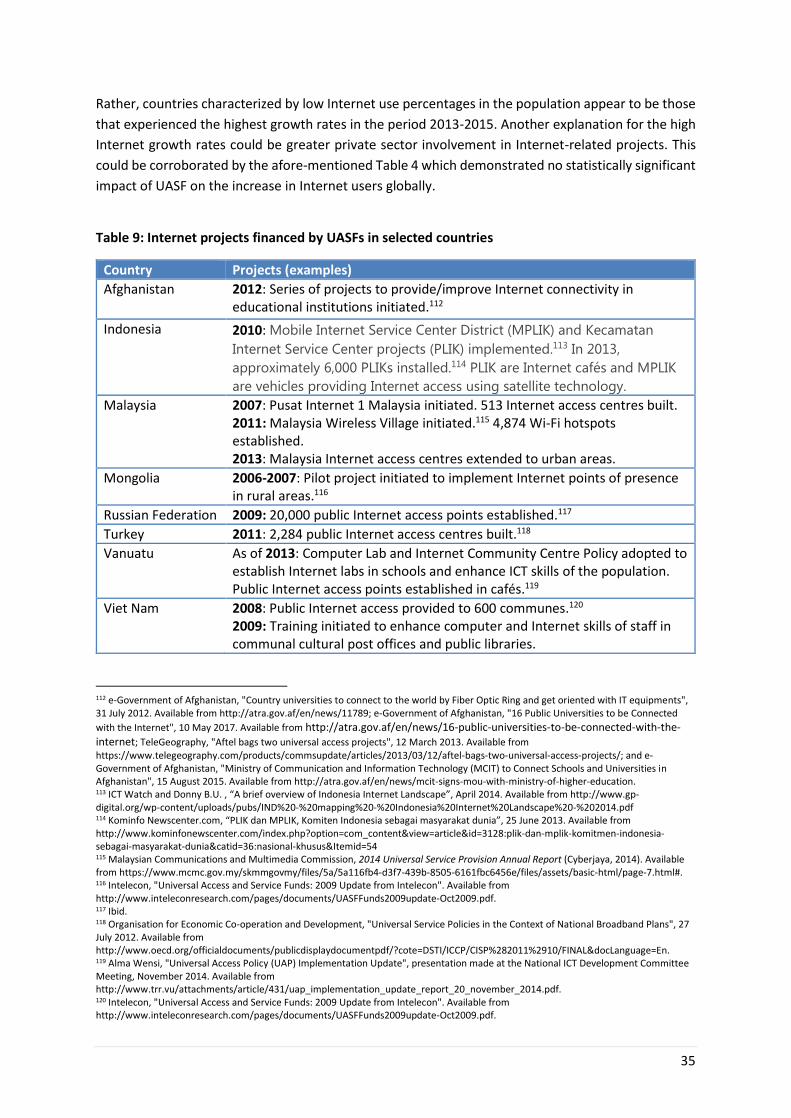
35
Rather, countries characterized by low Internet use percentages in the population appear to be those
that experienced the highest growth rates in the period 2013-2015. Another explanation for the high
Internet growth rates could be greater private sector involvement in Internet-related projects. This
could be corroborated by the afore-mentioned Table 4 which demonstrated no statistically significant
impact of UASF on the increase in Internet users globally.
Table 9: Internet projects financed by UASFs in selected countries
Country Projects (examples)
Afghanistan 2012: Series of projects to provide/improve Internet connectivity in educational institutions initiated.112
Indonesia 2010: Mobile Internet Service Center District (MPLIK) and Kecamatan
Internet Service Center projects (PLIK) implemented.113 In 2013,
approximately 6,000 PLIKs installed.114 PLIK are Internet cafés and MPLIK
are vehicles providing Internet access using satellite technology.
Malaysia 2007: Pusat Internet 1 Malaysia initiated. 513 Internet access centres built. 2011: Malaysia Wireless Village initiated.115 4,874 Wi-Fi hotspots established. 2013: Malaysia Internet access centres extended to urban areas.
Mongolia 2006-2007: Pilot project initiated to implement Internet points of presence in rural areas.116
Russian Federation 2009: 20,000 public Internet access points established.117
Turkey 2011: 2,284 public Internet access centres built.118
Vanuatu As of 2013: Computer Lab and Internet Community Centre Policy adopted to establish Internet labs in schools and enhance ICT skills of the population. Public Internet access points established in cafés.119
Viet Nam 2008: Public Internet access provided to 600 communes.120 2009: Training initiated to enhance computer and Internet skills of staff in communal cultural post offices and public libraries.
112 e-Government of Afghanistan, "Country universities to connect to the world by Fiber Optic Ring and get oriented with IT equipments", 31 July 2012. Available from http://atra.gov.af/en/news/11789; e-Government of Afghanistan, "16 Public Universities to be Connected
with the Internet", 10 May 2017. Available from http://atra.gov.af/en/news/16-public-universities-to-be-connected-with-the-internet; TeleGeography, "Aftel bags two universal access projects", 12 March 2013. Available from https://www.telegeography.com/products/commsupdate/articles/2013/03/12/aftel-bags-two-universal-access-projects/; and e-Government of Afghanistan, "Ministry of Communication and Information Technology (MCIT) to Connect Schools and Universities in Afghanistan", 15 August 2015. Available from http://atra.gov.af/en/news/mcit-signs-mou-with-ministry-of-higher-education. 113 ICT Watch and Donny B.U. , “A brief overview of Indonesia Internet Landscape”, April 2014. Available from http://www.gp-digital.org/wp-content/uploads/pubs/IND%20-%20mapping%20-%20Indonesia%20Internet%20Landscape%20-%202014.pdf 114 Kominfo Newscenter.com, “PLIK dan MPLIK, Komiten Indonesia sebagai masyarakat dunia”, 25 June 2013. Available from http://www.kominfonewscenter.com/index.php?option=com_content&view=article&id=3128:plik-dan-mplik-komitmen-indonesia-sebagai-masyarakat-dunia&catid=36:nasional-khusus&Itemid=54 115 Malaysian Communications and Multimedia Commission, 2014 Universal Service Provision Annual Report (Cyberjaya, 2014). Available from https://www.mcmc.gov.my/skmmgovmy/files/5a/5a116fb4-d3f7-439b-8505-6161fbc6456e/files/assets/basic-html/page-7.html#. 116 Intelecon, "Universal Access and Service Funds: 2009 Update from Intelecon". Available from http://www.inteleconresearch.com/pages/documents/UASFFunds2009update-Oct2009.pdf. 117 Ibid. 118 Organisation for Economic Co-operation and Development, "Universal Service Policies in the Context of National Broadband Plans", 27 July 2012. Available from http://www.oecd.org/officialdocuments/publicdisplaydocumentpdf/?cote=DSTI/ICCP/CISP%282011%2910/FINAL&docLanguage=En. 119 Alma Wensi, "Universal Access Policy (UAP) Implementation Update", presentation made at the National ICT Development Committee Meeting, November 2014. Available from http://www.trr.vu/attachments/article/431/uap_implementation_update_report_20_november_2014.pdf. 120 Intelecon, "Universal Access and Service Funds: 2009 Update from Intelecon". Available from http://www.inteleconresearch.com/pages/documents/UASFFunds2009update-Oct2009.pdf.
36
Statistical evidence from both the Asia-Pacific region and at the global level suggests that, on average,
allowing the use of funds for broadband and Internet projects in a UASF framework has not led to any
major results in terms of broadband and Internet adoption rates at the country level. The next section
provides anecdotal evidence of the challenges of employing UASFs as a financing mechanism for
expanding broadband and Internet connectivity.
9. Challenges in Implementing UASFs
9.1 Disbursement and Time Lag Challenges
Existing literature suggests that the disbursement rate of UASFs has generally been low.121 In India,
the year-to-year disbursement rate has been below 20 per cent since 2006, In Malaysia, it has also
been below 20 per cent since 2008, and in Pakistan, below 10 per cent since 2010.122 These low
disbursement rates have resulted in the suspension of some UASFs. For example, the Indonesian UASF
was temporarily halted in 2015 due to the low disbursement rate.123 Only a small fraction of disbursed
funds seems to go to broadband projects. For example, less than 25 per cent of the funds spent by
Pakistan’s UASF have gone to broadband projects so far. The same is true for Malaysia.124
Even when UASFs have policies that specifically target broadband projects, it may take several years
before the funds are allocated to broadband projects. In the case of Indonesia, despite several
statements made by local authorities since 2010, UASF’s subsidy for the Palapa Ring remained unclear
until 2016. In India, it took three years before its USOF disbursed funds for the first broadband project
after the USOF officially included broadband as an objective.
Another related challenge experienced in some countries is the misalignment between the fund
objectives and their actual implementation. For example, in 2015 the Communications Ministry of the
Russian Federation pointed out that the UASF spent too much financial resources dealing with budget
problems, while these funds should be primarily used to subsidize fibre-optic infrastructure in rural
areas.125
The lack of monitoring tools and mechanisms could lead to the non-compliance of implementing
operators with their obligations. For example, the operator in charge of implementing the Rural Wire
Line Broadband Scheme in India failed to pass down to eligible customers the rebate provided by the
121 GSMA, "Survey of Universal Service Funds: Key Findings", April 2013, http://www.gsma.com/publicpolicy/wp-content/uploads/2013/04/GSMA-USF-Key-findings-final.pdf. 122 Rohan Samarajiva, "Performance of universal service funds: India, Malaysia & Pakistan", 2016. Available from http://www.iicom.org/images/iic/events/annual-conference/2016/Speaker-Presentations/Day-1-Breakout-A1-Rohan-Samajiva-
LIRNEasia.pdf. The formula for the year-to-year disbursement rate is: 𝐷𝑖𝑠𝑏𝑢𝑟𝑠𝑚𝑒𝑛𝑡 𝑜𝑓 𝑓𝑢𝑛𝑑𝑠𝑡
𝐼𝑛𝑓𝑙𝑜𝑤 𝑜𝑓 𝑓𝑢𝑛𝑑𝑠𝑡−1× 100.
123 IndoTelko, "Indonesia Suspend USO Program", 11 March 2015. Available from http://www.indotelko.com/kanal?c=ev&it=indonesia-suspend-uso-program; and Antonia Timmerman, "Indonesia to use USO fund for startups", DealStreetAsia, 8 November 2016. Available from https://www.dealstreetasia.com/stories/indonesia-to-use-uso-fund-for-startups-57591/. 124 Rohan Samarajiva, "Performance of universal service funds: India, Malaysia & Pakistan", 2016. Available from http://www.iicom.org/images/iic/events/annual-conference/2016/Speaker-Presentations/Day-1-Breakout-A1-Rohan-Samajiva-LIRNEasia.pdf. 125 Yekaterina Yezhova, "Focus: Russian ministry unhappy with use of universal services fund for other ends", Prime Business News Agency, 10 March 2015. Available from http://www.1prime.biz/news/0/%7BB06A0D33-F760-44C3-9D2B-BCB934BEAF8F%7D.uif.
37
USOF, according to an official report published on the Indian USOF’s website. Furthermore, the
implementing operator claimed subsidies for disconnected lines.126
9.2 Structural and Operational Challenges
A lack of capacity may have hampered UASFs’ effectiveness. For example in Indonesia, a UASF-led
project was negatively affected by the short length of the maintenance contract. The one-year
maintenance contract was not sufficient to develop the required skills at the local level to maintain
and support the project.127
Structural challenges include unfavorable local conditions. Geographical obstacles and security
concerns may negatively impact the deployment of ICT infrastructure subsidized by UASFs in some
countries. Pakistan has been noted to face these structural challenges.128
The low rate of fund disbursement can often be attributed to the lack of clarity in the legal
environment in which UASFs operate. Legal disputes on the extent to which contributions are levied
and the way the funds are managed have occurred between public agencies in charge of UASFs and
the telecom operators in a number of countries. In some cases, conflict arises among the different
public agencies.129 For example, GSMA reports that one of the main challenges faced by the
Indonesian UASF was a dispute between the Treasury Ministry and the telecom regulatory institution
on the allocation and use of the funds.130 The lack of clarity on UASFs’ management and operations,
as well as the lack of fund autonomy have frequently contributed to these kinds of disputes.131
9.3 Additional Considerations
In addition to the challenges highlighted above, it should be noted that the examined UASFs are mostly
designed to accelerate deployment in rural and remote areas. This is probably the fundamental reason
why UASFs have not led to any sizeable gains in terms of fixed-broadband subscriptions per 100
inhabitants. For countries characterized by a low Internet adoption rate overall, broadband is not
widely deployed in urban areas either. This renders the UASF’s mission less justifiable in rural areas,
as the priority is to first sufficiently deploy broadband at the national scale and connect areas where
the economic returns induced by broadband adoption are the highest.
On the other hand, for countries characterized by a higher broadband/Internet adoption rate, it may
be more difficult to achieve significant gains at the national level as the fraction of unserved people
may be located in very sparsely populated areas. In other words, a large broadband project initiated
by the UASF may lead to very small gains in overall fixed-broadband subscriptions rate at the country
126 India, Ministry of Communication & Information Technology, "Universal Service Obligation Fund Reports". Available from http://www.usof.gov.in/usof-cms/Report.jsp. 127 GSMA, "Survey of Universal Service Funds: Key Findings", April 2013, http://www.gsma.com/publicpolicy/wp-content/uploads/2013/04/GSMA-USF-Key-findings-final.pdf. 128 Ibid. 129 Alliance for Affordable Internet, "Universal Access and Service Funds in the Broadband Era: The Collective Investment Imperative", May 2015. Available from http://a4ai.org/wp-content/uploads/2015/06/A4AI-USAF_06.2015_FINAL.pdf. 130 GSMA, "Survey of Universal Service Funds: Key Findings", April 2013, http://www.gsma.com/publicpolicy/wp-content/uploads/2013/04/GSMA-USF-Key-findings-final.pdf. 131 Alliance for Affordable Internet, "Universal Access and Service Funds in the Broadband Era: The Collective Investment Imperative", May 2015. Available from http://a4ai.org/wp-content/uploads/2015/06/A4AI-USAF_06.2015_FINAL.pdf.
38
scale. This also questions the effectiveness of focusing on subsidizing ‘fixed-broadband’ through
UASFs, compared to other technologies such as mobile-broadband and WIFI.
Overall, a small portion of UASFs in the region have incorporated broadband and Internet access. The
number of large-scale broadband/Internet projects implemented by these UASFs has remained
limited. Any significant progress in terms of broadband/Internet adoption appears to be rather a result
of private initiatives and/or other factors such as national broadband plans without any substantial
contributions from UASFs.
10. Other Perspectives
Some telecom operators have expressed concerns about the way UASFs are implemented and argue
that alternative systems are preferable.132 For example, under the “Pay or Play” regime, the operator
has the option to provide services to non-profitable area/population in lieu of paying the levy. Such
an approach has been implemented in Vanuatu.133 Besides, just giving poor populations’ access to
telecom services will not be sufficient unless monthly price subsidies are provided, as some
households are not able to afford access otherwise.134
Furthermore, it is often argued in the literature that technologies deployed in UASF-led projects
should not be chosen by the public authorities as it may lead to suboptimal investments, especially in
a sector prone to dramatic and rapid technological changes.135 For example, a study reports that in
remote areas, satellite technology and fixed lines were initially used for subsidized public phones
projects, while nowadays these areas are covered by mobile services available at a reasonable price,
some of which are unsubsidized initiatives from the private sector.136 Therefore, some policy papers
argue that operators should be free to choose the best technology to provide connectivity to the
targeted population.137
11. Good Examples from Asia and the Pacific
An often cited good example of successful UASFs is Pakistan’s USF, which was created in 2006. An
independent state company operates the fund, whose objective is to ensure universal access to
telecommunication services. The USF collects a 1.5 per cent levy from the telecom operators.
Two years following its creation, the fund initiated disbursements for broadband projects. In 2009,
the USF started a series of large-scale projects to provide broadband connectivity in the unserved
areas of Pakistan. They included installing 900km of fibre-optic cable in the Balochistan province that
132 InfoDev and ITU, "ICT Regulation Toolkit: 4.3.5 Other Approaches and Initiatives Promoting UAS". Available from http://ictregulationtoolkit.org/toolkit/4.3.5. 133 TRR, “Universal Access Policy”, 2014. Available from http://www.trr.vu/index.php/en/telecom-industry/universal-access/universal-access-policy 134 George R.G. Clarke and Scott J. Wallsten, “Universal(ly Bad) Service: Providing Infrastructure Services to Rural and Poor Urban Consumers”, World Bank Policy Research Working Paper, 2868, July 2002. 135 See Stephen L. Magiera, "Managing Universal Service Funds for Telecommunications: An ASEAN Manual for Output-Based Aid", United States Agency for International Development, September 2009. Available from http://pdf.usaid.gov/pdf_docs/pnaeb219.pdf. 136 Ibid. 137 See InfoDev and ITU, "ICT Regulation Toolkit: 4.8 Technologies for Universal Access and Service". Available from http://ictregulationtoolkit.org/toolkit/4.8.
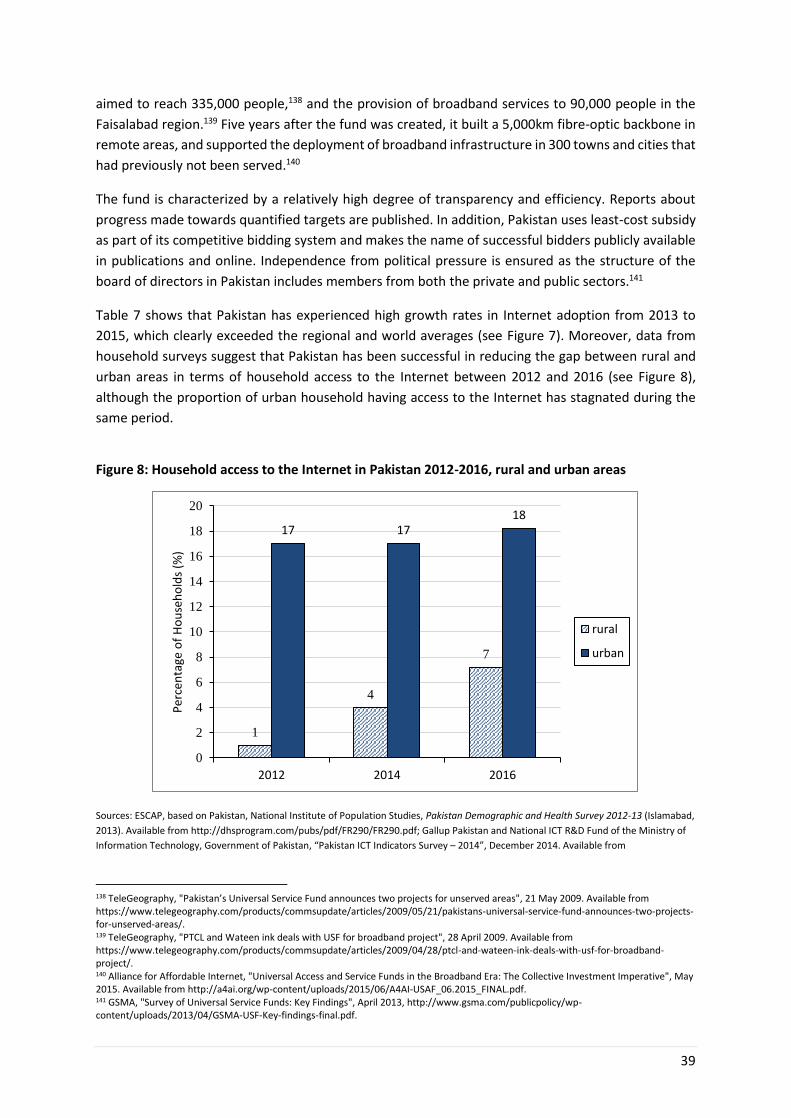
39
aimed to reach 335,000 people,138 and the provision of broadband services to 90,000 people in the
Faisalabad region.139 Five years after the fund was created, it built a 5,000km fibre-optic backbone in
remote areas, and supported the deployment of broadband infrastructure in 300 towns and cities that
had previously not been served.140
The fund is characterized by a relatively high degree of transparency and efficiency. Reports about
progress made towards quantified targets are published. In addition, Pakistan uses least-cost subsidy
as part of its competitive bidding system and makes the name of successful bidders publicly available
in publications and online. Independence from political pressure is ensured as the structure of the
board of directors in Pakistan includes members from both the private and public sectors.141
Table 7 shows that Pakistan has experienced high growth rates in Internet adoption from 2013 to
2015, which clearly exceeded the regional and world averages (see Figure 7). Moreover, data from
household surveys suggest that Pakistan has been successful in reducing the gap between rural and
urban areas in terms of household access to the Internet between 2012 and 2016 (see Figure 8),
although the proportion of urban household having access to the Internet has stagnated during the
same period.
Figure 8: Household access to the Internet in Pakistan 2012-2016, rural and urban areas
Sources: ESCAP, based on Pakistan, National Institute of Population Studies, Pakistan Demographic and Health Survey 2012-13 (Islamabad,
2013). Available from http://dhsprogram.com/pubs/pdf/FR290/FR290.pdf; Gallup Pakistan and National ICT R&D Fund of the Ministry of
Information Technology, Government of Pakistan, “Pakistan ICT Indicators Survey – 2014”, December 2014. Available from
138 TeleGeography, "Pakistan’s Universal Service Fund announces two projects for unserved areas", 21 May 2009. Available from https://www.telegeography.com/products/commsupdate/articles/2009/05/21/pakistans-universal-service-fund-announces-two-projects-for-unserved-areas/. 139 TeleGeography, "PTCL and Wateen ink deals with USF for broadband project", 28 April 2009. Available from https://www.telegeography.com/products/commsupdate/articles/2009/04/28/ptcl-and-wateen-ink-deals-with-usf-for-broadband-project/. 140 Alliance for Affordable Internet, "Universal Access and Service Funds in the Broadband Era: The Collective Investment Imperative", May 2015. Available from http://a4ai.org/wp-content/uploads/2015/06/A4AI-USAF_06.2015_FINAL.pdf. 141 GSMA, "Survey of Universal Service Funds: Key Findings", April 2013, http://www.gsma.com/publicpolicy/wp-content/uploads/2013/04/GSMA-USF-Key-findings-final.pdf.
1
4
7
17 1718
0
2
4
6
8
10
12
14
16
18
20
2012 2014 2016
Per
cen
tage
of
Ho
use
ho
lds
(%)
rural
urban
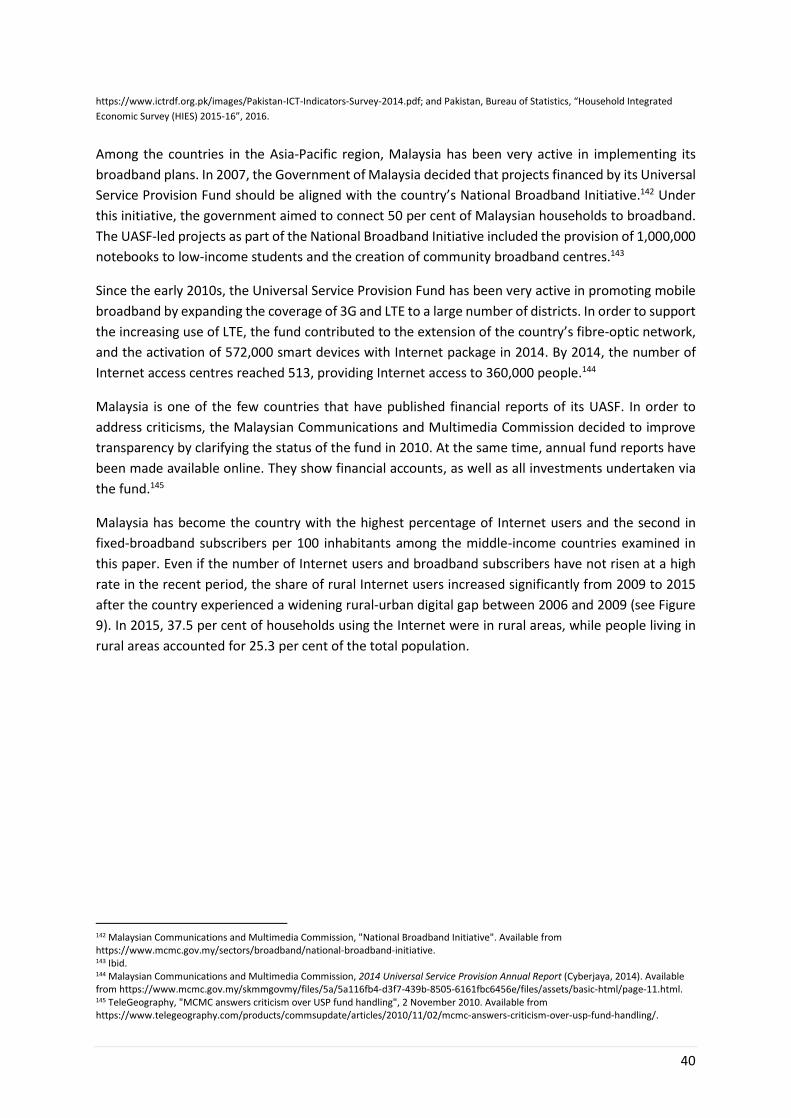
40
https://www.ictrdf.org.pk/images/Pakistan-ICT-Indicators-Survey-2014.pdf; and Pakistan, Bureau of Statistics, “Household Integrated
Economic Survey (HIES) 2015-16”, 2016.
Among the countries in the Asia-Pacific region, Malaysia has been very active in implementing its
broadband plans. In 2007, the Government of Malaysia decided that projects financed by its Universal
Service Provision Fund should be aligned with the country’s National Broadband Initiative.142 Under
this initiative, the government aimed to connect 50 per cent of Malaysian households to broadband.
The UASF-led projects as part of the National Broadband Initiative included the provision of 1,000,000
notebooks to low-income students and the creation of community broadband centres.143
Since the early 2010s, the Universal Service Provision Fund has been very active in promoting mobile
broadband by expanding the coverage of 3G and LTE to a large number of districts. In order to support
the increasing use of LTE, the fund contributed to the extension of the country’s fibre-optic network,
and the activation of 572,000 smart devices with Internet package in 2014. By 2014, the number of
Internet access centres reached 513, providing Internet access to 360,000 people.144
Malaysia is one of the few countries that have published financial reports of its UASF. In order to
address criticisms, the Malaysian Communications and Multimedia Commission decided to improve
transparency by clarifying the status of the fund in 2010. At the same time, annual fund reports have
been made available online. They show financial accounts, as well as all investments undertaken via
the fund.145
Malaysia has become the country with the highest percentage of Internet users and the second in
fixed-broadband subscribers per 100 inhabitants among the middle-income countries examined in
this paper. Even if the number of Internet users and broadband subscribers have not risen at a high
rate in the recent period, the share of rural Internet users increased significantly from 2009 to 2015
after the country experienced a widening rural-urban digital gap between 2006 and 2009 (see Figure
9). In 2015, 37.5 per cent of households using the Internet were in rural areas, while people living in
rural areas accounted for 25.3 per cent of the total population.
142 Malaysian Communications and Multimedia Commission, "National Broadband Initiative". Available from https://www.mcmc.gov.my/sectors/broadband/national-broadband-initiative. 143 Ibid. 144 Malaysian Communications and Multimedia Commission, 2014 Universal Service Provision Annual Report (Cyberjaya, 2014). Available from https://www.mcmc.gov.my/skmmgovmy/files/5a/5a116fb4-d3f7-439b-8505-6161fbc6456e/files/assets/basic-html/page-11.html. 145 TeleGeography, "MCMC answers criticism over USP fund handling", 2 November 2010. Available from https://www.telegeography.com/products/commsupdate/articles/2010/11/02/mcmc-answers-criticism-over-usp-fund-handling/.
41
Figure 9: Share of rural and urban Internet users in Malaysia, 2009-2015
Source: ESCAP, based on Malaysian Communications and Multimedia Commission, “Internet Users Survey, 2006-2016”, 2016.
It is difficult to assess the real extent to which the UASFs have contributed to the trends observed in
Malaysia and Pakistan, even if the 2010s coincide with a high-level activity period for the two funds.
Besides, demonstrating that UASFs are efficient is complicated, as the private sector may have
achieved better results in terms of broadband deployment/Internet adoption at the national scale if
there was no levy.
Nevertheless, these two UASFs are characterized by a relatively high degree of transparency and an
elevated level of activities. The example from Malaysia suggests that countries may only be able to
effectively bridge the rural-urban divide after they first achieve a certain level of ICT penetration rates
in urban areas. Yet, the example from Pakistan shows that even if the rural-urban access divide has
been narrowed, the country still exhibits limited fixed-broadband and Internet adoption rates as a
whole. This raises the question of whether the amount disbursed by the UASF would have led to more
significant results in terms of adoption rates at the national scale if they had remained in private sector
hands and/or spent in higher return areas at different phases. Alternative regulatory and licensing
provision which mandates operators to expand networks to remote and rural areas without a levy
could also be considered. Further research could help clarify these hypotheses.
12. Conclusion
With universal access remaining tenuous, UASFs would initially appear to be a viable option to kick-
start infrastructure expansion in unserved and underserved localities. However, while the Asia-Pacific
region offers some success stories of UASF implementation, no best practice model seems to have
emerged. This may be because every country in the vast and diverse region of Asia and the Pacific has
a unique set of challenges related to governance, geography, market development, foreign
investment, leadership, rule of law, and other unforeseen circumstances. One size does not fit all.
0%
10%
20%
30%
40%
50%
60%
70%
80%
90%
100%
2006 2008 2009 2011 2012 2014 2015
rural
urban
42
Since the majority of states in the Asia-Pacific region are categorized as developing or least developed
countries, policy-makers often view UASFs as a necessary financing mechanism for equitable ICT
benefit redistribution in poor, rural and remote areas. Nevertheless, UASFs have led to practical and
theoretical challenges.146
In fact, the econometric analysis in this paper found systematically negative correlations between
UASF and fixed broadband growth, while the existence of broadband policy (later years of 2010-2015)
was found positively correlated to fixed broadband expansion147. The findings on the Internet and
mobile broadband growth are less significant. It was also found that mobile broadband expansion
does not have statistically significant impact on fixed broadband expansion, according to this
analytical context.
The sections above show that UASFs are associated with some welfare-enhancing goals and significant
efforts have been undertaken by governments to establish efficient and effective UASFs to serve rural
areas and target populations. However, several structural and operational issues such as lack of
transparency and limited disbursements seem to negatively impact the majority of UASFs examined
in this study.
Whereas there is probably no single solution to address these multiple challenges and ensure that
targeted populations and areas benefit from UASF-led projects, more transparency and accountability
would be required. In addition to demonstrating the results achieved by UASFs, which are often
unreported, increased transparency and accountability will also enhance stakeholders’
commitment.148
A better understanding of incentives and constraints faced by private operators is also needed,
especially in early stages when countries have reached a certain level of broadband/Internet adoption.
In this regard, identifying the determinants of the ICT adoption path at the national scale in developing
countries could be an interesting area for future research and policy analysis. It could help policy
makers to choose the most efficient instruments in each phase of the ICT adoption path to minimize
access inequalities without hindering the overall objective and deployment149.
While the econometric section of this paper examines the impact of UASFs on broadband and Internet
adoption at the country level, there are still unanswered questions. It remains unclear whether UASFs
have sizeable impacts on the populations they specifically target such as women, people with
disabilities and the rural population. More and disaggregated household-level data on ICT adoption
for different types of populations (age, sex, rural/urban among others) is critically needed to enable
researchers to investigate the effect of UASF projects and decision makers to make evidence-based
policy.
146 Antonio Estache, Jean-Jacques Laffont and Xinzhu Zhang, " Universal service obligations in LDCs: The effect of uniform pricing on infrastructure access”, Journal of Public Economics, vol. 90, no. 6-7 (August 2006), pp. 1155-1179 147 It would merit a further investigation on the reason why the policies are found statistically significant during later years, but not earlier years. 148 ITU, "Universal Service Fund and Digital Inclusion for All Study", June 2013. Available from https://www.itu.int/en/ITU-D/Conferences/GSR/Documents/ITU%20USF%20Final%20Report.pdf. 149 http://www.itu.int/en/ITU-D/Digital-Inclusion/Documents/USF_final-en.pdf
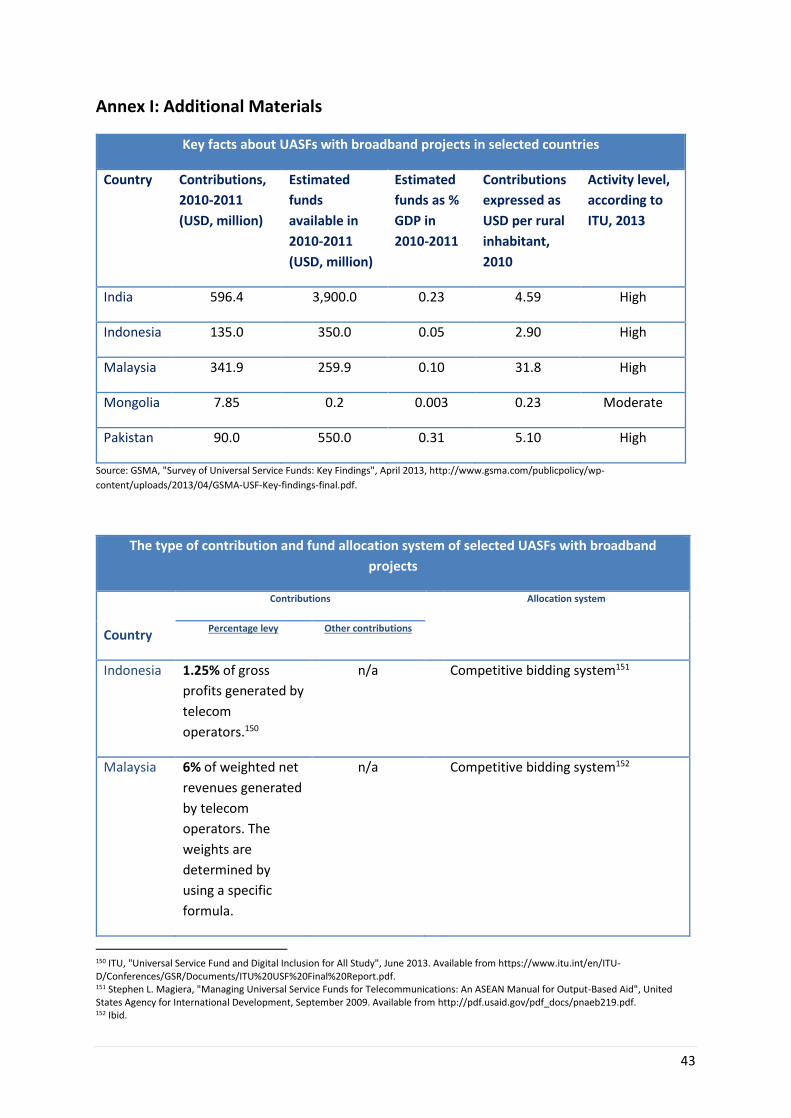
43
Annex I: Additional Materials
Key facts about UASFs with broadband projects in selected countries
Country Contributions,
2010-2011
(USD, million)
Estimated
funds
available in
2010-2011
(USD, million)
Estimated
funds as %
GDP in
2010-2011
Contributions
expressed as
USD per rural
inhabitant,
2010
Activity level,
according to
ITU, 2013
India 596.4 3,900.0 0.23 4.59 High
Indonesia 135.0 350.0 0.05 2.90 High
Malaysia 341.9 259.9 0.10 31.8 High
Mongolia 7.85 0.2 0.003 0.23 Moderate
Pakistan 90.0 550.0 0.31 5.10 High
Source: GSMA, "Survey of Universal Service Funds: Key Findings", April 2013, http://www.gsma.com/publicpolicy/wp-
content/uploads/2013/04/GSMA-USF-Key-findings-final.pdf.
The type of contribution and fund allocation system of selected UASFs with broadband
projects
Country
Contributions
Allocation system
Percentage levy Other contributions
Indonesia 1.25% of gross
profits generated by
telecom
operators.150
n/a
Competitive bidding system151
Malaysia 6% of weighted net
revenues generated
by telecom
operators. The
weights are
determined by
using a specific
formula.
n/a
Competitive bidding system152
150 ITU, "Universal Service Fund and Digital Inclusion for All Study", June 2013. Available from https://www.itu.int/en/ITU-D/Conferences/GSR/Documents/ITU%20USF%20Final%20Report.pdf. 151 Stephen L. Magiera, "Managing Universal Service Funds for Telecommunications: An ASEAN Manual for Output-Based Aid", United States Agency for International Development, September 2009. Available from http://pdf.usaid.gov/pdf_docs/pnaeb219.pdf. 152 Ibid.
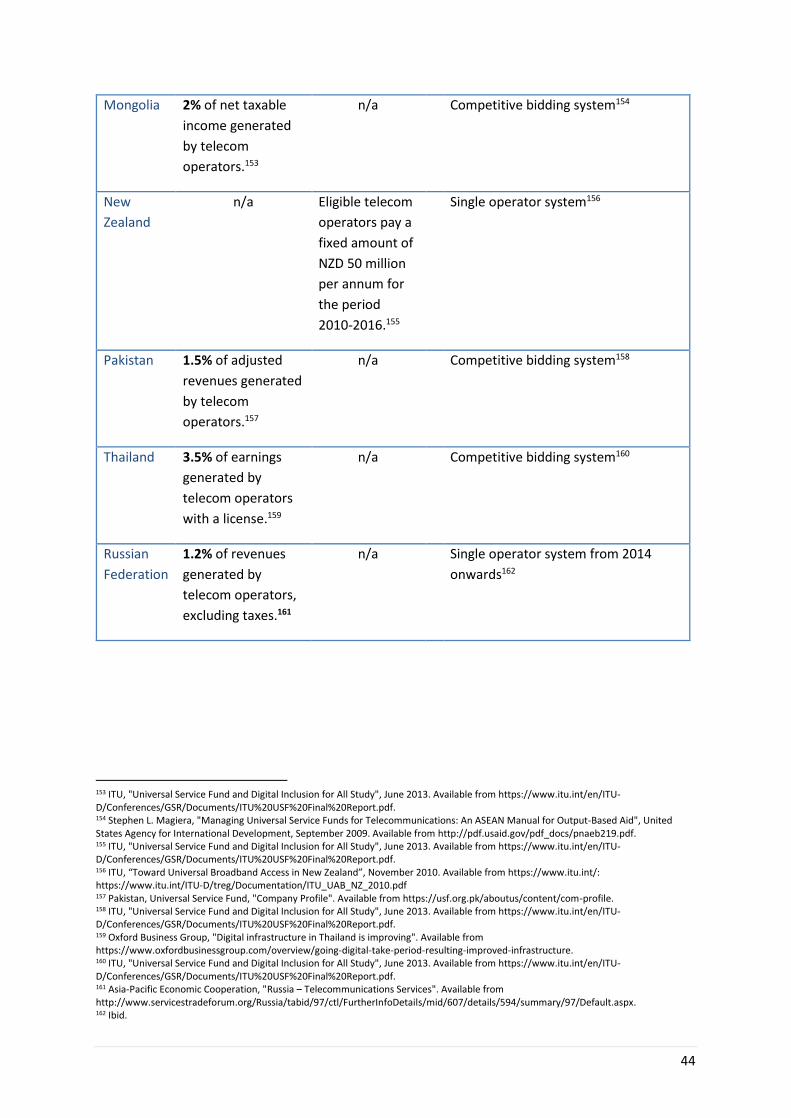
44
Mongolia 2% of net taxable
income generated
by telecom
operators.153
n/a
Competitive bidding system154
New
Zealand
n/a Eligible telecom
operators pay a
fixed amount of
NZD 50 million
per annum for
the period
2010-2016.155
Single operator system156
Pakistan 1.5% of adjusted
revenues generated
by telecom
operators.157
n/a
Competitive bidding system158
Thailand 3.5% of earnings
generated by
telecom operators
with a license.159
n/a Competitive bidding system160
Russian
Federation
1.2% of revenues
generated by
telecom operators,
excluding taxes.161
n/a Single operator system from 2014
onwards162
153 ITU, "Universal Service Fund and Digital Inclusion for All Study", June 2013. Available from https://www.itu.int/en/ITU-D/Conferences/GSR/Documents/ITU%20USF%20Final%20Report.pdf. 154 Stephen L. Magiera, "Managing Universal Service Funds for Telecommunications: An ASEAN Manual for Output-Based Aid", United States Agency for International Development, September 2009. Available from http://pdf.usaid.gov/pdf_docs/pnaeb219.pdf. 155 ITU, "Universal Service Fund and Digital Inclusion for All Study", June 2013. Available from https://www.itu.int/en/ITU-D/Conferences/GSR/Documents/ITU%20USF%20Final%20Report.pdf. 156 ITU, “Toward Universal Broadband Access in New Zealand”, November 2010. Available from https://www.itu.int/: https://www.itu.int/ITU-D/treg/Documentation/ITU_UAB_NZ_2010.pdf 157 Pakistan, Universal Service Fund, "Company Profile". Available from https://usf.org.pk/aboutus/content/com-profile. 158 ITU, "Universal Service Fund and Digital Inclusion for All Study", June 2013. Available from https://www.itu.int/en/ITU-D/Conferences/GSR/Documents/ITU%20USF%20Final%20Report.pdf. 159 Oxford Business Group, "Digital infrastructure in Thailand is improving". Available from https://www.oxfordbusinessgroup.com/overview/going-digital-take-period-resulting-improved-infrastructure. 160 ITU, "Universal Service Fund and Digital Inclusion for All Study", June 2013. Available from https://www.itu.int/en/ITU-D/Conferences/GSR/Documents/ITU%20USF%20Final%20Report.pdf. 161 Asia-Pacific Economic Cooperation, "Russia – Telecommunications Services". Available from http://www.servicestradeforum.org/Russia/tabid/97/ctl/FurtherInfoDetails/mid/607/details/594/summary/97/Default.aspx. 162 Ibid.
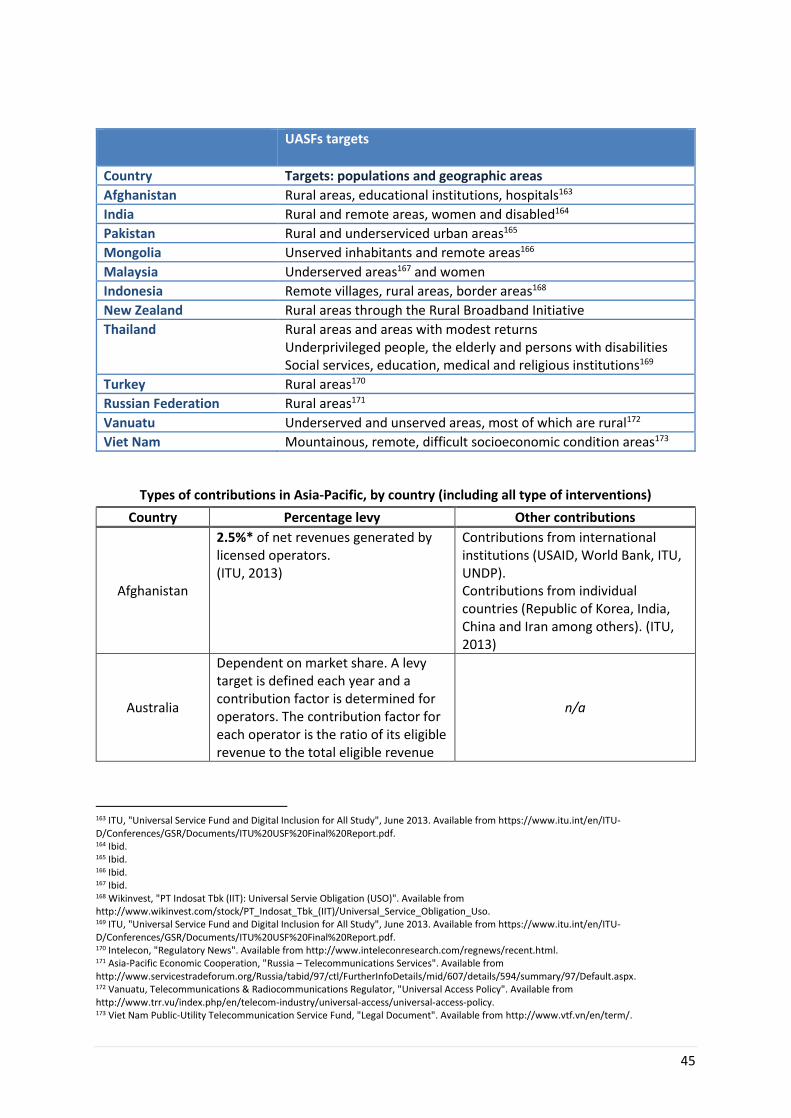
45
UASFs targets
Country Targets: populations and geographic areas
Afghanistan Rural areas, educational institutions, hospitals163
India Rural and remote areas, women and disabled164
Pakistan Rural and underserviced urban areas165
Mongolia Unserved inhabitants and remote areas166
Malaysia Underserved areas167 and women
Indonesia Remote villages, rural areas, border areas168
New Zealand Rural areas through the Rural Broadband Initiative
Thailand Rural areas and areas with modest returns Underprivileged people, the elderly and persons with disabilities Social services, education, medical and religious institutions169
Turkey Rural areas170
Russian Federation Rural areas171
Vanuatu Underserved and unserved areas, most of which are rural172
Viet Nam Mountainous, remote, difficult socioeconomic condition areas173
Types of contributions in Asia-Pacific, by country (including all type of interventions)
Country Percentage levy Other contributions
Afghanistan
2.5%* of net revenues generated by licensed operators. (ITU, 2013)
Contributions from international institutions (USAID, World Bank, ITU, UNDP). Contributions from individual countries (Republic of Korea, India, China and Iran among others). (ITU, 2013)
Australia
Dependent on market share. A levy target is defined each year and a contribution factor is determined for operators. The contribution factor for each operator is the ratio of its eligible revenue to the total eligible revenue
n/a
163 ITU, "Universal Service Fund and Digital Inclusion for All Study", June 2013. Available from https://www.itu.int/en/ITU-D/Conferences/GSR/Documents/ITU%20USF%20Final%20Report.pdf. 164 Ibid. 165 Ibid. 166 Ibid. 167 Ibid. 168 Wikinvest, "PT Indosat Tbk (IIT): Universal Servie Obligation (USO)". Available from http://www.wikinvest.com/stock/PT_Indosat_Tbk_(IIT)/Universal_Service_Obligation_Uso. 169 ITU, "Universal Service Fund and Digital Inclusion for All Study", June 2013. Available from https://www.itu.int/en/ITU-D/Conferences/GSR/Documents/ITU%20USF%20Final%20Report.pdf. 170 Intelecon, "Regulatory News". Available from http://www.inteleconresearch.com/regnews/recent.html. 171 Asia-Pacific Economic Cooperation, "Russia – Telecommunications Services". Available from http://www.servicestradeforum.org/Russia/tabid/97/ctl/FurtherInfoDetails/mid/607/details/594/summary/97/Default.aspx. 172 Vanuatu, Telecommunications & Radiocommunications Regulator, "Universal Access Policy". Available from http://www.trr.vu/index.php/en/telecom-industry/universal-access/universal-access-policy. 173 Viet Nam Public-Utility Telecommunication Service Fund, "Legal Document". Available from http://www.vtf.vn/en/term/.
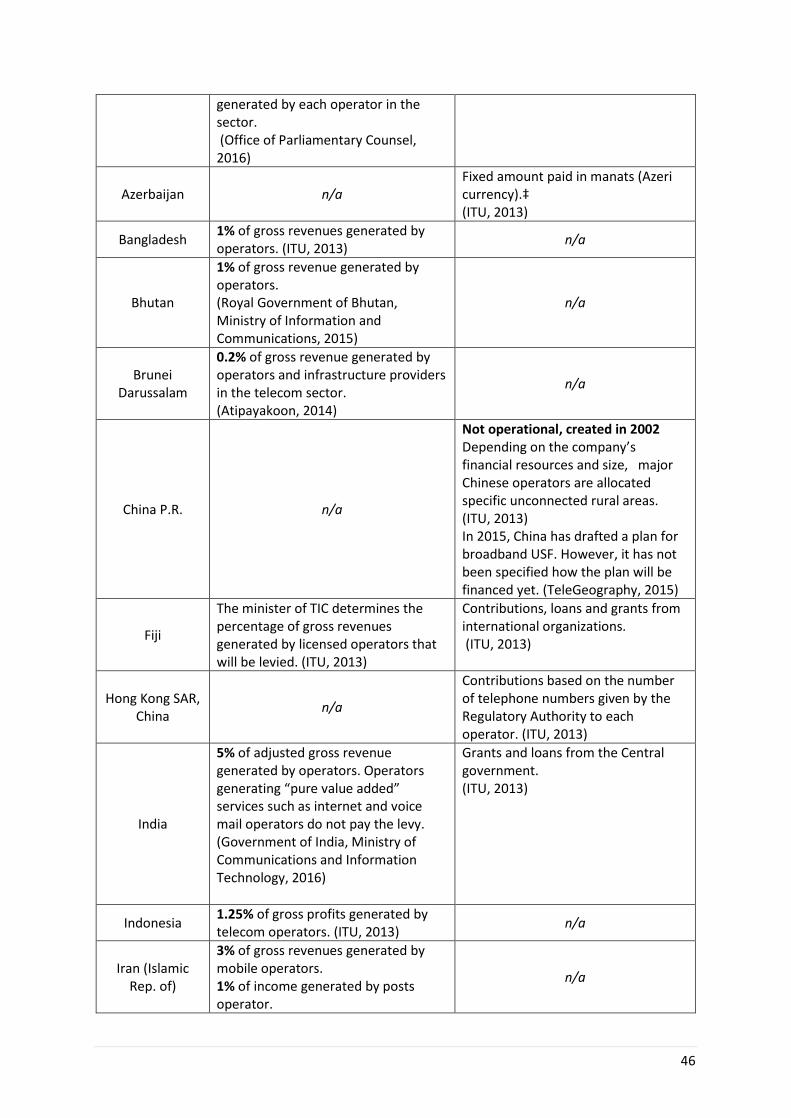
46
generated by each operator in the sector. (Office of Parliamentary Counsel, 2016)
Azerbaijan n/a Fixed amount paid in manats (Azeri currency).‡ (ITU, 2013)
Bangladesh 1% of gross revenues generated by operators. (ITU, 2013)
n/a
Bhutan
1% of gross revenue generated by operators. (Royal Government of Bhutan, Ministry of Information and Communications, 2015)
n/a
Brunei Darussalam
0.2% of gross revenue generated by operators and infrastructure providers in the telecom sector. (Atipayakoon, 2014)
n/a
China P.R. n/a
Not operational, created in 2002 Depending on the company’s financial resources and size, major Chinese operators are allocated specific unconnected rural areas. (ITU, 2013) In 2015, China has drafted a plan for broadband USF. However, it has not been specified how the plan will be financed yet. (TeleGeography, 2015)
Fiji
The minister of TIC determines the percentage of gross revenues generated by licensed operators that will be levied. (ITU, 2013)
Contributions, loans and grants from international organizations. (ITU, 2013)
Hong Kong SAR, China
n/a
Contributions based on the number of telephone numbers given by the Regulatory Authority to each operator. (ITU, 2013)
India
5% of adjusted gross revenue generated by operators. Operators generating “pure value added” services such as internet and voice mail operators do not pay the levy. (Government of India, Ministry of Communications and Information Technology, 2016)
Grants and loans from the Central government. (ITU, 2013)
Indonesia 1.25% of gross profits generated by telecom operators. (ITU, 2013)
n/a
Iran (Islamic Rep. of)
3% of gross revenues generated by mobile operators. 1% of income generated by posts operator.
n/a
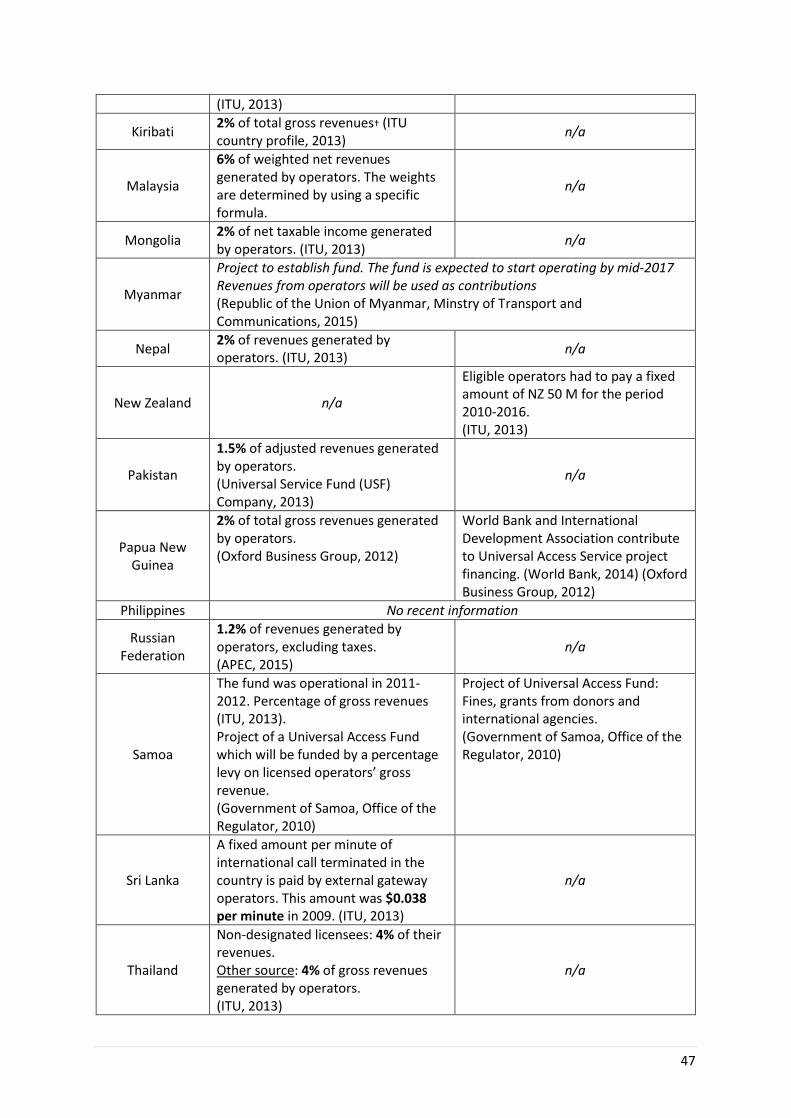
47
(ITU, 2013)
Kiribati 2% of total gross revenues† (ITU country profile, 2013)
n/a
Malaysia
6% of weighted net revenues generated by operators. The weights are determined by using a specific formula.
n/a
Mongolia 2% of net taxable income generated by operators. (ITU, 2013)
n/a
Myanmar
Project to establish fund. The fund is expected to start operating by mid-2017 Revenues from operators will be used as contributions (Republic of the Union of Myanmar, Minstry of Transport and Communications, 2015)
Nepal 2% of revenues generated by operators. (ITU, 2013)
n/a
New Zealand n/a
Eligible operators had to pay a fixed amount of NZ 50 M for the period 2010-2016. (ITU, 2013)
Pakistan
1.5% of adjusted revenues generated by operators. (Universal Service Fund (USF) Company, 2013)
n/a
Papua New Guinea
2% of total gross revenues generated by operators. (Oxford Business Group, 2012)
World Bank and International Development Association contribute to Universal Access Service project financing. (World Bank, 2014) (Oxford Business Group, 2012)
Philippines No recent information
Russian Federation
1.2% of revenues generated by operators, excluding taxes. (APEC, 2015)
n/a
Samoa
The fund was operational in 2011-2012. Percentage of gross revenues (ITU, 2013). Project of a Universal Access Fund which will be funded by a percentage levy on licensed operators’ gross revenue. (Government of Samoa, Office of the Regulator, 2010)
Project of Universal Access Fund: Fines, grants from donors and international agencies. (Government of Samoa, Office of the Regulator, 2010)
Sri Lanka
A fixed amount per minute of international call terminated in the country is paid by external gateway operators. This amount was $0.038 per minute in 2009. (ITU, 2013)
n/a
Thailand
Non-designated licensees: 4% of their revenues. Other source: 4% of gross revenues generated by operators. (ITU, 2013)
n/a
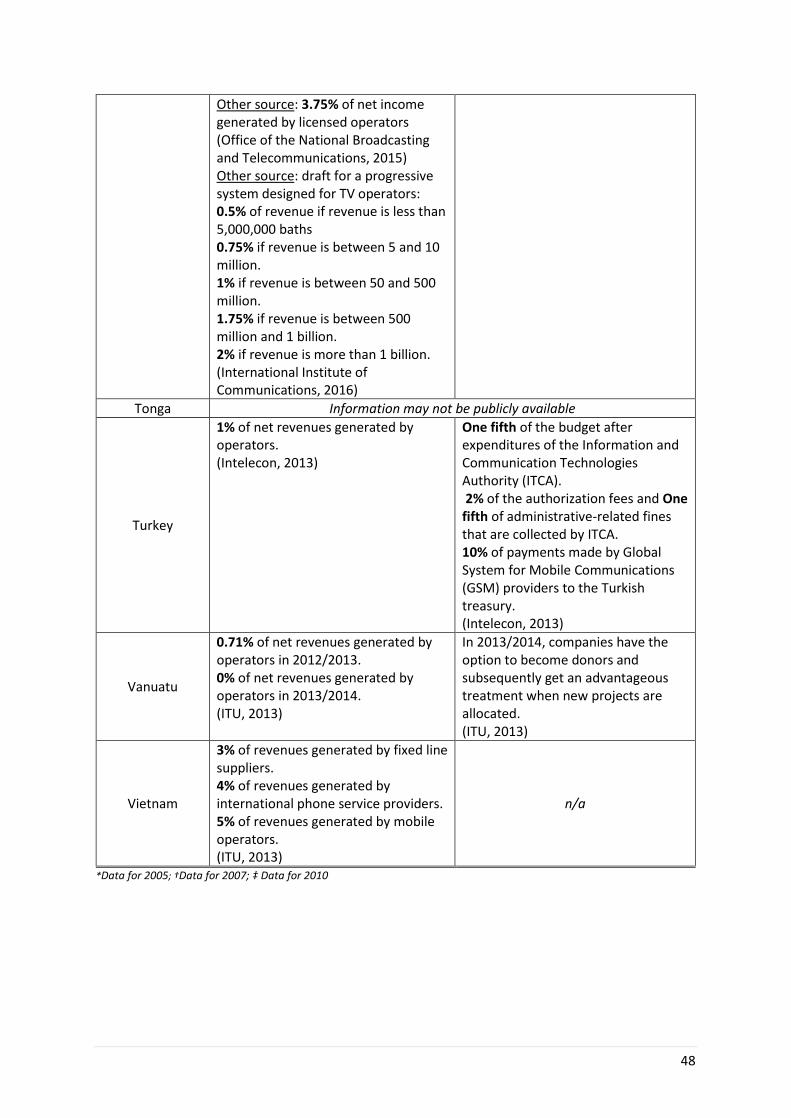
48
Other source: 3.75% of net income generated by licensed operators (Office of the National Broadcasting and Telecommunications, 2015) Other source: draft for a progressive system designed for TV operators: 0.5% of revenue if revenue is less than 5,000,000 baths 0.75% if revenue is between 5 and 10 million. 1% if revenue is between 50 and 500 million. 1.75% if revenue is between 500 million and 1 billion. 2% if revenue is more than 1 billion. (International Institute of Communications, 2016)
Tonga Information may not be publicly available
Turkey
1% of net revenues generated by operators. (Intelecon, 2013)
One fifth of the budget after expenditures of the Information and Communication Technologies Authority (ITCA). 2% of the authorization fees and One fifth of administrative-related fines that are collected by ITCA. 10% of payments made by Global System for Mobile Communications (GSM) providers to the Turkish treasury. (Intelecon, 2013)
Vanuatu
0.71% of net revenues generated by operators in 2012/2013. 0% of net revenues generated by operators in 2013/2014. (ITU, 2013)
In 2013/2014, companies have the option to become donors and subsequently get an advantageous treatment when new projects are allocated. (ITU, 2013)
Vietnam
3% of revenues generated by fixed line suppliers. 4% of revenues generated by international phone service providers. 5% of revenues generated by mobile operators. (ITU, 2013)
n/a
*Data for 2005; †Data for 2007; ‡ Data for 2010
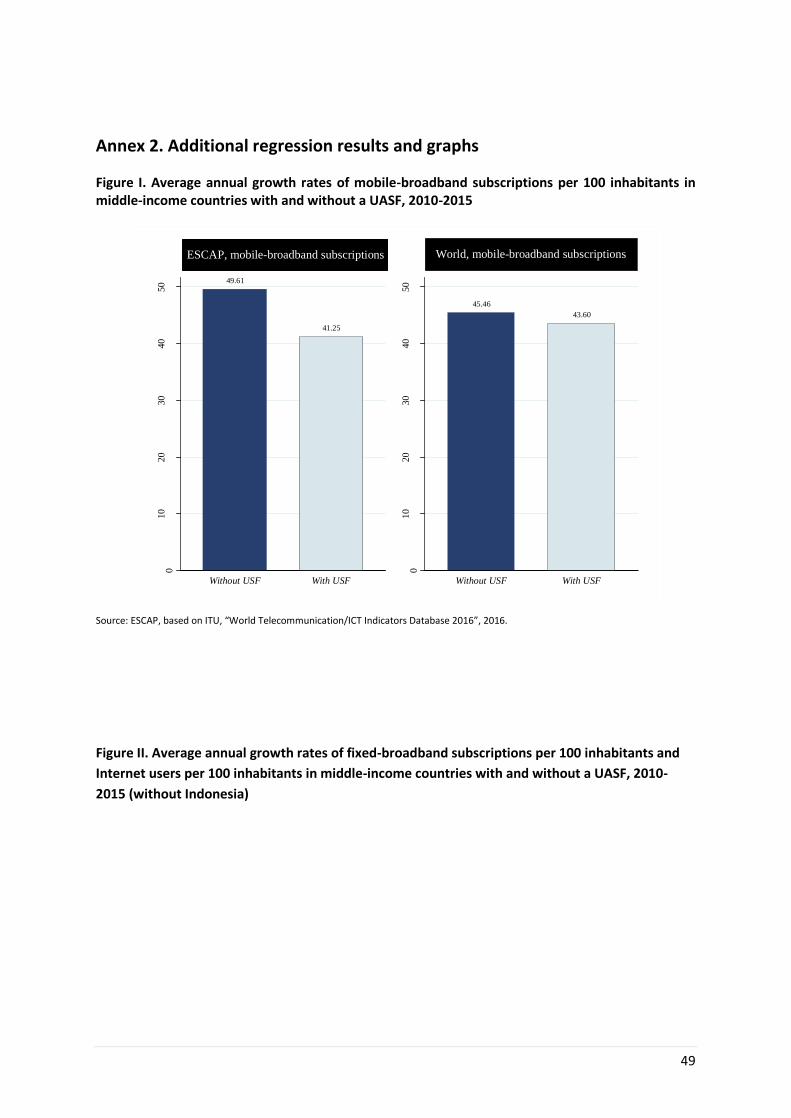
49
Annex 2. Additional regression results and graphs
Figure I. Average annual growth rates of mobile-broadband subscriptions per 100 inhabitants in middle-income countries with and without a UASF, 2010-2015
Source: ESCAP, based on ITU, “World Telecommunication/ICT Indicators Database 2016”, 2016.
Figure II. Average annual growth rates of fixed-broadband subscriptions per 100 inhabitants and
Internet users per 100 inhabitants in middle-income countries with and without a UASF, 2010-
2015 (without Indonesia)
49.61
41.25
010
20
30
40
50
Av
erag
e A
nnu
al G
row
th R
ates
(%
)
Without USF With USF
ESCAP, mobile-broadband subscriptions
45.46
43.60
010
20
30
40
50
Without USF With USF
World, mobile-broadband subscriptions
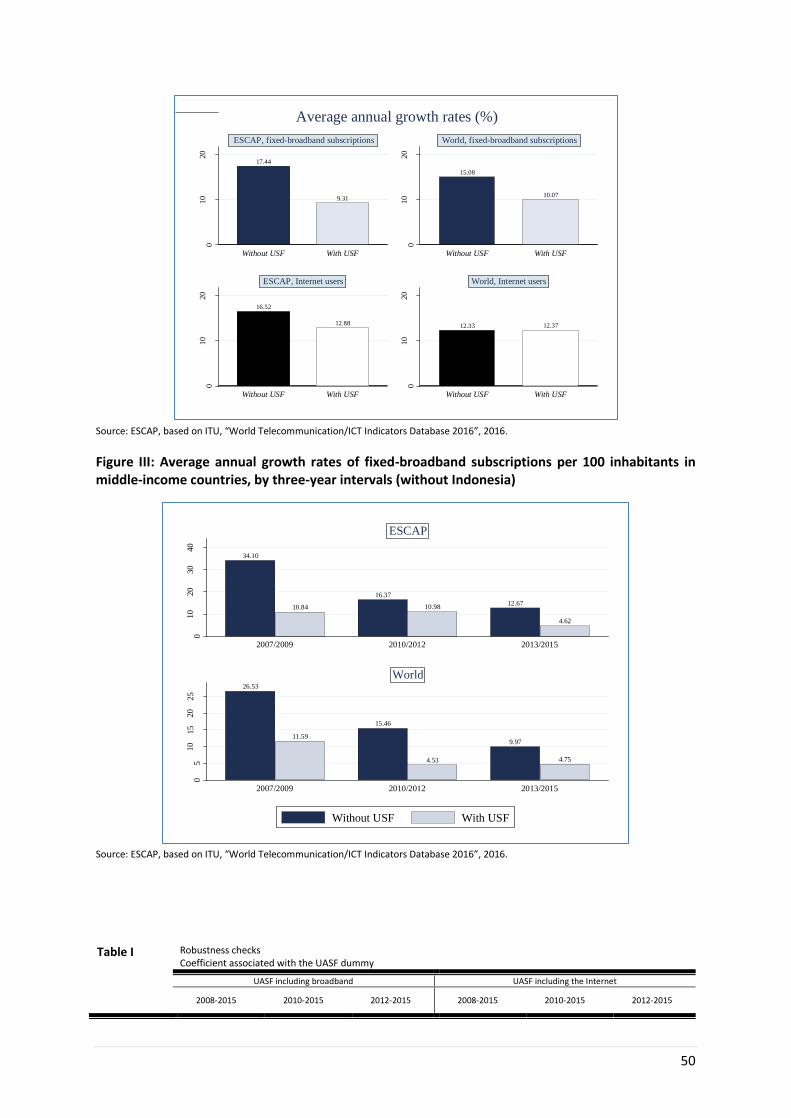
50
Source: ESCAP, based on ITU, “World Telecommunication/ICT Indicators Database 2016”, 2016.
Figure III: Average annual growth rates of fixed-broadband subscriptions per 100 inhabitants in middle-income countries, by three-year intervals (without Indonesia)
Source: ESCAP, based on ITU, “World Telecommunication/ICT Indicators Database 2016”, 2016.
Table I Robustness checks Coefficient associated with the UASF dummy
UASF including broadband UASF including the Internet
2008-2015 2010-2015 2012-2015 2008-2015 2010-2015 2012-2015
17.44
9.31
010
20
Av
erag
e A
nnu
al G
row
th R
ates
(%
)
Without USF With USF
ESCAP, fixed-broadband subscriptions
15.08
10.07
010
20
Without USF With USF
World, fixed-broadband subscriptions
16.52
12.88
010
20
Av
erag
e A
nnu
al G
row
th R
ates
(%
)
Without USF With USF
ESCAP, Internet users
12.33 12.37
010
20
Without USF With USF
World, Internet users
Average annual growth rates (%)
34.10
10.84
16.37
10.9812.67
4.62
010
20
30
40
Aver
age
Ann
ual
Gro
wth
Rat
es (
%)
2007/2009 2010/2012 2013/2015
ESCAP
26.53
11.59
15.46
4.53
9.97
4.75
05
10
15
20
25
Aver
age
Ann
ual
Gro
wth
Rat
es (
%)
2007/2009 2010/2012 2013/2015
World
Without USF With USF
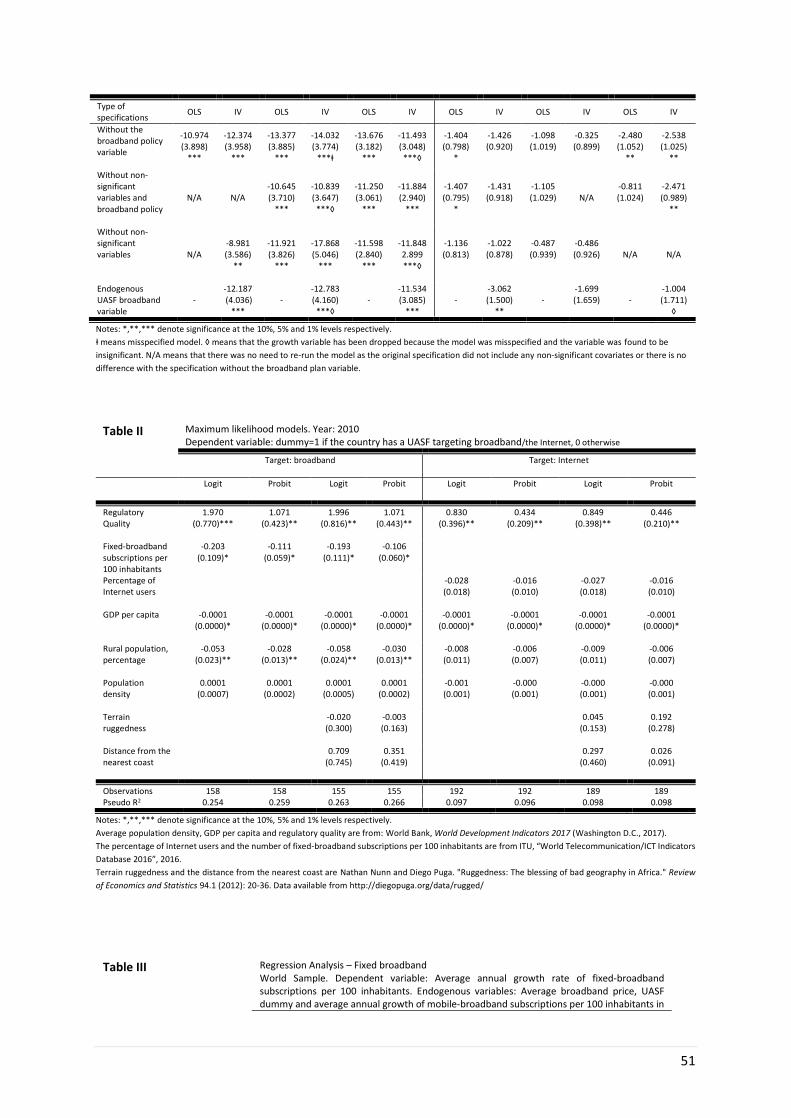
51
Type of specifications
OLS IV OLS IV OLS IV OLS IV OLS IV OLS IV
Without the broadband policy variable
-10.974 (3.898)
***
-12.374 (3.958)
***
-13.377 (3.885)
***
-14.032 (3.774)
***ⱡ
-13.676 (3.182)
***
-11.493 (3.048) ***◊
-1.404 (0.798)
*
-1.426 (0.920)
-1.098 (1.019)
-0.325 (0.899)
-2.480 (1.052)
**
-2.538 (1.025)
**
Without non-significant variables and broadband policy
N/A N/A -10.645 (3.710)
***
-10.839 (3.647) ***◊
-11.250 (3.061)
***
-11.884 (2.940)
***
-1.407 (0.795)
*
-1.431 (0.918)
-1.105 (1.029)
N/A
-0.811 (1.024)
-2.471 (0.989)
**
Without non-significant variables
N/A -8.981 (3.586)
**
-11.921 (3.826)
***
-17.868 (5.046)
***
-11.598 (2.840)
***
-11.848 2.899 ***◊
-1.136 (0.813)
-1.022 (0.878)
-0.487 (0.939)
-0.486 (0.926)
N/A N/A
Endogenous UASF broadband variable
- -12.187 (4.036)
*** -
-12.783 (4.160) ***◊
- -11.534 (3.085)
*** -
-3.062 (1.500)
** -
-1.699 (1.659)
-
-1.004 (1.711)
◊
Notes: *,**,*** denote significance at the 10%, 5% and 1% levels respectively.
ⱡ means misspecified model. ◊ means that the growth variable has been dropped because the model was misspecified and the variable was found to be
insignificant. N/A means that there was no need to re-run the model as the original specification did not include any non-significant covariates or there is no
difference with the specification without the broadband plan variable.
Table II Maximum likelihood models. Year: 2010 Dependent variable: dummy=1 if the country has a UASF targeting broadband/the Internet, 0 otherwise
Target: broadband
Target: Internet
Logit Probit
Logit Probit Logit Probit Logit Probit
Regulatory Quality
1.970 (0.770)***
1.071 (0.423)**
1.996 (0.816)**
1.071 (0.443)**
0.830 (0.396)**
0.434 (0.209)**
0.849 (0.398)**
0.446 (0.210)**
Fixed-broadband subscriptions per 100 inhabitants
-0.203 (0.109)*
-0.111 (0.059)*
-0.193 (0.111)*
-0.106 (0.060)*
Percentage of Internet users
-0.028 (0.018)
-0.016 (0.010)
-0.027 (0.018)
-0.016 (0.010)
GDP per capita -0.0001 (0.0000)*
-0.0001 (0.0000)*
-0.0001 (0.0000)*
-0.0001 (0.0000)*
-0.0001 (0.0000)*
-0.0001 (0.0000)*
-0.0001 (0.0000)*
-0.0001 (0.0000)*
Rural population, percentage
-0.053 (0.023)**
-0.028 (0.013)**
-0.058 (0.024)**
-0.030 (0.013)**
-0.008 (0.011)
-0.006 (0.007)
-0.009 (0.011)
-0.006 (0.007)
Population density
0.0001 (0.0007)
0.0001 (0.0002)
0.0001 (0.0005)
0.0001 (0.0002)
-0.001 (0.001)
-0.000 (0.001)
-0.000 (0.001)
-0.000 (0.001)
Terrain ruggedness
-0.020 (0.300)
-0.003 (0.163)
0.045 (0.153)
0.192 (0.278)
Distance from the nearest coast
0.709 (0.745)
0.351 (0.419)
0.297 (0.460)
0.026 (0.091)
Observations 158 158 155 155 192 192 189 189 Pseudo R2 0.254 0.259 0.263 0.266 0.097 0.096 0.098 0.098
Notes: *,**,*** denote significance at the 10%, 5% and 1% levels respectively.
Average population density, GDP per capita and regulatory quality are from: World Bank, World Development Indicators 2017 (Washington D.C., 2017).
The percentage of Internet users and the number of fixed-broadband subscriptions per 100 inhabitants are from ITU, “World Telecommunication/ICT Indicators
Database 2016”, 2016.
Terrain ruggedness and the distance from the nearest coast are Nathan Nunn and Diego Puga. "Ruggedness: The blessing of bad geography in Africa." Review
of Economics and Statistics 94.1 (2012): 20-36. Data available from http://diegopuga.org/data/rugged/
Table III Regression Analysis – Fixed broadband World Sample. Dependent variable: Average annual growth rate of fixed-broadband subscriptions per 100 inhabitants. Endogenous variables: Average broadband price, UASF dummy and average annual growth of mobile-broadband subscriptions per 100 inhabitants in
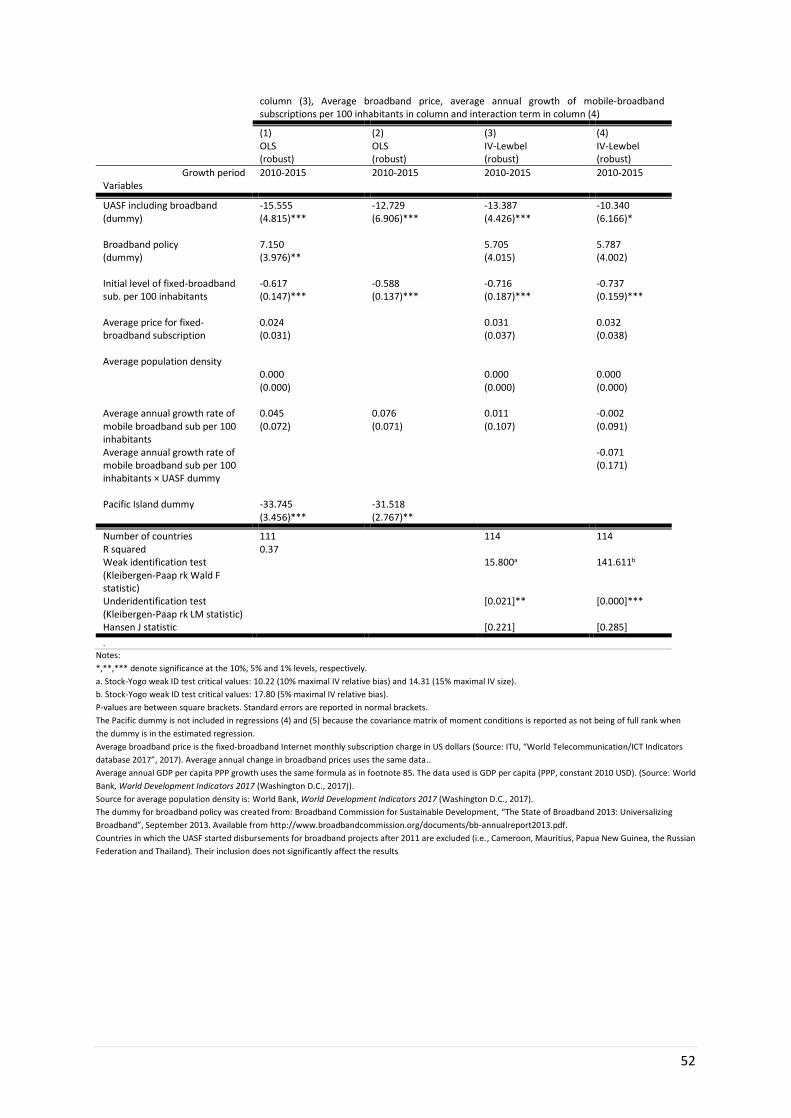
52
column (3), Average broadband price, average annual growth of mobile-broadband subscriptions per 100 inhabitants in column and interaction term in column (4)
(1) OLS (robust)
(2) OLS (robust)
(3) IV-Lewbel (robust)
(4) IV-Lewbel (robust)
Growth period Variables
2010-2015 2010-2015 2010-2015 2010-2015
UASF including broadband (dummy)
-15.555 (4.815)***
-12.729 (6.906)***
-13.387 (4.426)***
-10.340 (6.166)*
Broadband policy (dummy)
7.150 (3.976)**
5.705 (4.015)
5.787 (4.002)
Initial level of fixed-broadband sub. per 100 inhabitants
-0.617 (0.147)***
-0.588 (0.137)***
-0.716 (0.187)***
-0.737 (0.159)***
Average price for fixed-broadband subscription
0.024 (0.031)
0.031 (0.037)
0.032 (0.038)
Average population density 0.000 (0.000)
0.000 (0.000)
0.000 (0.000)
Average annual growth rate of mobile broadband sub per 100 inhabitants
0.045 (0.072)
0.076 (0.071)
0.011 (0.107)
-0.002 (0.091)
Average annual growth rate of mobile broadband sub per 100 inhabitants × UASF dummy
-0.071 (0.171)
Pacific Island dummy -33.745
(3.456)*** -31.518 (2.767)**
Number of countries 111 114 114 R squared 0.37 Weak identification test (Kleibergen-Paap rk Wald F statistic)
15.800a 141.611b
Underidentification test (Kleibergen-Paap rk LM statistic)
[0.021]** [0.000]***
Hansen J statistic [0.221] [0.285]
.
Notes:
*,**,*** denote significance at the 10%, 5% and 1% levels, respectively.
a. Stock-Yogo weak ID test critical values: 10.22 (10% maximal IV relative bias) and 14.31 (15% maximal IV size).
b. Stock-Yogo weak ID test critical values: 17.80 (5% maximal IV relative bias).
P-values are between square brackets. Standard errors are reported in normal brackets.
The Pacific dummy is not included in regressions (4) and (5) because the covariance matrix of moment conditions is reported as not being of full rank when
the dummy is in the estimated regression.
Average broadband price is the fixed-broadband Internet monthly subscription charge in US dollars (Source: ITU, “World Telecommunication/ICT Indicators
database 2017”, 2017). Average annual change in broadband prices uses the same data..
Average annual GDP per capita PPP growth uses the same formula as in footnote 85. The data used is GDP per capita (PPP, constant 2010 USD). (Source: World
Bank, World Development Indicators 2017 (Washington D.C., 2017)).
Source for average population density is: World Bank, World Development Indicators 2017 (Washington D.C., 2017).
The dummy for broadband policy was created from: Broadband Commission for Sustainable Development, “The State of Broadband 2013: Universalizing
Broadband”, September 2013. Available from http://www.broadbandcommission.org/documents/bb-annualreport2013.pdf.
Countries in which the UASF started disbursements for broadband projects after 2011 are excluded (i.e., Cameroon, Mauritius, Papua New Guinea, the Russian
Federation and Thailand). Their inclusion does not significantly affect the results
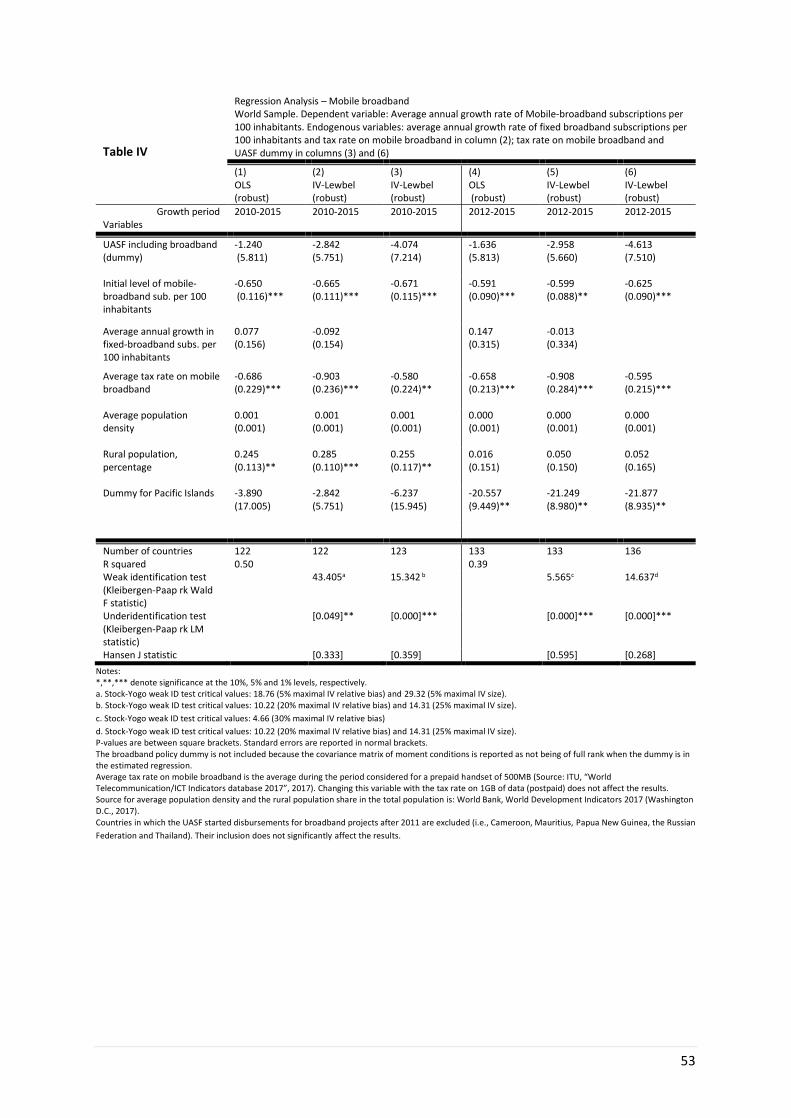
53
Table IV
Regression Analysis – Mobile broadband World Sample. Dependent variable: Average annual growth rate of Mobile-broadband subscriptions per 100 inhabitants. Endogenous variables: average annual growth rate of fixed broadband subscriptions per 100 inhabitants and tax rate on mobile broadband in column (2); tax rate on mobile broadband and UASF dummy in columns (3) and (6)
(1) OLS (robust)
(2) IV-Lewbel (robust)
(3) IV-Lewbel (robust)
(4) OLS (robust)
(5) IV-Lewbel (robust)
(6) IV-Lewbel (robust)
Growth period Variables
2010-2015 2010-2015 2010-2015 2012-2015 2012-2015 2012-2015
UASF including broadband (dummy)
-1.240 (5.811)
-2.842 (5.751)
-4.074 (7.214)
-1.636 (5.813)
-2.958 (5.660)
-4.613 (7.510)
Initial level of mobile-broadband sub. per 100 inhabitants
-0.650 (0.116)***
-0.665 (0.111)***
-0.671 (0.115)***
-0.591 (0.090)***
-0.599 (0.088)**
-0.625 (0.090)***
Average annual growth in fixed-broadband subs. per 100 inhabitants
0.077 (0.156)
-0.092 (0.154)
0.147 (0.315)
-0.013 (0.334)
Average tax rate on mobile broadband
-0.686 (0.229)***
-0.903 (0.236)***
-0.580 (0.224)**
-0.658 (0.213)***
-0.908 (0.284)***
-0.595 (0.215)***
Average population density
0.001 (0.001)
0.001 (0.001)
0.001 (0.001)
0.000 (0.001)
0.000 (0.001)
0.000 (0.001)
Rural population, percentage
0.245 (0.113)**
0.285 (0.110)***
0.255 (0.117)**
0.016 (0.151)
0.050 (0.150)
0.052 (0.165)
Dummy for Pacific Islands -3.890 (17.005)
-2.842 (5.751)
-6.237 (15.945)
-20.557 (9.449)**
-21.249 (8.980)**
-21.877 (8.935)**
Number of countries 122 122 123 133 133 136 R squared 0.50 0.39 Weak identification test (Kleibergen-Paap rk Wald F statistic)
43.405a 15.342 b 5.565c 14.637d
Underidentification test (Kleibergen-Paap rk LM statistic)
[0.049]** [0.000]*** [0.000]*** [0.000]***
Hansen J statistic [0.333] [0.359] [0.595] [0.268]
Notes: *,**,*** denote significance at the 10%, 5% and 1% levels, respectively. a. Stock-Yogo weak ID test critical values: 18.76 (5% maximal IV relative bias) and 29.32 (5% maximal IV size). b. Stock-Yogo weak ID test critical values: 10.22 (20% maximal IV relative bias) and 14.31 (25% maximal IV size).
c. Stock-Yogo weak ID test critical values: 4.66 (30% maximal IV relative bias)
d. Stock-Yogo weak ID test critical values: 10.22 (20% maximal IV relative bias) and 14.31 (25% maximal IV size). P-values are between square brackets. Standard errors are reported in normal brackets. The broadband policy dummy is not included because the covariance matrix of moment conditions is reported as not being of full rank when the dummy is in the estimated regression. Average tax rate on mobile broadband is the average during the period considered for a prepaid handset of 500MB (Source: ITU, “World Telecommunication/ICT Indicators database 2017”, 2017). Changing this variable with the tax rate on 1GB of data (postpaid) does not affect the results. Source for average population density and the rural population share in the total population is: World Bank, World Development Indicators 2017 (Washington D.C., 2017). Countries in which the UASF started disbursements for broadband projects after 2011 are excluded (i.e., Cameroon, Mauritius, Papua New Guinea, the Russian
Federation and Thailand). Their inclusion does not significantly affect the results.