the industry of farming lesson plan
TRANSCRIPT
The Industry of Farming Lesson Plan
Lesson Summary: In this lesson, students will examine how agriculture has evolved into today’s farming industry. Students will explore how agricultural products are developed in the United States and how agriculture is a major industry today. Students will evaluate data that shows trends in crops and agriculture activity in regions of the U.S. that experience different amounts of rainfall and sunlight. Students will analyze this data to construct an explanation as to how agriculture is a unique and vital industry that is dependent on specific conditions, many of which are outside the control of farm and ranch owners. Students will then investigate technologies farmers use to expand and improve their expected yield, such as irrigation techniques, soil management, the use of genetically modified organisms (GMOs), and applications.
Lesson Duration: One class period (45-60 minutes)
Essential Questions: • What are the major agricultural products in different regions of the United States? • How can weather in a region of the United States influence crop production in that region? • What factors have an impact on the economics of farming/ranching around the United States? • What technologies and techniques can farmers use to make farming/ranching more predictable and
successful?
Learning Objectives: Students will: • Identify factors that play a role in the economics of agriculture as an industry • Analyze and interpret data of agricultural trends in relationship to varying weather conditions • Draw conclusions about how agricultural production is influenced by natural and market factors that
are often outside the control of farmers and ranchers • Investigate technologies farmers use to influence their expected yield
Standards: Next Generation Science Standards: • HS-ESS3-1: Construct an explanation based on evidence for how the availability of natural
resources, occurrence of natural hazards, and changes in climate have influenced human activity. • HS-ESS2-3: Create a computational simulation to illustrate the relationships among management of
natural resources, the sustainability of human populations, and biodiversity.
Agriculture, Food and Natural Resources (AFNR) Cluster: Agribusiness Systems Pathway Knowledge and Skill Statements: • AGC09.02: Select, research, and examine critical aspects of career opportunities in one or more
AFNR career pathways in order to gain an understanding of the breadth of occupations within this cluster.
• AGC10.04: Envision emerging technology and globalization and project its influence on widespread markets to demonstrate an understanding of technologies and trends that will impact the AFNR industry.
• AGPG01.06: Use sales and marketing principles common to agribusiness systems to accomplish AFNR business objectives
Materials Note: All ancillary materials are provided at the end of this document. • Farmland video segments
• Video Segment #1: Farming Economics: Good, Bad & Ugly: This clip discusses challenges and risks involved in farming, including the difficulty of getting started and maintaining profitability.
• Video Segment #2: The Use of GMOs: This clip discusses the use of GMOs. • Video Segment #3: The Rewards of Farming: This clip discusses the rewards to farming
despite challenges. • Teammate Brainstorm Recording Sheet handout • Major U.S. Crops from 1950-2007 (distribute or display) • Website: USDA State Fact Sheets • Weather Card Sort handout • Examples of Extreme Weather Events handout • 3-2-1 Exit Slip handout
Vocabulary • Cropland: Land that is suitable for or used for crops. According to the USDA definition, cropland
includes: • Harvested land • Land used only for pasture or grazing • Land on which crops failed or were abandoned. • Fallow land • Land used for cover crops or used for soil improvement but not pastured or grazed
• Farm: According to the USDA definition, a farm is any place from which at least $1,000 worth of agricultural commodities were produced or sold, or normally have been sold, in a year.
BACKGROUND FOR TEACHER This lesson focuses on the means and methods of conventional farming. Students may have preconceptions based on media reports or conversations about the nature of farming today. Because of farms and ranches, and modern mechanized food production, the United States has an abundance of food compared to many other countries around the world. Despite the low cost and availability of many types of food many Americans may never have visited a farm or ranch. Many Americans also harbor misunderstanding of how their food is produced.
Numerous resources are available for students to learn about agriculture. One area of focus for this lesson is the different emphasis on major agricultural products in various regions of the United States. For example, corn and wheat are key crops in the Midwest. The Southeast and Western regions of the United States produce most of the country’s fruit crops.
Regional differences emphasize the impact of weather, so the lesson helps students connect weather in a region of the United States to being a dominant influence on crop production in that region. For example, in addition to typical daily and seasonal weather, the different regions of the U.S. experience different types of severe weather events (e.g., tornado, blizzard, flood, hurricane, or drought). Although severe weather events do not occur often, they can have an economic impact on the farming and ranching industries. Agriculture, perhaps more than other industries, is impacted not only by uncertain weather, but also by various market factors. Hence the economics of farming and ranching around the United States depends on a complex mix of weather patterns, costs of fuel, feed and fertilizer, local supply and demand and even international market forces.
With such variation, farmers are increasingly turning to various technologies and techniques to make farming and ranching more predictable and hence profitable. The implementation of such technology is highly specific, depending on the nature of the product, whether meat, dairy, grain, vegetable, fruit and so on. Broadly speaking, new technologies include remote sensing, soil and crop sensing, mobile computing, genetically-modified organisms, equipment automation and precision seed or input applications. Given such use of technology to overcome the challenges of farming and ranching, commercial agriculture will continue to be among the most important of our country’s industries.
Procedure:
ENGAGE 1. Choose a student and ask them to describe the most recent meal they ate.
2. Students write in their notebooks the most recent meal they ate in the form of a list.
3. Ask students to note beside each food the where each item in the meal originated.
4. Ask students to consider generally where their food comes from and how they access food. Students may list grocery stores, restaurants, and farmers markets. Guide students to think further about food sources by asking questions such as the following: • Where do grocery stores and restaurants get their food? • Where does the food from farmers markets come from? Do the people running the market or
stalls grow it themselves? • Do we have local farms?
5. Students revise the list of the food items in their meal to state the ultimate origin, not just a supermarket or factory.
6. Explain to students that they will learn how nearly all food is produced in commercial farms and ranches.
7. Reveal misconceptions about farming and ranching by asking students to consider the statements below. Display statements one at a time and ask students to indicate if they agree or disagree with each by giving a “thumbs up” or “thumbs down.” At this time, do not indicate whether or not their responses are accurate. • Most farms and ranches are run by large corporations. • Small farms and ranches are not important to our food supply. • All Americans have access to locally produced food. • The number of Americans going into farming or ranching as a career is increasing.
EXPLORE 1. Distribute Teammate Brainstorm Recording Sheet and play Video Segment 1. As students are
watching, ask them to note (in the “I shared...” section) risks involved in farming and ranching. Students may note information from the video or ideas they think of while watching the video.
2. Group students into pairs to discuss what they observed in the video. Guide students to use their Teammate Brainstorm Recording Sheet to capture what their partner recorded. As partners are sharing, students should be writing down main ideas from their conversation. Have students share their findings with the whole group.
3. Display or distribute Major U.S. Crops from 1950-2007.
4. Ask questions to review the data then help students build understanding by asking questions, such as: • What are the major agricultural products produced in the U.S.? • What does this data tell you about agriculture in the U.S.? • What patterns do you see in the data? • Who could use this data? How could farmers and ranchers use it? • Are there any foods you commonly eat that are not major agricultural products of the U.S.?
(Remind students that this table only displays major crops.).
5. Choose a student and ask him/her to name one of the major foods produced in their state. Choose another student and ask him/her to name another food produced in their state
6. Students work in small groups to explore the website USDA State Fact Sheets to learn about the Top Agricultural Commodities in their state.
7. Students discuss whether or not the data confirmed or contradicted their initial thinking. (If it is not possible for teams to work on computers, display the page so all students can see it and examine the data as a group.)
8. Working in their groups, students investigate a state in a different region on the USDA State Fact Sheets. (Either assign states or require approval of selections so each group explores a different state.)
9. Each group identifies the Top Agricultural Commodities in its assigned state and records their findings on a map of the U.S. (e.g., placing sticky notes on a classroom map, writing on overhead transparency of map, or dragging notes to whiteboard map).
10. Groups discuss possible reasons different agricultural goods are grown or produced in different regions of the U.S. If needed, ask questions to guide students’ discussion to include typical rainfall, sunlight, soil types, pests, and weeds in each region.
11. Still working in their groups, students research a region with regard to one of these environmental variables. For example, one group might investigate rainfall, sunlight, and common pests of the Southwest, while another researches the same variables for the Northeast. (Note: If online group research is not possible, consider displaying state or regional data about some of these variables using webpages such as Average Annual Sunshine by State or Average Annual Precipitation by State. If time is limited, limit the number of variables each group explores.)
12. Distribute the Weather Card Sort to each group. Guide groups to review the types of weather and match them to how this weather could influence crop production. (Note: The cards are provided in a table as the Answer Key and will need to be cut and shuffled for students.)
13. Review and correct or confirm students’ responses. Ask students if they have experienced any of these weather patterns locally. Depending on their region, students may have experienced one or more.
14. Distribute or display Example of Extreme Weather Events to small groups of students (or search on the Internet for a similar infographic). The example provided displays a national overview of climate anomalies and events by region in July 2015. Explain that this figure organizes the U.S. into regions to look at regional trends.
15. Ask students to review the different types of anomalies and events and place their cards on regions that match.
16. Guide students in an analysis of their map using questions such as the following: • Are all weather events found across the U.S.? • Would one weather event impact all farmers in the U.S.? • How might regional weather affect which crops farmers choose to grow? • How might severe weather events impact farmers’ crops or ranchers’ livestock? • What impact might it have on consumers?
EXPLAIN
1. Groups present their findings with the whole class. Each group explains its conclusions of why some crops are grown in particular areas of the country but not others.
2. Lead a class discussion on the connections between environmental variables and the foods produced in the different regions.
ELABORATE
1. Show Video Segment 2.
2. Working in small groups, students research one use of GMOs in agriculture. Each group chooses a specific GMO (alfalfa, canola, corn, cotton, papaya, potatoes, soybeans, etc.) for further investigation.
3. Groups create a concept map to describe and explain their GMO including its particular benefits and limitations. Encourage groups to consider the economics of their GMO. An optional resource is located at GMOAnswers.com: https://gmoanswers.com/ask/what-difference-cost-production-gmo-vs-non-gmo (For example, high-yielding rice varieties may require greater inputs of fertilizer and pesticide, which could offset any increase in revenue from higher yields.)
4. Groups then consider GMOs as one of several different kinds of technologies used to increase yields and reduce economic risk. Each group researches new technologies applicable to its GMO and adds this information to their concept map. As students work, remind them to consider their data sources and identify any potential biases in the information on the site.
5. Assign students to further research new technologies outside the classroom. Students may work individually, in pairs, or in small groups. The aim is for them to explore how biological, chemical and information technologies help farmers make their industry more predictable and successful. Encourage students to consider how adoption of new technologies helps farmers and ranchers to compete in the global marketplace. To focus their research, students can review the online resources, and then choose a particular technology, crop and region to research in detail. (Advise students of the follow-up report required for evaluation.)
6. Ask students to consider why people might continue to choose farming and ranching careers despite the challenges. Play Video Segment 3. As students are watching, ask them to note (in the “I shared...” section) rewards involved in farming and ranching. Students may note information from the video or ideas they think of while watching the video.
7. Group students into pairs to discuss what they observed in the video. Guide students to use their Teammate Brainstorm Recording Sheet to capture what their partner recorded. As partners are sharing, students should be writing down main ideas from their conversation. Have students share their findings with the whole group. Students may conclude that, despite the risks, the rewards of farming and ranching are significant.
EVALUATE 1. Students complete a 3-2-1 Exit Slip on their way out. This will help students summarize their learning
and comprehension of the lesson.
2. Review the students’ 3-2-1 Exit Slips and determine if there are any questions that need to be addressed and identify areas of student interest for further study.
FOLLOW-UP As part of Evaluate, students prepare and submit a report on new agricultural technologies. Encourage students to brainstorm a suitable format for their report, whether written, digital or audiovisual (slide show, skit, science poster, web page, etc.). Students present their final report to the class. Provide students with built-in checkpoints with specific dates to meet and discuss their progress, provide assistance and create their reports. Check in at one week. After two weeks students present their completed report with answers to the following questions: • What are the top five new technologies helping farmers and ranchers to make agriculture more
predictable and successful? • What technologies can farmers and ranchers use to maximize crop yields while minimizing
environmental impacts? • What kinds of technologies and techniques are specific to your chosen crop and region to make
farming and ranching more predictable and hence profitable? • How does adoption of new and emerging technology help farmers and ranchers compete in the
global marketplace?
Resources: • United States Department of Agriculture: In the News • The Flood of 1993 • National Centers for Environmental Information: National Overview – June 2015 • Farm Industry News: 20 Technologies Changing Agriculture • Business Insider: 15 Emerging Agriculture Technologies That Will Change the World • Forbes: The Future of Agriculture? Smart Farming
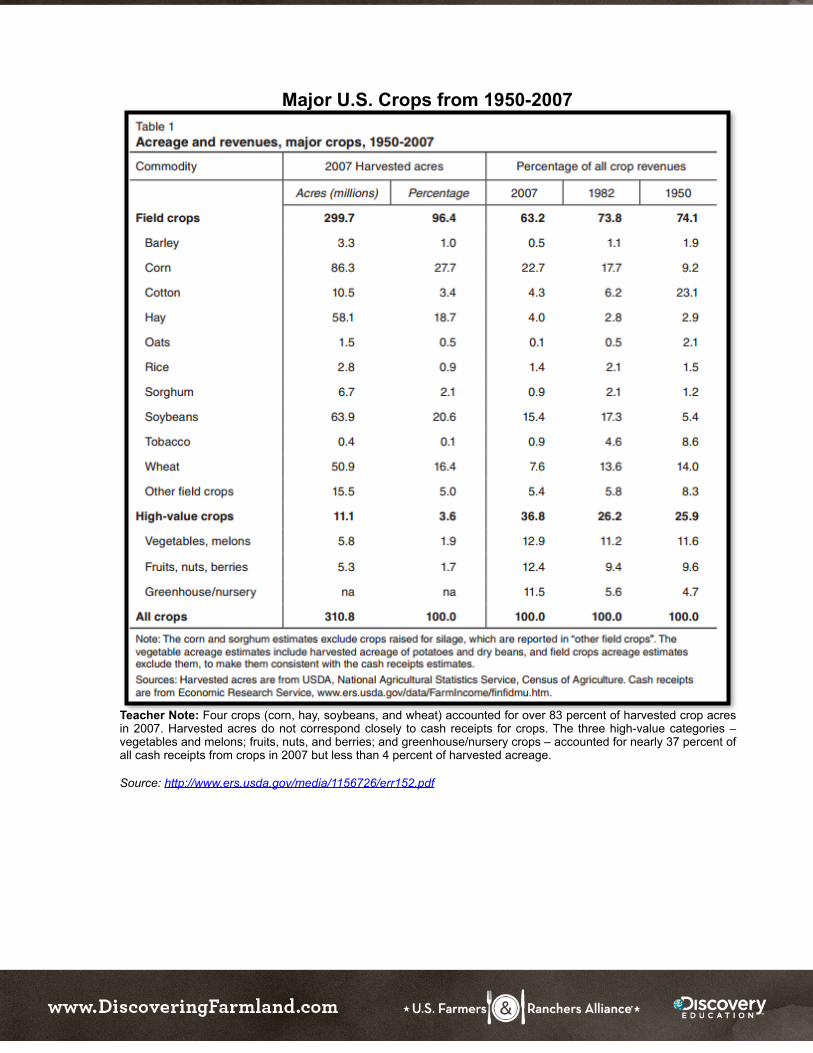
Major U.S. Crops from 1950-2007
! Teacher Note: Four crops (corn, hay, soybeans, and wheat) accounted for over 83 percent of harvested crop acres in 2007. Harvested acres do not correspond closely to cash receipts for crops. The three high-value categories – vegetables and melons; fruits, nuts, and berries; and greenhouse/nursery crops – accounted for nearly 37 percent of all cash receipts from crops in 2007 but less than 4 percent of harvested acreage.
Source: http://www.ers.usda.gov/media/1156726/err152.pdf
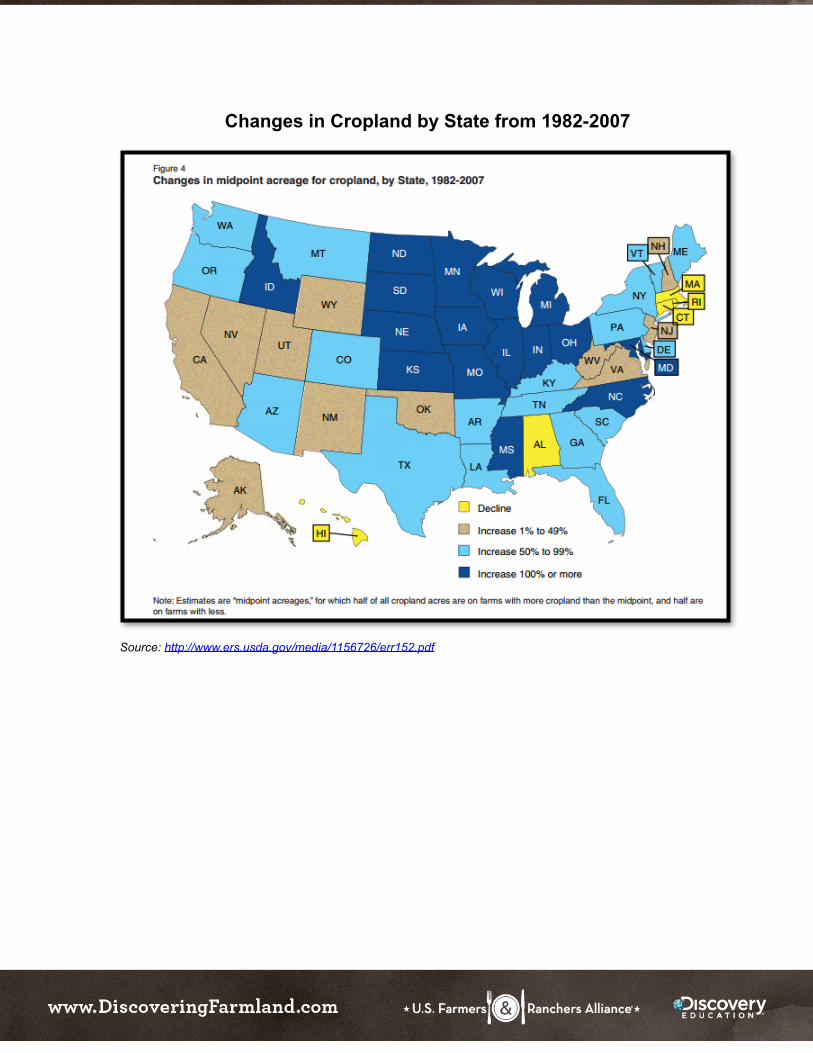
Changes in Cropland by State from 1982-2007
!
Source: http://www.ers.usda.gov/media/1156726/err152.pdf
Teammate Brainstorm Recording Sheet
RisksI shared….
________________________________________
________________________________________
________________________________________
________________________________________
________________________________________
________________________________________
________________________________________
________________________________________
________________________________________
My teammate shared…
________________________________________
________________________________________
________________________________________
________________________________________
________________________________________
________________________________________
________________________________________
________________________________________
________________________________________
Rewards

I shared….
________________________________________
________________________________________
________________________________________
________________________________________
________________________________________
________________________________________
________________________________________
________________________________________
________________________________________
________________________________________
My teammate shared…
________________________________________
________________________________________
________________________________________
________________________________________
________________________________________
________________________________________
________________________________________
________________________________________
________________________________________
________________________________________
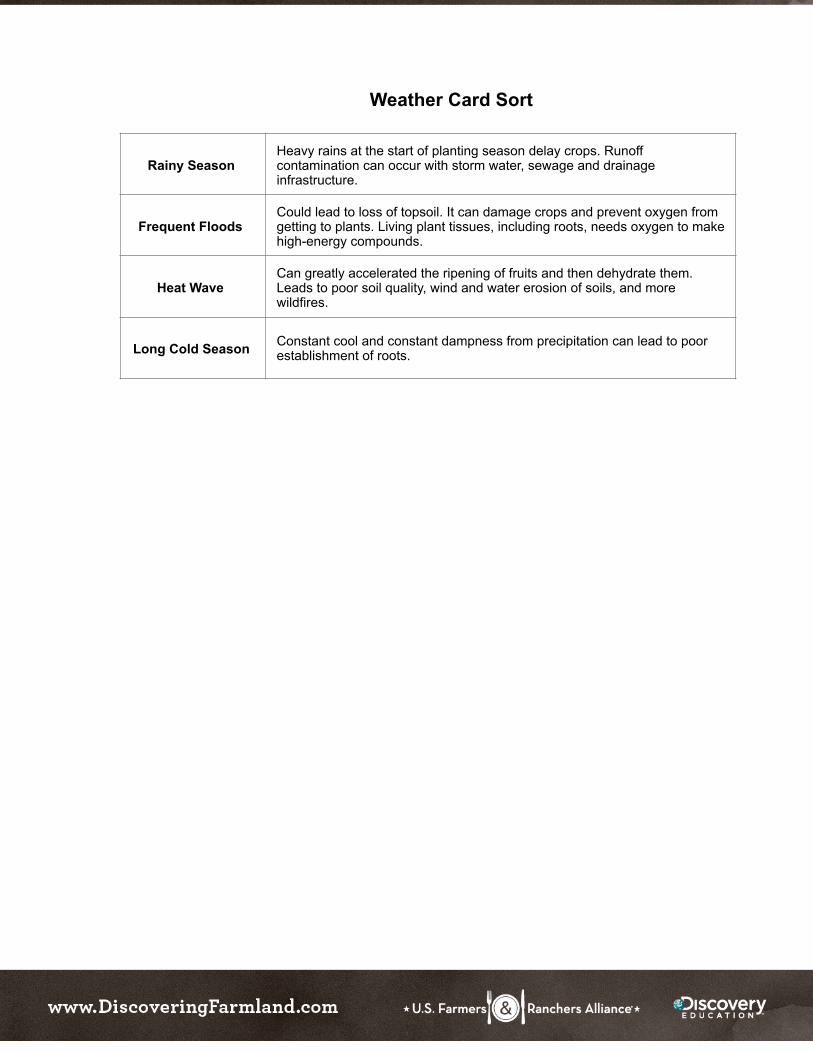
Weather Card Sort
Rainy SeasonHeavy rains at the start of planting season delay crops. Runoff contamination can occur with storm water, sewage and drainage infrastructure.
Frequent FloodsCould lead to loss of topsoil. It can damage crops and prevent oxygen from getting to plants. Living plant tissues, including roots, needs oxygen to make high-energy compounds.
Heat WaveCan greatly accelerated the ripening of fruits and then dehydrate them. Leads to poor soil quality, wind and water erosion of soils, and more wildfires.
Long Cold Season Constant cool and constant dampness from precipitation can lead to poor establishment of roots.
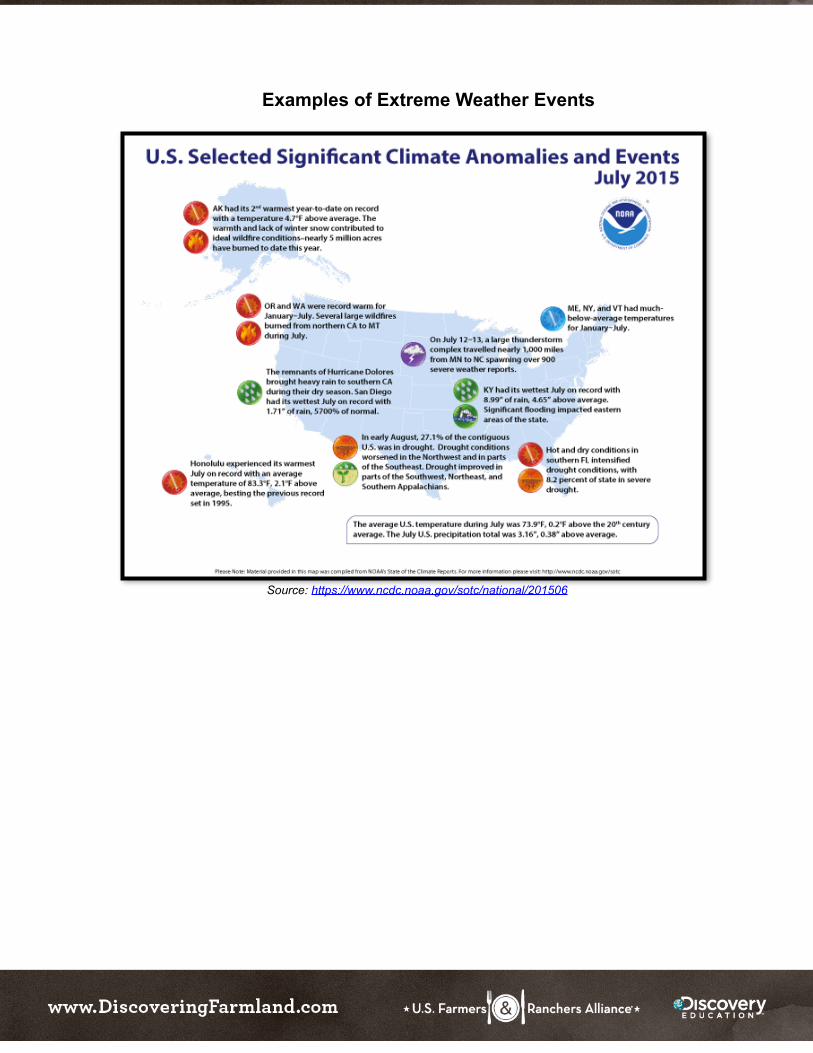
Examples of Extreme Weather Events
! Source: https://www.ncdc.noaa.gov/sotc/national/201506
3-2-1 Exit Slip
Name: _________________________________ Date: ___________ Class Period: ___
3-2-1 Exit Slip Name: _________________________________ Date: ___________ Class Period: ___
3Things I learned today:
2Things I found interesting:
1Question I still have:
3Things I learned today:
2Things I found interesting:
1Question I still have: