the inevitable policy response - pri
TRANSCRIPT

The Inevitable Policy Response: Investor Brief
- R E S P O N S I B L E I N V E S T M E N T -
The Inevitable Policy Response 2021 Forecasting and Aligning
Julian Poulter,
Head of Investor Relations, IPR
Partner, Energy Transition Advisers
https://www.linkedin.com/in/julian-poulter-98b7581/
December 2021

The Inevitable Policy Response: Investor Brief
Consortium Partners
2
This report was prepared by Vivid Economics and Energy Transition Advisors, who bear sole responsibility for any views expressed, which do not necessarily reflect those of the sponsors or other consortium members. The authors are solely responsible for any errors.
This project was commissioned by the PRI with support from:
The Inevitable Policy Response: Investor Brief
Leading financial institutions joined the IPR as Strategic Partners in 2021 to provide more in-depth industry
input, and to further strengthen its relevance to the financial industry
Core philanthropic support since IPR began in 2018. The IPR is funded in part by the Gordon and Betty Moore
Foundation through The Finance Hub, which was created to advance sustainable finance and the ClimateWorks
Foundation striving to innovate and accelerate climate solutions at scale
Who supports the Inevitable Policy Response ?

The Inevitable Policy Response: Investor Brief
4
• What is IPR?• What is in IPR FPS and 1.5C RPS that underpins investor actions?• FPS and 1.5C RPS Emission Pathways• Investor Landscape• IPR Value Drivers• IPR and PACTA• Using IPR Value Drivers to assess opportunities• IPR Across the Investment Chain• Asset Owners• Asset Managers• Service Providers
Contents
The Inevitable Policy Response: Investor Brief
5
What is IPR?
IPR is a consortium of organizations focused on developing decision-supporting forecasts aroundthe transition to a low-carbon economy. It develops both central forecasts around the transition aswell as forecasts around the nature of a potential policy ratchet. Its work is predicated on the ideathat the transition is inevitable and that forecasts are a crucial complement to previous approachesto developing climate goal optimizations without a comment on likelihood.

The Inevitable Policy Response: Investor Brief
The structure of the IPR framework
6
IPR Forecasted Policy
Scenario (FPS)
A fully integrated climate scenario
modelling the impact of the forecasted
policies on the real economy up to
2050, tracing detailed effects on all emitting sectors
IPR Value Drivers
A set of publicly available
outputs from the FPS and
1.5°C RPS that offer
significant granularity at the
sector and country level
allowing investors to assess
their own climate risk
Drivers of policy• Extreme weather
events
• Uninsurable world
• New climate research
• Impacts on security
• Civil society action
• Influence shifting
• Cheaper renewable energy
• Financial regulator warnings on stability
• New geopolitics of energy
IPR Forecast Policy Scenario (FPS)
A fully integrated climate scenario modelling the impact of the forecasted policies on the real economy up to 2050, tracing detailed
effects on all emitting sectors
IPR 1.5°C RPS ScenarioA ‘1.5°C Required Policy Scenario’(1.5°C
RPS) building on the IEA NZE by deepening analysis on policy, land use, emerging
economies, NETs and value drivers. This can be used by those looking to align to
1.5°C
IPR Policy Forecast
A high-conviction policy-based forecast of forceful
policy response to climate change and
implications for energy, agriculture and land use
IPR value driversA set of publicly available outputs from the FPS and
1.5°C RPS that offer significant granularity at the sector and country
level allowing investors to assess their own climate
risk

What is in IPR FPS and RPS that underpins investor actions?
7

The Inevitable Policy Response: Investor Brief
8
• In OECD countries, emissions reductions are rapid due to 2050 net
zero targets.
• Total (energy and land) CO₂ emissions countries fall from around 12
Gt in 2020 to 9 in 2030 and near zero in 2050, with virtually no
international offsets required
• In non-OECD countries, emissions reductions are slower due to
rapid growth in energy demand, later net zero targets in China,
India and Brazil, and lack of net zero targets elsewhere
• Total CO₂ emissions rise in the 2020s and fall back to 2020 levels of
30 Gt by 2030, before declining substantially and falling to 8 Gt in
2050
0
5
10
15
20
25
30
35
2020 2025 2030 2035 2040 2045 2050
GtC
O₂
Total CO₂ emissions, OECD
EU USA UK Other OECD
0
5
10
15
20
25
30
35
2020 2025 2030 2035 2040 2045 2050
GtC
O₂
Total CO₂ emissions, non-OECD
China India Brazil
Russia MENA Southeast Asia
Central and South America Other non-OECD
IPR FPS 2021: Total CO₂ emissions (on a production basis) reach near zero in OECD countries, though remain substantial in non-OECD countries

The Inevitable Policy Response: Investor Brief
9
Example key sector analysis - Global coal phase out
Phase out of existing unabated coal
2020 2025 2030 2035 2040 2045 2050 2055 2060 RPS FPS
AU RPS FPS 10% 5%
BRA RPS FPS 7% 4%
CAN RPS FPS 20% 10%
CHI RPS FPS 7% 4%
CSA RPS FPS 7% 4%
EEU RPS FPS 10% 5%
EURA RPS FPS 4% 3%
GCC RPS FPS 4% 3%
IND RPS FPS 4% 3%
INDO RPS FPS 4% 3%
JAP RPS FPS 7% 4%
MENA RPS FPS 4% 3%
RU RPS FPS 4% 3%
SA RPS FPS 4% 3%
SAF RPS FPS 7% 5%
SEAO RPS FPS 4% 3%
SK RPS FPS 7% 4%
SSA RPS FPS 4% 3%
UK Both 20% 20%
USA RPS FPS 10% 7%
WEU RPS FPS 10% 5%
* reduction in coal generation as a share of 2020 levels
Timeline annual reduction*

The Inevitable Policy Response: Investor Brief
10
Ending deforestation by 2025 in 1.5°C RPS will require immediate policy action
Deforestation of natural forest
halted through strong and effective
command and control policy
Carbon pricing and NDC
commitments combine to
stop net deforestation
by 2030
Countries/region like CAN, GCC, JAP,
SA, SK, UK have virtually zero net
deforestation

IPR FPS and 1.5°C RPS Emissions pathways
11

The Inevitable Policy Response: Investor Brief
IPR FPS 2021 total (energy and land) CO₂ emissions fall from around 40 Gt in 2020 to 8 Gt in 2050, with the land sector becoming a net carbon sink before 2050
• Total CO₂ emissions fall from around 40 Gt in 2020 to 8 Gt in 2100
• This fall is driven by reduction in emissions across both energy and land
• Energy sector emissions fall from around 34 GtCO₂ in 2020 to 9 GtCO₂ in 2100
• Land sector emissions fall from around 6 GtCO₂ in 2020 to zero in 2045
• Beyond 2045 the land sector becomes a net carbon sink and removes around 1 GtCO₂ per year by 2050
-5
0
5
10
15
20
25
30
35
40
45
2020 2025 2030 2035 2040 2045 2050
GtC
O2
Total CO₂ emissions
Energy and industrial processes Land FPS Total
12

The Inevitable Policy Response: Investor Brief
• Between 2020 and 2030, energy-related CO₂ emissions fall only slightly, as new policies begin to take effect
• By 2035 emissions are comparable to the IEA Announced Pledges Case (APC)
• Over this period emissions are well above those in IEA Sustainable Development Scenario (SDS), which represents immediate climate action
• From around 2035, emissions fall well below APC levels as more ambitious IPR 2021 forecast policies take effect
• By around 2045, emissions are line with those in IEA SDS
0
5
10
15
20
25
30
35
40
2020 2025 2030 2035 2040 2045 2050
GtC
O₂
Energy and industry CO₂ emissions
IEA STEPS
IEA APC
IEA SDS
IPR FPS 2021
* Data on IEA CO2 pathways are published in 5-year intervals ** IPR FPS 2019 was modelled in 5-year incrementsNote: IEA scenario data based on May 2021 Net Zero Emissions report; in WEO2021, IEA APC is renamed Announced Pledges Scenario (APS), with a slightly modified emissions pathway
IPR FPS 2021 energy related CO₂ emissions vs IEA APC and IEA SDS
13
IEA CO2 pathway published for 5 year
intervals; interpolation may not reflect
difference with FPS

The Inevitable Policy Response: Investor Brief
14
• IPR 1.5°C RPS cumulative CO₂ emissions are around 30% below IPR FPS 2021 levels between 2020 and 50
• IPR 1.5°C RPS emissions fall around 35% between 2020 and 2030, compared to 13% under the IPR FPS 2021
• By 2030 IPR 1.5°C RPS emissions are 8 GtCO₂ lower than IPR FPS 2021, and are below zero by 2050
-5
0
5
10
15
20
25
30
35
40
45
2020 2025 2030 2035 2040 2045 2050
GtC
O₂
Total CO₂ emissions
IPR FPS 2021 IPR 1.5°C RPS
Relative to the IPR FPS 2021, total CO₂ emissions (land and energy) in the IPR 1.5°C RPS decline rapidly, and are below zero by 2050
The Inevitable Policy Response: Investor Brief
15
IPR 1.5°C RPS Emissions Reduction Table
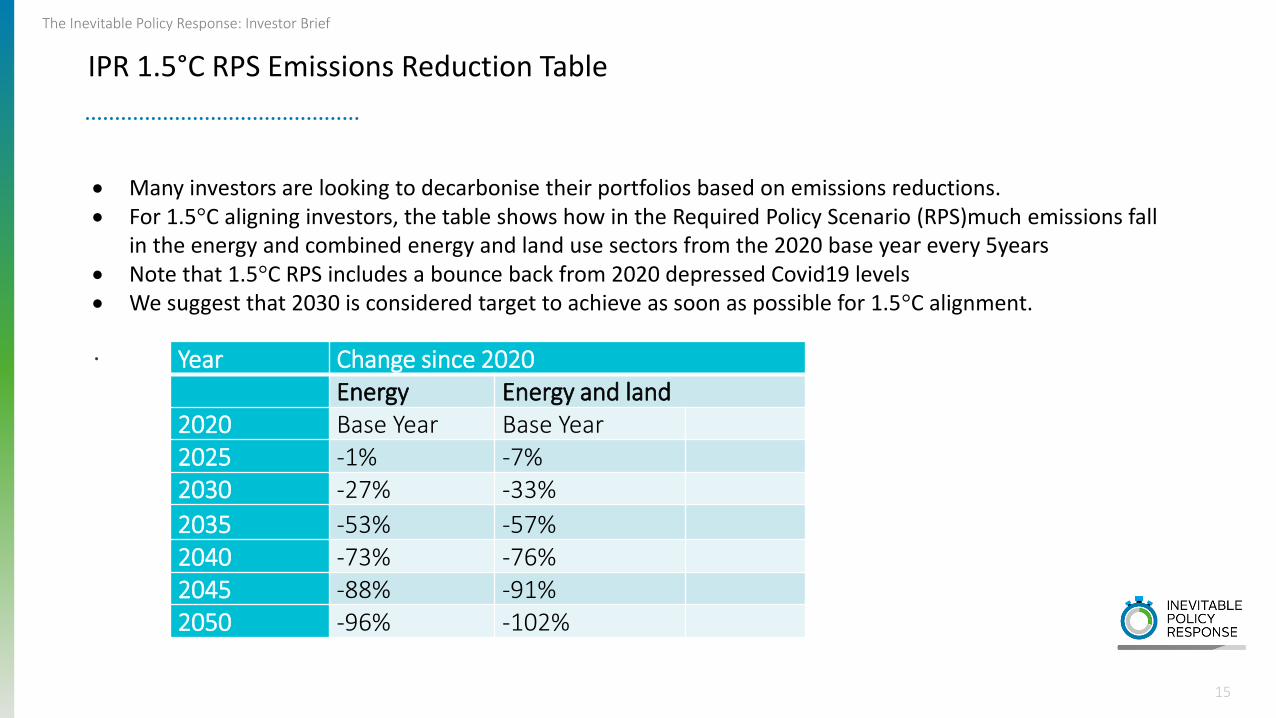
Year Change since 2020Energy Energy and land
2020 Base Year Base Year2025 -1% -7%2030 -27% -33%
2035 -53% -57%2040 -73% -76%2045 -88% -91%2050 -96% -102%
• Many investors are looking to decarbonise their portfolios based on emissions reductions.• For 1.5°C aligning investors, the table shows how in the Required Policy Scenario (RPS)much emissions fall
in the energy and combined energy and land use sectors from the 2020 base year every 5years• Note that 1.5°C RPS includes a bounce back from 2020 depressed Covid19 levels• We suggest that 2030 is considered target to achieve as soon as possible for 1.5°C alignment.
.

The Inevitable Policy Response: Investor Brief
16
Our analysis allows us to pinpoint the actions needed in key sectors to achieve an outcome consistent with 1.5°C
• We assume carbon prices to be similar to IPR FPS 2021 levels, as the extremely rapid transition required to achieve IPR 1.5°C RPS will be challenging to achieve through carbon pricing mechanisms beyond what is already expected in the IPR FPS 2021
• Instead, what drives the additional impact of the IPR 1.5°C RPS is performance standards (bans) or more direct subsidies driven by policymakers
• These further policies would need to be announced as quickly as possible, certainly by the 2023 Paris stocktake
• Implementation is required immediately upon announcement
Policy methodology for the IPR 1.5°C RPS

Investor Landscape
17

The Inevitable Policy Response: Investor Brief
The transition is well underway! Investment Performance since IPR launched at PRI In Person in 2018
18
Equities Debt Infrastructure

The Inevitable Policy Response: Investor Brief
Type of investment approach in relation to climate change
From a portfolio perspective, we can categorise approaches into four groups:
1. The price takers – happy to roll the dice in the market and hope for the best. Broad passive benchmarks
unlikely to optimise risks and opportunities.
2.The stress-testers (eg NGFS, RPS, NZE) – prepared to look at the risks of temperature-constrained scenarios
but mostly seeing low probability for anything that might impact their portfolio short to medium term.
Sometimes driven by regulatory compliance. Evidence suggests often little action as a result so far.
3.The aligners (eg NZAoA) – committed to long-term targets such as the Paris Agreement and Net Zero by
2050. There are a small numbers of these “leaders” but as yet few have fully aligned. Some funds
approaching this initially via fossil fuel divestment.
4.The forecasters – active investors looking for risks and opportunities who are open to a higher probability
scenario like IPR’s Forecast Policy Scenario, and mitigating at an early stage. These are what might be termed
the main stream investors who need an economic/regulatory reason to act, but if they do so, could shift large
amounts of capital
19
In practice, many investors are employing some or all of these together!

The Inevitable Policy Response: Investor Brief
How IPR fits each investment approach
IPR FPS 1.5°C RPSPassive Equity Investment for broad benchmark
• Engagement only strategy• Difficulty in finding upside opportunities is leading
investors to other asset classes• Changing to FPS – like benchmark
• Engagement only strategy• Could find upside opportunities in other asset classes• Change to an RPS benchmark
Stress Testers • Still a significant departure from BAU • Severe outcomes. Allocated low probability for many investors. Significant portfolio shifts rare
Net Zero Alignment • Can use FPS as a realistic step towards the ambition.• Mitigation against IPR will lower portfolio emissions• Maintains risk-return focus
• Interim 2025 and 2030 targets rely on policy settings for return
• Risks of underperformance if policy doesn’t materialise• Relies heavily on company engagement if there are regulatory
or internal barriers to active management• Major loss of diversification and associated increase in
concentration risk• Criteria for divestment may not capture transitioning
companies
IPR Forecasting • Looking to maximise risk-return and opportunities• Doing portfolio construction• Not limited by tracking error / broad benchmarks
n/a

The IPR value Drivers
21

The Inevitable Policy Response: Investor Brief
22
The Value Drivers Database Explained
The IPR Value Drivers database is the largest and most comprehensive in the world enabling direct input into investor valuation models
• Data summary:o All major jurisdictions coveredo Annualised datao Emissions by GHG typeo Investment by technology type by jurisdiction by sectoro Power Demand by fuel type by jurisdictiono All major sectors coveredo Huge Land Use componento Price data derivedo Macro-economic assumptions
• Unique data
• Designed in collaboration with IPR Strategic Partners and research partners
• Will facilitate opportunity to build new wave of product
• Hundreds of thousands of data points
The Inevitable Policy Response: Investor Brief
Integration of IPR FPS Value Drivers
23
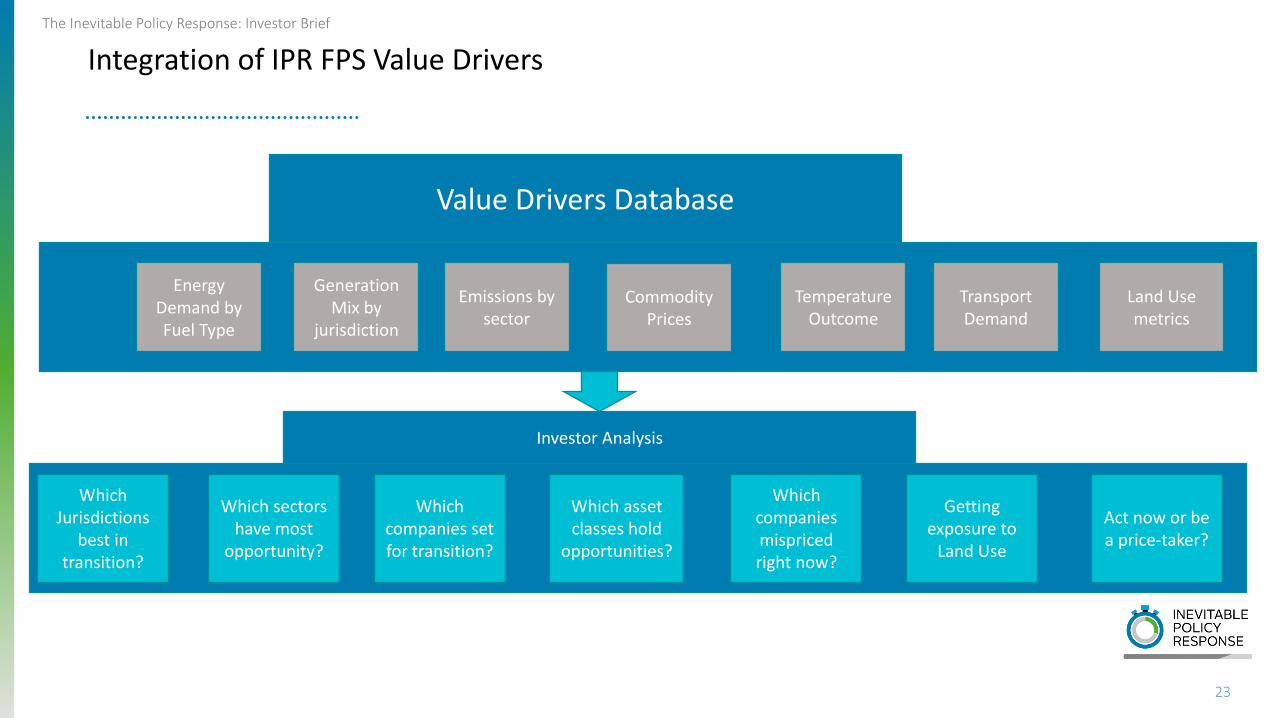
Value Drivers Database
Energy Demand by Fuel Type
Generation Mix by
jurisdiction
Emissions by sector
Which Jurisdictions
best in transition?
Which companies set for transition?
Which asset classes hold
opportunities?
Which companies mispriced right now?
Commodity Prices
Temperature Outcome
Which sectors have most
opportunity?
Transport Demand
Land Use metrics
Getting exposure to
Land Use
Act now or be a price-taker?
Investor Analysis

The Inevitable Policy Response: Investor Brief
Example Use of Value Drivers
24
Value Drivers Database
Sector Analysis
Classify low carbon
opportunities by asset class
Drive company analysis
Build Indices
Drive active
portfolio design
Re-allocate to PE / Infra / real assets?
Company selection / weighting
Build ETFs

The Inevitable Policy Response: Investor Brief
IPR and Sector Analysis – Example process from IPR 2019
25

The Inevitable Policy Response: Investor Brief
IPR and Sector Analysis – Example use of value drivers from IPR 2019
26

The Inevitable Policy Response: Investor Brief
IPR and Sector Analysis – Example use of value drivers from IPR 2019
27

The Inevitable Policy Response: Investor Brief
28
Example use of value drivers into asset class analysis
The Inevitable Policy Response: Investor Brief
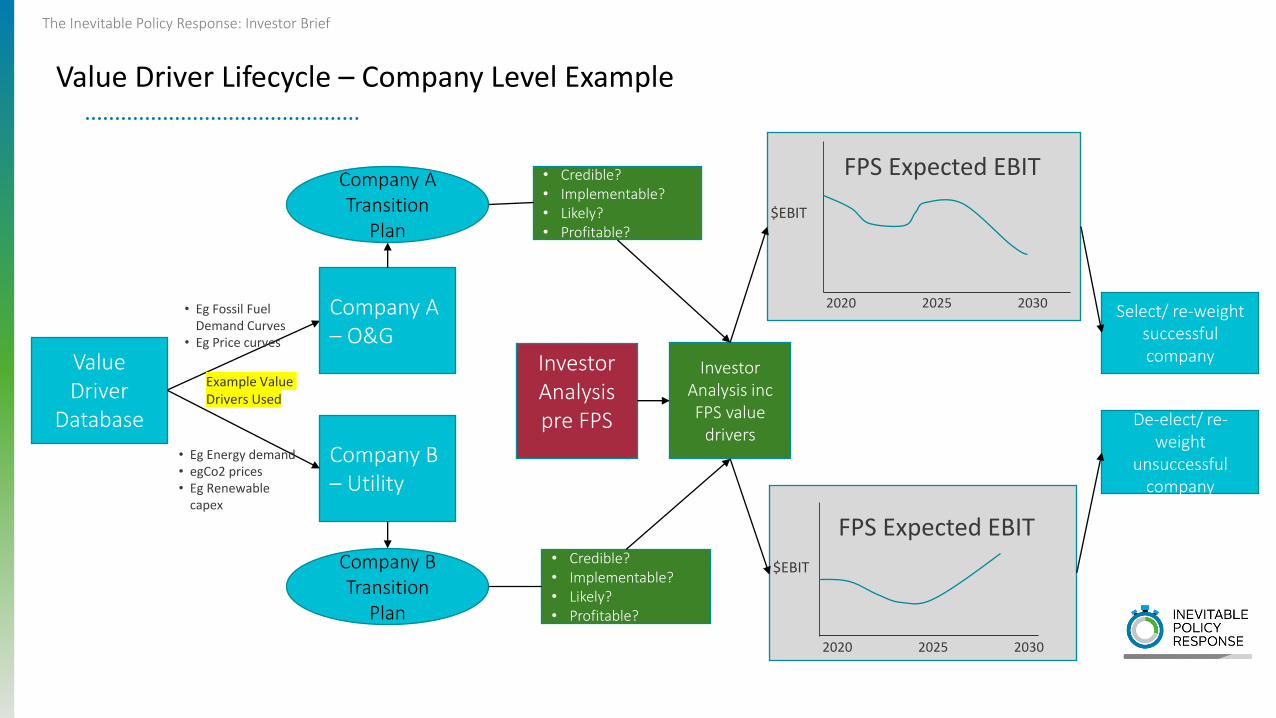
Value Driver Lifecycle – Company Level Example
Value Driver
Database
Company A – O&G
Company B – Utility
• Eg Fossil Fuel Demand Curves
• Eg Price curves
• Eg Energy demand• egCo2 prices• Eg Renewable
capex
Investor Analysis pre FPS
Company A Transition
Plan
Company B Transition
Plan
• Credible?• Implementable?• Likely?• Profitable?
• Credible?• Implementable?• Likely?• Profitable?
Investor Analysis incFPS value
drivers
2020 2025 2030
$EBIT
FPS Expected EBIT
2020 2025 2030
$EBIT
FPS Expected EBIT
Select/ re-weight successful company
De-elect/ re-weight
unsuccessful company
Example Value Drivers Used
The Inevitable Policy Response: Investor Brief
PACTA and the new Transition Disruption Metric
TDM based in the FPS (Forecast Policy Scenario) scenario developed by IPR
30

The Inevitable Policy Response: Investor Brief
PACTA Transition Disruption Metric (TDM)
31
• The TDM metric is complementary to the PACTA alignment model. If an investor wants to mitigate the policy
risk would need to move ahead of the FPS-IPR scenario.
• The metric measures the adjustments needed in the portfolio from year 6 to 10 (2026 - 2030) relative to
portfolio's pace in the first 5 years (2021-2025), in order to be in line with the FPS scenario by the end of
2030.
• The higher the number, the higher the likely portfolio disruption in the medium-term.
• If investors want a smooth transition to the scenario, they should start adjusting or engaging with companies
at a faster or slower pace according to their results.
• The metric creates a quantitative measurement of potential disruption based on how far the portfolio lags /
leads the FPS scenario in the first 5 years. The indicator will be available at technology, and portfolio level,
subject to scenario and data availability.

The Inevitable Policy Response: Investor Brief
Transition Disruption Metric
32
Visual representation of the
TDM*
● Full mitigation (0): The portfolio is ahead of the FPS scenario
pathway.
● Managed mitigation (from 0 to 1): Residual disruption
consistent with the effort in years 1 to 5. Over 1, suggests
that the portfolio needs to accelerate the transition relative
to its current capital stock evolution projections, but this
acceleration is in line with historical growth rates of the
sector.
● Managed disruption (1 to 2): is in line with the FPS
acceleration which involves some disruption that is still
manageable.
● Unmanaged or high disruption (over 2): An unmanaged or
high disruption suggests the portfolio is already lagging the
FPS scenario benchmark and will involve significant
unmanaged disruption over the next decade if / when the
FPS scenario materializes.
* This visual representation should be considered as an example given that the metric is under construction and may have slight variations.
Period of analysis: 10 years Start year of analysis: 2021
See: https://2degrees-investing.org/resource/pacta/

Using IPR Value Drivers to assess opportunities
33

The Inevitable Policy Response: Investor Brief
IPR FPS 2021 - Example Capital Shift Opportunities
34
0
100
200
00
400
00
00
00
00
00
2021
202
202
202
202
20 1
20
20
20
20
2041
204
204
204
204
billion
Capital investment electricity genera on( OR D)
ydrogen
O shore ind
Onshore ind
Solar
ydro
uclear
iomass CCS
iomass
atura l gas CCS0
10
1
20
2
0
2021
202
202
202
202
20 1
20
20
20
20
2041
204
204
204
204
billion
Capital investment: ne hea ng systems
ydrogen
eat pump
Res is ve
iomass
District heat
Oi l
atura l gas
Coal
0
20
40
0
0
100
120
billion
Capital investment: ne Truc s ( SA)
2
E
P E
ICE
0
200
400
00
00
1000
1200
2020
2021
2022
202
2024
202
202
202
202
202
20 0
20 1
20 2
20
20 4
20
20
20
20
20
2040
2041
2042
204
2044
204
204
204
204
204
20 0
CAPE
(billion SD
2020)
FPS S cumula ve CAPE investment
Forest restore Forest plant Forest avoid Peat res tore
angrove restore Cropland improve Pasture improve
The Inevitable Policy Response: Investor Brief
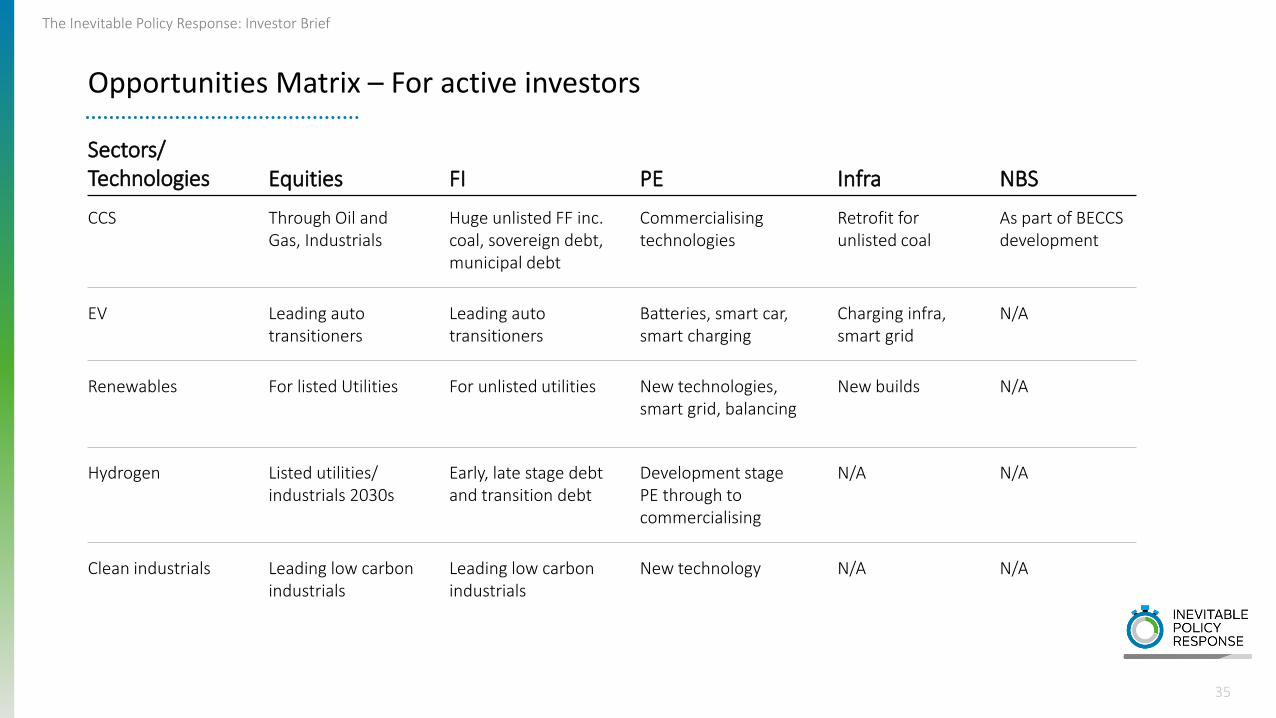
Opportunities Matrix – For active investors
Sectors/ Technologies Equities FI PE Infra
CCS Through Oil and Gas, Industrials
Huge unlisted FF inc. coal, sovereign debt, municipal debt
Commercialising technologies
Retrofit for unlisted coal
As part of BECCS development
EV Leading auto transitioners
Leading auto transitioners
Batteries, smart car, smart charging
Charging infra, smart grid
N/A
Renewables For listed Utilities For unlisted utilities New technologies, smart grid, balancing
New builds N/A
Hydrogen Listed utilities/ industrials 2030s
Early, late stage debt and transition debt
Development stage PE through to commercialising
N/A N/A
Clean industrials Leading low carbon industrials
Leading low carbon industrials
New technology N/A N/A
NBS
35

The Inevitable Policy Response: Investor Brief
Getting Exposure to the Land Use Elephant
36
Forest Conservation and Reforestation Improved Land Management Food Production Innovation & Technology
Equities • Deforestation-free commodities and supply chains
• Deforestation-free agribusiness
• Improved performance in Timberland REITS• Improved performance in agribusiness
companies
• As retail adoption emerges
Debt • Deforestation-free commodities and supply chains
• Deforestation-free agribusiness • Reforestation / afforestation
• Financing for improved performance in Timberland REITS
• Financing for improved performance in agribusiness companies
• Commercialisation
Infrastructure & Energy
• Integrate forest conservation and reforestation into infra and energy projects
n/a n/a
Real Assets • Reallocate to forestry asset class with high sustainability performance
• Opportunities to invest in carbon markets integrated with forestry investment
• Reallocate to forestry asset class with high sustainability performance
• Reallocate to agriculture with high sustainability performance
• Opportunities to invest in forest and soil carbon markets integrated with forestry and agricultural investment
• Reallocate unused pasture and grazing land toward climate-positive forestry and climate-positive agriculture
PE • Investment in technology supporting scaling of conservation and reforestation
• Investment in technology supporting scaling of improved land management and soil carbon management
• Investment in circular bioeconomy technologies (e.g. mass timber) replacing cement, steel, and plastics
• Significant opportunities across the value chain

The Inevitable Policy Response: Investor Brief
Highlighting FPS opportunities to 2030 – The Core Investor Timeframe
37
• Developed country deepest decarbonisation to 2030 represents biggest opportunities
• Early positioning by investors from 2025 in developing and emerging economies to take advantage
of opportunities
• Stronger forecasts in industrials implying leadership opportunities in steel and cement
• Investor Gas transition story opportunity not born out by FPS post 2025
• Investors should beware unlisted coal debt with possible sovereign / local debt implications
• Continued strong opportunities in solar and wind (particularly US and China) – within Infra / PE or
will utility balance sheets be the opportunity.
Very significant opportunities in Land Use – especially forestry

IPR Across the Investment Chain
38
The Inevitable Policy Response: Investor Brief
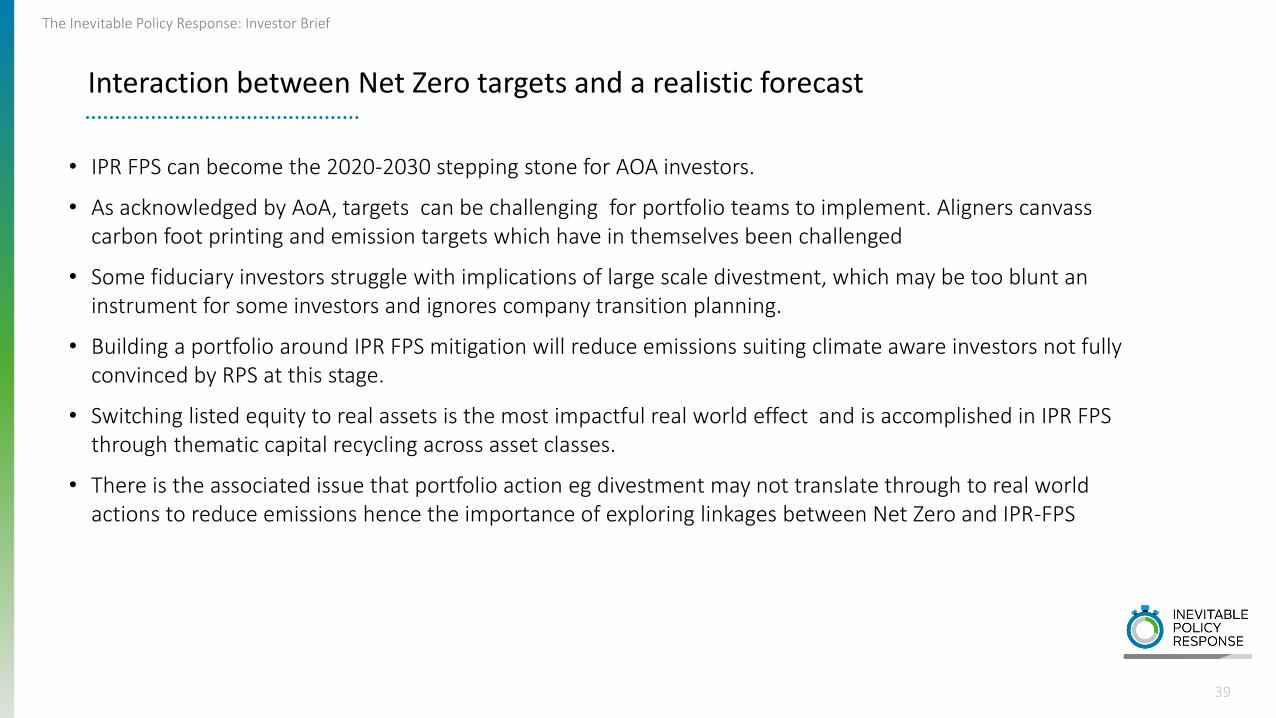
Interaction between Net Zero targets and a realistic forecast
39
• IPR FPS can become the 2020-2030 stepping stone for AOA investors.
• As acknowledged by AoA, targets can be challenging for portfolio teams to implement. Aligners canvass carbon foot printing and emission targets which have in themselves been challenged
• Some fiduciary investors struggle with implications of large scale divestment, which may be too blunt an instrument for some investors and ignores company transition planning.
• Building a portfolio around IPR FPS mitigation will reduce emissions suiting climate aware investors not fully convinced by RPS at this stage.
• Switching listed equity to real assets is the most impactful real world effect and is accomplished in IPR FPS through thematic capital recycling across asset classes.
• There is the associated issue that portfolio action eg divestment may not translate through to real world actions to reduce emissions hence the importance of exploring linkages between Net Zero and IPR-FPS

The Inevitable Policy Response: Investor Brief
Absorb IPR
Prefer to align with 1.5C RPS
Asset Owners
Asset Managers / Internal AO Portfolio Teams
Report base case via
TCFD
Modify Assumptions
FPS Active Opportunities
Greater dispersion of returns under 1.5c RPS
Implies faster reduction of FF exposure
Actively Integrate to
portfolio construction
approach
Build in-house outputs for own assumptions or modify IPR (use service provider
if necessary)
Agree with IPR FPS
Assumptions
Move to Full Adoption
Take Value Drivers
Conduct PACTA Technology Alignment
Take Value Drivers
IPR Investor Integration
FPS
RPS
40
New Product
Forecasting pathway
NZ Aligning pathway

The Inevitable Policy Response: Investor Brief
Dynamics of the investment chain
Asset Owners
• Board approval for thematic strategy
• Asset Re-allocation
• Manager selection criteria
• Forward looking mandate structures
• Passive/ active split
• Service provider alignment-consultants
• Recycle capital
• Engagement base case
• Build Indices / ETFs
• Engage with companies
• Engage with policymakers
• Underweight high carbon exposures
• Reward Strong transitioning companies
• Seek low carbon pure-plays eg infra / PE/ small caps
• Service provider alignment
Asset Managers / Internal AO Portfolio Teams
New Product
Demand for product
Incentives to price reality
41

The Inevitable Policy Response: Investor Brief
From Asset Allocation to Company Analysis
Optimal Carbon Risks / opportunities
strategy
MANAGER SELECTION
Asset Owners Asset ManagersThe challenge for Product Development
Example Challenge: How do you deal with a utility in
transition that might be the most emissions intensive
company in its country but also the largest investor in
clean energy?42
The Inevitable Policy Response: Investor Brief
Companies in Transition - The Challenge for Product Development
43
• As companies go into transition it is a challenge to then decide if they are in effect going to be low carbon and so should be considered as eligible for low carbon investment. Possible approaches include:
o Credible Net Zero targets e.g. via SBTi
o Bottom up company analysis which is extremely complex
• Capacity and knowledge takes time to build and is scarce in the market
• Asset Owners sometimes slow to recognise need for new product
• Track record unavailable for new product
• Tracking error barriers exist in some asset owners
• Index providers will take time to create new benchmarks

The Inevitable Policy Response: Investor Brief
Macro-economic Capital Market Assumptions issues for investors
44
• GDP, Inflation and interest rates are important for both asset owners and asset managers
• IPR FPS does not forecast significant GDP reductions. Indeed FPS cannot be realistic with large GDP losses as we do not believe governments will create recessionary policies to solve climate change
• We believe that central banks and governments will stimulate to counter any depressionary policy outcomes
• The tension that central banks face in setting interest rates will be between fighting the inflationary and recessionary pressures of the transition, especially in the next decade
• Our macroeconomic analysis indicates that the relatively modest magnitude of inflationary/ recessionary pressures means central banks can manage successfully and generally keep interest rates a bit lower in the near term (to fight recessionary pressure) while pushing interest rates back up to then fight inflationary pressure

The Inevitable Policy Response: Investor Brief
FPS results 2030: Climate change transition would produce mild negative impacts in most economies over the next decade
45
Impacts by 2030:
• 20 out of 21 countries/regions experience lower GDP in FPS compared to the baseline.
• For the majority of economies by 2030 the carbon tax and the abatement shocks have a negative impact on the economy compared to the baseline whilst the fiscal shock has an offsetting impact.
• Inflation is slightly higher in the FPS compared to the baseline for 2/3 of the economies
• All countries would see higher nominal long term interest rates in FPS compared to baseline. This is the result of inflationary pressures and increments in real interest rates in FPS compared to baseline.
• Most developing countries/regions see further depreciation (compared to baseline) in their exchange rates under FPS with limited impact through exports and GDP.
• Most economies would see minimal unemployment rate differences between FPS and baseline.

The Inevitable Policy Response: Investor Brief
46
IPR – macroeconomic impact value drivers:
• GDP
• Inflation rate
• Fossil Fuel Prices
• Long term interest rate
• Policy Interest Rate
• Unemployment rate
• Real personal disposable income
• Private sector investment
• Government investment
• Government debt
• House prices
• Effective exchange rate
The Inevitable Policy Response: Investor Brief
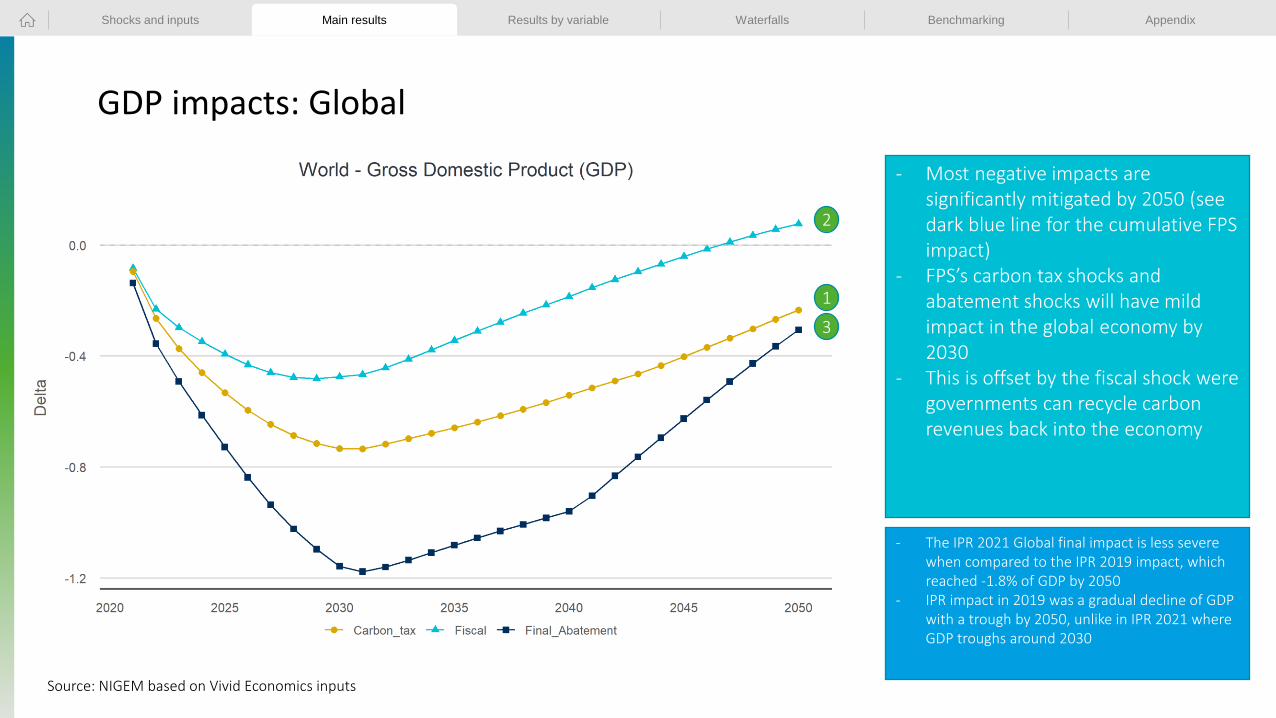
GDP impacts: Global
1
2
3
IPR – macroeconomic impacts
Source: NIGEM based on Vivid Economics inputs
- Most negative impacts are significantly mitigated by 2050 (see dark blue line for the cumulative FPS impact)
- FPS’s carbon tax shocks and abatement shocks will have mild impact in the global economy by 2030
- This is offset by the fiscal shock were governments can recycle carbon revenues back into the economy
- The IPR 2021 Global final impact is less severe when compared to the IPR 2019 impact, which reached -1.8% of GDP by 2050
- IPR impact in 2019 was a gradual decline of GDP with a trough by 2050, unlike in IPR 2021 where GDP troughs around 2030
Shocks and inputs Main results Results by variable Waterfalls Benchmarking Appendix
The Inevitable Policy Response: Investor Brief
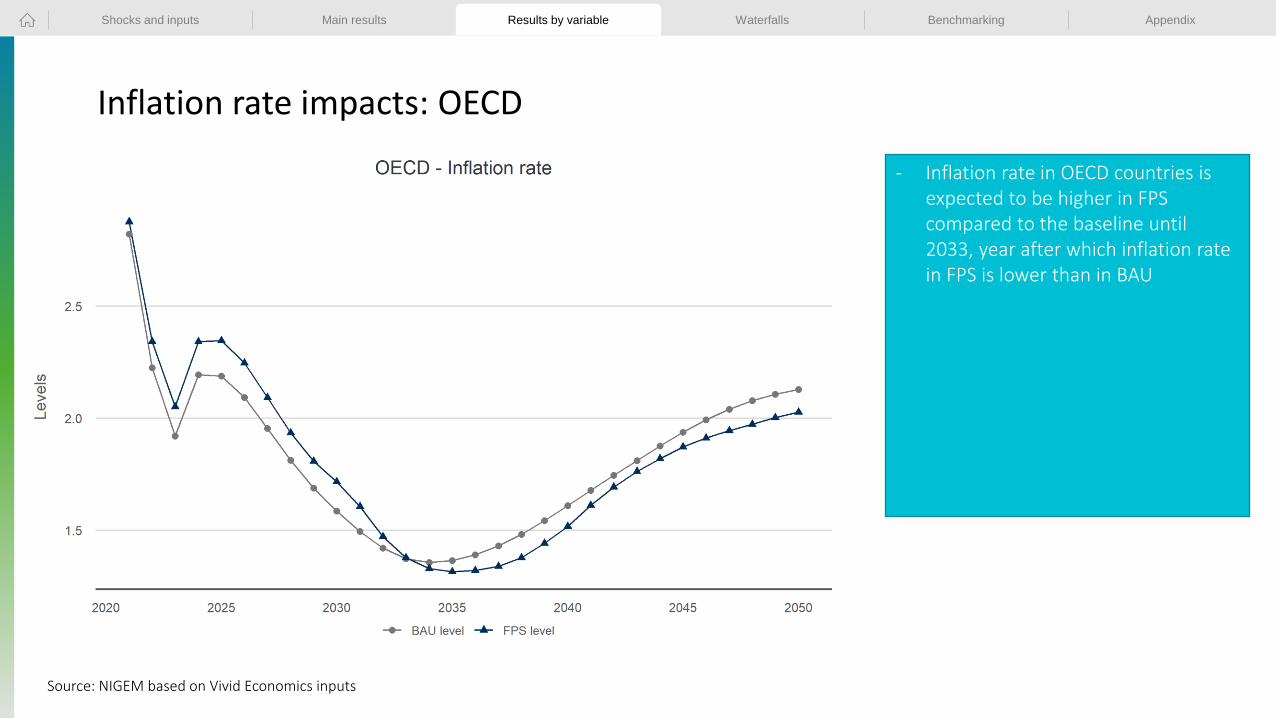
Inflation rate impacts: OECD
IPR – macroeconomic impacts
Source: NIGEM based on Vivid Economics inputs
- Inflation rate in OECD countries is expected to be higher in FPS compared to the baseline until 2033, year after which inflation rate in FPS is lower than in BAU
Shocks and inputs Main results Results by variable Waterfalls Benchmarking Appendix
The Inevitable Policy Response: Investor Brief
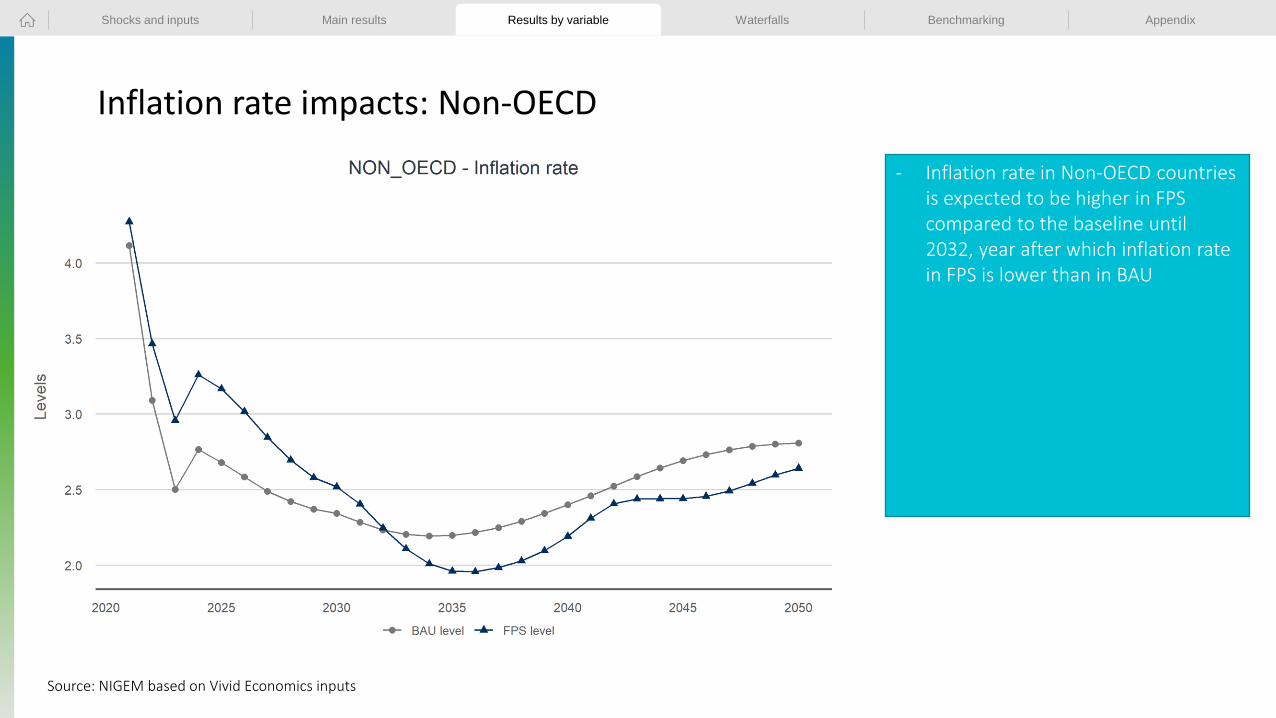
Inflation rate impacts: Non-OECD
IPR – macroeconomic impacts
Source: NIGEM based on Vivid Economics inputs
- Inflation rate in Non-OECD countries is expected to be higher in FPS compared to the baseline until 2032, year after which inflation rate in FPS is lower than in BAU
Shocks and inputs Main results Results by variable Waterfalls Benchmarking Appendix

Asset Owners
50

The Inevitable Policy Response: Investor Brief
How does IPR help the governance of asset owners to drive capital shift?
51
• IPR creates a framework for response to the risks and opportunities
• With so many variables and uncertainties in the energy transition, clarity via a more likely scenario is key
• Significant risk-return advantages for successful navigation by active investors
• IPR FPS 2021 creates a material risk-based approach based on “reality” rather than climate targets
• Credible, long term framework, liked by regulators and peer investors for its realism
• Flows into portfolio construction and manager selection
The Inevitable Policy Response: Investor Brief
Asset allocators serious about climate must take a thematic approach
52
• Climate transition risks and opportunities need to be understood across traditional asset classes
• Huge difference in expected return between sector winners and losers
• Flexible portfolio construction approaches required - Many opportunities emerging in PE, Infra and real asset classes.
• Asset Owners should question traditional Strategic Asset Allocation process, often advised by Consultants.
• Asset Manager selection key
• Asset Owners must incentivize and reward Asset Managers constructing new products to meet these demands.
• Optimisers based on Modern Portfolio Theory are frequently used. The problem is that they tend to take historic returns and historic risk (measured by Standard Deviation of returns) which does not suit a forward-looking structural change like IPR. Risk is not just volatility.

The Inevitable Policy Response: Investor Brief
Link between engagement and a Portfolio construction emphasis
53
• Passive investors on broad benchmarks can engage companies using IPR FPS 2021 to make their strategies reflect the energy transition. Resulting company transition plans can be assessed through an IPR lens.
• Rewarding and incentivizing companies with credible transition strategies. Using forward looking company plans to assess valuation will become key.
• If an investor doesn’t see the necessary transition in companies by the forecast acceleration, then taking portfolio action makes sense for risk reasons.
• For some asset owners, capital recycling into low carbon assets across asset classes themselves might seem more attractive than betting on high carbon companies acting fast enough, particularly with only a short time to a major acceleration

The Inevitable Policy Response: Investor Brief
The portfolio carbon switch by asset class
54
Before After (including companies in transition)
$$ allocation
Re-allocate & recycle
Infrastructure
Real Estate
Private Equity
MSCI Equities
Corporate Fixed Income
Sovereign Fixed Income
Infrastructure
Real Estate
Private Equity
Sovereign Fixed Income
Corporate Fixed Income
Sovereign FI Green Tilt
MSCI EquitiesIPR benchmarks/ Active selection
Corporate FI Green Tilt
Relatively Unexposed High Carbon AssetsGreen Assets
Pub
lic M
arke
tsP
riva
te M
arke
ts

The Inevitable Policy Response: Investor Brief
The big decision for asset owners – divestment?
55
• Divestment only looks at risks, not opportunities• Where to recycle this capital to from divested sectors?• Company transitions makes this more complex
The Inevitable Policy Response: Investor Brief
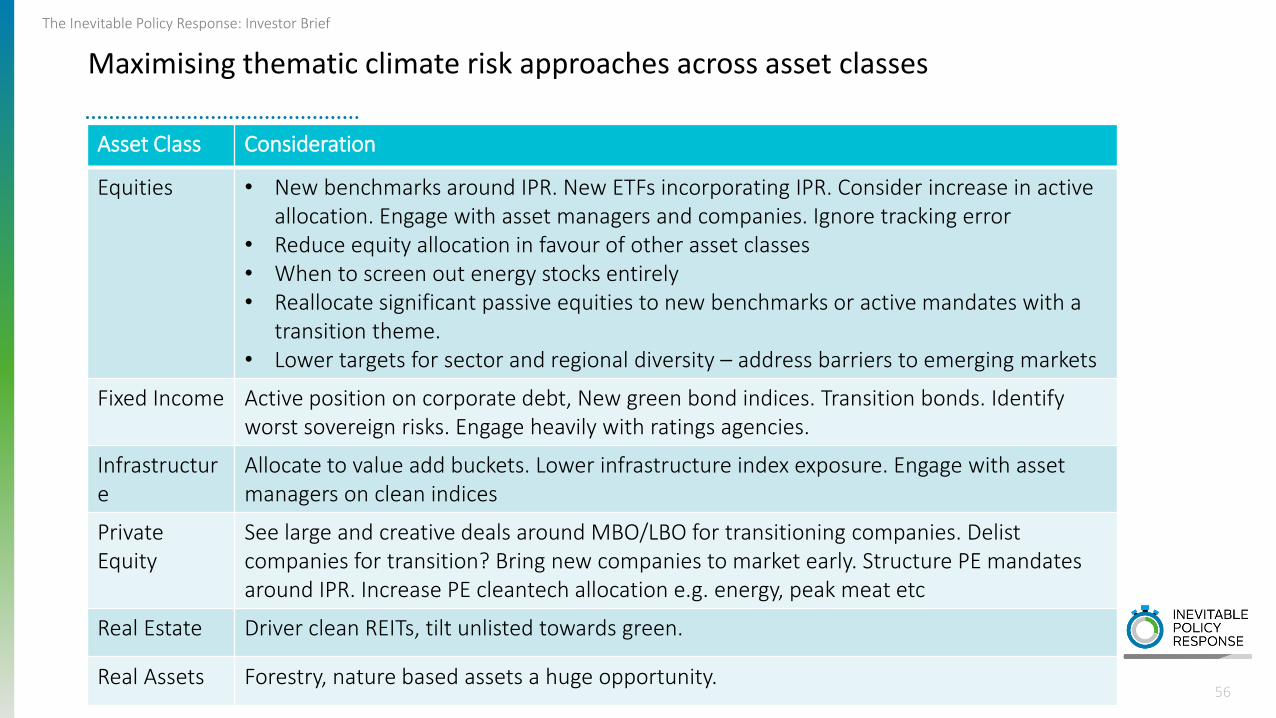
Maximising thematic climate risk approaches across asset classes
56
Asset Class Consideration
Equities • New benchmarks around IPR. New ETFs incorporating IPR. Consider increase in active allocation. Engage with asset managers and companies. Ignore tracking error
• Reduce equity allocation in favour of other asset classes• When to screen out energy stocks entirely• Reallocate significant passive equities to new benchmarks or active mandates with a
transition theme.• Lower targets for sector and regional diversity – address barriers to emerging markets
Fixed Income Active position on corporate debt, New green bond indices. Transition bonds. Identify worst sovereign risks. Engage heavily with ratings agencies.
Infrastructure
Allocate to value add buckets. Lower infrastructure index exposure. Engage with asset managers on clean indices
Private Equity
See large and creative deals around MBO/LBO for transitioning companies. Delist companies for transition? Bring new companies to market early. Structure PE mandates around IPR. Increase PE cleantech allocation e.g. energy, peak meat etc
Real Estate Driver clean REITs, tilt unlisted towards green.
Real Assets Forestry, nature based assets a huge opportunity.

The Inevitable Policy Response: Investor Brief
Asset Owner IPR Transition Tasks – Almost every core process impacted
57
2021 2025 2030
Accelerated Transition
• Agree governance around thematic climate
approach
• Set urgent voting guidelines on company
transition
• Re-set manager selection criteria and design
mandates towards risk AND low carbon upside
• Ensure portfolio construction and SAA can
support forward looking assumptions around the
energy transition theme
• Set new benchmarks e.g. low carbon
• Drive Managers to develop new product
• Drive asset managers towards forward looking
assumptions and incentivise them accordingly
• Engage regulators to remove barriers
Policy
Implementation
Phase

Asset Managers
58
The Inevitable Policy Response: Investor Brief
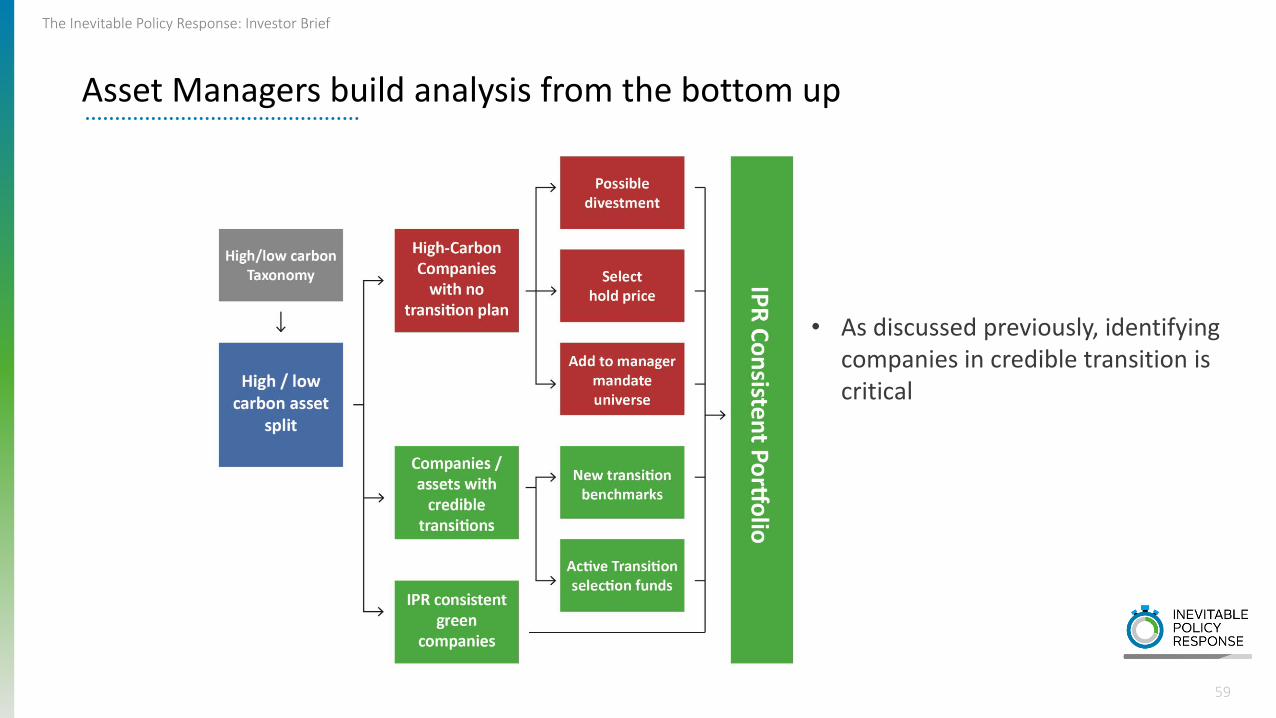
59
Asset Managers build analysis from the bottom up
• As discussed previously, identifying companies in credible transition is critical

The Inevitable Policy Response: Investor Brief
The implications of company transition challenge
Company X
Policy
Shareholder Engagement / Management
Incentives
Reputational
Decision to transition
Decision to wind down
Sell Assets
Enter new markets
Issue Transition / green bonds
De-list
Buy assets from PE /
Infrastructure
B
Resist Transition
C
(Barriers: Inertia, culture, skills, limited return available in existing competitive markets)
Investor Due-DiligenceIs the transition strategy credible?Does the transition strategy occur quickly enough?Do we trust the company to execute the strategy?
Produce Transition Strategy
AMerge/MBO /
LBO
Drivers of Transition Transition Options
60
Restructure capital base

The Inevitable Policy Response: Investor Brief
Asset Manager Actions
61
• Asset managers can greatly increase capacity to design build product
• Asset Managers can design product to help Asset owners implement green and climate aware investment strategies – this moves forward the current asset class definitions and historic way of approaching SAA
• Asset Manager company engagement can drive the market faster, perhaps in partnership with their Asset Owner clients.
• Asset manager creativity and competition required to maximise the opportunities, arbitrage, first to market, etc.

Service Providers
62
The Inevitable Policy Response: Investor Brief
What should Service Providers do?
63
• Investment Consultants – critical to showing asset owners how to create strategy for the transition. Barriers in consulting against perception of “risky advice”
• Ratings Agencies – Can integrate IPR into ratings analysis (Fitch already doing so)
• Data providers – Can build new offerings integrating IPR public data
• Index Providers – can create new benchmarks and semi-passive product
• Proxy advisers – Can make voting recommendation based on IPR realism
• Corporate consultants – Can use IPR as the basis for company transition strategies

The information contained in this report is meant for the purposes of information only and is not intended to be investment, legal, tax or other advice, nor is it intended to be relied upon in
making an investment or other decision. This report is provided with the understanding that the authors and publishers are not providing advice on legal, economic, investment or other
professional issues and services. Unless expressly stated otherwise, the opinions, recommendations, findings, interpretations and conclusions expressed in this report are those of the various
contributors to the report and do not necessarily represent the views of PRI Association or the signatories to the Principles for Responsible Investment. The inclusion of company examples
does not in any way constitute an endorsement of these organisations by PRI Association or the signatories to the Principles for Responsible Investment. While we have endeavoured to
ensure that the information contained in this report has been obtained from reliable and up-to-date sources, the changing nature of statistics, laws, rules and regulations may result in
delays, omissions or inaccuracies in information contained in this report. PRI Association is not responsible for any errors or omissions, or for any decision made or action taken based on
information contained in this report or for any loss or damage arising from or caused by such decision or action. All information in this report is provided “as-is”, with no guarantee of
completeness, accuracy, timeliness or of the results obtained from the use of this information, and without warranty of any kind, expressed or implied.
Vivid Economics and Energy Transition Advisors are not investment advisers and makes no representation regarding the advisability of investing in any particular company, investment fund
or other vehicle. The information contained in this research report does not constitute an offer to sell securities or the solicitation of an offer to buy, or recommendation for investment in,
any securities within the United States or any other jurisdiction. This research report provides general information only. The information is not intended as financial advice, and decisions to
invest should not be made in reliance on any of the statements set forth in this document. Vivid Economics and Energy Transition Advisors shall not be liable for any claims or losses of any
nature in connection with information contained in this document, including but not limited to, lost profits or punitive or consequential damages. The information and opinions in this report
constitute a judgement as at the date indicated and are subject to change without notice. The information may therefore not be accurate or current. The information and opinions contained
in this report have been compiled or arrived at from sources believed to be reliable in good faith, but no representation or warranty, express or implied, is made by Vivid Economics or Energy
Transition Advisors as to their accuracy, completeness or correctness and Vivid Economics and Energy Transition Advisors do also not warrant that the information is up to date.
64