the influence of in vitro gill and liver metabolism of
TRANSCRIPT

THE INFLUENCE OF IN VITRO GILL AND LIVER METABOLISM
OF XENOBIOTICS ON FISH BIOCONCENTRATION
Cristi Frasier Gomez, B.S., M.S.
Dissertation Prepared for the Degree of
DOCTOR OF PHILOSOPHY
UNIVERSITY OF NORTH TEXAS
August 2010
APPROVED:
Duane B. Huggett, Major Professor Mark Burleson, Committee Member Edward Dzialowski, Committee Member Thomas La Point, Committee Member Barney J. Venables, Committee Member Arthur J. Goven, Chair of the Department of
Biological Sciences James D. Meernik, Acting Dean of the
Robert B. Toulouse School of Graduate Studies

Gomez, Cristi Frasier. The influence of in vitro gill and liver metabolism of
xenobiotics on fish bioconcentration. Doctor of Philosophy (Biology), August 2010, 175
pp., 11 tables, 27 illustrations, reference list, 122 titles.
This dissertation examines the ability of in vitro biotransformation assays to
provide an indication of metabolic potential. The potential for xenobiotic compounds to
bioconcentrate in aquatic organisms is expressed through the bioconcentration factor
(BCF). The metabolic loss of ibuprofen, norethindrone and propranolol was measured
using rainbow trout (Oncorhynchus mykiss) and channel catfish (Ictalurus punctatus) gill
and liver S9 fractions, microsomes and cell suspensions. Metabolic transformation
rates (kM) were extrapolated from in vitro intrinsic clearance of parent compound (CLm)
and integrated into a refined BCF model. In general, CLm of test compounds was
greater in liver S9 fractions and hepatocytes. However, the influence of hepatic
metabolism on kM and BCF was limited by hepatic blood flow (20-25%) compared to gill
blood flow (~100%). A significant difference was noted between BCF solely based on
KOW and BCF including kM. These studies indicate that the inclusion of kM in BCF
models can bring predicted bioconcentration estimates closer to in vivo values. Primary
cell suspensions are preferred over subcellular fractions as cell suspensions possess
both phase I and phase II enzyme activity. Further study was conducted on ibuprofen
biotransformation pathways. As fish do not contain the same cytochrome P450 (CYP)
2C homologs known to metabolize ibuprofen in mammals, it cannot be assumed that
piscine biotransformation is similar. Metabolite analysis found 2-hydroxy-ibuprofen as
the major metabolite in S9 and microsomal fractions. Additional assays involving the
induction and inhibition of specific CYP isozymes support CYP1A2 as an alternative
metabolic pathway.

ii
Copyright 2010
by
Cristi Frasier Gomez

iii
ACKNOWLEDGEMENTS
This work would not have been possible without the financial support of the
Pfizer Global Research and Development, whose collaboration is greatly appreciated. I
am especially indebted to Dr. Duane Huggett, my major professor, who has been a
mentor and a friend. I cannot praise Dr. Huggett enough for his graciousness, flexibility
and support.
I am grateful to everyone with whom I have had the pleasure to work with during
this project. Each member of my Dissertation Committee has provided
me with guidance that has helped shape this dissertation. I would especially like to
thank Dr. Barney Venables for opening me up to the world of analytical chemistry. I
cannot thank him enough for his patience as I muddled my way through my first six
months of sample analysis. I also thank my lab mates for their encouragement and
laughter.
No one has been more important to me in the pursuit of this project than my
family. I thank my three wonderful children for their patience with my harried schedule,
my sister and mother-in-law for always being there to babysit or lend a hand, and my
mom and dad for all their unconditional love and support in spirit and in practice. Most
importantly, I wish to thank my loving and supportive husband, Matthew, who truly made
this possible.

iv
TABLE OF CONTENTS
Page
ACKNOWLEDGEMENTS ............................................................................................... iii
LIST OF TABLES ........................................................................................................... vi
LIST OF FIGURES ......................................................................................................... vii
Chapter
1. INTRODUCTION ......................................................................................................... 1
Project Overview .......................................................................................................... 1
Background .................................................................................................................. 2
Review of Bioconcentration Assays and Models .......................................................... 6
Fish Physiology and Function ...................................................................................... 9
Objectives and Hypotheses ....................................................................................... 15
Experimental Design .................................................................................................. 17
References ................................................................................................................. 25
2. THE INFLUENCE OF GILL AND LIVER METABOLISM IN S9 FRACTIONS ON THE PREDICTED BIOCONCENTRATION OF PHARMACEUTICALS IN FISH ................... 38
Introduction ................................................................................................................ 38
Materials and Methods ............................................................................................... 40
Results ....................................................................................................................... 48
Discussion and Conclusions ...................................................................................... 54
References ................................................................................................................. 56
3. IBUPROFEN METABOLISM IN THE LIVER AND GILL OF RAINBOW TROUT, Oncorhynchus mykiss ................................................................................................... 60
Introduction ................................................................................................................ 60
Materials and Methods ............................................................................................... 61
Results and Discussion .............................................................................................. 64
References ................................................................................................................. 68

v
4. METABOLISM OF THREE PHARMACEUTICALS IN RAINBOW TROUT AND CHANNEL CATFISH LIVER AND GILL CELL SUSPENSIONS, AND THE EFFECT ON PREDICTED BIOCONCENTRATION ........................................................................... 70
Introduction ................................................................................................................ 70
Materials and Methods ............................................................................................... 72
Results ....................................................................................................................... 80
Discussion and Conclusions ...................................................................................... 84
References ................................................................................................................. 87
5. CONCLUSIONS ........................................................................................................ 93
Introduction ................................................................................................................ 93
Comparison of Subcellular Fractions and Cell Suspensions ...................................... 93
Objectives and Hypotheses ..................................................................................... 105
BCF Model Evaluation ............................................................................................. 111
Conclusion ............................................................................................................... 115
References ............................................................................................................... 115
APPENDIX A: PROTOCOLS ...................................................................................... 118
APPENDIX B: IN VITRO BIOTRANSFORMATION ASSAY FORM ............................ 136
APPENDIX C: ILSI/HESI BCF MODEL (FROM MICROSOFT EXCEL) ...................... 138
APPENDIX D: EXPONENTIAL PLOTS OF LOSS OF PARENT DATA………………..142
REFERENCES ............................................................................................................ 159

vi
LIST OF TABLES
Table 1. Concentrations of ibuprofen observed in water samples. ................................ 21
Table 2. Experimental log KOW values for propranolol (Johnson et al., 2007). .............. 22
Table 3. Concentrations of propranolol found in water samples. ................................... 23
Table 4. Physiological and physical characteristics used to extrapolate in vitro metabolic
transformation of subcellular fractions within the BCF model ........................................ 47
Table 5. Comparison of intrinsic clearance rate (CLm), extrapolated metabolic
transformation rate (kM), BCFM and BCF0 ..................................................................... 52
Table 6. Physiological and physical characteristic used to extrapolate in vitro metabolic
transformation of cell suspensions within the BCF model ............................................. 79
Table 7. Comparison of intrinsic clearance rate of parent (CLm), extrapolated metabolic
transformation rate (kM), BCFM and BCF0 ..................................................................... 85
Table 8. Mean coefficient of determination (R2 ) for exponential curves fit to
concentration versus time ............................................................................................. 94
Table 9. Influence of kM on predicted BCF .................................................................. 107
Table 10. Statistical analysis between predicted in vitro BCFM(total) and in vivo BCF ... 109
Table 11. Example of the influence of the fractional lipid content of whole fish body on
extrapolation of in vitro biotransformation data. ........................................................... 113

vii
LIST OF FIGURES
Fig. 1. Timeline of key events in the history of persistent, bioaccumulative and toxic
(PBT) substances. ........................................................................................................... 3
Fig. 2. Biotransformation of norethindrone in humans. .................................................. 18
Fig. 3. Biotransformation of (S)-(+)-ibuprofen. ............................................................... 20
Fig. 4. Propranolol. ........................................................................................................ 22
Fig. 5. Extrapolation of in vitro S9 metabolism assay to the metabolic transformation
rate (kM) ........................................................................................................................ 46
Fig. 6. Percent increase in resorufin over 60 minute time course. ................................. 49
Fig. 7. Mean loss of parent compound over 90 minute study time period. .................... 50
Fig. 8. Mean CLm of S9 fractions ................................................................................... 51
Fig. 9. Relative loss of parent compound over 90 minute study time period ................. 64
Fig. 10. (A) Mean CLm of uninduced S9 fractions. (B) Mean CLm of BNF-induced and
uninduced trout liver microsomes (TLM) and trout gill microsomes (TGM) ................... 65
Fig. 11. Relative frequencies of ibuprofen and its metabolites ...................................... 66
Fig. 12. Extrapolation of in vitro primary cell suspension metabolism assay to metabolic
transformation rate (kM) ................................................................................................. 78
Fig. 13. Mean loss of parent compound in deactivated control cells. ............................ 80
Fig. 14. Mean loss of parent compound over 120 minute study time period. ............... 81
Fig. 15. (A) Mean intrinsic clearance rate of parent (CLm) and (B) mean extrapolated
metabolic transformation rate (kM) of cell suspensions.................................................. 82
Fig. 16. Intrinsic clearance of parent compound (CLm) between cell suspension lots. .. 84
Fig. 17. Example of first order kinetics in catfish hepatocyte assay results .................. 94

viii
Fig. 18. Mean percent loss of norethindrone across liver and gill S9, microsomes and
cell suspensions. ........................................................................................................... 96
Fig. 19. Comparison of mean intrinsic clearance rate (CLm) of norethindrone in liver and
gill subcellular fractions and primary cell suspensions. ................................................. 97
Fig. 20. Comparison of mean metabolic transformation rate (kM) of norethindrone in liver
and gill subcellular fractions and primary cell suspensions ........................................... 98
Fig. 21. Mean percent loss of propranolol across liver and gill S9, microsomes and cell
suspensions. ............................................................................................................... 100
Fig. 22. Comparison of mean intrinsic clearance rate (CLm) of propranolol in liver and gill
subcellular fractions and primary cell suspensions ..................................................... 100
Fig. 23. Comparison of mean metabolic transformation rate (kM) of propranolol in liver
and gill subcellular fractions and primary cell suspensions ......................................... 101
Fig. 25. Comparison of mean intrinsic clearance rate (CLm) of ibuprofen in liver and gill
subcellular fractions and primary cell suspensions ..................................................... 104
Fig. 26. Comparison of mean metabolic transformation rate (kM) of ibuprofen in liver and
gill subcellular fractions and primary cell suspensions ................................................ 104
Fig. 27. Comparison of BCF ....................................................................................... 110

1
CHAPTER 1
INTRODUCTION
1.1 Project Overview
The potential for a chemical to bioconcentrate is often expressed through the
calculation of a bioconcentration factor (BCF). The ability of a substance to
bioconcentrate is an important chemical characteristic as it indicates the potential for a
substance to partition into and remain in the organism, increasing the potential for
chronic toxic effects. BCF is the proportionality constant of the chemical concentration
in an aquatic animal at steady-state equilibrium (CB) to the chemical concentration in
ambient water (CW) (Veith and DeFoe, 1979).
(BCF = CB / CW) (1)
BCF may also be calculated from a one-compartment model, where k1 is the
uptake rate constant and k2 is the elimination rate constant (Barron, 1990).
(BCF = k1 / k2) (2)
Through a joint effort with the International Life Sciences Institute – Human and
Environmental Sciences Institute (ILSI/HESI), a multi-compartment model based on the
principles of absorption, distribution, metabolism and elimination (ADME) has been
proposed. This model in includes: k1 (uptake via gills), kU (dietary ingestion), k2
(elimination across gills), kG (growth), kM (metabolism) and kE (egestion) (Gobas, 1993).
BCF = (k1 + kU) / (k2 + kG +kM +kE) (3)

2
This dissertation focuses on the determination and applicability of the metabolic
transformation rate constant (kM). Moreover, the following work centers on metabolic
clearance of the gills and liver. A series of in vitro biotransformation assays were
conducted in order to develop a simple and cost effective test method for estimating the
intrinsic clearance rate of parent compound (CLm) and extrapolating it to kM. kM was
then incorporated into a multi-compartmental BCF model. Rainbow trout
(Oncorhynchus mykiss) and channel catfish (Ictalurus punctatus) served as model
organisms to evaluate species differences in metabolism.
1.2. Background
1.2.1. Historical Review
Bioconcentration has traditionally been defined as the accumulation of chemical
substances from aquatic environments through non-dietary routes (Barron, 1990).
Bioconcentration often represents a surrogate measure for “B” in PBT, a regulatory
classification for persistent, bioaccumulative and toxic substances that has taken on
greater importance in the past few years with the implementation of the European Union
regulation on the Registration, Evaluation and Authorisation of Chemicals (REACH) and
the Canadian assessment of chemicals on the Domestic Substances List (DSL).
However, bioaccumulative substances should not be solely classified as
emerging contaminants. They have long played a leading role in the history of
environmental toxicology (Fig. 1). Since the publication of Silent Spring by Rachel
Carson in 1962, the fate of chemicals in the environment has received growing
attention, particularly those chemicals with PBT characteristics. Some place the
synthesis of benzene hexachloride by Michael Faraday in 1825 as a pivotal moment in

3
time that lead to the synthesis halogenated organics in large, industrial quantities
(Lipnick and Muir, 2000).
Fig. 1. Timeline of key events in the history of persistent, bioaccumulative and toxic
(PBT) substances.
In the 1930s and 1940s, a new generation of pesticides became commercially
available, which have since been termed organochlorines. These pesticides had lower
acute toxicity than their precursors, such as arsenic and hydrogen cyanide (Kovach et
al., 1992). However, their indirect and chronic effects did not become cause for concern
until many years later (Harner et al., 1999). One of the key indirect effects was
bioaccumulation and biomagnification through the food chain. For example, DDT was
linked to the population decline of large raptors, not through direct exposure to DDT, but
through the highly lipophilic compound’s magnification up the food chain. A strong
inverse correlation between eggshell thickness and DDE, the primary metabolite of

4
DDT, was found in the eggs of peregrine falcons (Falco peregrines) and California
condors (Gymnogypus californianus) (van Emden and Peakall, 1999). The inability to
effectively reproduce decimated the two bird populations. Thus, the need to evaluate a
chemical’s indirect routes of toxicity became apparent. This prompted the creation of
several regulatory restrictions on PBT substances.
1.2.2. Regulatory Overview
Currently, Canada, the European Union, the United States and the United
Nations have independent definitions for what constitutes a PBT. In Canada, a
substance deemed inherently toxic may be restricted or banned from trade if it meets
the criteria for persistence or bioaccumulation. Inherent toxicity is defined as chronic no
observable effect concentration (NOEC) < 0.1mg L-1 or acute LC50 (EC50) < 1 mg L-1
(Environment Canada, 2003). The term “inherently toxic” is used to distinguish from
other regulatory definitions of “toxic.” A chemical is considered bioaccumulative if it has
a BCF or bioaccumulation factor (BAF) > 5,000 or a log KOW > 5 (Environment Canada,
2003). BAF includes all exposure routes, including dietary routes, and are often
considered a more complete quotient than BCF. BAF can be calculated from BCF by
including a food chain multiplier (FCM) (NYDEC, 1998).
BAF = (FCM) * (BCF) (4)
The European Union has two regulatory classifications: PBT and very persistent,
very bioaccumulative (vPvB). PBTs must meet the criteria for persistence,
bioaccumulation and toxicity, in which the criteria for bioaccumulation is a BCF > 2,000
or log KOW > 4.5. vPvBs must only meet the criteria for persistence and
5
bioaccumulation, in which the criteria for bioaccumulation is raised to a BCF > 5,000 or
log KOW > 5, mirroring Canada’s criteria. Persistence classification is based on the half-
life in either water or sediment. The criteria differ for marine and freshwater
environments. The EU criteria for toxic requires a chronic NOEC < 0.01 mg/L,
classification as a carcinogen, mutagen or reproductive toxin (CMR) or evidence
showing endocrine disrupting effects (European Chemicals Bureau, 2003).
Classification as a PBT or vPvB leads to the authorization of chemical use under
REACH (European Union, 2006).
The United States Environmental Protection Agency (USEPA) established PBT
criteria in which all three characteristics must be met. Substances with a BCF or BAF >
1,000 must undergo further testing. Substances with a BCF or BAF > 5,000 may be
banned from commerce (USEPA, 1999).
Furthermore, the United Nations Environmental Programme, through the
Stockholm Convention on Persistent Organic Pollutants (POPs). POPs addresses a
select group of chemicals that present PBT characteristics, but also are transported
through air, water and migratory species across international boundaries and deposited
far from their place of release. The first twelve compounds subject to the Convention
are primarily pesticides, but also include other halogenated organics: aldrin, chlordane,
dieldrin, endrin, heptachlor, hexachlorobenzene (HCB), mirex, toxaphene, PCBs, DDT,
polychlorinated dibenzodioxins (PCDDs) and polychlorinated dibenzofurans (PCDFs).
The Convention established a bioaccumulation criteria at a BCF > 5,000 (United
Nations, 2001).

6
1.3. Review of Bioconcentration Assays and Models
1.3.1. OECD 305: Bioconcentration: Flow-Through Fish Test
OECD 305: Bioconcentration: Flow-Through Fish Test is an experimental in vivo
determination of the BCF in fish (OECD, 1996). The test is conducted in two phases:
an exposure phase and a depuration phase. In the exposure phase, fish are exposed
to two sublethal concentrations of the test chemical. Both fish and water are sampled at
regular intervals, and the concentration of the original test compound is measured.
After 28-days of toxicant exposure, or when a steady-state is reached in the fish, the
fish are transferred to clean water and the depuration phase commences for an
additional 14 days.
The BCF may be expressed as either a function of the total wet weight of fish or
the total lipid weight of fish. Thus, OECD 305 is a one compartment model, in which the
single compartment represents either a homogenate of the fish or the homogenized lipid
portion of the fish. Additionally, as described in Eqs. (1) and (2) above, two
mathematical models may be used to determine the BCF from OECD 305. The first
calculates BCF as the concentration of a chemical in fish (CB) divided by the
concentration in water (CW) under steady-state conditions. The second calculates BCF
using first-order kinetic data, where k1 represents the rate constant for uptake and k2
represents the rate constant for elimination. European ring tests found variations
between the two methods to be less than the interlaboratory variation (Kristensen and
Tyle, 1991).
7
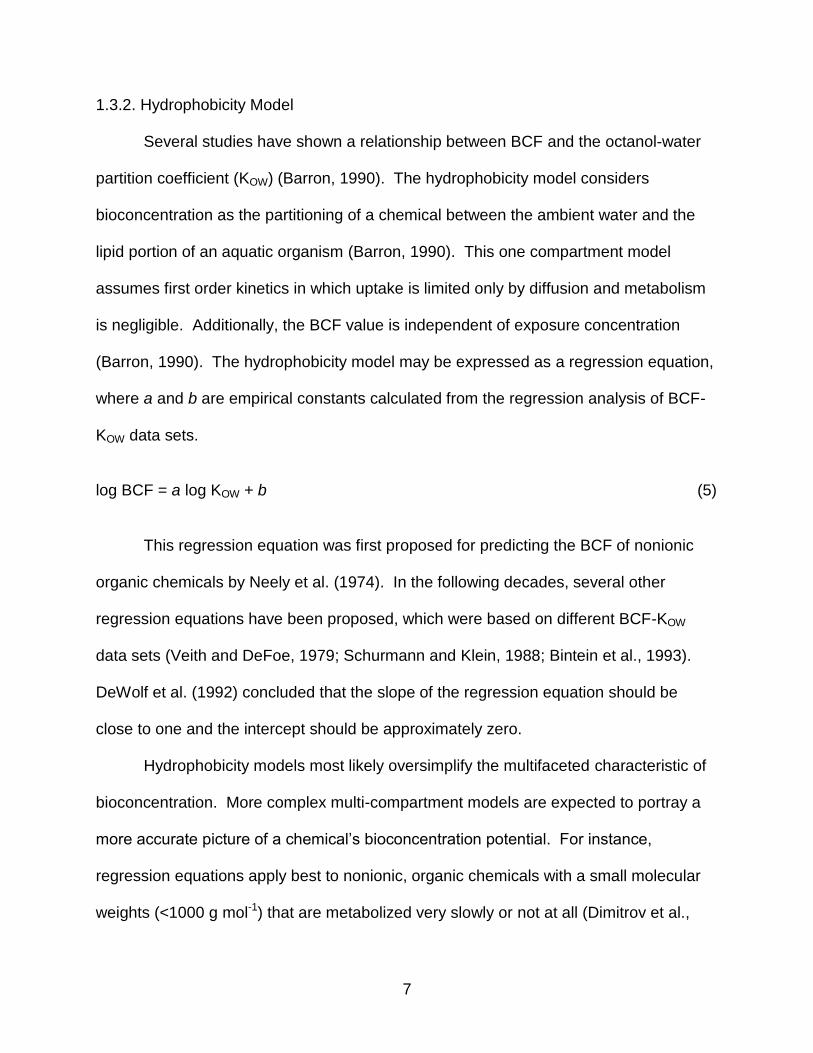
1.3.2. Hydrophobicity Model
Several studies have shown a relationship between BCF and the octanol-water
partition coefficient (KOW) (Barron, 1990). The hydrophobicity model considers
bioconcentration as the partitioning of a chemical between the ambient water and the
lipid portion of an aquatic organism (Barron, 1990). This one compartment model
assumes first order kinetics in which uptake is limited only by diffusion and metabolism
is negligible. Additionally, the BCF value is independent of exposure concentration
(Barron, 1990). The hydrophobicity model may be expressed as a regression equation,
where a and b are empirical constants calculated from the regression analysis of BCF-
KOW data sets.
log BCF = a log KOW + b (5)
This regression equation was first proposed for predicting the BCF of nonionic
organic chemicals by Neely et al. (1974). In the following decades, several other
regression equations have been proposed, which were based on different BCF-KOW
data sets (Veith and DeFoe, 1979; Schurmann and Klein, 1988; Bintein et al., 1993).
DeWolf et al. (1992) concluded that the slope of the regression equation should be
close to one and the intercept should be approximately zero.
Hydrophobicity models most likely oversimplify the multifaceted characteristic of
bioconcentration. More complex multi-compartment models are expected to portray a
more accurate picture of a chemical’s bioconcentration potential. For instance,
regression equations apply best to nonionic, organic chemicals with a small molecular
weights (<1000 g mol-1) that are metabolized very slowly or not at all (Dimitrov et al.,
8
2005). Thus, they underestimate the potential for metabolic elimination. Moreover,
new, emerging environmental contaminants, such as ionizable pharmaceuticals, cannot
be assumed to behave the same as the historical neutral, lipophilic contaminants.
Assumptions must be rethought with regard to their uptake, distribution, metabolism,
elimination and potential accumulation in the aquatic environment.
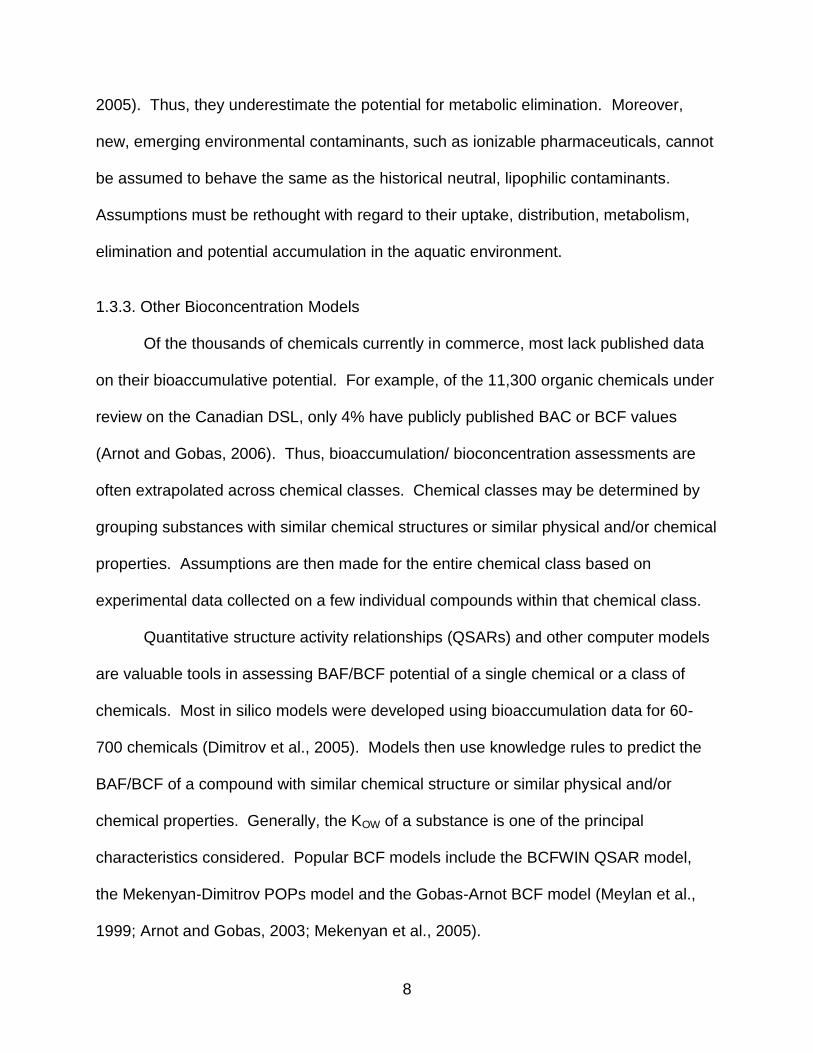
1.3.3. Other Bioconcentration Models
Of the thousands of chemicals currently in commerce, most lack published data
on their bioaccumulative potential. For example, of the 11,300 organic chemicals under
review on the Canadian DSL, only 4% have publicly published BAC or BCF values
(Arnot and Gobas, 2006). Thus, bioaccumulation/ bioconcentration assessments are
often extrapolated across chemical classes. Chemical classes may be determined by
grouping substances with similar chemical structures or similar physical and/or chemical
properties. Assumptions are then made for the entire chemical class based on
experimental data collected on a few individual compounds within that chemical class.
Quantitative structure activity relationships (QSARs) and other computer models
are valuable tools in assessing BAF/BCF potential of a single chemical or a class of
chemicals. Most in silico models were developed using bioaccumulation data for 60-
700 chemicals (Dimitrov et al., 2005). Models then use knowledge rules to predict the
BAF/BCF of a compound with similar chemical structure or similar physical and/or
chemical properties. Generally, the KOW of a substance is one of the principal
characteristics considered. Popular BCF models include the BCFWIN QSAR model,
the Mekenyan-Dimitrov POPs model and the Gobas-Arnot BCF model (Meylan et al.,
1999; Arnot and Gobas, 2003; Mekenyan et al., 2005).

9
1.4. Fish Physiology and Function
1.4.1. Gill Structure
Teleost fish typically have four gill arches consisting of holobranchs and one arch
comprising of a vascularized psuedobranch (Laurent, 1984). A psuedobranch is found
in rainbow trout, but not channel catfish. Water flows through the branchial cavity,
which houses the gills arches, and leaves through the operculum. Each gill arch is lined
with two rows of gill filaments that project posteriolaterally (Wilson and Laurent, 2002).
Gill filaments consist of folded lamellae. The shape and size of lamellae vary between
fish species; however, the surface area provided by the lamella is critical to the
exchange of gases and other materials between water and blood. Lamellae typically
are curved and consist of the respiratory epithelium (Laurent, 1984). The respiratory
epithelium is composed of two epithelial layers separated by a series of modified
endothelial cells.
The ultrastructure of the gill contains various epithelial cells types, including
pavement cells, chloride cells and mucus cells. The pavement cell is a modified
endothelial cell, lining the blood spaces within the lamellae. Pavement cells are
squamous or cuboidal cells unique to the fish gill and represent the major protein source
in the gill epithelium (Kültz and Somero, 1996). They contain a nucleus and typical
intracellular organelles, such as rough and smooth endoplasmic reticulum, Golgi
apparatus and lysosomes. However, pavement cells have low mitochondrial densities.
Chloride cells, on the other hand, are mitochondria-rich cells concentrated in the
afferent edge of the filament epithelium (Laurent, 1984). Multiple gill cells types have
been found to contribute to xenobiotic metabolism, including pavement cells and pillar
10
cells (Miller et al., 1988; Miller et al., 1989; Leguen et al., 2000; Leguen et al., 2001).
Most in vitro cultured gill epithelia contain a mixture of pavement and chloride cells
(Galvez et al., 2008).
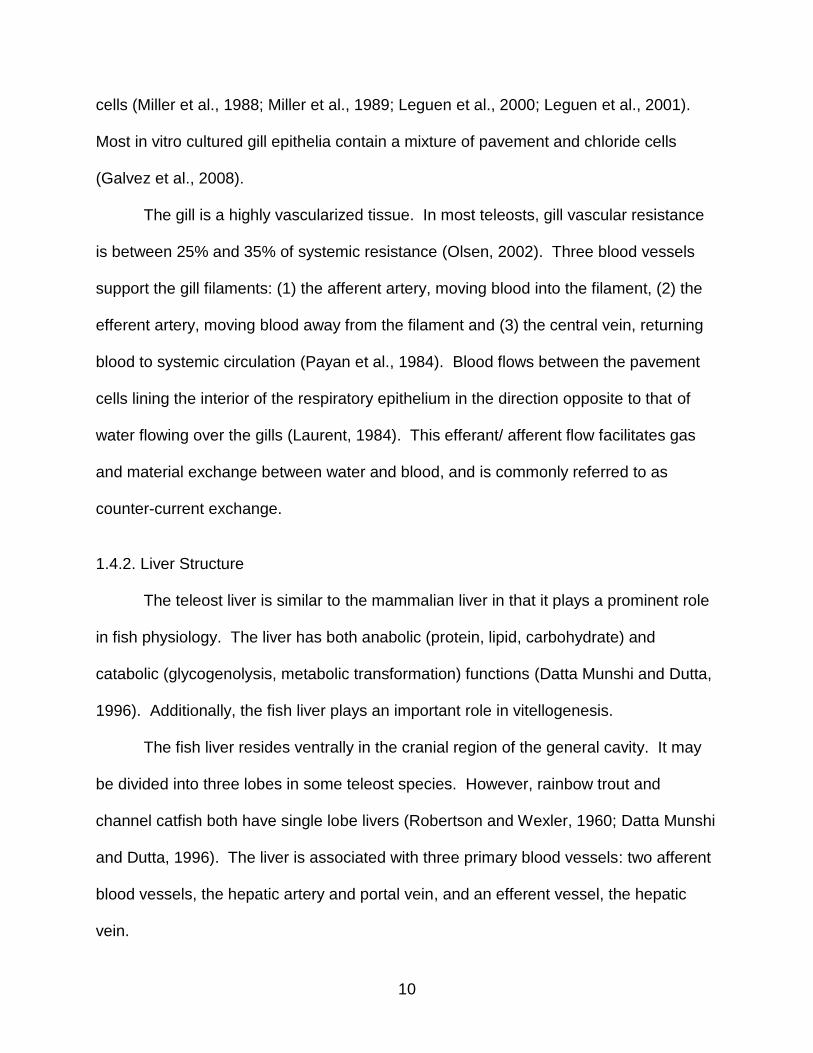
The gill is a highly vascularized tissue. In most teleosts, gill vascular resistance
is between 25% and 35% of systemic resistance (Olsen, 2002). Three blood vessels
support the gill filaments: (1) the afferent artery, moving blood into the filament, (2) the
efferent artery, moving blood away from the filament and (3) the central vein, returning
blood to systemic circulation (Payan et al., 1984). Blood flows between the pavement
cells lining the interior of the respiratory epithelium in the direction opposite to that of
water flowing over the gills (Laurent, 1984). This efferant/ afferent flow facilitates gas
and material exchange between water and blood, and is commonly referred to as
counter-current exchange.
1.4.2. Liver Structure
The teleost liver is similar to the mammalian liver in that it plays a prominent role
in fish physiology. The liver has both anabolic (protein, lipid, carbohydrate) and
catabolic (glycogenolysis, metabolic transformation) functions (Datta Munshi and Dutta,
1996). Additionally, the fish liver plays an important role in vitellogenesis.
The fish liver resides ventrally in the cranial region of the general cavity. It may
be divided into three lobes in some teleost species. However, rainbow trout and
channel catfish both have single lobe livers (Robertson and Wexler, 1960; Datta Munshi
and Dutta, 1996). The liver is associated with three primary blood vessels: two afferent
blood vessels, the hepatic artery and portal vein, and an efferent vessel, the hepatic
vein.
11
Several cell types are found in the fish liver. Hepatocytes comprise the major cell
type, occupying 80-85% of liver volume (Hampton et al., 1989). Biliary epithelial cells,
exocrine pancreatic cells, Ito cells, macrophages and fibroblasts are also found in fish
liver. Studies have observed cytochrome P450 (CYP) 1A1 presence not only in
hepatocytes, but also in biliary epithelial cells and sinusoidal endothelial cells (Lester et
al., 1993).
1.4.3. Chemical Absorption and Uptake
Two common assumptions of fish bioconcentration models are (1) chemical
uptake across the gill dominates all other routes of uptake and (2) chemical uptake
occurs through passive diffusion (Barron, 1990; Randall et al., 1991; Barber, 2003).
Xenobiotics traditionally enter the body via passive diffusion through semi-permeable
membranes of the gill, the lining of the mouth or the gastrointestinal tract (Spacie and
Hamelink, 1985).
However, often individual characteristics of the fish or the compound itself
determine whether these statements correctly predict a specific uptake situation. For
example, absorption across cutaneous surfaces may contribute to chemical uptake in
smaller fish (e.g., fathead minnow, Pimephales promelas) due to their larger surface
area to volume ratio and the relatively short diffusion distance across the skin compared
to larger fish (Lien and McKim, 1993). Additionally, it has been hypothesized that
dietary uptake, rather than uptake across the gill, is the primary route by which fish
accumulate very hydrophobic compounds (KOW > 5) that are not soluble in water
(Bruggeman et al., 1984).
12
Several physiological factors affect absorption across the gill and subsequent
uptake into the fish. The gill contains a porous capillary network that facilitates
absorption of xenobiotics into systemic circulation (Olsen, 2002). The functional surface
area of the lamellae also affects absorption. The rate of chemical uptake across the
gills is dependent on several factors. Multiple studies have determined that chemical
uptake is positively correlated with water flow across the gill (Norstrom et al., 1976;
McKim and Goeden, 1982). Additionally, it has been shown that diffusion from water to
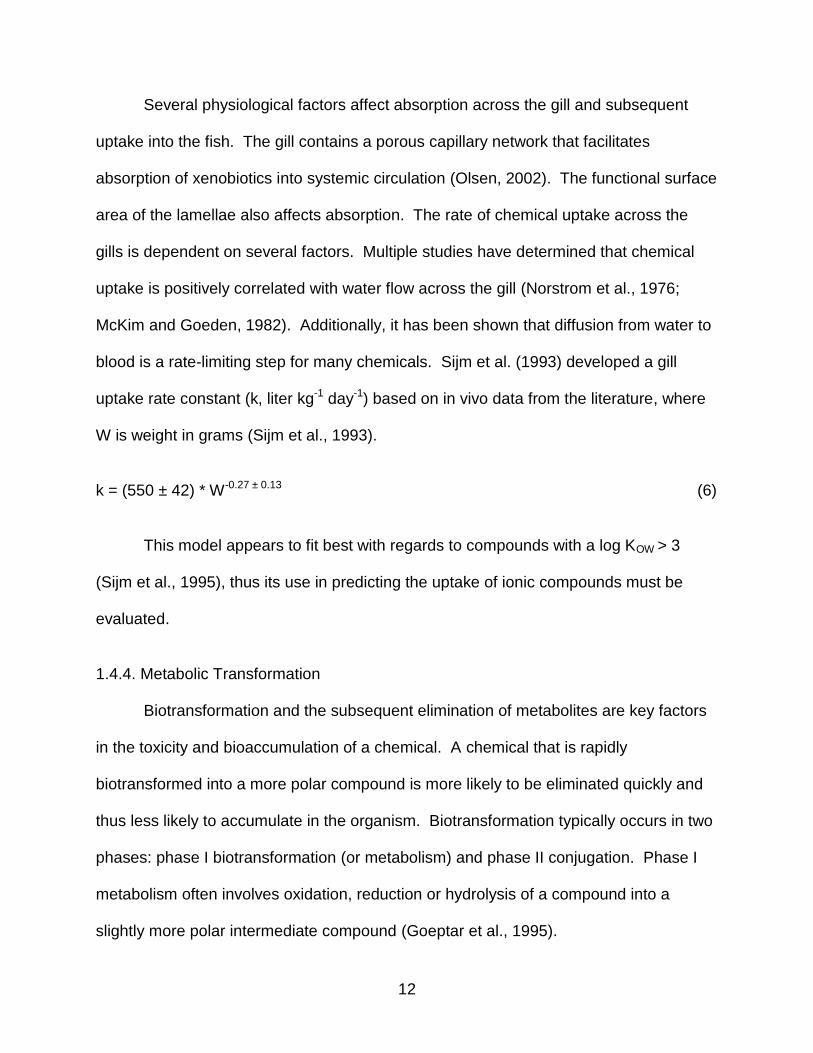
blood is a rate-limiting step for many chemicals. Sijm et al. (1993) developed a gill
uptake rate constant (k, liter kg-1 day-1) based on in vivo data from the literature, where
W is weight in grams (Sijm et al., 1993).
k = (550 ± 42) * W-0.27 ± 0.13 (6)
This model appears to fit best with regards to compounds with a log KOW > 3
(Sijm et al., 1995), thus its use in predicting the uptake of ionic compounds must be
evaluated.
1.4.4. Metabolic Transformation
Biotransformation and the subsequent elimination of metabolites are key factors
in the toxicity and bioaccumulation of a chemical. A chemical that is rapidly
biotransformed into a more polar compound is more likely to be eliminated quickly and
thus less likely to accumulate in the organism. Biotransformation typically occurs in two
phases: phase I biotransformation (or metabolism) and phase II conjugation. Phase I
metabolism often involves oxidation, reduction or hydrolysis of a compound into a
slightly more polar intermediate compound (Goeptar et al., 1995).

13
Cytochrome P450 isozymes catalyze a large portion of phase I reactions by
inserting a single oxygen atom into an organic substrate while reducing the other
oxygen to water. P450s are a superfamily of heme-thiolate enzymes responsible for the
metabolism of endogenous and xenobiotic compounds. P450s are thought to have
originated over 3.5 million years ago and are found in most forms of life, including
bacteria, fungi, plants and animals (Chang and Kam, 1999). In teleosts, P450s typically
reside in the membrane of endoplasmic reticulum, but have also been found in
mitochondria (Buhler and Wang-Buhler, 1998).
Phase II metabolism involves the conjugation of the intermediate metabolite with
a polar functional group to increase water solubility. Conjugation typically reduces any
bioactivity of the intermediate metabolite. Phase II enzymes are specific for a
functional group. For example, UDP-glucuronosyltransferase (UGT) catalyzes phase II
biotransformation through conjugation with glucuronic acid (Ritter, 2000; Buckley and
Klaassen, 2007). Phase II reactions also include sulfonation, methylation, acetylation,
conjugation with glutathione, and conjugation with certain amino acids, such as glycine,
glutamic acid and taurine (Parkinson and Ogilvie, 2007).
1.4.4.1. Gill Metabolism
The gill is a metabolically active tissue in the fish and has been shown to contain
both phase I and II enzymes (Buhler and Wang-Buhler, 1998; Walter et al., 2001;
Klaren et al., 2007). CYP1A1 was first isolated in rainbow trout liver microsomes in
1982 (Williams and Buhler, 1984). It has been found in the pavement cells of the gill
along with several other monooxygenases. (Buhler and Wang-Buhler, 1998).
Mammalian species have been hypothesized to have over 60 distinguishably different

14
types of P450 enzymes (Coon et al., 1996). The diversity of P450s in rainbow trout is
expected to be as varied as that of mammalian species (Lee et al., 1998).
Limited research has suggested that the metabolic activity in the gill is less than
that of the liver. Arachidonic acid metabolism in scrup (Stenotomus chrysops) gill
microsomes was found to be 10- to 30-fold less than that of scrup liver microsomes
(Schlezinger et al., 1998). Metabolic activity in gill epithelial cells was observed at
between 7- and 60-fold less than the activity level in isolated hepatocytes, depending on
the substrate (7-ethoxycoumarin, aniline and testosterone) (Leguen et al., 2000).
Others have reported similar metabolic differences between the gill and liver (Lindstrom-
Seppa et al., 1981; Pesonen and Andersson, 1991).
1.4.4.2. Liver Metabolism
Enzymes capable of xenobiotic biotransformation are found in a most tissues. In
vertebrates, the liver is considered to be the primary site of biotransformation
(Parkinson and Ogilvie, 2007). The liver has dual blood sources from the hepatic and
vein and hepatic artery. The hepatic vein supplies blood from the gastrointestinal tract.
Through first pass elimination, the liver processes xenobiotics absorbed from dietary
sources. The liver also receives blood flow from the hepatic artery, which allows for
biotransformation of xenobiotics systemically available in the bloodstream (Parkinson
and Ogilvie, 2007).
In most vertebrates, the highest concentration of P450 enzymes involved in
xenobiotic metabolism is found in the endoplasmic reticulum of hepatocytes (Parkinson
and Ogilvie, 2007). The liver is also a site for phase II biotransformation. Studies have

15
shown the presence of sulfotransferase and UGT in the livers of most teleost fish
(Klaren et al., 2007).
1.4.5. Elimination
The potential for a substance to bioconcentrate greatly depends on the
organism’s ability to eliminate the substance. Compounds which are easily eliminated
have less potential to remain in the body and accumulate. Substances may be
eliminated via biliary excretion, urinary excretion or passive diffusion across the gill
(Streit, 1998). In general, xenobiotics are biotransformed into more polar compounds
prior to elimination; thus, an organism’s ability to metabolize a compound plays a critical
role in elimination. Additionally, metabolism at the site of elimination (e.g., the gill)
reduces residency time in the organism and possible toxicity and bioaccumulation
(Black et al., 1995).
The gill is considered a key site for elimination. Many of the properties that
facilitate uptake across the gill, such as large surface area, short diffusion distance and
counter-current blood flow allow for elimination across the gill (Streit, 1998). In addition,
the large proportion of cardiac output to the gill further facilitates elimination across the
gill.
1.5. Objectives and Hypotheses
1.5.1. Objective 1
Determine the in vitro intrinsic clearance rate of parent compound (CLm) and the
metabolic rate constant (kM) for the test compounds in gill S9 fractions.

16
Hypothesis 1: HO: Loss of parent material will not be significantly different
from starting concentrations. α = 0.05
Hypothesis 2: HO: In vitro gill kM will not significantly decrease model BCF
values. α = 0.05
1.5.2. Objective 2
Determine the in vitro intrinsic clearance rate of parent compound (CLm) and the
metabolic rate constant (kM) for the test compounds in liver S9 fractions.
Hypothesis 3: HO: Loss of parent material will not be significantly different
from starting concentrations. α = 0.05
Hypothesis 4: HO: In vitro liver kM will not significantly decrease model BCF
values. α = 0.05
1.5.3. Objective 3
Determine the in vitro intrinsic clearance rate of parent compound (CLm) and the
metabolic rate constant (kM) for the test compounds in primary gill cell suspensions.
Hypothesis 5: HO: Loss of parent material will not be significantly different
from starting concentrations. α = 0.05
Hypothesis 6: HO: In vitro gill kM will not significantly decrease model BCF
values. α = 0.05
1.5.4. Objective 4
Determine the in vitro intrinsic clearance rate of parent compound (CLm) and the
metabolic rate constant (kM) for the test compounds in primary hepatocyte suspensions.

17
Hypothesis 7: HO: Loss of parent material will not be significantly different
from starting concentrations. α = 0.05
Hypothesis 8: HO: In vitro liver kM will not significantly decrease model BCF
values. α = 0.05
1.5.5. Objective 5
Compare in vitro metabolism data to in vivo whole fish bioconcentration data.
Hypothesis 9: HO: Calculated BCF including in vitro kM values will not
significantly differ from in vivo BCF. α = 0.05
1.6. Experimental Design
1.6.1. Test Materials
1.6.1.1. Norethindrone
Norethindrone (19-norpregn-4-en-20-yn-3-one,17-hydroxy-,[17α-]-; C20H26O2)
is a synthetic progestin commonly found in oral contraceptives. In humans,
norethindrone is metabolized by CYP2C19 and CYP3A4 (Fig. 2) (Korhonen et al.,
2008). In human liver microsomes, hydroxylation accounts for ~98% of norethindrone
metabolites (Korhonen et al., 2008).

18
Fig. 2. Biotransformation of norethindrone in humans as adapted from Korhonen et al
(2008).
Additionally, norethindrone binds extensively to plasma albumin and sex
hormone binding globulin (SHBG) (Orme, 1982). This supports the systemic circulation
of norethindrone. Norethindrone has reported log KOW of 2.97 and 2.99, indicating only
moderate hydrophobicity (Saha et al., 2000; Lee et al., 2007).
The presence of norethindrone in the environment is attributed to its presence in
wastewater. A study of Canadian municipal sewage detected norethindrone in
wastewater influent samples at levels ranging from 26 – 224ng L-1. The study found
norethindrone in only one wastewater effluent sample (159ng L-1) (Fernandez et al.,
2007).

19
1.6.1.2. Ibuprofen
Ibuprofen is a nonsteroidal anti-inflammatory drug (NSAID) found in over-the-
counter pain relievers and several prescription pharmaceuticals (Fig. 3). In the human
and rat liver, CYP2C9 and CYP2C8 metabolize ibuprofen (Davies, 1998; Jacqz-Aigrain
and Anderson, 2006). Ibuprofen also undergoes direct glucuronidation (Jacqz-Aigrain
and Anderson, 2006). UGT 1A9, UGT1A3, UGT2B1 and UGT2B7 are known to
conjugate ibuprofen (Ritter, 2000).
Several differing log KOW values have been reported in the literature for
ibuprofen, depending on the pH of solubilizing matrix (Jones et al., 2002; Weigel et al.,
2004. However, the majority of the literature places the log KOW at approximately 1.0
(Cleuvers, 2003) .

20
Fig. 3. Biotransformation of (S)-(+)-ibuprofen as adapted from Chang et al. (2008).
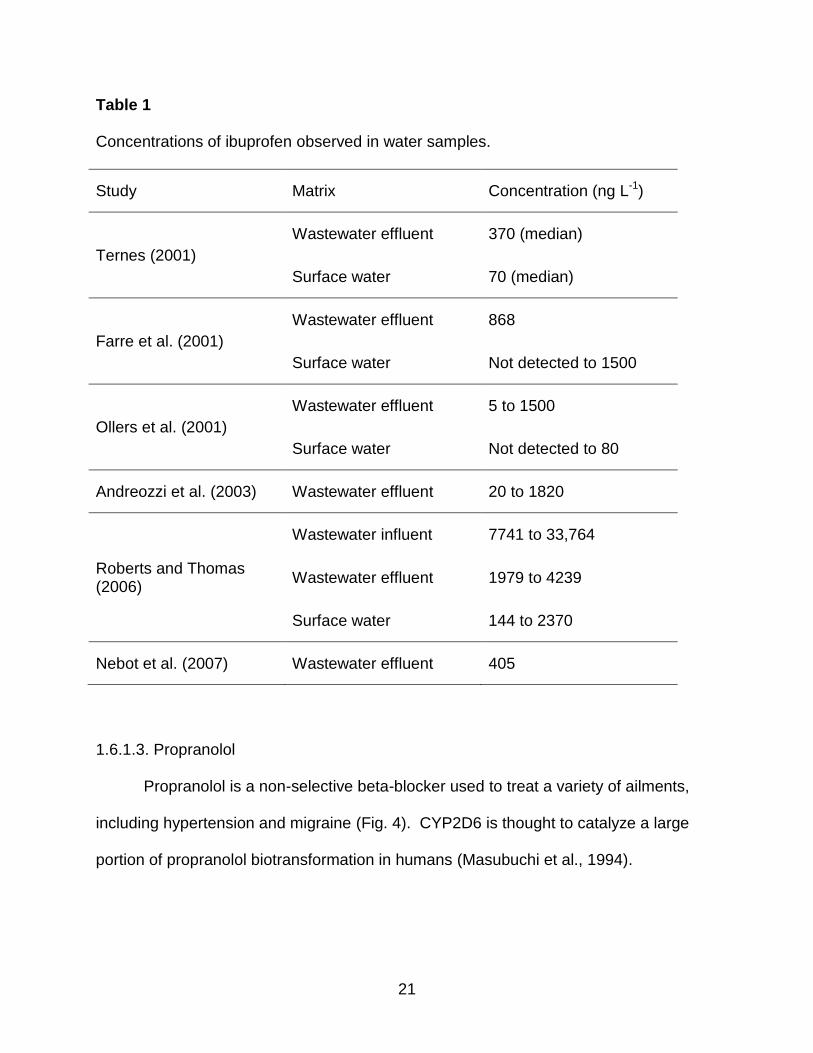
Ibuprofen has been identified in the environment at various concentrations.
Table 1 provides a summary from the literature. The literature review resulted in a
maximum concentration of 4239ng L-1 ibuprofen observed in wastewater effluent and
2370ng L-1 ibuprofen in surface water (Roberts and Thomas, 2006).
21
Table 1
Concentrations of ibuprofen observed in water samples.
Study Matrix Concentration (ng L-1)
Ternes (2001)
Wastewater effluent 370 (median)
Surface water 70 (median)
Farre et al. (2001)
Wastewater effluent 868
Surface water Not detected to 1500
Ollers et al. (2001)
Wastewater effluent 5 to 1500
Surface water Not detected to 80
Andreozzi et al. (2003) Wastewater effluent 20 to 1820
Roberts and Thomas (2006)
Wastewater influent 7741 to 33,764
Wastewater effluent 1979 to 4239
Surface water 144 to 2370
Nebot et al. (2007) Wastewater effluent 405
1.6.1.3. Propranolol
Propranolol is a non-selective beta-blocker used to treat a variety of ailments,
including hypertension and migraine (Fig. 4). CYP2D6 is thought to catalyze a large
portion of propranolol biotransformation in humans (Masubuchi et al., 1994).

22
Fig. 4. Propranolol.
The log KOW of propranolol has been reported extensively in the literature. The
log KOW value differs depending on pH (Table 2). For the purpose of this dissertation,
the log KOW of 0.78 at the physiological pH 7 was used.
Table 2
Experimental log KOW values for propranolol (Johnson et al., 2007).
log KOW pH
0.78 7
1.9 8
3.5 9.5
Propranolol has been identified in the environment at various concentrations.
Table 3 provides a summary from the literature. The literature review resulted in a
maximum concentration of 1900ng L-1 in wastewater effluent and 107ng L-1 in surface
water (Huggett et al., 2003; Roberts and Thomas, 2006).

23
Table 3
Concentrations of propranolol found in water samples.
Study Matrix Concentration (ng L-1)
Ternes (2001)
Wastewater effluent 170 (median)
Surface water 12 (median)
Andreozzi et al. (2003) Wastewater effluent 10 to 90
Huggett et al. (2003) Wastewater effluent 26 to 1900
Roberts and Thomas (2006)
Wastewater influent 60 to 119
Wastewater effluent 195 to 373
Surface water 35 to 107
1.6.2. Model Organisms
Fish are commonly used as model organisms in environmental toxicology (Bols
et al., 2001). Fish are the most diverse group of vertebrates with approximately 20,000
different species (Bols et al., 2005). Fish occupy a broad range of habitats and can be
found in most aquatic niches. They also are found at a variety of trophic levels, an
important attribute when studying bioaccumulation and biomagnification. Fish function
well as laboratory test subjects as many species can live out their entire life cycle in a
laboratory environment. Furthermore, fish provide not only an indicator of aquatic
health, but also of human health. Contaminants released to the aquatic environment
(e.g., wastewater discharge, storm water runoff, aerial deposition) ultimately lead to
human exposure either through direct contact with a water body via recreational use or
24
through indirect consumption of aquatic resources (Bols et al., 2005). Lastly, fish also
are of economic importance. The health of the aquatic environment directly impacts the
strength of fisheries and aquaculture facilities (Costanza et al., 1997).
Rainbow trout (Oncorhynchus mykiss) and channel catfish (Ictalurus punctatus)
served as model organisms in this dissertation. They represent cold and warm water
freshwater teleosts. Rainbow trout inhabit cold water environments while channel
catfish reside in warm water habitats. From a regulatory prospective, fish are the most
commonly used model organism (i.e., OECD 305 as discussed above) (OECD, 1996).
Rainbow trout has a long history as a model species in toxicological research (McKim et
al., 1987; Bailey et al., 1996; Buhler and Wang-Buhler, 1998). Furthermore, a large
body of literature exists studying phase I biotransformation and overall metabolism in
rainbow trout. It is speculated that P450 enzymes of rainbow trout are the most
intensively studied among all aquatic species (Buhler and Wang-Buhler, 1998).
1.6.3. In Vitro Design
Several important issues propel the movement towards in vitro environmental
toxicology assessments. The increased regulatory push for BCF values for all
chemicals in commerce places cost as a key factor. Weisbrod et al. (2007) estimates
the cost for an in vivo OECD 305 study conducted under good laboratory practices
(GLP) at approximately $125,000. When that cost is multiplied by the tens of thousands
of chemicals in commerce without bioconcentration or bioaccumulation data, the cost
become fiscally prohibitive. In vitro studies, such as the ones evaluated in this
dissertation, have the advantage of lower costs. Additionally, in vitro study results are

25
obtained more quickly, allow for more control over dosing and are often more
reproducible (Bols et al., 2005).
In vitro studies also satisfy the societal desire to reduce the use of animals in
toxicological testing (Bols et al., 2005; de Wolf et al., 2007; Weisbrod et al., 2007).
Russell and Burch (1959) defined the principles of the 3Rs (replace, reduce and refine)
to provide a framework for the development of more humane experimental design.
Replacement involves the substitution of insentient test materials for conscious, higher
order animals. Reduction regards the reduction in the number of animals used in a
study. Refinement aims to decrease the incidence and/or severity of inhumane
techniques applied during the course of a study (de Wolf et al., 2007). The studies
conducted in this dissertation fall into the realm of reduction. Through the use of
composited tissue batches, several compounds could be evaluated with the sacrifice of
less than 5% of the fish required to evaluate a single compound with OECD 305.
1.7. References
Andreozzi, R., Raffaele, M., Nicklas, P., 2003. Pharmaceuticals in STP effluents and
their solar photodegradation in aquatic environment . Chemosphere 50, 1319-
1330.
Arnot, J., Gobas, F., 2003. A generic QSAR for assessing the bioaccumulation potential
of organic chemicals in aquatic food webs. QSAR Comb. Sci. 22, 337-345.
Arnot, J., Gobas, F., 2006. A review of bioconcentration factor (BCF) and
bioaccumulation factor (BAF) assessments for chemicals in aquatic organisms.
Environ. Rev. 14, 257-297.

26
Bailey, G., Williams, D., Hendricks, J., 1996. Fish models for environmental
carcinogenesis: the rainbow trout. Environ. Health Persp. 104(Suppl. 1), 5-21.
Barber, M., 2003. A review and comparison of models for predicting dynamic chemical
bioconcentration in fish. Environ. Toxicol. Chem. 22, 1963-1992.
Barron, M.G. 1990. Bioconcentration: Will water-borne organic chemicals accumulate in
aquatic animals? Environ. Sci. Technol. 24, 1612-1618.
Bintein, S., Devillers, J., Karcher, W., 1993. Nonlinear dependence of fish
bioaccumulative chemicals in water and sediment to residues in fish: a
visualization approach. Environ. Toxicol. Chem. 22, 2822-2830.
Black, M., Bjorkroth, K., Oikari, A., 1995. Probing the routes, rates, and mechanisms of
xenobiotic elimination by rainbow trout (Oncorhynchus mykiss) with a
physiological chamber. In: Hughes, J., Biddinger, G., Mones, E. (Eds.),
Environmental Toxicology and Risk Assessment - Third Volume, ASTM STP
1218. American Society for Testing and Materials, Philadelphia, pp. 351-364.
Bols, N., Brubacher, J., Ganassin, R., Lee, L., 2001. Ecotoxicology and innate immunity
in fish. Dev. Comp. Immunol. 25, 853-873.
Bols, N., Dayeh, V., Lee, L., Schirmer, K., 2005. Use of fish cell lines in toxicology and
ecotoxicology of fish. Piscine cell lines in environmental toxicology. In:
Mommsen, T., Moon, T. (Eds.), Biochemistry and Molecular Biology of Fishes,
Vol. 6. Elsevier Science, Amsterdam, pp. 43-84.
Bruggeman, W., Opperhuizen, A., Wijbenga, A., Hutzinger, O., 1984. Bioaccumulation
of super-lipophilic chemicals in fish. Toxicol. Environ. Chem. 7, 173-189.

27
Buckley, D., Klaassen, C., 2007. Tissue- and Gender-Specific mRNA Expression of
UDP-Glucuronosyltransferases (UGTs) in Mice. Drug Metab. Dispos. 35, 121-
127.
Buhler, D., Wang-Buhler, J.-L., 1998. Review: Rainbow trout cytochrome P450s:
purification, molecular aspects, metabolic activity, induction and role in
environmental monitoring. Comp. Biochem. Physiol. 121C, 107-137.
Chang, G., Kam, P., 1999. The physiological and pharmacological roles of cytochrome
P450 isoenzymes. Anaesthesia 54, 42-50.
Chang, S.-Y., Li, W., Traeger, S. C., Wang, B., Cui, D., Zhang, H., Wen, B., Rodrigues,
A.D., 2008. Confirmation that cytochrome P450 2C8 (CYP2C8) plays a minor
role in (S)-(+)- and (R)-(-)-ibuprofen hydroxylation in vitro. Drug Metab. Dispos.
36, 2513-2522.
Cleuvers, M., 2003. Aquatic ecotoxicity of pharmaceuticals including the assessment of
combination effects. Toxicol. Lett. 142, 185-194.
Coon, M., Vaz, A., Bestervelt, L., 1996. Cytochrome P450 2: peroxidative reactions of
diversozymes. FASEB J. 10, 428-434.
Costanza, R., D'Arfe, R., De Groot, R., Farber, S., Grasso, M., Hannon, B., Limburg, K.,
Naeem, S., O'Neill, R.V., Paruelo, J., Raskin, R.G., Sutton, P., Van Den Belt, M.,
1997. The value of the world's ecosystem services and natural capital. Nature
387, 253-260.
Datta Munshi, J., Dutta, H., 1996. Fish morphology: horizon of new research. A.A.
Balkema Publishers, Brookfield, VT.

28
Davies, N., 1998. Clinical pharmacokinetics of ibuprofen. The first 30 years. Clin.
Pharmacokinet. 34, 101-54.
de Wolf, W., Comber, M., Douben, P., Gimeno, S., Holt, M., Lillicrap, L., Sijm, D., van
Egmond, R., Weisbrod, A., Whale, G., 2007. Animal Use Replacement,
Reduction, and Refinement: Development of an Integrated Testing Strategy for
Bioconcentration of Chemicals. Integr. Environ. Assess. Manag. 3, 3-17.
de Wolf, W., de Bruijn, J., Seinen, W., Hermens, J., 1992. Influence of biotransformation
on the relationship between bioconcentration factors and octanol-water partition
coefficients. Environ. Sci. Technol. 26, 1197-1201.
Dimitrov, S., Dimitrova, G., Pavlov, T., Dimitrova, N., Patlewics, G., Niemela, G., 2005.
A stepwise approach for defining applicability domain of SAR and QSAR models.
J. Chem. Inf. Model. 45, 839-849.
Environment Canada, 2003. Guidance Manual for the Ecological Categorization of
Organic and Inorganic Substances on Canada's Domestic Substances List
(DSL). <http://www.ec.gc.ca/substances/ese/eng/dsl/guidance_document.cfm>.
European Chemicals Bureau, 2003. Technical Guidance Document on Risk
Assessment Part II. <http://ecb.jrc.ec.europa.eu/Documents/
TECHNICAL_GUIDANCE_DOCUMENT/EDITION_2/tgdpart2_2ed.pdf>.
European Union, 2006. Regulation (EC) No 1907/2006 of the European Parliment and
of the Council. <http://eur-lex.europa.eu/LexUriServ/LexUriServ.do?uri=
OJ:L:2006:396:0001:0849:EN:PDF>.
Farre, M., Ferrer, I., Ginebreda, A., Figueras, M., Olivella, L., Tirapuc, L., Vilanovac, M.,
Barcelo, D., 2001. Determination of drugs in surface water and wastewater
29
samples by liquid chromatography–mass spectrometry: methods and preliminary
results including toxicity studies with Vibrio fischeri. J. Chromatogr. A 938, 187-
197.
Fernandez, M., Ikonomou, M., Buchanan, I., 2007. An assessment of estrogenic organic
contaminants in Canadian wastewaters. Sci. Total Environ. 373, 250-269.
Galvez, F., Tsui, T., Wood, C., 2008. Cultured trout gill epithelia enriched in pavement
cells or in mitochondria-rich cells provides insights into Na+ and Ca2+ transport.
In Vitro Cell. Dev. An. 44, 415-425.
Gobas, F., 1993. A model for predicting the bioaccumulation of hydrophobic organic
chemicals in aquatic food-webs: application to Lake Ontario. Ecological
Modelling 69, 1-17.
Goeptar, A., Scheerens, H., Vermeulen, N., 1995. Oxygen reductase and substrate
reductase activity of cytochrome P450. Crit. Rev. Toxicol. 25, 25-65.
Hampton, J., Lantz, R., Hinton, D., 1989. Functional units in rainbow trout (Salmo
gairdneri, Richardson) Liver: III. Morphometric analysis of parenchyma, stroma,
and component cell types. Am. J. Anat. 185, 58-73.
Harner, T., Wideman, J.L., Jantunen, L.M., Bidleman, T.F., Parkhurst, W.J., 1999.
Residues of organochlorine pesticides in Alabama soils. Environ. Pollut. 106,
323-332.
Huggett, D., Khan, I., Foran, C., Schlenk, D., 2003. Determination of beta-adrenergic
receptor blocking pharmaceuticals in United States wastewater effluent. Environ.
Pollut. 121, 199-205.
30
Jacqz-Aigrain, E., Anderson, B., 2006. Pain control: Non-steroidal anti-inflammatory
agents. Semin. Fetal Neonatal. Med. 11, 251-259.
Johnson, A., Keller, V., Williams, R., Young, A., 2007. A practical demonstration in
modelling diclofenac and propranolol river water concentrations using a GIS
hydrology model in a rural UK catchment. Environ. Pollut. 146, 155-165.
Jones, O., Voulvoulis, N., Lester, J., 2002,). Aquatic environmental assessment of the
top 25 English prescription pharmaceuticals. Water Res. 36, 5013-5022.
Klaren, P., Guzmán, J., Reutelingsperger, S., Mancera, J., Flik, G., 2007. Low salinity
acclimation and thyroid hormone metabolizing enzymes in gilthead seabream
(Sparus auratus). Gen Comp Endocrinol. 152, 215-22.
Korhonen, T., Turpeinen, M., Tolonen, A., Laine, K., Pelkonen, O., 2008. Identification
of the human cytochrome P450 enzymes involved in the in vitro
biotransformation of lynestrenol and norethindrone. J. Steroid Biochem. Mol. Biol.
110, 56-66.
Kovach, J., Petzoldt, C., Degni, J., Tette, J., 1992. A Method to Measure the
Environmental Impact of Pesticides. New York's Food and Life Sciences Bulletin
139, 1-8.
Kristensen, P., Tyle, H., 1991. The assessment of bioaccumulation. in Nagel, R., Loskill,
R. (Eds.), Bioaccumulation in aquatic systems. VCH Verlagsgesellschaft GmbH,
Weinheim (DE), pp. 189-227.
Kültz, D., Somero, G., 1996. Differences in protein patterns of gill epithelial cells of the
fish Gillichthys mirabilis. J. Comp. Physiol. B 166, 88-100.
31
Laurent, P., 1984. Gill Internal Morphology. in Hoar, W., Randall, D. (Eds.), Fish
Physiology.Vol. X. Gills. Part A. Anatomy, Gas Transfer, and Acid-Base
Regulation. Academic Press, London, pp. 73-183.
Lee, L., Carmosini, N., Sassman, S., Dion, H., Sepulveda, M., 2007. Agricultural
contributions of antimicrobials and hormones on soil and water quality. in Sparks,
D. (Ed.), Advances in Agronomy. Vol. 93 Academic Press, London, pp. 1-93.
Lee, S.-J., Wang-Buhler, J.-L., Col, I., Yu, T.-S., Yang, Y.-H., Miranda, C.L., Lech, J.,
Buhler, D.R., 1998. Cloning, sequencing, and tissue expression of CYP3A27, a
new member of the CYP3A subfamily from embryonic and adult rainbow trout
livers. Arch. Biochem. Biophys. 320, 53-61.
Leguen, I., Carlsson, C., Perdu-Durand, E., Prunet, P., Part, P., Cravedi, J., 2000.
Xenobiotic and steroid biotransformation activities in rainbow trout gill epithelial
cells in culture. Aquat. Toxicol. 48, 165-176.
Leguen, I., Cravedi, J., Pisam, M., Prunet, P., 2001. Biological functions of trout
pavement-like gill cells in primary culture on solid support: pH(i) regulation, cell
volume regulation and xenobiotic biotransformation. Comp. Biochem. Physiol. A
Mol. Integr. Physiol. 128, 207-222.
Lester, S., Braunbeck, T., Teh, S., Stegeman, J., Miller, M., Hinton, D., 1993. Hepatic
Cellular Distribution of Cytochrome P-450 IA1 in Rainbow Trout (Oncorhynchus
mykiss): An Immunohisto- and Cytochemical Study. Cancer Res. 53, 3700-3706.
Lien, G., McKim, J., 1993. Predicting branchial and cutaneous uptake of 2,2',5,5'-
tetrachlorobiphenyl in fathead minnows (Pimephales promelas) and Japanese
medaka (Oryzias latipes): Rate limiting factors. Aquat. Toxicol. 27, 15-32.
32
Lindstrom-Seppa, P., Koivusaari, U., Hanninen, O., 1981. Extrahepatic xenobiotic
metabolism in north-European freshwater fish. Comp. Biochem. Physiol. 69C,
259-263.
Lipnick, R.L., Muir, D.C., 2000. History of Persistent, Bioaccumulative, and Toxic
Chemicals. in Lipnick, R.L., Hermens, J.L., Jones, K.C., Muir, D.C. (Eds.),
Persistent, Bioaccumulative, and Toxic Chemicals I. American Chemical Society,
Washington, DC, pp.1-12.
Masubuchi, Y., Hosokawa, S., Horie, T., Ohmori, S., Kitada, M., Suzuki, T., Narimatsu,
S., 1994. Cytochrome P-450 isozymes involved in propranolol metabolism in
human liver microsomes: The role of CYP-2D6 as ring hydroxylase and CYP1A2
as N-desisopropylase. Drug Metab. Dispos. 22, 909-915.
McKim, J., Goeden, H., 1982. A direct measure of the uptake efficiency of a xenobiotic
chemical across the gills of brook trout (Salvelinus fontinalis) under normoxic and
hypoxic conditions. Comp. Biochem. Physiol. 72C, 65-74.
McKim, J., Bradbury, S., Memi, G., 1987. Fish acute toxicity syndromes and their use in
the QSAR approach to hazard assessment. Environ. Health Persp. 71, 171-86.
Mekenyan, O., Pavlov, T., Grancharov, V., Todorov, M., Schmieder, P., Veith, G., 2005.
2D-3D migration of large chemical inventories with conformational multiplication:
application of the genetic algorithm. J. Chem. Inf. Model 45, 283-292.
Meylan, W., Howard, P., Boethling, R., Aronson, D., Printup, H., Gouchie, S., 1999.
Improved method for estimating bioconcentration/bioaccumulation factor from
octanol/water partition coefficient. Environ. Toxicol. Chem. 18, 664-672.
33
Miller, M., Hinton, D., Stegeman, J., 1989. Cytochrome P-450 E induction and
localization in gill pillar (endothelial) cells of scup and rainbow trout. Aquat.
Toxicol. (Amst.). 14, 307-322.
Miller, M., Hinton, D., Blair, J., Stegeman, J., 1988. Immunohistochemical localization of
cytochromc P-450E in liver, gill and heart of scup (Stenotomus chrysops) and
rainbow trout (Salmo gairdneri). Mar. Environ. Res. 24, 37-39.
Nebot, C., Gibb, S., Boyd, K., 2007. Quantification of human pharmaceuticals in water
samples by high performance liquid chromatography–tandem mass
spectrometry. Anal. Chem. Acta. 598, 87-94.
Neely, W., Branson, D., Blau, G., 1974. Partition coefficient to measure
bioconcentration potential of organic chemicals in fish. Environ. Sci. Technol. 8,
1113-1115.
Norstrom, R., McKinnon, A., de Freitas, A., 1976. A bioenergetics-based model for
pollutant accumulation by fish. Simulation of PCB and methylmercury residue
levels in Ottawa river yellow perch (Perca flavescens). J. Fish Res. Board Can.
33, 248–267.
NYDEC (New York Department of Environmental Conservation), 1998. Division of
Water Technical and Operational Guidance Series (1.1.4): Procedures for
Derivation of Bioaccumulation Factors. Albany, NY.
OECD (Organization for Economic Cooperation and Development), 1996.
Bioconcentration: Flow-through Fish Tests, 305, last updated 14 June 1996.
Paris, France.
34
Öllers, S., Singer, H., Fässler, P., Müller, S., 2001. Simultaneous quantification of
neutral and acidic pharmaceuticals and pesticides at the low-ng/l level in surface
and waste water. J. Chromatogr. A 911, 225-234.
Olsen, K., 2002. Gill Circulation: Regulation of perfusion distribution and metabolism of
regulatory molecules. J. Exp. Zool. 293, 320-335.
Orme, M., 1982. The third S.K. & F. prize lecture, University of London, December
1981: The clinical pharmacology of oral contraceptive steroids. Br. J. Clin.
Pharmac. 14, 31-42.
Parkinson, A., Ogilvie, B. 2007. Biotransformation of Xenobiotics. in Casarett, L.,
Klaassen, C., Doull, J. (Eds.), Casarett and Doull's toxicology: the basic science
of poisons, 7th ed. McGraw-Hill Professional, New York, pp. 161-304.
Payan, P., Girard, J., Mayer-Gostan, N., 1984. Branchial Ion Movements in Teleosts:
The Roles of Respiratory and Chloride Cells. in Hoar, W., Randall, D. (Eds.), Fish
Physiology. Vol. X. Gills. Part B. Ion and Water Transfer. Academic Press,
London, pp. 42.
Pesonen, M., Andersson, T., 1991. Characterization and induction of xenobiotic
metabolizing enzyme activities in a primary culture of rainbow trout hepatocytes.
Xenobiotica. 21, 461-471.
Randall, D., Lin, H., Wright, P., 1991. Gill water flow and the chemistry of the boundary
layer. Physiol. Zool. 64, 26-38.
Ritter, J., 2000. Roles of glucuronidation and UDP-glucuronosyltransferases in
xenobiotic bioactivation reactions. Chem. Biol. Interact. 129, 171-193.

35
Roberts, P., Thomas, K., 2006. The occurrence of selected pharmaceuticals in
wastewater effluent and surface waters of the lower Tyne catchment. Sci. Total
Environ. 356, 143-153.
Robertson, O., Wexler, B., 1960. Histological changes in the organs and tissues of
migrating and spawning Pacific salmon (genus Oncorhynchus). Endocrinol. 66,
222-239.
Russell, W., Burch, R., 1959. The principles of humane experimental technique.
Methuen, London.
Saha, A., Roy, K., De, K., Sengupta, C., 2000. Effects of oral contraceptive
norethindrone on blood-lipid and lipid peroxidation parameters. Acta. Pol. Pharm.
57, 441-7.
Schlezinger, J., Parker, C., Zeldin, D., Stegeman, J., 1998. Arachidonic acid metabolism
in the marine fish Stenotomus chrysops (Scup) and the effects of cytochrome
P450 1A inducers. Arch. Biochem. Biophys. 353, 265-275.
Schurmann, G., Klein, W., 1988. Advances in bioconcentration prediction.
Chemosphere 17, 1551-1574.
Sijm, D., Part, P., Opperhuizen, A., 1993. The influence of temperature on the uptake
rate constants of hydrophobic compounds determined by the isolated perfused
gills of rainbow trout (Oncorhynchus mykiss). Aquat. Toxicol. 25, 1-14.
Sijm, D., Verberne, M., deJonge, W., Part, P., Opperhuizen, A., 1995. Allometry in the
uptake of hydrophobic chemicals determined in vivo and in isolated perfused
gills. Toxicol. Appl. Pharmacol. 131, 130-135.
36
Spacie, A., & Hamelink, J. (1985). Bioaccumulation. in Rand, G., Petrocelli, S. (Eds.),
Fundamentals of Aquatic Toxicology: Methods and Applications. Hemisphere
Publishing Corp., New York, pp. 495-525.
Streit, B., 1998. Bioaccumulation of contaminants in fish. in Braunbeck, T., Hinton, D.,
Streit, B. (Eds.), Fish Ecotoxicology. Birkhauser Verlag Basel, Switzerland, pp.
353-387.
Ternes, T., 2001. Analytical methods for the determination of pharmaceuticals in
aqueous environmental samples. Trends Anal. Chem. 20, :419-434.
United Nations, 2001. Stockholm Convention on Persistent Organic Pollutants.
<http://chm.pops.int/Portals/0/Repository/convention_text/UNEP-POPS-COP-
CONVTEXT-FULL.English.PDF>.
USEPA (United States Environmental Protection Agency), 1999. Category for
Persistent, Bioaccumulative, and Toxic New Chemicals. 2009, from Federal
Register: November 4, 1999 (Volume 64, Number 213).
<http://www.epa.gov/fedrgstr/EPA-TOX/1999/November/Day-04/t28888.htm>.
van Emden, H.F., Peakall, D.B., 1999. Beyond Silent Spring: Integrated Pest
Management and Chemical Safety. Integrated Pest Mgmt. Rev. 4, 269-270.
Veith, G., DeFoe, D., 1979. Measuring and estimating the bioconcentration factor of
chemicals in fish. Fish Res. Board Can. 36, 1040-48.
Walter, R., Sung, H., Intano, G., Walter, C., 2001. Characterization of O(6)-
methylguanine-DNA-methyltransferase (O(6)-MGMT) activity in Xiphophorus
fishes. Mutat. Res. 493, 11-22.
37
Weigel, S., Kallenborn, R., Hühnerfuss, H., 2004. Simultaneous solid-phase extraction
of acidic, neutral and basic pharmaceuticals from aqueous samples at ambient
(neutral) pH and their determination by gas chromatography–mass spectrometry.
J. Chromatogr. A 1023, 183-195.
Weisbrod, A., Burkhard, L., Arnot, J., Mekenyan, O., Howard, P.H., Russom, C.,
Boethling, R., Sakuratani, Y., Traas, T., Bridges, T., Lutz, C., Bonnell, M.,
Woodburn, K., Parkerton, T., 2007. Workgroup report: review of fish
bioaccumulation databases used to identify persistent, bioaccumulative, toxic
substances. Environ. Health Perspect. 115, 255-261.
Williams, D., Buhler, D., 1984. Benzo[a]pyrene hydroxylase catalyzed by purified
isozymes of cytochrome P-450 from B-naphthoflavone-fed rainbow trout.
Biochem. Pharmacol. 43, 4752-4756.
Wilson, J., Laurent, P., 2002. Fish Gill Morphology: Inside Out. J. Exp. Zool. 293, 192-
213.
38
CHAPTER 2
THE INFLUENCE OF GILL AND LIVER METABOLISM IN S9 FRACTIONS ON THE
PREDICTED BIOCONCENTRATION OF PHARMACEUTICALS IN FISH
2.1. Introduction
The bioconcentration factor (BCF) is a quantitative expression of a compound’s
ability to partition into and remain in an organism following aqueous exposure,
increasing the potential for chronic toxic effects and/or biomagnification in higher trophic
levels. Bioconcentration often represents a surrogate measure for “B” in PBT, a
regulatory classification for persistent, bioaccumulative and toxic substances that has
taken on greater importance with the implementation of the European Union regulation
on the Registration, Evaluation and Authorisation of Chemicals (REACH) and the
Canadian assessment of chemicals on the Domestic Substances List (DSL). Of the
thousands of chemicals currently in commerce, most lack published data on their
bioaccumulation potential. For example, of the 11,300 organic chemicals under review
on the Canadian DSL, only 4% have publicly published BAF or BCF values (Arnot and
Gobas, 2006). Thus, a method for accurately determining large quantities of BCF
values is necessary. Multi-compartment BCF models provide such an alternative
method.
Historically, models utilize KOW as the primary determinant of BCF. Recent BCF
modeling efforts have proposed a multi-compartment model based on the principles of
absorption, distribution, metabolism and elimination (ADME) (Arnot and Gobas, 2004;
Cowan-Ellsberry et al., 2008; Arnot et al., 2009). The model includes: uptake via gills
39
(k1), dietary ingestion (kU), elimination across gills (k2 ), growth (kG), metabolism (kM)
and egestion (kE) (Gobas, 1993).
BCF = (k1 + kU) / (k2 + kG +kM +kE) (7)
By far, a majority of efforts have focused on the role of metabolism on the
process of bioconcentration (Arnot et al., 2008; Cowan-Ellsberry et al., 2008; Dyer et al.,
2009). Building on concepts developed within the human pharmaceutical sector, in vitro
fish metabolism information may be able to predict whole fish clearance, and thus,
contribute to a more realistic calculated BCF (Obach, 1999; Mohutsky et al., 2006;
Cowan-Ellsberry et al., 2008).
While human science has focused on ionizable pharmaceuticals, most
environmental work has focused on neutral, lipophilic chemicals. This study evaluates
the ability of in vitro fish metabolism data to determine whole fish intrinsic clearance,
using ibuprofen (a weak acid), norethindrone (a neutral compound) and propranolol (a
weak base) as the test compounds. Test compounds were chosen as they are readily
metabolized in human and mammalian liver and have been found in the aquatic
environment at trace levels. In the human and rat liver, cytochrome P450 (CYP) 2C9
and 2C8 contribute to the majority of phase I metabolism of ibuprofen (Jacqz-Aigrain
and Anderson, 2006). Ibuprofen also undergoes glucuronidation by multiple UDP-
glucuronosyltransferase (UGT) isoforms (Ritter, 2000). In human liver, norethindrone is
primarily metabolized by CYP3A4 (Korhonen et al., 2008). CYP2D6 is thought to
catalyze a large portion of propranolol biotransformation in humans (Masubuchi et al.,
1994). As fish do not contain the same CYP isoforms as mammals, and are specifically
40
known not to have CYP2C or 2D homologs (Buhler and Wang-Buhler, 1998), it cannot
be assumed that fish biotransformation of these pharmaceuticals will be equivalent to
that of mammals. Therefore, this study assessed biotransformation through the
measurement of loss of parent compound.
2.2. Materials and Methods
2.2.1. Materials
All chemicals used in incubation assays were purchased from Sigma-Aldrich
Corp. (St. Louis, MO). Homogenization buffer (50mM potassium phosphate, 0.15M
potassium chloride, 0.2M sucrose) materials were obtained from Fisher Chemical
(Fairlawn, NJ). The Bradford Protein Assay was procured from Bio-Rad Laboratories
(Hercules, CA). Uninduced, male Sprague-Dawley rat liver S9 and uninduced, male
CD-1 mouse liver S9 were purchased from Moltox (Boone, NC). (±)-Ibuprofen, d3-
ibuprofen, norethindrone and d6-norethindrone were sourced from Toronto Research
Chemicals (North York, ON, Canada). (±)-Propranolol was supplied by TOCRIS
Bioscience (Ellisville, MO). d7-propranolol was purchased from CDN Isotopes Inc.
(Pointe-Claire, Quebec, Canada).
2.2.2. Fish Cultures
Gill and liver tissue were harvested from anesthetized (e.g. MS-222) mature
rainbow trout (Oncorhynchus mykiss) and channel catfish (Ictalurus punctatus). Fish
were procured from Greers Ferry National Fish Hatchery (Heber Springs, AR). Fish
were maintained in dechlorinated tap water at the appropriate temperature (16°C for
rainbow trout and room temperature (~25°C) for channel catfish) in Frigid Units Living
41
Streams under fluorescent lights with a 16 hour light/8 hour dark photoperiod. Fish
were fed ground Purina Trout Chow. All studies were conducted in accordance with
University of North Texas animal use protocols.
2.2.3. S9 Fractions
Tissues were rinsed thoroughly with a homogenization buffer and immediately
placed on ice (Kelly et al., 2000). Gill, liver and whole fish wet weights were collected
prior to further processing. Gill tissue was then composited, minced and mixed with a
homogenization buffer in a 2:1 buffer to tissue ratio (v:w). Liver tissues were
homogenized with a 4:1 buffer to tissue ratio. Tissue from five to ten fish were
homogenized together to reduce interfish variability. Additionally, multiple tissue
homogenate batches were prepared to evaluate homogenate variability. Four to ten
tissue homogenates were utilized to evaluate loss of parent (i.e., n = 4-10) within each
tissue type. Tissues were homogenized on ice using an electric homogenizer. The
homogenate was placed in chilled centrifuge tubes and centrifuged at 9,000g for 20
minutes at 4°C. The S9 supernatant was carefully separated from the pellet via pipette
and stored at -80°C.
2.2.4. Incubation of S9 fractions
S9 fractions were diluted to 2mg protein mL-1 with 0.01M phosphate buffer (pH
7.4). The Bradford Protein Assay was used to determine the protein content of each
sample. A NADPH regeneration system containing 7mM isocitrate and isocitrate
dehydrogenase (0.5 units of activity mL-1) was then added to 600μL S9 in
microcentrifuge tubes. Test compounds were dissolved in ethanol to create 100X stock

42
solutions. To reduce any reaction interference from the ethanol, only 6.5μL was added
to the S9 samples to bring the reaction vessel concentration to 10μM test compound.
Samples were run in duplicate or triplicate. S9 matrix controls and solvent controls
were run with each assay to assure that loss of parent was not due to binding effects.
Samples were placed in a temperature controlled shaker (15°C for trout, 25°C for catfish
and 37°C for mammalian) to equilibrate for 10 minutes. To initiate the reactions, 6.5μL
of 50mM NADPH in phosphate buffer was added to each sample. S9 and solvent
controls did not receive NADPH. Samples were returned to the shaker and incubated
for 90 to 120 minutes. Aliquots of 100μL were removed at the appropriate time points
for each test material. Aliquots were placed in 100μL cold methanol and vortexed to
stop biological activity. Deuterated internal standard was then added. Samples were
centrifuged at 2500g for 10 minutes to pellet the denatured protein. The supernatant
was carefully removed via pipette and stored at 4°C until GC/MS or LC-MS/MS
analysis.
2.2.5. Instrumental Analysis
2.2.5.1. GC/MS
Ibuprofen samples were dried under a gentle stream of nitrogen. The
derivatizing agent boron trifluoride (BF3)-methanol and acetonitrile were added.
Samples were incubated at 85°C for two hours. Approximately 200µL of milli-Q water
(MQ) was added and the derivatized ibuprofen was back extracted into 1:1 hexane:ethyl
acetate. Samples were then dried again under nitrogen gas and reconstituted to 100µL
with hexane. Samples were analyzed using an Agilent 6890N Network GC System
coupled with an Agilent 5973 inert Mass Selective Detector and an Agilent autosampler
43
(Agilent Technologies, Inc.). Samples were injected at 260°C in pulsed splitless mode
onto an Econo-Cap™ EC™-5 (30m x 0.25mm x 0.25μm) column. Injection pressure
was held constant at 9.5psi and with a flow of 18.5mL min-1. Initial temperature of 40°C
was held for three minutes, increased 10°C min-1 until 200°C, further increased 15°C
min-1 until 300°C and then held for five minutes. Analytes were detected and quantified
in selective ion monitoring (SIM) mode with the quantitative ions 161 m/z for ibuprofen
and 164 m/z for d6-ibuprofen. A seven-point calibration curve was used for
quantification.
2.2.5.2. LC-MS/MS Analysis
Norethindrone and propranolol samples were dried under nitrogen and
reconstituted in 100µL 1:1 methanol:MQ. LC-MS/MS was carried out using a Waters
2695 Separations Module and autosampler (Waters). Chromatography was performed
on a Sunfire C18 (2.1mm x 50mm, 3.5µm) column (Waters). Analyte identification was
performed using a Micromass Quattro Ultima mass spectrometry system with an
electrospray interface run in positive mode (Micromass). The flow rate for all
applications was 0.2mL min-1 with an injection volume of 10µL.
The mobile phase for norethindrone analysis consisted of MQ with 0.1% formic
acid (solvent A) and methanol with 0.1% formic acid (Solvent B1). Initial mobile phase
conditions of 70% solvent A:30% solvent B1 were held for one minute and then solvent
B1 was increased to 70% over three minutes. Solvent B1 was further increased to 95%
over 30 seconds and then decreased to 70% over two minutes. Initial mobile phase
conditions were returned over 30 seconds and held for three minutes. For propranolol,
the mobile phase comprised of solvent A and 2:1 acetonitrile:methanol with 0.1% formic

44
acid (solvent B2). Initial mobile phase of 90% solvent A:10% solvent B2 was held for 30
seconds. Solvent B2 linearly increased to 90% over 9.5 minutes. Initial conditions were
then linearly resumed over the course of two minutes.
Individual tune files were created for each analyte. Norethindrone settings
consisted of 4.0kV capillary voltage, 60V cone voltage and 30eV collision energy. For
propranolol, capillary voltage was 4.0kV with cone voltage at 45V and collision energy
at 17eV. Protonated ions were dissociated with argon for norethindrone (m/z
298.5>108.2), d6-norethindrone (m/z 304.1>113.8), propranolol (m/z 260.1>183.4) and
d7-propranolol (m/z 267.1>190.1) with detection in multiple reaction monitoring (MRM)
mode. Six-point calibration curves of analyte standards were used for quantification.
2.2.6. Ethoxyresorufin-O-deethylase (EROD) activity
To ensure S9 fractions were metabolically active, the dealkylation of
ethoxyresorufin to resorufin was measured. S9 fractions were diluted to 2mg protein
mL-1 with 0.01M phosphate buffer (pH 7.4). Ethoxyresorufin (5µM) was added.
NADPH (10µM) was added to initiate the reaction. Samples were covered in aluminum
foil and placed in a shaker within a dark incubator (15°C for rainbow trout fractions,
25°C for channel catfish fractions). S9 matrix controls and blanks did not receive
NADPH. Aliquots were removed at 0, 20, 40 and 60 minute time points and placed in
four volumes of cold methanol in black 96-well plates to stop the reaction. Samples
were immediately read for fluorescence (excitation 530nm, emission 590nm) on a
Synergy 2 Multi-Mode Microplate Reader (BioTek). A five-point resorufin standard
curve (10-50µg mL-1) was used for quantification. All work was conducted in low light
conditions.

45
2.2.7. In vitro metabolic transformation rates of the gill and liver
In vitro metabolic transformation rates of the gill and liver were determined using
the bioconcentration model described by Cowan-Ellsberry et al. (2008) (Fig. 5). The
model extrapolates in vitro test data to determine a whole body metabolic
transformation rate using key fish physiological information (Table 4). This extrapolation
is based on concepts commonly applied in mammalian pharmacokinetics (Obach,
1999). Intrinsic clearance rate of parent compound (CLm) was determined from in vitro
S9 data per mg protein in the assay vessel. Multiplication of tissue weight and total
protein content determined intrinsic clearance in tissue (CLi), which was extrapolated to
tissue clearance (CLt) by including cardiac output, fraction of blood flow through tissue
and a free fraction correction term. Division by the volume of distribution then produced
the metabolic transformation rate (kM). BCF was then calculated, incorporating kM
(BCFM) and with kM equal to zero (BCF0). BCF calculations also included predicted k1,
k2, kE and kG values based upon KOW, total fish weight and fish lipid content.
Parameters, such as body composition and blood composition obtained from Cowan-
Ellsberry et al (2008), were not altered across species as they affected BCF calculations
and eliminated the ability to directly compare the impact of the metabolic transformation
rate.

46
Fig. 5. Extrapolation of in vitro S9 metabolism assay to the metabolic transformation
rate (kM) based upon Cowan-Ellsberry et al. (2008). [CLm, intrinsic clearance rate of
parent compound (mL hr-1 (mg protein)-1) ; CLi, intrinsic clearance in tissue (L d-1 kg-1);
TW, tissue weight (g tissue (kg body weight)-1); PL, protein per g tissue (g g-1); CLt,
tissue clearance (L d-1 kg-1); CO, cardiac output (mL min-1 kg-1); TF, fraction of blood
flow through tissue; fu, free fraction correction term; Vd, volume of distribution (L kg-1)].

47
Table 4
Physiological and physical characteristics used to extrapolate in vitro metabolic
transformation within the BCF model. Mean values are reported. Tissue batch specific
values were used in the calculation of individual kM and BCFM. Values were determined
during the course of the study or in other unpublished laboratory studies. *Information
to calculate characteristic provided by supplier (Moltox). †Information collected from
literature (Davies and Morris, 1993; Gearhart et al., 1994; Houston, 1994; Janssen et
al., 2002).
Trout Gill
Trout Liver
Catfish Gill
Catfish Liver
Rat Liver
Mouse Liver
Body weight (kg) 0.204 0.204 0.157 0.157 0.289* 0.028*
Tissue weight (g (g bw)-1) 12.2 15.1 6.9 19.4 37.8* 37.9*
Protein level (g protein (g tissue)-1)
0.042 0.078 0.024 0.094 0.045† 0.045†
Cardiac output (mL min-1 kg-1) 16.9 16.9 26.2 26.2 263† 484†
Fraction of blood flow through tissue
1.0 0.20 1.0 0.20 0.20† 0.25†
Body composition
lipid 0.10 0.10 0.10 0.10 0.1 0.1
non-lipid organic 0.20 0.20 0.20 0.20 0.2 0.2
water 0.70 0.70 0.70 0.70 0.7 0.7
Blood composition
blood lipid 0.01 0.01 0.01 0.01 0.01 0.01
non-lipid organic 0.15 0.15 0.15 0.15 0.15 0.15
water 0.84 0.84 0.84 0.84 0.84 0.84
Temperature of environment 15°C 15°C 25°C 25°C 37°C 37°C

48
2.2.8. Statistical Analysis
Statistical analysis was conducted using GraphPad Prism 5 (GraphPad Software,
Inc.). Loss of parent data was found to be homoscedastic within each S9 fraction type
(i.e., catfish liver S9, etc.). Two-way repeated measures ANOVA confirmed statistical
significance of loss of parent compound over time while Bonferroni post tests were used
to evaluate the differences between tissue homogenate batches at each sample time
point. CLm and BCF values were analyzed either via an unpaired t-test or one-way
ANOVA with Bonferroni's multiple comparison post test, depending upon the number of
items compared. Mean and standard deviation are shown in all figures.
2.3. Results
2.3.1. EROD Activity
EROD assays confirmed metabolic activity of the multiple tissue fractions.
Resorufin concentration significantly increased over time in each test article, signifying
CYP1A2 activity (Fig. 6). Resorufin was observed for trout liver and gill S9 at
376.4±23.4 and 363.7±17.9pmol mg protein-1 after 60 minutes, which equated to mean
32.7% and 13.3% increases in resorufin. For catfish liver and gill S9, resorufin
concentrations were 269.5±37.3 and 268.2±15.8pmol mg protein-1 after 60 minutes,
which equated to mean 16.3% and 27.7% increases.

49
Fig. 6. Percent increase in resorufin over 60 minute time course.
2.3.2. Intrinsic clearance rate of parent compound
Loss of parent compound was observed in all trials, indicating metabolic activity
in the S9 fractions. However, loss of parent compound occurred at varying rates among
species and tissue type (Fig. 7). CLm was calculated from loss of parent using
analytically confirmed initial parent concentrations (Fig. 8). In general, liver fractions
provided higher clearance rates than gill fractions. For norethindrone and propranolol, a
significant difference was observed between liver and gill CLm within each species.
However, a difference between species was not observed as the CLm of trout and
catfish liver and the CLm of trout and catfish gill were not significantly different.
Ibuprofen metabolism did not follow the trend of higher liver clearance rates. The
difference between liver and gill fractions was not considered significantly different.
While gill clearance rates for ibuprofen were in the same range as those observed for
norethindrone and propranolol, ibuprofen liver clearance rates were significantly less
than those of norethindrone and propranolol. Ibuprofen metabolism was also tested in
uninduced Sprague-Dawley rat and CD-1 mouse S9 to provide further perspective on
the lower intrinsic clearance rates found in fish liver S9. CLm of rat and mouse were not

50
significantly different than those of fish. Thus, ibuprofen appears to have a lower
clearance rate across species than propranolol and norethindrone.
Fig. 7. Mean loss of parent compound in S9 fractions over 90 minute study time period.

51
Fig. 8. Mean CLm of S9 fractions. “*” indicates significant difference from S9 of the
same species.

52
Table 5
Comparison of intrinsic clearance rate (CLm), extrapolated metabolic transformation rate (kM), BCFM and BCF0. Mean and
standard error reported. †Represents four assay replicates of single lot of pooled rat or mouse S9.
Norethindrone Propranolol Ibuprofen
Trout Liver S9
Trout Gill S9
Catfish Liver S9
Catfish Gill S9
Trout Liver S9
Trout Gill S9
Catfish Liver S9
Catfish Gill S9
Trout Liver S9
Trout Gill S9
Catfish Liver S9
Catfish Gill S9
Rat Liver S9
Mouse Liver S9
n 10 6 8 4 6 7 6 5 7 6 8 6 † †
CLm 77.4 ± 13.2
11.9 ± 3.1
105.1 ± 8.7
23.8 ± 8.8
180.9 ±
13.8
460.6 ±
16.8
149.1 ± 12.5
61.2 ± 15.9
46.7 ±
12.3
48.9 ±
18.1
41.0 ± 6.0
74.5 ± 22.1
89.7 ± 16.0
46.72 ± 7.1
kM 0.26 ± 0.04
0.03 ± 0.01
0.52 ± 0.03
0.02 ± 0.006
1.75 ±
0.07
0.50 ± 0.13
2.45 ± 0.12
0.17 ± 0.04
0.56 ±
0.12
0.69 ±
0.12
0.82 ± 0.10
0.17 ± 0.05
2.02 ± 0.35
1.1 ± 0.17
BCFM 84.9 ±
1.6 96.1 ±
0.3 76.8 ±
0.9 96.3 ±
0.3
0.55 ±
0.003
0.59 ± 0.004
0.54 ± 0.003
0.60 ± 0.002
0.97 ±
0.02
0.97 ±
0.005
0.96 ± 0.005
0.99 ± 0.003
0.88 ± 0.02
0.97 ± 0.004
BCFM(total) 83.5 ± 1.6 76.2 ± 0.9 0.53 ± 0.005 0.53 ± 0.004 0.93 ± 0.02 0.95 ± 0.006 0.88 ± 0.02
0.97 ± 0.004
BCF0 97.3 0.60 1.0

53
2.3.3. Metabolic transformation rate
As described in section 2.8, the metabolic transformation rate (kM, d-1) was
extrapolated from loss of parent (Table 5). Fish tissue fractions with higher CLm had
correspondingly higher kM as the physiological parameters entered for trout and catfish
were not greatly different. However, the increased liver to body weight, TW and CO of
the rat enhanced its calculated kM.
2.3.4. BCF
Not all tissue fractions consistently contributed to a significantly reduced BCF.
Predicted BCF0 for norethindrone, propranolol and ibuprofen were 97.3, 0.60 and 1.0
respectively. BCFM including trout liver kM were highly significantly less than the original
predicted BCF0 for all three compounds. Catfish liver BCFM was also significantly less
than BCF0 for all compounds. Trout gill metabolism significantly lowered BCFM for
ibuprofen and propranolol; however, its impact on norethindrone was considered not
significant. Catfish gill did not significantly reduce BCF in any of the compounds.
Mean gill and liver kM were combined additively to obtain kM(total), representing
total fish metabolic transformation. Trout BCFM(total) was significantly smaller than BCFM
based on liver alone (BCFM(liver)) for propranolol (0.53 ± 0.005) and ibuprofen (0.93 ±
0.02). Trout BCFM(total) was not significantly less than trout BCFM(liver) for norethindrone
(83.5 ± 1.6) due to minimal gill clearance. Conversely, a significant difference was
noted between catfish BCFM(total) and BCFM(liver) for norethindrone (76.2 ± 0.9).
Significant differences were not observed with propranolol (0.53 ± 0.004) and ibuprofen
(0.95 ± 0.006). Lastly, in continuing with mammalian comparisons for ibuprofen, rat

54
liver BCFM (0.88 ± 0.02) was significantly less than trout and catfish BCFM(total).
However, mouse BCFM (0.97 ± 0.004) was not significantly different.
2.4. Discussion and Conclusions
This study aimed at finding a simple method for determining kM in vitro. The
method proved reliable in providing reproducible intrinsic clearance rates between
different batches of tissue homogenates. A significant difference was not observed
between the CLm within a tissue fraction type, supporting the use of tissue homogenates
to reduce interfish variability. Additionally, the fish used during this study were procured
at different times over the course of two years. Variability from the assorted fish
procurement batches was not seen.
As intrinsic clearance rates were scaled to metabolic transformation rates, the
physiological parameters used in the model influenced calculated kM values in different
ways. For example, mean TW differed between liver and gill with liver accounting for a
larger proportion of body weight than gill. The larger liver TW increased kM, and thus
correspondingly decreased BCFM. The same is true for tissue protein levels (PL). Liver
had larger PL than gill, which increased kM. Differences in cardiac output between the
two fish species was not great enough to result in significant differences in kM.
However, a 10-fold increase in cardiac output, as seen in the rat, did significantly
increase kM.
Differences in metabolism and CLm were observed between tissue types
throughout the study. For norethindrone and propranolol, gill CLm was smaller than that
of liver. Other studies have suggested that gill metabolic activity is less than that of the
liver. Arachidonic acid metabolism in scup (Stenotomus chrysops) gill microsomes was
55
found to be 10- to 30-fold less than that of scrup liver microsomes (Schlezinger et al.,
1998). Metabolic activity in rainbow trout gill epithelial cells was observed at between
seven- and 60-fold less than isolated hepatocytes, depending on the substrate (7-
ethoxycoumarin, aniline and testosterone) (Leguen et al., 2000). Others have reported
similar metabolic differences (Pesonen and Andersson, 1991; Lindstrom-Seppa et al.,
1981).
Although differences in CLm were noted between tissues, differences in intrinsic
clearance rates were not found between species. In contrast, significant differences
were seen in BCFM values between species in some cases. The biological and
ecological relevance of these differences in BCFM must be put into perspective. For
instance, BCFM for propranolol was significantly different between trout and catfish for
both liver and gill. Nonetheless, these differences were less than a 0.1 change in BCF
and are most likely not biologically or ecologically relevant to either fish species.
Overall, the inclusion of gill and liver kM decreased norethindrone BCFs by 14.2%
in trout and 21.7% in catfish. Propranolol BCFs decreased by 11.7% in both fish
species. Ibuprofen BCFs decreased by 7.0%, 5.0%, 12.0% and 3.0% for trout, catfish,
rat and mouse respectively. The inclusion of kM brought predicted BCFs closer to
observed in vivo BCFs (Nallani et al., 2009).
Although the test compounds are not expected to bioconcentrate due to their
small KOW, they demonstrate the metabolic activity of fish S9 fractions and the potential
for fish to clear xenobiotics. Furthermore, they serve to advance method development
of in vitro metabolism assays. The application of in vitro metabolism assays in an
integrated ADME bioconcentration model has the potential to derive more realistic BCF
56
values while dramatically reducing study time, cost and the number of animals required
(OECD, 1996; de Wolf et al., 2007; Weisbrod et al., 2007).
2.5. References
Arnot, J. A., Gobas, F. A., 2004. A food web bioaccumulation model for organic
chemicals in aquatic ecosystems. Environ. Toxicol. Chem. 10, 2343–2355.
Arnot, J., Gobas, F. A., 2006. A review of bioconcentration factor (BCF) and
bioaccumulation factor (BAF) assessments for chemicals in aquatic organisms.
Environ. Rev. 14, 257-297.
Arnot, J. A., Mackay, D., Parkerton, T., & Bonnell, M., 2008. A database of fish
biotransformation rates for organic chemicals. Environ. Toxicol. Chem. 27, 2263-
2270.
Arnot, J. A., Meylan, W., Tunkel, J., Howard, P. H., Mackay, D., Bonnell, M., Boethling,
R. S., 2009. A quantitative structure-activity relationship for predicting metabolic
biotransformation rates for organic chemicals in fish. Environ. Toxicol. Chem. 28,
1168-1177.
Buhler, D., Wang-Buhler, J.-L., 1998. Review: Rainbow trout cytochrome P450s:
purification, molecular aspects, metabolic activity, induction and role in
environmental monitoring. Comp. Biochem. Physiol. 121C, 107-137.
Cowan-Ellsberry, C., Dyer, S. E., Bernhard, M., Roe, A., Dowty, M., & Weisbrod, A.,
2008. Approach for extrapolating in vitro metabolism data to refine
bioconcentration factor estimates. Chemosphere 70, 1804-1817.
Davies, B., Morris, T., 1993. Physiological parameters in laboratory animals and
humans. Pharm. Res. 10, 1093-1095.
57
de Wolf, W., Comber, M., Douben, P., Gimeno, S., Holt, M., Lillicrap, L., Sijm, D., van
Egmond, R., Weisbrod, A., Whale, G., 2007. Animal Use Replacement,
Reduction, and Refinement: Development of an Integrated Testing Strategy for
Bioconcentration of Chemicals. Integr. Environ. Assess. Manag. 3, 3-17.
Dyer, S., Bernhard, M., Cowan-Ellsberry, C., Perdu-Durand, E., Demmerle, S., Cravedi,
J., 2009. In vitro biotransformation of surfactants in fish. Part II--Alcohol
ethoxylate (C16EO8) and alcohol ethoxylate sulfate (C14EO2S) to estimate
bioconcentration potential. Chemosphere 76, 989-98.
Gearhart, J. M., Jepson, G. W., Clewell, H. J., Andersen, M. E., Conolly, R. B., 1994.
Physiologically Based Pharmacokinetic Model for the Inhibition of
Acetylcholinesterase by Organophosphate Esters. Environ. Health Perspect. 102
Suppl., 51-60.
Gobas, F., 1993. A model for predicting the bioaccumulation of hydrophobic organic
chemicals in aquatic food-webs: application to Lake Ontario. Ecological
Modelling 69, 1-17.
Houston, J. B., 1994. Utility of in vitro drug metabolism data in predicting in vivo
metabolic clearance. Biochem. Pharmacol. 47, 1469-1479.
Jacqz-Aigrain, E., Anderson, B., 2006. Pain control: Non-steroidal anti-inflammatory
agents. Semin. Fetal Neonatal. Med. 11, 251-259.
Janssen, B., Debets, J., Leenders, P., Smits, J., 2002. Chronic measurement of cardiac
output in conscious mice. Am. J. Physiol. Regulatory Integrative Comp. Physiol.
282, 928-935.

58
Kelly, S. P., Fletcher, M., Part, P., Wood, C. M., 2000. Procedures for the preparation
and culture of 'reconstructed' rainbow trout branchial epithelia. Methods Cell Sci.
22, 153-163.
Korhonen, T., Turpeinen, M., Tolonen, A., Laine, K., Pelkonen, O., 2008. Identification
of the human cytochrome P450 enzymes involved in the in vitro
biotransformation of lynestrenol and norethindrone. J. Steroid Biochem. Mol. Biol.
110, 56-66.
Leguen, I., Carlsson, C., Perdu-Durand, E., Prunet, P., Part, P., Cravedi, J., 2000.
Xenobiotic and steroid biotransformation activities in rainbow trout gill epithelial
cells in culture. Aquat. Toxicol. 48, 165–176.
Lindstrom-Seppa, P., Koivusaari, U., Hanninen, O., 1981. Extrahepatic xenobiotic
metabolism in north-European freshwater fish. Comp. Biochem. Physiol. 69C,
259–263.
Masubuchi, Y., Hosokawa, S., Horie, T., Suzuki, T., Ohmori, S., Kitada, M., Narimatsu,
S., 1994. Cytochrome P450 isozymes involved in propranolol metabolism in
human liver microsomes. The role of CYP2D6 as ring-hydroxylase and CYP1A2
as N-desisopropylase. Drug Metab. Dispos. 22, 909-915.
Mohutsky, M. A., Chien, J. Y., Ring, B. J., Wrighton, S. A., 2006. Predictions of the in
vivo clearance of drugs from rate of loss using human liver microsomes for phase
I and phase II biotransformations. Pharm. Res. 23, 654-662.
Nallani, G., Paulos, P., Vaz, A., Constantine, L., Venables, B., Huggett, D., 2009.
Bioconcentration potential of ibuprofen in fathead minnow (Pimephales
59
promelas) and channel catfish (Ictalurus punctatus) [Abstract No. UP012].
Presented at SETAC North America 30th Annual Meeting, New Orleans, LA.
Obach, R. S., 1999. Prediction of human clearance of twenty-nine drugs from hepatic
microsomal intrinsic clearance data: an examination of in vitro half-life approach
and nonspecific binding to microsomes. Drug Metab. Dispos. 27, 1350-1359.
OECD (Organization for Economic Cooperation and Development), 1996.
Bioconcentration: Flow-through Fish Tests, 305, last updated 14 June 1996.
Paris, France.
Pesonen, M., Andersson, T., 1991. Characterization and induction of xenobiotic
metabolizing enzyme activities in a primary culture of rainbow trout hepatocytes.
Xenobiotica. 21, 461–471.
Ritter, J., 2000. Roles of glucuronidation and UDP-glucuronosyltransferases in
xenobiotic bioactivation reactions. Chem. Biol. Interact. 129, 171-193.
Schlezinger, J., Parker, C., Zeldin, D., Stegeman, J., 1998. Arachidonic acid metabolism
in the marine fish Stenotomus chrysops (Scup) and the effects of cytochrome
P450 1A inducers. Arch. Biochem. Biophys. 353, 265-275.
Weisbrod, A., Burkhard, L., Arnot, J., Mekenyan, O., Howard, P., Russom, C.,
Boethling, R., Sakuratani, Y., Traas, T., Bridges, T., Lutz, C., Bonnell, M.,
Woodburn, K., Parkerton, T., 2007. Workgroup report: review of fish
bioaccumulation databases used to identify persistent, bioaccumulative, toxic
substances. Environ. Health Perspect. 115, 255-261.
60
CHAPTER 3
IBUPROFEN METABOLISM IN THE LIVER AND GILL OF RAINBOW TROUT,
Oncorhynchus mykiss
3.1. Introduction
Ibuprofen is a nonsteroidal anti-inflammatory drug (NSAID) found in over-the-
counter and prescription pharmaceuticals. Ibuprofen is typically administered as a
racemic mixture of (S)-(+)- and (R)-(-)-enantiomers (Rodrigues 2005), with (R)-(-)-
ibuprofen undergoing unidirectional chiral inversion to (S)-(+)-ibuprofen (Davies, 1998).
Both enantiomers are readily metabolized through phase I and phase II pathways. In
human and rat liver, cytochrome P450 (CYP) 2C9 and 2C8 contribute to the majority of
Phase I biotransformation of ibuprofen (Jacqz-Aigrain and Anderson 2006). Uridine
diphosphate glucuronyl-transferase (UGT) 1A9, 1A3, 2B1 and 2B7 are known to
conjugate ibuprofen (Ritter 2000). Studies have shown direct glucuronidation to
account for approximately 14% of (S)-(+)-ibuprofen metabolism with 2-hydroxy-
ibuprofen (2-OH-IBP) and 3-hydroxy-ibuprofen (3-OH-IBP) metabolites accounting for
28% and 45%, respectively in human microsomes (Davies 1998; Rodrigues 2005; Rudy
et al. 1991). 3-OH-IBP is quickly biotransformed to 3-carboxy ibuprofen via cytosolic
dehydrogenases (Rudy et al. 1991; Davies 1998). As fish do not contain the same
CYP2C isoforms as mammals (Buhler and Wang-Buhler 1998), it cannot be assumed
that piscine biotransformation will be equivalent to that of mammals.
Aquatic organisms may be exposed to chronic, low dose exposures to ibuprofen.
Ibuprofen has been identified in the environment with concentrations observed as high
as 4239ng L-1 in wastewater effluent and 2370ng L-1 in surface water (Roberts and

61
Thomas 2006; Ternes 2001). Thus, understanding the ability and mechanism of fish to
metabolize ibuprofen further elucidates the effects of ibuprofen in the aquatic
environment.
3.2. Materials and Methods
Chemicals used in the following studies were purchased from Sigma-Aldrich
Corp. (St. Louis, MO) unless noted below. Alamethicin and uridine diphosphate
glucuronic acid (UDPGA) were generously provided by Pfizer Inc. (Groton, CT). The
Bradford Protein Assay was procured from Bio-Rad Laboratories (Hercules, CA).
Uninduced, male Sprague-Dawley rat liver S9 and uninduced, male CD-1 mouse S9
were purchased from Moltox (Boone, NC). Ibuprofen and d3-ibuprofen were sourced
from Toronto Research Chemicals (North York, ON, Canada).
Gill and liver tissue were harvested from mature rainbow trout (Greers Ferry
National Fish Hatchery, Heber Springs, AR). Fish were maintained in dechlorinated tap
water at 16°C in Frigid Units Living Streams under fluorescent lights with a 16 hour
light/8 hour dark photoperiod. Fish were fed ground Purina Trout Chow. Fish were
anesthetized prior to sacrifice. All studies were conducted in accordance with
University of North Texas animal use protocols.
For uninduced fractions, tissues from five to ten fish were composited and
homogenized on ice using an electric homogenizer. The homogenate was centrifuged
at 9,000g for 20 minutes at 4°C. The S9 supernatant was carefully separated from the
pellet and stored at -80°C. To obtain microsomal fractions, S9 underwent centrifugation
at 100,000g for 60 minutes at 4°C. The supernatant was discarded and the pellet
resuspended in homogenization buffer. For induced fractions, rainbow trout (n = 3)
62
were injected with beta-naphthoflavone (BNF, 100mg (kg bw)-1) and sacrificed after 24-
hours. Microsomes were made from the composited gill and liver tissue.
S9 and microsomal fractions were diluted to 2.0 and 1.0mg protein mL-1 with
0.01M phosphate buffer (pH 7.4), respectively. The Bradford Protein Assay determined
the protein content of each sample. Samples (650µL total volume) included an NADPH
regeneration system and 10μM ibuprofen. Samples were run in duplicate or triplicate.
S9 matrix controls and solvent controls were run with each assay to assure loss of
parent was not due to binding effects. Samples were equilibrated for 10 minutes (trout
at 15°C; mammalian at 37°C) in a temperature controlled shaker. To initiate the
reactions, 6.5μL of 50mM NADPH in phosphate buffer was added to each sample.
Samples were then incubated for 60 to 120 minutes. Aliquots of 100μL were removed
throughout the course of the incubation and placed in equal volume cold methanol to
stop biological activity. Deuterated internal standard was then added. Samples were
centrifuged at 2500g for 10 minutes to pellet the denatured protein. The supernatant
was then stored at 4°C until instrumental analysis. All loss of parent studies were
analyzed via GC/MS (see below).
To further investigate UGT specific activity, the above procedure was modified to
include the addition of the cofactor UDPGA. Alamethicin was added at 50μg mg-1
protein to S9 samples prior to equilibration. To initiate the reaction, 5mM UDPGA was
added to the sample along with NADPH. To evaluate the influence of phase I
biotransformation on ibuprofen metabolism, alpha-naphthoflavone (ANF), a CYP1A2
inhibitor, was added prior to incubation at 10µM to BNF-induced microsomes.
Uninhibited samples were run for comparison.

63
Samples of uninduced S9 and induced, uninhibited microsomes were collected
after 60 minutes for metabolite analysis. Metabolites were analyzed via LC/MS (see
below).
For GC/MS analysis, samples were derivatized with boron trifluoride (BF3)-
methanol and analyzed with an Agilent 6890N Network GC System coupled with an
Agilent 5973 inert Mass Selective Detector and an Agilent autosampler (Agilent
Technologies, Inc.). Analytes were detected and quantified in selective ion monitoring
(SIM) mode with the quantitative ions 161 m/z for ibuprofen and 164 m/z for deuterated
ibuprofen. For LC/MS analysis, chromatography was performed with an Agilent solvent
delivery system and autosampler on a Phenomenex Synergi Hydro RP-C18 (4.6mm x
150mm, 4μm) column. Metabolite identification was performed using a Thermo LTQ
equipped with an electrospray interface operating in negative ion mode (Thermo
Electron).
Statistical analysis was conducted using GraphPad Prism 5 (GraphPad Software,
Inc.). Mean and standard error are reported. Previous unpublished data has shown
compositing tissue to reduce the variability in metabolic activity that may be found
between individual fish. The uninduced S9 and microsomes used in these studies
come from the same data set and have been used to evaluate metabolic activity of
other compounds with confidence. Thus, although some assays are replicates of single
tissue homogenates, it is assumed that their activity is representative of the overall
statistical population.

64
3.3. Results and Discussion
In the S9 metabolism study, loss of ibuprofen parent compound was observed in
all trials, indicating the occurrence of metabolism (Fig. 9). The intrinsic clearance rate
(CLm, mL hr-1 (mg protein)-1) was calculated from loss of parent material normalized to
protein content, according to the Eq. (8) based upon Xing et al. (2008).
CLm = Rate loss of parent (µmol hr-1 mg protein-1) * Vol of test solution (mL)
(8) Initial parent concentration (µmol).
Initial parent concentrations were analytically confirmed and not based on nominal
concentrations.
Fig. 9. Relative loss of parent compound over 90 minute study time period. Represents
mean loss of parent. Assays including UDPGA were performed with a single batch
composited tissues. Error bars represent standard error among replicates.
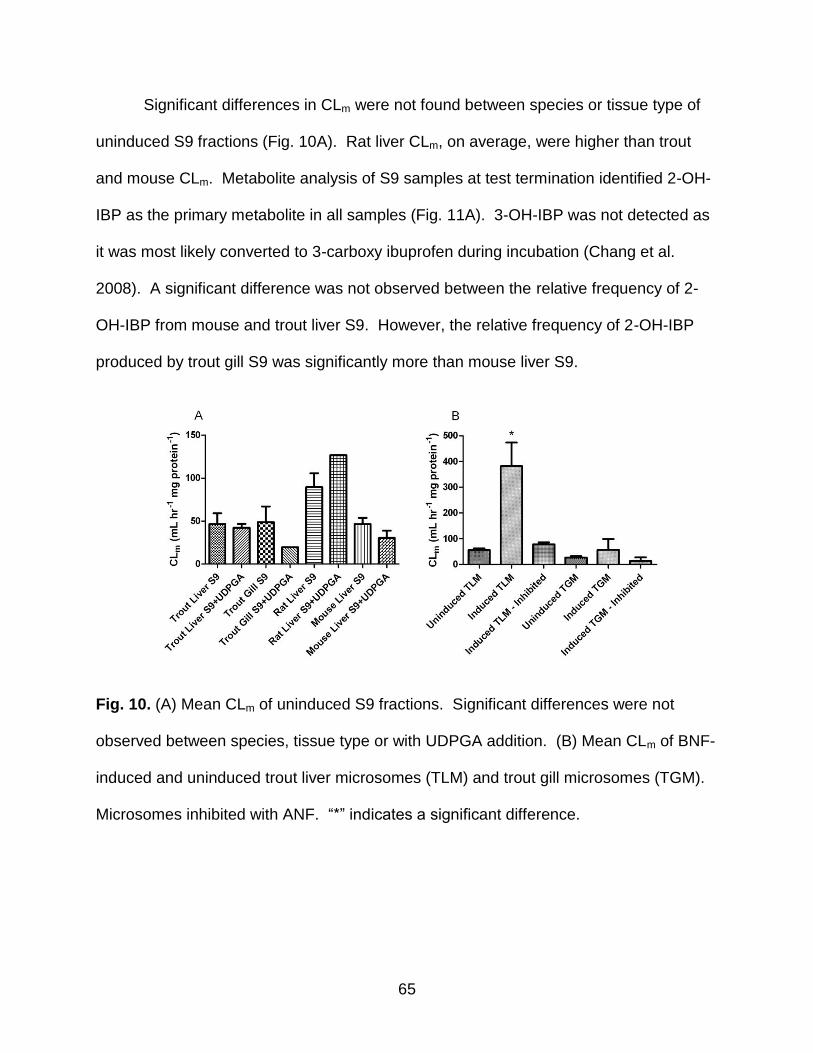
65
Significant differences in CLm were not found between species or tissue type of
uninduced S9 fractions (Fig. 10A). Rat liver CLm, on average, were higher than trout
and mouse CLm. Metabolite analysis of S9 samples at test termination identified 2-OH-
IBP as the primary metabolite in all samples (Fig. 11A). 3-OH-IBP was not detected as
it was most likely converted to 3-carboxy ibuprofen during incubation (Chang et al.
2008). A significant difference was not observed between the relative frequency of 2-
OH-IBP from mouse and trout liver S9. However, the relative frequency of 2-OH-IBP
produced by trout gill S9 was significantly more than mouse liver S9.
Fig. 10. (A) Mean CLm of uninduced S9 fractions. Significant differences were not
observed between species, tissue type or with UDPGA addition. (B) Mean CLm of BNF-
induced and uninduced trout liver microsomes (TLM) and trout gill microsomes (TGM).
Microsomes inhibited with ANF. “*” indicates a significant difference.

66
Fig. 11. Relative frequencies of ibuprofen and its metabolites. (A) “*” indicates
significant differences between fish tissue fraction and mouse tissue fraction. (B) “*”
indicates significant difference between induced and uninduced microsomes.
Glucuronide metabolites were not detected in the trout gill S9 samples. This
indicates that direct glucuronyl conjugation may not play a major role in
biotransformation in gill tissues. Moreover, the addition of UDPGA did not significantly
increase CLm. As UDPGA is often found at levels below the Km of UGTs in uninduced
environments (Ritter 2000), CLm was expected to increase with the addition of the
cofactor. The lack of significant increase reinforces that glucuronidation is not a major
ibuprofen pathway in the gill. Glucuronide metabolites were found in mouse liver S9 at
expected relative frequencies (Chang et al. 2008). No significant difference was found
between the relative frequency of trout liver and mouse liver S9 glucuronide
metabolites.
As phase I biotransformation appears to be the major pathway in ibuprofen
metabolism, studies with induced and/or inhibited microsomes were conducted to
67
further delineate the mechanism behind trout biotransformation of ibuprofen. Metabolic
activity was greatly enhanced in BNF-induced trout liver microsomes (mean 19.6% loss
of parent compound within 20 minutes). This may be due to increased CYP1A activity
(Buhler and Wang-Buhler 1998). Metabolite analysis indicated 2-OH-IBP levels in BNF-
induced liver microsomes to be double that of uninduced liver microsomes (Fig. 11B).
Glucuronide metabolites were not detected in induced liver microsomes. Moreover,
ANF inhibited metabolic activity in induced liver microsomes (Fig. 10B). The remaining
activity is assumed to be glucuronide conjugation. BNF did not enhance metabolic
activity in gill microsomes, nor did ANF significantly inhibit activity. Metabolite analysis
found similar relative frequencies of 2-OH-IBP in gill microsomes, while glucuronide
metabolites were not detected as in gill S9 fractions.
The enhanced metabolism in BNF-induced microsomes and subsequent
inhibition by ANF suggests CYP1A2, rather than a CYP2C homolog, as a metabolic
pathway for ibuprofen in fish. Naproxen, another NSAID, is known to undergo CYP1A2
biotransformation along with CYP2C9 in humans (Miners et al. 1996; Rodrigues et al.
1996). CYP1A2 may oxidize ibuprofen in a similar manner as naproxen.
These data suggest that ibuprofen can be metabolized in fish at similar rates and
with similar end metabolites as mammals. The intrinsic clearance in mouse and rat liver
S9 factions was not significantly different than trout liver CLm. The mechanism
responsible for ibuprofen metabolism may be different (e.g. CYP1A2) than known
mammalian mechanisms (e.g. CYP2C9), yet it may be feasible to read-across some
information from mammalian literature since intrinsic clearance rates were similar. More

68
data are needed to fully understand the similarities and differences between piscine and
mammalian metabolism and its ecological significance.
3.4. References
Buhler, D., Wang-Buhler, J.-L., 1998. Review: Rainbow trout cytochrome P450s:
purification, molecular aspects, metabolic activity, induction and role in
environmental monitoring. Comp Biochem Physiol. 121C, 107-137.
Chang, S.-Y., Li, W., Traeger, S. C., Wang, B., Cui, D., Zhang, H., Wen, B., Rodrigues,
A. D., 2008. Confirmation that cytochrome P450 2C8 (CYP2C8) plays a minor
role in (S)-(+)- and (R)-(-)-ibuprofen hydroxylation in vitro. Drug Metab. Dispos.
36, 2513-2522.
Davies, N., 1998. Clinical pharmacokinetics of ibuprofen: The first 30 years. Clin
Pharmacokinet. 34, 101–154.
Han, X., Nabb, D., Yang, C., Snajdr, S., Mingoia, R., 2009. Liver microsomes and S9
from rainbow trout (Oncorhynchus mykiss): comparison of basal-level enzyme
activities with rat and determination of xenobiotic intrinsic clearance in support of
bioaccumulation assessment. Environ. Toxicol. Chem. 28, 481-488.
Jacqz-Aigrain, E., Anderson, B., 2006. Pain control: Non-steroidal anti-inflammatory
agents. Semin. Fetal Neonatal. Med. 11, 251-259.
Miners, J., Coulter, S., Tukey, R., Veronese, M., Birkett, D., 1996. Cytochromes P450,
1A2, and 2C9 are responsible for the human hepatic O-demethylation of R- and
S-naproxen. Biochem Pharmacol. 51, 1003-1008.
Ritter, J., 2000. Roles of glucuronidation and UDP-glucuronosyltransferases in
xenobiotic bioactivation reactions. Chem Biol Interact. 129, 171-193.

69
Roberts, P., Thomas, K., 2006. The occurrence of selected pharmaceuticals in
wastewater effluent and surface waters of the lower Tyne catchment. Sci. Total
Environ. 356, 143-153.
Rodrigues, A., 2005. Impact of CYP2C9 genotype on pharmacokinetics: are all
cyclooxygenase inhibitors the same? Drug Metab. Dispos. 33, 1567-1575.
Rodrigues, A., Kukulka, M., Roberts, E., Ouellet, D., Rodgers, T., 1996. [O-methyl
14C]naproxen O-demethylase activity in human liver microsomes: evidence for
the involvement of cytochrome P4501A2 and P4502C9/10. Drug Metab. Dispos.
24, 126-136.
Rudy, A., Knight, P., Brater, D., Hall, S., 1991. Stereoselective metabolism of ibuprofen
in humans: administration of R-, S- and racemic ibuprofen. J. Pharmacol. Exp.
Ther. 259, 1133-1139.
Ternes, T., 2001. Analytical methods for the determination of pharmaceuticals in
aqueous environmental samples. Trends Anal. Chem. 20, 419-434.

70
CHAPTER 4
METABOLISM OF THREE PHARMACEUTICALS IN RAINBOW TROUT AND
CHANNEL CATFISH LIVER AND GILL CELL SUSPENSIONS, AND THE EFFECT ON
PREDICTED BIOCONCENTRATION
4.1. Introduction
Bioconcentration involves uptake of xenobiotics via an organism’s respiratory
surfaces (e.g., gills and/or skin) and the subsequent elimination from the organism
(Gobas and Morrison, 2000). Uptake through the gills is the predominant route for most
organic xenobiotics except extremely hydrophobic organic chemicals, in which uptake
through ingestion of xenobiotics bound to food particles significantly contributes to total
bioaccumulation (Bruggeman et al., 1984; Randall et al., 1998). The bioconcentration
factor (BCF) is a quantitative expression of a compound’s ability to partition from the
aqueous environment into and remain in an organism. Historically, models have utilized
the 1-octanol-water partition coefficient (KOW) as the primary determinant of BCF (Neely
et al., 1974; Veith et al., 1979; Mackay, 1982; Davies and Dobbs, 1984; Oliver and
Niimi, 1985). Single compartment models provide successful estimates for compounds
whose bioconcentration is governed by their lipophilicity and low biologic activity.
However, hydrophobicity models have been hypothesized to overpredict the BCF of
ionizable, readily metabolized compounds, such as pharmaceuticals.
Recent BCF modeling efforts have proposed a multi-compartment model based
on the principles of absorption, distribution, metabolism and elimination (ADME) (Arnot
et al., 2009; Arnot and Gobas, 2004; Cowan-Ellsberry et al., 2008). The model depicted
as BCF = (k1 + kU) / (k2 + kG +kM +kE), includes: uptake via gills (k1), dietary ingestion
71
(kU), elimination across gills (k2 ), growth (kG), metabolism (kM) and egestion (kE)
(Gobas, 1993). By far, a majority of efforts have focused on the role of metabolism on
the process of bioconcentration (Arnot et al., 2008; Cowan-Ellsberry et al., 2008; Dyer
et al., 2009). Building on concepts developed within the human pharmaceutical sector,
in vitro fish metabolism data may be able to predict whole fish clearance, and thus,
contribute to a more realistic calculated BCF (Obach, 1999; Mohutsky et al., 2006;
Cowan-Ellsberry et al., 2008).
In vitro biotransformation assays provide several advantages to full scale in vivo
studies. As BCF has gained increased regulatory significance over the past decade,
the need for cost effective techniques that take into consideration refinement, reduction
and replacement in animal studies has also grown. In vitro biotransformation assays
allow for quick, reproducible results without the expense of in vivo studies. Moreover,
the primary cell suspensions used in this study permit the evaluation of heterogeneous
mixtures of cell types. This is advantageous when studying tissues, such as the gill,
which contain multiple cell types that could potentially play a role in xenobiotic
metabolism. Lastly, in vitro studies satisfy the societal desire to reduce the use of
animals in toxicological testing (Bols et al., 2005; de Wolf et al., 2007; Weisbrod et al.,
2007).
This study evaluates the ability of in vitro fish metabolism data from liver and gill
cell suspensions to determine whole fish intrinsic clearance, using ibuprofen (a weak
acid), norethindrone (a neutral compound) and propranolol (a weak base) as the test
compounds. Test compounds were chosen as they are readily metabolized in human
and mammalian liver (Masubuchi et al., 1994; Chang et al., 2008; Korhonen et al.,

72
2008) and have been found in the aquatic environment at trace levels (Huggett et al.,
2003; Roberts and Thomas, 2006; Fernandez et al., 2007).
4.2. Materials and Methods
4.2.1. Materials
All materials used in the isolation of cells were purchased from Invitrogen Corp.
(Carlsbad, CA). Chemicals used during cell incubation and neutral red uptake assay
were purchased from Sigma-Aldrich Corp. (St. Louis, MO). (±)-Ibuprofen, norethindrone
and their deuterated internal standards were sourced from Toronto Research Chemicals
(North York, ON, Canada). (±)-Propranolol was supplied by TOCRIS Bioscience
(Ellisville, MO). Deuterated propranolol was purchased from CDN Isotopes Inc. (Pointe-
Claire, Quebec, Canada).
4.2.2. Fish Cultures
Rainbow trout were procured from Greers Ferry National Fish Hatchery (Heber
Springs, AR) while channel catfish were procured from Pond King Inc. (Gainesville, TX)
as juveniles and raised under laboratory conditions. Fish were maintained in
dechlorinated tap water at the appropriate temperature (16°C for rainbow trout and
room temperature (~25°C) for channel catfish) in Frigid Units Living Streams under
fluorescent lights with a 16 hour light/8 hour dark photoperiod. Fish were fed ground
Purina Trout Chow. All studies were conducted in accordance with University of North
Texas animal use protocols.

73
4.2.3. Cell Isolation
Prior to harvesting gill tissue, fish were placed in sterile reconstituted hard water
for 20 minutes. Gill tissues were washed thoroughly with Hank’s Balanced Salt Solution
(HBSS) following the protocol described in Kelly et al. (2000). Livers were perfused with
HBSS for ten minutes and then carefully excised. Gill, liver and whole fish wet weights
were collected prior to further processing. Fish were anesthetized with MS-222 during
sacrifice.
Cell isolation was carried out in the same manner for both gill and liver. Three
tissues were finely minced and composited to reduce interfish variability. Two to three
lots of individual tissue composites (n= 3) were prepared to evaluate lot variability.
Tissues were placed in 50mL conical centrifuge tubes and 5-10mL of 0.05%
trypsin with 0.2g L-1 EDTA•4Na in Hanks' Balanced Salt Solution (Part et al., 1993; Kelly
et al., 2000). Tissues were then placed in a temperature controlled shaker (15°C for
trout; 25°C for catfish) for 20 minutes. Cells were then transferred through a 100µm cell
strainer into a new conical centrifuge tube containing 20mL 10% fetal bovine serum
(FBS) in HBSS. Trypsinization was repeated 3-4 times as needed. The strained cells
were centrifuged at 500g for 10 minutes to pellet the cellular contents. The supernatant
was aspirated off and a pre-chilled solution containing 2.5% FBS in HBSS was added.
The pellet was resuspended with mechanical agitation. The resuspended cells were
centrifuged at 500g for 10 minutes. The supernatant was removed and the pellet was
resuspended in10mL of Leibovitz’s L-15 medium (containing L-glutamine).

74
4.2.4. Cell deactivation
Enzymatically deactivated cells served as control cells to ensure loss of parent
was not due to binding effects. Cells were pelleted via centrifugation at 500g for 5
minutes. Media was removed and 3:1 acetonitrile:MQ water was added. Cells were
resuspended and then placed at 4°C for 15 minutes. Cells were centrifuged at 500g for
10 minutes. The acetonitrile:MQ supernatant was removed and cells were resuspended
in the original volume of media.
4.2.5. Cell Suspension Incubation
Cell suspensions were diluted to 2.5x10⁶ total cells mL-1 with media. Cell counts
were determined via hemocytometer. Test compounds were dissolved in ethanol to
create 100X stock solutions. To reduce any reaction interference from the ethanol, only
6.5μL was added to the cell suspension to bring the concentration to 10μM test
compound (650µL total test volume, 1% ethanol). Samples were run in duplicate.
Media controls, solvent controls and deactivated cell controls were run with each assay
to assure that loss of parent was not due to binding effects. Trout cell suspensions
were placed in a temperature controlled shaker at 15°C (25°C for catfish) and incubated
for 120 minutes. Aliquots of 100μL were removed at 0, 15, 30, 60, 90 and 120 minute
time points for each test material. Aliquots were placed in equal volume cold methanol,
vortexed and placed at -20°C to stop biological activity. Deuterated internal standard
(d3-ibuprofen, d6-norethindrone or d7-propranolol) was then added. Samples were
centrifuged at 500g for 10 minutes to pellet the denatured protein. The supernatant was
carefully removed via pipette and stored at 4°C until instrumental analysis.

75
4.2.6. Instrumental Analysis
Samples were dried under a gentle stream of nitrogen and reconstituted in 100
µL 1:1 methanol:MQ water. LC-MS and LC-MS/MS were carried out using a Waters
2695 Separations Module and autosampler. Chromatography was performed on a
Waters Sunfire C18 (2.1mm x 50mm, 3.5µm) column (Waters). Analyte identification
was performed using a Micromass Quattro Ultima mass spectrometry system with an
electrospray interface run in positive mode for norethindrone and propranolol and in
negative mode for ibuprofen. The flow rate for all applications was 0.2mL min-1 with a
column temperature of 25°C and injection volume of 10µL.
The mobile phase for norethindrone analysis consisted of MQ water with 0.1%
formic acid (solvent A) and methanol with 0.1% formic acid (solvent B1). Initial mobile
phase conditions of 70% solvent A: 30% solvent B1 were held for one minute and then
solvent B1 was increased to 70% over three minutes. Solvent B1 was further increased
to 95% over 30 seconds and then decreased to 70% over two minutes. Initial mobile
phase conditions were returned over 30 seconds and held for three minutes. For
propranolol analysis, the mobile phase comprised of solvent A and 2:1
acetonitrile:methanol with 0.1% formic acid (solvent B2). Initial mobile phase proportion
of 90% (A) / 10% (B2) was held for 30 seconds. Solvent B2 linearly increased to 90%
over 9.5 minutes. Initial conditions were then linearly resumed over the course of two
minutes. For ibuprofen, the initial mobile phase consisted of MQ with10µM ammonium
formate (solvent C) and unmodified methanol (solvent D) at 50% each. Solvent D
increased linearly to 95% at seven minutes and was held for two minutes. Initial mobile
phase conditions were returned over two minutes.

76
Individual tune files were created for each analyte to optimize detection.
Norethindrone settings consisted of 4.00kV capillary voltage, 60V cone voltage and
30eV collision energy. For propranolol, capillary voltage was set at 4.00kV with cone
voltage at 45V and collision energy at 17eV. Ibuprofen held tune settings of 3.00kV
capillary voltage and 10V cone voltage. Protonated ions were dissociated with argon
for norethindrone (m/z 298.5>108.2), d6-norethindrone (m/z 304.1>113.8), propranolol
(m/z 260.1>183.4) and d7-propranolol (m/z 267.1>190.1) with detection in multiple
reaction monitoring (MRM) mode. Ibuprofen was run in single reaction monitoring
(SRM) mode with m/z 205.1 and m/z 208.1 monitored for ibuprofen and d3-ibuprofen,
respectively. Six-point calibration curves of analyte standards were used for
quantification.
4.2.7. Neutral Red Uptake Assay
For quality control purposes, a neutral red uptake assay adapted from Repetto et
al. (2008) was used to determine cell viability. The neutral red uptake assay evaluates
cell viability based on the ability of viable cells to incorporate and bind the weak cationic,
supravital neutral red dye. The neutral red dye penetrates cell membranes via nonionic
diffusion and accumulates in lysosomes. Cell suspension were diluted to 2.5x10⁶ cells
mL-1 with media. Neutral Red Solution, 0.33% in DPBS (50µL) was added to 450µL of
cell suspension in a microcentrifuge tube. Samples were placed in a shaker at the
appropriate temperature for two hours. Cells were then pelleted via centrifugation at
500g for 10 minutes. The supernatant was carefully removed and 200µL of Neutral Red
Assay Fixative (0.1% CaCl2 in 0.5% formaldehyde) was added to each sample.
Samples were gently shook for no more than two minutes as care was taken not to lyse

77
cells. Samples were centrifuge at 500g for five minutes. The supernatant was
discarded and 500µL of Neutral Red Assay Solubilization Solution (1% acetic acid in
50% ethanol) was added to each sample. Samples were vortexed to resuspend the
pellet and release neutral red dye into the solution. In a clear 96-well plate, 200µL of
sample was pipetted into wells in duplicate. Media blanks and deactivated control cells
were also analyzed. Absorbance was measured 540nm with background absorbance
at 690nm. Results confirmed cell viability or deactivation in each cell lot (data not
shown).
4.2.8. In vitro metabolic transformation rates of the gill and liver
In vitro metabolic transformation rates of the gill and liver were determined using
the bioconcentration model described by Cowan-Ellsberry et al. (2008) (Figure 12). The
model extrapolates in vitro test data to determine a whole body metabolic
transformation rate using key fish physiological information (Table 6). This extrapolation
is based on concepts commonly applied in mammalian pharmacokinetics (Obach,
1999). Intrinsic clearance rate of parent compound (CLm) was determined from in vitro
cellular suspension data, in which CLm = loss of parent material (µmol hr-1 cell-1) * total
reaction volume (mL) / the analytically confirmed initial parent concentration (µmol).
Multiplication of tissue weight (TW) and cellularity (Cp, cells (g tissue)-1) determined
intrinsic clearance in tissue (CLi), which was extrapolated to tissue clearance (CLt) by
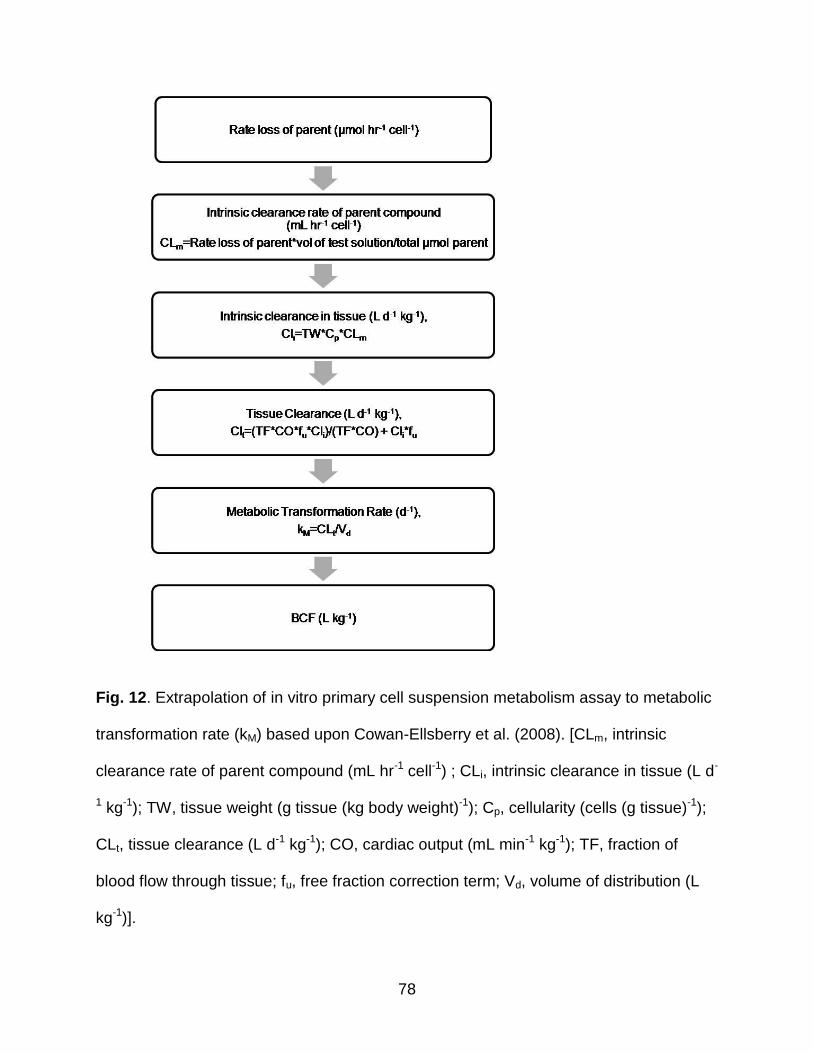
78
Fig. 12. Extrapolation of in vitro primary cell suspension metabolism assay to metabolic
transformation rate (kM) based upon Cowan-Ellsberry et al. (2008). [CLm, intrinsic
clearance rate of parent compound (mL hr-1 cell-1) ; CLi, intrinsic clearance in tissue (L d-
1 kg-1); TW, tissue weight (g tissue (kg body weight)-1); Cp, cellularity (cells (g tissue)-1);
CLt, tissue clearance (L d-1 kg-1); CO, cardiac output (mL min-1 kg-1); TF, fraction of
blood flow through tissue; fu, free fraction correction term; Vd, volume of distribution (L
kg-1)].

79
Table 6
Physiological and physical characteristic used to extrapolate in vitro metabolic
transformation within the BCF model. Mean values are reported below. Values were
determined during the course of the study or in other unpublished laboratory studies.
Trout Gill Trout Liver Catfish Gill Catfish Liver
Body weight (kg) 0.211 0.211 0.057 0.057
Cellularity (cells (g tissue)-1) 1.17x10⁸ 3.41x10⁸ 1.24x10⁸ 3.03x10⁸
Cardiac output (mL min-1 kg-1) 16.9 16.9 26.2 26.2
Fraction of blood flow through tissue
1.0 0.20 1.0 0.20
Body composition
lipid 0.10 0.10 0.10 0.10
non-lipid organic 0.20 0.20 0.20 0.20
water 0.70 0.70 0.70 0.70
Blood composition
blood lipid 0.01 0.01 0.01 0.01
non-lipid organic 0.15 0.15 0.15 0.15
water 0.84 0.84 0.84 0.84
Temperature of environment 15°C 15°C 25°C 25°C
including cardiac output (CO), fraction of blood flow through tissue (TF) and a free
fraction correction term (fu). Division by the volume of distribution (Vd) then produced

80
the metabolic transformation rate (kM). BCF was then calculated, incorporating kM
(BCFM) and with kM equal to zero (BCF0). BCF calculations also included predicted k1,
k2, kE and kG values based upon KOW, total fish weight and fish lipid content.
4.2.9. Statistical Analysis
Statistical analysis was conducted using GraphPad Prism 5 (GraphPad Software,
Inc.). Two-way repeated measures ANOVA confirmed statistical significance of loss of
parent compound over time while Bonferroni post tests were used to evaluate the
differences between tissue homogenate batches at each sample time point. CLm, kM
and BCF were analyzed either via an unpaired t-test or one-way ANOVA with
Bonferroni's multiple comparison post test. Mean and standard error are reported.
4.3. Results
4.3.1. Intrinsic clearance rate of parent compound
A significant loss was not found in deactivated controls cells indicating that loss
due to binding did not greatly contribute to loss of parent compound (Fig. 13).
Fig. 13. Mean loss of parent compound in deactivated control cells.
Loss of parent in active cell suspensions occurred at varying rates among
species and cell types (Figure 14). In general, the intrinsic clearance rate (CLm; mL hr-1
cell-1) was higher in hepatocytes than gill cell suspensions (Figure 15A). For ibuprofen,

81
trout and catfish hepatocytes had significantly higher CLm than the gill cell suspensions.
A difference was not observed between species (i.e., trout hepatocyte CLm was not
different than catfish hepatocyte CLm and trout gill CLm was not different that catfish gill
CLm). For norethindrone, catfish hepatocytes had a significantly higher mean CLm than
catfish gill cells. Trout hepatocytes had a slightly higher, yet not statistically different
mean CLm than gill cells. A significant difference was not observed between species.
For propranolol, a species difference was noted in that catfish hepatocyte CLm was
significantly greater than trout hepatocyte CLm. Catfish gill CLm was greater for
propranolol, yet not significantly greater, than trout gill CLm.
Fig. 14. Mean loss of parent compound over 120 minute study time period.

82
Fig. 15. (A) Mean intrinsic clearance rate of parent (CLm) and (B) mean extrapolated
metabolic transformation rate (kM). “*” indicates significant difference between
hepatocyte and gill cell suspensions of the same species.
83
4.3.3. Metabolic transformation rate (kM)
As described in section 2.8, the metabolic transformation rate (kM, d-1) was
extrapolated from loss of parent (Figure 15B). Although hepatocytes had greater CLm,
gill kM was significantly larger in both species for all three compounds. A larger fraction
of blood flow through the gills (TF) lead to greater tissue clearance (CLt), and thus a
greater kM, despite the liver having greater cellularity and thus greater intrinsic
clearance in the tissue (CLi). While the liver may more effectively metabolize
compounds once they have reached the liver, the larger gill TF allows for greater
potential to act upon compounds. Hence, hepatocyte kM is limited by hepatic blood
flow. As a pre-systemic tissue, the gill has greater opportunity to eliminate xenobiotics
through metabolism.
4.3.4. BCF
Including kM, significantly reduced BCF in all species and cell types. Predicted
BCF0 (i.e., predicted BCF without kM) for norethindrone, propranolol and ibuprofen were
97.3, 0.6 and 1.0 respectively. For propranolol, a species difference was not observed
between the BCFM calculated from liver kM or gill kM (Table 7). For norethindrone,
species differences were not noted in BCFM calculated from liver kM. However, trout gill
BCFM was significantly less than catfish gill BCFM even though mean trout gill kM was
less than that of catfish gill.
Mean gill and liver kM were combined additively to obtain kM(total), representing
total fish metabolic transformation. Propranolol BCFM(total) was significantly smaller than
BCFM based on liver alone (BCFM(liver)) for trout (0.29 ± 0.011) and catfish (0.29 ±
0.000). BCFM(total) for norethindrone was also significantly less than BCFM(liver) for trout

84
(28.0 ± 0.1) and catfish (34.0 ± 3.7). Trout BCFM(total) was considered significantly less
than catfish for norethindrone. Furthermore, Ibuprofen BCFM(total) for trout (0.50 ± 0.000)
and catfish (0.53 ± 0.002) were significantly different than BCFM calculated with liver
alone.
4.4. Discussion and Conclusions
This study aimed at finding a simple method for determining kM in vitro. The
method proved reliable in providing reproducible intrinsic clearance rates between
different lots of primary cells. A significant difference was not observed between the
CLm within a cell type. This supports the use of composited tissues to reduce interfish
variability in primary cell suspensions.
Fig. 16. Intrinsic clearance of parent compound (CLm) between cell suspension lots.
Differences in metabolism and CLm were observed between cell types throughout
the study. For all three compounds, hepatocyte CLm was greater than that of gill cell
suspensions. Previous studies (Chapter 2) with trout and catfish liver and gill S9
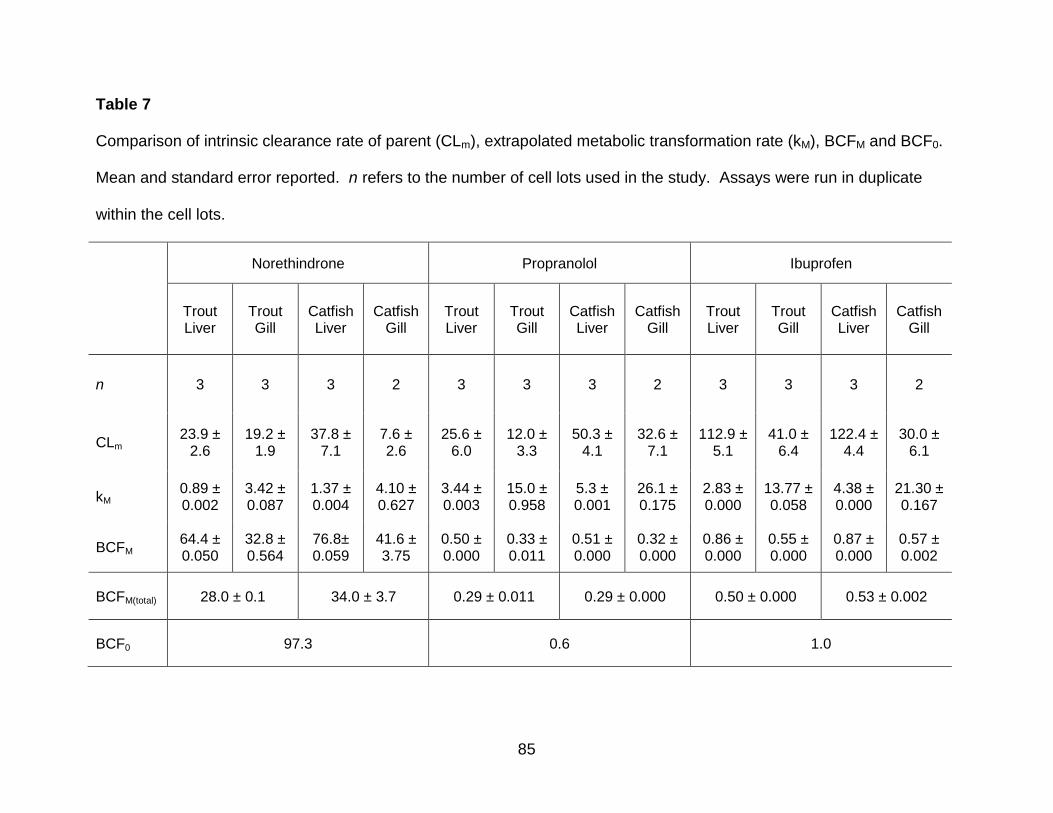
85
Table 7
Comparison of intrinsic clearance rate of parent (CLm), extrapolated metabolic transformation rate (kM), BCFM and BCF0.
Mean and standard error reported. n refers to the number of cell lots used in the study. Assays were run in duplicate
within the cell lots.
Norethindrone Propranolol Ibuprofen
Trout Liver
Trout Gill
Catfish Liver
Catfish Gill
Trout Liver
Trout Gill
Catfish Liver
Catfish Gill
Trout Liver
Trout Gill
Catfish Liver
Catfish Gill
n 3 3 3 2 3 3 3 2 3 3 3 2
CLm 23.9 ±
2.6 19.2 ±
1.9 37.8 ±
7.1 7.6 ± 2.6
25.6 ± 6.0
12.0 ± 3.3
50.3 ± 4.1
32.6 ± 7.1
112.9 ± 5.1
41.0 ± 6.4
122.4 ± 4.4
30.0 ± 6.1
kM 0.89 ± 0.002
3.42 ± 0.087
1.37 ± 0.004
4.10 ± 0.627
3.44 ± 0.003
15.0 ± 0.958
5.3 ± 0.001
26.1 ± 0.175
2.83 ± 0.000
13.77 ± 0.058
4.38 ± 0.000
21.30 ± 0.167
BCFM 64.4 ± 0.050
32.8 ± 0.564
76.8± 0.059
41.6 ± 3.75
0.50 ± 0.000
0.33 ± 0.011
0.51 ± 0.000
0.32 ± 0.000
0.86 ± 0.000
0.55 ± 0.000
0.87 ± 0.000
0.57 ± 0.002
BCFM(total) 28.0 ± 0.1 34.0 ± 3.7 0.29 ± 0.011 0.29 ± 0.000 0.50 ± 0.000 0.53 ± 0.002
BCF0 97.3 0.6 1.0
86
fractions on norethindrone, propranolol and ibuprofen also found liver S9 fractions to
provide higher clearance rates than gill S9 fractions. Several other studies have further
suggested that gill metabolic activity is less than that of liver (Lindstrom-Seppa et al.
1981; Pesonen and Andersson 1991; Schlezinger et al. 1998; Leguen et al. 2000).
Although differences in CLm and kM were noted between species for propranolol,
the biological and ecological relevance of these differences must be kept in perspective.
Catfish hepatocyte CLm was twice that of trout with a mean 42.0% loss of parent after
two hours compared to only 24.6% for trout. Additionally, catfish gill more readily
metabolized propranolol than trout gill. Yet, these results translated to equivalent BCFM
for the two species. Thus, any biological significance is most likely not related to
bioconcentration, but in catfish’s ability to better metabolize propranolol, which may
have significance in chronic, low level exposure scenarios.
Overall, the inclusion of gill and liver kM decreased norethindrone BCFs by 71.3%
in trout and 65.0% in catfish. Propranolol BCFs decreased by 51.0% in trout and 51.2%
in catfish. Ibuprofen BCFs decreased by 49.5% and 47.3% for trout and catfish,
respectively. Thus, the inclusion of kM brought predicted BCFs closer to observed in
vivo BCFs (Nallani et al., 2009).
The BCF model uses additional ADME parameters to calculate BCF. k1, k2, kG
and kE are based upon whole fish weight, temperature and/or KOW. Of these
parameters, KOW is static while the 10°C temperature variation between species has
little effect. The disparity in whole fish weights caused the unexpected results. Even
though the trout and catfish studied were at similar non-sexually reproducing life stages,
the increased trout body weight decreased k1, k2, kG and kE, which allowed for kM to
87
have a greater influence in BCF calculations. Thus, trout gill BCFM was significantly
less than catfish gill BCFM.
Although the test compounds were not expected to significantly bioconcentrate
(i.e., BCF>2000) due to their small KOW, they demonstrate the ability to measure
metabolic activity in fish cell suspensions through loss of parent. Furthermore, they
serve to advance method development of in vitro biotransformation assays and their
application in an integrated ADME bioconcentration model. As discussed in Cowan-
Ellsberry et al. (2008), the sensitivity of kM and BCFM to extrapolation parameters
underscores the need for further physiological data collection and analysis. Overall, the
inclusion of metabolism allows for more realistic BCF while reducing study time, cost
and animal use (de Wolf et al., 2007; OECD, 1996; Weisbrod et al., 2007).
4.5. References
Arnot, J. A., Gobas, F. A., 2004. A food web bioaccumulation model for organic
chemicals in aquatic ecosystems. Environ. Toxicol. Chem. 10, 2343–2355.
Arnot, J. A., Mackay, D., Parkerton, T., Bonnell, M., 2008. A database of fish
biotransformation rates for organic chemicals. Environ. Toxicol. Chem. 27, 2263-
2270.
Arnot, J. A., Meylan, W., Tunkel, J., Howard, P. H., Mackay, D., Bonnell, M., Boethling,
R. S., 2009. A quantitative structure-activity relationship for predicting metabolic
biotransformation rates for organic chemicals in fish. Environ. Toxicol. Chem. 28,
1168-1177.
Bols, N., Dayeh, V., Lee, L., Schirmer, K., 2005. Use of fish cell lines in toxicology and
ecotoxicology of fish. Piscine cell lines in environmental toxicology, in Mommsen,

88
T., Moon, T. (Eds.), Biochemistry and Molecular Biology of Fishes, Vol. 6.
Elsevier Science, Amsterdam, pp. 43-84.
Bruggeman, W., Opperhuizen, A., Wijbenga, A., Hutzinger, O., 1984. Bioaccumulation
of super-lipophilic chemicals in fish. Toxicol. Environ. Chem. 7, 173-189.
Chang, S.-Y., Li, W., Traeger, S. C., Wang, B., Cui, D., Zhang, H., Wen, B., Rodrigues,
A.D., 2008. Confirmation that cytochrome P450 2C8 (CYP2C8) plays a minor
role in (S)-(+)- and (R)-(-)-ibuprofen hydroxylation in vitro. Drug Metab. Dispos.
36, 2513-2522.
Cowan-Ellsberry, C., Dyer, S. E., Bernhard, M., Roe, A., Dowty, M., Weisbrod, A., 2008.
Approach for extrapolating in vitro metabolism data to refine bioconcentration
factor estimates. Chemosphere 70, 1804-1817.
Davies, R. P., Dobbs, A. J., 1984. The prediction of bioconcentration in fish. Water Res.
18, 1253-1262.
de Wolf, W., Comber, M., Douben, P., Gimeno, S., Holt, M., Lillicrap, L., Sijm, D., van
Egmond, R., Weisbrod, A., Whale, G., 2007. Animal use replacement, reduction,
and refinement: Development of an integrated testing strategy for
bioconcentration of chemicals. Integr. Environ. Assess. Manag. 3, 3-17.
Dyer, S., Bernhard, M., Cowan-Ellsberry, C., Perdu-Durand, E., Demmerle, S., Cravedi,
J., 2009. In vitro biotransformation of surfactants in fish. Part II--Alcohol
ethoxylate (C16EO8) and alcohol ethoxylate sulfate (C14EO2S) to estimate
bioconcentration potential. Chemosphere 76, 989-98.
Fernandez, M., Ikonomou, M., Buchanan, I., 2007. An assessment of estrogenic organic
contaminants in Canadian wastewaters. Sci. Total Environ. 373, 250-269.

89
Gobas, F., 1993. A model for predicting the bioaccumulation of hydrophobic organic
chemicals in aquatic food-webs: application to Lake Ontario. Ecological
Modelling 69, 1-17.
Gobas, F., Morrison, H., 2000. Bioconcentration and biomagnification in the aquatic
environment. in: Boethling, R., Mackay, D. (Eds.), Property Estimation Methods
for Chemicals: Environmental and Health Sciences. CRC Press LLC, Boca
Raton, FL, pp. 189-232.
Huggett, D., Khan, I., Foran, C., Schlenk, D., 2003. Determination of beta-adrenergic
receptor blocking pharmaceuticals in United States wastewater effluent. Environ.
Pollut. 121, 199-205.
Kelly, S. P., Fletcher, M., Part, P., Wood, C. M., 2000. Procedures for the preparation
and culture of 'reconstructed' rainbow trout branchial epithelia. Methods Cell Sci.
22, 153-163.
Korhonen, T., Turpeinen, M., Tolonen, A., Laine, K., Pelkonen, O., 2008. Identification
of the human cytochrome P450 enzymes involved in the in vitro
biotransformation of lynestrenol and norethindrone. J. Steroid Biochem. Mol. Biol.
110, 56-66.
Leguen, I., Carlsson, C., Perdu-Durand, E., Prunet, P., Part, P., Cravedi, J., 2000.
Xenobiotic and steroid biotransformation activities in rainbow trout gill epithelial
cells in culture. Aquat. Toxicol. 48, 165–176.
Lindstrom-Seppa, P., Koivusaari, U., Hanninen, O., 1981. Extrahepatic xenobiotic
metabolism in north-European freshwater fish. Comp. Biochem. Physiol. 69C,
259-263.

90
Mackay, D. 1982. Correlation of bioconcentration factors. Env. Sci. Technol. 16, 274-
278.
Masubuchi, Y., Hosokawa, S., Horie, T., Ohmori, S., Kitada, M., Suzuki, T., Narimatsu,
S., 1994. Cytochrome P-450 isozymes involved in propranolol metabolism in
human liver microsomes: The role of CYP-2D6 as ring hydroxylase and CYP1A2
as N-desisopropylase. Drug Metab. Dispos. 22, 909-915.
Mohutsky, M. A., Chien, J. Y., Ring, B. J., Wrighton, S. A., 2006. Predictions of the in
vivo clearance of drugs from rate of loss using human liver microsomes for phase
I and phase II biotransformations. Pharm. Res. 23, 654-662.
Nallani, G., Paulos, P., Vaz, A., Constantine, L., Venables, B., Huggett, D., 2009.
Bioconcentration potential of ibuprofen in fathead minnow (Pimephales
promelas) and channel catfish (Ictalurus punctatus) [Abstract No. UP012].
Presented at SETAC North America 30th Annual Meeting, New Orleans, LA.
Neely, W., Branson, D., Blau, G., 1974. Partition coefficient to measure
bioconcentration potential of organic chemicals in fish. Environ. Sci. Technol. 8,
1113-1115.
Obach, R. S., 1999. Prediction of human clearance of twenty-nine drugs from hepatic
microsomal intrinsic clearance data: an examination of in vitro half-life approach
and nonspecific binding to microsomes. Drug Metab. Dispos. 27, 1350-1359.
OECD (Organization for Economic Cooperation and Development), 1996.
Bioconcentration: Flow-through Fish Tests, 305, last updated 14 June 1996.
Paris, France.
91
Oliver, B. G., Niimi, A. J., 1985. Bioconcentration Factors of Some Halogenated
Organics for Rainbow Trout: Limitations in their Use for Prediction of
Environmental Residues. Environ. Sci. Technol. 19, 842-849.
Part, P., Norrgren, L., Bergstrom, E., Sjoberg, P., 1993. Primary cultures of epithelial
cells from rainbow trout gills. J. Exp. Biol. 175, 219-232.
Pesonen, M., Andersson, T., 1991. Characterization and induction of xenobiotic
metabolizing enzyme activities in a primary culture of rainbow trout hepatocytes.
Xenobiotica 21, 461–471.
Randall, D. J., Connell, D. W., Yang, R., Wu, S. S., 1998. Concentrations of persistent
lipophilic compounds in fish are determined by exchange across the gills, not
through the food chain. Chemosphere, 37, 1263-1270.
Repetto, G., del Peso, A., Zurita, J. L., 2008. Neutral red uptake assay viability/
cytotoxicity. Nat. Protoc. 3, 1125-1131.
Roberts, P., Thomas, K., 2006. The occurrence of selected pharmaceuticals in
wastewater effluent and surface waters of the lower Tyne catchment. Sci. Total
Environ. 356, 143-153.
Schlezinger, J., Parker, C., Zeldin, D., Stegeman, J., 1998. Arachidonic acid metabolism
in the marine fish Stenotomus chrysops (Scup) and the effects of cytochrome
P450 1A inducers. Arch. Biochem. Biophys. 353, 265-275.
Veith, G.D., D.L. Defoe and B.V. Bergstedt. 1979. Measuring and estimating the
bioconcentration factor of chemicals on fish. J. Fish. Res. Board Can. 36:1040-
1048.

92
Weisbrod, A., Burkhard, L., Arnot, J., Mekenyan, O., Howard, P., Russom, C.,
Boethling, R., Sakuratani, Y., Traas, T., Bridges, T., Lutz, C., Bonnell, M.,
Woodburn, K., Parkerton, T., 2007. Workgroup report: review of fish
bioaccumulation databases used to identify persistent, bioaccumulative, toxic
substances. Environ. Health Perspect. 115, 255-261.

93
CHAPTER 5
CONCLUSIONS
5.1. Introduction
The evaluation of metabolic potential provides mechanistic insight into how
aquatic species may process xenobiotics in their environment. The ability to metabolize
and clear potentially deleterious substances may afford an advantage to the organism.
This dissertation focused on the influence of metabolic transformation on
bioconcentration. An in vitro biotransformation assay was refined across two fish
species with three compounds. Loss of parent was measured in S9 fractions,
microsomes (trout only) and primary cells suspensions to assess metabolic activity.
The intrinsic clearance rate of parent compound (CLm) was extrapolated to the
metabolic transformation rate (kM) and inserted into a BCF model.
5.2. Comparison of Subcellular Fractions and Cell Suspensions
5.2.1. First Order Kinetics
To evaluate loss of parent compound, first order kinetics was assumed for each
reaction. Remaining parent compound concentrations were plotted versus time (Fig.
15). Data points were fit to an exponential curve with the following integrated equation
where k is the first order loss constant and t is time.
µmoles lost = intercept * e-kt (9)

94
Fig. 17. Example of first order kinetics in catfish hepatocyte assay results. Ibuprofen
concentrations (ng mL-1) are plotted against time (minutes).
Data sets with a coefficient of determination (R2 ) less than 0.5 were excluded
from future analysis. Table 8 provides the mean R2 for each data set. Most assay
replicates met the requirements for first order kinetics.
Table 8
Mean coefficient of determination (R2 ) for exponential curves fit to concentration versus
time. “M” indicates microsomes. “Cell” indicates primary cell suspension.
Norethindrone Propranolol Ibuprofen
S9 M Cell S9 M Cell S9 M Cell
Trout Liver 0.72 0.94 0.82 0.82 0.95 0.91 0.72 0.69 0.72
Trout Gill 0.64 0.75 0.77 0.72 0.54 0.71 0.57 0.51 0.81
Catfish Liver 0.77 --- 0.72 0.81 --- 0.91 0.73 --- 0.79
Catfish Gill 0.85 --- 0.71 0.62 --- 0.68 0.78 --- 0.81

95
5.2.2. Variability
In some data sets, such as trout gill microsome metabolism of ibuprofen, the
mean percent loss over 90 minutes was small (e.g., 6.9%). Although, this slight loss of
parent was considered significant over time and exceeded the minimum detectable
difference (MDD) due to a small variance (s2) between replicates, the mean loss of
ibuprofen was only 138.5ng mL-1 over the course of the assay. Data sets with greater
loss of parent often had a greater s2 and thus a larger MDD. For example, catfish liver
S9 had an average 65.9% loss of propranolol over the course of the study and an MDD
of 6.7% loss. The loss of ibuprofen in trout gill microsomes would not be statistically
verifiable with the same s2 and MDD as the propranolol catfish liver S9 assay. Variation
in more metabolically active data sets is due to greater variation at the intermediate time
points. Continuing with the previous example, at the 90 minute time point, a mean
65.9% loss with standard deviation of 4.9% was observed. The standard deviation of
the proceeding time points (15, 30, 45 and 60 minutes) ranged from 18.6% to 29.1%.
Thus, the source of variation was the loss rate at which the replicates approached the
substrate concentration asymptote.
5.2.3. Norethindrone
As discussed in previous chapters, loss of parent norethindrone was observed in
all subcellular fractions and cell suspensions. In general, hepatic subcellular fractions
and cell suspensions provided for a greater percent loss of parent compound (Fig. 16).
The greatest percent loss was seen in trout liver microsomes, followed by trout and
catfish liver S9 and then trout and catfish hepatocytes. A difference in loss of parent
was not as distinguishable in gill subcellular fractions and cell suspensions.

96
Fig. 18. Mean percent loss of norethindrone across liver and gill S9, microsomes and
cell suspensions.
CLm of cell suspension assays was adjusted to mL hr-1 (106 cells)-1 to better
compare with the subcellular fractions. Trout liver microsomes were statistically greater
than trout liver S9 and trout hepatocytes (Fig. 17). This may be in part to the
normalization of microsomes to S9. Microsomes were diluted to 1mg protein mL-1 while
S9 was diluted to 2mg protein mL-1. Some evidence indicate that the microsomal pellet
contains four to five times greater P450 activity than S9 (Pearce et al., 1996). Thus,
microsomes would be expected to have higher CLm. A significantly higher CLm was
also found in trout gill microsomes.
Hepatocyte suspension CLm were significantly lower than liver S9 CLm in both
species. Although the same trend was seen in catfish gill suspensions, the difference
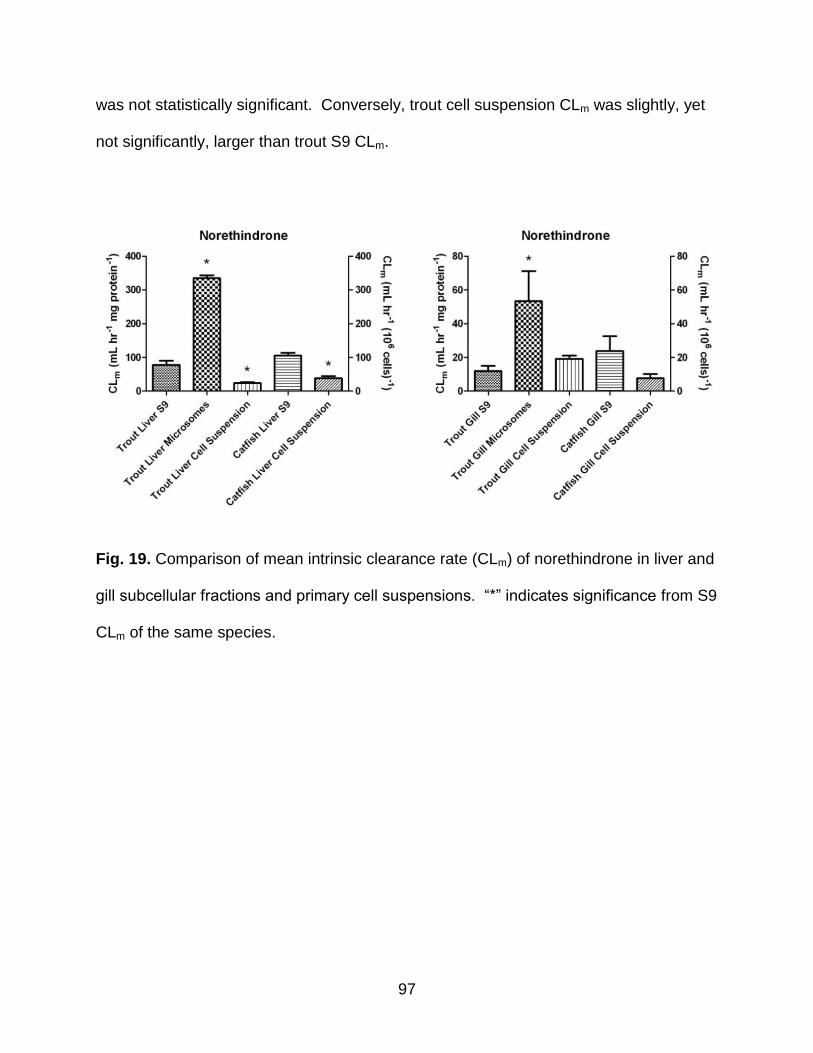
97
was not statistically significant. Conversely, trout cell suspension CLm was slightly, yet
not significantly, larger than trout S9 CLm.
Fig. 19. Comparison of mean intrinsic clearance rate (CLm) of norethindrone in liver and
gill subcellular fractions and primary cell suspensions. “*” indicates significance from S9
CLm of the same species.

98
Fig. 20. Comparison of mean metabolic transformation rate (kM) of norethindrone in liver
and gill subcellular fractions and primary cell suspensions. “*” indicates significance
from S9 kM of the same species.
The extrapolation of CLm to kM provided for a wide range of values, in which cell
suspension kM was significantly greater than S9 kM in all species and tissue types (Fig.
18). This was due to differences in the extrapolation modeling. In order to calculate kM
from CLm, different formulas were used to determine intrinsic clearance in the tissue
(CLi). The tissue weight (TW) was multiplied by CLm and then further multiplied by
either the subcellular fraction protein level (PL) or cell suspension cellularity (Cp).
CLi = TW * (PL or Cp) * CLm (11)

99
Protein levels ranged from 0.024 to 0.094 g protein (g tissue)-1. Cellularity was
much greater with a range of 1.17x10⁸ to 3.41x10⁸ cells (g tissue)-1. This is an
enormous disparity in magnitude that heavily influences kM. Thus, in vitro cell
suspension assays will have a greater influence on BCF than in vitro subcellular fraction
assays due to the manner in which kM is calculated.
5.2.4. Propranolol
Propranolol was well metabolized in most assay replicates with the highest
percent loss of parent in hepatic subcellular fractions and the least in trout gill cell
suspensions (Fig. 19).
Liver S9 and microsomal fractions had significantly higher CLm than hepatocyte
suspensions (Fig. 20). The same trend was seen in gill subcellular fractions. However,
a significant difference could not be obtained due to the variance in gill S9 and
microsome CLm. Increased metabolism in S9 and microsomes over cell suspensions
may be due to either greater quantity or greater substrate accessibility to P450
isozymes in the reaction vessel. Differential centrifugation forms microsomes from the
endoplasmic reticulum (ER), which isolates ER membrane-bound P450s from other
cytosolic enzymes. S9 contains both microsomes and cytosol. CYP2D6 readily
metabolizes propranolol in mammalian microsomes (Masubuchi et al., 1994). Although
direct CYP2D homologues have not been identified in fish (Buhler and Wang-Buhler,
1998), the biotransformation pathway is assumed to be P450-mediated. The similar
metabolism of propranolol in S9 and microsomes supports a P450-mediated pathway.

100
Fig. 21. Mean percent loss of propranolol across liver and gill S9, microsomes and cell
suspensions.
Fig. 22. Comparison of mean intrinsic clearance rate (CLm) of propranolol in liver and
gill subcellular fractions and primary cell suspensions. “*” indicates significance from S9
CLm of the same species.
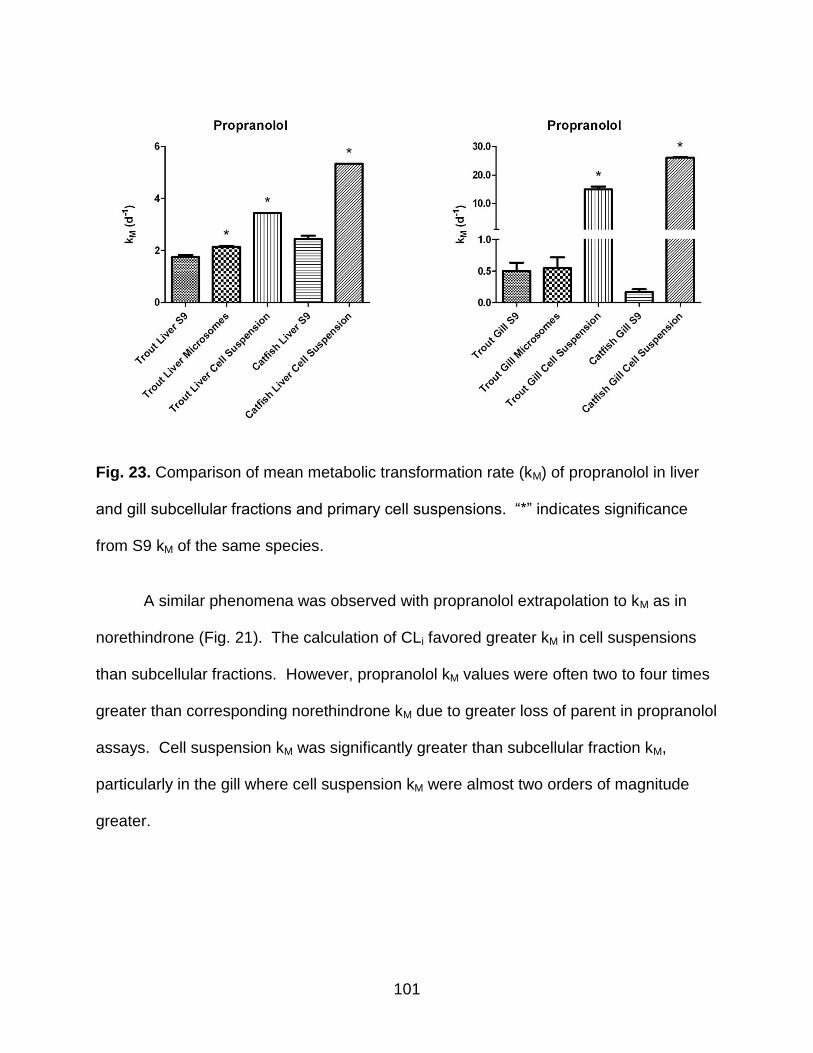
101
Fig. 23. Comparison of mean metabolic transformation rate (kM) of propranolol in liver
and gill subcellular fractions and primary cell suspensions. “*” indicates significance
from S9 kM of the same species.
A similar phenomena was observed with propranolol extrapolation to kM as in
norethindrone (Fig. 21). The calculation of CLi favored greater kM in cell suspensions
than subcellular fractions. However, propranolol kM values were often two to four times
greater than corresponding norethindrone kM due to greater loss of parent in propranolol
assays. Cell suspension kM was significantly greater than subcellular fraction kM,
particularly in the gill where cell suspension kM were almost two orders of magnitude
greater.

102
5.2.5. Ibuprofen
Unlike norethindrone and propranolol, ibuprofen also undergoes phase II
biotransformation via glucuronidation to form an acyl-glucuronide metabolite (Ritter
2000). Studies have shown direct glucuronidation to account for approximately 14% of
(S)-(+)-ibuprofen metabolism with 2-hydroxyl-ibuprofen and 3-hydroxyl-ibuprofen
metabolites accounting for 28% and 45%, respectively in human microsomes (Rudy et
al., 1991; Davies, 1998; Rodrigues, 2005). In mammalian systems, the hydroxyl-
metabolites are formed by CYP2C9 and CYP2C8 (Jacqz-Aigrain and Anderson, 2006).
As discussed in Chapter 3, an alternative phase I pathway involving CYP1A2 is
hypothesized for piscine metabolism.
Fig. 24. Mean percent loss of ibuprofen across liver and gill S9, microsomes and cell
suspensions.

103
Hepatocyte suspensions metabolized a significantly greater percent of parent
compound than subcellular fractions (Fig. 22). Increased availability to UDP-
glucuronosyltransferase (UGT) in the cellular suspensions may have lead to the
increased metabolism. UGTs are similar to P450s in that they are membrane bound
enzymes located in ER. However, unlike P450s, the UGT active site is in the lumen of
the ER (Remmel et al., 2008). Highly charged uridine diphosphate glucuronic acid
(UDPGA) requires transport across the membrane to the UGT active site. Membrane
integrity is maintained in microsomes (Kobayashi et al., 2006), limiting UDPGA and
ibuprofen access. Membrane disruptors, such as alamethicin, are required to allow for
membrane leakage in microsomal incubations. However, the effectiveness of
membrane disruptors is often substrate specific (Lett et al., 1992). In the ibuprofen
studies described in Chapter 3, alamethicin was added to S9 incubations with
supplemental UDPGA. Although some studies have found the addition of alamethicin to
double or triple UGT activity (Fisher et al., 2000), the addition of alamethicin and
UDPGA did not significantly enhance ibuprofen metabolism in S9 compared to
unaugmented S9. In cell suspensions, UDPGA-ER transport remains functional. Thus,
the increased ibuprofen metabolism in hepatocyte suspensions may be due to
increased glucuronidation.
Comparison of CLm between subcellular fractions and cell suspensions was
similar to that of norethindrone and propranolol (Fig. 23). Hepatocyte suspensions had
significantly greater CLm. A significant difference was not found between gill CLm.
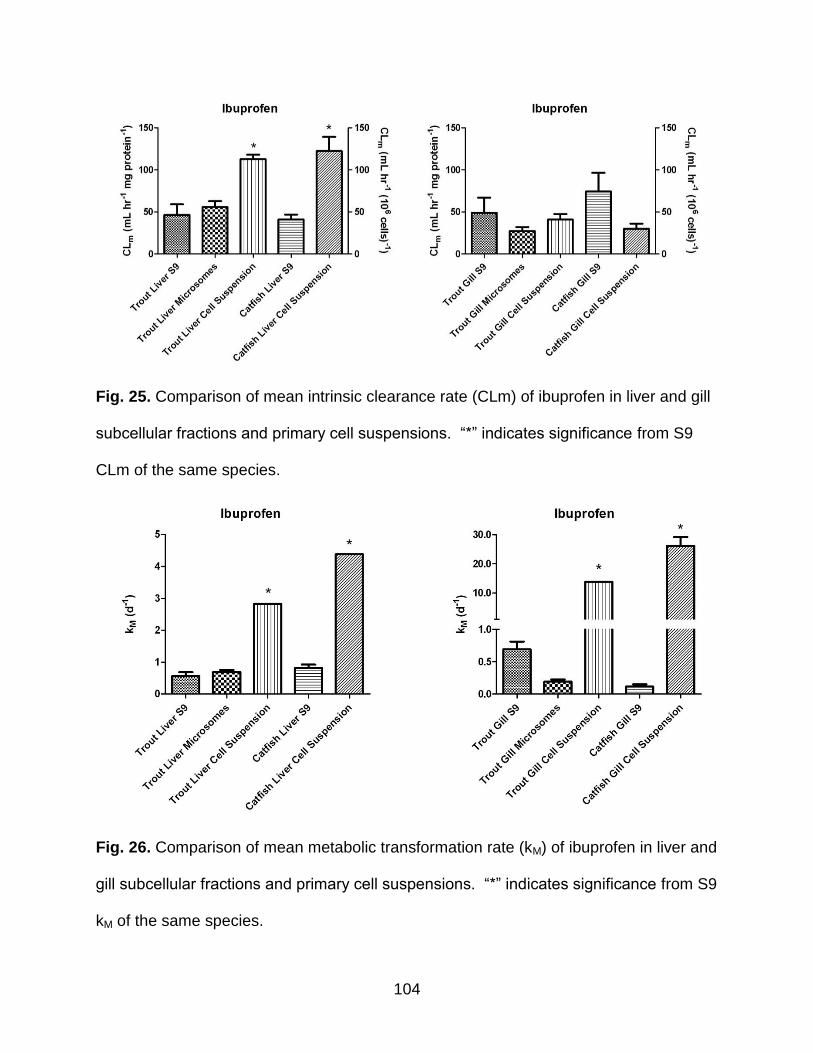
104
Fig. 25. Comparison of mean intrinsic clearance rate (CLm) of ibuprofen in liver and gill
subcellular fractions and primary cell suspensions. “*” indicates significance from S9
CLm of the same species.
Fig. 26. Comparison of mean metabolic transformation rate (kM) of ibuprofen in liver and
gill subcellular fractions and primary cell suspensions. “*” indicates significance from S9
kM of the same species.

105
For ibuprofen, kM values were in the same range as propranolol (Fig. 24). Lower
kM were noted in norethindrone. Cell suspension kM was significantly greater than
subcellular fraction kM, particularly in the gill .
5.3. Objectives and Hypotheses
5.3.1. Objective 1
Determine the in vitro intrinsic clearance rate of parent compound (CLm) and the
metabolic rate constant (kM) for the test compounds in gill S9 fractions.
Hypothesis 1: HO: Loss of parent material will not be significantly different
from starting concentrations. α = 0.05
Two-way repeated measures ANOVA analyzed loss of parent compound over
time for statistical significance. For all three compounds, the effect of time was
considered extremely significant (p<0.0001) for all gill subcellular fractions. Thus, the
null hypothesis was rejected.
Hypothesis 2: HO: In vitro gill kM will not significantly decrease model BCF
values. α = 0.05
One-way ANOVA with Bonferroni post tests was used to determine significance
between BCF0 and BCFM. Significance was not found with all gill subcellular fractions,
thus, the null hypothesis cannot be rejected in its entirety (Table 9). The influence of
catfish gill kM was not significant in decreasing the BCFM of any of the three compounds.
A significant difference was observed in trout gill S9 for propranolol and ibuprofen, but

106
not for trout gill microsomes. The opposite was found with norethindrone. Significance
was noted in trout gill microsomes, but not trout S9.
5.3.2. Objective 2
Determine the in vitro intrinsic clearance rate of parent compound (CLm) and the
metabolic rate constant (kM) for the test compounds in liver S9 fractions.
Hypothesis 3: HO: Loss of parent material will not be significantly different
from starting concentrations. α = 0.05
Two-way repeated measures ANOVA analyzed loss of parent compound over
time for statistical significance. For all three compounds, the effect of time was
considered extremely significant (p<0.0001) for all liver subcellular fractions. Thus, the
null hypothesis was rejected.
Hypothesis 4: HO: In vitro liver kM will not significantly decrease model BCF
values. α = 0.05
One-way ANOVA with Bonferroni post tests was used to determine significance
between BCF0 and BCFM. Significance was found in all liver subcellular fractions, thus,
the null hypothesis can be rejected (Table 9).

107
Table 9
Influence of kM on predicted BCF. "ns” indicates no significant difference when
compared to BCF0. “*” indicates p<0.05. “**” indicates p<0.01. “***” indicates
p<0.0001.
Norethindrone Propranolol Ibuprofen
Trout Liver S9 *** *** **
Trout Gill S9 ns ** **
Trout Liver Microsomes *** *** **
Trout Gill Microsomes * ns ns
Catfish Liver S9 *** *** ***
Catfish Gill S9 ns ns ns
5.3.3. Objective 3
Determine the in vitro intrinsic clearance rate of parent compound (CLm) and the
metabolic rate constant (kM) for the test compounds in primary gill cell suspensions.
Hypothesis 5: HO: Loss of parent material will not be significantly different
from starting concentrations. α = 0.05
Two-way repeated measures ANOVA analyzed loss of parent compound over
time for statistical significance. For all three compounds, the effect of time was
considered extremely significant (p<0.0001) for all primary gill cell suspensions. Thus,
the null hypothesis was rejected.
108
Hypothesis 6: HO: In vitro gill kM will not significantly decrease model BCF
values. α = 0.05
One-way ANOVA with Bonferroni post tests was used to determine significance
between BCF0 and BCFM. Significance was found in all gill cell suspensions
(p<0.0001), thus the null hypothesis can be rejected.
5.3.4. Objective 4
Determine the in vitro intrinsic clearance rate of parent compound (CLm) and the
metabolic rate constant (kM) for the test compounds in primary hepatocyte suspensions.
Hypothesis 7: HO: Loss of parent material will not be significantly different
from starting concentrations. α = 0.05
Two-way repeated measures ANOVA analyzed loss of parent compound over
time for statistical significance. For all three compounds, the effect of time was
considered extremely significant (p<0.0001) for all primary hepatocyte suspensions.
Thus, the null hypothesis was rejected.
Hypothesis 8: HO: In vitro liver kM will not significantly decrease model BCF
values. α = 0.05
One-way ANOVA with Bonferroni post tests was used to determine significance
between BCF0 and BCFM. Significance was found in all hepatocyte suspensions
(p<0.0001), thus the null hypothesis can be rejected.
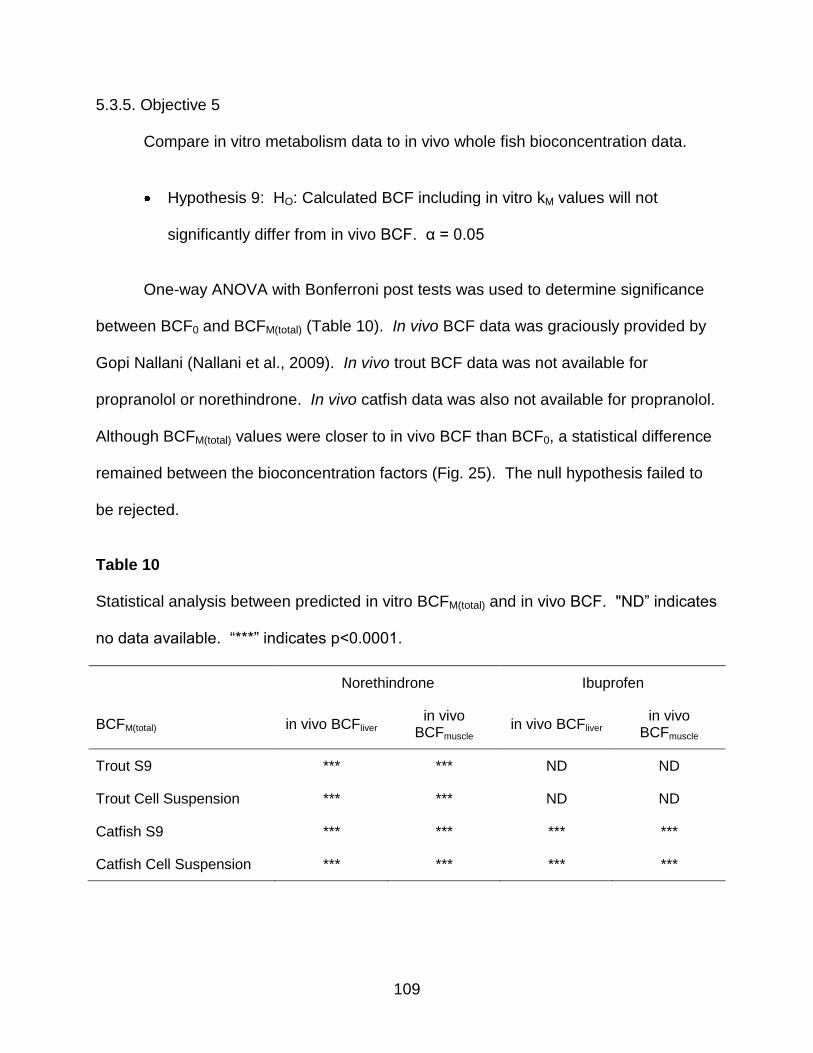
109
5.3.5. Objective 5
Compare in vitro metabolism data to in vivo whole fish bioconcentration data.
Hypothesis 9: HO: Calculated BCF including in vitro kM values will not
significantly differ from in vivo BCF. α = 0.05
One-way ANOVA with Bonferroni post tests was used to determine significance
between BCF0 and BCFM(total) (Table 10). In vivo BCF data was graciously provided by
Gopi Nallani (Nallani et al., 2009). In vivo trout BCF data was not available for
propranolol or norethindrone. In vivo catfish data was also not available for propranolol.
Although BCFM(total) values were closer to in vivo BCF than BCF0, a statistical difference
remained between the bioconcentration factors (Fig. 25). The null hypothesis failed to
be rejected.
Table 10
Statistical analysis between predicted in vitro BCFM(total) and in vivo BCF. "ND” indicates
no data available. “***” indicates p<0.0001.
Norethindrone Ibuprofen
BCFM(total) in vivo BCFliver in vivo
BCFmuscle in vivo BCFliver
in vivo BCFmuscle
Trout S9 *** *** ND ND
Trout Cell Suspension *** *** ND ND
Catfish S9 *** *** *** ***
Catfish Cell Suspension *** *** *** ***
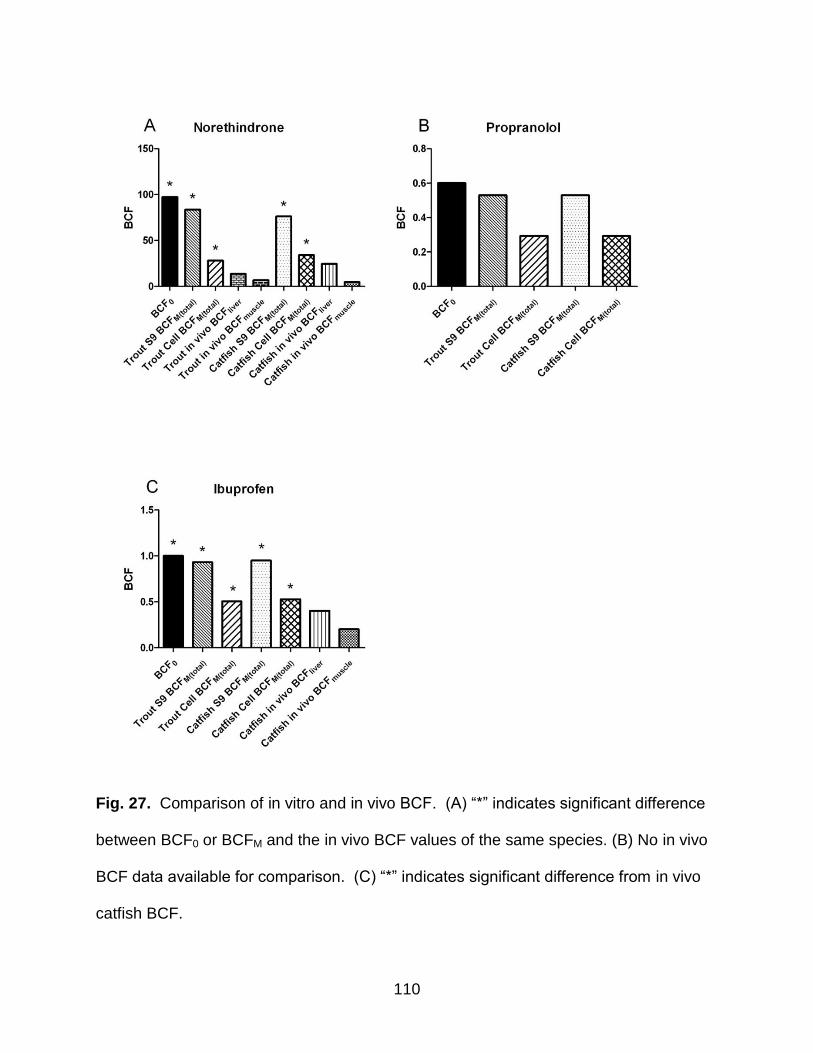
110
Fig. 27. Comparison of in vitro and in vivo BCF. (A) “*” indicates significant difference
between BCF0 or BCFM and the in vivo BCF values of the same species. (B) No in vivo
BCF data available for comparison. (C) “*” indicates significant difference from in vivo
catfish BCF.
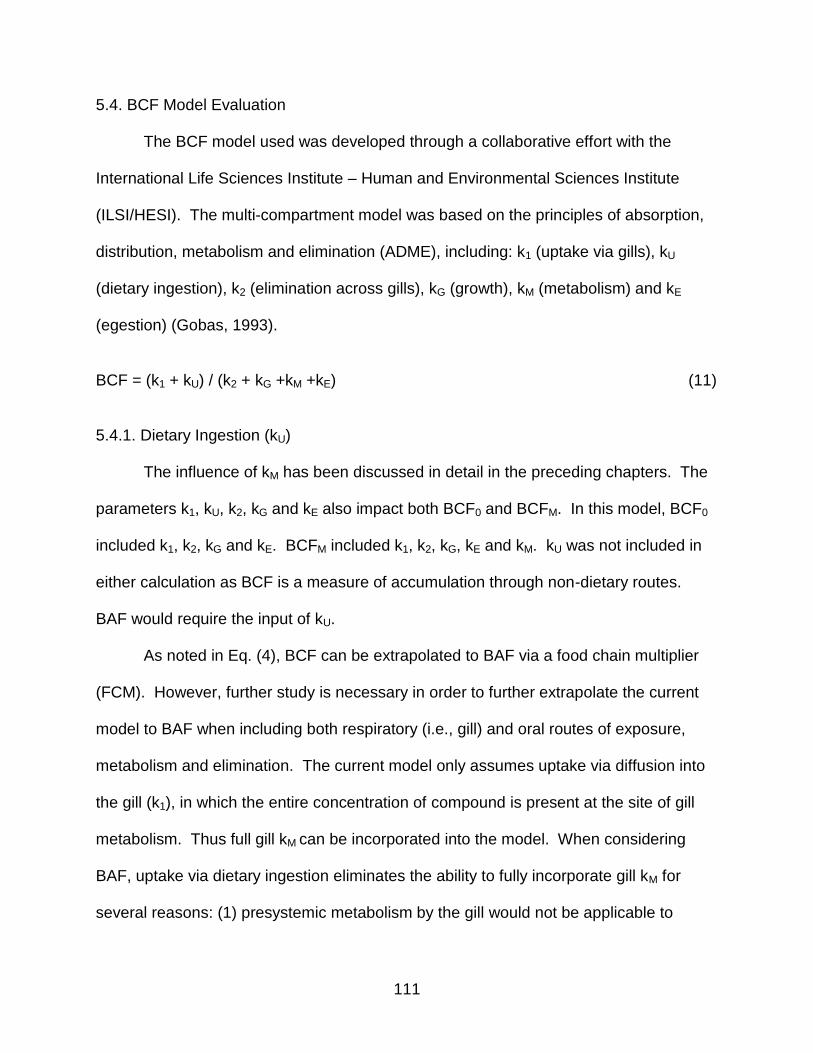
111
5.4. BCF Model Evaluation
The BCF model used was developed through a collaborative effort with the
International Life Sciences Institute – Human and Environmental Sciences Institute
(ILSI/HESI). The multi-compartment model was based on the principles of absorption,
distribution, metabolism and elimination (ADME), including: k1 (uptake via gills), kU
(dietary ingestion), k2 (elimination across gills), kG (growth), kM (metabolism) and kE
(egestion) (Gobas, 1993).
BCF = (k1 + kU) / (k2 + kG +kM +kE) (11)
5.4.1. Dietary Ingestion (kU)
The influence of kM has been discussed in detail in the preceding chapters. The
parameters k1, kU, k2, kG and kE also impact both BCF0 and BCFM. In this model, BCF0
included k1, k2, kG and kE. BCFM included k1, k2, kG, kE and kM. kU was not included in
either calculation as BCF is a measure of accumulation through non-dietary routes.
BAF would require the input of kU.
As noted in Eq. (4), BCF can be extrapolated to BAF via a food chain multiplier
(FCM). However, further study is necessary in order to further extrapolate the current
model to BAF when including both respiratory (i.e., gill) and oral routes of exposure,
metabolism and elimination. The current model only assumes uptake via diffusion into
the gill (k1), in which the entire concentration of compound is present at the site of gill
metabolism. Thus full gill kM can be incorporated into the model. When considering
BAF, uptake via dietary ingestion eliminates the ability to fully incorporate gill kM for
several reasons: (1) presystemic metabolism by the gill would not be applicable to
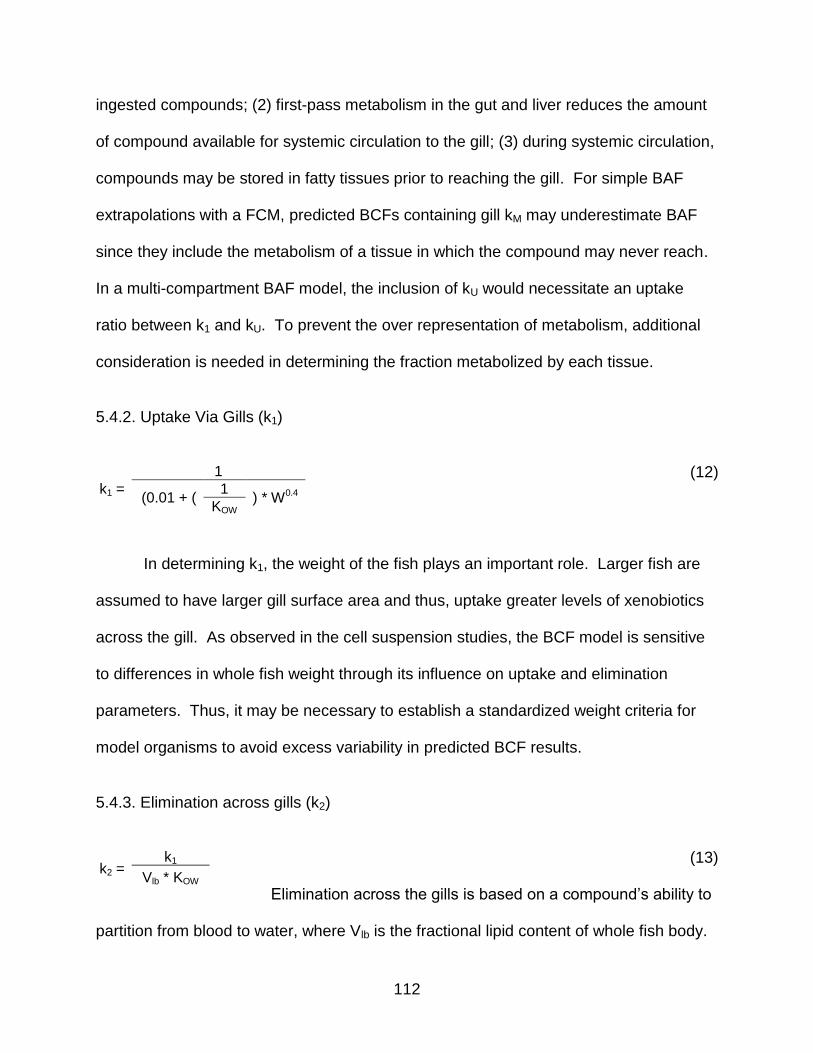
112
ingested compounds; (2) first-pass metabolism in the gut and liver reduces the amount
of compound available for systemic circulation to the gill; (3) during systemic circulation,
compounds may be stored in fatty tissues prior to reaching the gill. For simple BAF
extrapolations with a FCM, predicted BCFs containing gill kM may underestimate BAF
since they include the metabolism of a tissue in which the compound may never reach.
In a multi-compartment BAF model, the inclusion of kU would necessitate an uptake
ratio between k1 and kU. To prevent the over representation of metabolism, additional
consideration is needed in determining the fraction metabolized by each tissue.
5.4.2. Uptake Via Gills (k1)
(12)
In determining k1, the weight of the fish plays an important role. Larger fish are
assumed to have larger gill surface area and thus, uptake greater levels of xenobiotics
across the gill. As observed in the cell suspension studies, the BCF model is sensitive
to differences in whole fish weight through its influence on uptake and elimination
parameters. Thus, it may be necessary to establish a standardized weight criteria for
model organisms to avoid excess variability in predicted BCF results.
5.4.3. Elimination across gills (k2)
(13)
Elimination across the gills is based on a compound’s ability to
partition from blood to water, where Vlb is the fractional lipid content of whole fish body.
k1 =
1
(0.01 + ( 1
) * W0.4 KOW
k2 = k1
Vlb * KOW

113
k2 is based on the assumption that increased fish lipid content and compound
lipophilicity result in storage of the compound in fatty tissue, rather than systemic
circulation and subsequent elimination across the gill. Thus, Vlb and KOW decrease k2
while the ability to partition into the gill bloodstream (k1) is considered equivalent to the
ability to partition out of the bloodstream. Vlb is expected to vary from 2-11% dependent
upon fish species, age and location (Dyer et al., 2000; Arnot and Gobas, 2004; Cowan-
Ellsberry et al., 2008). For purposes of comparison, Vlb was held constant for each
species at 0.1 (i.e., 10%) (Cowan-Ellsberry et al., 2008). Variation in Vlb can
significantly affect modeling results. For example, changing the Vlb in the extrapolation
of a typical trout liver S9 biotransformation assay alters not only k2, but also kM, BCFM
and BCF0 (Table 11).
Table 11
Example of the influence of the fractional lipid content of whole fish body on
extrapolation of in vitro biotransformation data.
Fractional lipid content of whole fish body (Vlb)
0.02 0.10 0.11
k2 8.77 1.75 1.59
kM 1.14 0.29 0.27
BCFM 17.3 83.4 91.7
BCF0 19.5 97.3 107.0
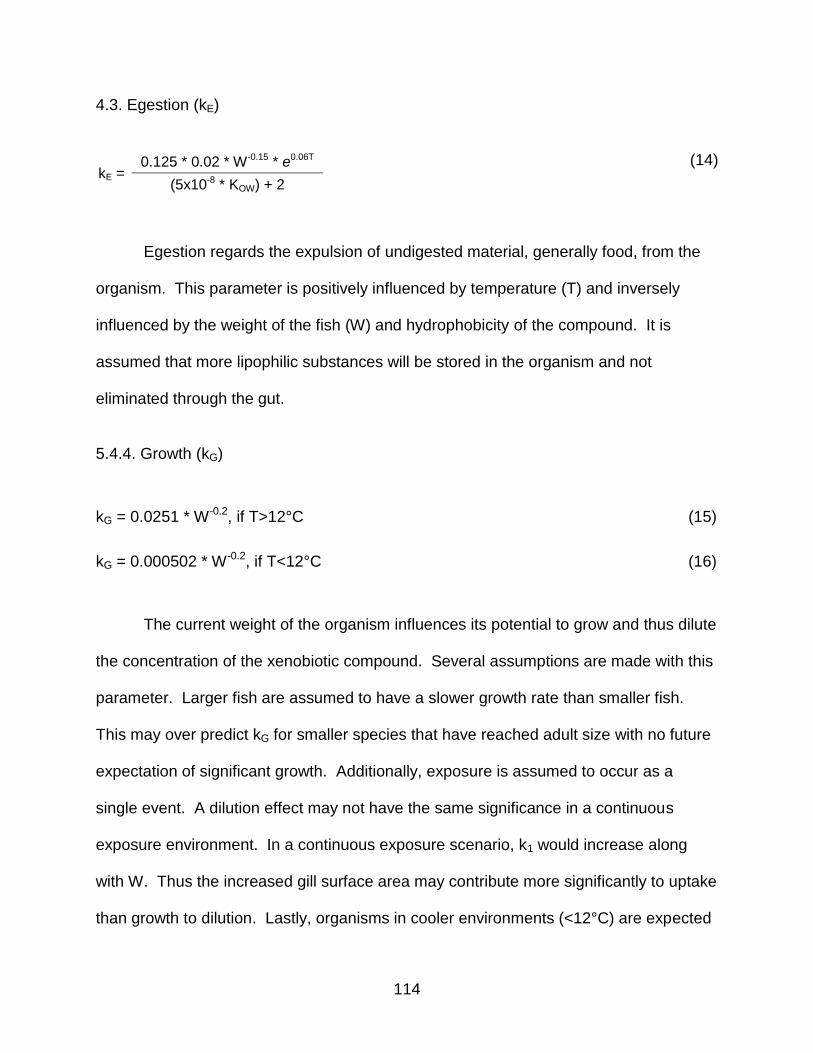
114
4.3. Egestion (kE)
(14)
Egestion regards the expulsion of undigested material, generally food, from the
organism. This parameter is positively influenced by temperature (T) and inversely
influenced by the weight of the fish (W) and hydrophobicity of the compound. It is
assumed that more lipophilic substances will be stored in the organism and not
eliminated through the gut.
5.4.4. Growth (kG)
kG = 0.0251 * W-0.2, if T>12°C (15)
kG = 0.000502 * W-0.2, if T<12°C (16)
The current weight of the organism influences its potential to grow and thus dilute
the concentration of the xenobiotic compound. Several assumptions are made with this
parameter. Larger fish are assumed to have a slower growth rate than smaller fish.
This may over predict kG for smaller species that have reached adult size with no future
expectation of significant growth. Additionally, exposure is assumed to occur as a
single event. A dilution effect may not have the same significance in a continuous
exposure environment. In a continuous exposure scenario, k1 would increase along
with W. Thus the increased gill surface area may contribute more significantly to uptake
than growth to dilution. Lastly, organisms in cooler environments (<12°C) are expected
kE = 0.125 * 0.02 * W-0.15 * e0.06T
(5x10⁻⁸ * KOW) + 2

115
to have slower growth rates than those in warmer environments (>12°C). Additional
study of kG may be necessary in the prediction of BCF for smaller species (e.g., fathead
minnow (Pimephales promelas)) or organisms in environments with dynamic
temperature ranges and/or continuous exposure.
5.5. Conclusion
Overall, extrapolation of the in vitro biotransformation assay data lowered
predicted BCF values, placing them closer, yet still statistically different, to in vivo BCFs.
Refinement of the remaining parameters k1, k2, kG and kE are needed to further improve
the BCF model. Additionally, primary cell suspensions appear to more effectively
contribute to kM. As seen in ibuprofen, cell suspensions are more appropriate for
compounds that undergo glucuronidation and may serve as a better representation for
compounds undergoing other phase II conjugations.
In vitro biotransformation assays are not limited to providing inputs for BCF
models. They also impart knowledge on how aquatic organisms metabolize
xenobiotics. Continued research into the fields of bioconcentration modeling and
piscine biotransformation will allow for better understanding of how xenobiotic
compounds affect aquatic organisms.
5.6. References
Arnot, J. A., Gobas, F. A., 2004. A food web bioaccumulation model for organic
chemicals in aquatic ecosystems. Environ. Toxicol. Chem. 10, 2343-2355.
116
Buhler, D., Wang-Buhler, J.-L., 1998. Review: Rainbow trout cytochrome P450s:
purification, molecular aspects, metabolic activity, induction and role in
environmental monitoring. Comp. Biochem. Physiol. 121C, 107-137.
Cowan-Ellsberry, C., Dyer, S. E., Bernhard, M., Roe, A., Dowty, M., Weisbrod, A., 2008.
Approach for extrapolating in vitro metabolism data to refine bioconcentration
factor estimates. Chemosphere 70, 1804-1817.
Davies, N., 1998. Clinical pharmacokinetics of ibuprofen: The first 30 years. Clin.
Pharmacokinet. 34, 101-154.
Dyer, S. D., White-Hull, C. E., Shephard, B. K., 2000. Assessment of chemical mixtures
via toxicity reference values overpredict hazard to Ohio fish communities.
Environ. Sci. Technol. 34, 2518-2524.
Fisher, M., Campanale, K., Ackermann, B., Vandenbranden, M., Wrighton, S., 2000. In
vitro glucuronidation using human liver microsomes and the pore-forming peptide
alamethicin. Drug Metab. Dispos. 28, 560-566.
Jacqz-Aigrain, E., Anderson, B., 2006. Pain control: Non-steroidal anti-inflammatory
agents. Semin. Fetal Neonatal. Med. 11, 251-259.
Kobayashi, T., Sleeman, J. E., Coughtrie, M. W., 2006. Molecular and functional
characterization of microsomal UDP-glucuronic acid uptake by members of the
nucleotide sugar transporter (NST) family. Biochem. J. 400(Pt. 2), 281-289.
Lett, E., Kriszt, W., de Sandro, V., Ducrotoy, G., Richert, L., 1992. Optimal detergent
activation of rat liver microsomal UDP-glucuronosyltransferases toward morphine
and 1-naphthol: Contribution to induction and latency studies. Biochem.
Pharmacol. 43, 1649-1653.

117
Masubuchi, Y., Hosokawa, S., Horie, T., Suzuki, T., Ohmori, S., Kitada, M., Suzuki, T.,
Narimatsu, S.. 1994. Cytochrome P450 isozymes involved in propranolol
metabolism in human liver microsomes. The role of CYP2D6 as ring-hydroxylase
and CYP1A2 as N-desisopropylase. Drug Metab. Dispos. 22(6), 909-915.
Nallani, G., Paulos, P., Vaz, A., Constantine, L., Venables, B., Huggett, D., 2009.
Bioconcentration potential of ibuprofen in fathead minnow (Pimephales
promelas) and channel catfish (Ictalurus punctatus). New Orleans: North America
SETAC Annual Meeting.
Pearce, R., McIntyre, C. J., Madan, A., Sanzgiri, U., Draper, A. J., Bullock, P., Cook, D.
C., Burton, L. A., Latham, J., Nevins, C., Parkinson, A., 1996. Effects of freezing,
thawing, and storing human liver microsomes on cytochrome P450. Arch.
Biochem. Biophys. 331, 145-169.
Remmel, R. P., Zhou, J., Argikar, U. A., 2008. UDP-Glucuronosyltransferases. in:
Rodrigues, A. (Ed.), Drug-Drug Interactions, 2nd Ed. Informa Healthcare USA,
Inc., New York, NY, pp. 87-134
Ritter, J., 2000. Roles of glucuronidation and UDP-glucuronosyltransferases in
xenobiotic bioactivation reactions. Chem. Biol. Interact. 129, 171-193.
Rodrigues, A., 2005. Impact of CYP2C9 genotype on pharmacokinetics: are all
cyclooxygenase inhibitors the same? Drug Metab. Dispos. 33, 1567-1575.
Rudy, A., Knight, P., Brater, D., Hall, S., 1991. Stereoselective metabolism of ibuprofen
in humans: administration of R-, S- and racemic ibuprofen. J. Pharmacol. Exp.
Ther. 259, 1133-1139.
118
APPENDIX A
PROTOCOLS

119
A.1 In vitro Biotransformation Assay – S9 and Microsomes
1. Combine:
Test Article Blank Solvent Control S9 Control
--- --- 600µL methanol ---
600µL S9 600µL S9 --- 600µL S9
20µL isocitrate dehydrogenase
20µL isocitrate dehydrogenase
20µL isocitrate dehydrogenase
20µL isocitrate dehydrogenase
6µL isocitrate 6µL isocitrate 6µL isocitrate 6µL isocitrate
Test material --- Test material Test material
Test material may be:
6.5µL of 1mM propranolol stock solution (10µM final),
6.5µL of 1mM ibuprofen stock solution (10µM final), or
6.5µL of 1mM norethindrone stock solution (10µM final).
2. Vortex. Equilibrate in incubator at 15°C (trout), 25°C (catfish) or 37°C (mammalian)
for 10 minutes. Shake at low speed.
3. Add 6µL of 50mM NADPH.
4. Vortex well (~30 seconds).
5. Immediately place 100µL of test article, blank, solvent control and S9 control in
100µL methanol (time 0 min). Place denatured samples in refrigerator (4°C).
6. Place remaining blank and controls in incubator or water bath for remainder of test.
Shake at low speed. Place 100µL of blank and controls in 100µL methanol for the
last time point. Place denatured samples in refrigerator (4°C).

120
7. Place test articles in incubator or water bath until the next time point. Time points
should be 10 to 30 minutes apart and cover an appropriate range of time to
determine the intrinsic metabolic clearance rate (i.e., 1-3 hours). Place 100µL of test
article in 100µL methanol for each time point. Place denatured test articles in
refrigerator (4°C).
8. Spin all samples at 2500g for 10 minutes. Carefully remove supernatant and place
in 2mL RAM vial.
For S9 Assay – Ibuprofen Metabolites
9. Combine:
Test Article Blank Solvent Control S9 Control
--- --- 600µL methanol ---
600µL S9 600µL S9 --- 600µL S9
20µL isocitrate dehydrogenase
20µL isocitrate dehydrogenase
20µL isocitrate dehydrogenase
20µL isocitrate dehydrogenase
6µL isocitrate 6µL isocitrate 6µL isocitrate 6µL isocitrate
Test material --- Test material Test material
15µL alamethicin 15µL alamethicin 15µL alamethicin 15µL alamethicin
Test material = 6.5µL of 1mM ibuprofen stock solution (10 µM final)
10. Vortex. Equilibrate in incubator at 15°C (trout), 25°C (catfish) or 37°C (mammalian)
for 10 minutes. Shake at low speed.
11. Add 6µL of 50mM NADPH. Add 12µL UDPGA.
12. Vortex well (~5 full seconds).

121
13. Immediately place 100µL of test article, blank, solvent control and S9 control in
100µL cold methanol (time 0 min). Place denatured samples in refrigerator (4°C).
14. Place remaining blank and controls in incubator for remainder of test. Shake at low
speed. Place 100µL of blank and controls in 100µL methanol for the last time point.
Place denatured samples in refrigerator (4°C).
15. Place test articles in incubator until the next time point. Time points should be 10 to
30 minutes apart and cover an appropriate range of time to determine the intrinsic
metabolic clearance rate (i.e., 1-3 hours). Place 100µL of test article in 100µL cold
methanol for each time point. Place denatured test articles in refrigerator (4°C).
16. For metabolite samples, take only a 60 minute time point. Place 600µL methanol in
sample to stop reaction. Transfer to amber RAM vial. Store in refrigerator (4°C).
17. Add d3-Ibuprofen internal standard to loss of parent samples and controls (not
metabolite samples).
18. Spin all samples (except metabolite samples) at 2500g for 10 minutes. Carefully
remove supernatant and place in 2mL RAM vial.

122
A.2 In vitro Biotransformation Assay – Primary Cell Suspensions
Preparation 1. Autoclave ~5 gallons of RHW. Bucket, 2L glassware, autoclave tape, RHW
2. Make solutions Media, wash soln, trypsin+EDTA soln, stop soln, rinse soln
3. Do not feed fish 18-24 hours prior to sacrifice
4. Clean all dissecting tools and area with 70% ethanol
ethanol
Solutions 1. Wash solution 30 mL HBSS or PBS (pH 7.7) – need to check
Store at 4°C Invitrogen $14 – 14175-095-500mL
2. Trypsin+EDTA Solution 5 mL of 0.5% trypsin 0.5 mL 2% EDTA in PBS or HBSS ~44.5 mL PBS (to 50 mL) Store at 4°C
3. Stop Solution 2 mL fetal bovine serum 18 mL PBS or HBSS (pH 7.7) Store at 4°C
4. Rinse Solution 0.5 mL fetal bovine serum 19.5 mL PBS or HBSS Store at 4°C
5. Media 5 mL fetal bovine serum 95 mL L-15 media (make to 100 mL) Store at 4°C
Leibovitz’s L-15 medium (containing L-glutamine and phenol red)
6. water: acetonitrile: formic acid (92:5:3)
MQ water Acetonitrile Formic acid Store at room temp

123
Procedures 1. For GILLS ONLY - Place fish in autoclaved RHW for 30 min prior to collection.
(See Liver Perfusion Protocol for hepatocyte isolation protocol). Anesthetize fish prior to tissue harvest with MS-222.
RHW, bucket, fish Aquatic Tox Lab
2. Remove tissue under sterile conditions and place in HBSS or PBS (pH 7.4) Scalpel, scissors, HBSS or PBS
Aquatic Tox Lab
3. WASH Place tissue in 10mL Wash Soln for 10 min with manual agitation. Mince gills with scalpel, so as to have 3-5 filaments per cut. Place tissue in
10mL of fresh Wash Soln for 10 min with manual agitation. This step is skipped with perfused liver.
Aspirate wash solution. Add 10 mL of fresh Wash Soln with manual agitation.
Place tissue in 50 mL conical centrifuge tube. Aspirate out Wash Soln.
Petri dish 50 mL conical centrifuge tube Wash Solution Scalpel Aspirator Transfer pipettes
Hood in 280
4. TRYPTIC DIGESTION First digestion
Rinse gill filaments with a few drops of Trypsin+EDTA Soln. Aspirate. Add 5 mL Trypsin+EDTA. Shake for 20 min. Mechanically agitate well with transfer pipette (50x). Place 20 mL of Stop Soln into a new 50 mL conical centrifuge tube. Transfer and strain trypsinized cells through 100µm cell strainer
into the new 50 mL conical tube. Remove remaining filaments from strainer and place in the original
conical tube for further digestion. Second digestion
Add5 mL Trypsin+EDTA. Shake for 20 min. Mechanically agitate well with transfer pipette (50x). Transfer and strain trypsinized cells through a new 100µm cell
strainer into the 50 mL conical tube containing the cells from the first digestion.
Repeat with a third digestion if the tissue in the strainer still appears to contain cellular material or if there is a lot of mucus present in gill tissue. The digested gill filaments should appear translucent.
50 mL conical centrifuge tube Transfer pipettes Aspirator 100µm cell strainer Trypsin+EDTA Solution Stop Solution
5. CELL SUSPENSION Centrifuge
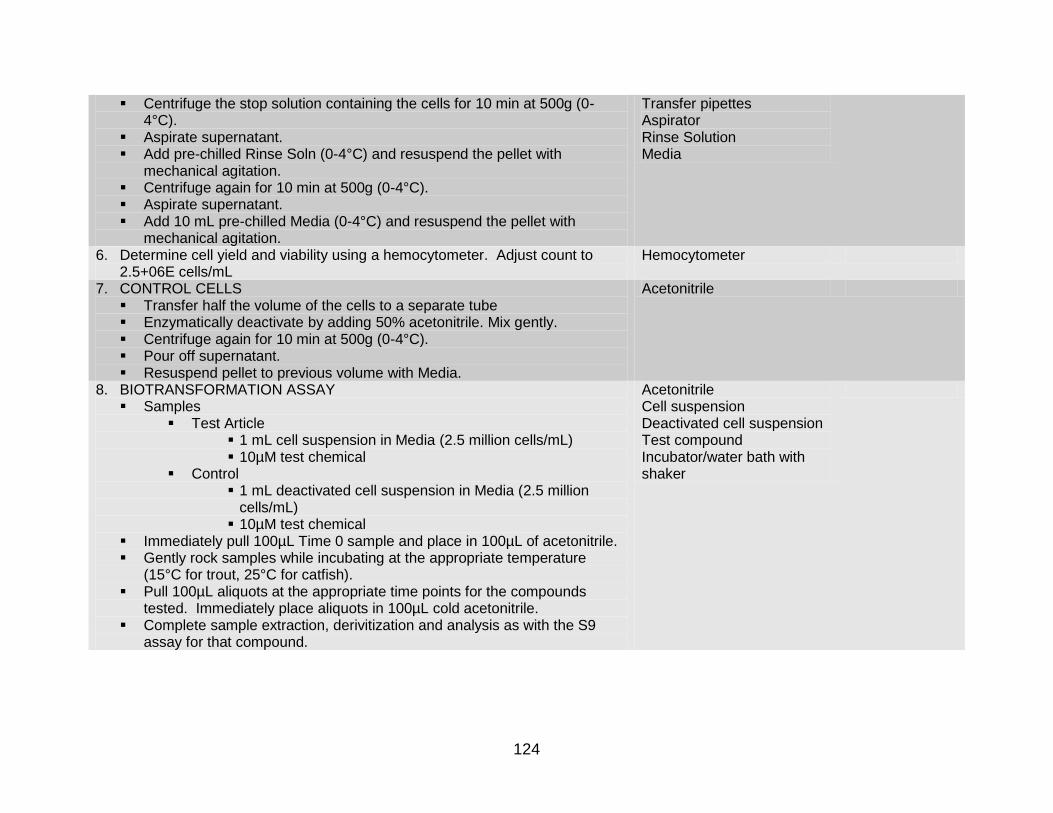
124
Centrifuge the stop solution containing the cells for 10 min at 500g (0-4°C).
Aspirate supernatant. Add pre-chilled Rinse Soln (0-4°C) and resuspend the pellet with
mechanical agitation. Centrifuge again for 10 min at 500g (0-4°C). Aspirate supernatant. Add 10 mL pre-chilled Media (0-4°C) and resuspend the pellet with
mechanical agitation.
Transfer pipettes Aspirator Rinse Solution Media
6. Determine cell yield and viability using a hemocytometer. Adjust count to 2.5+06E cells/mL
Hemocytometer
7. CONTROL CELLS Transfer half the volume of the cells to a separate tube Enzymatically deactivate by adding 50% acetonitrile. Mix gently. Centrifuge again for 10 min at 500g (0-4°C). Pour off supernatant. Resuspend pellet to previous volume with Media.
Acetonitrile
8. BIOTRANSFORMATION ASSAY Samples
Test Article 1 mL cell suspension in Media (2.5 million cells/mL) 10µM test chemical
Control 1 mL deactivated cell suspension in Media (2.5 million
cells/mL) 10µM test chemical
Immediately pull 100µL Time 0 sample and place in 100µL of acetonitrile. Gently rock samples while incubating at the appropriate temperature
(15°C for trout, 25°C for catfish). Pull 100µL aliquots at the appropriate time points for the compounds
tested. Immediately place aliquots in 100µL cold acetonitrile. Complete sample extraction, derivitization and analysis as with the S9
assay for that compound.
Acetonitrile Cell suspension Deactivated cell suspension Test compound Incubator/water bath with shaker
125
A.3 Liver Perfusion Protocol
Purpose: To flush blood from fish liver prior to hepatocyte isolation.
Culture of Fish:
Do not feed for approximately 24 hours prior to test initiation.
This procedure is easier to perform on larger fish (<200g).
Equipment:
1. Balance for weighing tissue weights (0.500 to 20g)
2. Balance for weighing whole fish weights (50 to 2000g)
3. Ice bath
4. Infusion needle; gauge 21 or smaller
5. Syringe (5mL)
6. Surgical scalpel, scissors, forceps, clamps
7. Pre-weighed 15mL falcon tubes for tissues
8. Hank’s Buffered Salt Solution (HBSS; Gibco)
9. Ethanol (for sterilization of equipment)
10. MS-222

126
Perfusion:
1. Fill syringe with chilled HBSS.
2. Anesthetize the animal (in 0.10 g/L MS-222) until opercular movement is minimal
and fish is not responsive.
3. Weigh fish and record.
4. Place fish in ice bath with the ventral surface facing the technician.
5. Make a midline incision from the vent to just below the operculum, taking care
not to cut too deeply into the body cavity.
6. Make a lateral incision at the caudal end of the midline incision extending about
half way up to the dorsal surface. Make a similar lateral incision just caudal to the
operculum. Fold back the resulting flap of the body wall and cut away, exposing
the body cavity.
7. Exposed liver should be dark red (prior to perfusion) and the heart still beating.
8. Locate a ventral branch of the hepatic portal vein and carefully clear away any
obscuring connective tissue. Always perfuse the lower vein closest to you.
9. Carefully insert the syringe needle into the portal vein. If possible, secure in
place with a clamp or thread. You must provide constant gentle pressure to the
syringe. Too much pressure will burst the vein.
10. Peristaltic pump option: a capillary tube extending from the syringe may be
threaded into the vein . A peristaltic pump can then be used to provide a
constant flow of HBSS. This did not work well on fish smaller than 200g as then
portal vein was too thin.
11. Sever the blood vessels leading from the anterior aspect of the liver to the heart.

127
12. Perfuse the liver with HBSS for 5-10 min. Blanching of the liver should be evident
within the first minute or two of perfusion.
13. If necessary, refill syringe and repeat. If outer edges remain pink, cut off with
scissors and do not use.
14. Excise liver and remove gall bladder carefully. Do not allow bile to contact liver.
15. Place in pre-weighed 15mL flacon tube on ice.
16. Weigh and record tissue.
17. Proceed immediately to hepatocyte isolation (trypsinization).
Fig. 1. Insertion of needle into portal vein. Fig. 2. Example of blanched liver.

128
A.4 EROD Assay
Purpose: To determine CYP1A2 activity of subcellular fractions and cellular
suspensions.
Supplies:
1. Cell fraction/suspension – 1mg mL-1 microsomes, 2 mg mL-1 S9, or 2x10⁶ cells
mL-1 suspension
2. Cell suspension media or 0.01M PBS as diluent
3. Microcentrifuge tubes
4. Black 96-well plate
5. 10µL pipette, 200µL pipette, 1000µL pipette
6. Pipette tips
7. Vortex with shaker adaptor
8. Incubator
9. Spectrophotometer
Standard Curve:
1. Assay is light sensitive. Keep samples and stock materials covered with foil and
conduct in dark room.
2. A 6-point resorufin standard curve is needed to determine % resorufin created
during dealkylation of the ethoxyresorufin substrate.
3. Final concentrations of 5, 4, 3, 2, 1 and 0.5µg mL-1.
4. In a black 96-well plate, add 100µL to each well to be used.
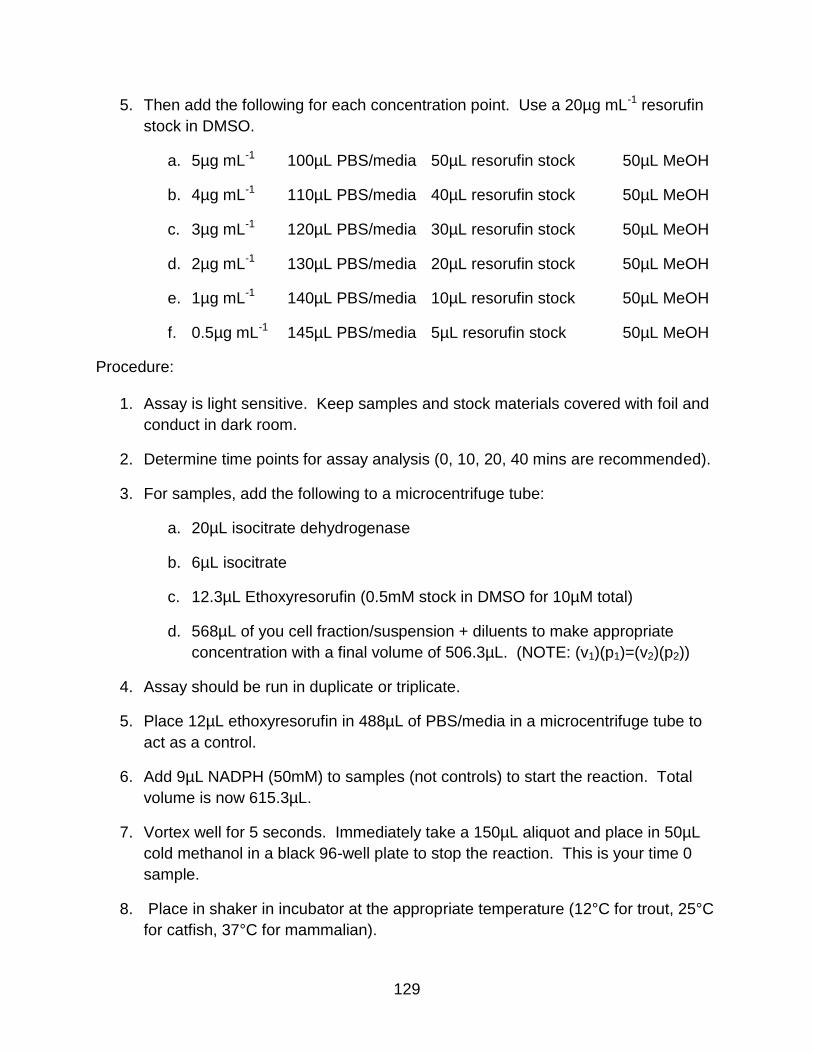
129
5. Then add the following for each concentration point. Use a 20µg mL-1 resorufin
stock in DMSO.
a. 5µg mL-1 100µL PBS/media 50µL resorufin stock 50µL MeOH
b. 4µg mL-1 110µL PBS/media 40µL resorufin stock 50µL MeOH
c. 3µg mL-1 120µL PBS/media 30µL resorufin stock 50µL MeOH
d. 2µg mL-1 130µL PBS/media 20µL resorufin stock 50µL MeOH
e. 1µg mL-1 140µL PBS/media 10µL resorufin stock 50µL MeOH
f. 0.5µg mL-1 145µL PBS/media 5µL resorufin stock 50µL MeOH
Procedure:
1. Assay is light sensitive. Keep samples and stock materials covered with foil and
conduct in dark room.
2. Determine time points for assay analysis (0, 10, 20, 40 mins are recommended).
3. For samples, add the following to a microcentrifuge tube:
a. 20µL isocitrate dehydrogenase
b. 6µL isocitrate
c. 12.3µL Ethoxyresorufin (0.5mM stock in DMSO for 10µM total)
d. 568µL of you cell fraction/suspension + diluents to make appropriate
concentration with a final volume of 506.3µL. (NOTE: (v1)(p1)=(v2)(p2))
4. Assay should be run in duplicate or triplicate.
5. Place 12µL ethoxyresorufin in 488µL of PBS/media in a microcentrifuge tube to
act as a control.
6. Add 9µL NADPH (50mM) to samples (not controls) to start the reaction. Total
volume is now 615.3µL.
7. Vortex well for 5 seconds. Immediately take a 150µL aliquot and place in 50µL
cold methanol in a black 96-well plate to stop the reaction. This is your time 0
sample.
8. Place in shaker in incubator at the appropriate temperature (12°C for trout, 25°C
for catfish, 37°C for mammalian).
130
9. Take a 150µL aliquot at each time point and place in 50µL cold methanol to stop
the reaction.
10. After each time point, read the96-well plate. (NOTE: Samples are now diluted
25%).
11. Read plate using the EROD protocol on the spectrophotometer. Read on
fluorescence plate reader (Excitation 550 nm; Emission 590 nm).
12. Plot % resorufin. Run statistical analysis to determine difference between
samples and controls.

131
A.5 Neutral Red Uptake Assay for Cell Viability
Purpose: To qualitatively verify viability of cell suspensions. This protocol is not
designed to provide quantitative data.
Supplies:
1. Cell suspension – 2.5 to 4.5x10⁶ cells mL-1 density.
2. Cell suspension media
3. In Vitro Toxicology Assay Kit, Neutral Red based (TOX-4, Sigma)
4. Microcentrifuge tubes
5. Clear 96-well plate
6. 200µL pipette, 1000µL pipette, pipette tips
7. Vortex with shaker adaptor housed within incubator
8. Eppendorf centrifuge
9. Spectrophotometer
Procedure:
10. Dilute cell suspension to a 2.5 to 4x10⁶ cells mL-1 density.
11. Determine time point for assay analysis (at 2-4 hours is recommended).
12. Place 450µL of cell suspension in a microcentrifuge tube.
13. Place 450µL of deactivated cell suspension in a microcentrifuge tube.
14. Place 450µL of media in a microcentrifuge tube to act as a blank.
15. Assay should be run in duplicate or triplicate.
16. Place 50µL of Neutral Red Solution, 0.33% in DPBS to each microcentrifuge
tube. If needed, filter the Neutral Red Solution to remove particulates.

132
17. Place in shaker within the incubator at the appropriate temperature (15°C for
trout, 25°C for catfish, 37°C for mammalian).
18. 10 minutes prior to the end of the incubation period, place samples in Eppendorf
centrifuge. Spin at 500g for 10 min.
19. Carefully remove and discard supernatant. (Note: The blank should not have a
pellet.)
20. Add 200µL of Neutral Red Assay Fixative, 0.1% CaCl2 in 0.5% Formaldehyde to
each sample. Gently shake to rinse for no more than 5 minutes. (Note: Rough
handling of samples may cause cells to lyse.)
21. Centrifuge at 500g for 5 minutes to repellet samples.
22. Carefully remove and discard supernatant.
23. Add 500µL of Neutral Red Assay Solubilization Solution, 1% Acetic acid in 50%
Ethanol to each sample. Vortex well to resuspend pellet and release neutral red
dye into the solution.
24. Add 200µL of sample in duplicate to interior wells of a clear 96-well plate.
25. Read plate using the Neutral Red protocol on the spectrophotometer. Measure
absorbance at a wavelength of 540nm. Measure the background absorbance at
690nm and subtract from 540 nm measurement. (Note: The closest filter we
have to 690nm is 670nm.)
26. Run a t-test or other statistical analysis to determine difference between active
cells and deactivated cells/blank.

133
A.6 Derivitization
Derivitization of Ibuprofen
1. 500µg/L (ppb) check standard should be derivatized along with samples.
2. Dry down samples under N2.
3. Add 50µL BF3/MeOH and 50µL AcN. Vortex for 30 seconds.
4. Incubate at 85°C for 2 hours.
5. Let samples cool to room temperature.
6. Add 6 drops MQ water. Vortex.
7. Add 500µL 1:1 ethyl acetate:hexane. Vortex. Back extract solvent top layer.
Repeat two additional times.
8. Dry down samples under N2.
9. Reconstitute in 100µL of hexane.
10. If precipitation or cloudiness occurs, transfer samples to new eppendorf tubes. Spin
samples at 2500g for 10minutes. Carefully remove supernatant and place in 200µL
glass insert.
11. Use the GC/MS ibuprofen method found in Cristi’s folder.
12. The 500ppb check standard should be run between sample series as an indicator of
sample degradation.
Derivitization of Propranolol
1. 500µg/L (ppb) check standard should be derivatized along with samples.
2. Dry down samples under N2.
3. Add 50µL MSTFA and 50µL AcN. Vortex for 30 seconds.

134
4. Incubate at room temperature for 30 minutes.
5. Incubate at 60°C for 15 minutes.
6. Add 15µL MBTFA. Vortex for 30 seconds.
7. Incubate at 60°C for 15 minutes.
8. Let samples cool to room temperature.
9. Dry down samples under N2.
10. Reconstitute in 100µL of methylene chloride.
11. If precipitation or cloudiness occurs, transfer samples to new eppendorf tubes. Spin
samples at 2500g for 10minutes. Carefully remove supernatant and place in 200µL
glass insert.
12. For GC/MS analysis, use the Propranolol.M method found in Cristi’s folder in the
Methods folder.
13. This method uses an external calibration curve.
14. Derivatized propranolol degrades within 6 hours at room temperature. Derivatized
propranolol is stable at 4°C for several days.
15. The 500ppb check standard should be run between sample series as an indicator of
sample degradation. You may want to make multiple check standards if you are
running multiple sample series.
16. Keep samples at 4°C for as long as possible. Only run one sample series on the
GC/MS at a time (i.e., load a series of 6 samples plus check standard, run them, and
then load the next sample series).

135
Derivitization of Norethindrone
1. 500µg/L (ppb) check standard should be derivatized along with samples.
2. Dry down samples under N2.
3. Add 50µL MSTFA and 50µL AcN. Vortex for 30 seconds.
4. Incubate at 70°C for 2 hours.
5. Let samples cool to room temperature.
6. Dry down samples under N2.
7. Reconstitute in 100µL of methylene chloride.
8. If precipitation or cloudiness occurs, transfer samples to new eppendorf tubes. Spin
samples at 2500g for 10minutes. Carefully remove supernatant and place in 200µL
glass insert.
9. Use the Norethindrone SIM method found in Cristi’s folder.
The 500ppb check standard should be run between sample series as an indicator of
sample degradation.

136
APPENDIX B
IN VITRO BIOTRANSFORMATION ASSAY FORM

137
In vitro Biotransformation Assay Date: ______________ By: _________________________
Add: mg/mL protein Species/Tissue Harvested
µL S9/microsomes
Add: Stock Conc. Supplier Lot No.
µL analyte (____________)
µL isocitrate dehydrogenase
µL isocitrate
Vortex.
Equilibrate in incubator at __________°C for __________ minutes.
Time begins: Time ends:
Add: Stock Conc. Supplier Lot No.
µL NADPH
Reaction begins at:
For minutes, stop at:
minutes, stop at:
minutes, stop at:
minutes, stop at:
minutes, stop at:
minutes, stop at:
Reaction stopped in __________ µL of acetonitrile / methanol.
Control contains: Stock Conc. Supplier Lot No.
µL analyte (____________)
µL isocitrate dehydrogenase
µL isocitrate
µL of acetonitrile / methanol to stop the reaction.
Blank contains: Stock Conc. Supplier Lot No.
µL S9
µL isocitrate dehydrogenase
µL isocitrate
µL of acetonitrile / methanol to stop the reaction.

138
APPENDIX C
ILSI/HESI BCF MODEL (FROM MICROSOFT EXCEL)

139
The model is described in detail in the following publication
Cowan-Ellsberry, C.E., Dyer, S.D., Erhardt, S., Bernhard, M.J., Roe, A., Dowty, M.E. and Weisbrod, A.V. 2008.
Approach for extrapolating in vitro metabolism data to refine bioconcentration factor estimates
Chemosphere 70:1804-1817
This is Figure 2 from that publication which shows the flow of the calculation and the variables that are used to calculate k MET and BCF
The details of the BCF calculation are taken from Arnot and Gobas (2003 and 2004)
BCF = k1/(k2+kE+kG+kMET)
where
k1=1/((0.01+(1/(Kow))*(W0.4)))
k2 =k1/(Vlb*(Kow))
kE=0.125*(0.02*(W -0.15)*EXP(0.06*T))/(0.00000005*Kow + 2)
kG=0.00251*W-0.2 If T>12
kG = 0.000502*W -0.2 If T <12
S9 -- Intrinsic clearance rate of parent chemical,
CLm (ml hr-1 (mg protein)-1)
Intrinsic Clearance in Liver (L d-1 kg-1)
CLi = LW * PL * CLm
Hepatic Clearance(L d-1 kg-1)
CLh = (LF * CO * fu * CLi)/(LF * CO) + CLi * fu)
Elimination Rate Constant(d-1)
kMET = CLh/Vd
BCF, Mass Balance Fish BCF model
•Liver Weight, LW (gm kg-1)• Protein per gm of liver, PL (gm (gm of liver)-1)
• Cardiac Output, CO (L d-1 kg-1)• Fraction of blood flow through liver, LF• fu free fraction correction term
• Volume of Distribution, Vd (L kg-1)
Hepatocyte -- Intrinsic clearance rate of parent chemical,
CLm (ml hr-1 cell-1)
•Liver Weight, LW (gm kg-1)•Hepatocellularity, Hp (cells (gm of liver)-1)
Intrinsic Clearance in Liver (L d-1 kg-1)
CLi = LW * Hp * CLm
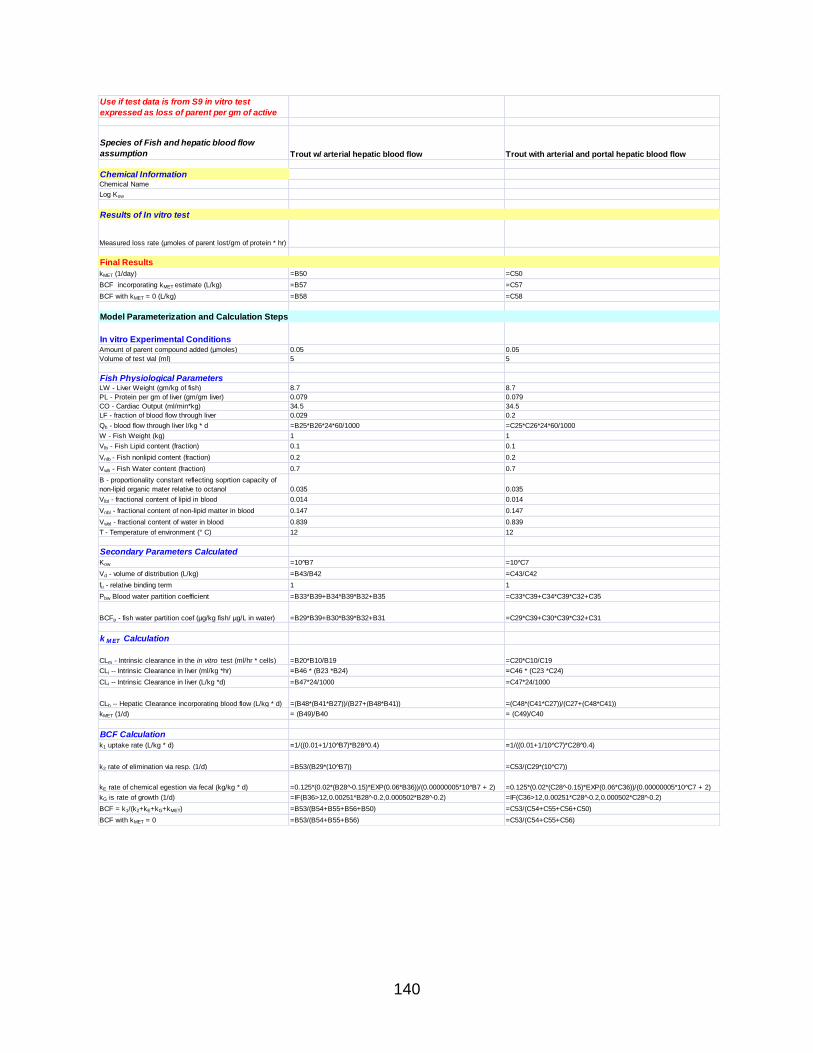
140
Use if test data is from S9 in vitro test
expressed as loss of parent per gm of active
Species of Fish and hepatic blood flow
assumption Trout w/ arterial hepatic blood flow Trout with arterial and portal hepatic blood flow
Chemical InformationChemical Name
Log Kow
Results of In vitro test
Measured loss rate (µmoles of parent lost/gm of protein * hr)
Final Results
kMET (1/day) =B50 =C50
BCF incorporating kMET estimate (L/kg) =B57 =C57
BCF with kMET = 0 (L/kg) =B58 =C58
Model Parameterization and Calculation Steps
In vitro Experimental ConditionsAmount of parent compound added (µmoles) 0.05 0.05
Volume of test vial (ml) 5 5
Fish Physiological ParametersLW - Liver Weight (gm/kg of fish) 8.7 8.7
PL - Protein per gm of liver (gm/gm liver) 0.079 0.079
CO - Cardiac Output (ml/min*kg) 34.5 34.5
LF - fraction of blood flow through liver 0.029 0.2
Qh - blood flow through liver l/kg * d =B25*B26*24*60/1000 =C25*C26*24*60/1000
W - Fish Weight (kg) 1 1
Vlb - Fish Lipid content (fraction) 0.1 0.1
Vnlb - Fish nonlipid content (fraction) 0.2 0.2
Vwb - Fish Water content (fraction) 0.7 0.7
B - proportionality constant reflecting soprtion capacity of
non-lipid organic mater relative to octanol 0.035 0.035
Vlbl - fractional content of lipid in blood 0.014 0.014
Vnbl - fractional content of non-lipid matter in blood 0.147 0.147
Vwbl - fractional content of water in blood 0.839 0.839
T - Temperature of environment (° C) 12 12
Secondary Parameters Calculated
Kow =10^B7 =10^C7
Vd - volume of distribution (L/kg) =B43/B42 =C43/C42
fu - relative binding term 1 1
Pbw Blood water partition coefficient =B33*B39+B34*B39*B32+B35 =C33*C39+C34*C39*C32+C35
BCFp - fish water partition coef (µg/kg fish/ µg/L in water) =B29*B39+B30*B39*B32+B31 =C29*C39+C30*C39*C32+C31
k M ET Calculation
CLm - Intrinsic clearance in the in vitro test (ml/hr * cells) =B20*B10/B19 =C20*C10/C19
CLi -- Intrinsic Clearance in liver (ml/kg *hr) =B46 * (B23 *B24) =C46 * (C23 *C24)
CLi -- Intrinsic Clearance in liver (L/kg *d) =B47*24/1000 =C47*24/1000
CLh -- Hepatic Clearance incorporating blood flow (L/kg * d) =(B48*(B41*B27))/(B27+(B48*B41)) =(C48*(C41*C27))/(C27+(C48*C41))
kMET (1/d) = (B49)/B40 = (C49)/C40
BCF Calculation
k1 uptake rate (L/kg * d) =1/((0.01+1/10^B7)*B28 0̂.4) =1/((0.01+1/10^C7)*C28 0̂.4)
k2 rate of elimination via resp. (1/d) =B53/(B29*(10^B7)) =C53/(C29*(10^C7))
kE rate of chemical egestion via fecal (kg/kg * d) =0.125*(0.02*(B28 -̂0.15)*EXP(0.06*B36))/(0.00000005*10^B7 + 2) =0.125*(0.02*(C28 -̂0.15)*EXP(0.06*C36))/(0.00000005*10^C7 + 2)
kG is rate of growth (1/d) =IF(B36>12,0.00251*B28 -̂0.2,0.000502*B28 -̂0.2) =IF(C36>12,0.00251*C28 -̂0.2,0.000502*C28 -̂0.2)
BCF = k1/(k2+kE+kG+kMET) =B53/(B54+B55+B56+B50) =C53/(C54+C55+C56+C50)
BCF with kMET = 0 =B53/(B54+B55+B56) =C53/(C54+C55+C56)
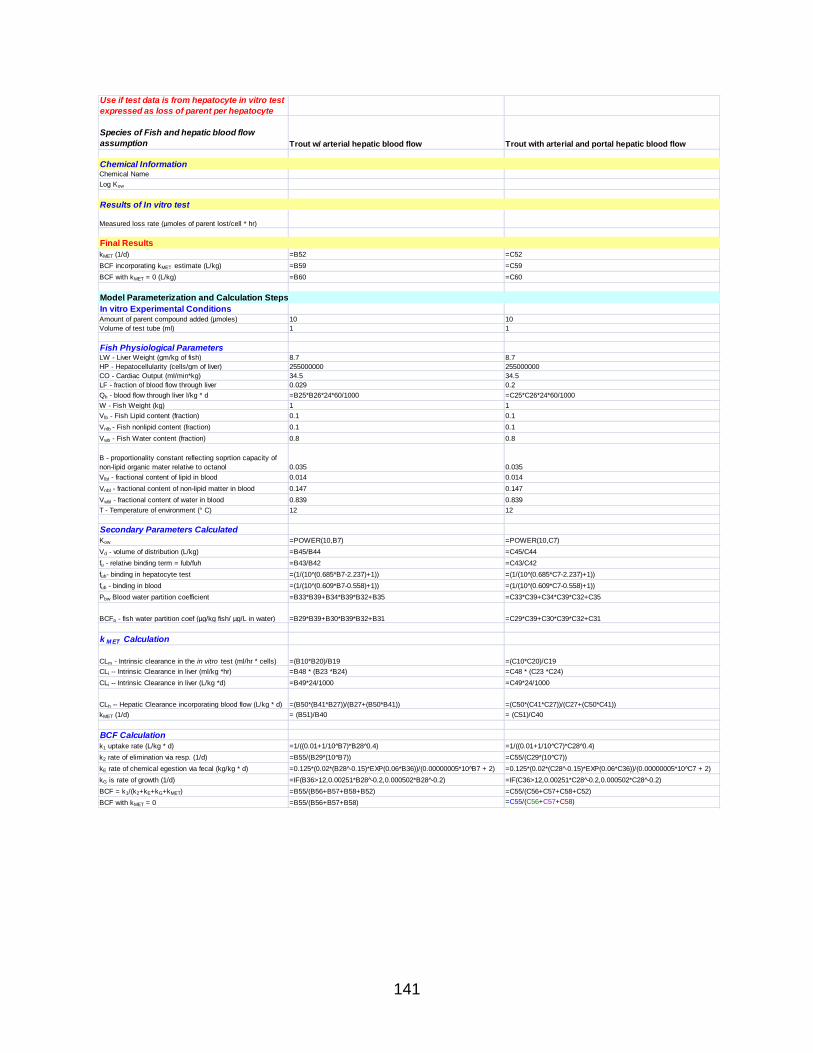
141
Use if test data is from hepatocyte in vitro test
expressed as loss of parent per hepatocyte
Species of Fish and hepatic blood flow
assumption Trout w/ arterial hepatic blood flow Trout with arterial and portal hepatic blood flow
Chemical InformationChemical Name
Log Kow
Results of In vitro test
Measured loss rate (µmoles of parent lost/cell * hr)
Final Results
kMET (1/d) =B52 =C52
BCF incorporating kMET estimate (L/kg) =B59 =C59
BCF with kMET = 0 (L/kg) =B60 =C60
Model Parameterization and Calculation Steps
In vitro Experimental ConditionsAmount of parent compound added (µmoles) 10 10
Volume of test tube (ml) 1 1
Fish Physiological ParametersLW - Liver Weight (gm/kg of fish) 8.7 8.7
HP - Hepatocellularity (cells/gm of liver) 255000000 255000000
CO - Cardiac Output (ml/min*kg) 34.5 34.5
LF - fraction of blood flow through liver 0.029 0.2
Qh - blood flow through liver l/kg * d =B25*B26*24*60/1000 =C25*C26*24*60/1000
W - Fish Weight (kg) 1 1
Vlb - Fish Lipid content (fraction) 0.1 0.1
Vnlb - Fish nonlipid content (fraction) 0.1 0.1
Vwb - Fish Water content (fraction) 0.8 0.8
B - proportionality constant reflecting soprtion capacity of
non-lipid organic mater relative to octanol 0.035 0.035
Vlbl - fractional content of lipid in blood 0.014 0.014
Vnbl - fractional content of non-lipid matter in blood 0.147 0.147
Vwbl - fractional content of water in blood 0.839 0.839
T - Temperature of environment (° C) 12 12
Secondary Parameters Calculated
Kow =POWER(10,B7) =POWER(10,C7)
Vd - volume of distribution (L/kg) =B45/B44 =C45/C44
fu - relative binding term = fub/fuh =B43/B42 =C43/C42
fuh- binding in hepatocyte test =(1/(10 (̂0.685*B7-2.237)+1)) =(1/(10 (̂0.685*C7-2.237)+1))
fub - binding in blood =(1/(10 (̂0.609*B7-0.558)+1)) =(1/(10 (̂0.609*C7-0.558)+1))
Pbw Blood water partition coefficient =B33*B39+B34*B39*B32+B35 =C33*C39+C34*C39*C32+C35
BCFp - fish water partition coef (µg/kg fish/ µg/L in water) =B29*B39+B30*B39*B32+B31 =C29*C39+C30*C39*C32+C31
k M ET Calculation
CLm - Intrinsic clearance in the in vitro test (ml/hr * cells) =(B10*B20)/B19 =(C10*C20)/C19
CLi -- Intrinsic Clearance in liver (ml/kg *hr) =B48 * (B23 *B24) =C48 * (C23 *C24)
CLi -- Intrinsic Clearance in liver (L/kg *d) =B49*24/1000 =C49*24/1000
CLh -- Hepatic Clearance incorporating blood flow (L/kg * d) =(B50*(B41*B27))/(B27+(B50*B41)) =(C50*(C41*C27))/(C27+(C50*C41))
kMET (1/d) = (B51)/B40 = (C51)/C40
BCF Calculation
k1 uptake rate (L/kg * d) =1/((0.01+1/10^B7)*B28 0̂.4) =1/((0.01+1/10^C7)*C28 0̂.4)
k2 rate of elimination via resp. (1/d) =B55/(B29*(10^B7)) =C55/(C29*(10^C7))
kE rate of chemical egestion via fecal (kg/kg * d) =0.125*(0.02*(B28 -̂0.15)*EXP(0.06*B36))/(0.00000005*10^B7 + 2) =0.125*(0.02*(C28 -̂0.15)*EXP(0.06*C36))/(0.00000005*10^C7 + 2)
kG is rate of growth (1/d) =IF(B36>12,0.00251*B28 -̂0.2,0.000502*B28 -̂0.2) =IF(C36>12,0.00251*C28 -̂0.2,0.000502*C28 -̂0.2)
BCF = k1/(k2+kE+kG+kMET) =B55/(B56+B57+B58+B52) =C55/(C56+C57+C58+C52)
BCF with kMET = 0 =B55/(B56+B57+B58) =C55/(C56+C57+C58)

142
APPENDIX D
EXPONENTIAL PLOTS OF LOSS OF PARENT DATA
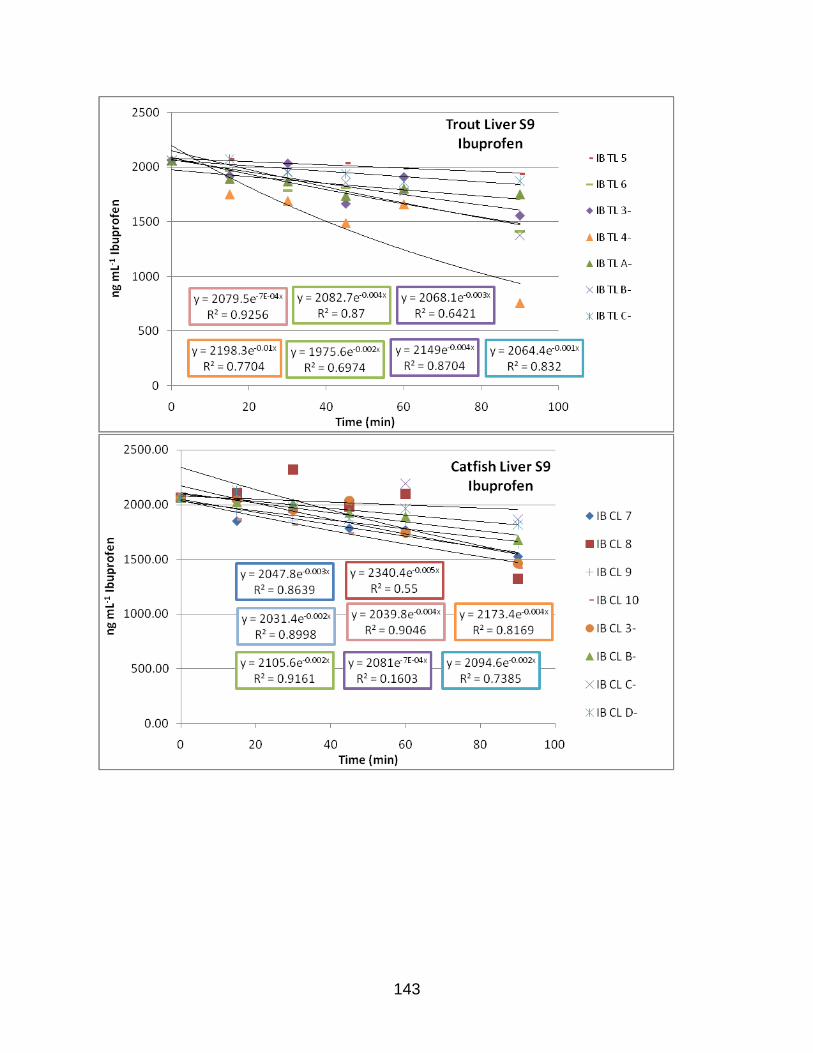
143

144

145

146

147

148

149

150

151
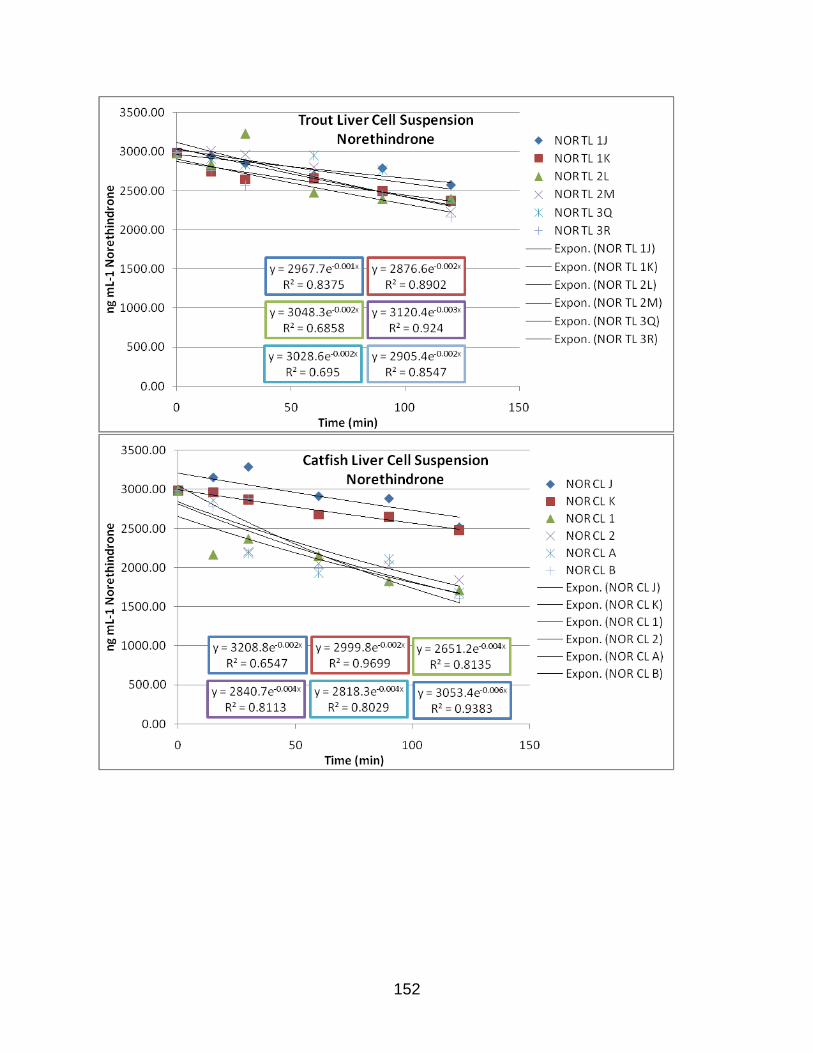
152

153

154

155

156

157
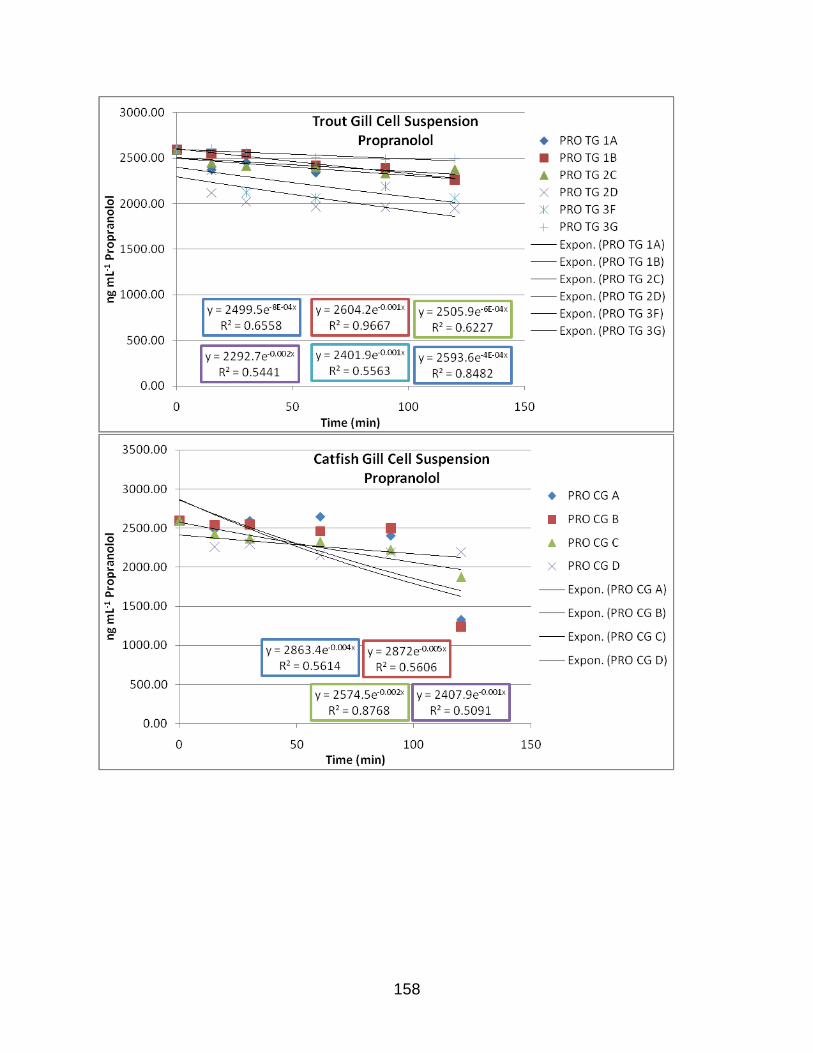
158

159
REFERENCES
Andreozzi, R., Raffaele, M., Nicklas, P., 2003. Pharmaceuticals in STP effluents and
their solar photodegradation in aquatic environment . Chemosphere 50, 1319-
1330.
Arnot, J., Gobas, F., 2003. A generic QSAR for assessing the bioaccumulation potential
of organic chemicals in aquatic food webs. QSAR Comb. Sci. 22, 337-345.
Arnot, J. A., Gobas, F. A., 2004. A food web bioaccumulation model for organic
chemicals in aquatic ecosystems. Environ. Toxicol. Chem. 10, 2343–2355.
Arnot, J., Gobas, F., 2006. A review of bioconcentration factor (BCF) and
bioaccumulation factor (BAF) assessments for chemicals in aquatic organisms.
Environ. Rev. 14, 257-297.
Arnot, J. A., Mackay, D., Parkerton, T., & Bonnell, M., 2008. A database of fish
biotransformation rates for organic chemicals. Environ. Toxicol. Chem. 27, 2263-
2270.
Arnot, J. A., Meylan, W., Tunkel, J., Howard, P. H., Mackay, D., Bonnell, M., Boethling,
R. S., 2009. A quantitative structure-activity relationship for predicting metabolic
biotransformation rates for organic chemicals in fish. Environ. Toxicol. Chem. 28,
1168-1177.
Bailey, G., Williams, D., Hendricks, J., 1996. Fish models for environmental
carcinogenesis: the rainbow trout. Environ. Health Persp. 104(Suppl 1), 5-21.
Barber, M., 2003. A review and comparison of models for predicting dynamic chemical
bioconcentration in fish. Environ. Toxicol. Chem. 22, 1963-1992.

160
Barron, M.G. 1990. Bioconcentration: Will water-borne organic chemicals accumulate in
aquatic animals? Environ. Sci. Technol. 24, 1612-1618.
Bintein, S., Devillers, J., Karcher, W., 1993. Nonlinear dependence of fish
bioaccumulative chemicals in water and sediment to residues in fish: a
visualization approach. Environ. Toxicol. Chem. 22, 2822-2830.
Black, M., Bjorkroth, K., Oikari, A., 1995. Probing the routes, rates, and mechanisms of
xenobiotic elimination by rainbow trout (Oncorhynchus mykiss) with a
physiological chamber. In: Hughes, J., Biddinger, G., Mones, E. (Eds.),
Environmental Toxicology and Risk Assessment - Third Volume, ASTM STP
1218. American Society for Testing and Materials, Philadelphia, pp. 351-364.
Bols, N., Brubacher, J., Ganassin, R., Lee, L., 2001. Ecotoxicology and innate immunity
in fish. Dev. Comp. Immunol. 25, 853-873.
Bols, N., Dayeh, V., Lee, L., Schirmer, K., 2005. Use of fish cell lines in toxicology and
ecotoxicology of fish. Piscine cell lines in environmental toxicology. In:
Mommsen, T., Moon, T. (Eds.), Biochemistry and Molecular Biology of Fishes,
Vol. 6. Elsevier Science, Amsterdam, pp. 43-84.
Bruggeman, W., Opperhuizen, A., Wijbenga, A., Hutzinger, O., 1984. Bioaccumulation
of super-lipophilic chemicals in fish. Toxicol. Environ. Chem. 7, 173-189.
Buckley, D., Klaassen, C., 2007. Tissue- and Gender-Specific mRNA Expression of
UDP-Glucuronosyltransferases (UGTs) in Mice. Drug Metab. Dispos. 35, 121-
127.

161
Buhler, D., Wang-Buhler, J.-L., 1998. Review: Rainbow trout cytochrome P450s:
purification, molecular aspects, metabolic activity, induction and role in
environmental monitoring. Comp. Biochem. Physiol. 121C, 107-137.
Chang, G., Kam, P., 1999. The physiological and pharmacological roles of cytochrome
P450 isoenzymes. Anaesthesia 54, 42-50.
Chang, S.-Y., Li, W., Traeger, S. C., Wang, B., Cui, D., Zhang, H., Wen, B., Rodrigues,
A.D., 2008. Confirmation that cytochrome P450 2C8 (CYP2C8) plays a minor
role in (S)-(+)- and (R)-(-)-ibuprofen hydroxylation in vitro. Drug Metab. Dispos.
36, 2513-2522.
Cleuvers, M., 2003. Aquatic ecotoxicity of pharmaceuticals including the assessment of
combination effects. Toxicol. Lett. 142, 185-194.
Coon, M., Vaz, A., Bestervelt, L., 1996. Cytochrome P450 2: peroxidative reactions of
diversozymes. FASEB J. 10, 428-434.
Costanza, R., D'Arfe, R., De Groot, R., Farber, S., Grasso, M., Hannon, B., Limburg, K.,
Naeem, S., O'Neill, R.V., Paruelo, J., Raskin, R.G., Sutton, P., Van Den Belt, M.,
1997. The value of the world's ecosystem services and natural capital. Nature
387, 253-260.
Cowan-Ellsberry, C., Dyer, S. E., Bernhard, M., Roe, A., Dowty, M., & Weisbrod, A.,
2008. Approach for extrapolating in vitro metabolism data to refine
bioconcentration factor estimates. Chemosphere 70, 1804-1817.
Datta Munshi, J., Dutta, H., 1996. Fish morphology: horizon of new research. A.A.
Balkema Publishers, Brookfield, VT.

162
Davies, R. P., Dobbs, A. J., 1984. The prediction of bioconcentration in fish. Water Res.
18, 1253-1262.
Davies, B., Morris, T., 1993. Physiological parameters in laboratory animals and
humans. Pharm. Res. 10, 1093-1095.
Davies, N., 1998. Clinical pharmacokinetics of ibuprofen. The first 30 years. Clin.
Pharmacokinet. 34, 101-54.
de Wolf, W., Comber, M., Douben, P., Gimeno, S., Holt, M., Lillicrap, L., Sijm, D., van
Egmond, R., Weisbrod, A., Whale, G., 2007. Animal Use Replacement,
Reduction, and Refinement: Development of an Integrated Testing Strategy for
Bioconcentration of Chemicals. Integr. Environ. Assess. Manag. 3, 3-17.
de Wolf, W., de Bruijn, J., Seinen, W., Hermens, J., 1992. Influence of biotransformation
on the relationship between bioconcentration factors and octanol-water partition
coefficients. Environ. Sci. Technol. 26, 1197-1201.
Dimitrov, S., Dimitrova, G., Pavlov, T., Dimitrova, N., Patlewics, G., Niemela, G., 2005.
A stepwise approach for defining applicability domain of SAR and QSAR models.
J. Chem. Inf. Model. 45, 839-849.
Dyer, S. D., White-Hull, C. E., Shephard, B. K., 2000. Assessment of chemical mixtures
via toxicity reference values overpredict hazard to Ohio fish communities.
Environ. Sci. Technol. 34, 2518-2524.
Dyer, S., Bernhard, M., Cowan-Ellsberry, C., Perdu-Durand, E., Demmerle, S., Cravedi,
J., 2009. In vitro biotransformation of surfactants in fish. Part II--Alcohol
ethoxylate (C16EO8) and alcohol ethoxylate sulfate (C14EO2S) to estimate
bioconcentration potential. Chemosphere 76, 989-98.

163
Environment Canada, 2003. Guidance Manual for the Ecological Categorization of
Organic and Inorganic Substances on Canada's Domestic Substances List
(DSL). <http://www.ec.gc.ca/substances/ese/eng/dsl/guidance_document.cfm>.
European Chemicals Bureau, 2003. Technical Guidance Document on Risk
Assessment Part II. <http://ecb.jrc.ec.europa.eu/Documents/
TECHNICAL_GUIDANCE_DOCUMENT/EDITION_2/tgdpart2_2ed.pdf>.
European Union, 2006. Regulation (EC) No 1907/2006 of the European Parliment and
of the Council. <http://eur-lex.europa.eu/LexUriServ/LexUriServ.do?uri=
OJ:L:2006:396:0001:0849:EN:PDF>.
Farre, M., Ferrer, I., Ginebreda, A., Figueras, M., Olivella, L., Tirapuc, L., Vilanovac, M.,
Barcelo, D., 2001. Determination of drugs in surface water and wastewater
samples by liquid chromatography–mass spectrometry: methods and preliminary
results including toxicity studies with Vibrio fischeri. J. Chromatogr. A 938, 187-
197.
Fernandez, M., Ikonomou, M., Buchanan, I., 2007. An assessment of estrogenic organic
contaminants in Canadian wastewaters. Sci. Total Environ. 373, 250-269.
Fisher, M., Campanale, K., Ackermann, B., Vandenbranden, M., Wrighton, S., 2000. In
vitro glucuronidation using human liver microsomes and the pore-forming peptide
alamethicin. Drug Metab. Dispos. 28, 560-566.
Galvez, F., Tsui, T., Wood, C., 2008. Cultured trout gill epithelia enriched in pavement
cells or in mitochondria-rich cells provides insights into Na+ and Ca2+ transport.
In Vitro Cell. Dev. An. 44, 415-425.

164
Gearhart, J. M., Jepson, G. W., Clewell, H. J., Andersen, M. E., Conolly, R. B., 1994.
Physiologically Based Pharmacokinetic Model for the Inhibition of
Acetylcholinesterase by Organophosphate Esters. Environ. Health Perspect. 102
Suppl., 51-60.
Gobas, F., 1993. A model for predicting the bioaccumulation of hydrophobic organic
chemicals in aquatic food-webs: application to Lake Ontario. Ecological
Modelling 69, 1-17.
Gobas, F., Morrison, H., 2000. Bioconcentration and biomagnification in the aquatic
environment. in: Boethling, R., Mackay, D. (Eds.), Property Estimation Methods
for Chemicals: Environmental and Health Sciences. CRC Press LLC, Boca
Raton, FL, pp. 189-232.
Goeptar, A., Scheerens, H., Vermeulen, N., 1995. Oxygen reductase and substrate
reductase activity of cytochrome P450. Crit. Rev. Toxicol. 25, 25-65.
Hampton, J., Lantz, R., Hinton, D., 1989. Functional units in rainbow trout (Salmo
gairdneri, Richardson) Liver: III. Morphometric analysis of parenchyma, stroma,
and component cell types. Am. J. Anat. 185, 58-73.
Han, X., Nabb, D., Yang, C., Snajdr, S., Mingoia, R., 2009. Liver microsomes and S9
from rainbow trout (Oncorhynchus mykiss): comparison of basal-level enzyme
activities with rat and determination of xenobiotic intrinsic clearance in support of
bioaccumulation assessment. Environ. Toxicol. Chem. 28, 481-488.
Harner, T., Wideman, J.L., Jantunen, L.M., Bidleman, T.F., Parkhurst, W.J., 1999.
Residues of organochlorine pesticides in Alabama soils. Environ. Pollut. 106,
323-332.

165
Houston, J. B., 1994. Utility of in vitro drug metabolism data in predicting in vivo
metabolic clearance. Biochem. Pharmacol. 47, 1469-1479.
Huggett, D., Khan, I., Foran, C., Schlenk, D., 2003. Determination of beta-adrenergic
receptor blocking pharmaceuticals in United States wastewater effluent. Environ.
Pollut. 121, 199-205.
Jacqz-Aigrain, E., Anderson, B., 2006. Pain control: Non-steroidal anti-inflammatory
agents. Semin. Fetal Neonatal. Med. 11, 251-259.
Janssen, B., Debets, J., Leenders, P., Smits, J., 2002. Chronic measurement of cardiac
output in conscious mice. Am. J. Physiol. Regulatory Integrative Comp. Physiol.
282, 928-935.
Johnson, A., Keller, V., Williams, R., Young, A., 2007. A practical demonstration in
modelling diclofenac and propranolol river water concentrations using a GIS
hydrology model in a rural UK catchment. Environ. Pollut. 146, 155-165.
Jones, O., Voulvoulis, N., Lester, J., 2002,). Aquatic environmental assessment of the
top 25 English prescription pharmaceuticals. Water Res. 36, 5013-5022.
Kelly, S. P., Fletcher, M., Part, P., Wood, C. M., 2000. Procedures for the preparation
and culture of 'reconstructed' rainbow trout branchial epithelia. Methods Cell Sci.
22, 153-163.
Klaren, P., Guzmán, J., Reutelingsperger, S., Mancera, J., Flik, G., 2007. Low salinity
acclimation and thyroid hormone metabolizing enzymes in gilthead seabream
(Sparus auratus). Gen Comp Endocrinol. 152, 215-22.

166
Kobayashi, T., Sleeman, J. E., Coughtrie, M. W., 2006. Molecular and functional
characterization of microsomal UDP-glucuronic acid uptake by members of the
nucleotide sugar transporter (NST) family. Biochem. J. 400(Pt. 2), 281-289.
Korhonen, T., Turpeinen, M., Tolonen, A., Laine, K., Pelkonen, O., 2008. Identification
of the human cytochrome P450 enzymes involved in the in vitro
biotransformation of lynestrenol and norethindrone. J. Steroid Biochem. Mol. Biol.
110, 56-66.
Kovach, J., Petzoldt, C., Degni, J., Tette, J., 1992. A Method to Measure the
Environmental Impact of Pesticides. New York's Food and Life Sciences Bulletin
139, 1-8.
Kristensen, P., Tyle, H., 1991. The assessment of bioaccumulation. in Nagel, R., Loskill,
R. (Eds.), Bioaccumulation in aquatic systems. VCH Verlagsgesellschaft GmbH,
Weinheim (DE), pp. 189-227.
Kültz, D., Somero, G., 1996. Differences in protein patterns of gill epithelial cells of the
fish Gillichthys mirabilis. J. Comp. Physiol. B 166, 88-100.
Laurent, P., 1984. Gill Internal Morphology. in Hoar, W., Randall, D. (Eds.), Fish
Physiology.Vol. X. Gills. Part A. Anatomy, Gas Transfer, and Acid-Base
Regulation. Academic Press, London, pp. 73-183.
Lee, L., Carmosini, N., Sassman, S., Dion, H., Sepulveda, M., 2007. Agricultural
contributions of antimicrobials and hormones on soil and water quality. in Sparks,
D. (Ed.), Advances in Agronomy. Vol. 93 Academic Press, London, pp. 1-93.
Lee, S.-J., Wang-Buhler, J.-L., Col, I., Yu, T.-S., Yang, Y.-H., Miranda, C.L., Lech, J.,
Buhler, D.R., 1998. Cloning, sequencing, and tissue expression of CYP3A27, a

167
new member of the CYP3A subfamily from embryonic and adult rainbow trout
livers. Arch. Biochem. Biophys. 320, 53-61.
Leguen, I., Carlsson, C., Perdu-Durand, E., Prunet, P., Part, P., Cravedi, J., 2000.
Xenobiotic and steroid biotransformation activities in rainbow trout gill epithelial
cells in culture. Aquat. Toxicol. 48, 165-176.
Leguen, I., Cravedi, J., Pisam, M., Prunet, P., 2001. Biological functions of trout
pavement-like gill cells in primary culture on solid support: pH(i) regulation, cell
volume regulation and xenobiotic biotransformation. Comp. Biochem. Physiol. A
Mol. Integr. Physiol. 128, 207-222.
Lester, S., Braunbeck, T., Teh, S., Stegeman, J., Miller, M., Hinton, D., 1993. Hepatic
Cellular Distribution of Cytochrome P-450 IA1 in Rainbow Trout (Oncorhynchus
mykiss): An Immunohisto- and Cytochemical Study. Cancer Res. 53, 3700-3706.
Lett, E., Kriszt, W., de Sandro, V., Ducrotoy, G., Richert, L., 1992. Optimal detergent
activation of rat liver microsomal UDP-glucuronosyltransferases toward morphine
and 1-naphthol: Contribution to induction and latency studies. Biochem.
Pharmacol. 43, 1649-1653.
Lien, G., McKim, J., 1993. Predicting branchial and cutaneous uptake of 2,2',5,5'-
tetrachlorobiphenyl in fathead minnows (Pimephales promelas) and Japanese
medaka (Oryzias latipes): Rate limiting factors. Aquat. Toxicol. 27, 15-32.
Lindstrom-Seppa, P., Koivusaari, U., Hanninen, O., 1981. Extrahepatic xenobiotic
metabolism in north-European freshwater fish. Comp. Biochem. Physiol. 69C,
259-263.

168
Lipnick, R.L., Muir, D.C., 2000. History of Persistent, Bioaccumulative, and Toxic
Chemicals. in Lipnick, R.L., Hermens, J.L., Jones, K.C., Muir, D.C. (Eds.),
Persistent, Bioaccumulative, and Toxic Chemicals I. American Chemical Society,
Washington, DC, pp.1-12.
Mackay, D. 1982. Correlation of bioconcentration factors. Env. Sci. Technol. 16, 274-
278.
Masubuchi, Y., Hosokawa, S., Horie, T., Ohmori, S., Kitada, M., Suzuki, T., Narimatsu,
S., 1994. Cytochrome P-450 isozymes involved in propranolol metabolism in
human liver microsomes: The role of CYP-2D6 as ring hydroxylase and CYP1A2
as N-desisopropylase. Drug Metab. Dispos. 22, 909-915.
McKim, J., Goeden, H., 1982. A direct measure of the uptake efficiency of a xenobiotic
chemical across the gills of brook trout (Salvelinus fontinalis) under normoxic and
hypoxic conditions. Comp. Biochem. Physiol. 72C, 65-74.
McKim, J., Bradbury, S., Memi, G., 1987. Fish acute toxicity syndromes and their use in
the QSAR approach to hazard assessment. Environ. Health Persp. 71, 171-86.
Mekenyan, O., Pavlov, T., Grancharov, V., Todorov, M., Schmieder, P., Veith, G., 2005.
2D-3D migration of large chemical inventories with conformational multiplication:
application of the genetic algorithm. J. Chem. Inf. Model 45, 283-292.
Meylan, W., Howard, P., Boethling, R., Aronson, D., Printup, H., Gouchie, S., 1999.
Improved method for estimating bioconcentration/bioaccumulation factor from
octanol/water partition coefficient. Environ. Toxicol. Chem. 18, 664-672.

169
Miller, M., Hinton, D., Stegeman, J., 1989. Cytochrome P-450 E induction and
localization in gill pillar (endothelial) cells of scup and rainbow trout. Aquat.
Toxicol. (Amst.). 14, 307-322.
Miller, M., Hinton, D., Blair, J., Stegeman, J., 1988. Immunohistochemical localization of
cytochromc P-450E in liver, gill and heart of scup (Stenotomus chrysops) and
rainbow trout (Salmo gairdneri). Mar. Environ. Res. 24, 37-39.
Miners, J., Coulter, S., Tukey, R., Veronese, M., Birkett, D., 1996. Cytochromes P450,
1A2, and 2C9 are responsible for the human hepatic O-demethylation of R- and
S-naproxen. Biochem Pharmacol. 51, 1003-1008.
Mohutsky, M. A., Chien, J. Y., Ring, B. J., Wrighton, S. A., 2006. Predictions of the in
vivo clearance of drugs from rate of loss using human liver microsomes for phase
I and phase II biotransformations. Pharm. Res. 23, 654-662.
Nallani, G., Paulos, P., Vaz, A., Constantine, L., Venables, B., Huggett, D., 2009.
Bioconcentration potential of ibuprofen in fathead minnow (Pimephales
promelas) and channel catfish (Ictalurus punctatus) [Abstract No. UP012].
Presented at SETAC North America 30th Annual Meeting, New Orleans, LA.
Nebot, C., Gibb, S., Boyd, K., 2007. Quantification of human pharmaceuticals in water
samples by high performance liquid chromatography–tandem mass
spectrometry. Anal. Chem. Acta. 598, 87-94.
Neely, W., Branson, D., Blau, G., 1974. Partition coefficient to measure
bioconcentration potential of organic chemicals in fish. Environ. Sci. Technol. 8,
1113-1115.

170
Norstrom, R., McKinnon, A., de Freitas, A., 1976. A bioenergetics-based model for
pollutant accumulation by fish. Simulation of PCB and methylmercury residue
levels in Ottawa river yellow perch (Perca flavescens). J. Fish Res. Board Can.
33, 248–267.
NYDEC (New York Department of Environmental Conservation), 1998. Division of
Water Technical and Operational Guidance Series (1.1.4): Procedures for
Derivation of Bioaccumulation Factors. Albany, NY.
Obach, R. S., 1999. Prediction of human clearance of twenty-nine drugs from hepatic
microsomal intrinsic clearance data: an examination of in vitro half-life approach
and nonspecific binding to microsomes. Drug Metab. Dispos. 27, 1350-1359.
OECD (Organization for Economic Cooperation and Development), 1996.
Bioconcentration: Flow-through Fish Tests, 305, last updated 14 June 1996.
Paris, France.
Oliver, B. G., Niimi, A. J., 1985. Bioconcentration Factors of Some Halogenated
Organics for Rainbow Trout: Limitations in their Use for Prediction of
Environmental Residues. Environ. Sci. Technol. 19, 842-849.
Öllers, S., Singer, H., Fässler, P., Müller, S., 2001. Simultaneous quantification of
neutral and acidic pharmaceuticals and pesticides at the low-ng/l level in surface
and waste water. J. Chromatogr. A 911, 225-234.
Olsen, K., 2002. Gill Circulation: Regulation of perfusion distribution and metabolism of
regulatory molecules. J. Exp. Zool. 293, 320-335.

171
Orme, M., 1982. The third S.K. & F. prize lecture, University of London, December
1981: The clinical pharmacology of oral contraceptive steroids. Br. J. Clin.
Pharmac. 14, 31-42.
Parkinson, A., Ogilvie, B. 2007. Biotransformation of Xenobiotics. in Casarett, L.,
Klaassen, C., Doull, J. (Eds.), Casarett and Doull's toxicology: the basic science
of poisons, 7th ed. McGraw-Hill Professional, New York, pp. 161-304.
Part, P., Norrgren, L., Bergstrom, E., Sjoberg, P., 1993. Primary cultures of epithelial
cells from rainbow trout gills. J. Exp. Biol. 175, 219-232.
Payan, P., Girard, J., Mayer-Gostan, N., 1984. Branchial Ion Movements in Teleosts:
The Roles of Respiratory and Chloride Cells. in Hoar, W., Randall, D. (Eds.), Fish
Physiology. Vol. X. Gills. Part B. Ion and Water Transfer. Academic Press,
London, pp. 42.
Pearce, R., McIntyre, C. J., Madan, A., Sanzgiri, U., Draper, A. J., Bullock, P., Cook, D.
C., Burton, L. A., Latham, J., Nevins, C., Parkinson, A., 1996. Effects of freezing,
thawing, and storing human liver microsomes on cytochrome P450. Arch.
Biochem. Biophys. 331, 145-169.
Pesonen, M., Andersson, T., 1991. Characterization and induction of xenobiotic
metabolizing enzyme activities in a primary culture of rainbow trout hepatocytes.
Xenobiotica. 21, 461-471.
Randall, D., Lin, H., Wright, P., 1991. Gill water flow and the chemistry of the boundary
layer. Physiol. Zool. 64, 26-38.
172
Randall, D. J., Connell, D. W., Yang, R., Wu, S. S., 1998. Concentrations of persistent
lipophilic compounds in fish are determined by exchange across the gills, not
through the food chain. Chemosphere, 37, 1263-1270.
Remmel, R. P., Zhou, J., Argikar, U. A., 2008. UDP-Glucuronosyltransferases. in:
Rodrigues, A. (Ed.), Drug-Drug Interactions, 2nd Ed. Informa Healthcare USA,
Inc., New York, NY, pp. 87-134
Repetto, G., del Peso, A., Zurita, J. L., 2008. Neutral red uptake assay viability/
cytotoxicity. Nat. Protoc. 3, 1125-1131.
Ritter, J., 2000. Roles of glucuronidation and UDP-glucuronosyltransferases in
xenobiotic bioactivation reactions. Chem. Biol. Interact. 129, 171-193.
Roberts, P., Thomas, K., 2006. The occurrence of selected pharmaceuticals in
wastewater effluent and surface waters of the lower Tyne catchment. Sci. Total
Environ. 356, 143-153.
Robertson, O., Wexler, B., 1960. Histological changes in the organs and tissues of
migrating and spawning Pacific salmon (genus Oncorhynchus). Endocrinol. 66,
222-239.
Rodrigues, A., 2005. Impact of CYP2C9 genotype on pharmacokinetics: are all
cyclooxygenase inhibitors the same? Drug Metab. Dispos. 33, 1567-1575.
Rodrigues, A., Kukulka, M., Roberts, E., Ouellet, D., Rodgers, T., 1996. [O-methyl
14C]naproxen O-demethylase activity in human liver microsomes: evidence for
the involvement of cytochrome P4501A2 and P4502C9/10. Drug Metab. Dispos.
24, 126-136.

173
Rudy, A., Knight, P., Brater, D., Hall, S., 1991. Stereoselective metabolism of ibuprofen
in humans: administration of R-, S- and racemic ibuprofen. J. Pharmacol. Exp.
Ther. 259, 1133-1139.
Russell, W., Burch, R., 1959. The principles of humane experimental technique.
Methuen, London.
Saha, A., Roy, K., De, K., Sengupta, C., 2000. Effects of oral contraceptive
norethindrone on blood-lipid and lipid peroxidation parameters. Acta. Pol. Pharm.
57, 441-7.
Schlezinger, J., Parker, C., Zeldin, D., Stegeman, J., 1998. Arachidonic acid metabolism
in the marine fish Stenotomus chrysops (Scup) and the effects of cytochrome
P450 1A inducers. Arch. Biochem. Biophys. 353, 265-275.
Schurmann, G., Klein, W., 1988. Advances in bioconcentration prediction.
Chemosphere 17, 1551-1574.
Sijm, D., Part, P., Opperhuizen, A., 1993. The influence of temperature on the uptake
rate constants of hydrophobic compounds determined by the isolated perfused
gills of rainbow trout (Oncorhynchus mykiss). Aquat. Toxicol. 25, 1-14.
Sijm, D., Verberne, M., deJonge, W., Part, P., Opperhuizen, A., 1995. Allometry in the
uptake of hydrophobic chemicals determined in vivo and in isolated perfused
gills. Toxicol. Appl. Pharmacol. 131, 130-135.
Spacie, A., & Hamelink, J. (1985). Bioaccumulation. in Rand, G., Petrocelli, S. (Eds.),
Fundamentals of Aquatic Toxicology: Methods and Applications. Hemisphere
Publishing Corp., New York, pp. 495-525.

174
Streit, B., 1998. Bioaccumulation of contaminants in fish. in Braunbeck, T., Hinton, D.,
Streit, B. (Eds.), Fish Ecotoxicology. Birkhauser Verlag Basel, Switzerland, pp.
353-387.
Ternes, T., 2001. Analytical methods for the determination of pharmaceuticals in
aqueous environmental samples. Trends Anal. Chem. 20, :419-434.
United Nations, 2001. Stockholm Convention on Persistent Organic Pollutants.
<http://chm.pops.int/Portals/0/Repository/convention_text/UNEP-POPS-COP-
CONVTEXT-FULL.English.PDF>.
USEPA (United States Environmental Protection Agency), 1999. Category for
Persistent, Bioaccumulative, and Toxic New Chemicals. 2009, from Federal
Register: November 4, 1999 (Volume 64, Number 213).
<http://www.epa.gov/fedrgstr/EPA-TOX/1999/November/Day-04/t28888.htm>.
van Emden, H.F., Peakall, D.B., 1999. Beyond Silent Spring: Integrated Pest
Management and Chemical Safety. Integrated Pest Mgmt. Rev. 4, 269-270.
Veith, G., DeFoe, D., 1979. Measuring and estimating the bioconcentration factor of
chemicals in fish. Fish Res. Board Can. 36, 1040-48.
Walter, R., Sung, H., Intano, G., Walter, C., 2001. Characterization of O(6)-
methylguanine-DNA-methyltransferase (O(6)-MGMT) activity in Xiphophorus
fishes. Mutat. Res. 493, 11-22.
Weigel, S., Kallenborn, R., Hühnerfuss, H., 2004. Simultaneous solid-phase extraction
of acidic, neutral and basic pharmaceuticals from aqueous samples at ambient
(neutral) pH and their determination by gas chromatography–mass spectrometry.
J. Chromatogr. A 1023, 183-195.

175
Weisbrod, A., Burkhard, L., Arnot, J., Mekenyan, O., Howard, P.H., Russom, C.,
Boethling, R., Sakuratani, Y., Traas, T., Bridges, T., Lutz, C., Bonnell, M.,
Woodburn, K., Parkerton, T., 2007. Workgroup report: review of fish
bioaccumulation databases used to identify persistent, bioaccumulative, toxic
substances. Environ. Health Perspect. 115, 255-261.
Williams, D., Buhler, D., 1984. Benzo[a]pyrene hydroxylase catalyzed by purified
isozymes of cytochrome P-450 from B-naphthoflavone-fed rainbow trout.
Biochem. Pharmacol. 43, 4752-4756.
Wilson, J., Laurent, P., 2002. Fish Gill Morphology: Inside Out. J. Exp. Zool. 293, 192-
213.