the informal economy in albania
TRANSCRIPT

THE INFORMAL ECONOMY IN ALBANIA
ANALYSIS AND POLICYRECOMMENDATIONS
DECEMBER 2004
Report prepared by the OECD - Investment Compactfor the Ministry of Economy of Albania
ISBN 92-64-01025-4 INV
ES
TM
EN
T C
OM
PA
CT
The informal economy is a major obstacle to the development of a strongenterprise sector and to the building of a well functioning market economy.
Economists have only recently started to explore the role played by theinformal economy in transition countries and so far much of the attention has beendevoted to estimating the size of the informal sector and to evaluating the fiscalimplications.
This report, prepared by the OECD Investment Compact in co-operation withthe OECD Statistics Directorate, upon a request from the Albanian Ministry ofEconomy, analyses the case of Albania, from an enterprise policy perspective.The analysis was conducted using a combination of statistical, macro and micro-economic tools, based on official GDP data and a set of indirect observations.The report explores issues such the size and intensity of informal activities inthe enterprise sector, the impact of tax and social security regimes, and therelationship between the informal economy and the spreading of unfair competitionpractices.
The report provides a set of policy recommendations, to be used as inputsfor the elaboration by the Albanian Government, together with its social partners,of a medium term strategy aiming to reduce the size of the informal economy.
PUBLISHED WITH THE SUPPORT OF THE CENTRAL EUROPEAN INITIATIVE (CEI)

The Informal Economy in Albania
ANALYSIS AND POLICY RECOMMENDATIONS
December 2004
Report prepared by the OECD - Investment Compact for the Ministry of Economy of Albania
Published with the support of the Central European Initiative (CEI)

THE STABILITY PACT FOR SOUTH EASTERN EUROPE is a political declaration and framework agreement adopted in June 1999 to encourage and strengthen co-operation among the countries of South East Europe (SEE) and to facilitate, co-ordinate and streamline efforts to ensure stability and economic growth in the region. (see www.stabilitypact.org)
THE SOUTH EAST EUROPE COMPACT FOR REFORM, INVESTMENT, INTEGRITY AND GROWTH (“THE INVESTMENT COMPACT”)
is a key component of the Stability Pact under Working Table II on Economic Reconstruction, Development and Co-operation. Private investment is essential to facilitate the transition to market economy structures and to underpin social and economic development. The Investment Compact promotes and supports policy reforms that aim to improve the investment climate in South East Europe and thereby encourage investment and the development of a strong private sector. The main objectives of the Investment Compact are to:
- Improve the climate for business and investment; - Attract and encourage private investment; - Ensure private sector involvement in the reform process; - Instigate and monitor the implementation of reform.
The participating SEE countries in the Investment Compact are: Albania, Bosnia and Herzegovina, Bulgaria, Croatia, the Republic of Macedonia, Moldova, Romania, Serbia and Montenegro. Building on the core principle of the Investment Compact that “ownership” of reform rests within the region itself, the Investment Compact seeks to share the long experience of OECD countries. It provides region-wide peer review and capacity building through dialogue on successful policy development and ensures identification of practical steps to implement reform and transition.
The work of the Investment Compact has been actively supported and financed by seventeen OECD Member countries: Austria, Belgium, Czech Republic, Finland, France, Germany, Greece, Hungary, Ireland, Italy, Japan, Norway, Sweden, Switzerland, Turkey, United Kingdom, United States and the European Commission. (see www.investmentcompact.org)
SECRETARIAT FOR CEI PROJECTS AT THE EBRD – LONDON
The Central European Initiative supports regional co-operation at economic and political level in Central and Eastern Europe. Founded in 1989, the CEI now counts 17 member countries: Albania, Austria, Belarus, Bosnia and Herzegovina, Bulgaria, Croatia, the Czech Republic, Hungary, Italy, Macedonia, Moldova, Poland, Romania, Serbia and Montenegro, Slovakia, Slovenia and Ukraine.
Since the establishment of the institutional and technical co-operation with the European Bank for Reconstruction and Development (EBRD) in 1991, the joint CEI – EBRD Secretariat has been funded by the Italian government with a total of approximately €27 million for the implementation of technical co-operation assignments alongside EBRD investments and for development and training activities in the region. EBRD’s investments, supported by the CEI, amount to over €300 million, with a total project value of over €1 billion.
The Economic Dimension of the CEI
- Develop Strategies (with partners in the 17 countries) - Mobilise national resources (through the annual CEI Summit Economic Forum, the regular meetings and
operations of the Working Groups, and ministerial meetings) and international support (through co-operation programmes with other international organisations and financial institutions, such as the European Union, the United Nations, the EBRD, OECD, WB, etc.)
- Technical Co-operation assistance for specific projects alongside EBRD investments (or investments of other IFIs) - Support institutional development through the Know-how Exchange Programme (KEP) for know-how transfer
between CEI countries through specific cooperation activities - Support international events and training thematically linked to the CEI areas of priority intervention (South-
eastern Europe, Wider Europe region and sectors such as SMEs, agriculture, infrastructure)
Project opportunities promotion, also through the business “Match-making programme” and the publication of Investment Guides.

THE INFORMAL ECONOMY IN ALBANIA: ANALYSIS AND POLICY RECOMMENDATIONS - ISBN 92-64-010254 - ©OECD 2005 3
Foreword
At the end of 2003 the Albanian Ministry of Economy requested the OECD Investment Compact to conduct a study of the informal economy with the purpose of identifying a set of policy recommendations directed at improving the methods of estimation and at promoting the progressive reduction of the weight of the informal economy. This request opened up a new phase in the already close and positive co-operation between the Investment Compact and the Government of Albania.
The study embodied in this report has been prepared by the OECD Investment Compact and the OECD Statistics Directorate, with the full support of the Albanian Government, which has granted access to privileged information. It has benefited from inputs and comments from experts in a number of international and Albanian institutions listed in the Acknowledgement section above. Its publication and public dissemination has been supported by a grant from the Central European Initiative.
The informal economy, with its consequences in terms of tax evasion, labour market distortions and unfair competition, is a major issue in Albania, as well as many other transition economies. It has been singled out in various reports, including the Enterprise Policy Assessments conducted by the Investment Compact in 2003 and 2004 throughout South East Europe, as a major obstacle to the development of a strong enterprise sector and to the building of a well functioning market economy.
This report contributes to the analysis of this complex phenomenon and provides inputs for a medium term strategy that will deal with the different, interrelated issues arising from the presence of a large informal sector. While focused on Albania it also provides pointers on issues for review and action in other countries in the region.
The elaboration and effective implementation of any strategy promoting a progressive move from informal to formal activities is a major challenge. It should not be under estimated. It requires the active participation and the strong support of all social partners, employers and trade unions, local administrations as well as the various branches of public administration. And it requires ongoing and persistent action over the longer term if measurable progress is to be achieved.
Policy implementation is at the heart of the OECD Investment Compact objectives. The initiatives taken by the Albanian Council of Ministers
• to establish a Task Force for the Reduction of the Informal Economy, co-ordinated by the Ministry of Economy,
• to elaborate a detailed and comprehensive Action Plan, as reported in Annex F, and
• to call for a Conference of the Social Partners to be held in Spring 2005 in order to gain widespread understanding and support for change,
are, therefore, particularly welcomed.

FOREWORD
4 THE INFORMAL ECONOMY IN ALBANIA: ANALYSIS AND POLICY RECOMMENDATIONS - ISBN 92-64-010254 - ©OECD 2005
The Investment Compact, in cooperation with all Stability Pact partners, will seek to monitor progress through the Investment Compact monitoring instruments and to provide constructive partnership to Albania in tackling the challenge of dealing with the informal economy.
Manfred Schekulin Director, Export and Investment Policy Department Federal Ministry for Economic Affairs and Labour of Austria Co-Chair, Investment Compact Project Team
Milen Keremedchiev National Coordinator of the Stability Pact, Bulgaria Co-Chair, Investment Compact Project Team
Rainer Geiger Deputy Director Directorate for Financial Fiscal and Enterprise Affairs, OECD Co-Chair, Investment Compact Project Team
Enrico Giovannini Chief Statistician and Director of the Statistics Directorate, OECD
THE INFORMAL ECONOMY IN ALBANIA: ANALYSIS AND POLICY RECOMMENDATIONS - ISBN 92-64-010254 - ©OECD 2005 5
STATEMENT FROM THE MINISTER OF ECONOMY OF THE REPUBLIC OF ALBANIA
The Albanian Government would like to express its gratitude to the OECD Investment Compact for South East Europe, OECD and the Central European Initiative (CEI) for their support with the Government’s initiative on research into the informal economy in Albania.
As the first country in the region to undertake an initiative of this kind, Albania is at the foreground in consistently completing reforms and adapting to the standards of the EU Association and Stabilisation process. Since 1998 Albania has maintained macro-economic stability and has been constant in its efforts to implement a modern tax system structured according to EU standards.
The Government of Albania is in the process of implementing a number of programmes aiming to reform customs and tax administration. Albania has implemented a liberalised trade policy and ensured stable economic growth of 6-7% per year, while supporting private sector development, which at present constitutes almost 75% of GDP.
The collapse of pyramid schemes in 1996–97 hindered policy reform, the development of a coherent institutional framework and has contributed to the development of the Informal Economy, in some sectors.
The informal economy in Albania is largely undocumented with regard to its impact on employment and production. Tax evasion and the implementation of effective regulation and procedures remain controversial issues. The Government, the Unions, and Employers’ Associations are in agreement that the Informal Economy represents a substantial share of GDP. The informal economy is having a negative impact on the country’s economic development and on the management of economic and structural reforms. The issue of the informal economy is therefore a priority for the Government and requires immediate and effective action.
This analysis of the informal economy has resulted in the Government adopting a mid-term strategy on entrepreneurial policy reform. In order to implement the recommendations provided by this report, the Government has officially set up a ‘Task Force’ which will structure and monitor the action plan aimed at reducing the informal economy.
Innovative research of this kind is a first for the region of South East Europe and reflects the continuing co-operation between Albania and the OECD Investment Compact for South East Europe in policy reform and adopting best practice methods for the development of the business and investment climate in the country as well as the region.
Mr. Anastas Angjeli
Minister of Economy of the Republic of Albania

6 THE INFORMAL ECONOMY IN ALBANIA: ANALYSIS AND POLICY RECOMMENDATIONS - ISBN 92-64-010254 - ©OECD 2005
ACKNOWLEDGEMENTS
The report has been prepared by the OECD Investment Compact for South East Europe, under the direction of Declan Murphy (Programme Director, Investment Compact) as part of the South East Europe Enterprise Policy Initiative of the Investment Compact and in response to a request from the Ministry of Economy of Albania.
The research team was composed of Antonio Fanelli (Principal Administrator, OECD Investment Compact and project co-ordinator), Nadim Ahmad (National Accountant, OECD Statistics Directorate) and Ricardo Pinto (Consultant to the OECD Investment Compact), who undertook the main research and prepared the report. The European Commission (DG Enterprise) has provided support for this report and the work of the Investment Compact.
Edward Christie and Mario Holzner (Economists, Vienna Institute for International Economic Studies) have acted as consultants to the research team and contributed with the elaboration of estimates of total household tax compliance.
The report has benefited from comments and contributions by Francesco Panzica (Task Officer for Albania, European Training Foundation), Zbigniew Kominek (Economist, European Bank for Reconstruction and Development), Professor Luca Meldolesi, Alessandro La Grassa and Domenico Marino (Advisors to the Committee for the Highlight of Informal Labour, operating under the Presidency of the Council of Ministers, Italy and chaired by Prof. Luca Meldolesi). The participation of the Italian experts in peer review discussions in Albania and their expert views and guidance has helped and enhanced the report. The OECD Investment Compact would like to thank all contributors for their excellent support. In addition thanks are due to Francesca Pissarides, Peter Sanfey (both Senior Economists, European Bank for Reconstruction and Development), Richard Highfield (Head of the E-Commerce, Consumption Taxes and Tax Administration Division at the OECD Centre for Tax Policy and Administration) and Luca Pappalardo (SAP Advisor to INSTAT) for their very helpful comments during the drafting process.
Several Albanian institutions, (the Ministry of Economy, Ministry of Finance, Ministry of Labour and Social Assistance, the Bank of Albania, the Social Insurance Institute and the National Institute of Statistics (INSTAT)) have been involved in this study. In addition a leading commercial bank in Albania has provided a sample of company financial data, which is gratefully acknowledged. Their constructive cooperation was highly appreciated. Particular thanks should go to Bashkim Sykja (Director of the Business Promotion Department, Ministry of Economy) who co-ordinated the project from the Albanian side. The Private Public Finance Institute (Tirana), directed by Elida Reci, provided technical support for field research and interviews in Albania.
The European Commission (DG Enterprise and Industry) has financially supported the study. The publication and public presentation of the report have been supported by a grant provided by the Central European Initiative (CEI).
The assessments and views expressed in this report are those of the Investment Compact and do not necessarily reflect the views of the OECD and its Member countries. The report is available on the web page of the Investment Compact:(www.investmentcompact.org).

THE INFORMAL ECONOMY IN ALBANIA: ANALYSIS AND POLICY RECOMMENDATIONS - ISBN 92-64-010254 - ©OECD 2005 7
Table of Contents
Executive Summary and Key Policy Recommendations.......................................................................9
Executive Summary ................................................................................................................................9 Policy Recommendations......................................................................................................................18
Chapter 1 Analytical Framework, Focus and Structure of the Report..................................................23
1.1 Introduction .....................................................................................................................................23 1.2 Definition of the informal economy................................................................................................23 1.3 The informal economy in Albania: Possible sources, main features and current estimates............26 1.4 Focus and structure of the report.....................................................................................................30
Chapter 2 Assessment of the Statistical System ...................................................................................33
2.1 Introduction .....................................................................................................................................33 2.2 Assessing and Estimating GDP.......................................................................................................34 2.3 Estimates of Household Tax Compliance in Albania .....................................................................39 2.4 Conclusions .....................................................................................................................................42 2.5 Recommendations on the statistical system....................................................................................45
Chapter 3 The Impact of the Tax and Social Security Contribution Regime on Company Behaviour........................................................................................................53
3.1 Approach .........................................................................................................................................53 3.2 Tax System......................................................................................................................................54 3.3 Social Security Contributions Regime ............................................................................................56 3.4 How some companies manage to systematically evade taxes and social security contributions ....56 3.5 Analysis of Company Behaviour ....................................................................................................63
References ..............................................................................................................................................78
Annex A Assessing and Estimating GDP in Albania ..........................................................................81
Annex B Industrial Sectors used by INSTAT (and concordance with European NACE classifications). .................................................107
Annex C Comparing Estimates of Formal Activity with Taxes Received ........................................108
Annex D Pro-forma Questionnaire Used for Company Data Provided by Financial Institutions .....110
Annex E Household Tax Compliance in Albania .............................................................................111
Annex F Order of the Council of Ministers for the Establishment of a Steering Committee ...........132
Annex G Action Plan for the Reduction of the Informal Economy in Albania.................................134
Annex H Acronyms ...........................................................................................................................143


THE INFORMAL ECONOMY IN ALBANIA: ANALYSIS AND POLICY RECOMMENDATIONS - ISBN 92-64-010254 - ©OECD 2005 9
EXECUTIVE SUMMARY AND KEY POLICY RECOMMENDATIONS
Executive Summary
Informal economy, a hotly debated issue
The informal economy is an important contributor to employment and production in Albania but also fiscal and regulatory evasion and, as such, is a hotly debated issue. The government, trade unions and employers’ associations recognise that informal activities provide a substantial contribution to the economy. They also acknowledge however, that this contribution comes with significant costs in terms of lost tax revenues, lack of employee protection and unfair competition among enterprises. The informal economy overshadows and influences many structural policy efforts and requires urgent action if Albania is to advance in building a soundly based market economy.
Scope of the report
The availability of data on which to base a productive debate and build a comprehensive policy aimed at formalising the informal sector is limited, as is the understanding of the elements behind the growth of the informal economy. For these reasons the Government, through its Ministry of Economy, requested the OECD Investment Compact to conduct a study addressing three main questions and to provide recommendations on practical steps that could lead to a formalisation of the informal economy in a sustainable way:
1. How big is the informal economy in Albania?
2. How can the current estimation methods used by the Albanian Statistical Office (INSTAT) to measure the informal economy be improved?
3. How can the government tackle the informal economy issue more effectively?
The report seeks to provide an answer to those questions using an approach that combines elements of macro and micro-economic analysis. It is important to stress from the outset that no definitive answer exists on how best to tackle the informal economy. Economists have only recently started to explore the role played by the informal economy in transition countries and so far much of the attention has been devoted to estimating the size of the informal sector and to evaluating the fiscal implications.
Agenda for Action
In this respect this report is different from the mainstream economic literature on the subject. It focuses on the implications that the presence of a large informal sector has on business and enterprise development. The approach is pragmatic. The primary aim is to identify some practical policy recommendations that can be implemented. It contains 33 recommendations including 12 priority issues

EXECUTIVE SUMMARY AND KEY POLICY RECOMMENDATIONS
10 THE INFORMAL ECONOMY IN ALBANIA: ANALYSIS AND POLICY RECOMMENDATIONS - ISBN 92-64-010254 - ©OECD 2005
for action. There are many aspects of the informal economy that will require ongoing and in-depth analysis. This report should be seen as a contribution to that process. It is an agenda of action that can be taken forward in the short to medium term and equally a valuable basis for building a longer term strategy on this complex subject.
A challenge for government and all social partners.
The experience of a number of OECD and transition countries shows that there is no magic formula or single major solution to transform informal economic activity into formal activity. However, it is possible to introduce a number of policy measures that, together, steadily shift the balance of economic and social rewards from the informal to the formal sector. It is important to stress, however, that such an analysis and change process cannot be developed in isolation. Recommendations can only be developed and properly implemented through a process of policy dialogue and concrete action on implementation, that involves the government, public administrations, civil society, the enterprise sector, and representatives of employees, as stressed in the foreword.
Defining the informal economy
The informal economy is a vague term open to a number of interpretations. In this report we have defined informal economy as the ensemble of all unobserved economic productive activities that are driven by tax and social security evasion or by attempts to avoid compliance with certain legal standards and administrative procedures. This definition excludes marginal non taxed activities (such as domestic labour and subsistence farming) and therefore criminal activities (e.g. smuggling, trafficking, prostitution etc.), which are believed to be quite significant in Albania but are different in nature and require different policy measures than informal activities. Allowing for these exclusions the borderline between formal and informal activity is largely determined by the rate of compliance to tax and social contribution laws and regulation. As a result the report mainly focuses on the impact of the tax and social contribution regimes on the informal and formal economy.
The emergence of the informal economy
The seeds of the informal economy in Albania were planted during the initial phase of the country’s transition towards a market economy; when the development of the legal institutional, fiscal and regulatory framework lagged behind the development of the private enterprise sector. The political unrest that followed the collapse of the pyramid schemes in 1996-1997 further delayed the development of a coherent institutional framework, increasing the gap between the institutions and the real economy.
Tackling the Informal Economy – the story so far
Since 1997 Albania has made considerable efforts to introduce a modern tax regime, structured on standard EU modelled VAT systems for indirect taxation and corporate and personal income tax for direct taxation. It is implementing a number of programmes to upgrade the customs and tax administrations. Over the last five years the country has built a stable and open macro-economic framework, completed economic liberalisation and enjoyed a sustained economic expansion, albeit from low levels, supported by a growing private enterprise sector.

EXECUTIVE SUMMARY AND KEY POLICY RECOMMENDATIONS
THE INFORMAL ECONOMY IN ALBANIA: ANALYSIS AND POLICY RECOMMENDATIONS - ISBN 92-64-010254 - ©OECD 2005 11
However, in spite of these positive elements, the share of the informal economy in GDP does not appear to have receded. Indeed, the indications are that the informal sector has been the most dynamic component of the Albanian economy in recent years. For example, Albania has one of the highest VAT, corporate income tax and social contribution rates among the countries of South East Europe, but at the same time it has close to the lowest ratio of tax and social contribution revenues to GDP.
Tackling the Informal Economy – the future?
The report argues that the seeds planted in the first phase of the transition process have developed into an intricate web that is woven into the entire economic system. Informal activity has become a structural feature of the Albanian economy. It does not appear to be linked to a specific phase of the development of the emerging private sector and is unlikely to recede in the near future unless profound changes are made to the tax and social contribution regimes, and to tax administration enforcement. This needs to be augmented with strong signals from government that these issues will be tackled as part of a wider, more comprehensive policy-package that deals with poverty eradication, employment rights, and improved public services more generally.
The relatively high overall tax and social security burden, in combination with a weak tax enforcement record and a high degree of un-regulated competition in the domestic markets for goods and services, has produced a powerful mix that has fuelled the expansion of the informal economy. Enterprises have become adept at exploiting inconsistencies in the tax and social security systems so as to systematically under-report their profits and turnover.
One area of the tax system that is being exploited, at significant cost to government revenues, is the VAT threshold, which is also the threshold for small business tax payments, as opposed to profit taxes. As defined, small businesses (those with a turnover of less than Lek 8 million) pay a tax equivalent to 4% of turnover. Businesses operating above this threshold however, must pay corporate tax. Our investigations, based on company data, suggest that the marginal tax rate above and around the Lek 8 million is currently greater than 100%, acting either as a dampener on economic growth or more commonly an unwitting contributor to informal production.
How big is the informal economy? - 40% larger than formal production in the small enterprise sector1.
The definition that we use for informal production is based on productive activities that are tax evasive. Because companies and individuals that engage in informal production are unlikely to provide accurate accounts to statistical or other administrative authorities, estimating the size of informal production is a complex exercise and estimates necessarily come with a number of caveats attached that can often obscure the message.
Indeed, the most significant message that emerges from our analysis is that informal production in the small enterprise sector is dominant over formal production. According to our estimates, in the manufacturing, trade, transport, construction, retailing and other business services sectors, the most dynamic of the Albanian economy and typically dominated by (small) private firms, informal production is about 40% larger than formal production.
These sectors are responsible for about half of total economic activity in Albania2. In other sectors, such as public administration, financial services and utilities, the scope for informal production is much more limited, as is generally the case in other economies. This means that cross-country comparisons of

EXECUTIVE SUMMARY AND KEY POLICY RECOMMENDATIONS
12 THE INFORMAL ECONOMY IN ALBANIA: ANALYSIS AND POLICY RECOMMENDATIONS - ISBN 92-64-010254 - ©OECD 2005
informal economy to GDP ratios are often misinterpreted. Of particular importance in this context is the share of agricultural activities within GDP; which contributes about one-quarter of GDP in Albania. Agricultural activities are not taxed in Albania and so fall outside the scope of our definition of the informal sector. In many other countries, however, they may be taxed and so fall in scope. Therefore two countries identical in every way (same levels of non-agricultural output, tax-evasion, corruption etc), except one has significantly higher levels of (measured) subsistence farming say, will also have significantly different estimates of informal production as a per cent of GDP.
Taking this and other caveats into account, which are described in more detail in the main body of the paper, we estimate the size of the informal economy in 2002 at 23.4% of GDP at market prices and 22.7% in 2001. Our estimate may at first sight appear to be on the low side, certainly when set against the estimates of 30-60% of GDP given in some recent unofficial studies but these differences are partly explained by the fact that we do not include agricultural activities within our definition of the informal sector. All other things equal, if we include agricultural activities in our definition, our estimates move to the higher end of the 30-60% range.
In the profit tax paying sector, as a whole, informal production is larger than formal
So far we have described two ratios illustrating the importance of informal activities within Albania; the emphasis, as we imply, for policy makers being on the first. There is another ratio which reinforces the message given in the first ratio (that informal production is 40% larger than formal production in the small enterprise sector). This measure considers the share of value-added generated informally by all sectors3 of the economy that are subject to some form of profit (or business) taxation. Our analysis shows that over half (51%) of value-added generated in these sectors is informal. This is significant and has major tax and budgetary policy implications.
Going through the estimation process
There is a fourth statistic, numerously cited in this report to help illustrate the derivation of our estimates and to illustrate the broader trends of the informal economy. As mentioned above, our estimates of the size of the informal economy in 2002 and 2001 were 23.4% and 22.7% of GDP at market prices respectively. GDP at market prices is commonly used as the denominator in describing the size of the informal economy. However, we believe that a better picture can be obtained by using GDP at basic prices, commonly referred to as gross value-added4, since this measure avoids possible distortions caused by uneven enforcement of indirect taxes. On this basis, we estimate the size of the informal economy as a share of gross value-added at 26.6% in 2002 and 26.0% in 2001.
Official and detailed data on economic activity is not currently available for 2003 or 2004, but an analysis of the work of the Vienna Institute, information on tax revenues and early indications from the business register, suggest that the size of the informal economy in these years was about the same order of magnitude. Indeed we estimate that informal production over the last 5 years contributed between 24-28% of total gross value-added.
During the course of our analysis it became apparent that the public at large were not aware that official (INSTAT) estimates of gross value-added already included estimates of the informal economy. This is an important point that needs to be better disseminated. Nevertheless, although the official (INSTAT) estimates of the informal economy as a share of gross value-added (27.9% in 2002) are not very different from our own there is a crucial difference concerning the denominator in this ratio, gross value-added.

EXECUTIVE SUMMARY AND KEY POLICY RECOMMENDATIONS
THE INFORMAL ECONOMY IN ALBANIA: ANALYSIS AND POLICY RECOMMENDATIONS - ISBN 92-64-010254 - ©OECD 2005 13
Our assessment suggests that the methodology used by INSTAT over-estimates the levels of both formal and informal production5. As such, again keeping in mind the quality caveats, our estimate of 26.6% in 2002 is based on a much lower level of gross value added (Lek 491 billion, 12.6% lower than current official estimates). Estimates for 2001 are based on gross value-added estimates of Lek 460 billion, 12.9% lower than official estimates6.
Improving estimation methods
In the report we make a number of recommendations relating to processes, internal administration structures and estimation methods but, ultimately, the key to improvements in estimation methods is more resources and better quality (and more) data. At the time of writing seven staff in INSTAT were allocated to the production of the national accounts. It is important to state that, given these limited resources, INSTAT is doing a good job. These numbers are however insufficient if Albania is to firmly grasp the measurement of the informal economy.
Why many companies choose to operate informally?
In order to evaluate the implications of informal activity and understand the mechanisms that are behind the growth of the informal sector, the report analyses data from a sample of micro to small and medium sized enterprises, provided by a leading banking institution in Albania and integrates this data with the findings from a series of company interviews. The size of the sample (87 companies) and the limited number of business interviews do not allow fully representative conclusions for the whole enterprise sector, but the information emerging from these inputs is valuable in understanding the dynamics of the informal economy. The broad approach used in this analysis is to identify the rewards and the risks associated with various levels of informal activity and to understand the forces and the rationale behind company behaviour.
The picture that emerges from the micro-analysis substantially confirms the indications of the statistical and macro-analysis. In the small enterprise sector, there is a systematic and widespread under-reporting of company turnover, partly driven by the fiscal advantages (inadvertently) given by the current tax regime for companies with a turnover below Lek 8 million (€63 000). Those companies are subject to the Small Business Tax (SBT) set at 4% of declared turnover and are exempt from charging VAT. The advantage at the margin is very significant. Overall tax liabilities can be reduced by more than 100% by under reporting turnover, providing a very strong incentive for tax evasion.
The relatively high marginal tax-rate above the VAT exemption threshold is distortionary and is an impediment to reducing informal activity. The VAT exemption and the lower taxation rate on profits allow companies benefiting from the SBT regime to undercut their competitors operating under the CIT/VAT regime. In an extremely price sensitive market, this fuels unfair competition and creates an incentive for the spread of under-reporting and tax evasion throughout the economy.
The two-tier VAT regime results in a break in the valued added chain that, in turn, facilitates turnover under-reporting, VAT and CIT evasion. Dysfunctions in the operations of the customs administration create an additional channel for turnover under-reporting, increasing the pressure from unfair competition through parallel imports. Business interviews revealed that practices such as under-declaring the value of imports and mislabelling the content of imports, in order to benefit from lower import duties, are still widespread, in spite of recent progress made in upgrading the customs administration.

EXECUTIVE SUMMARY AND KEY POLICY RECOMMENDATIONS
14 THE INFORMAL ECONOMY IN ALBANIA: ANALYSIS AND POLICY RECOMMENDATIONS - ISBN 92-64-010254 - ©OECD 2005
Systematic under-declaration of wages and salaries is wide-spread
Enterprises systematically under-declare wage levels and, so, under-pay social security contributions; principally by abusing the provisions of the minimum wage. This is done largely in collusion with employees, who prefer immediate direct cash payments to future social benefits. This behaviour is justified by employees and employers on the grounds that the current level of state pensions is too low and on the poor state of the national health system. The implications are significant: a) the personal income tax regime is de facto non operational in the private sector, creating tax discrimination among employees working in the private and public sector, b) the social security and pension system is in the medium term unsustainable and c) the labour market is highly distorted and non-transparent, since, according to the Social Administration Department, officially registered enterprises under-report their labour force by approximately 30%. The widespread use of cash in conducting inter-company transactions and in paying salaries is a function of the level of informality in the economy, as cash transactions leave no record for tax and labour inspectors.
The scope of this study does not allow for a detailed investigation of the informal labour market. However, the European Training Foundation is conducting a field study, co-ordinated with this report, on issues that look at the dynamics of the labour market and the enterprise sector in the Durres and Tirana districts.
Unfair competition and, to a lesser extent, the regulatory regime are key drivers
The rewards for informal operations are substantial. According to a sample of company data, full tax compliance can result in a further reduction of 15-20% of company profits from the current level which includes a degree of non compliance, depending on the sector of activity and the company size. But, because of the pressure from unfair competition, full tax compliance risks pushing the profit rate below what has been defined in the report as the growth profit rate (section 3.5.4). This could bring the expansion of the small business sector to a halt. The pressure on profits arising from full tax compliance is such that in some cases it approaches the subsistence profit rate, forcing marginal enterprises to withdraw from the market.
Based on the analysis conducted in the framework of the Enterprise Policy Performance Assessments for Albania (OECD, EBRD 2003, OECD, EBRD, EC-DG Enterprise and Industry 2004) the report indicates that the regulatory regime currently in place in Albania contributes to the spreading of informal operations, but not on the same scale as the fiscal and social contribution regime.
The current level of corporate income tax is unsustainable for many small enterprises
In the prevailing business environment a corporate tax rate of 25%7, although not high by international standards, is unsustainable for many enterprises with a turnover just above the Lek 8 million threshold, and works as an additional incentive to tax evasion, as illustrated by Table 3.9. This is because of unfair competition from massive tax evasion by other enterprises combined with the more favourable regime afforded by the SBT tax to small business, including the VAT exemption.
Because of the strong pressure of unfair competition from companies evading the CIT and VAT, companies in the Lek 8-40 million turnover range, need to massively under-report their turnover to marginally increase their after tax profit margin (Table 3.9). The implication is a very high level of tax evasion or, in other words, a very low level of tax compliance, once VAT and CIT loss tax revenues are taken into account. The company data show that the percentage of taxes evaded is above the 80% mark

EXECUTIVE SUMMARY AND KEY POLICY RECOMMENDATIONS
THE INFORMAL ECONOMY IN ALBANIA: ANALYSIS AND POLICY RECOMMENDATIONS - ISBN 92-64-010254 - ©OECD 2005 15
for all companies in the Lek 8 to 40 million turnover range, while it is significantly lower (around 35%) for enterprises with turnovers below Lek 8 million.
The size of the informal economy is not necessarily an indicator of potential revenue losses
Contrary to popular perception, small entrepreneurs are evading taxes and social contribution more out of necessity and to remain in business than for personal enrichment through distributed profits. The ultimate beneficiaries of the current situation are the consumers/households, as fierce price competition in sectors that are de facto free from state regulation and interference, guarantees that most benefits from tax evasion are transformed into a consumer price reduction.
Estimates produced by the Vienna Institute of International Economic Studies as part of this study show that the gain from tax evasion by households amounted to around 12% of GDP in 2002/2003. The link between corporate and household tax evasion is determined by the fact that nearly all of the direct and indirect taxes imposed on households are collected through enterprises. In other words, a move towards full tax compliance by the households, through a strict enforcement of the current tax regime on the private enterprise sector, will imply, all other things equal, a shift of resources from the household budgets to the state budget in the same order of magnitude. This means that the redistributive role of government will take on increased importance but it is also important to flag-up the possible negative impact on activity and growth that a rush to full compliance and enforcement may entail. The combined effect of lower household income and higher prices could lead to lower overall economic consumption and activity.
Risks of detection and fines are outweighed by informal activities
The analysis shows that the risks of operating informally are relatively modest. The system of labour inspections is constrained by the number of inspectors and made ineffective by the high levels of collusion between employers and employees.
Tax audit data show that small enterprises below the VAT threshold have less than a one in ten chance of being inspected in any given year and even then, based on estimates of informal activity, tax inspectors are able, on average, to uncover only a portion of the actual tax evasion, (at best 40% on average). The picture is similar for VAT registered enterprises. These have a higher chance of being inspected (two in three) but again the indications are that audits only uncover a small proportion of actual evasion (about one-third). Even after taking fines and bribes into account these audited companies appear to benefit from operating informally.
Given the absence of sector studies, the lack of systematic exchanges of information among various branches of the public administration and an underdeveloped internal reporting system within the tax administration, tax inspectors operate mostly in the dark. In this situation, the assignment of tax revenue targets to local tax offices, while guaranteeing a minimum of tax revenues, opens the way to arbitrary actions by the local tax administration.
Finally, several indicators point to a widespread use of bribery of state officials by private enterprises. Albanian companies pay one of the highest “bribing taxes” in South East Europe amounting to around 3% of the average company turnover, according to data from the BEEP 2002 survey conducted by the EBRD and the World Bank. For companies operating informally the regular payment of bribes is, in a way, equivalent to an insurance premium, offering partial cover against the risk of being fined or excessively fined by the tax authorities.
EXECUTIVE SUMMARY AND KEY POLICY RECOMMENDATIONS
16 THE INFORMAL ECONOMY IN ALBANIA: ANALYSIS AND POLICY RECOMMENDATIONS - ISBN 92-64-010254 - ©OECD 2005
On the plus side
The situation is not as bleak as it may appear from the picture described above. The tax authorities have introduced over the last few years a number of measures aiming at restricting the areas of tax evasion. Much of the effort has been directed towards the category of large tax payers, i.e. large enterprises subject to VAT. For the small business sector the main method of securing a minimum of tax and social security contribution compliance is the annual renewal of the business license, which is granted only upon proof of a minimum payment of taxes and social security contributions, coupled with sporadic actions to identify unincorporated, unregistered enterprises. All of this contributes to create a situation where the distinction between the formal and informal economy is blurred.
The informal sector is mostly made up of registered companies known to the tax authorities and which file regular tax returns declaring a modest turnover and profit, but which are accepted with few questions from the local tax office, often with the help of a small under the table payment.
The entire system appears to operate on a relatively stable equilibrium. Tax evasion is systematic throughout the whole enterprise sector. Entrepreneurs re-invest most of the additional profits from tax evasion in their business activities, as implied by the high growth rate of the small business sector. Fierce price competition assures that part of the gains from tax evasion is transferred to the households and the state secures a minimum of tax revenues which grows in line with the expansion of the economy.
But inaction now may lead to problems in the longer term
However, it is evident that this is a sub-optimal equilibrium, not sustainable over the medium term, as the economic expansion will be constrained by the lack of investment in public infrastructure, in training and education and by the short term view adopted by entrepreneurs that make most of their gains by remaining small.
The challenge for Albania is how to move to a superior level of equilibrium without compromising the vitality of the enterprise sector and penalising households, eradicating unfair competition without reducing the overall level of competition in the economy.
The costs of inaction over the medium term could be considerable and affect the development of a fully fledged market economy in Albania. Lower tax revenues mean fewer resources available for investment in infrastructure and education. Widespread use of informal labour contracts and systematic evasion of social security contributions imply weaker protection and lower social benefits for the employees. At the same time it leads to a lower level of employee loyalty and dissuades companies from investing in workforce training.
A high level of tax evasion translates into a high level of unfair competition and distorts market operations. Under-declarations of profits and turnover undermine trust between companies and banks and hamper the development of an efficient credit market. Finally, in an economy with a high level of informal activity a peculiar form of adverse selection takes place. Companies running informal operations tend to deal with suppliers and buyers that share the same non-transparent business practices, including the keeping of a double accounting system, one for the tax office and one for internal use. Large foreign companies, used to operating in accordance with more stringent reporting and accounting standards and high levels of disclosure, may find this type of environment too challenging for a direct presence and may defer investment decisions.

EXECUTIVE SUMMARY AND KEY POLICY RECOMMENDATIONS
THE INFORMAL ECONOMY IN ALBANIA: ANALYSIS AND POLICY RECOMMENDATIONS - ISBN 92-64-010254 - ©OECD 2005 17
The way ahead: building wide support for a comprehensive medium term strategy to tackle the informal economy
The experience of a number of OECD and transition countries shows that the informal economy issue is best addressed through a process of dialogue between the government and its social and economic counterparts such as trade unions, employers’ associations and the public more generally. This dialogue is essential to better understand the underlying interests of the parties involved and to develop a more trusting relationship between the government and the enterprise sector; an essential condition for successful policy implementation.
This report, with its set of policy recommendations, is the contribution from the OECD Investment Compact to the policy debate aiming at formulating a medium term strategy for the formalisation of the informal economy.
At the end of the day there will always be entrepreneurs, in Albania as elsewhere, that will try to evade taxes and operate informally. The core aim of this report is to shift attitudes away from such behaviour, marginalising non compliant entrepreneurs, removing social acceptance and justification in the process.

EXECUTIVE SUMMARY AND KEY POLICY RECOMMENDATIONS
18 THE INFORMAL ECONOMY IN ALBANIA: ANALYSIS AND POLICY RECOMMENDATIONS - ISBN 92-64-010254 - ©OECD 2005
Policy Recommendations*
Statistics and GDP Estimation
A full description of the recommendations to improve the statistical production system and the estimation of the informal sector and more generally GDP are included in Section 2.6. The list below serves as a summary only.
1. *Adjustments for the informal sector are currently of a static nature meaning that the approach is unable to measure the efficiency of policy measures designed to tackle the informal sector. Of equal concern is the fact that estimates of growth in the informal economy are driven by growth rates in the formal economy. A more dynamic mechanism for informal economy estimation must be introduced; particularly as the findings from the Vienna Institute point to year-on-year changes in the share of informal activities within the economy. One commonly used approach to do this is to develop estimates of GDP based on the labour input method. This requires the introduction of a labour force survey in the medium term, which should be given a high priority.
2. In the short term, estimates concerning employment and wages and salaries from the Living Standards Measurement Surveys should be fully-exploited.
3. As a complement to this development, annual meetings should be held with industry experts to provide qualitative assessments of changes to the informal economy adjustments used by INSTAT. Tax audit provides another tool in this regard (assessing changes in the size of the informal sector).
4. * It is essential that the resources and infrastructure are put in place to develop a fully fledged statistical register that includes unincorporated enterprises. INSTAT have already made impressive strides in this respect, setting up a statistical register for incorporated enterprises. This momentum needs to be continued.
5. * Within the GDP estimation process VAT registered enterprises should be identified and treated separately from non VAT registered enterprises. This is important for policy analysis and for quality assurance; using checks between declared VAT payments and expected VAT payments.
6. As far as is statistically possible, imputations for non-surveyed enterprises should be carried out at the 4 digit NACE level broken down into much smaller employment categories than those currently used. Certainly the employment strata for small enterprises should be split into 4: one employee; two employees; three employees and four employees. The same principle of smaller employment strata should also be investigated for medium and large enterprises.
7. Attempts should be made to obtain data on the components of value-added that are not currently separately identifiable: compensation of employees; consumption of fixed capital and operating surplus.
* 12 priority recommendations are marked with an asterisk *.

EXECUTIVE SUMMARY AND KEY POLICY RECOMMENDATIONS
THE INFORMAL ECONOMY IN ALBANIA: ANALYSIS AND POLICY RECOMMENDATIONS - ISBN 92-64-010254 - ©OECD 2005 19
8. * The results in Section 2 suggest that GDP may be overstated. This needs to be fully investigated and a thorough assessment of other components of GDP, such as agricultural value-added, imputed rent and non-market consumption of fixed capital should be conducted at the same time.
9. The role and development of expenditure based estimates in GDP estimation should be increased. On-going plans to develop supply-use tables are welcomed and strongly encouraged.
10. More (and better) resources are needed both human and software systems. A small team (of perhaps 2) is needed to work full time on the estimation of the informal economy. At the same time resources (2) should be made available to allow for the development of expenditure based estimates of GDP and supply-use tables; important tools for GDP exhaustiveness. Commensurate with this a new statistical system will need to be developed, moving the current production process away from the Excel based system that is currently used.
Tax Regime and Tax Administration
11. * The interaction between the SBT, VAT and CIT taxes provides massive scope for tax evasion. There is, therefore, a need to unify the tax system as far as small, medium and large enterprises are concerned, applying a standard tax regime based on Corporate Income Tax and Value Added Tax for all companies above a minimum threshold.
12. * Micro enterprises, which represent the overwhelming majority of enterprises, should still benefit from a simple tax regime, for example, based on a lump sum tax or a fixed rate on turnover as for the SBT.
13. * The threshold should be significantly lower than the current SBT threshold. As a first indication, it is proposed that the threshold should be set between Lek 2 to 3 million (15,750 to 23,500 €), corresponding to the turnover of micro-enterprises with one to 4 employees, in which labour is usually the main input.
14. The progressive extension of the VAT and CIT regime to all companies above the Lek 2-3 million turnover threshold should be timed with a progressive reduction of the effective CIT rate, either by a straight cut in the rate and/or by the introduction of tax deductions and allowances.
15. * The SBT rate at the lower turnover threshold should be set at a rate that removes the distortion at the margin. The marginal tax rate for companies with a turnover just above the threshold should be similar to the marginal rate below the threshold.
16. The government should enter into a process of consultation with representatives of the private sector, particularly of small entrepreneurs and link reductions in the effective CIT tax rate to improved targets of tax compliance for the private enterprise sector, covering both CIT and VAT collection.

EXECUTIVE SUMMARY AND KEY POLICY RECOMMENDATIONS
20 THE INFORMAL ECONOMY IN ALBANIA: ANALYSIS AND POLICY RECOMMENDATIONS - ISBN 92-64-010254 - ©OECD 2005
17. * A reduction in the CIT rate, compared to a combination of various tax measures, has the advantage of sending a clear signal to the private sector and of being simpler to apply.
18. The introduction of VAT for all firms would have significant effects, such as a general price increase. For this reason, the proposed tax regime changes should be implemented gradually, if they are to be effective. Moreover, since the tax revenue generated by the SBT is a key component of local government finance, any lost revenue would have to be compensated for from other sources. The higher levels of tax compliance should allow this to happen.
19. The creation of a set of standard corporate tax payer profiles, based on a number by parameters providing indications on the basic elements that define the tax base (e.g. by turnover and category of enterprise, sector and location), could help the Tax Administration to better target its collection and inspection activities by focusing on the companies that submit tax returns which are not broadly in line with the standard profiles. The set of standard profiles could also reduce the asymmetry of information between the local tax offices and the central tax administration and, if made public, would present companies with a more predictable indication of their tax liabilities. The process leading to the identification of standard corporate tax payer profiles could build on the model already developed in the construction sector in cooperation with the Association of Construction.
20. In order to promote a higher rate of tax compliance among enterprises a number of incentives promoting good behaviour should be considered. Such incentives could consist, for instance, of a system of timely reimbursement of VAT credits, the possibility for enterprises to compensate for liabilities and credits across different types of taxes, including VAT and social security contributions, and a more favourable system of deductions and tax allowances.
21. The unilateral introduction by the government of a generalised tax amnesty to smooth the path towards formalisation is not advisable, given the widespread practice of tax evasion. The amnesty could produce additional tax revenues that could be used, for instance to compensate for the CIT rate cut. On the other hand, it would be difficult to design and implement, absorb a large amount of administrative resources and, unless it forms part of a wider strategy, is unlikely to have lasting effects. An ineffective tax amnesty can dent government credibility and put under question the implementation of the entire formalisation strategy.
22. There is a necessity to develop a more effective tax inspectorate. This body should operate in a transparent and accountable way. It should have strong powers to penalise non compliant companies and to push recurrent non compliant firms out of the market. At the same time, the right to recourse needs to be strengthened and speeded-up.
23. The establishment of a hotline where entrepreneurs and consumers could report non-complying firms to the tax administration could help to curb unfair competition and marginalise companies that do not follow fair business practices.
Social Security Contributions
The social security contributions system in Albania is not sustainable. An estimated 30% of employees in formally registered enterprises are not registered and do not pay any social security contributions (SSCs). Those that pay generally do so at the minimum salary level, thus contributing only minimally to SSCs and PIT. Based on business interviews, entrepreneurs behave in this manner primarily

EXECUTIVE SUMMARY AND KEY POLICY RECOMMENDATIONS
THE INFORMAL ECONOMY IN ALBANIA: ANALYSIS AND POLICY RECOMMENDATIONS - ISBN 92-64-010254 - ©OECD 2005 21
to remain competitive, since “everybody else does it.” Another key reason is that employees lack confidence in the state’s capacity to provide for their future pension and health needs.
24. * The experience of OECD countries suggests that there is a need to further reduce the SSC contribution rates from their high current level, at the same time as seeking to broaden the tax base through the informal economy strategy.
25. * Establish a system of incentives in order to increase the collection rate. The poor SSC collection rate will only be increased if the tax inspectorate has an incentive to do this; over and above performing their existing duties and responsibilities.
26. In line with the IMF’s recommendations on this issue (2001), it is necessary to introduce an effective voluntary third pillar (private pension funds) in relation to pension provision in Albania.
Customs Administration
27. * There is a need to continue VAT collection at the point of customs entry, in order to secure the VAT chain. The analysis illustrates that by breaking the VAT value chain at an early stage, large scale evasion occurs. Currently there is significant scope for tax evasion (VAT, excises and CIT) through such mechanisms as deliberately mislabelling and underestimating the volumes/quantities/costs of imports.
28. The experience of other countries, such as Bulgaria, highlights the effectiveness of an independent inspectorate within the customs administration to ensure that the levels of evasion are significantly reduced.
Regulatory Environment
The report has not dealt directly with the impact of the regulatory environment on the growth of the informal economy. Regulatory environment issues have been analysed in detail in the 2004 Enterprise Policy Performance Assessment for Albania (OECD, EBRD 2004, forthcoming) and a number of policy recommendations have been identified. This area warrants deeper study but there are some specific issues that should be addressed in the short to medium term.
29. Abolish the Tirana District Court registration system and introduce a “one-stop-shop”.
30. Move away from active court approval for company registration and introduce a single registration form and “on-line” registration of enterprises.
31. Introduce a Government approved Action Plan for Reducing Barriers to Business, by supporting the inter-ministerial task force co-ordinated by the Ministry of Economy.
32. Ensure that that the Task Force has adequate resources and staff and is able to conduct effective consultations with the business community.
33. Introduce the principle of “silence is consent” as soon as is practical.

EXECUTIVE SUMMARY AND KEY POLICY RECOMMENDATIONS
22 THE INFORMAL ECONOMY IN ALBANIA: ANALYSIS AND POLICY RECOMMENDATIONS - ISBN 92-64-010254 - ©OECD 2005
NOTES
1 Small enterprise sector is defined here as all enterprises within the manufacturing, trade, transport,
construction, retailing and other business services sectors. This definition does not include all private enterprises since significant activity is generated by private enterprises in other sectors, notably telecommunications and financial services.
2 Total private sector contribution to GDP is estimated at 75% (EBRD, Transition Report, 2004). See also, footnote 1.
3 This includes manufacturing, trade, transport, construction, retailing, other business services, utility, financial services, communications, mining and oil sectors
4 GDP or gross value-added at basic prices, is equal to GDP at market prices excluding taxes less subsidies on products (for example VAT). See the System of National Accounts 1993, paragraph 6.226. In simple terms gross value-added at basic prices reflects the value-added generated and retained by producers.
5 We have not fully investigated the accuracy of agricultural production estimates and indeed other statistics such as the imputation made by national accountants to reflect the rent that home-owners would pay if they rented their properties (see the System of National Accounts 1993, paragraph 6.29, for more information); meaning that there must be some residual uncertainty about the size of GDP more generally.
6 This conclusion is supported by the provisional findings of the EC Twinning Project between INSTAT and ISTAT (Italy) which points to over-estimates of about 11%
7 The corporate tax rate will be reduced to 23% from 1st January 2005.

THE INFORMAL ECONOMY IN ALBANIA: ANALYSIS AND POLICY RECOMMENDATIONS - ISBN 92-64-010254 - ©OECD 2005 23
Chapter 1
ANALYTICAL FRAMEWORK, FOCUS AND STRUCTURE OF THE REPORT
1.1 Introduction
This chapter lays the basis for the detailed analysis that will be carried out in chapter 2 and 3. It starts with presenting a definition of the ‘informal economy’, a term that it is open to a number of interpretations. It continues with a general overview of informal economy issues, looking at what recent economic literature has identified as the main sources of the informal economy.
This general introduction is followed by a review the most recent papers published on the informal economy in Albania, trying to identify the main features of the informal sector and looking at the current estimates of the size of the informal economy in Albania.
The final section provides an overview of the structure of the report.
1.2 Definition of the informal economy
Several terms are commonly used to define what is generally called the informal economy: shadow economy, black economy, underground economy, informal economy, or using a related statistical definition the non-observed economy. The use of this wide variety of terms, often with different conceptual underpinnings, has often resulted in difficulties in interpretation and sometimes misleading comparisons. The OECD Handbook “Measuring the Non-Observed Economy” (2002) provides a comprehensive description of what it refers to as the Non-Observed Economy and fully articulates the types of economic activities which should be included under the OECD’s definition. The Handbook was primarily designed to ensure the exhaustiveness of gross domestic product (GDP) estimates, and so, necessarily encompasses a wider coverage of activities than those central to this report. It includes many activities, for example, that have no tax implications at all however well they are measured. The Handbook definition is described in more detail later.
The definition of the informal economy that is used in this report is unobserved economic and productive, activity that is driven by tax and social security evasion or to avoid complying with certain legal standards and administrative procedures (see also Mirus and Smith, 1997). It is important to note that this definition does not cover all types of tax evasion, or revenue (illegally) foregone by government, since it strictly refers to evasion related to the production of goods and services and so will not for example reflect tax evasion related to capital gains, which is not related to production. The definition also excludes criminal activities (e.g. smuggling, trafficking, etc.) and marginal non taxed activities (such as domestic labour and subsistence farming).

Chapter 1 ANALYTICAL FRAMEWORK, FOCUS AND STRUCTURE OF THE REPORT
24 THE INFORMAL ECONOMY IN ALBANIA: ANALYSIS AND POLICY RECOMMENDATIONS - ISBN 92-64-010254 - ©OECD 2005
Moreover, it is important to differentiate between tax evasion and tax avoidance. The former is the general term for efforts by individuals, firms, trusts and other entities to evade the payment of taxes by breaking the law. Tax evasion usually entails taxpayers deliberately misrepresenting or concealing the true state of their affairs to the tax authorities to reduce their tax liability and includes, in particular, dishonest tax reporting such as under-declaring profits or overstating deductions. By contrast, tax avoidance is the legal exploitation of the tax regime to one’s own advantage, to attempt to reduce the amount of tax that is payable by means that are within the law whilst making a full disclosure of material information to the tax authorities.
The definition of the informal economy chosen reflects the specific focus of this report, which is to investigate the mechanisms or incentives that encourage enterprises to operate informally. In the statistical (national accounting) domain, studies in this area usually attempt to assess the true estimate of gross domestic product (GDP) if all informal (unobserved) activities were recorded. In fact, the issue is more complex than this because as noted above, these studies have generally used a variety of definitions and names to describe this unobserved activity, for example: underground, shadow, black, hidden, informal, etc., and it not always clear how to compare the corresponding estimates, if at all.
Defining the border between the Informal Economy and the Non Observed Economy
Although the parallels between the estimation of GDP and the size of economic activity in the informal sector (as defined above) are related, there are some important differences. One of the key concepts in the national accounts is that of production. The rules that have been developed to determine the scope of what should be included or excluded (referred to as the production boundary) determine the scope of most current and capital transactions in the accounts, and so GDP. Figure 1.1 provides a simple overview of these rules.
Figure 1.1: The GDP Production Boundary
Activities that fall within the production boundary of the national accounts system may, therefore, be summarised as follows:
• The production of all individual or collective goods or services that are supplied to units other than their producers, or intended to be so supplied, including the production of goods or services used up in the process of producing such goods or services.
Are capital, labour or material inputsused to produce goods and services? Yes
Are theyexchangedfor cash oras barter?
YesIncluded in
theproductionboundary
No
Examples: oil in theground; fish in thesea; natural forests.
No
Are theygoods?
No
Are they housingservices provided byowner- occupiers?
Yes
No
Examples: cooking,laundry, caring for
children, homerepairs
Yes
Excludedfrom the
productionboundary

Chapter 1 ANALYTICAL FRAMEWORK, FOCUS AND STRUCTURE OF THE REPORT
THE INFORMAL ECONOMY IN ALBANIA: ANALYSIS AND POLICY RECOMMENDATIONS - ISBN 92-64-010254 - ©OECD 2005 25
• The own-account production of all goods that are retained by their producers for their own final consumption or gross capital formation.
• The own-account production of housing services by owner-occupiers and of domestic and personal services produced by employing paid domestic staff.
• their household production that should be included, whether or not for own final use, include:
− The production of agricultural products and their subsequent storage; the gathering of berries or other uncultivated crops; forestry; wood-cutting and the collection of firewood; hunting and fishing.
− The production of other primary products such as mining salt, cutting peat, the supply of water, etc.
− The processing of agricultural products; the production of grain by threshing; the production of flour by milling; the curing of skins and the production of leather; the production and preservation of meat and fish products; the preservation of fruit by drying, bottling, etc.; the production of dairy products such as butter or cheese; the production of beer, wine, or spirits; the production of baskets or mats; etc.
− Other kinds of processing such as weaving cloth; dress making and tailoring; the production of footwear; the production of pottery, utensils or durables; making furniture or furnishings, etc.
Clearly, the direct consequences on government revenues of wrongly estimating any of these activities differ depending on the activity that is being estimated. One of the most important in this context is the production of housing services provided by owner-occupiers. This activity is purely imputed and, although important for GDP estimation, amounting to 6.5% in Albania in 2001, based on official statistics, (compared to between 3 and 6 % in OECD countries) it has little or no significance for taxes. Another important activity, particularly for Albania, is agricultural production by households. Much of this, especially in Albania, is subsistence related with most production being consumed by the producers. Indeed for Albania, agricultural production as a whole, impacts only marginally on government revenues, since most production is by households and, where market activities do occur, they incur no VAT. This matters since most attempts to estimate GDP exhaustively, whether referred to as underground, hidden, shadow, etc. include some assessment of these activities.
The OECD Handbook “Measuring the Non-Observed Economy” (2002) provides a comprehensive description of the non-observed economy, which is defined as consisting of five groups of activities:
• Underground production1, defined as those activities that are productive and legal but are deliberately concealed from public authorities to avoid payment of taxes or compliance with regulations.
• Illegal production, defined as those productive activities that generate goods and services forbidden by law or that are unlawful when carried out by unauthorised procedures.
• Informal sector production, defined as those productive activities conducted by unincorporated enterprises in the household sector or other units that are unregistered and/or less than a specified size in terms of employment, and that have some market production.
• Production of households for own-final use, defined as those productive activities that result in goods or services consumed or capitalised by the households that produced them.
• Statistical underground, defined as all productive activities that should be accounted for in basic data collection programmes but are missed due to deficiencies in the statistical system.

Chapter 1 ANALYTICAL FRAMEWORK, FOCUS AND STRUCTURE OF THE REPORT
26 THE INFORMAL ECONOMY IN ALBANIA: ANALYSIS AND POLICY RECOMMENDATIONS - ISBN 92-64-010254 - ©OECD 2005
It is important to stress, however, that non-observed does not mean not measured. Government statisticians have over the years developed a wide range of methods to estimate the non-observed economy and so all countries are likely to record at least some of the non-observed economy in official estimates of GDP, as is also the case in Albania, as will be shown later. For example, a significant component of households’ production for own final use is the imputed rent of owner-occupiers, where a long history of estimation methods exists. It is also important to stress that the OECD definition of the informal sector is based on the definition adopted at the 15th International Conference of Labour Statisticians and differs from the definition of the informal sector used in this report. Although the two entities are related, they are not the same.
Although all of these components of the non-observed economy are important for GDP purposes, two are of particular relevance in the context of this report: these are underground and informal sector production, which correspond closely to our definition of the informal economy. The Venn diagram2 in Figure 1.2 illustrates the relationship between the non-observed economy (NOE) and our definition of the informal economy (shaded) from a production perspective. To avoid unnecessary complication the statistical underground is shown in the diagram but it cuts across both the underground and informal sectors (taxable and non taxable components).
Figure 1.2: Relationship between the NOE and Evasive Activities
1.3 The informal economy in Albania: possible sources, main features and current estimates
1.3.1 Sources of the informal economy: a general overview
Almost all of the literature highlights the importance of the following key factor in the establishment and growth of the informal economy:
• High intensity of legal and administrative regulations: the greater the intensity of regulations such as business registration, license and permit requirements, labour market

Chapter 1 ANALYTICAL FRAMEWORK, FOCUS AND STRUCTURE OF THE REPORT
THE INFORMAL ECONOMY IN ALBANIA: ANALYSIS AND POLICY RECOMMENDATIONS - ISBN 92-64-010254 - ©OECD 2005 27
restrictions, trade barriers, etc, the greater the incentive for flight into the informal economy. Research also suggests that law enforcement, not just the intensity of regulations, may be a key issue.
• High overall tax and social security burdens: basically, the higher the difference between the total cost of labour in the official economy and after tax earnings from work, the greater the incentive for flight operation in the informal economy.
• Lack of trust in official institutions / administrative corruption: examples of such corruption include the court system, unclear legislation and bureaucracy.
• Lack of access to formal property systems: this refers to the lack of clear property rights and title deeds and the inability to collateralise property assets. This obstructs firms’ access to official financial institutions such as credit lines, insurance, etc.
• Long-term decline in civic virtue and loyalty towards public institutions, combined with a decline in tax morale.
• Broad acceptance of illicit work often sanctioned or tolerated by the state.
(Ernste, 2003, p.91; Djankov et al, 2002; De Soto, 2000)
In a comprehensive literature review, Ernste (2003) argues that since taxes affect labour-leisure choices and stimulate labour supply in the informal economy, the distorting effect of this choice is a major concern, leading to the conclusion that the bigger the difference between the total costs of labour in the official economy and the after-tax earnings from work, the greater the incentive to avoid the difference and work in the informal economy. This difference depends largely on the social security system and the tax burden, which is the main focus of this report since it has the merit of allowing it to be measured and including activities which could be harnessed by the formal sector.
1.3.2 Main features of the informal economy in Albania: a review of previous research
Private sector development has been fairly vigorous in the recent past in Albania. GDP growth has been fairly steady at 6% per annum (IMF, 2004), fuelled by expansion in sectors such as construction, transportation and services. As a result, the share of private sector activity is among the highest in the SEE region, at 75% of GDP (EBRD, 2003).
Despite this performance, recent studies have pointed out that the business environment remains extremely difficult in Albania (OECD-EBRD, 2003; FIAS, 2003; OECD-EBRD-EC/ DG Enterprise and Industry, 2004, etc.), especially in the case of small enterprises. The difficulties include significant bureaucratic and administrative barriers (such as entry barriers such as registration procedures and costs, licensing and permits problems, etc.), a high tax burden and a cumbersome tax administration, etc.
The above represent obstacles to doing business which discourage formality, but in addition, the issue of bribery and corruption is particularly noteworthy in Albania (see Fries et al, 2003). Bribery (i.e. the proportion of firms that frequently bribe public officials to obtain licenses or permits and/or to avoid safety and other inspections) is only exceeded in a few countries in the South East European (SEE) region, such as fYR Macedonia, Bosnia and Herzegovina, and Serbia and Montenegro. The “time tax” (i.e. the proportion of senior managements’ working time spent dealing with public officials) is also more

Chapter 1 ANALYTICAL FRAMEWORK, FOCUS AND STRUCTURE OF THE REPORT
28 THE INFORMAL ECONOMY IN ALBANIA: ANALYSIS AND POLICY RECOMMENDATIONS - ISBN 92-64-010254 - ©OECD 2005
severe than in any other SEE transition country, thus providing a strong incentive for firms to avoid any form of bureaucracy and taxation possible.
Turning to the nature of the informal economy, Ruli (2003) points out that private economic activity was banned by law until 1990, which means that the informal economy has grown very rapidly to current levels. Gerxhani (1988, p.3) argues that the economic crisis during the period 1990 – 1992 was crucial in that the “problems of high unemployment, poverty and social insecurity created by economic disaster were extremely severe.” This has undoubtedly acted as a strong impulse for people to respond creatively to their difficulties by participating in the informal economy.
Ruli argues that although informality runs deep, its nature varies according to certain main forms (2003):
• The activity of rural farmers, which accounts for 50% of GDP but does not contribute to tax and social security since this is legally exempted by Government.
• The micro businesses owned by individuals or families, which are mainly temporary and generally unregistered.
• Registered SMEs, operating at various levels of formality.
• Illegal and criminal activities, sometimes disguised as legal businesses.
Of all these, Ruli argues: “The most worrying occurrence of informality in the fiscal area lies in the zone of small, medium or large businesses which are duly registered, but hide their turnover, profits, number of employees and real wages. It is precisely these kinds of businesses, which account for the largest part of the country’s economic activities.” (2003, p.245), with the trade (especially retail), transportation (goods and passengers), services (such as bars and restaurants), construction and production activities highlighted as being particularly important in terms of informal economy (see also Table 2.4).
A survey undertaken in Albania by ACER (1999) illustrates the nature of fiscal evasion, from a company perspective:
• 75% of firms stated that fiscal evasion occurs “very frequently”.
• 73% stated that they hide their real profits (20% on average before taxes).
• 94% of the evasion is caused by the existing tax system and policies.
The structural nature of enterprises in Albania also plays a role in relation to the informal economy. Muco et al (2004), analysing data from the Administrative Register (activities registered with the fiscal and legal authorities) and the Statistical Data (business surveys), note that the typical Albanian enterprise may be characterised as being very small, reflecting the predominance of agricultural activities in the economy and the decline in importance of large, state owned enterprises. 94.7% of firms employ 33% of employees in firms of 1-4 employees. In other words, one-third of employees work in family businesses. They also note that the bigger the firm, the fewer the number of registered employees and that, between 1998 and 2002, total employment shrunk at the same time as the number of firms was expanding. Table 1.1 provides an overview of the development in terms of enterprises and employees during the period 1998 – 2002.

Chapter 1 ANALYTICAL FRAMEWORK, FOCUS AND STRUCTURE OF THE REPORT
THE INFORMAL ECONOMY IN ALBANIA: ANALYSIS AND POLICY RECOMMENDATIONS - ISBN 92-64-010254 - ©OECD 2005 29
Table 1.1: Number of Firms and Employees According to Size (1998-2002)
Number of Employees
Firms 1998
Employees 1998
Firms 1999
Employees 1999
Firms 2000
Employees 2000
Firms 2001
Employees 2001
Firms 2002
Employees 2002
1-4 49135 62899 49183 62524 53583 67344 50131 61995 53484 66747
5-9 1061 6747 1034 6598 1544 9167 1777 10536 1519 9531
10-19 534 6756 515 6711 555 7197 530 6978 636 8457
20-49 335 10230 368 11353 367 11258 381 11883 410 12465
50 + 463 124006 444 118189 453 109755 411 104043 425 104123
Total 51528 210638 51544 205375 56502 204721 53230 195435 56474 201323
Source: Statistical Data from Muco et al, 2004
An analysis of the labour market situation reveals that despite a young population structure, an analysis of the last ten years reveals a reduction in the labour force due in large measure to significant levels of emigration, mainly to Greece and Italy (see Muco et al, 2004). Migration from the rural areas to the cities, especially Tirana, has been a notable feature. Small plots, low levels of productivity and subsistence incomes have fuelled the desire to emigrate and immigrate. At the same time, the collapse of public employment has resulted in high levels of unemployment (about 16%), despite a notable increase in private, non-agricultural sector employment.
These trends are rapidly changing the socio-economic profile of the country. In the short term, emigration continues to have positive effects, such as the continuing high levels of remittances from those living and working abroad, which play a significant role in macro-economic stability as well as investment (including in enterprises), injection of know-how, support to the standards of living and alleviation of poverty. At the same time, remittances fuel the informal economy since they are typically channelled outside of the commercial banking system, which complicates detection of size and impact.
1.3.3 Current estimates of the informal economy in Albania
As a consequence of the issues previously discussed, many Albanian businesses choose to avoid these difficulties by either operating fully or partly in the informal economy. A number of studies have sought to estimate the size of the Albanian informal economy, as illustrated in Table 1.2 below.
Table 1.2: Estimates of the Size of the informal economy in Albania
Source Estimate (% of GDP) ACER (1999) 30% INSTAT (2004), for GDP in 2002 25% Schneider (2002) 33% Ruli (2003) 30%-45% Christie & Holzner (2003) 51% IMF (2003) 30%-50%+ Muco et al (2004) 30%-60%
Various methods have been utilised to estimate the size of the informal economy such as
discrepancies in the national accounts, fluctuations in currency outside the banking system, changes in the use of electricity as a proxy for real economic activity, etc. The above estimates are not directly comparable or problem free, not least because of the severe data limitations (see also Section 2), but they

Chapter 1 ANALYTICAL FRAMEWORK, FOCUS AND STRUCTURE OF THE REPORT
30 THE INFORMAL ECONOMY IN ALBANIA: ANALYSIS AND POLICY RECOMMENDATIONS - ISBN 92-64-010254 - ©OECD 2005
conclude that the informal economy accounts for 30% - 60% of GDP in Albania, with more recent estimates clustering at the higher end of the range. Chapter 2 sets out the estimates made by the OECD and the Vienna Institute for International Economic Studies respectively.
It is widely recognised that the informal economy has certain positive features, such as generating a vibrant and entrepreneurial business sector, being a significant source of employment and operating as a major force in counteracting poverty by acting as a safety net. De Soto makes a powerful case that the informal economy is a rational response to the inability of the state to satisfy basic human needs (housing, employment, transport, etc.), with the result that many people are forced to renounce legality since the costs of abiding by the law exceed the benefits (1989 and 2000).
An informal sector above 30% of GDP implies major negative consequences for the level of tax revenues, public services, unfair competition (for businesses complying with the tax requirements) and generally for the development of a transparent and functioning market economy, which is essential if Albania is to achieve accession to the European Union and sustainable economic development more generally.
1.4 Focus and structure of the report
The Government of Albanian (2001) considers tackling the informal economy to be an important policy priority, highlighting the necessity to increase budget revenues by expanding the taxable base and reducing the informal economy. In this context, the Ministry of Economy (MoE) is seeking assistance to develop a consistent and comprehensive analytical framework so as to better understand the size and the dynamic of the informal economy, as well as the mechanisms behind the rapid growth of the informal sector.
The Ministry of Economy has made request to the OECD for assistance with the following issues:
• Estimate the size, dynamics and the sector concentration of the informal economy, taking into consideration previous regional studies and the work already conducted by the National Institute of Statistics (INSTAT) and the IMF.
• Assist INSTAT to improve its methods of informal economy estimation and its capacity to improve its observation of the sector.
• Analyse the factors behind the growth of the informal economy and, most importantly, to identify policy recommendations for the progressive formalisation of the informal sector.
In providing a response to these requests, the analysis is structured in two main sections:
• Chapter 2 is dedicated to the assessment of the Statistical System, focusing on : statistical analysis, including informal economy estimates, and macro-economic issues;
• Chapter 3 looks at the impact of the tax and social contribution regime on company behaviour.
However, in order simplify the reading of the report, the policy recommendations and the key inputs for the elaboration of a strategy by the Albanian Government for harnessing the informal economy are presented in the Executive Summary.

Chapter 1 ANALYTICAL FRAMEWORK, FOCUS AND STRUCTURE OF THE REPORT
THE INFORMAL ECONOMY IN ALBANIA: ANALYSIS AND POLICY RECOMMENDATIONS - ISBN 92-64-010254 - ©OECD 2005 31
In line with the definition of the informal economy adopted in section 1.2, the report focuses mainly on issues related to the tax and the social contribution regimes. Less space has been instead devoted to regulatory environment issues, which are reviewed more in detail in the Enterprise Policy Performance Assessment Report for Albania (OECD-EBRD 2004, Regulatory Governance in South East European Countries; Progress and Challenges, OECD 2004). The business interviews and the EPPA focus group discussions have indicated that in the case of Albania, regulatory issues such as company registration procedures, licences and permits, are costly and cumbersome, but they do not carry the same weight as the tax and social contribution regimes in determining the growth and the dynamic of the informal economy.
In the final section we have included a selected number of policy recommendations (taken from the 2004 EPPA report) related to regulatory issues.
NOTES
1 The definition of underground production is, literally, identical to the definition of informal economy
used in this report. The decision to describe underground production as informal activities in this report is however deliberate. In practice what is included in underground production can be affected by what is included in the informal sector (NOE handbook definition). In short there are potentially large overlaps between the two, depending on the prevalence of small enterprises within an economy – and, so, estimates for underground production may not always reflect the totality of production that is evasive; whatever the reasons. This overlap is not unintentional however and is explicitly recognised in the Handbook, which is why it refers to NOE areas not components. In Albania, where the majority of enterprises are arguably in the informal sector, (as defined in the NOE handbook), this overlap could be problematic.
2 Note that the diagram specifically relates to Albania and cannot be generalised for all countries. Note also that, strictly speaking, the shaded area is not exactly the same as our definition of the informal economy since underground production would not include the value-added of incorporated enterprises that correctly declare their output to the statistical authorities but not the tax authorities. However, this is an extremely unlikely outcome and so we have chosen to ignore it in the presentation above. The overlaps between illegal activities and underground and informal production are more theoretical than real but in any case do not include activities strictly forbidden by law irrespective of the producer (such as drugs production and, prostitution).


THE INFORMAL ECONOMY IN ALBANIA: ANALYSIS AND POLICY RECOMMENDATIONS - ISBN 92-64-010254 - ©OECD 2005 33
Chapter 2
ASSESSMENT OF THE STATISTICAL SYSTEM
2.1 Introduction
This is not the first assessment of the Albanian Statistical System to have been undertaken in recent years. A number of observers have made comments on the statistical system and the quality of GDP estimates, particularly with regards to the size of the non-observed economy; as shown in Table 1.1. One of the more recent comprehensive assessments was conducted in July 2001 by Heinrich Brungger from the Swiss Federal Statistical Office under a contractual arrangement between INSTAT and Eurostat. This assessment investigated the statistical system as a whole, including institutional aspects, the laws governing statistics, and the capacity of the statistical system and its main actors to provide, in a sustainable way, timely, accurate, authoritative and relevant information to users. This report included a number of recommendations, some short term, many of which have been implemented, and some of a longer term nature, many of which remain to be implemented; reflecting in part the fact that they are dependent on other factors, such as additional resources. At present only 7 people currently work on the National Accounts in INSTAT; certainly this acts as an impediment to what can currently be achieved. The OECD fully endorses the main conclusions from this report and encourages progress to continue in delivering the longer term improvements envisaged in the recommendations.
This assessment differs from that carried out by Brungger in that it focuses primarily on the measurement of the informal sector. As stated earlier in this report, this is a more restrictive definition than the non-observed economy; a full assessment of which is not attempted below. Such an assessment would require an evaluation of a number of economic statistics and methodologies; for example, evaluations of the contribution to GDP made by: illegal activities (e.g. drugs and prostitution); agricultural production (particularly by households); income in kind (e.g. tips or non-cash remuneration); consumption of fixed capital by government; and the methods used to estimate the imputations for owner-occupied dwellings. None of these areas, however, currently impact on tax revenues (under current legislation) and so, given the time available to conduct this study, and the focus on the informal sector, the deliberations and findings are largely centred on the informal economy (as defined in Section 1).
Four main sub-sections are included in this Chapter. The first summarily reviews the methodology and data sources currently used to estimate GDP, presenting alternative estimates of gross value-added derived using different assumptions for enterprises not captured in sampling or in the VAT inquiry data. A more detailed description is included as Annex A. The second section presents estimates of household tax evasion using statistics on household expenditure and income and identities between the two, see also Annex E. The third section draws some general conclusions relating to the estimation of informal activity and GDP, and the last section lists in full the recommendations.

Chapter 2 ASSESSMENT OF THE STATISTICAL SYSTEM
34 THE INFORMAL ECONOMY IN ALBANIA: ANALYSIS AND POLICY RECOMMENDATIONS - ISBN 92-64-010254 - ©OECD 2005
Before continuing a few introductory comments are necessary. The first is to thank and recognise the important assistance of INSTAT in developing this work and for providing the data sources and time that allowed the evaluation to take place; without which none of the following would have been possible. The second is to make clear that any recommendations or comments made below should not be interpreted as criticisms of INSTAT. Indeed the opposite is closer to the truth. Developing statistical systems takes time, and in this respect INSTAT have come a very long way in a very short time. The fact that it is possible to assess INSTAT’s adjustments for the informal economy (and the NOE) is in itself creditable, since many countries make no adjustments at all specifically for the NOE.
2.2 Assessing and Estimating GDP
The detailed results and analysis of the GDP estimation system, data sources and methodology are included in annex A. This section summarises the main findings.
2.2.1 An overview of the GDP estimation process
INSTAT estimate GDP using a production based approach. This uses data from a variety of sources, agricultural statistics, government data, VAT inquiry data, annual structural business surveys and estimates of enterprises registered on INSTAT’s nascent statistical business register. INSTAT prepare their accounts by identifying 25 sectors in the economy (listed in Annex B). Of these, adjustments for informal activity are made in 14 sectors, mainly manufacturing (excluding petroleum refining) and business services (see also Table 2.1 below).
These adjustments cover the informal activity of registered, tax-paying, enterprises but who engage in some level of informal production and purely informal enterprises that pay no taxes at all and so are completely underground. Figure 2.1 below shows the contribution made by each sector of the economy to gross value added, as estimated by INSTAT for 2002. It shows that agriculture is still an important source of production and income in Albania (although much of the income generated is subsistence related; that is, imputed to reflect the production of rural households engaged in production of agricultural products for their own consumption.) Estimates for informal production are made in the transport, other business services, trade, hotels and catering sectors (referred to as ‘other services’ in Figure 2.1 below) and in the manufacturing (excluding petroleum refining) and construction sectors. These sectors (collectively referred to as the PFPI sector) were estimated to contribute just over half (52%) of gross value-added in 2002.
Investigations suggest that the focus of INSTAT on these key sectors is the correct approach. Certainly the feedback from meetings with different government departments and small businesses suggest that informal activity is significant in some key sectors. For example, officials at the Labour Ministry believe that at least 30% of labour is unregistered, which is likely to be a lower bound, since inspections are never likely to discover all evasion; particularly in completely informal enterprises, for example those where production takes place at home.
However, as shown below, we believe that some improvements to the GDP estimation process can be made both in the short and longer term: resources permitting. Not all of the findings are included in this summary section; although the recommendations and conclusions are exhaustive, only the findings that have a considerable measurable impact on GDP and informal economy estimation are described below. Some findings, for example, point to improvements in the quality of GDP estimates but with no obvious directional bias. For a full description of these, readers are referred to Annex A.

Chapter 2 ASSESSMENT OF THE STATISTICAL SYSTEM
THE INFORMAL ECONOMY IN ALBANIA: ANALYSIS AND POLICY RECOMMENDATIONS - ISBN 92-64-010254 - ©OECD 2005 35
Figure 2.1: Gross Value-Added in Albania in 2002, %.
Informal Activity is estimated by INSTAT and is significant
It is difficult to over-emphasise the point that INSTAT do make adjustments for informal activity since it became clear during the course of investigations that many commentators on the Albanian economy were not aware of this.
Official estimates by INSTAT put gross value-added in 2002 at Lek 562 billion, 27.9% of which reflects adjustments made by INSTAT to capture informal activity. As stated above these adjustments are made to those sectors of the economy where informal activity is generally understood to occur, so, for example, no adjustments are made to the public, communications, energy, or agricultural sectors. In the sectors where adjustments are made, formal activity is estimated at 24.1% of gross value-added (Table 2.1); meaning that in the current official estimates of gross value-added produced by INSTAT informal production is 1.2 times as large as formal production in these sectors as a whole (PFPI) in 2002.
Agriculture and Fishing, 26.0
Mining, Quarrying, petroleum refining,
Energy and Water, 2.3 ,
Communication and Financial Services, 6.9
Public Administration, health and education,
8.2 FISIM, -3.4
Inputed Rent, 7.9
Other Services, 36.0
Manufacturing ex petroleum refining, 8.2
Construction, 7.8

Chapter 2 ASSESSMENT OF THE STATISTICAL SYSTEM
36 THE INFORMAL ECONOMY IN ALBANIA: ANALYSIS AND POLICY RECOMMENDATIONS - ISBN 92-64-010254 - ©OECD 2005
Notes: (a) Excludes the imputation for owner occupied dwellings.
But the official estimates of informal activity are lower than generally understood
However investigations in this study into the GDP estimation process used by INSTAT suggests that this is not quite the full picture. A large part of formal activity is estimated using imputations. This assessment concludes that these imputations include a formal and an informal part, not just formal activity, (see Annex A, section A.3.2 for a fuller exposition). And, so, it appears, for given estimate of GDP, that the estimates quoted above over-estimate formal activity and under-estimate informal activity. It is estimated that the current official estimates of gross value-added in 2001 reflect 15.5% formal activity and 36.0% informal activity (Table 2.2); again looking only at those sectors where informal activity is believed to occur. The figures are of a similar magnitude for 2002 data. The ratio of informal to formal activity (2.3) based on these estimates is extra-ordinarily high, and certainly much higher than is commonly thought, (see also Annex A, Section A.3.3 which compares INSTAT adjustments against estimates of informal activity observed in company data).
This suggests that the current estimates of informal activity and of gross value-added may be too high in these sectors. It cannot be stated with certainty whether this is the case for total economy gross value-added as this study has generally focused on those economic areas where tax evasion occurs. For example, the study has not attempted to measure illegal activity or indeed corruption, which in some cases can also be productive (in an economic sense), and studies indicate that corruption is significant in Albania compared to other countries in the region. Moreover, this study has largely concentrated on one particular aspect of GDP, the informal sector. Other components of GDP that have not been investigated in this study may be higher, for example agricultural output, imputed rent and government consumption of fixed capital.
Table 2.1: Gross Value-Added by Sector – Official Estimates – % of GVA (2001, 2002)
2002 2001
% of GVA % of GVA
Formal Informal
Ratio: Informal –
Formal Formal Informal
Ratio: Informal – Formal
Cereal Products 0.2 0.4 1.7 0.2 0.4 1.7 Other food 0.5 0.5 1.1 0.5 0.5 1.1 Textiles, leather 1.2 0.9 0.7 1.3 1.0 0.7 Wood, paper, furniture 0.6 0.9 1.4 0.6 0.8 1.4 Chemicals 0.2 0.2 1.2 0.2 0.2 1.2 Non-metallic & mineral products 0.5 0.6 1.1 0.5 0.5 1.1 Metals 0.6 0.8 1.4 0.5 0.8 1.4 Machinery & equipment 0.1 0.1 0.5 0.1 0.1 0.5 Construction 3.3 4.5 1.4 3.4 5.1 1.4 Trade 9.3 9.0 1.0 9.1 8.3 1.0 Hotel & catering 1.7 1.9 1.1 1.2 1.4 1.1 Transport 3.4 4.7 1.4 4.1 5.2 1.4 Real estate, renting, business services(a) 1.6 2.4 1.5 1.1 1.7 1.5 Other Community etc 1.0 1.2 1.2 1.2 1.4 1.2 Total 24.1 27.9 1.2 24.1 27.4 1.1

Chapter 2 ASSESSMENT OF THE STATISTICAL SYSTEM
THE INFORMAL ECONOMY IN ALBANIA: ANALYSIS AND POLICY RECOMMENDATIONS - ISBN 92-64-010254 - ©OECD 2005 37
Notes: (a) Excludes the imputation for owner occupied dwellings.
2.2.2 Simulated gross value-added
That all said, the available evidence does point in the direction of lower estimates of GVA. In Annex A, section A.3.4 an alternative estimate of gross value-added is calculated (called simulated gross value-added).
Irrespective of where the line is drawn between informal and formal estimates, the current INSTAT process, in effect, assumes that small non-sampled enterprises have the same average turnover as all sampled enterprises. As explained below, this is very unlikely.
As shown in Annex A, sampled enterprises include all VAT registered enterprises (those that declare turnovers with more than Lek 8 million) whereas un-sampled enterprises, and where imputations are made, in theory, do not. Some of these VAT registered small enterprises have very large turnovers that can significantly impact on average turnovers used for imputation; producing averages many times the median turnover in the sector in some cases (see also Table A.13). It is extremely unlikely that enterprises with turnovers of this magnitude will go unnoticed by the authorities and, so, clearly, the probability of any enterprise not registering for VAT diminishes in line with their turnover. This holds whether they operate completely informally or partly informally, that is, register as a small business declaring a turnover below the Lek 8 million VAT threshold.
The company data provided by a financial institution in Albania suggests that in practice enterprises not registered for VAT are unlikely to have turnovers above Lek 40 million. As such this study estimates of simulated gross value added recalculate the contribution made by small enterprises that are registered on the statistical register, but that are not sampled or registered for VAT, by assuming that they have the same distribution of (and average) turnover as those small enterprises with less then Lek 40 million that are sampled and VAT registered.
This produces an estimate of (simulated) gross value-added of Lek 491 billion; Lek 71 billion lower than current official estimates, a reduction of nearly 13%. Once again, caveats relating to the possibility that other areas of activity such as agriculture may be currently under-estimated must be recalled in this
Table 2.2: Recalibrated formal/informal activity – % GVA, 2001
% of GVA
Formal Informal
Ratio: Informal – Formal
Cereal Products 0.2 0.4 2.1 Other food 0.4 0.6 1.4 Textiles, leather 1.1 1.2 1.1 Wood, paper, furniture 0.5 0.9 2.0 Chemicals 0.2 0.3 1.5 Non-metallic & mineral products 0.5 0.6 1.2 Metals 0.4 0.9 2.5 Machinery & equipment 0.1 0.1 0.7 Construction 3.3 5.3 1.6 Trade 4.7 12.7 2.7 Hotel & catering 0.9 1.7 1.8 Transport 2.1 7.2 3.5 Real estate, renting, business services (a) 0.6 2.2 3.4 Other Community etc 0.6 2.0 3.2 Total 15.5 36.0 2.3

Chapter 2 ASSESSMENT OF THE STATISTICAL SYSTEM
38 THE INFORMAL ECONOMY IN ALBANIA: ANALYSIS AND POLICY RECOMMENDATIONS - ISBN 92-64-010254 - ©OECD 2005
context but it is interesting to note that provisional results from the Twinning Project (see below), using Labour based estimates of activity are broadly in line with this finding of lower GDP. The size of the informal sector using this alternative (simulated) approach for GVA is still significant (26.6%) however, and, is 1.4 times the size of the formal sector in those sectors where informal activities tend to occur (Table 2.3).
Notes: (a) Excludes the imputation for owner occupied dwellings.
2.2.3 Trade Statistics (see also Annex A, section A.2)
Because GDP is estimated using a production approach, any mismeasurement of imports or exports will not, on its own, affect the GDP estimates. Nevertheless trade data do form an important input into expenditure based approaches of GDP, and evasion related to imports and (less so) exports is thought to make a significant contribution to the informal economy, both directly and indirectly (through competition, see Section 3). As such the quality of the statistics in this area requires some investigation, and is covered in detail in Annex A. The paragraph below briefly summarises the main points.
A comparison of import data with customs and excise duties and VAT collected on imports reveals a very low effective VAT rate (11-12%) and considerable scope to reduce other tax payments by misclassifying imported goods to lower customs and excise categories, (see Annex A, Table A.5). Of course, a number of exemptions are applicable in the case of VAT, and so it is not altogether surprising that the effective VAT rate is lower than the rate of VAT (20%). But the difference suggests a level of exemptions that is arguably too high to be credible. If for example as much as 20% of all imports were exempted from VAT this would still result in Lek 5 billion more VAT than is currently collected at the customs’ border (an increase of nearly 20%).
2.2.4 Labour Input Methods
An alternative way to calculate estimates of gross value-added, recommended by Eurostat1 (the Statistical arm of the European Commission), is to compare employment data from demographic sources,
Table 2.3: Formal and Informal Activity by Sector – Simulated estimates - % of GVA
2002 2001
% of GVA % of GVA
Formal Informal
Ratio: Informal – Formal Formal Informal
Ratio: Informal – Formal
Cereal Products 0.2 0.4 2.0 0.2 0.4 2.0 Other food 0.5 0.6 1.2 0.5 0.6 1.2 Textiles, leather 1.1 1.0 0.9 1.3 1.1 0.9 Wood, paper, furniture 0.6 0.9 1.6 0.5 0.9 1.6 Chemicals 0.2 0.3 1.7 0.2 0.3 1.7 Non-metallic & mineral products 0.5 0.7 1.3 0.5 0.7 1.3 Metals 0.5 0.9 1.8 0.4 0.7 1.8 Machinery & equipment 0.1 0.1 0.8 0.1 0.1 0.8 Construction 3.6 6.4 1.7 3.8 6.6 1.7 Trade 5.6 7.0 1.3 5.5 6.9 1.3 Hotel & catering 1.5 2.0 1.4 1.1 1.5 1.4 Transport 2.0 2.9 1.4 2.4 3.4 1.4 Real estate, renting, business services(a) 1.4 2.8 2.0 1.0 2.0 2.0 Other Community etc 0.6 0.6 1.0 0.7 0.8 1.0 Total 18.4 26.6 1.4 18.3 26.0 1.4

Chapter 2 ASSESSMENT OF THE STATISTICAL SYSTEM
THE INFORMAL ECONOMY IN ALBANIA: ANALYSIS AND POLICY RECOMMENDATIONS - ISBN 92-64-010254 - ©OECD 2005 39
such as a Labour Force Survey, against employment data underlying gross value-added estimates. This is commonly known as the Labour Input method2. Although the method is recommended as a means to check GDP estimates, some countries, such as Italy, use the method to estimate gross value-added directly in some industries.
Unfortunately, the data that is needed to carry out this assessment is only partially available. However, it is possible to produce an alternative estimate of GVA based on the assumption that the value-added per employee of employees working in sampled enterprises is the same as those working in non-sampled enterprises (for each industry and size). Estimates, kindly provided by Luca Pappalardo of the Twinning Project, show that gross value-added estimates are about 11% lower than current estimates using this approach (see also Annex A, Table A.16 and section A.3.5). This is broadly in line with the message that emerges from the (simulated) estimates above.
2.2.5 Tax Audit Data
Another approach to evaluate the size of the informal sector is to use tax-audit data. This approach has been used by INSEE (the French Statistical Office) and is described in Calzaroni and Madelin (2000).
The Tax Inspectorate in Albania provided data on the total number of inspections and on the number of inspections that resulted in the imposition of fines, including data on the value of unpaid taxes and the value of the fine imposed (if any), (see Annex A, Table A.17 and section A.3.6). An analysis of this data points to significantly lower levels of evasion than in any of the estimates referred to above (about 25% of the size of simulated GVA estimates for example). It seems more likely however, that the audit based figures demonstrate the ability of enterprises to conceal activity, even after being audited, and/or they give some indication as to the possible size of corruption, (see also Section 3). This limits the current scope for using audit data to arrive at an independent estimate of informal activity but the possibility of using the approach above (preferably at the industry level) to assess possible changes over-time in the size of informality should not be ruled-out.
2.3 Estimates of Household Tax Compliance in Albania
This section presents a summary of the work “Household Tax Compliance in Albania” conducted by Edward Christie and Mario Holzner, both economists at the Vienna Institute for International Economic Studies (WIIW) for this study. The contribution of the WIIW complements other areas of this report, but it is important to stress that it is not an attempt to measure GDP exhaustively. Instead it concerns the measurement of tax compliance in the household sector, which is a connected issue, as it touches on the consequences of having a large informal economy.
The approach used by WIIW and presented in Annex E constructs estimates of the compliance rates for personal income tax, compulsory employee social security contributions, VAT and excise tax. Using sensitivity analyses the results are presented as ranges, rather than point estimates. The findings are aggregated to provide an overall estimate of the total undeclared household income for each available year, allowing comparisons between Albania and other countries in Southeast Europe. The main findings are presented below for the four types of tax. The full results, including the sensitivity analysis and the international comparison can be found in the report itself. In each case, a description of the methodology used is not given but can be found in Annex E.

Chapter 2 ASSESSMENT OF THE STATISTICAL SYSTEM
40 THE INFORMAL ECONOMY IN ALBANIA: ANALYSIS AND POLICY RECOMMENDATIONS - ISBN 92-64-010254 - ©OECD 2005
2.3.1 Personal Income Tax and Social Security Contribution Compliance
The results for social security compliance are as shown in Table 2.4.
Table 2.4: Social Security Compliance Rates
Year SSC Base Total SSC Liability As a share of SSC base SSC Revenue Compliance Rate 2003 358443 29956 8.4% 7648 26%
2002 320974 26963 8.4% 6586 24%
2001 246971 14781 6.0% 5737 39%
2000 181913 13432 7.4% 5112 38%
1999 206363 14017 6.8% 4628 33%
1998 182507 13449 7.4% 4035 30%
Note: All monetary amounts are expressed in millions of Lek at current prices.
What is noteworthy about the results above is the inverted U-shape of the compliance rate across time. The decisive change came when policy changes were introduced that changed the upper bound for the individual social security base to five times the level of the lower bound, rather than three times the level, as had previously been the case. This change provoked a jump in the SSC liability from around Lek 14 billion for 1998-2001 to about double that for 2002 and 2003. From the table, however, it is clear that the increase in collected revenues was only gradual and fell far short of doubling. One possible explanation for this is a disconnect between individual liabilities and the contribution collection process, possibly reflecting the fact that staff responsible for collecting contributions react only weakly to changes in the regulations, and instead set revenue targets according to different criteria.
The results for Personal Income Tax are illustrated in Table 2.5.
Table 2.5: Personal Income Tax Compliance Rates
Year PIT tax base PIT Liability As a share of PIT base PIT Revenue Compliance Rate 2003 328487 24868 7.6% 6414 26% 2002 294011 20467 7.0% 6149 30% 2001 232190 13396 5.8% 6300 47% 2000 168481 10965 6.5% 4590 42% 1999 192345 14479 7.5% 3110 21% 1998 169058 11428 6.8% 1167 10% Note: All monetary amounts are expressed in millions of Lek at current prices.
Once again one notices an inverted U-shape of the compliance rate over time. This reflects the fact that collected revenues have stood at approximately the same nominal level over the 2001-2003 period, while the total liability has jumped significantly between 2001 and 2002. However, contrary to what is the case with social security, the rates and income band limits did not change between 2001 and 2002. The driving force here appears to be the quite strong increase in the (nominal) PIT tax base. As the PIT structure is progressive, this has a more than proportional effect on the total liability. As was the case with social security collections, it is possible that revenue targets for PIT also exist and are set within the tax administration in nominal terms, rather than there being targets in terms of compliance rates.

Chapter 2 ASSESSMENT OF THE STATISTICAL SYSTEM
THE INFORMAL ECONOMY IN ALBANIA: ANALYSIS AND POLICY RECOMMENDATIONS - ISBN 92-64-010254 - ©OECD 2005 41
2.3.2 Excise Tax and VAT Modelling
Using the modelling framework detailed in the report, estimates of the VAT compliance rate for non-excised goods and services and the compliance rate for excised goods are shown in Table 2.6 below.
Table 2.6: Excise and VAT compliance Rates
Year Compliance Rate for
Excised Goods VAT Compliance Rate for
Non-Excised Goods and Services 1996 48.1% 17.7% 1997 16.1% 38.6% 1998 33.2% 58.5% 1999 50.9% 55.6% 2000 74.7% 69.2% 2001 61.5% 59.9% 2002 45.7% 57.8% 2003 59.1% 56.3%
The results for the excised goods compliance rate show a marked fall for 1997, a turbulent and lawless year for Albania, followed by a steady improvement up to and including 2000. For the non-excised goods VAT compliance rate, there is likewise an encouraging steady trend towards higher values up to 2000. The period from 2001 to 2003 shows a stabilisation of the VAT compliance rate above 55%, while the excise compliance rate dipped again in 2002 and came back in 2003 to a level of around 60%. In short, compliance has increased but there is still plenty of room for improvement. Further discussion is provided in the report.
The VAT compliance rates estimates for 2001 can be broadly compared with the estimates of informal gross value-added in a stylised way. Taking estimates of simulated gross value-added as a reference, under-declared value-added by VAT registered enterprises amounted to some Lek 57.0 billion in 2001. This is equivalent to Lek 11.4 billion foregone VAT revenue (57.0*20%). It is shown above that if as much as 20% of total imports were VAT exempt this would still have resulted in Lek 5 billion more revenue than was actually received in 2001.
According to official statistics the total collected revenue from VAT in 2001 was Lek 41.9 billion. Taking the estimates of foregone VAT revenue from VAT registered enterprises and imports together implies a VAT compliance rate of 72% (41.9) / (41.9+11.4+7). This is very close to the rate shown in the Vienna Institute’s estimates above.
Including foregone VAT revenue that should have been paid by non VAT registered enterprises (but with actual turnovers of greater than Lek 8 million) would bring the two rates even closer. For example the total value-added of non VAT registered enterprises that appear on the statistical register is estimated at Lek 64 billion in 2001 (based on simulated GVA); Lek 25.1 billion formal and Lek 38.9 billion informal). Assuming that one-third of this value-added was generated by enterprises with more than Lek 8 million turnover, and, so, on which VAT should have been paid, would have generated an extra Lek 4.3 billion in VAT revenue; bringing the compliance rate (consistent with simulated GVA estimates) down from 72% to 67%; which is even closer to the Institute’s 61.5% estimate.

Chapter 2 ASSESSMENT OF THE STATISTICAL SYSTEM
42 THE INFORMAL ECONOMY IN ALBANIA: ANALYSIS AND POLICY RECOMMENDATIONS - ISBN 92-64-010254 - ©OECD 2005
2.3.3 Total tax and social security evasion
Table 2.7 aggregates estimated evasion over all the major tax types to arrive at an estimate of total tax loss from household evasion; assuming 100% compliance. A number of caveats are needed when interpreting this data, for example the quality of data used in the study, a full list is included in Annex E. These points notwithstanding, the table shows that revenue losses from this sector alone are significant. As can be seen the profile is quite erratic, dipping significantly in 2000 and 2001; where data concerns are greatest, but overall the analysis suggests that evasion from the household sector is in the order of 10% of GDP.
Table 2.7: Estimated lost tax revenue due to tax evasion, by type of tax (1996-2003)
1996 1997 1998 1999 2000 2001 2002 2003
Personal Income Tax Loss, % of GDP . . 2.4 2.3 1.2 1.2 2.1 2.5 HH Social Security Contr. Loss, % of GDP
. . 2.2 1.9 1.5 1.5 3.0 3.0
Excise Tax Loss, % of GDP 1.7 3.4 2.3 1.4 0.6 1.0 1.6 1.1 VAT Tax Loss, % of GDP 10.5 8.7 5.6 5.0 3.0 4.5 5.3 5.2 Total Tax Loss, %GDP . . 12.5 10.6 6.2 8.1 12.0 11.8 Source: Vienna Institute calculations
2.3.4 Observations
A number of assumptions are necessarily used in the WIIW’s model, which suggests that some caution is needed in interpreting the results. Nonetheless, some general observations can be still be made. The Vienna Institute’s estimates of compliance rates for the various types of taxes suggest that tax compliance in Albania is very low by European standards (the full report contains an international comparison). Of particular concern is the possibility that compliance rates for personal income tax and social security contributions have significantly worsened over the last few years.
A more positive message comes through on VAT and Excise taxes. Although the profile of compliance is erratic, suggesting some data problems, particularly for VAT, the overall message is clear. VAT and Excise duty compliance rates appear to have improved markedly since the mid 1990s. This is not altogether surprising given the changes introduced during this period concerning VAT collection after the crisis in 1997 that led to the introduction of a pre-arrival information system for imports and the collection of VAT at the borders – in 2001 for example about 2/3 of paid VAT was collected at the border (levied on imports). However, there has been no noticeable improvement since then, which suggests that further policy measures will be required to improve compliance. This is an issue not just for VAT on domestic production but also VAT on imports where the potential levels of evasion were illustrated earlier.
2.4 Conclusions
Measuring the size of the informal sector is a considerable challenge but, as INSTAT has demonstrated, it is a challenge that is surmountable in the long run. The progress made by INSTAT in recent years is impressive and their approach to tackling the non observed economy has been methodical and importantly, transparent. The measurement of GDP requires the collation of numerous data sources,

Chapter 2 ASSESSMENT OF THE STATISTICAL SYSTEM
THE INFORMAL ECONOMY IN ALBANIA: ANALYSIS AND POLICY RECOMMENDATIONS - ISBN 92-64-010254 - ©OECD 2005 43
some quantitative, like the ASBS, and some qualitative like the expert assessments used to estimate the informal sector. On the basis of the available evidence, it appears that current estimates of (taxable) GDP are overstated. However, care should be taken in drawing firm conclusions here about GDP estimates more generally.
The analysis used in this report has not utilised all of the data at INSTAT’s disposal and, as a consequence, it is too early to conclude that current estimates of GDP are definitely under-reported. The range of estimates presented in Annex A and simulated gross value added estimates are themselves based on certain assumptions regarding the behaviour and characteristics of un-observed small enterprises that appear on the statistical register. In estimating formal activity, for example, it has been assumed that none of these small (un-observed) enterprises are VAT-registered, and so by definition, formally, all fall below the Lek 8 million turnover threshold. This may not be the case. One cannot rule out the possibility that within their fold will be new start-ups that have not yet appeared on the VAT register. Moreover, in the main analysis the focus is primarily on small enterprises; leaving estimates of value-added in large and medium enterprises largely unchanged. The work of the Twinning Project however, (described in more detail in Annex A), suggests that revisions to large and medium enterprises may be upwards, thus partly offsetting any downward changes to the value-added of small enterprises.
Further, although it may be true that the output (formal and informal) of small enterprises in sectors where informal activity occurs is lower than currently shown in official estimates, one should note that this report does not assess the quality of value-added estimates in other sectors, for example, agriculture, government, health, education, utilities, energy, imputed-rent and financial services: which together, whichever estimate of GVA is used, provide the bulk of gross value-added. Some may think it odd that references to government, health and education are included here since these are traditionally thought to be devoid of any informal activity. That assumption is generally correct. However, one aspect of government, health and education that is often over-looked in this context is the inclusion of consumption of fixed capital within value-added estimates. This is notoriously difficult to measure. Because mis-measurement has no bearing on the informal sector, as defined in this report, the quality of these estimates has not been investigated.
However, any broad based review of Albania’s GDP estimates should comprise not only adjustments to estimates of the informal sector but also all other components of GDP; certainly this should include agricultural output and imputed-rent. Another potentially important area (for GDP estimation) not covered in the assessment is illegal activities such as drugs, prostitution, smuggling and theft. A number of countries have begun to include these activities in their official estimates of GDP in recent years, or to include them in satellite accounts, and these tend to have a positive impact of GDP (0.5-1.5%), if the current estimation process is production driven3 as is the case in Albania. Moreover no attempt has been made to estimate any production related to corruption. In many cases corruption is not considered to be part of the GDP production boundary, for example if payments are not related to any specific service. However the consensus is that payments should be included in the production boundary if they can be related to a specific service. In many countries an under-the-counter payment to doctors often secures a speedier more comprehensive diagnosis or treatment. In Albania where corruption levels are generally considered to be high (Table 3.8), at least compared to other countries in the region, this could make a significant difference to GDP4.
Table 1.1 provided a comparison of estimates of the size of the informal economy produced in a number of studies. These generally varied from 30-60% of GDP. Comparisons of these estimates are of course complicated by the fact that the definitions of informal activity are not generally the same and because each necessarily has to use a number of different assumptions, some of which are more stretching than others. For example currency based models will suffer because of the widespread use of Euros and Dollars in Albania. The alternative (simulated) estimates provided above are at the lower end

Chapter 2 ASSESSMENT OF THE STATISTICAL SYSTEM
44 THE INFORMAL ECONOMY IN ALBANIA: ANALYSIS AND POLICY RECOMMENDATIONS - ISBN 92-64-010254 - ©OECD 2005
of these estimates however. To some extent, this probably reflects the fact that our definition of informal activity is more restrictive. Many studies, including the OECD’s own definition of the non-observed economy, include the entire unobserved output of unincorporated enterprises, whether the output is taxable or not. In Albania, where much of agricultural output is subsistence related, and where agriculture continues to dominate (31% of ‘simulated’ GVA in 2001, including fishing), the inclusion of the agricultural output of households in a definition of informal activity is likely to be significant. A different way of looking at the informal economy however is to consider the size of total value-added that is generated by non-agricultural private and public sector activity that is taxed, which is estimated at 34.6% of simulated GVA, above, in 2001: 18.3% of which reflects the value-added of private sector activities (where some informal activities also occur); 7.4% is the value-added of mining, energy, financial and communications industries (including the negative adjustment for financial intermediation services) and the remaining 8.9% is the value-added of the public sector.
2.4.1 Comparisons with Other Countries
A comparison of Albania’s tax collection to GDP rates with other countries in the region, and at various stages of transition, provides another measure of the size of the informal economy relative to other countries.
Table 2.8 below sets the context for this comparison by first comparing rates in the major taxes (and social security contributions) for selected countries in the region. With the exception of personal income tax (PIT) it shows that the rates in Albania are generally at the top-end. However the limitations of such a crude comparison should be noted, since many other (different) factors need to be accounted for, such as differences in average salaries, and income tax and social security exemptions, thresholds, tiers and upper limits.
Table 2.8: Tax and Social Security Rates (2001 unless stated)
Country VAT PIT – (starting rate) Corporate Tax Social Security Albania 20 5 25 41.9 (2004) Bulgaria 20 20 32 (2000)
19.5 (2003) 45.7 (2000) 42.5 (2003)
Croatia 22 20 20 37.7 fYR Macedonia 18 15 15 32 Slovenia 20 n/a 25 38
Source: IMF country reports (various)
Table 2.9 below compares revenues from VAT, personal income tax (PIT), social security contributions and corporate (profit/turnover) taxes in Albania with those in Bulgaria Croatia, fYR Macedonia and Slovenia. It shows that in almost all of these taxes the rates, as a per cent of GDP, are significantly lower in Albania than in all other countries (the exception being corporate tax in fYR Macedonia and Slovenia, which may be explained by coverage, as the figures for Albania include Small Business Tax payments).
According to official statistics, therefore, Albania compares unfavourably with other countries in the region vis-à-vis tax collection efficiency, particularly in the domain of social security contributions and VAT. For social security contributions the comparisons are particularly stark since Albania has the second highest rate (exceeded only marginally by Bulgaria) but by far the lowest revenue as a percentage of GDP. It should be noted that these figures refer to the period before the recent changes moving the responsibility for social security collection to the Tax Office.

Chapter 2 ASSESSMENT OF THE STATISTICAL SYSTEM
THE INFORMAL ECONOMY IN ALBANIA: ANALYSIS AND POLICY RECOMMENDATIONS - ISBN 92-64-010254 - ©OECD 2005 45
Table 2.9: Main Revenues as a per cent of GDP (2001)
Country VAT PIT
Corporate Tax
Social Security
Total
Albania (original GDP) 7.0 1.1 2.1 3.8 14.0 Albania (simulated GDP) 7.9 1.2 2.3 4.3 15.8 Albania (simulated GDP, ex agriculture) 10.9 1.7 3.2 5.9 21.7 Bulgaria 8.3 3.6 3.9 7.8 23.6 Croatia 13.5 2.0 3.9 12.9 32.3 fYR Macedonia 7.3 3.1 1.3 10.8 22.5 Slovenia 9.3 6.1 1.5 13.1 30.0
Note: Simulated GVA, refers to the calculation of GVA assuming that un-surveyed enterprises are not VAT registered and have turnovers (formal + informal) of less than Lek 40 million.
2.4.2.But comparing revenues as a per cent of GDP is not ideal
However it is not clear to what extent differences in VAT thresholds or more general VAT exemptions play here, such as exports. Albania is unique amongst the selected countries in zero-rating agricultural products; although in fYR Macedonia the rate is 5%, and of course, agricultural products produced and consumed by households will be zero-rated in all countries. For Albania, where the agricultural sector contributed 25% of official GDP in 2001, this may make a difference. Moreover, countries with large informal sectors, which are not fully captured in official GDP estimates, will appear to have high tax collection rates, as a per cent of GDP; leading some observers to draw the (possibly) incorrect conclusion that tax-collection mechanisms in these countries were relatively better than similar countries that included informal activities in their GDP estimates. In this context it should be recalled that GDP is not the perfect denominator for these comparisons
This point is best made by making cross-country comparisons based on the lower (simulated estimates of GDP) and excluding agricultural value-added. As might be expected, looking at the ratios using simulated GDP as a denominator, tax-GDP ratios, using this lower level of GDP, are higher and are much closer to the levels seen in other countries; for example Albania’s VAT-GDP ratio rises above the rate in fYR Macedonia and is the second highest when agricultural value-added is removed from the denominator; although the rates for PIT and social security payments, where country differences in thresholds and rates play a bigger role, are still significantly lower. This suggests that the practice of avoiding social security contributions and personal income tax payments by not registering employees or registering them at minimum wage levels is not just significant in Albania, as borne out in the Vienna Institute estimates shown above, but significantly more widespread in Albania than in other countries.
2.5 Recommendations on the statistical system
INSTAT are doing a good job. It is important to reiterate this message in order to ensure that it does not get lost in the overall assessment of INSTAT’s current approach, which, in the nature of assessments more generally, casts a critical eye on the current methodology and production process.
Introducing Dynamic Adjustments and the Labour Input Method
One aspect of informal economy estimation that has not been hitherto discussed concerns its static nature. This makes it very difficult to use official data to model any changes that may have occurred in the size of the informal sector in response to policy changes; including those policy measures designed

Chapter 2 ASSESSMENT OF THE STATISTICAL SYSTEM
46 THE INFORMAL ECONOMY IN ALBANIA: ANALYSIS AND POLICY RECOMMENDATIONS - ISBN 92-64-010254 - ©OECD 2005
specifically to reduce the level of informality. Indeed because of these assumptions, the official data for 2000 to 2002 shows very little change in the level of overall economy wide informality. The small changes that do occur reflect compositional changes in activity and final demand, rather than changes in informality per se. From the official estimates available, the informal economy, in those sectors where informal activity generally occurs, (using INSTAT’s own definition) remained in the 27-28% range as a share of GVA between 2000 and 2002, (28.0%, 27.4%, 27.9%, based on official statistics).
The picture that emerges from these statistics is, at first glance, unambiguous. The informal sector proved resistant to any attempts by government to reduce its size. This may very well be true. Unfortunately, because of the way in which the informal sector is estimated, one cannot necessarily infer this from the figures above because the estimation process used by INSTAT is not able to respond to policy changes, unless the (expert assessment) ratios used to assess the size of informal activity are more dynamic. This is not currently the case, as the ratios have remained the same since 1998.
The consequence of this is that if small incorporated enterprises grow, so too do the estimates of informal activity by unincorporated small enterprises (mainly households); since the INSTAT method assumes a fixed relationship between the (formal) output of incorporated enterprises and unincorporated enterprises. This may very well be the case. Indeed this is equivalent to stating that growth in the formal sector equals growth in the informal sector; which is not completely far-fetched.
However, there are a number of good reasons why this may not hold. For example, as (and if) an unincorporated enterprise grows it is more likely to become incorporated (and formal), particularly if it is in a rapidly growing sector where the rewards from operating (at least partly) formally outweigh those from operating informally. All other things being equal, this would mean that the formal (incorporated) sector had grown at the expense of the informal (unincorporated) sector. With the current estimation process, however, the informal economy would appear to have grown too. But this is not the only reason why the assumption may not hold. More generally one would expect that, as the economy grew and measures to formalise the economy took hold, so one would see a move away from marginal (and informal) activities into formal activities, particularly if the growth was typified by an increase in employment by medium and large enterprises such as multinational corporations.
Recommendation 1
It is imperative, therefore, that INSTAT introduces a more dynamic approach to its informal activity estimation; certainly this is one of the only robust mechanisms that would allow an assessment of activity by unincorporated (unregistered) units. One possibility is to develop, and quickly, the ability to produce estimates of activity based on the labour input method, since this would be able to pick up many of the economic and demographic changes that affect the size of the informal sector. In the medium term this will require the creation of a labour force survey. In the short term, however, it is possible to use information coming from the Living Standards Measurement Survey, which although limited in its sample size, provides important information on employment (by industry, occupation, hours worked, salaries, income in kind, etc.). Additionally the LSMS survey could be adapted to include supplementary questions relating to labour if necessary.
Recommendation 2
A second, and complementary approach, is to hold annual meetings of company accountants and other key players in the business community in those sectors where informal activity is prevalent, as a means of annually updating, in a qualitative way, the size of adjustments needed to estimate the informal

Chapter 2 ASSESSMENT OF THE STATISTICAL SYSTEM
THE INFORMAL ECONOMY IN ALBANIA: ANALYSIS AND POLICY RECOMMENDATIONS - ISBN 92-64-010254 - ©OECD 2005 47
sector. This is a potentially rich source of information that can be attained relatively simply. Certainly the OECD experience of interviews with entrepreneurs and accountants in Albania proved to be a rich source of information concerning company behaviour and the mechanisms/incentives that drove the informal economy.
Recommendation 3
A third approach is to use tax audit data (although this will only be able to provide estimates of informal activity in incorporated enterprises). From discussions with Tax Administration officials it is clear that a rich source of data exists here that could be used to help assess the size of the informal sector. Naturally, one needs to be aware of the possible pitfalls that come with using data such as these, since the population of audited companies is inherently biased (insofar as they are more likely to be operating informally than other non-audited enterprises). In addition, one has to recognise the possibility that the data are biased in the opposite direction too (i.e. they suggest that evasion is lower than it actually appears to be, and, as shown above, this seems significant), as one cannot discount the possibility that bribes are offered to auditing officials.
Nevertheless, the benefits that come from using these data should not be overlooked, since, at the very least, they provide, on their own, as a time series, some assessment of changes in the size of the informal economy in incorporated enterprises over time (assuming that no other changes occur, such as levels of corruption). This approach has been used by INSEE (the French Statistical Office) and is described in Calzaroni and Madelin (2000).
Unfortunately it has not been possible to include such estimates in this report, beyond the rudimentary analysis provided above (and in Section 3) as the industry data that would have permitted such a calculation was not available. However, the data received suggests that a rich supply of data (collected annually) is available. Resources may not permit this analysis to be completed but it is to be hoped that national accounts experts assisting INSTAT as part of the Twinning Project may be able to provide enough momentum to take this work forward and make it a regular feature of the production process.
Recommendation 4
The fourth recommendation concerns the development of a Business Register. This was also a recommendation outlined in the Brungger report (2001) but the recommendations are repeated below, verbatim, to stress their importance in developing quality statistics more generally (and not just to better measure the informal sector).
There is no good system of business surveys without a good statistical business register. The present register is, in view of the very limited resources available, a good start, but needs considerable investment before further surveys are added, so as to improve both the selection of units and the grossing up to the relevant universe. However, a statistical business register which is fully compliant with EU requirements is too demanding for the foreseeable future in the case of Albania. A selection of the most important requirements will have to be made for implementation in the next 5 years.
Given the lack of sources on the total economy, it is suggested to have an economic census covering all sectors except agriculture, forestry, fishing and hunting, but including general administration. This should be the starting point for a set of interrelated business registers as outlined below. This economic

Chapter 2 ASSESSMENT OF THE STATISTICAL SYSTEM
48 THE INFORMAL ECONOMY IN ALBANIA: ANALYSIS AND POLICY RECOMMENDATIONS - ISBN 92-64-010254 - ©OECD 2005
census can only be carried out with funding from abroad, but it would be highly desirable if this could take place in 2003, based on a government decision.
The first register to be created from this census would be a register of legal units (public and private companies), with both the enterprise and the local unit level, with main activities at each level (the inclusion of secondary activities may be tested). This register would include all companies whether known to the tax authorities or not, and it is therefore necessary that any data transmission to administrative bodies, and especially to any administrative business register kept elsewhere, is completely excluded. The updating after the census would be made with tax data, the continuation of the forms for births, deaths and movements of enterprises in an adapted form, survey data for those companies that are included in the samples, and inputs from regional offices and/or the postal service (and for public enterprises additional administrative channels). It is important to have a size variable for each company and local unit in terms of employment; this will be the only way to have employment data by region of sufficient quality. The most important aspect of this register is however the quality of the addresses of both headquarters and local units. (This part of the Brungger recommendation has been acted on and delivered but is included here for completeness)
The second register to be created from the economic census would be for unincorporated enterprises. Unlike the register of legal entities, it is not realistic to have a systematic updating of such a list, but it can serve as frame for selecting samples in those cases where inclusion of unincorporated enterprises is necessary. Criteria will have to worked out for deciding for each survey whether they should be included; in general, they should be included in annual surveys, but not necessarily in all quarterly or even monthly surveys. Questionnaires would have to be simpler than for legal entities (or very basic questions could even be integrated in household surveys if a breakdown between industry and services is sufficient). The only possible source for updates (very partial indeed) are tax data (in the case an unincorporated enterprise is really known to authorities other than INSTAT), household surveys where a household member reports to run a business, and feed-back from or about units that have been selected to be part of business surveys. Exclusive use for statistical purposes is as important here as for legal entities.
The third register originating from the economic census deals with the general administration. It will have to include all local units; the updating should be organised in co-operation with the ministry of civil administration, and local governments. It is important that some key variables such as employment can also be produced for the administration, via mainly administrative sources and in forms of surveys with local governments.
These business registers should have an explicit legal base in the revised statistical law, since unlike other microdata files at INSTAT, names and addresses are a permanent component of such registers.
The first surveys to be added to the existing two should be those necessary for producing the IMF Special Data Dissemination Standard (SDDS) series according to international standards, i.e. wages and production in the private sector. Concerning annual surveys, priority should be given to information required by national accounts.
Recommendation 5
The fifth recommendation follows from the analysis described above. A key recommendation in this context is to attempt to identify (and treat) VAT registered enterprises separately in the ASBS from those that are not VAT registered. In this way imputations for incorporated enterprises that are not VAT registered and not surveyed can be based on the value-added and turnover estimates from observed

Chapter 2 ASSESSMENT OF THE STATISTICAL SYSTEM
THE INFORMAL ECONOMY IN ALBANIA: ANALYSIS AND POLICY RECOMMENDATIONS - ISBN 92-64-010254 - ©OECD 2005 49
incorporated but non VAT registered enterprises. Commensurate with this, imputations should be made using much smaller employment strata if at all possible (and in addition sampling should also be drawn from these smaller strata). This is especially important for small enterprises, given the prevalence in Albania of enterprises with 1-4 employees but is also important for large and medium enterprises. Preferably medium enterprises should be split to separately identify those with 5, 6, 7 and perhaps 8, 9 and 10 employees, with wider employment strata thereafter, perhaps going up in strata of 5 to 10, but it is recognised that this may be too costly too achieve.
Equally it is important, particularly for the trade sector, and other large sectors with heterogeneous value-added to output/turnover ratios, that the imputations outlined above are conducted at the 4-digit NACE level. This is of paramount importance in the trade sector and can be achieved at relatively little cost.
Recommendation 6
An approach was described above that allows for the broad validation of formal sector activity (which includes the output, turnover and value-added of non-sampled incorporated enterprises). This method should be applied, as a quality check, to ensure that the proxies/imputations used to estimate the size of these enterprises are appropriate. In short, the recommendation is to compare estimates of formal activity with the corresponding received tax revenue (VAT and corporation tax).
In the longer term a concerted effort needs to be made, utilising the balance sheets (ASBS), to acquire data on compensation of employees and consumption of fixed capital as separate components of value-added. On its own this merits development since it will increase the relevance and usefulness of GDP. However, it will also strengthen the relevance/quality of the tax-check procedure described above and provide for the possibility of a further check; comparing declared compensation of employees against personal income tax payments and social security contributions.
Recommendation 7
The estimates presented above suggest that current estimates of GDP may be significantly overstated. This has political and presentational implications. It is imperative, therefore, that INSTAT, in conjunction with the Twinning Project, and other key players such as the Ministry of Finance and the IMF, develop a strategy that can handle this issue as soon as it can be established that significant revisions are needed. At the same time it is important that a comprehensive review is carried out on those areas of economic activity that could not be assessed in this report, namely imputed rent; agricultural output; and non-market consumption of fixed capital government. At the same time, given the probable spotlight on how these changes affect Albania’s standing internationally (in a national income and wealth per capita perspective) it might be worthwhile to consider whether an increased emphasis on Gross National Income measures would be helpful; meaning that improved estimates of remittances would be needed. Although, given their importance to the Albanian economy, a concerted effort should be made on improving these estimates anyway.
Recommendation 8
Recommendation 1 stressed the need to develop a labour force survey to provide a tool to measure informality. A complementary approach is to strengthen the role and quality of expenditure based estimates in GDP estimation; since these provide an alternative estimate of GDP to the production

Chapter 2 ASSESSMENT OF THE STATISTICAL SYSTEM
50 THE INFORMAL ECONOMY IN ALBANIA: ANALYSIS AND POLICY RECOMMENDATIONS - ISBN 92-64-010254 - ©OECD 2005
approach. Moreover, expenditure based estimates are generally less affected by informal activities, as far as measurement is concerned. The development of LSMS estimates for households’ consumption is a significant step forward in this respect, as is the fact that the survey will continue to be run for another year at least. At present the estimates are not considered robust enough to inform GDP estimation. However, it is important that the momentum from this survey is maintained with a view to expanding and developing it so that it takes the form of a conventional family expenditure survey, where consumption is recorded (ideally) on a weekly basis. Commensurate with this, supply-use tables should be introduced as soon as is realistically possible. This is currently on the work-plan of the Twinning Project, as is an assessment of constant price economic statistics. These developments are to be welcomed and should be given a high priority.
Recommendation 9
Implementing these recommendations will not be easy, and it goes without saying that extra resources will be needed in order to deliver these changes. These should not be short-term resources however. The measurement of the non-observed economy currently involves one member of staff who spends a considerable amount of time working on the GDP estimation process more generally. This is not desirable. As has been shown the informal sector is significant in Albania and its measurement is evidently of importance to government and to other players in Albania, including the international and business community. Better measurement and information in this sector is therefore very important. This is unlikely to occur within the current resources of the National Accounts team (which is already stretched), and so extra resources dedicated to the informal sector are paramount. Additional resources will also be needed in implementing and integrating supply-use tables into the regular national accounts production process too and in developing better quality estimates of GDP using an expenditure approach. It is difficult to be too prescriptive on numbers but certainly 2 staff working on the informal economy and 2 on the development of expenditure estimates of GDP might be considered a minimum to start with.
Another area that will at least require investigation is the speeding-up of GDP estimates. At present annual estimates of GDP occur two years after the date to which they refer. In most developed economies, estimates of GDP are produced quarterly a matter of months after the quarter to which they refer, as are first estimates of annual GDP. Timeliness is crucial for policy makers, whether they be in government, central banks or in the private sector. Resources should be devoted to investigating the feasibility of producing speedier estimates of annual GDP and quarterly GDP. The feasibility study need take the time of only one full time expert, however extra resources will probably be needed if the feasibility of producing quarterly estimates can be established.
At present INSTAT uses an Microsoft Excel and Access system to produce its accounts. There is no doubt that the system is well designed, efficient and transparent, however the danger exists that errors might be introduced accidentally, or changes made without full documentation. Statistical offices throughout the world generally avoid the use of spreadsheet systems for these very reasons, and this should be no less true for Albania. It is not advocated here that a statistical system using customised software be designed specifically for INSTAT as is often the case in very large statistical offices. These require large teams to update and maintain the system and to train users and these costs cannot be justified for Albania. However it is certainly recommended that INSTAT move away from Excel/Access to a more secure, but still off-the-shelf, software system such as SAS. This is likely to require at least one temporary resource to develop the system and for subsequent staff training.

Chapter 2 ASSESSMENT OF THE STATISTICAL SYSTEM
THE INFORMAL ECONOMY IN ALBANIA: ANALYSIS AND POLICY RECOMMENDATIONS - ISBN 92-64-010254 - ©OECD 2005 51
Recommendation 10
INSTAT generally has good relations with other government departments but better relations are possible. This is particularly the case vis-à-vis its relations with the agriculture ministry. A service level agreement spelling out exactly what is delivered from the ministry with an accurate description of the methodologies used is a minimum requirement in this context. Certainly some mechanism should be built in to allow feedback from INSTAT to be incorporated.
The second area of communication concerns the internal dynamics of INSTAT. At present a significant part of the estimation of expenditure based estimates of GDP (household final consumption) exists in the social statistics (surveys) area. This is unusual although it largely reflects the fact that much of the information on households’ consumption is derived from the LSMS, where the priority is poverty assessment rather than GDP estimation. Because these estimates are produced outside of the National Accounts area it is more difficult for them to meet national accounts needs; particularly as the team responsible will necessarily (and rightly) be focussed on the objectives of the LSMS. At present the transfer of data between these two units does not appear to be driven by a service level agreement. One is needed. This will at the very least ensure that the LSMS team are able to identify how much time is needed to meet national accounts needs and whether extra resources are needed to achieve this: (extra resources that could be located within the LSMS team or the national accounts team; possibly, but not ideally, using one of the two additional resources identified in recommendation 9).
NOTES
1 Commission Decision NO 94/168/EC
2 For a fuller description of this method see the OECD Handbook on the Non Observed Economy (2002).
3 As long as intermediate consumption is correctly recorded. If an expenditure approach is used, GDP could be reduced since estimates for smuggling would increase imports and so reduce GDP; assuming that the household surveys correctly pick up expenditure on these goods.
4 The impact of including corruption may be positive or negative. In theory if payments for corruption could be identified and included in the accounts they would be recorded as intermediate consumption of businesses, output and value-added of (corrupt) officials and final demand of households. As such GDP should increase by the amount of final demand. However the adjustments currently made for informal activity may include corruption payments within value-added rather than intermediate consumption, since companies are hardly likely to declare these payments. And so current estimates of GDP are likely to be overestimated by the amount of payments made by companies and underestimated by not including final demand payments.


THE INFORMAL ECONOMY IN ALBANIA: ANALYSIS AND POLICY RECOMMENDATIONS - ISBN 92-64-010254 - ©OECD 2005 53
Chapter 3
THE IMPACT OF THE TAX AND SOCIAL SECURITY CONTRIBUTION REGIME ON COMPANY BEHAVIOUR
3.1 Approach
As mentioned in Chapter 1, a number of factors have caused informal activities to grow significantly in Albania since the beginning of the transition process. Previous studies have pointed at the high intensity of legal and administrative regulations (see FIAS, 2003; OECD-EBRD, 2003), allied to a lack of trust in official institutions and administrative corruption. Poor access to formal property systems (lack of access to clear property rights and title deeds) leads to an inability to collateralise property assets. This in turn obstructs access to official financial products (such as credit lines, insurance, leasing, etc.) and contributes to keeping enterprises in the informal sector (see OECD-EBRD, 2003). A decline in civic virtue and loyalty towards public institutions, combined with a declining tax morale, a broad acceptance of illicit work and corruptible public officials, and systematic non-payment of utility bills have also contributed to generate an environment that promotes and accepts the presence of a significant informal economy.
In Albania these factors played an important role in promoting informality in the first phase of the transition process, which ended with the political and economic crisis sparked by the collapse of the pyramid schemes in 1996/97. The aftermath of the crisis included the introduction of a series of reforms and confidence building measures which laid the basis for a new cycle of economic growth. As Albania moved towards greater political and economic stability and the economy entered into a phase of sustained growth, others factors started to play a leading role in sustaining the informal economy. The relatively high overall tax and social security burden, in combination with a weak tax enforcement record and very strong competition in the market for goods and services, has been a potent mix fuelling an expansion of the informal economy.
As previously noted, the greater the difference between before and after tax profits and compensation of employees, the greater the incentive to operate informally. Company behaviour relative to tax and social security compliance is determined not only by the public administration, but also by the behaviour of direct competitors, particularly in markets driven essentially by price competition. In this context, the presence of a significant proportion of companies able to systematically evade taxes and social security contributions, thus driving down prices, acts as a powerful force encouraging even previously fully compliant companies into some degree of informality. Under these circumstances, any weaknesses and inconsistencies in the tax and social security regimes are likely to be fully exploited by companies, increasing the prevalence of informality throughout the economy.
The focus of this section of the report is, therefore, on the implications of the tax system and, to a lesser extent, the social security contributions system on the level of informal economy. The core of the chapter is dedicated to an analysis of company behaviour, based on a combination of empirical data and tax simulations. This analysis plays a central role in developing an understanding of how the informal economy operates and influences economic development.

Chapter 3 THE IMPACT OF THE TAX AND SOCIAL SECURITY CONTRIBUTION REGIME ON COMPANY BEHAVIOUR
54 THE INFORMAL ECONOMY IN ALBANIA: ANALYSIS AND POLICY RECOMMENDATIONS - ISBN 92-64-010254 - ©OECD 2005
The approach adopted in this section is to identify and quantify the risks/costs and the rewards/benefits associated with different levels of informal enterprise operation. The assumption is that enterprises (like individuals) determine the level of informality at which to operate in relation to the perceived risks (fines, bribes, higher financing costs, etc.) and the rewards/benefits (e.g. higher profit margins, non state interference, etc.). The company’s objective is to maximise profits and minimise risks.
The first part of this chapter sets out the key features of the tax system, in so far as it affects enterprises. It focuses on the main taxes, social security contributions and customs duties, highlighting their key features, without going into detail about their application.
The second part of the chapter highlights the main drivers of tax evasion, based on qualitative research with 10 state institutions and 19 firms in the Tirana - Durres area. This qualitative exercise is not statistically significant. It was designed to obtain a better understanding of how firms operate, the interaction between the tax system and the informal economy, as well as to assist with modelling company behaviour, interpreting the empirical results and identifying possible policy recommendations.
The final part of the chapter focuses on an analysis of company behaviour based on information provided by a leading Albanian bank, whose assistance is gratefully acknowledged. Financial data were collected from a sample of 167 companies, mainly small and medium-sized, based on their applications for commercial bank credit. The data collection procedures and the sample are discussed in section 3.6.2. Again, no statistical representation or significance is inferred from such an exercise. Rather, the focus of the final part of the chapter is to model company behaviour with the aim of extracting policy recommendations in relation to harnessing the informal economy.
3.2 Tax System
The literature review (see section 1.3) has previously highlighted the importance of the tax system in relation to the informal economy. This section explores in more detail the situation in Albania. There are numerous national and local taxes, such as the property tax, road tax, solidarity tax and various other national and local taxes (such as business registration tax, stamp duties, hotel tax, TV and phone licenses, etc.). However, only five main taxes apply to enterprises, as summarised below. Note that, unless stated, all figures such as rates and exemption levels reflect legislation at the time of writing (Oct. 2004).1
Personal Income Tax (PIT)
This is a tax on employment income and other specified sources of worldwide income of Albanian residents and the Albanian income of non-residents. Physical persons who pay the Small Business Tax are not subject to PIT. The PIT is progressive. The first Lek 14,000 of monthly wages are exempt, as are unemployment benefits, pensions and other transfers, as well as farmers’ self-employment income. The starting rate is 5%, with a top marginal rate of 20%. Employers withhold PIT from wages and transfer it to the state when the wages are paid. The PIT is paid on a monthly basis.
Small Business Tax (SBT)
The SBT is a tax on small businesses with an annual turnover of less than Lek 8 million. There is a fixed fee for all companies with a turnover below Lek 2 million, depending on the nature of the business and category of the district that the business is located in. A rate of 4% is levied on the annual turnover

Chapter 3 THE IMPACT OF THE TAX AND SOCIAL SECURITY CONTRIBUTION REGIME ON COMPANY BEHAVIOUR
THE INFORMAL ECONOMY IN ALBANIA: ANALYSIS AND POLICY RECOMMENDATIONS - ISBN 92-64-010254 - ©OECD 2005 55
between Lek 2-8 million (€ 15 750 to € 63 000 range). The SBT does not apply to agricultural activities and is paid twice per annum.
Value Added Tax (VAT)
The VAT is a general tax on domestic consumption, implemented as a tax on (non-exempt) imported goods and the supply of goods and services by registered tax payers with a turnover above Lek 8 million (€63,000). Registered VAT payers are theoretically eligible to receive a credit for tax charged on their inputs. All VAT registered companies obtain a NIPT number and are required to use invoices issued by the Tax Administration for all sales of goods and services. There is a single rate of VAT (20%). VAT is paid monthly. Exports (goods and services) and supplies relating to international transport are zero-rated. There are exemptions from VAT such as financial services, leasing of most land and buildings, national currency and postal stamps, supplies for health, educational, religious, non-profit organisations, supplies to diplomatic and consular missions and medicines and medical equipment. (See Law on Value Added Tax, No.7928, 1995; Instruction No. 7 on Value Added Tax, 2004).
Corporate Income Tax (CIT or profit tax)
This is a tax on worldwide income or domestic corporations and Albanian income of foreign corporations in Albania. Depreciation rules apply, loss-carry-forward is possible for three years and there is a foreign tax credit. All companies which are not subject to the SBT are required to pay a flat rate of 25% on corporate income2. This is paid on a monthly basis according to a formula which takes into account the balance sheets over the previous two years. (See Law on Income Tax No. 8438, 1998; Instruction No.1 For Income Tax, 2004).
Excise taxes
This tax is levied on domestic production and imports of items such as tobacco products, alcoholic drinks, soft drinks and mineral water, coffee and oil by-products. Excise taxes are levied on all individuals and legal entities and rates vary, for example, from 5% (e.g. soft drinks and mineral water), to 20% (e.g. coffee) to 50% (e.g. beer and perfumes) to 90% (e.g. gasoline, certain oil by-products). The exceptions are ethyl alcohol used for alcoholic drinks for export and liquid gas used for household consumption. Table 3.1 below illustrates the relative importance of the various key taxes in Albania.
Several issues are worth noting in relation to Table 3.1:
• The ratio of total tax revenues to GDP is relatively low in absolute terms (19% of GDP in 2002) and in comparison with other SEE countries. See also Table 2.9)
• VAT is the most important tax, however, it only accounted for 6.8% of GDP in 2002.
• Other important taxes are CIT and excise tax, but both contribute relatively little to the national tax revenues (1.8% and 1.4% of GDP respectively in 2002).
• Other taxes such as PIT (0.9%) and the small business tax (SBT) (0.4%) are marginal contributors to national tax revenues.

Chapter 3 THE IMPACT OF THE TAX AND SOCIAL SECURITY CONTRIBUTION REGIME ON COMPANY BEHAVIOUR
56 THE INFORMAL ECONOMY IN ALBANIA: ANALYSIS AND POLICY RECOMMENDATIONS - ISBN 92-64-010254 - ©OECD 2005
Table 3.1: Albanian Government Tax and Social Security Revenues (2002 - 2004)
2002 2002 2002 2003 2003 2003 2004 2004 2004 Outturn Estimate Budget tot mil.
Lek % tot
tax rev % of GDP
tot mil. Lek
% tot tax rev
% of GDP
tot mil. Lek
% tot tax rev
% of GDP
VAT 46113 35.8 6.8 50760 33.9 7.0 57148 33.5 7.0 Profit tax 12198 9.5 1.8 13200 8.8 1.8 15200 8.9 1.9 Excise tax 9324 7.2 1.4 12830 8.6 1.7 16232 9.5 2.0 Small business tax 2548 2.0 0.4 3354 2.2 0.5 4044 2.4 0.5 Personal income tax
6149 4.8 0.9 6600 4.4 1.0 8162 4.8 1.0
Customs duties 13387 10.4 2.0 15041 10.0 2.0 14700 8.6 1.8 Social contributions 25637 19.9 3.8 29949 20.0 4.0 33688 19.7 4.1 Other taxes 13592 10.5 1.9 17953 12.0 2.1 21450 12.6 2.5 Total 128948 100 19.0 149687 100 20.1 170624 100 20.8 Source: adapted from IMF, 2004, table 5, p.23
3.3 Social Security Contributions Regime
Employers and employees are required to make significant social security contributions (SSCs):
• Employer contributions: all public and private employers are liable and these contributions fund pensions, maternity benefits, unemployment insurance, sickness benefits and employment injury insurance. Health insurance contributions fund medicines and other medical costs. The employers’ SSC amounts to 30.7% of gross wages of employees between a floor and a ceiling; and 1.7% for health insurance on the same base.
• Employee contributions: All employees are liable and pay 9.5% and 1.7% respectively for social and health insurance.
(see Law on Collection of Compulsory Social Insurance and Health Insurance Contributions No. 9136, 2003; Instruction No. 5 For Collection of Social Insurance and Health Insurance Contributions, 2004).
SSCs are also relatively low as a proportion of GDP - social insurance accounts for 3.5% and health insurance 0.3% of GDP. Following a review of the Albanian pension fund, the IMF (2001, p.23) concluded that the system was unsustainable and would continue to require large transfers from the budget unless the contribution was increased significantly, especially that of the private sector.
In addition to some reductions in the social security contributions rate (down from 45.9% - see OECD-EBRD, 2003), coupled with an increase in the retirement age, a recent change is that the Social Insurance Institute will no longer be responsible for the collection of SSCs. The Ministry of Finance is to completely take over this function from the beginning of 2005.
3.4 How some companies manage to systematically evade taxes and social security contributions
A mission was undertaken by the OECD in mid-June 2004 in order to meet with the relevant government ministries/agencies, as well as hold qualitative discussions with entrepreneurs, state authorities and tax inspectors. The key purpose of the exercise was to obtain an understanding of:
Chapter 3 THE IMPACT OF THE TAX AND SOCIAL SECURITY CONTRIBUTION REGIME ON COMPANY BEHAVIOUR
THE INFORMAL ECONOMY IN ALBANIA: ANALYSIS AND POLICY RECOMMENDATIONS - ISBN 92-64-010254 - ©OECD 2005 57
• The current tax and social security contribution system.
• The data available and their limitations.
• The methods used by firms to bypass tax, social security and customs and excise payments.
• The main weaknesses in public administration.
• The possible policy measures to address the informal economy.
The focus was on obtaining a qualitative understanding of the key informal economy drivers; aside from the overall tax and social security burden. Interviews were conducted with the following state organisations:
• Bank of Albania.
• INSTAT.
• General Taxation Department.
• Ministry of Agriculture.
• Ministry of Economy.
• Ministry of Finance.
• Social Insurance Institute.
• Ministry of Labour and Social Assistance
• Agency for SMEs.
In addition, 19 firms were interviewed in five sectors of economic activity located in the Tirana (13) and Durres (6) regions, since the great majority of registered Albanian enterprises are located in this area.
Although not in any way statistically significant, a number of points are worth noting in relation to the principal taxes and the interaction of the tax regimes.
3.4.1 Main tax and social security contributions evasion methods
As a starting point for the analysis a number of key issues were identified in relation to the current tax regime. These are based on discussions with the tax and labour inspectorate officials on the application of these regimes and business interviews. The entrepreneurs, selected on the basis of their knowledge of prevailing business practices in their sector, were interviewed about the record of tax compliance in their sector of activity and the most common methods used by their direct competitors to reduce their tax obligations. The second part of this chapter seeks to verify whether empirical data on company behaviour, collected through bank loan applications, support these initial issues for consideration.
Value Added Tax (VAT)
• A significant proportion of companies that are currently registered under the Small Business Tax (SBT) are evading VAT payments by systematically under-reporting their real level of turnover, thus ensuring that they remain below the Lek 8 million VAT threshold.

Chapter 3 THE IMPACT OF THE TAX AND SOCIAL SECURITY CONTRIBUTION REGIME ON COMPANY BEHAVIOUR
58 THE INFORMAL ECONOMY IN ALBANIA: ANALYSIS AND POLICY RECOMMENDATIONS - ISBN 92-64-010254 - ©OECD 2005
• A significant proportion of VAT registered companies are also systematically underpaying VAT by under-reporting their real level of turnover, with a consequent evasion of CIT on the profits generated by the non-reported part of the turnover.
• The existing two tier system (VAT registered and non-VAT registered), with a relatively high threshold for non-VAT taxpayers (€63,000), creates considerable scope for evasion since it is not possible for tax officers to track the entire VAT chain leading to the final consumer.
Corporate Income Tax (CIT) / Profit Tax
• As a result of systematic under-reporting of turnover and the dominance in the business sector of very small enterprises subject to the SBT, relatively few companies report profits and pay the CIT, resulting in a low level (1.8% of GDP in 2002) of tax revenues from this source.
Small Business Tax (SBT)
• Given the earlier comments relating to VAT, Albanian companies have a real incentive to stay small, so as to continue to benefit from the SBT.
• That means that the SBT, rather than encouraging the growth of small enterprises into sizeable operations (vertical growth), may actually be promoting the opposite. Entrepreneurs try to conceal the growth of their operations in order to benefit from the simpler and more favourable SBT tax regime. When the systematic under-reporting of turnover proves difficult, entrepreneurs may find it more profitable to split their operations and establish new companies, all declaring a turnover below the SBT threshold (horizontal growth).
• Since it is a legal requirement for obtaining annual licenses, most small enterprises pay the minimum taxes and social security contributions possible. For example, the typical scenario in family businesses is that the owner pays the minimum social security contributions and the SBT, however, family members engaged in the business do not.
Social Security Contributions
• According to the Social Security Institute, 59% of all declared employees receive an income equal to the national minimum wage. As a consequence, only the minimum level of social security contributions is paid in the majority of cases. Moreover the ratio of employees receiving an income equal to the national minimum wages rises when one considers only those workers in the private sector.
• The prevailing situation in all sectors covered by the interviews is that private sector employers (totally formal or partly formal) pay the official minimum wage to their employees, but typically make additional cash payments on a monthly basis, thus toping-up their employees’ incomes.
• This leads to the rather unrealistic scenario where, according to Social Security Institute data, the average monthly wage declared in the private sector (less than Lek 13,000 per month) is significantly below that of the public sector (about Lek 20,000 per month).
• There is a very high degree of collusion between employers and employees in relation to social security contribution evasion. This happens in part because employees see little or no value in contributing to the state health / social insurance schemes. Given the high level of job

Chapter 3 THE IMPACT OF THE TAX AND SOCIAL SECURITY CONTRIBUTION REGIME ON COMPANY BEHAVIOUR
THE INFORMAL ECONOMY IN ALBANIA: ANALYSIS AND POLICY RECOMMENDATIONS - ISBN 92-64-010254 - ©OECD 2005 59
insecurity and the still relatively low level of wages in the private sector, particularly for the less qualified, employees have a strong preference for maximising their immediate cash income instead of accepting a reduction of their net salary in exchange for future benefits.
Personal Income Tax (PIT)
• Since the great majority of employees in the private sector claim wages at the statutory national minimum wage level, the rate of PIT evasion is extremely high. De facto, PIT is paid mostly by public sector employees and only accounted for 0.9% of GDP in 2002.
Customs
• Discussions with entrepreneurs revealed a very high level of customs duty and VAT evasion at the borders, which is likely to result in a significant loss of state revenue.
• Examples of how this is achieved include payments made by bank transfer (basis for official invoicing) but with cash top-ups. This results in bills being under-reported and thus lower customs / VAT duties.
• A common practice is for firms to generate invoices which under-report the real value/quantities coming through customs. In addition, some products may be deliberately mislabelled (e.g. components instead of final goods), resulting in a significant mark-up upon sale to the final consumer but no gains to the state coffers. Section 2.2.3 and Annex A, section A.2, provide empirical and anecdotal evidence to support this hypothesis.
3.4.2 The Interaction between the formal and informal sides of the economy
The issues highlighted above do not represent an exhaustive list of the mechanisms by which the state is losing potential tax revenue. As previously stated, the aim of the exercise was to obtain a perspective as to the broad nature and scale of the informal economy, thus providing a basis for the subsequent company level analysis. This qualitative exercise also highlighted a number of relevant issues in relation to the interaction between the formal and informal sectors.
Two-Tier Tax Regime
Table 3.1 illustrates that relatively little tax revenue is collected from VAT and SBT. The reason for this appears to be the direct result of the interaction between these two taxes, referred to here as the “two-tier taxation regime”. The co-existence and interaction of a double taxation regime, one for companies with an annual turnover above Lek 8 million (€ 63 000), subject to VAT and CIT, and one for companies with an annual turnover below Lek 8 million, subject to a flat rate tax of 4% of total turnover (no VAT, no company income tax) means (as shown below) that companies have a strong incentive not to report part of their turnover in order to remain subject to the SBT. The mechanisms for this partly reflect both risks and rewards. On the rewards side, we show that, in practice, the marginal tax rate for companies operating above the VAT threshold is greater than 100% for additional income just over the threshold. On the risks side, the probability of detection is related to the probability of being audited. In 2003, two-thirds of companies with turnovers greater than Lek 8 million were audited by tax-administration inspectors but less than 10% of small businesses were audited. And even where detection did occur the available evidence suggests that this was only partially successful. The analysis of company data seeks to

Chapter 3 THE IMPACT OF THE TAX AND SOCIAL SECURITY CONTRIBUTION REGIME ON COMPANY BEHAVIOUR
60 THE INFORMAL ECONOMY IN ALBANIA: ANALYSIS AND POLICY RECOMMENDATIONS - ISBN 92-64-010254 - ©OECD 2005
quantify the extent to which Albanian companies at the margin have an incentive to declare annual turnover below the Lek 8 million threshold. It also provides an indication of the level of under-reporting needed to achieve this and the associated level of VAT and CIT evasion.
Transactions among Firms Subject to Different Tax Regimes
A key factor enabling larger companies to evade VAT payments is the interaction between firms that are eligible for VAT and those that are not. Whilst the tax office can keep track of the VAT chain (bearing in mind the fact that this chain may be underestimated in the first place due to “leaks” at customs – see below) for firms that are VAT registered, this does not apply to non VAT registered enterprises.
Transactions between VAT and SBT taxpayers are subject to simple invoicing, rather than the more stringent invoicing requirements set by the Tax Administration for VAT transactions. This process facilitates the non-reporting of real turnover resulting from those transactions. There is, therefore, an important discontinuity in the reporting of the value added chain, thus generating scope for systematic VAT and CIT avoidance.
The Role of Customs Administration
Anecdotal evidence points to a widespread practice of significantly under-declaring values and volumes of imports; and a less common practice of over-declaring the value of exports, since reimbursement applications for VAT on exports are processed with significant delays. Moreover an examination of the effective customs and excise rates applied to imported goods more generally reveals significant scope to evade these taxes by mis-labelling products. VAT and the excise tax on imports are imposed by the Customs Administration, rather than the Tax Administration, together with customs duties at the point of entry.
Albania depends heavily on imports. The official figure for imported goods amounts to close to 30% of GDP (EIU, 2002), however, qualitative research suggests that the value added chain is often broken at a very early stage. Companies that manage to reduce VAT and customs duty payments at the point of entry acquire a considerable margin over competitors subject to full tax payments. Many of the manufacturers interviewed complained strongly of unfair competition from parallel imports.
The consequence is that there is a loss of state tax revenue at the border, as well as at the end of the value-added chain, since companies only charge VAT at the declared value. The rest of the margin charged is typically received in cash, thus adding to under-reported turnover. Therefore, there are questions to be raised about the role played by the Customs Administration and the levels of collusion that may exist between customs officials and businessmen. Various attempts are being made to reform the Customs Administration and two major programmes financed by the European commission and USAID are currently underway. However, further improvement in the performance of the Customs Administration would be an important component of any strategy directed at reducing the size of the informal economy. Unless the “leakage” is stopped at customs, the chances of capturing greater tax revenues down the value added chain are limited. In addition, any attempt to enforce greater tax compliance in relation to local producers without intervening at the same time on the leakage at customs, would put local companies at even greater competitive disadvantage.

Chapter 3 THE IMPACT OF THE TAX AND SOCIAL SECURITY CONTRIBUTION REGIME ON COMPANY BEHAVIOUR
THE INFORMAL ECONOMY IN ALBANIA: ANALYSIS AND POLICY RECOMMENDATIONS - ISBN 92-64-010254 - ©OECD 2005 61
The Role of the Tax Administration
The role of the Tax Administration is perceived by the private sector to be problematic and it is seen as largely ineffective in curbing the growth of the informal economy in Albania. A key issue of concern is that the activities of the Tax Administration appear to be driven essentially by the need to raise revenue for the national budget, with apparently little consideration given to fair and equal treatment of tax payers.
Tax targets are pre-determined on a monthly basis and local Tax Offices are obliged to meet those targets. A system designed on this basis is likely to result in highly arbitrary and non-transparent activities which cause resentment on the part of the enterprises and fuel the incentive to operate outside of the legal environment, to the extent that this is possible. Enterprises which are thought, by the tax inspectors, to be particularly profitable or liquid become the target of intense inspections which, in some cases, verge on harassment. The general perception of the business community is that until the Government of Albania makes realistic revenue projections, there will continue to be undue pressure on both the Tax Administration and thus businesses too (OECD-EBRD-DG Enterprise, forthcoming). This in turn, requires a broadening of the tax base and a reduction in the informal economy.
At present the central administration gives highest priority to the monitoring of tax collection from the largest tax payers (large enterprises). Small business tax collection activity is delegated to the local Tax Offices, which are requested basically to fulfil their target of tax collection, without providing much further information.
This system is consistent with an approach directed at maximising short term tax revenues given the current levels of capacity, but it does not provide an incentive for local Tax Offices to explore ways of broadening the tax base. A weak internal reporting system results in an asymmetry of information between the local Tax Offices and the central administration that can be exploited by local tax officials in terms of hiding potential tax revenues from the central administration, thus lowering their tax collection targets and, at the same time, maximising the scope for rent seeking from local companies. An EU funded technical assistance programme is currently seeking to improve the operation of the Tax Administration and its internal reporting system.
Another important development relates to the transfer of responsibility for the collection of social security contributions from the Social Security Contributions Institute to the Tax Administration. This process started in November 2003, when all large firms were transferred. In May 2004, VAT registered firms were transferred and in January 2005 the remainder (micro and small firms) will be transferred to the Tax Administration. This reform seeks to increase the efficiency of social security contribution collection. The Tax Administration has many more inspectors (about 1,500), greater expertise and experience in collecting debt, greater powers to acquire/ check information, etc., however, it is unclear whether the tax inspectors will have sufficient incentives to collect social security contributions more effectively than was the case with the Social Security Contributions Institute’s own inspectors.
These preliminary observations suggest a need to extend the VAT base so as to potentially reduce tax evasion. However, any substantial change in the design of the current tax regime would need to reflect the capacity of the Tax Administration to cope effectively with such reform. A number of Technical Assistance projects are being implemented specifically to enhance the capacity of the Tax Administration.

Chapter 3 THE IMPACT OF THE TAX AND SOCIAL SECURITY CONTRIBUTION REGIME ON COMPANY BEHAVIOUR
62 THE INFORMAL ECONOMY IN ALBANIA: ANALYSIS AND POLICY RECOMMENDATIONS - ISBN 92-64-010254 - ©OECD 2005
Minimum Salary and Social Security Contributions
Social security contributions are being systematically avoided by firms. The norm in the private sector is for employers to pay the statutory minimum salary, thus avoiding anything but the minimum social security contributions, since these are thought to be excessive (currently 41.9% of gross salaries). A wage top-up is paid in cash, typically with no salary slips given.
In the case of family businesses, the situation is even more extreme. In order to obtain the annual operating licence, firms have to prove that they have paid their taxes and social security contributions. This usually applies to the person who registered the company, and s/he typically receives the minimum salary. Although Albanian businesses tend to employ other family members, these are rarely declared and receive their salary payments in cash. The Labour Inspectorate is aware of this fact but notes, with some justification, that it is very difficult for them to prove whether family members are truly working for a business or not.
Such an extensive system can only operate if there is a high level of collusion between employers and employees, based on the interest of employees in maximising present revenues instead of the current and future benefits, and the employers’ preference for cash transactions that leave no record in the formal company accounts.
In general, employees seem to have a limited trust in the ability of the state to provide social security benefits, either currently or in the future, reflecting the current relatively poor level of medical and social assistance provided by the state health and pension system. The consequence is higher levels of evasion highlighted by the fact that the official wages in the public sector are 1.5 times as high as those in the private sector. The statutory minimum salary falls below the threshold for PIT but the systematic under-reporting of real salaries leads to significant avoidance of PIT, to the point that such revenues are generated almost exclusively by public sector employees.
Although the Labour Inspectorate estimates that as many as 30% of those working are not registered (this figure only takes into account officially registered enterprises, reflecting the fact that the Labour Inspectorate is not tasked with tackling the unregistered part of the informal economy), its procedures do not discourage such practices. Employers that are discovered to be employing people illegally are given a warning and required to employ those workers officially. The 103 inspectors operating in 36 cities then check whether the illegal employees have been formalised or not. Fines may be charged at 50 times the minimum wage (not per employee), however, only 50 fines were issued between January and May 2004 (worth Lek 6 million) and only 20% of these have been collected. While the rewards of operating informally are evident, the risks appear to be limited.
The budgetary impact of social security avoidance is, therefore, considerable, albeit difficult to quantify, and is amplified by its association with avoidance of PIT. It can be argued that social security avoidance, being so wide-spread and compensated by direct payments to employees, has a less distorting impact on enterprise competition than other factors such as CIT and VAT tax avoidance.
However, the impact of social security avoidance on the development of the enterprise sector, particularly in the medium term, could be more significant. With a labour market characterised by high job insecurity, lack of formal employment contracts and opaque compensation scales, companies may be less willing to invest in the training of their employees and, at the same time, employees may be less concerned about their career prospects. Albania has a form of dual labour market, with emigration being an alternative to unemployment or a low salary and harsh labour conditions at home. Consequently, any intervention that results in a lower net salary for employees or in higher labour costs for employers may alter the balance in the labour market and create an additional incentive for emigration.

Chapter 3 THE IMPACT OF THE TAX AND SOCIAL SECURITY CONTRIBUTION REGIME ON COMPANY BEHAVIOUR
THE INFORMAL ECONOMY IN ALBANIA: ANALYSIS AND POLICY RECOMMENDATIONS - ISBN 92-64-010254 - ©OECD 2005 63
The links between social security avoidance, the compensation scales, the dynamic of the labour market and skills development fall outside the scope of this report, however, the European Training Foundation is currently conducting a study on precisely these issues.
The Role of the Cash Economy
Although many companies may possess bank accounts, almost all business transactions are conducted in cash, leaving no trace for public authorities. This applies to domestic as well as foreign transactions, where the typical modus operandus is for payments to be made as a mixture of cash (not declared) and bank transfers (basis for official declarations). Although some of the official transactions may involve depositing in bank accounts (for example, in order to deal with excess liquidity and conduct the minimum transactions required by law), these are typically withdrawn as cash, which means that tax authorities lose track of what happens next. This problem is compounded by the significant role played by remittances since they are typically cash in nature and rarely find their way into the commercial banking system.
Since cash plays such a dominant role, it is very hard for tax authorities to keep track of the real transactions being undertaken and thus to estimate firms’ real turnover. The programme for the reduction of the cash economy led by the Bank of Albania is, therefore, a key component of a strategy aiming at a progressive formalisation of the informal economy.
3.5 Analysis of Company Behaviour
3.5.1 The Risks and Rewards Approach
As previously pointed out, the approach employed here is to identify and quantify the risks/costs and the rewards/benefits associated with different levels of informal activity. The underlying assumption is that enterprises decide on the level of informality at which to operate on the basis of the actual rewards/benefits (such as higher profit margins, non state interference, etc.) as well as the perceived risks (such as fines, bribes, higher financing costs, etc.).
At the individual level, an enterprise will continue to operate informally as long as the perceived rewards, adjusted by the risk of being prosecuted by the authorities, are higher than the costs involved with running informal operations. The latter costs typically include setting aside reserve funds to cover possible fines, bribery, running dual accounts, higher financing costs, etc.
At the aggregate level, as long as a significant share of enterprises continues to operate informally, greater proportions of formal enterprises will be forced to adapt to the market conditions and shift some or all of their operations towards informality. But, by operating both on the fiscal and regulatory levers (“the carrot”), as well as on the punitive lever through inspections, fines and other measures (“the stick”), it should be possible to shift the balance towards formal operations. In other words, by operating both on the carrot and the stick, it is theoretically possible to shift the balance between the risk-adjusted profit margin associated with non compliance (the higher the level of non compliance, the higher the risks) and that associated with full compliance. When the pressure from unfair competition starts to subdue, enterprises should find it easier to comply with taxes and regulations, setting the basis for a virtuous circle.

Chapter 3 THE IMPACT OF THE TAX AND SOCIAL SECURITY CONTRIBUTION REGIME ON COMPANY BEHAVIOUR
64 THE INFORMAL ECONOMY IN ALBANIA: ANALYSIS AND POLICY RECOMMENDATIONS - ISBN 92-64-010254 - ©OECD 2005
Inappropriately designed and targeted measures could have a considerable impact on the enterprise sector, given the significant size of the informal economy in Albania. The risk/reward approach contributes to finding the right balance between the carrot and the stick. If the government overdoes the use of the carrot, it will lose valuable tax revenues and it may end up unnecessarily lowering the tax burden; including giving tax reductions to non-marginal enterprises that could well afford to pay the usual taxes. Alternatively, any excessive cuts in social security contributions, could threaten the level of social benefits for employees such as health insurance, pensions and unemployment benefits. At the same time, overdoing the stick could drive a large number of marginal enterprises out of business or increase the scope for corruption.
3.5.2 Company Data
Access to reliable company financial data that reflect both the actual enterprise performance (profit margin, cost structure, etc.) and the real level of tax compliance is the basis for the risk/reward analyses developed here. Such data are difficult to collect as they are highly confidential and companies are reluctant to disclose such information through interviews or company surveys. The experience of this project is that entrepreneurs were willing to discuss issues such as under-reporting of turnover and tax avoidance as long as the discussion remained at a sectoral level. This information provides valuable insights but is insufficient for an in-depth analysis.
The solution to finding a reliable source of direct observations was to examine company financial data collected by the Albanian banking sector through firms’ applications for commercial loans, as well as from loan monitoring activity. Company data were collected by the financial institutions co-operating with this project without infringing confidentiality rules. The data were provided in an aggregate form and precautions were taken to ensure that the companies included in the sample could not be identified.
A sample of 167 companies was extracted from over 10,000 loan application files. However, following a process of data cleaning only 87 companies could be used in the analysis due to a mixture of insufficient information, inconsistent data, etc. The quality of the available information is, however, considered to be high since firms had an incentive to disclose information correctly, in order to gain the trust of the banking institutions they contacted for a loan.
The 87 firms corresponded to the following sectors of economic activity, which according to INSTAT, represent the sectors exhibiting the highest levels of potential for operation in the informal economy:
• Agro-industry (12 firms).
• Construction (11 firms).
• Building materials (15 firms).
• Hotels, restaurants and cafés (14 firms).
• Light industry (14 firms).
• Retail sector (11 firms)
• Other services (10 firms).
The sample of companies is made up of legal, registered and active enterprises which are mainly micro, small and medium in size. These enterprises are not particularly cash rich otherwise they would not apply for bank loans but are profitable and display growth potential, otherwise commercial banks

Chapter 3 THE IMPACT OF THE TAX AND SOCIAL SECURITY CONTRIBUTION REGIME ON COMPANY BEHAVIOUR
THE INFORMAL ECONOMY IN ALBANIA: ANALYSIS AND POLICY RECOMMENDATIONS - ISBN 92-64-010254 - ©OECD 2005 65
would not approve their loan applications. Thus the sample is biased towards registered small and medium enterprises and under-represents marginal / subsistence / unregistered enterprises. Nevertheless, this company dataset provides a basis for obtaining an indication of the general level of tax and social security contributions compliance, according to various sectors of economic activity. It is stressed that the sample of companies is not random and, so, no statistical significance is inferred from the analysis to follow.
An overview of the risk-reward analysis used
The first step in risk/reward analysis is to use the aggregate empirical data to quantify the level of the average enterprise profit margin (on a cash flow basis) associated with different levels of compliance; repeating the exercise for different types of taxes (SBT, CIT and VAT).
The second step consists of developing a number of simulations, based on the indications given by the company data, to evaluate the impact of different mixes of tax policy measures on the profit margins, given a number of assumptions about the levels of tax compliance.
Although it would have been useful to extend the analysis to employment, salaries and social security contributions, and indeed data on these issues were collected, the lack of other relevant data (e.g. whether staff were part-time or full time, registered or unregistered etc.) meant that this was not feasible. It is expected that employment and social security issues will be dealt with in more detail in the forthcoming ETF report.
3.5.3 Company Data Analysis: Key Findings
The interviews indicated that company behaviour varies markedly according to the nature of the tax regime. As a consequence, the risk/reward analysis was carried out according to four levels of turnover: Lek 2-8 million (24 companies), Lek 8-20 million (23 companies), Lek 20-40 million (16 companies) and Lek 40+ million (13 companies). Firms with turnovers below Lek 2 ml were excluded (11 companies), as this category is typically made up of very small family business, their impact on total tax revenues is marginal and such firms are rarely a significant source of unfair competition.
Based on the aggregated company financial statements, a number of financial performance indicators were calculated, as reported in Table 3.2.
Table 3.2: Financial Performance Indicators (2004)
Indicators T/over 2ml L<>8ml L
T/over 8ml L<>20ml L
T/over 20ml L<>40ml L
T/over >40ml L
Total costs % of turnover 71.8% 76.6% 76.6% 78.9% Total labour costs % of total costs 9.8% 9.9% 17.6% 8.2% Mark-up margin on total costs 37.3% 27.8% 29.1% 25.8% Gross profit margin as % of total sales 26.7% 21.3% 22.3% 20.4% CIT-SBT tax % of gross profit 5.7% 5.1% 6.4% 7.8% Municipal tax % of gross profit 3.3% 2.8% 0.9% 0.3% Profit after tax % of turnover 23.9% 19.6% 20.7% 18.7% Net VAT % of value added 0.0% 2.3% 1.2% 7.9%

Chapter 3 THE IMPACT OF THE TAX AND SOCIAL SECURITY CONTRIBUTION REGIME ON COMPANY BEHAVIOUR
66 THE INFORMAL ECONOMY IN ALBANIA: ANALYSIS AND POLICY RECOMMENDATIONS - ISBN 92-64-010254 - ©OECD 2005
The information obtained from companies applying for commercial loans suggests the following broad scenarios:
Cost structure
• The total costs to turnover ratio is relatively stable (71.8 – 78.9%) across all categories of enterprise.
• The same applies to the ratio of total labour costs to total costs, with the exception of the Lek 20<>40 ml bracket (17.6%), possibly reflecting the inclusion of dis-proportionally more companies operating in labour intensive sectors in this turnover bracket.
• The labour costs are likely to be under-reported since employees often receive cash supplements (which may or not be included in the above data) and family members are typically not included in entrepreneurs’ assessment of labour costs.
Gross Profit Margins
• Based on the interviews, small entrepreneurs calculate their profit as a mark-up over total costs or as a percentage of total sales.
• All categories of companies reveal a relatively high gross profit margin (20.4% - 26.7%). From the gross profit, firms must deduct salaries, finance new investment, etc. as this is supported largely by internally generated funds. The higher profit margin recorded by companies below the Lek 8 million threshold (37.3%), probably includes the salaries of the entrepreneur and family members working in the firm.
• The profit margins are higher in the two categories above the Lek 8 million threshold than in the category above Lek 40 million. The very low VAT payment figures in these two categories suggest that the bulk of these companies probably declare themselves as SBT payers, and so declare turnovers of less than Lek 8 million.
Tax payments
• The share of gross profit used to pay for SBT/CIT tax is relatively low (ranging from 5.1% to 7.8%), regardless of the level of turnover. The incidence of SBT/CIT tax avoidance is examined in more in detail below. The main point to note at this stage is that actual CIT payments are much lower than would be expected since CIT applies to all companies with a turnover above the Lek 8million threshold and the standard CIT rate is 25%.
• The municipal tax is important for companies with low levels of turnover (up to 3.3% of gross profit) but obviously becomes progressively less significant with increasing levels of turnover (0.3% of gross profit in the case of companies with a turnover above Lek 40 million).
VAT Compliance
• No VAT is payable for companies below the Lek 8 million threshold, but those with a turnover above this only pay 1.2% - 8% on the value added generated. A priori, even after taking account of exemptions (which are not likely to be large given the sectors and size of the

Chapter 3 THE IMPACT OF THE TAX AND SOCIAL SECURITY CONTRIBUTION REGIME ON COMPANY BEHAVIOUR
THE INFORMAL ECONOMY IN ALBANIA: ANALYSIS AND POLICY RECOMMENDATIONS - ISBN 92-64-010254 - ©OECD 2005 67
companies), the expectation would have been for a figure closer to 20%, the on going VAT rate, suggesting that a significant amount of VAT is being avoided by companies.
• The rate of apparent VAT evasion is higher for companies in the two brackets above the Lek 8 ml threshold and increases markedly in the Lek 40 mil bracket, albeit well below the 20% rate.
3.5.4 How companies respond to signals sent by the current tax and social contribution regimes: some initial observations
The company analysis findings mentioned above provide scope for some preliminary observations. The first is that the company financial performance indicators broadly confirm the findings that emerged from the business interviews. Companies operating under the SBT tax regime enjoy a lower tax burden than companies operating under the CIT+VAT tax regime, as illustrated by the spread in the after tax profit margin between the below Lek 8 million and the above Lek 40 million brackets. Moreover, given the very low levels of SBT/CIT paid by enterprises operating above the Lek 8 million threshold, it appears that the bulk of these companies (certainly those with turnovers between Lek 8 and 40 million) substantially limit their tax payments by under-reporting their turnover and thereby qualifying for the SBT tax.
A second consideration applies to the behaviour of bigger companies. VAT and tax payment data indicate that companies with turnovers above Lek 40 million are also able to substantially limit their tax payments. Enterprises in this class appear to reduce their tax liabilities either by declaring a turnover below Lek 8 million, thus qualifying for the SBT, or by simply under-reporting part of their turnover for VAT purposes, and, thus, declaring lower profits for CIT purposes. As shown in section 3.6.4, the former method implies a much higher rate of turnover under-reporting than the latter.
Finally, the data set reported in table 3.2 indicates that the banking sector requires companies to have an after tax profit rate of around 18-23% in order to be deemed credit-worthy. Companies recording an after-tax profit margin below this range are likely to find it difficult to access external financial sources and thus expand their businesses. This applies to bank loans and probably even more so to equity finance, since equity investors are typically willing to take higher risks but also demand higher returns. Therefore, a working assumption is that the minimum acceptable net growth profit rate (as a % of turnover) is likely to be in the 20-25% range for companies above the Lek 8 million threshold, with the exception of the retail sector (see table 3.5) where the rate is significantly lower, reflecting the different nature of the business.
According to qualitative interviews with Albanian businesses, a mark-up of around 15% over total costs is needed to keep a small family enterprise with a turnover of just above Lek 8 millions in business. A 15% mark-up just about assures a reasonable salary for the entrepreneur and the family members working in the firm, leaving no funds left for expansion. A gross mark-up rate of around 15% of total costs, at the current rate of tax compliance, is equivalent to an after tax profit rate on turnover of about 13%. This may be called the subsistence profit rate.
This rate may appear to be relatively high, but firms in Albania have to maintain a surplus margin in order to deal with the uncertainties of the business environment. These range from frequent energy black outs, requiring companies to acquire their own generator, to temporary disruption of inputs supplies or the sudden demands of the arbitrary tax collection system. Most small enterprises cannot rely on bank credit to smooth temporary liquidity crises and without cash reserves risk going under at the occurrence of the first unexpected event. Following this line of reasoning, it can be assumed that in a highly

Chapter 3 THE IMPACT OF THE TAX AND SOCIAL SECURITY CONTRIBUTION REGIME ON COMPANY BEHAVIOUR
68 THE INFORMAL ECONOMY IN ALBANIA: ANALYSIS AND POLICY RECOMMENDATIONS - ISBN 92-64-010254 - ©OECD 2005
competitive environment, tax evasion is not so much a choice for most of the small and medium size companies but a necessary tool to achieve an acceptable profit margin, particularly when the risks of being caught and fined are limited.
Using the stick more effectively, through higher fines and more frequent tax inspections, may increase the level of tax compliance. But leaving the current tax regime unchanged may push the after tax profit rate below the growth profit rate and bring to a halt the expansion of the private enterprise sector. Moreover, if the profit rate is pushed down below the subsistence profit rate, many small and marginal family firms are likely go out of business with possible serious social and political consequences since the micro enterprise sector is a major source of employment in Albania.
Faced with an increased tax burden, companies have another alternative to protect their margins, namely to increase tax evasion by paying more bribes. The final outcome of increased tax enforcement will, therefore, depend on the ability of the government to curb bribery and corruption.
3.5.5 Broad estimates of the average level of tax evasion, turnover under-reporting and informality reward
The next part of the company analysis is devoted to exploring the initial observations described above. The first step is to calculate the current level of tax avoidance and turnover under-reporting and then to assess the impact of full compliance on after tax profits. The starting point of the analysis is the observed after tax profit margin, calculated as a percentage of total sales. Table 3.3 sets out these margins for all the sectors of activity covered by the dataset.
Table 3.3: After Tax Profits Margins by Sector of Activity (2004)
Indicators
T/over 2ml<>8ml L
T/over 8ml<>20ml L
T/over 20<>40ml L
T/over >40ml L
Profit after SBT-CIT Tax/Turnover Ratio
Construction 44.1% 18.2% 20.8% 19.0% Materials 21.5% 17.4% 16.4% 27.0% Other services 43.1% 15.7% 21.3% 22.1% Agro-industry 21.6% 30.3% 28.4% 12.5% Light Industry 30.2% 19.1% 16.8% 16.6% Hotels/restaurants./cafes 24.7% 25.7% 25.6% N/A Retail sector 15.7% 14.8% 7.9% 21.0%
The after tax profit margin is around 20% for companies above the Lek 8 million threshold, but
much higher for the smaller enterprises (around 30%). This relatively low after tax profit rate in the retail sector is not indicative of a higher level of tax compliance, rather it reflects the lower ratio of turnover to value added that is typical of retail operations.
The company dataset included figures for total turnover, gross profits, SBT, CIT and municipal tax payments. On the basis of these data, it was possible to calculate how much SBT should have been paid by companies with a turnover below the Lek 8 (applying the current 4% rate on turnover), as well as how much CIT should have been paid by companies above the Lek 8 million threshold (applying the current 25% rate to gross profits). The full compliance SBT-CIT tax payment is calculated without taking into consideration tax deductions for depreciation, carry forward losses and tax credits and is, therefore, an approximation of the effective tax liabilities.

Chapter 3 THE IMPACT OF THE TAX AND SOCIAL SECURITY CONTRIBUTION REGIME ON COMPANY BEHAVIOUR
THE INFORMAL ECONOMY IN ALBANIA: ANALYSIS AND POLICY RECOMMENDATIONS - ISBN 92-64-010254 - ©OECD 2005 69
By subtracting the imputed tax payment from the actual gross profit figure, it is possible to obtain the after profit figure after SBT-CIT tax consistent with full compliance, all other things being equal. Table 3.4 reports the after profit margin at full compliance, calculated as a percentage of turnover.
Table 3.4: Profits after Tax at Full Compliance (2004)
Indicators
T/over 2ml<>8ml L
T/over 8ml<>20ml L
T/over 20ml L<>40ml L
T/over >40ml L
After tax profit rates at full compliance
Construction 42.6% 15.0% 16.8% 17.2% Materials 20.1% 14.2% 13.3% 21.1% Other services 42.1% 14.7% 25.3% 16.7% Agro-industry 19.0% 24.1% 22.6% 9.9% Light Industry 29.6% 15.0% 13.4% 12.9% Hotels/rest./cafes 23.8% 21.4% 19.7% N/A Retail sector 13.1% 11.8% 6.2% 16.1% Average 27.2% 16.6% 16.7% 15.7%
A comparison of Tables 3.3 and 3.4 illustrates that the reduction in the after tax profit is relatively small for companies below the Lek 8 million threshold, but is slightly higher for companies in the other categories. This is mainly because the effective SBT rate on profit is much lower than the CIT rate. Small companies have a lower incentive to evade SBT since the gains are proportionally smaller than in the case of CIT payers. However, it is worth noting that, with the exclusion of the “below 8 million turnover” category, the average after tax profit rate for all other categories of enterprise would fall substantially below the 18-23% margin previously identified as the minimum acceptable net growth profit rate and would have important implications for the sustainability of the current tax regime. This, of course, partly reflects the inclusion of the retail sector, where the profit rates can be expected to be generally lower, however, even excluding the retail sector, it is clear that in many sector-turnover bands the rate falls below the 18-23% range; particularly in those enterprises with turnovers above Lek 40 million.
Table 3.5 shows the additional gross profit reduction that companies would sustain if they complied fully with SBT and CIT requirements. The profit reduction is calculated by dividing the SBT-CIT tax shortfall by the gross profits.
Table 3.5: Reduction in after tax profit due to full compliance by Sector of Activity (2004)
Indicators
T/over 2ml<>8ml L
T/over 8ml<>20ml L
T/over 20ml<>40ml L
T/over >40ml L
Reduction in after tax profit due to full compliance
Construction -3.2% -16.0% -17.9% -13.6% Materials -5.9% -17.0% -18.0% -20.9% Other services -2.2% -5.2% -11.9% -24.4% Agro-industry -11.3% -19.3% -19.1% -19.8% Light Industry -1.6% -20.4% -19.0% -21.7% Hotels/rest./cafes -3.3% -14.8% -22.7% N/A Retail sector -15.1% -19.2% -20.4% -22.7%
Companies with turnover above Lek 40 million would see their profits reduced by one fifth, if they became fully compliant. The figures reported in Table 3.5 can be seen as indicators of the rewards reaped by companies for operating at the current level of informally. Table 3.6 shows SBT-CIT tax evasion as a percent of SBT-CIT taxes expected under full compliance by sectors.

Chapter 3 THE IMPACT OF THE TAX AND SOCIAL SECURITY CONTRIBUTION REGIME ON COMPANY BEHAVIOUR
70 THE INFORMAL ECONOMY IN ALBANIA: ANALYSIS AND POLICY RECOMMENDATIONS - ISBN 92-64-010254 - ©OECD 2005
Table 3.6: Percentage of SBT-CIT evaded by Sector of Activity (2004)*
Indicators
T/over 2ml<>8ml L
T/over 8ml<>20ml L
T/over 20ml L<>40ml L
T/over >40ml L
SBT-CIT Tax Evasion Indicators
Construction 37.5% 82.8% 74.8% 54.3% Materials 37.0% 72.6% 71.8% 89.2% Other services 25.8% 56.5% 85.2% 98.3% Agro-industry 64.8% 83.9% 76.4% 81.0% Light Industry 27.8% 84.3% 83.1% 86.8% Hotels/rest./cafes 48.3% 85.4% 96.1% N/A Retail sector 64.4% 92.4% 81.7% 92.5% * SBT applies to companies with a turnover below Lek 8 million; CIT to all companies with a turnover above this threshold
To complete the analysis, Table 3.7 shows a Total Evasion Index, - total unpaid taxes (SBT, CIT and VAT), as a per cent of the total for these taxes that would be expected under full compliance; all other things equal. The table shows that this is running at very high levels (ranging from 37.8% - 81.5%), partly reflecting the fact that firms need to under-report their turnover very significantly in order to make relatively marginal gains in net profitability. This final point has important implications both for understanding the dynamic behind the growth of the informal economy and for drawing policy conclusions.
Table 3.7: Percentage of Taxes (SBT-CIT-VAT) evaded by sector of Activity (2004)
Indicators
T/over 2ml L <>8ml L
T/over 8ml L<>20ml L
T/over 20ml L<>40ml L
T/over >40ml L
Total Tax Evasion Index - % of total unpaid taxes
Construction 37.5% 91.1% 81.5% 46.7% Materials 35.7% 84.4% 75.9% 29.2% Other services 25.8% 70.9% 95.2% 98.2% Agro-industry 64.8% 92.8% 78.3% 82.1% Light Industry 27.8% 93.4% 93.9% 94.0% Hotels/rest./cafes 48.3% 79.1% 98.2% N/A Retail sector 64.4% 88.0% 90.5% 94.8%
3.5.6 The Risk-Reward Balance
As previously mentioned, the profit margin recorded by companies operating informally needs to be adjusted for the costs and risks associated with evasion.
Risk of being Inspected and Fined by Tax Inspectors
Table A.17 in the Annex A shows the level of the main taxes evaded and uncovered by tax administration auditors in VAT registered enterprises in 2003. The table also shows the value of fines imposed. The level of informal economy activity (gross value-added) consistent with the levels of tax evasion discovered by tax inspectors is estimated at Lek 19 billion (see Annex A, section A.3.6.), and compares with the Lek 57 billion of informal value-added for VAT paying enterprises in 2001; estimated using the more comprehensive national accounts based approach, described in section 2 and annex A (see also Tables 2.3 and A.14).

Chapter 3 THE IMPACT OF THE TAX AND SOCIAL SECURITY CONTRIBUTION REGIME ON COMPANY BEHAVIOUR
THE INFORMAL ECONOMY IN ALBANIA: ANALYSIS AND POLICY RECOMMENDATIONS - ISBN 92-64-010254 - ©OECD 2005 71
Therefore, based on national accounts data, the conclusion that can be drawn is that audits of VAT paying companies are at best 33% (19/57) effective. In truth, they are likely to be considerably less effective than this; probably closer to 20-25% given the upper bound nature of the numerator and the fact that the denominator reflects informal activity in 2001, not 2003. (See Annex A, Section A.3.6)
However, even if we assume that the 33% rate is correct, meaning that, on average, audited companies manage to evade paying taxes on two-thirds of their under-declared value-added and we further assume the same levels of detection apply to VAT, Excise duties, Gambling tax and the National tax, we can estimate that, although, Lek 3.51 billion unpaid taxes were discovered by tax inspectors, Lek 3.51*(1/0.33)-Lek 3.51 billion = (Lek 7.12 billion) was the amount of tax evasion that remained undetected in 2003 in VAT registered audited enterprises This is considerably higher than the Lek 1.63 billion paid in fines3(Table A.17), suggesting that on average it pays for enterprises to operate informally, even if they are audited, as the risks and costs of detection (Lek 1.63 billion, excluding bribes) are outweighed by the benefits (Lek 7.12 billion). However, as shown in Table 3.8 below, the average level of bribes in Albania is significant, amounting to 3.3% of turnover on average. If we assume that value-added makes up about one-third of turnover this is equivalent to nearly 10% of value-added; which is very large. Some of this, of course, will not be related tax evasion. If we assume that one-third of the rate does reflect evasion however, then total bribes paid by VAT paying enterprises, engaged in some informal activities, is approximately Lek 3.9 billion4, approximately two-thirds of which is probably paid by audited companies = Lek 2.6 billion5. This means that of the total unpaid (and undetected) taxes of Lek 7.1 billion by audited enterprises, on average, Lek 2.6 billion is redistributed as bribes and Lek 1.6 billion as fines; leaving a still relatively large Lek 2.9 billion premium for audited enterprises6. Moreover, not all enterprises are audited. In 2003 for example roughly one-third of large active enterprises were not audited.
Similar conclusions can be drawn for incorporated enterprises that are not VAT registered. Here, audit data revealed under-declarations of turnover consistent with undeclared value-added of Lek 15.2 billion, less than 40% of the estimated value of under-declared value-added of Lek 38.9 billion (based on the simulated GVA estimates in Table A.14). Moreover 92.5% of small enterprises (a measure of risk) were not audited at all.
Risk of being Inspected and Fined by Labour Inspectors
Unfortunately little data was made available on inspections beyond information gained during discussions with officials from the Labour Ministry and Social Security administration. These discussions revealed that, on average, 30% of workers in enterprises inspected by labour inspectors were not registered. The discussions also revealed, however, that the risk of fines due to social contribution evasion is so low as to be negligible, (commonly, for example, enterprises are given a first warning when evasion is discovered). This is particularly the case where companies pay the minimum social security contributions based on the minimum wage, since under these circumstances the ability of inspectors to detect evasion is severely limited.
Bribes to Evade Taxes and Social Security Contributions (without sanctions and fines)
Data from the 2002 BEEP Survey, the FIAS Company Survey and the World Bank Early Warning and Trade Facilitation Progress Reports, indicate that bribing in Albania is a widespread practice, as are kickbacks (sums paid to receive government contracts). Of the 26 countries listed in this survey, Albania topped all the categories listed in table 3.8, except for the average bribe tax, where it ranked second, after the Kyrgyz Republic (3.7).

Chapter 3 THE IMPACT OF THE TAX AND SOCIAL SECURITY CONTRIBUTION REGIME ON COMPANY BEHAVIOUR
72 THE INFORMAL ECONOMY IN ALBANIA: ANALYSIS AND POLICY RECOMMENDATIONS - ISBN 92-64-010254 - ©OECD 2005
Table 3.8: Bribes and Kickbacks Paid in 2002 (BEEPS)
Country Share of firms paying bribe tax
Average bribe tax Share of firms paying kickbacks
Average kickback tax
Albania 77.1 3.3 68.8 6.0 Bulgaria 51.2 1.9 37.2 2.5 Croatia 24.6 0.6 11.2 0.9 fYR Macedonia 61.2 0.8 44.1 2.9 Slovenia 14.9 0.8 12.8 0.7
Source: Fries et al (2003, Table 3)
The picture that emerges from these surveys suggests that companies are making frequent resort to bribery. Overall, companies end up by diverting a not insignificant part of their revenues to the payment of bribes; estimated in the 2002 BEEP Survey to be an average of 3% of turnover. This figure includes all bribes paid by companies to public officials such as tax officials, for permits and licences and dealings with other administrative requirements.
Relation between Bribing and Informal Operations
It seems fair to say that companies that practice tax evasion are more easily blackmailed by tax and customs officials and, therefore, are more prone to paying bribes in exchange for lenient treatment. The interviews with Albanian firms indicated that entrepreneurs see bribes as little different to any other business cost and consider it as an ‘insurance’ payment against the risk of being fined or heavily fined. The 3% average bribe tax indicated in the BEEP Survey, effectively offsets the payment of fines.
As previously noted, most tax and social contribution evasion is carried out by registered companies that regularly pay the minimum tax and social security contributions. As in any system, there are cases of total evasion, but these require a higher level of collusion between companies and public officials, particularly in the case of relatively large operations. The information available suggests that, for medium and large operations at least, this type of evasion is of a lower order of magnitude.
A single bribe is normally too small for a company to resist and costs of pursuing a case against the corrupt officials too great, especially given the fact that the retaliatory power of those officials may be considerable. However, since the opportunities for bribe extortion are numerous (e.g. tax declaration, inspections, customs operations, etc.) the totality of bribery in Albania is considerable. Such a system, which is based on mutual advantage, is difficult to dismantle. The Albanian government is implementing an extensive anti-corruption and anti-bribery programme, but evidence from the EPPA 2003 and 2004 shows limited impact (OECD-EBRD, 2003; OECD-EBRD-DG Enterprise and Industry, 2004).
Other costs associated with informal operations include the running of two parallel sets of company books, one to be shown to the Tax Office and the other showing the real entries. The limited reliance on bank financing may be partly attributed to this practice, since companies operating informally will not be able to show their records reporting actual turnover and profits. It has not been possible to obtain reliable estimates of these costs but the indications are that they are relatively marginal. For the want of more precise indicators, it can be assumed that the risk /costs of operating informally are around the central value of 3% of the enterprise turnover. As a rough calculation, the risk adjusted after tax profit rate should, therefore, be 3% less than the after tax profit rate on turnover.

Chapter 3 THE IMPACT OF THE TAX AND SOCIAL SECURITY CONTRIBUTION REGIME ON COMPANY BEHAVIOUR
THE INFORMAL ECONOMY IN ALBANIA: ANALYSIS AND POLICY RECOMMENDATIONS - ISBN 92-64-010254 - ©OECD 2005 73
3.5.7 Tax Simulations
The interviews and the analysis of company data provide valuable insights into the mechanisms behind the growth of the informal economy. However, in order to refine the analysis it is important to develop a better understanding of the relationship between the tax regime, the profit margins and the size of the informal economy. This can be achieved by running a set of tax simulations, using the gross profit margin for the four categories of enterprise previously reported as the basis for the elaborations. It is assumed that for all the value added generated, the VAT fiscal base is equal to 35% of the company turnover, broadly in line with the figure emerging from the company data, and company data available in INSTAT.
The aim is to assess the impact of the current two-tier tax regime on profits and informality. In doing this, the analysis identifies three model enterprises. One with a turnover of Lek 5 million, qualifying for SBT tax (company A), and two with turnovers above the Lek 8 million threshold: one with Lek 14 million (company B) and the other with Lek 45 million (company C), both subject to CIT and VAT. All tax simulations are reported in Table 3.9.
Simulation 1 (assuming full compliance) shows, under the current tax regime, that the after tax profit margin at full compliance would fall below the average growth profit rate and approach the level of the subsistence rate as defined in section 3.5.4, for companies B and C, but not company A, which is subject to the lighter SBT tax regime. Therefore on the basis of attaining full tax compliance, the current CIT tax regime would not be sustainable. Full CIT tax enforcement would probably compel a relatively large proportion of companies to curb their expansion and/or force them out of business, especially those operating with below average profit margins.
Simulation 2 considers the potential gains generated by turnover under-reporting for companies operating at the margin of the two tax regimes (SBT and CIT). It considers two firms: company A, with a turnover of Lek 7,999,999 and therefore subject to the SBT tax and company B, with a turnover of 8,000,001, subject to CIT and VAT.
The simulation shows that company A pays in total just 4% of its turnover in taxes, compared with 13.7% for company B (CIT+VAT) and benefit from a higher after-tax profit rate (22.7%), compared with 20.0% for company B. The marginal tax rate is 66%, if we take into account only the CIT, but it jumps to over 300% once the impact of VAT is also factored in.
Suppose now that company A uses part of its higher after-tax margin and lower tax burden to reduce its prices, undercutting company B. In order to respond to competition, Company B will have to find a way not to charge VAT to its customer. In other words, Company B has a choice: either it continues to pay VAT at the cost of significantly reducing its after-tax profit margin, or to under-report its turnover, thus qualifying for the SBT tax and being able to compete with Company A on equal basis. Little wonder then that most companies seem to choose the second option.
The company data analysis and the business interviews show that most companies operate at least partially informally. Simulation 3, therefore, returns to the three companies modelled in simulation 1, but instead examines what happens when systematic turnover under-reporting takes place. It assumes that company A declares 55% of its real turnover, that company B declares a turnover of Lek 7,900,000 (also equal to 55% of its real turnover) in order to qualify for SBT tax. Company C declares the same proportion its turnover, but is subject to CIT and VAT. Finally, as an extreme but not entirely improbable case, company D declares only Lek 7,700,000 in order to qualify for the SBT tax, in spite of having a turnover amounting to Lek 45 million.

Chapter 3 THE IMPACT OF THE TAX AND SOCIAL SECURITY CONTRIBUTION REGIME ON COMPANY BEHAVIOUR
74 THE INFORMAL ECONOMY IN ALBANIA: ANALYSIS AND POLICY RECOMMENDATIONS - ISBN 92-64-010254 - ©OECD 2005
Simulation 3 shows that the informality reward (the additional profit margin on turnover generated by tax evasion), originating from the abuse of the SBT tax payer status increases, not surprisingly, with the amount of turnover under-reporting. It is relatively low for the true small companies, with a real turnover below the Lek 8 million threshold, but it becomes significant as turnover increases, reaching 21.6% in the case of company D.
However, it is important to note that moving away from the 8 million threshold, the marginal benefit for the company, measured in terms of the after-tax profit rate, generated by turnover under-reporting, aimed at classifying the company as SBT taxpayer, tends to decrease. Company D hides from the tax authorities a turnover volume nearly six times higher than company B (Lek37.3 million against Lek 6.3 million), but it records an after-tax profit rate only marginally higher than company B (19.6% against 17.8% for company A). In other words, companies need to hide an increasingly large proportion of their turnover to achieve what was defined earlier as the average growth after tax profit rate. The impact of this dynamic on the tax compliance rate is disastrous. The compliance rate is only 17.8% for company B and drops to 5.7% for company D.
These simulations assume that companies are not able to retain any of the unpaid VAT since the markets for goods and services are highly competitive in Albania and demand is highly price sensitive. Any gains from VAT tax avoidance are, therefore, likely to be passed on to consumers. The picture would change significantly if companies could retain part of the unpaid VAT to increase their profit margin. In such a case, systematic turnover under-reporting would generate a double benefit for the enterprises since they would be able to reduce their CIT liabilities as well as to gain from VAT evasion, thus increasing the informality reward. Such a situation is likely to apply in sectors where competition is restricted either by entry barriers (such as permits and licences) or by technical factors (such as economies of scale).
The appropriation by enterprises of the additional margin generated by VAT evasion does not necessarily modify the tax compliance rate; companies still do not have real incentives to fully report their turnover. In other words, a lower level of competition does not necessarily promote higher tax compliance. It will simply remove some of the ‘gains’ generated by informal operations from consumers and transfer them to the dominant enterprises.
It is probable that large-scale under-reporting to qualify for SBT status, becomes increasingly difficult as the company grows since it is harder to conceal relatively large operations. Moreover, the risk premium (or the bribe tax) can be expected to increase in line with under-reporting. Data from company statements indicate that the chances of succeeding in being classified as a SBT taxpayer recede significantly as turnover increases, such that a turnover of around Lek 40 million forms an upper limit. At this point, the tax avoidance pattern starts to change. There will be fewer disincentives for vertical growth (see also section 3.5.1), but companies will still try to conceal part of their turnover to reduce their CIT liabilities.
It is worth assessing what happens in case of a significant reduction of the CIT rate. In order to do this, we have inserted in the model the following changes: a) the SBT tax is abolished for companies with a turnover above Lek 2 million, b) all companies above the Lek 2 million threshold are subjected to CIT and VAT and c) simultaneously, the CIT rate is reduced to 10%.
Simulation 4 assumes that the tax compliance rate will not change as a result of the changes in the tax regime. Simulation 5 assumes instead that a lower CIT rate will promote higher tax compliance and the rate of compliance is set at 80% for both CIT and VAT. This is not an impossible target to presume, as once an unbroken value added chain is established, companies will find it much more difficult to avoid VAT and under-declare their turnover.

Chapter 3 THE IMPACT OF THE TAX AND SOCIAL SECURITY CONTRIBUTION REGIME ON COMPANY BEHAVIOUR
THE INFORMAL ECONOMY IN ALBANIA: ANALYSIS AND POLICY RECOMMENDATIONS - ISBN 92-64-010254 - ©OECD 2005 75
Simulation 4 shows that even at a low rate of tax compliance, scrapping the SBT tax and lowering the CIT rate to 10% produces a modest increase of tax revenues compared to simulation 3 from all companies, except company C, where the reduction in CIT revenues is not offset by an increase in VAT revenues.
Simulation 5 shows that the same measures, combined with a large improvement in the tax compliance rate, generate much higher tax revenues without significantly reducing the net after tax profit rate. In addition the risk premium or the bribe tax associated with informal operations is likely to be very much reduced, as companies will fear fines less and/or will be less willing to pay bribes, since they are largely tax compliant. In turn, this should boost the after-tax profit rate. This scenario appears to be very favourable. However, it should be noted that higher taxes compliance is likely to translate into higher consumer prices.

Chapter 3 THE IMPACT OF THE TAX AND SOCIAL SECURITY CONTRIBUTION REGIME ON COMPANY BEHAVIOUR
76 THE INFORMAL ECONOMY IN ALBANIA: ANALYSIS AND POLICY RECOMMENDATIONS - ISBN 92-64-010254 - ©OECD 2005
12
34
56
78
910
1112
1314
1516
1718
1T
urno
ver
repo
rtin
g ra
teA
ctua
lD
ecla
red
VA
T ra
teV
AT
pai
dV
AT
due
Gro
ss p
rofit
SB
T
CIT
SB
T-C
IT ta
xS
BT
-CIT
tax
Tot
al ta
x %
on
t-o
Tot
al ta
xA
fter t
ax p
rofit
Info
rmal
ity
SM
E-C
ITV
AT
Tot
al10
0%T
urno
ver
Tur
nove
rst
anda
rdra
te a
s %
of
rate
rate
paid
due
paid
due
as %
of
rew
ard
com
plia
nce
com
plia
nce
com
plia
nce
turn
over
turn
over
as %
of g
.p.
rate
rate
rate
Com
pany
A5,
000,
000
5,
000,
000
n/
a-
20.0
%4%
n/a
200,
000
20
0,00
0
20
0,00
0
4.0%
16.0
%
Com
pany
B14
,000
,000
14,0
00,0
00
20
.0%
980,
000
98
0,00
0
20.0
%0%
25%
700,
000
70
0,00
0
1,
680,
000
12.0
%15
.0%
Com
pany
C45
,000
,000
45,0
00,0
00
20
.0%
3,15
0,00
0
3,
150,
000
20.0
%0%
25%
2,25
0,00
0
2,
250,
000
5,
400,
000
12.0
%15
.0%
2T
urno
ver
repo
rtin
g ra
teA
ctua
lD
ecla
red
VA
T ra
teV
AT
pai
dV
AT
due
Gro
ss p
rofit
SB
T
CIT
SB
T-C
IT ta
xS
BT
-CIT
tax
Tot
al ta
x %
on
t-o
Tot
al ta
xA
fter t
ax p
rofit
Info
rmal
ity
SM
E-C
ITV
AT
Tot
al10
0%T
urno
ver
Tur
nove
rst
anda
rdra
te a
s %
of
rate
rate
paid
due
paid
due
as %
of
rew
ard
com
plia
nce
com
plia
nce
com
plia
nce
turn
over
turn
over
as %
of g
.p.
rate
rate
rate
Com
pany
A7,
999,
999
7,
999,
999
n/
a-
-20
.0%
4%n/
a32
0,00
0
320,
000
320,
000
4.
0%16
.0%
Com
pany
B8,
000,
001
8,
000,
001
20
.0%
560,
000
56
0,00
0
20.0
%n/
a25
%40
0,00
0
400,
000
960,
000
12
.0%
15.0
%
3T
urno
ver
repo
rtin
g ra
teA
ctua
lD
ecla
red
VA
T ra
teV
AT
pai
dV
AT
due
Gro
ss p
rofit
SB
T
CIT
SB
T-C
IT ta
xS
BT
-CIT
tax
Tot
al ta
x %
on
t-o
Tot
al ta
xA
fter t
ax p
rofit
Info
rmal
ity
SM
E-C
ITV
AT
Tot
al ta
x55
%T
urno
ver
Tur
nove
rst
anda
rdra
te a
s %
of
rate
rate
paid
due
paid
due
as %
of
rew
ard
com
plia
nce
com
plia
nce
com
plia
nce
(Com
pany
D: 1
7%)
turn
over
turn
over
as %
of g
.p.
rate
rate
rate
Com
pany
A
5,00
0,00
0
2,75
0,00
0
20.0
%4%
110,
000
20
0,00
0
11
0,00
0
2.2%
200,
000
17
.8%
9.0%
55%
0%55
.0%
Com
pany
B
14,0
00,0
00
7,
700,
000
20
.0%
-
980,
000
20
.0%
4%25
%30
8,00
0
700,
000
308,
000
2.
2%1,
680,
000
17.8
%14
.0%
44%
0%18
.3%
Com
pany
C
45,0
00,0
00
24
,750
,000
20.0
%1,
732,
500
3,15
0,00
0
20
.0%
25%
1,23
7,50
0
2,
250,
000
2,
970,
000
6.6%
5,40
0,00
0
17
.3%
11.3
%55
%55
%55
.0%
Com
pany
D
45,0
00,0
00
7,
700,
000
20
.0%
-
3,15
0,00
0
20
.0%
4%25
%30
8,00
0
2,25
0,00
0
308,
000
0.
7%5,
400,
000
19.3
%21
.6%
14%
0%5.
7%
4N
o S
BT
Act
ual
Dec
lare
dV
AT
rate
VA
T p
aid
VA
T du
eG
ross
pro
fitS
BT
C
ITS
BT-
CIT
tax
SB
T-C
IT ta
xT
otal
tax
% o
n t-
oT
otal
tax
Afte
r tax
pro
fitIn
form
ality
S
ME
-CIT
VA
TT
otal
tax
CIT
10%
Tur
nove
rT
urno
ver
stan
dard
rate
as
% o
f ra
tera
tepa
iddu
epa
iddu
eas
% o
f re
war
dco
mpl
ianc
eco
mpl
ianc
eco
mpl
ianc
eT
urno
ver
repo
rtin
g ra
tetu
rnov
ertu
rnov
eras
% o
f g.p
.ra
tera
tera
te55
%, C
ompa
ny D
17%
Com
pany
A
5,00
0,00
0
2,75
0,00
0
20.0
%19
2,50
0
350,
000
20
.0%
0%10
%55
,000
100,
000
247,
500
5.
0%45
0,00
0
18.9
%4.
5%55
%55
%55
.0%
Com
pany
B
14,0
00,0
00
7,
700,
000
20
.0%
539,
000
98
0,00
0
20.0
%0%
10%
154,
000
28
0,00
0
69
3,00
0
5.0%
1,26
0,00
0
18
.9%
4.5%
55%
55%
55.0
%
Com
pany
C
45,0
00,0
00
24
,750
,000
20.0
%1,
732,
500
3,15
0,00
0
20
.0%
0%10
%49
5,00
0
900,
000
2,22
7,50
0
5.
0%4,
050,
000
18.9
%4.
5%55
%55
%55
.0%
Com
pany
D
45,0
00,0
00
7,
700,
000
20
.0%
539,
000
3,
150,
000
20.0
%0%
10%
154,
000
90
0,00
0
69
3,00
0
1.5%
4,05
0,00
0
19
.7%
8.3%
17%
17%
17.1
%
5N
o S
BT
Act
ual
Dec
lare
dV
AT
rate
VA
T p
aid
VA
T du
eG
ross
pro
fitS
BT
C
ITS
BT-
CIT
tax
SB
T-C
IT ta
xT
otal
tax
% o
n t-
oT
otal
tax
Afte
r tax
pro
fitIn
form
ality
S
ME
-CIT
VA
TT
otal
tax
CIT
10%
Tur
nove
rT
urno
ver
stan
dard
rate
as
% o
f ra
tera
tepa
iddu
epa
iddu
eas
% o
f re
war
dco
mpl
ianc
eco
mpl
ianc
eco
mpl
ianc
eT
urno
ver
repo
rtin
g ra
tetu
rnov
ertu
rnov
eras
% o
f g.p
.ra
tera
tera
te80
%C
ompa
ny A
5,
000,
000
4,
000,
000
20
.0%
280,
000
35
0,00
0
26.7
%0%
10%
106,
800
13
3,50
0
38
6,80
0
7.7%
483,
500
24
.6%
2.0%
80%
80%
80.0
%
Com
pany
B
14,0
00,0
00
11
,200
,000
20.0
%78
4,00
0
980,
000
21
.3%
0%10
%23
8,56
0
298,
200
1,02
2,56
0
7.
3%1,
278,
200
19.6
%2.
0%80
%80
%80
.0%
Com
pany
C
45,0
00,0
00
36
,000
,000
20.0
%2,
520,
000
3,15
0,00
0
20
.4%
0%10
%73
4,40
0
918,
000
3,25
4,40
0
7.
2%4,
068,
000
18.8
%2.
0%80
%80
%80
.0%

Chapter 3 THE IMPACT OF THE TAX AND SOCIAL SECURITY CONTRIBUTION REGIME ON COMPANY BEHAVIOUR
THE INFORMAL ECONOMY IN ALBANIA: ANALYSIS AND POLICY RECOMMENDATIONS - ISBN 92-64-010254 - ©OECD 2005 77
NOTES
1 The Fiscal Package included in the 2005 State Budget approved in December 2004 introduced a number
of changes in the tax regime, reflecting some of the recommendations contained in this report:
PIT: there has been reduction in the number of tax brackets from 7 to 5. The top marginal rate has been raised to 30% for incomes above Lek 500 000.
SBT: the tax has been split into two components: a lump sum payment determined in relation to location and type of activity and an income tax component with a flat rate of 3%.
CIT: the CIT rate has been reduced to 23% coming into effect on 1st January 2005. A further reduction to 20% is expected to take place in January 2006.
2 The corporate tax rate will be reduced to 23% from 1st January 2005.
3 Fines for social security contributions are not included here but anecdotal information, including discussions with the social security department and labour ministry, indicates that these are not significant.
4 Formal value-added by VAT paying enterprises is estimated at Lek 59.0 billion (section A.3.3) and informal value-added is estimated at Lek 57 billion; meaning that the overall (upper-bound) amount of bribes paid by VAT registered enterprises, consistent with total formal and informal value-added, is 0.033*116= Lek 3.9 billion.
5 5223 VAT paying enterprises were audited in 2003 out of a total of 8000 active enterprises.
6 Given the number of assumptions and unknowns these numbers are largely illustrative. For example the formulation assumes that there is no relationship between the payment of a bribe and the probability of being audited, detected or fined. In practice such relationships may exist. Further the formulation assumes that the distribution of companies sampled in calculating the 3.3% bribe tax rate is representative of the distribution of VAT companies.

THE INFORMAL ECONOMY IN ALBANIA: ANALYSIS AND POLICY RECOMMENDATIONS - ISBN 92-64-010254 - ©OECD 2005 78
REFERENCES
Albanian Center for Economic Research (ACER) (1999) Informal Economy in Albania: Study of Hidden Employment and Tax Evasion, ACER.
Brungger, H. (2001) The Statistical System of the Republic of Albania: Global Assessment, Swiss Federal Statistical Office.
Calzaroni, M. and Madelin, V (2000) Exhaustiveness of GDP Measurement: French and Italian Approaches , paper presented at the 24th General Conference of the International Association for Research in Income and Wealth.
Christie, E. and Holzner, M. (2003) The Dark Side of the Balkans (the Shadow Economy in South East Europe), Vienna Institute for International Economic Studies.
De Soto, H. (1989) The Other Path: The Economic Answer to Terrorism, Basic Books.
De Soto, H. (2000) The Mystery of Capital: Why Capitalism Triumphs in the West and Fails Everywhere Else, Basic Books.
Djankov, S., Lieberman, I., Mukherjee, J., and Nenova, T. (2002) Going Informal: the Costs and Benefits, World Bank.
Ernste, D. (2003) “Shadow Economy and Institutional Change in Transition Countries”, Chapter 4 in Belev, B. [ed.] The Informal Economy in the EU Accession Countries: Size, Scope, Trends and Challenges to the Process of EU Enlargement, Center for the Study of Democracy, Sofia.
Djankov, S., Lieberman, I., Mukherjee, J. and Nenova, T. (2003) “Going Informal: Benefits and Costs”, Chapter 3 in Belev, B. [ed.] The Informal Economy in the EU Accession Countries: Size, Scope, Trends and Challenges to the Process of EU Enlargement, Center for the Study of Democracy, Sofia.
EBRD (2003) Transition Report, EBRD, London.
FIAS (2003) Albania Removing Administrative Barriers to Investment: A Critical Component of the National Development Strategy, IFC and World Bank.
Fries, S., Lysenko, T. and Polanec, S. “The 2002 Business Environment and Enterprise Performance Survey: Results from a survey of 6,100 firms”, EBRD working paper No. 84, 2003.
Gerxhani, K. (1998) Politico - Economic Institutions and the Informal Sector: A Spontaneous Free-Market in Albania, Paper presented at the Institutions in Transition Conference, Bled, Slovenia, September 1998.

REFERENCES
THE INFORMAL ECONOMY IN ALBANIA: ANALYSIS AND POLICY RECOMMENDATIONS - ISBN 92-64-010254 - ©OECD 2005 79
Government of Albanian (2001) National Strategy for Socio-Economic Development, November 2001, Council of Ministers.
Kaufman, D. and Kaliberda, A. (1996) Integrating the Unofficial Economy into the Dynamics of Post-socialist Economies: a framework of analysis and evidence, World Bank.
IMF (2001) Financial Sustainability and Reform Options for the Albanian Pension Fund, IMF Working Paper 01/47, IMF.
IMF (2003) Albania: Selected Issues and Statistical Appendix, March 2003, IMF
IMF (2004) “Albania country Report No. 04/22”, IMF, Washington, D.C.
INSTAT (2001) National Accounts Data, INSTAT.
Mirus, R., Smith, R.S. (1997) “Canada's Underground Economy: Measurement and Implications", in: The Underground Economy: Global Evidence of its Size and Impact, edited by Lippert, O., Walker, M., The Fraser Institute, Vancouver.
Muco, M., Sanfey, P. Luci, E. and Hashorva, G. (2004) “Private Sector and Labour Market Developments in Albania: Formal Versus Informal”, Global Development Network Southeast Europe (GDN-SEE)
Muent, H., Pissarides, F. and Sanfey, P. (2000) - Taxes, Competition and Finance for Albanian Enterprises: Evidence from a Field Study, EBRD.
OECD (2002) Measuring the Non-Observed Economy Handbook, OECD. Paris.
OECD-EBRD (2003) Albania Enterprise Policy Performance Assessment, OECD. Paris.
OECD-EBRD-DG Enterprise and Industry, 2004, Albania Enterprise Policy Performance Assessment 2004, OECD. Paris.
Prislopeanu, I (2002) Albanian Tobacco: A Dying Industry, Tobacco Journal International, No. 5/02.
Ruli, G. (2003) “Characteristics of Informal Sector Development in Albania, Chapter 13 in Belev, B. [ed.] The Informal Economy in the EU Accession Countries: Size, Scope, Trends and Challenges to the Process of EU Enlargement, Center for the Study of Democracy, Sofia.
Schneider, F. (2002) “The Value Added of Underground Activities: size and measurement of the shadow economies of 110 countries all over the world”, mimeo, University of Linz.
Schneider, F. (2003) “The Size and Development of the Shadow Economies and the Shadow Economy Labour Force of 22 Transition and 21 OECD Countries: What Do We Really Know?”, Chapter 2 in Belev, B. [ed.] The Informal Economy in the EU Accession Countries: Size, Scope, Trends and Challenges to the Process of EU Enlargement, Center for the Study of Democracy, Sofia.


THE INFORMAL ECONOMY IN ALBANIA: ANALYSIS AND POLICY RECOMMENDATIONS - ISBN 92-64-010254 - ©OECD 2005 81
Annex A
ASSESSING AND ESTIMATING GDP IN ALBANIA
This annex describes the full assessment of the GDP estimation process used by INSTAT and summarily described in Section 2 of the main report. It covers, in depth, the main data sources that impact on informal economy estimation, and explores the methodology currently used by INSTAT. Section 2 describes some of the areas where it is felt improvements could be made, others, of lower importance but still significant, are also included here.
A.1. The Non-Observed Economy in Albania – Official Statistics (INSTAT)
Three common approaches are used to estimate GDP by statistical offices; these are commonly referred to as:
• Production, which estimates gross value added by industries as the difference between intermediate consumption and output of goods and services.
• Expenditure, which estimates total final demand for goods and services, including trade.
• Income, which estimates gross value–added using information of companies net operating surpluses, wages and salaries, social security contributions and other income components such as consumption of fixed capital (depreciation).
In Albania estimates of GDP are almost exclusively based on the use of the production approach; estimates of GDP based on the expenditure approach are aligned to the production estimates using alignment adjustments. Indeed some components of expenditure are directly determined by production estimates, for example, estimates of investment in buildings and dwellings are set equal to the estimates of construction output.
A.1.1 Data Sources for Industrial Activity
The source data for estimates of industrial activity in the private sector (excluding agriculture) are the Annual Structural Business Survey or ASBS (for industry, retail trade, construction and transport), VAT data and balance sheet data. This latter source largely provides data on those sectors not covered in the ASBS and can often reveal companies not included on the statistical business register of legal entities that is produced and updated by INSTAT.

Annex A: ASSESSING AND ESTIMATING GDP IN ALBANIA
82 THE INFORMAL ECONOMY IN ALBANIA: ANALYSIS AND POLICY RECOMMENDATIONS - ISBN 92-64-010254 - ©OECD 2005
Agricultural Statistics
Estimates of agricultural activity come directly from the Ministry of Agriculture. The initial assessment of these estimates suggests that improvements could be made to the compilation and estimation process. These include improvements to the sampling frames used to estimate agricultural output and indeed some of the other necessary assumptions, such as prices and methodology (which is mainly based on the area of agricultural land and crop yields). However, although improvements could be made in some areas, the estimates of agricultural gross value-added do at least appear to be exhaustive in their coverage of activities. Importantly, they include the output of households, whether the output is for sale on own-consumption and INSTAT also include an additional component, which they call the non-observed component, to the estimates received from the Ministry of Agriculture. Given its contribution to GDP, an assessment of agricultural activity is, of course, very important in assessing the quality of GDP estimates. However it is less so, under the current tax-regime, for estimating the informal economy (as defined in this report); since (at present) agricultural output is not subject to VAT and most production tends to be marginal and non-taxed. As such a full assessment of estimates of agricultural output is beyond the scope of this project. Instead, readers are referred to the Twinning Project, a joint ISTAT1/IMF project that is investigating the scope for long-term improvements in the statistical system in Albania; which is investigating this area of statistical measurement.
The statistical business register
The statistical business register is used as the sampling frame for the annual structure survey. The basic source for updating the register is tax records from the tax authorities (mainly VAT inquiry data). In 2001 about 35,000 active enterprises were listed as active on the register; just over half of these were registered as trade businesses. The sampling frame includes 50,000 businesses meaning that a significant number of companies on the Register are no longer active. The ASBS surveys all enterprises with five or more employees (about 3,500 businesses). Businesses with fewer employees are sampled on the basis of turnover only (about 8,500 businesses are surveyed), stratified by 2-digit NACE2 activities, although for some sectors, 3 and 4 digit NACE are used. Nearly 92% of registered businesses fall into this category, (1-4 employees), amounting to 32% of turnover. It should be noted too that this figure of 92% relates only to registered businesses. Depending on the sector, INSTAT estimates that informal activity by unincorporated enterprises adds about another 20 to 35% to the totals for small businesses (this is described in more detail later). Although, in some sectors (mining, petroleum, electricity, post and telecommunications, public administration, health and education), no adjustments of this type are made; since the scope for evasion in these sectors is thought to be relatively small (and relatively few small companies operate).
In 2002 the total number of enterprises on the register rose to over 56 000 falling to just under 52 000 in 2003. How much of this fall reflects a removal of inactive enterprises from the register is not clear but the indications are that the number of active enterprises rose over this period. For example, just over 6000 new enterprises were created in 2002, compared to nearly 8000 new enterprises in 2003.
A.1.2 The GDP Estimation Process and INSTAT Adjustments for the NOE
Step 1 – Estimating value-added from enterprises surveyed by the ASBS
The GDP estimation process begins with the ASBS which, to recap, surveys all private enterprises on the business register with more than five employees and samples enterprises with less than four
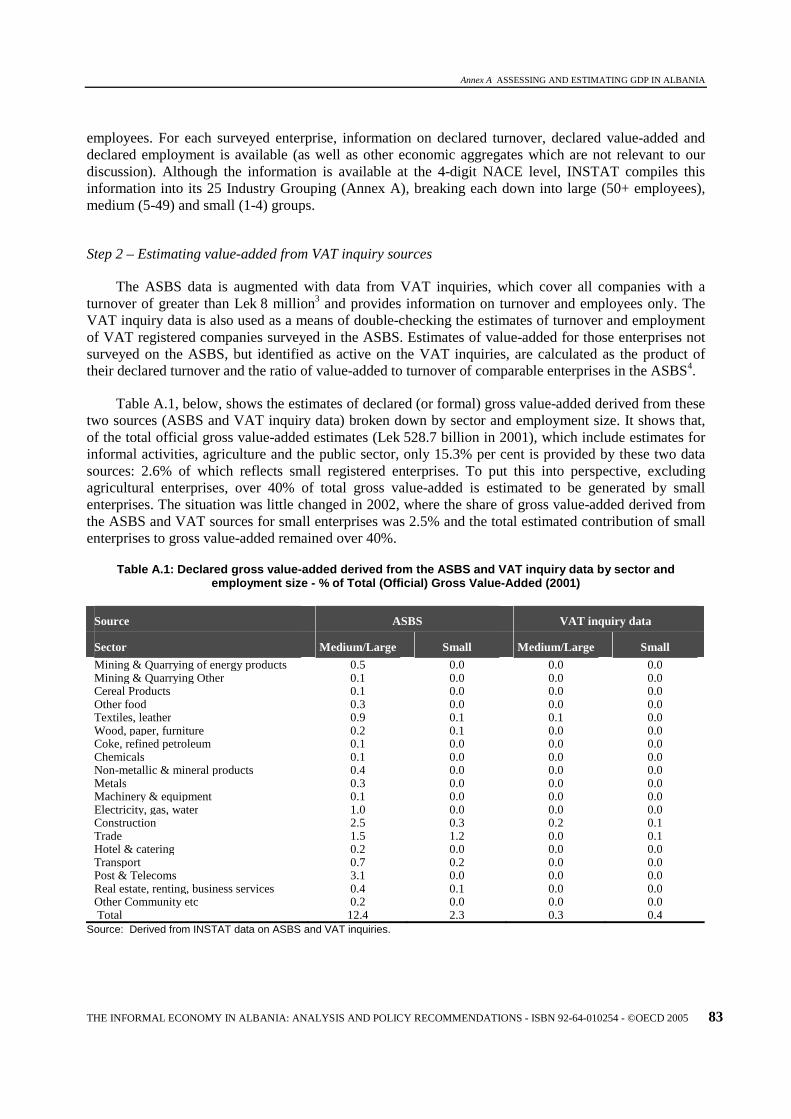
Annex A ASSESSING AND ESTIMATING GDP IN ALBANIA
THE INFORMAL ECONOMY IN ALBANIA: ANALYSIS AND POLICY RECOMMENDATIONS - ISBN 92-64-010254 - ©OECD 2005 83
employees. For each surveyed enterprise, information on declared turnover, declared value-added and declared employment is available (as well as other economic aggregates which are not relevant to our discussion). Although the information is available at the 4-digit NACE level, INSTAT compiles this information into its 25 Industry Grouping (Annex A), breaking each down into large (50+ employees), medium (5-49) and small (1-4) groups.
Step 2 – Estimating value-added from VAT inquiry sources
The ASBS data is augmented with data from VAT inquiries, which cover all companies with a turnover of greater than Lek 8 million3 and provides information on turnover and employees only. The VAT inquiry data is also used as a means of double-checking the estimates of turnover and employment of VAT registered companies surveyed in the ASBS. Estimates of value-added for those enterprises not surveyed on the ASBS, but identified as active on the VAT inquiries, are calculated as the product of their declared turnover and the ratio of value-added to turnover of comparable enterprises in the ASBS4.
Table A.1, below, shows the estimates of declared (or formal) gross value-added derived from these two sources (ASBS and VAT inquiry data) broken down by sector and employment size. It shows that, of the total official gross value-added estimates (Lek 528.7 billion in 2001), which include estimates for informal activities, agriculture and the public sector, only 15.3% per cent is provided by these two data sources: 2.6% of which reflects small registered enterprises. To put this into perspective, excluding agricultural enterprises, over 40% of total gross value-added is estimated to be generated by small enterprises. The situation was little changed in 2002, where the share of gross value-added derived from the ASBS and VAT sources for small enterprises was 2.5% and the total estimated contribution of small enterprises to gross value-added remained over 40%.
Table A.1: Declared gross value-added derived from the ASBS and VAT inquiry data by sector and employment size - % of Total (Official) Gross Value-Added (2001)
Source ASBS VAT inquiry data
Sector Medium/Large Small Medium/Large Small
Mining & Quarrying of energy products 0.5 0.0 0.0 0.0 Mining & Quarrying Other 0.1 0.0 0.0 0.0 Cereal Products 0.1 0.0 0.0 0.0 Other food 0.3 0.0 0.0 0.0 Textiles, leather 0.9 0.1 0.1 0.0 Wood, paper, furniture 0.2 0.1 0.0 0.0 Coke, refined petroleum 0.1 0.0 0.0 0.0 Chemicals 0.1 0.0 0.0 0.0 Non-metallic & mineral products 0.4 0.0 0.0 0.0 Metals 0.3 0.0 0.0 0.0 Machinery & equipment 0.1 0.0 0.0 0.0 Electricity, gas, water 1.0 0.0 0.0 0.0 Construction 2.5 0.3 0.2 0.1 Trade 1.5 1.2 0.0 0.1 Hotel & catering 0.2 0.0 0.0 0.0 Transport 0.7 0.2 0.0 0.0 Post & Telecoms 3.1 0.0 0.0 0.0 Real estate, renting, business services 0.4 0.1 0.0 0.0 Other Community etc 0.2 0.0 0.0 0.0 Total 12.4 2.3 0.3 0.4
Source: Derived from INSTAT data on ASBS and VAT inquiries.

Annex A: ASSESSING AND ESTIMATING GDP IN ALBANIA
84 THE INFORMAL ECONOMY IN ALBANIA: ANALYSIS AND POLICY RECOMMENDATIONS - ISBN 92-64-010254 - ©OECD 2005
This does not, however, suggest that the size of the informal economy, as defined in this report, has been over 80% in recent years. For example, the estimates do not reflect any grossing-up to the entire population or corrections for non-response to the ASBS survey. In addition other significant sources of data for gross value-added exist, particularly regarding the output of the public sector (where the data is sourced from publicly administered institutions) and agricultural output (where the data is provided by the Ministry for Agriculture). In this regard agriculture, fishing, public administration, health, education, financial activities and imputed rent contributed almost 46% to the official estimates of gross value added in 2001 and 2002. However, the estimates shown below are important in that they illustrate how much information on the gross value-added of the non-financial non-agricultural private sector comes from, in the main, directly collected data. (2001 data is shown below since the available data sources are more comprehensive here but the picture for 2002 and 2003 is very similar).
Step 3 – Grossing up for all registered enterprises
The next step in INSTAT’s GDP estimation process is to gross-up surveyed estimates to the total population of enterprises registered on the statistical register (and to correct for any non-response). The procedure assumes that the value-added (and turnover) of each registered (but non-surveyed) enterprise is the same as the average of the Industry-Employment strata in which it falls. So, for example, the value-added of 100 non-surveyed enterprises in say, the transport sector, all with less than 5 employees, would be determined by applying the average value-added per small enterprise in the transport sector (ascertained from the ASBS and VAT data) to each of these 100 companies.
This is a very important assumption that warrants further scrutiny and the report will return to this in the following section. Table A.2 below shows the contribution to gross value-added made by this source of data, broken down by industry for small enterprises. The figures for registered but not surveyed large and medium enterprises are not shown as their total contribution is generally less than 0.5% of total gross value-added; reflecting the fact that surveys for large and medium enterprises are exhaustive, and so, typically, only imputations for non-responding large and medium enterprises are included here.
Table A.2: GVA of small enterprises not surveyed in the ASBS and VAT inquiry- % of Total (Official) GVA
Sector 2001 2002
Mining & Quarrying of energy 0.0 0.0 Mining & Quarrying Other 0.0 0.0 Cereal Products 0.1 0.1 Other food 0.1 0.1 Textiles, leather 0.2 0.2 Wood, paper, furniture 0.2 0.3 Coke, refined petroleum 0.0 0.0 Chemicals 0.0 0.0 Non-metallic & mineral products 0.1 0.1 Metals 0.2 0.2 Machinery & equipment 0.0 0.0 Electricity, gas, water 0.0 0.0 Construction 0.2 0.2 Trade 6.1 6.2 Hotel & catering 0.9 1.3 Transport 3.0 2.1 Post & Telecoms 0.0 0.0 Real estate, renting, business services 0.7 1.0 Other Community etc 0.8 0.6 Total 12.7 12.6
Source: INSTAT

Annex A ASSESSING AND ESTIMATING GDP IN ALBANIA
THE INFORMAL ECONOMY IN ALBANIA: ANALYSIS AND POLICY RECOMMENDATIONS - ISBN 92-64-010254 - ©OECD 2005 85
Step 4 – NOE adjustments
Considerable efforts are made by INSTAT to capture significant parts of the non-observed economy using the production approach. This is achieved using two mechanisms.
The first is based on expert-assessments of under-reported activity by companies on the business register; which also includes estimates from the balance sheets of newly formed companies that have not yet been incorporated onto the business register (these adjustments correspond broadly to the definition of underground-production, used in the OECD NOE Handbook).
The second concerns the activities of unincorporated enterprises referred to earlier (these adjustments correspond broadly to the definition of informal sector production and household production for own-final use used in the OECD NOE Handbook).
For each industrial sector, where informal activity is considered to occur (14 out of 25 sectors. Shown below in Table A.4), INSTAT imputes under-recorded output to registered enterprises on the basis of these expert assessments. These imputations are made separately for large, medium and small enterprises. All of these imputations are made on the assumption that output (turnover) is under-recorded and so have a full impact on value-added (income).
What do the adjustments cover in gross value-added?
Unfortunately, no attempt is made to break down this under-recorded value-added into its components, such as operating surplus or compensation of employees, which matters if one wishes to estimate the size of foregone government revenue related to the informal economy (the total rate for employees and employers’ social security contributions is nearly 42% on monthly income above Lek 10,343, compared with the corporation tax rate of 25%).
The investigations into informal activity (see also sections 3.5.1 and 3.5.2 of the main report)) suggest that many companies declare minimum wages and salaries and social security contributions for as few employees as possible. Indeed, information from the Labour Ministry suggests that 30% of employees in registered enterprises are not declared at all; which tells a similar story to fiscal data on Personal Income Tax, which contributed only 5.5% of total tax revenue in 2001 falling to 4.8% in 2002 and 4.4% in 2003. Indeed, in 2002, the actual cash revenues were lower than they were in 2001. To illustrate the point further, official figures based on declarations show that, in 2003, the average monthly salary in the public sector (Lek19,833) was over 1.5 times higher than the average (declared) monthly salary in the private sector, (Lek12,546). It is not clear that the INSTAT approach covers this type of informality; although the estimates probably achieve this indirectly.
The size of the Informal economy
In total 27.9% of official estimates for gross value added (GVA) in 2002, the latest year for which official data were available, are measured using the two mechanisms described above. Partly because of the way in which the informal economy is estimated, this is little changed from the position in 2001 (27.4%) and 2000 (28.0%).
It should be recalled however that a number of activities that are important, at least for GDP exhaustiveness, are not currently captured in these estimates such as income-in-kind. Moreover, estimates for the non-observed economy’s contribution to GDP are much larger, since the non-observed

Annex A: ASSESSING AND ESTIMATING GDP IN ALBANIA
86 THE INFORMAL ECONOMY IN ALBANIA: ANALYSIS AND POLICY RECOMMENDATIONS - ISBN 92-64-010254 - ©OECD 2005
economy includes imputations for households’ own-production of agricultural products and owner-occupied dwellings.
Table A.3 below shows gross value-added by sector, broken down by size of enterprise and activity that is observed and non-observed. Including imputed rent and INSTAT’s own-adjustments to estimates of agriculture and fisheries value-added, it can be shown that the non-observed economy (NOE) contributes about 36% of gross value-added in 2002. In fact, the true figure is likely to be significantly higher as much of the agricultural output shown below, and recorded as observed, is likely to be produced by households for own-consumption and so be within the OECD handbook’s definition of the informal sector. So, the NOE’s actual contribution to GDP is probably closer to 50-60% of GDP.
Table A.3: Observed and Non-Observed Gross Value-Added by Sector, Lek, millions (2002)
Observed Non-Observed
Total Economy
Agriculture 128,671 16,238 144,909 Fishing 1,210 242 1,452 Mining & Quarrying of energy products 3,612 0 3,612 Mining & Quarrying Other 523 0 523 Cereal Products 1,284 2,172 3,456 Other food 2,574 2,833 5,407 Textiles, leather 6,713 4,920 11,634 Wood, paper, furniture 3,607 4,942 8,549 Coke, refined petroleum -311 0 -311 Chemicals 917 1,123 2,040 Non-metallic & mineral products 2,911 3,167 6,078 Metals 3,298 4,676 7,974 Machinery & equipment 650 354 1,004 Electricity, gas, water 9,228 0 9,228 Construction 18,581 25,348 43,929 Trade 52,035 50,817 102,852 Hotel & catering 9,311 10,501 19,812 Transport 19,358 26,192 45,549 Post & Telecoms 18,698 0 18,698 Financial Activities 20,295 0 20,295 Real estate, renting, business services (a) 8,926 13,388 22,314 Public admin 23,821 0 23,821 Education 15,275 0 15,275 Health 7,197 0 7,197 Other Community etc 5,439 6,534 11,974 Imputed rent 0 44,397 44,397 FISIM adjustment -19,238 0 -19,238 Total Gross Value Added 388,892 173,449 562,341 Taxes and Subsidies on Products 67,659 67,659 Gross Domestic Product 456,551 173,449 630,000
Notes: (a) Excludes the imputation for owner occupied dwellings which is shown separately. Source: INSTAT
The main concern of this report, however, is assessing informal activity, as opposed to the non-observed economy, and, so, in this respect the 50-60% figure is misleading. Table A.4 below shows the contribution of formal and informal activity to GVA, for each industry where INSTAT assumes that informal activity occurs. It shows that, in these industries, informal activity is 1.2 times as large as formal activity.

Annex A ASSESSING AND ESTIMATING GDP IN ALBANIA
THE INFORMAL ECONOMY IN ALBANIA: ANALYSIS AND POLICY RECOMMENDATIONS - ISBN 92-64-010254 - ©OECD 2005 87
Table A.4: Formal and Informal Activity by Sector – % of GVA (2002) Official Estimates
% of GVA
Formal Informal
Ratio: Informal -
Formal Cereal Products 0.2 0.4 1.7 Other food 0.5 0.5 1.1 Textiles, leather 1.2 0.9 0.7 Wood, paper, furniture 0.6 0.9 1.4 Chemicals 0.2 0.2 1.2 Non-metallic & mineral products 0.5 0.6 1.1 Metals 0.6 0.8 1.4 Machinery & equipment 0.1 0.1 0.5 Construction 3.3 4.5 1.4 Trade 9.3 9.0 1.0 Hotel & catering 1.7 1.9 1.1 Transport 3.4 4.7 1.4 Real estate, renting, business services(a) 1.6 2.4 1.5 Other Community etc 1.0 1.2 1.2 Total 24.1 27.9 1.2
Notes: (a) Excludes the imputation for owner occupied dwellings. Source: INSTAT
A.2 Trade Statistics
Looking at Mirror Statistics
Of importance to the problem of tax evasion but less so GDP (since INSTAT uses a production approach) is the issue of trade, particularly imports. The interviews conducted with private entrepreneurs and businesses suggested that a large part of evasion may occur as a consequence of a VAT evasion chain that begins at the customs’ borders (see section 3 of the main report for more details). If this were occurring, it should in theory, reveal itself as an under-reporting of imports. One relatively simple way to estimate the actual size of this evasion is to use mirror statistics, that is, to compare the value of imports compiled by Customs with statistics from exporting countries. However, this comparison reveals some surprises, namely little difference between the two sets of statistics at the total level.
Although some significant differences do exist at the product level of detail, it is difficult to conclude that these differences are symptomatic of evasion, at least at aggregated product levels, since no significant relationship exists between the over/under reporting of imports (compared to export statistics) and overall tax rates (customs and excise duties plus VAT)5. This is, after all, what one would expect to see if officials were systematically misreporting high-customs-and–excise-tax goods as low-customs-and-excise-tax goods (but recording the actual values correctly). To some extent this is not entirely surprising since it would be difficult for manufacturers (as opposed to retailers) to undertake this type of evasion as they would at the very least have to ensure that the reclassified goods could be used in their production process. Moreover the changes introduced to Customs procedures shortly after the economic crisis in 1997, which led to the introduction of a pre-arrival information system for imports, will have restricted the scope for these types of evasive activities. That said, anecdotal evidence suggests exporters and importers collude to declare the value of exports and imports at publicly known minimum prices, and so it would seem that evasion occurs via a different mechanism, namely by implicitly under-declaring the value of imports.

Annex A: ASSESSING AND ESTIMATING GDP IN ALBANIA
88 THE INFORMAL ECONOMY IN ALBANIA: ANALYSIS AND POLICY RECOMMENDATIONS - ISBN 92-64-010254 - ©OECD 2005
Investigating the scope for evasion through misclassification
However, the aggregated product statistics reveal only part of the picture. For example exports of vehicles other than railway rolling stock (HS 876) (mainly motor vehicles) were valued at $3.6 million in 2001 and imports were valued at $6.8 million. Part of the difference between the two estimates reflect valuation differences between exports and imports but the large difference does raise the possibility that some products have appeared under this category (HS 87), rather than their correct category to reduce customs and excise duties.
Table A.5 below shows effective excise duty and VAT rates that were paid on motor car imports in 2003, broken down by detailed product type. It shows significant variations in the levels of both excise duties and VAT duties and so either considerable levels of evasion, given the very low VAT rates, or at the very least, considerable scope for evasion; for example by declaring new motor vehicles with compression ignition engines of less than 2.5L (where the effective excise rate was 15%) as having engines of greater than 2.5L (where the effective excise rate was 8.6%) Better still would be to declare a new car with a spark ignition engine, whatever the size, as used, as the difference in effective rates here is extremely large (and profitable): 15% versus 0.9% for cars with engines larger than 2.8L and 13.2% versus 0.0% for cars with engines less than 2.8L.
Table A.5: Comparisons of effective excise and VAT rates by class of motor vehicle
HS Code Description
Motor Vehicles for the Transport of >= 10 persons, Incl. Driver, with
Excise Duty Effective Rates
Effective VAT Rates
8702101100 Compression-ignition internal combustion piston engine 'diesel or semi-diesel', of a cylinder capacity of > 2.500 cm¬, new
8.6 10.8
8702101900 Compression-ignition internal combustion piston engine 'diesel or semi-diesel', of a cylinder capacity of > 2.500 cm¬, used
7.9 11.5
8702109100 Compression-ignition internal combustion piston engine 'diesel or semi-diesel', of a cylinder capacity of <= 2.500 cm¬, new
15.0 16.7
8702109900 Compression-ignition internal combustion piston engine 'diesel or semi-diesel', of a cylinder capacity of <= 2.500 cm¬, used
9.7 13.6
8702901100 Spark-ignition internal combustion piston engine, of a cylinder capacity of > 2.800 cm¬, new
15.0 16.8
8702901900 Spark-ignition internal combustion piston engine, of a cylinder capacity of > 2.800 cm¬, used
0.9 1.3
8702903100 Spark-ignition internal combustion piston engine, of a cylinder capacity of <= 2.800 cm¬, new
13.2 17.4
8702903900 Spark-ignition internal combustion piston engine, of a cylinder capacity of <= 2.800 cm¬, used
0.0 0.0
8702909000 Not with internal combustion piston engine 10.7 14.7
Source: Customs Data provided by INSTAT
Effective Rates
An analysis of declared imports and taxes received makes interesting reading. In 2003 Albania imported Lek 278.3 billion of goods (valued at market prices, that is including customs and excise duties and VAT), of which Lek 32.7 billion was VAT; an effective VAT rate of 11.75 per cent, only just over half of the standard rate (20%). Of course, many goods (e.g. [pharmaceutical products] are exempt from

Annex A ASSESSING AND ESTIMATING GDP IN ALBANIA
THE INFORMAL ECONOMY IN ALBANIA: ANALYSIS AND POLICY RECOMMENDATIONS - ISBN 92-64-010254 - ©OECD 2005 89
VAT, as are imports of goods used by exporters and recently investment machinery, but even taking these exemptions into account, the effective rate looks very low.
For example, exports of goods in 2001 (the latest year for which export figures are available) were Lek 43.8 billion and imports of goods, at market prices, are estimated at Lek 236.6 billion (of which 11.9%, Lek 28 billion, is estimated as VAT). Even if it is assumed that the entirety of exports was merely re-exported goods, and so no VAT was payable on any of these imports, it would still mean that nearly 30% of all other imported goods in 2001 would need to be exempted for use in domestic production or domestic sale to arrive at an overall effective rate of 11.9%. This does not seem plausible. Looked at another way, if no imported goods were exempted at all, revenue from VAT in 2001, collected at the border, would have been Lek 13.5 billion higher, 2.5% of official gross value-added. Indeed, even if it were assumed that 20% of all imports were exempt from VAT in 2001, expected revenue would still have been over Lek 5 billion higher than that actually collected.
Shuttle trade and smuggling
Again, partly because of time-considerations and because of the production approach to GDP estimation used by INSTAT, it has not been possible to investigate the phenomena of shuttle trade and smuggling, both of which can be expected to have an impact on foregone tax revenues. Earlier work by Prislopeanu (2002), for example, cited in the IMF country report (2003) for Albania pointed to considerable differences between cigarette imports and cigarette consumption in Albania, as evidence of systematic smuggling and evasion, amounting to 1.5% of GDP; although it should be noted that the estimates of consumption used by Prislopeanu are arguably upper bounds, as they imply that one in two adult Albanians (aged 15 and over) smoke a packet of cigarettes a day.
A.3 Assessment of INSTAT Adjustments
A.3.1 Adjustments for VAT Inquiry Data
The starting point is to review the method (step 2) used to calculate the gross value-added of enterprises identified on the VAT inquiry data but that have not been picked-up in the ASBS. Recall that the estimates are derived by assuming that for each of the 25 industrial sectors and 3 employment strata the average value-added to output ratio that comes out of the ASBS data is representative of those VAT inquiry enterprises in the same industry-employment grouping. This assumes that:
1. All 4-digit NACE enterprises within a particular (25) industrial sector have the same value-added to output ratio; or
2. The distribution of enterprises by 4-digit NACE group, in each industry-employment strata, is the same as the distribution of enterprises in the ASBS sample.
In addition it also assumes that enterprises within a particular employment grouping also have the same value-added to output ratios, even where they have a different number of declared employees. So, for example, small enterprises within the construction sector are assumed to have the same value-added to output ratio whether they have one, two, three or four employees. This assumption has been tested. Applying value-output ratios at the 25 industry level but with much more detailed employment strata makes little appreciable difference.

Annex A: ASSESSING AND ESTIMATING GDP IN ALBANIA
90 THE INFORMAL ECONOMY IN ALBANIA: ANALYSIS AND POLICY RECOMMENDATIONS - ISBN 92-64-010254 - ©OECD 2005
Evaluating the assumptions
From the data available it is not possible to test (2) above, although it is unlikely that this assumption holds. However, it is possible to test for (1), the more relevant of the two assumptions. The assessment of this assumption is best illustrated by investigating a specific sector. Figure A.1 discussed below, compares the average value-added to output ratios of small 4-digit NACE enterprises within the trade sector.
In 2001 of the 1,089 enterprises where VAT inquiry data was used as the primary source, 535 were in the trade sector; over 80% of which were small enterprises. Recall also that the INSTAT method assumes that the value-added to output ratio of all small enterprises in this sector is the same as the average of small trade enterprises recorded in the ASBS. In 2001 the ASBS surveyed 3,778 small enterprises in this sector, with an average value-added to output ratio of less than 0.1, meaning that VAT inquiry small trade enterprises were estimated as contributing 0.3% of (formal) gross value-added. The picture was little changed in 2002 but 2001 data is referred to here, and below, as more detailed information on 2001 was available at the time of writing. That said, the conclusions that follow hold for all years.
Variation of value-added to turnover ratios in NACE groups can be significant
Figure 2.1 below, however, shows that within this sector the variation of the value-added to output ratio by 4-digit NACE group is significant, with a broad range of 0.05 to 0.4. Indeed if it is assumed, for exposition, that all VAT inquiry enterprises were NACE 5020 enterprises, the contribution of small VAT inquiry companies rises to 1.3% of GVA, a significant increase. Worked through the system, because of the multiplier effects of informal economy estimation, this would increase total GVA by over 2%. On the other hand if all small VAT inquiry companies were 5050 say, estimated GVA would be smaller.
Figure A.1: Value-Added to Turnover Ratios in the Trade Sector (1-4 employees) by 4-digit NACE group, 2001 (number of enterprises in brackets)
(3778)
(968)
(72)
(134)
(120)
(93)
(77)
(312)
(95)
(127)
(520)(219)
(109)(70)
(285)(119)
(248)
(105)
(105)
0
0.1
0.2
0.3
0.4
5020
5030
5050
5131
5139
5147
5151
5153
5170
5211
5212
5227
5231
5242
5246
5248
5263
Other
Total
NACE category
Rat
io

Annex A ASSESSING AND ESTIMATING GDP IN ALBANIA
THE INFORMAL ECONOMY IN ALBANIA: ANALYSIS AND POLICY RECOMMENDATIONS - ISBN 92-64-010254 - ©OECD 2005 91
Estimated impact on GDP of imputing at the NACE 4-digit level
It is not possible to evaluate the actual impact on GVA estimation by assuming that homogeneity occurs at the 4-digit level rather than the 25 industry level, since the data are not available from the VAT inquiry to do this. Indeed it is possible that the VAT inquiry data, which is based on a different classification system, renders this impossible; although this seems unlikely. Certainly it’s an area that would benefit from further investigation by INSTAT.
It is important to note that this approach cannot be used in all sectors, since in some of the industry-employment strata, the number of enterprises surveyed in the ASBS is insufficient to allow this, as shown in Table A.6 below, which shows the number of enterprises surveyed in the ASBS for each industry-employment strata in 2002 (the pattern for 2001 is little different). It shows that in some strata the number of enterprises surveyed is as little as two. It is not recommended that the level of two enterprises serves as the benchmark for 4-digit NACE groups as it has been used by INSTAT out of necessity rather than statistical quality. Certainly, however, one could consider a range of say 30-50 enterprises in a NACE 4-digit group as being sufficient; improving the overall GDP estimation process, as well as the stability of value-added to output ratios over time which may currently be affected by differences (over time) in the composition of 4-digit NACE groups in the VAT inquiry data.
Table A.6: Number of Enterprises surveyed in the ASBS (2002) by industry and employment strata
Employment Size Industry Large Medium Small All Mining & Quarrying of energy products 0 1 1 2 Mining & Quarrying Other 0 2 5 7 Cereal Products 0 2 26 28 Other food 0 3 22 25 Textiles, leather 3 6 23 32 Wood, paper, furniture 0 10 60 70 Coke, refined petroleum 0 0 1 1 Chemicals 0 1 8 9 Non-metallic & mineral products 1 2 16 19 Metals 0 2 19 21 Machinery & equipment 0 0 3 3 Electricity, gas, water 2 1 0 3 Construction 1 33 142 176 Trade 2 38 485 525 Hotel & catering 1 9 21 31 Transport 0 6 23 29 Post & Telecoms 0 0 2 2 Real estate, renting, business services 0 6 42 48 Other Community etc 1 11 33 45 Grand Total 11 133 932 1076
A.3.2 Imputations for Enterprises not surveyed on the ASBS or VAT inquiry data
A review is now made of the assumption that the turnover (and so value-added) of each enterprise not surveyed in the ASBS or VAT inquiry data (but listed as active on the statistical register) is the same as the average of enterprises surveyed in the ASBS/VAT inquiry data (for given industry-employment strata). One point that will not be developed here, since it follows from the above, is that concerning the implicit assumption that the 25 industry groupings are homogeneous.

Annex A: ASSESSING AND ESTIMATING GDP IN ALBANIA
92 THE INFORMAL ECONOMY IN ALBANIA: ANALYSIS AND POLICY RECOMMENDATIONS - ISBN 92-64-010254 - ©OECD 2005
An important consideration to begin with is the VAT threshold of Lek 8 million. Given that the VAT inquiry data supplements the ASBS by identifying all of those VAT registered enterprises that are not surveyed in the ASBS, it would be fair to assume that, with a few exceptions, the two data sources (VAT inquiry and ASBS) capture the whole universe of enterprises who are VAT registered and, so, declare a turnover of Lek 8 million or more, as well as all of the VAT registered companies with a turnover of below Lek 8 million but who are engaged in overseas trade.
By extension, it can be concluded that nearly all of the enterprises not surveyed in the ASBS or VAT inquiries are not VAT registered and so have a turnover below Lek 8 million. ‘Nearly all’, because some (particularly new) enterprises may have registered themselves for VAT purposes but were not, at the time, picked-up on the VAT inquiry. For convenience it is assumed here that all large and medium enterprises not surveyed are VAT registered. Small enterprises that are not surveyed however are not likely to be VAT registered, and so probably declare, in the main, turnovers of less than Lek 8 million.
If this is so, it is clear that the INSTAT imputation for small non-surveyed enterprises assumes that (for each industry) each small enterprise that is not surveyed has the same turnover as small enterprises picked-up in the ASBS/VAT inquiries. This may indeed be the case but it should be clear that the imputation includes a formal and an informal part, since the non-surveyed companies will not declare a turnover of more than Lek 8 million but ASBS/VAT inquiry companies may do. In other words the 12.6% of gross value added (Table A.2) contributed by non-surveyed small enterprises on the statistical register is not only formal but includes an informal part too.7
Should the size of the employment strata be decreased for imputation
Another feature of the imputation that warrants scrutiny is the assumption that the 1-4 employment strata is sufficient. The employment data available on small enterprises not surveyed in the ASBS/VAT inquiries shows that these enterprises have significantly lower levels of employment than small enterprises that are surveyed. If the INSTAT imputations for these enterprises were repeated but using the averages from the 1,2,3 and 4 employment strata separately, current estimates of gross value-added in recent years would be nearly 5% lower (see also Table A.13).
The impact on GDP estimates of stratifying large and medium enterprises into smaller employment groups, for example 5-10, 10-15, etc. for medium enterprises is not performed in this analysis as the employment distributions of non-surveyed large and medium enterprises are likely to be much more widely dispersed than in small enterprises. This reflects the wider employment strata and the fact that individual employment data for each enterprise is not available for this analysis (although it is available within INSTAT). Information on employment by enterprise is also unavailable (here) for non-surveyed small enterprises; only average employment levels by company with each employment strata are available. However because the variation of employment levels in small enterprises is much smaller (than large and medium enterprises), it is unlikely to have a distorting effect.8
Re-estimating the formal contribution of small non-surveyed enterprises on the statistical register
The analysis below re-estimates gross value-added in 2001 assuming that non-surveyed incorporated small enterprises all declare turnovers to the tax authorities below the Lek 8 million threshold and calculates estimates of value-added for each of these small enterprises by calculating averages from the ASBS/VAT inquiry data for each industry (broken down into employment groups of ‘one’, ‘two’, ‘three’ and ‘four’) with a declared turnover of less than Lek 8 million.

Annex A ASSESSING AND ESTIMATING GDP IN ALBANIA
THE INFORMAL ECONOMY IN ALBANIA: ANALYSIS AND POLICY RECOMMENDATIONS - ISBN 92-64-010254 - ©OECD 2005 93
The formal economy is much smaller than generally understood from official statistics
Table A.7 below summarises this information. It shows that the contribution of small registered but non-surveyed enterprises to the formal economy is significantly lower than currently suggested by official estimates (4.2% rather than 12.7% in 2001, and about the same in 2002).
Table A.7: Re-estimating the share of incorporated non- surveyed small enterprises to the formal economy -% of Total (Official) GVA (2001)
Sector Formal Implied Informal
Mining & Quarrying of energy products 0.0 0.0 Mining & Quarrying Other 0.0 0.0 Cereal Products 0.1 0.0 Other food 0.0 0.0 Textiles, leather 0.0 0.2 Wood, paper, furniture 0.1 0.1 Coke, refined petroleum 0.0 0.0 Chemicals 0.0 0.0 Non-metallic & mineral products 0.0 0.0 Metals 0.1 0.1 Machinery & equipment 0.0 0.0 Electricity, gas, water 0.0 0.0 Construction 0.1 0.1 Trade 1.7 4.4 Hotel & catering 0.6 0.3 Transport 1.0 2.0 Post & Telecoms 0.0 0.0 Real estate, renting, business services 0.2 0.5 Other Community etc 0.2 0.6 Total 4.2 8.5
Source: Estimates derived from ASBS and INSTAT data on GVA.
Validating formal economy estimates
However, the basic information to test the validity of these lower estimates of the formal economy in non-surveyed small enterprises (4.2% compared to 12.7%) does not need to rely on anecdotal evidence alone.
It is possible to compare these estimates of the formal economy with actual tax revenues. Annex B describes this process in more detail and shows, that even these lower estimates of formal gross value-added are more likely to overstate than understate the size of the formal economy.
From hereon, for simplicity, all enterprises surveyed in the ASBS with a turnover of greater than Lek 8 million, all enterprises picked up in the VAT inquiries, and any large and medium non surveyed enterprises are referred to as VAT registered enterprises. All other small enterprises on the statistical register are referred to below as non VAT registered.
Comparing expected and actual profit (turnover) taxes
Two approaches are used. The first compares, separately, expected profit and small business tax revenues with actual revenues from these taxes. It shows that for VAT registered enterprises, expected profit tax and actual receipts of profit tax are identical (Lek 10.2 billion) if the percentage of operating

Annex A: ASSESSING AND ESTIMATING GDP IN ALBANIA
94 THE INFORMAL ECONOMY IN ALBANIA: ANALYSIS AND POLICY RECOMMENDATIONS - ISBN 92-64-010254 - ©OECD 2005
surplus that is taxable is relatively low (51%); suggesting that the estimates of formal value-added for VAT registered enterprises are more likely to have a marginal upward, rather than a downward, bias.
For enterprises with a turnover below Lek 8 million (non VAT registered, who pay the small business tax, levied on turnover) and where very little directly observed estimates are available in INSTAT, the estimates of the Small Business Tax consistent with the formal economy re-estimated above are twice as high as actual receipts; implying that estimates of turnover and the contribution of small non VAT registered enterprises to the formal economy is probably closer to 2% of gross value-added than the 4.2% presented in Table A.7 above.
Comparing expected and actual VAT receipts
A second check is to compare expected VAT receipts from VAT registered enterprises with actual receipts. This suggests that the group defined as VAT-registered enterprises above is very close to the actual group of enterprises who pay VAT: (Lek 41.7 billion estimated versus Lek 41.9 billion actually received).
On balance the lower estimates of formal activity by VAT registered enterprises seem robust. However, the estimates of turnover (and so value-added) from non VAT registered enterprises are likely to be about 2%, rather than 4.2% (which is still significantly lower than the current 12.7%). Unfortunately it is not possible to calculate estimates consistent with a level of 2% by industry and so, in what follows, we take the upper-bound estimate of 4.2%.
Re-estimating the formal/informal economy split given current estimates of GDP
On this basis Table A.8 below recalculates the shares of the informal/formal economies by key sectors; assuming estimates of gross value-added are unchanged. It shows that the contribution of the informal activity to gross value-added, implicit within official figures, is equivalent to 36% of gross value-added, and that in those sectors of the economy where informal activity typically occurs it is over twice as large as the formal economy. 2001 data is shown below but the position in 2002 is little different, where the contribution made by formal activities in these sectors is 16.1% and 35.9% in informal activities.

Annex A ASSESSING AND ESTIMATING GDP IN ALBANIA
THE INFORMAL ECONOMY IN ALBANIA: ANALYSIS AND POLICY RECOMMENDATIONS - ISBN 92-64-010254 - ©OECD 2005 95
Table A.8: Recalibrated estimates of formal/informal activity – % GVA, 2001
Notes: (a) Excludes the imputation for owner occupied dwellings. Source: Estimates derived from ASBS and INSTAT data on GVA.
It’s important to note, however, that these estimates assume that the total estimates of gross value-added are unchanged, and that implicitly, the ratio of the formal to informal sector is much larger for non VAT registered companies than for VAT registered (in other words that small non-surveyed enterprises are likely to have the same output/value-added, etc. as small surveyed enterprises, whether they are registered for VAT or not).
A.3.3 Assessment of INSTAT Adjustments for the NOE
Using Company Data Collected from Financial Institutions
The lower estimates gross value-added are based on the assumption that informal activity per unit of formal activity is the same in VAT and non-VAT registered enterprises. In the analysis that follows, the data obtained from financial institutions9 in Albania provide very strong evidence that this is not the case and that the ratio for non-VAT registered enterprises is significantly higher.
For the purposes of this analysis the sample of enterprises is divided into two groups, those that paid VAT and those that did not. Each company is separated into one of four turnover groups: less than Lek 8 million, Lek 8-20 million, Lek 20-40 million and Lek 40 million plus (see also section 3.5.2 of the main report). For the group of VAT paying companies the analysis takes the actual corporate income tax payments made and multiplies these by 4 to derive estimates of profits actually declared to the authorities (since profit tax is charged at 25%10). Table A.9 below shows the ratio of declared taxable profits to actual profits in each sector.
Table A.9: Ratio of declared profits to actual profits – VAT registered enterprises
(sample size in brackets)
Agro-Chemicals
Construction Hotels Materials Other Services Retail
0.22 (3) 0.45 (7) 0.41 (1) 0.22 (5) 0.12 (2) 0.10 (1)
% of GVA
Formal Informal
Ratio: Informal – Formal
Cereal Products 0.2 0.4 2.1 Other food 0.4 0.6 1.4 Textiles, leather 1.1 1.2 1.1 Wood, paper, furniture 0.5 0.9 2.0 Chemicals 0.2 0.3 1.5 Non-metallic & mineral products 0.5 0.6 1.2 Metals 0.4 0.9 2.5 Machinery & equipment 0.1 0.1 0.7 Construction 3.3 5.3 1.6 Trade 4.7 12.7 2.7 Hotel & catering 0.9 1.7 1.8 Transport 2.1 7.2 3.5 Real estate, renting, business services (a) 0.6 2.2 3.4 Other Community etc 0.6 2.0 3.2 Total 15.5 36.0 2.3

Annex A: ASSESSING AND ESTIMATING GDP IN ALBANIA
96 THE INFORMAL ECONOMY IN ALBANIA: ANALYSIS AND POLICY RECOMMENDATIONS - ISBN 92-64-010254 - ©OECD 2005
This, of course, is not equivalent to figures for gross value-added (GVA) since GVA includes compensation of employees, consumption of fixed capital (CFC) and, implicitly, interest payments amongst other things. In what follows, therefore, it is assumed that companies have no incentive to under-record CFC or other tax deductible items such as interest payments, which should be part of GVA. Further it is assumed that compensation of employees is underestimated by 50%.11 With these assumptions it is possible to arrive at an estimate of the total under-declaration of gross value-added as a per cent of declared turnover.
Do INSTAT adjustments for VAT registered enterprises reflect reality?
Despite the relatively small sample size, Table A.10, below, shows that the estimates of informal activity from the financial institution data are reassuringly close to the range of estimates used by INSTAT to estimate the informal economy (for VAT registered enterprises) in most sectors. It is not possible to make a direct comparison as the financial data do to show how many employees were actually declared, and so it is not possible to allocate this data to small, medium and large declared categories. The difference for the retail sector does, however, look significant; although two points need to be considered here. The first reflects the significant heterogeneity in this sector (as shown in Figure A.1) above and the second related point concerns the very small sample size (one in this case).
Table A.10: Comparisons of declared and actual value-added by VAT registered enterprises - Implied INSTAT estimates in brackets (medium), (small)
Agro-Chemicals
Construction Hotels Materials Other Services
Retail
Undeclared VA – % of declared turnover
0.17 0.20 0.21 0.33 0.31 0.13
Undeclared VA – ratio of declared value added
1.8 (1.0), (2.2)
1.1 (1.5), (1.9)
1.2 (0.8), (1.1)
1.8 (1.3), (1.5)
1.7 (0.7), (1.1)
4.4 (0.7), (0.7)
Do INSTAT adjustments for non-VAT registered enterprises reflect reality?
A similar analysis is shown below in Table A.11 for non VAT paying companies12. The main difference being that calculations here are based on the assumption that each enterprise pays the Small Business Tax (as no VAT is paid and the actual tax payments are consistent with small business tax payments). Declared turnover is calculated by multiplying small business tax payments by 25 (as before it is assumed that the fixed fee below the Lek 2 million threshold is equivalent to a rate of 4%).
Table A.11: Ratio of under-reported/declared turnover by non VAT registered (incorporated) enterprises.
(Numbers of observations in brackets)
Sector Light industry
Agro-Chemicals
Cons-
truction Hotels Materials Other
Services Retail
Under-reported turnover/ declared turnover (financial data)
3.16 (11) 1.30 (7) 3.87 (4) 3.48 (12) 1.77 (9) 0.55 (7) 4.8 (9)
As was the case for VAT paying companies, the INSTAT adjustments for the informal economy (in Table A.10) in non VAT paying companies are quite close to what companies appear to do in most cases,

Annex A ASSESSING AND ESTIMATING GDP IN ALBANIA
THE INFORMAL ECONOMY IN ALBANIA: ANALYSIS AND POLICY RECOMMENDATIONS - ISBN 92-64-010254 - ©OECD 2005 97
the notable exception being ‘other services’. A couple of points need to be recalled. The first is that the figures refer to value-added and not turnover. And the second is the relatively small sample size of financial company data used.
In this context, a few comments on the first point here are worthwhile. The INSTAT adjustments for enterprises on the statistical register generally assume that some percentage of turnover is under-declared with the difference being recorded entirely as value-added.
However, based on the company dataset available, enterprises do not appear to operate in this way. Generally, enterprises under-report output (turnover) and, consistent with this, value-added and intermediate consumption. This is consistent with the idea that the informal economy is part of a (partly VAT evasive) chain. If companies purchase intermediate goods informally for example, as many do, no invoices are likely to be given and so companies will generally not be able to record this expenditure as intermediate consumption; since the tax authorities (for assessment purposes at least) generally require proof of invoices. This assessment is corroborated by the information gathered during the interviews conducted with small private enterprises and entrepreneurs. In general the conclusion must be that enterprises try to under-record intermediate consumption and value-added (profits) in proportions that reflect the overall production process; in other words the value-added to output ratios of formal and informal production can be expected to be the same (for a given enterprise). On its own, this need not imply any change to the estimates of GDP currently produced by INSTAT but estimates of turnover/output should at the least be recalculated so value-added to output ratios are preserved. In time, and with the introduction of input-output supply-use tables, it will be possible to more rigorously test these assumptions.
Another point concerning Table A.11 is worth mentioning here. The company data suggests that the size of the informal sector is smallest in ‘other services’. This can be misleading since it might merely reflect the small sample size and the fact that very few of the enterprises surveyed in this group should have been VAT payers and were not VAT registered (see Table A.12 below) and this, in itself, may be a function of the sampling process or the types of customers that the financial institutions lend to. In other words, some care is needed when interpreting the company data in this context as potential biases can impact considerably. What the data does reveal though is that, the higher the turnover, the lower the probability that companies will remain unregistered for VAT purposes. Certainly, from the sample available, Lek 40 million appears to be an upper-bound for VAT evasion.
Table A.12:– Distribution of Turnover by Sector
(VAT paying Companies in brackets)
Industry/ Turnover Band Lek millions
<8 8=<20 20=<40 >=40 Total
Agro- Chemicals 4 3 (1) (2) 7 (3)
Construction 2 2 (3) (4) 4 (7)
Hotels 8 (1) 4 12 (1)
Light industry 5 4 2 11
Materials 4 4 (2) 1 (1) (2) 9 (5)
Other service 5 2 (1) (1) 7 (2)
Retail 5 3 1 (1) 9 (1)
Total 33 18 (4) 8 (5) (10) 59 (19)

Annex A: ASSESSING AND ESTIMATING GDP IN ALBANIA
98 THE INFORMAL ECONOMY IN ALBANIA: ANALYSIS AND POLICY RECOMMENDATIONS - ISBN 92-64-010254 - ©OECD 2005
Re-estimating gross value-added
In what follows we attempt to re-estimate gross value-added assuming that the estimates for the size of informal activity relative to formal activity currently used by INSTAT are correct but that the official levels of formal activity are too high. Instead we assume that the correct estimates of formal activity are as implied in Table A.8.
If GVA were re-estimated on this lower level of formal activity (15.5% of GVA), applying INSTAT’s informal economy adjustments as before13, gross value-added estimates fall from Lek 528.7 billion in 2001 to Lek 424 billion; a reduction of nearly 20% (8.5% of which reflects the direct fall in the estimate of the formal economy). As explained below however these are lower bound and not central estimates of gross value-added.
The contribution of the informal sector in this case falls to just under 20%; although the informal sector in those industries where informality might be expected is as big as the formal sector; implying that the informal sector is still very significant even with these much lower estimates of gross value-added.
Interestingly, these lower estimates of gross value-added are also much closer to INSTAT’s (provisional) estimates of GDP arrived at from the expenditure side, where the latest estimates for 2000 and 2001 show a considerable balancing item in the region of about Lek 70 billion. If this were true, it might also help to explain why, according to official data, Albania had very low levels of tax revenues as a per cent of GDP, compared to similar countries in the region as shown in Table 2.9 (and IMF, 2003).
These calculations assume however that the ratios of informal to formal activity in small non VAT registered enterprises and small VAT registered enterprises is the same. The company data suggests that is not the case and that non-VAT registered small companies engage in higher levels of informality than VAT registered companies. Table A.13 below attempts to simulate estimates of GVA by assuming that the average actual (formal+informal) turnover of a non-surveyed registered enterprise can be modelled by the average seen in increasing turnover bands. For example the first data column uses the average turnovers of sampled enterprises with declarations of less than Lek 8 million to calculate the average turnover of all non-surveyed small enterprises; producing an estimate of Lek 424 billion for GVA. The second data column however takes the average of all small sampled enterprises with a turnover of less than Lek 20 million, giving an estimate of GVA of Lek 435 million. The table illustrates that GVA increases significantly as the turnover bands used to calculate the averages increase.
Table A.13: Estimating GVA, setting average turnover in un-surveyed small registered enterprises equal to
average turnover in small surveyed enterprises, with increasing turnover bands - 2001. (Less than Lek 8 mill, less than Lek 20 mill etc.)
Turnover Threshold (Lek millions) <8 <20 <40 <60 <80 <100 All
GVA (Lek billions) 424 435 448 455 460 467 503a
Informal as % of GVA 19.7 21.7 23.9 25.1 25.9 27.0 32.2
Informal/Formal Ratio for sectors where informality occurs
0.9 1.1 1.2 1.3 1.3 1.4 1.8
Number of small enterprises in ASBS as % of total small enterprises in ASBS
74.8 87.4 93.2 95.9 97.0 97.7 100
(a) Estimates are lower than the official estimate of GVA as they have been calibrated using more detailed employment strata and because averages do not include small enterprises picked up separately in VAT inquiries.

Annex A ASSESSING AND ESTIMATING GDP IN ALBANIA
THE INFORMAL ECONOMY IN ALBANIA: ANALYSIS AND POLICY RECOMMENDATIONS - ISBN 92-64-010254 - ©OECD 2005 99
Table A.13 shows that the inclusion of the 2.3% of small companies with turnovers of more than Lek 100 million increases GVA by nearly 10% (Lek 467 billion to Lek 503 billion). A couple of important points need to be recalled in this context. The first is to remember that the actual contribution to value-added by these 2.3% of companies is not excluded from any of the estimates above. They are only excluded from the averages that are used to proxy the value-added of non-surveyed enterprises (where the turnover bands are less than Lek 100 million). The second is to recall that a large part of GVA is completely unaffected by any changes in the derivation of the averages used for non-surveyed small incorporated enterprises; for example agriculture, public administration and power generation to name but three sectors, as well as every large and medium enterprise.
The indications are that current estimates of GVA may be overestimated
The upshot of this is that either current estimates of GDP are overstated, by as much as 20%, or that the size of the informal sector is significantly larger than expected. Certainly, if it is assumed that small registered non-VAT paying enterprises do not have actual turnovers of more than Lek 40 million (as is implied by the company data provided by financial institutions), gross value added is likely to be around Lek 448 billion. Even with these lower estimates however the informal sector remains large, relative to the formal sector. Taking those industries where informal activity is generally understood to occur, the ratio of informal to formal activity is still 1.2.
But some caution is needed in making assessments about GDP as a whole
However, a number of other factors need to be considered before making a definitive statement regarding the size of GDP. Although it seems unlikely, one cannot rule out the possibility that the informal sector is significantly larger than has hitherto been expected. Moreover, this study has largely concentrated on one particular aspect of GDP, the informal sector. Other components of GDP that have not been investigated in this study may be higher, for example agricultural output, imputed rent and government consumption of fixed capital. The data are not available to calculate the impact on real growth rates, although it is not likely to be as significant.
That all said, the evidence presented above does point to lower estimates of GVA. To preserve the current estimates of GVA for example the informal sector would need to be 2.3 times the formal sector (looking only at those industries where informal activity is believed to occur).
Re-estimating gross value-added (Simulated GVA)
In the estimates in Tables A.14 and A.15, presented below, estimates of GVA are derived based on the assumption that un-surveyed registered small enterprises have the same turnover and value-added as the average for the population of small enterprises that declare turnovers of less than Lek 40 million. This is broadly in line14 with the findings from the company data provided by financial institutions in Albania. To reinforce the message that these estimates should not be interpreted as new revised estimates of GVA, for the reasons given above, this estimate is referred to as Simulated GVA (based on assumptions about the behaviour of small enterprises).
The estimates below also include additional changes regarding the calculation of informal activity in enterprises not on the statistical register. As described above, INSTAT currently computes these estimates as a fixed proportion of formal (declared) output (but not informal) multiplied by the value-added to output ratio. The preferred approach in this report is to take the product of the same proportion

Annex A: ASSESSING AND ESTIMATING GDP IN ALBANIA
100 THE INFORMAL ECONOMY IN ALBANIA: ANALYSIS AND POLICY RECOMMENDATIONS - ISBN 92-64-010254 - ©OECD 2005
and total (formal + informal) value-added of small registered enterprises. Notice that this latter adjustment has the effect of increasing GVA in some sectors above the levels currently used, for example, construction.
Using these assumptions (simulated) GVA in 2001 is estimated at Lek 461 billion, nearly Lek 70 billion lower than current official estimates, a reduction of nearly 13%. The size of the informal sector using this alternative (simulated) approach for GVA is still significant (26.0%) however, and, is 1.4 times the size of the formal sector in those sectors where informal activities tend to occur. And this is without reflecting any agricultural value-added (30%), which is largely non-observed (despite the reference to most agricultural output as being observed in Table A.15 below). See also Table 2.3 which includes data for 2002.
Table A.14: Observed and Non-Observed Gross Value-Added by Sector, Simulated Estimates
Lek, millions (2001)
Observed Non-Observed
Total Economy
Agriculture 125780 15982 141762 Fishing 1088 218 1306 Mining & Quarrying of energy products 3791 0 3791 Mining & Quarrying Other 806 31 837 Cereal Products 1014 2029 3044 Other food 2324 2721 5046 Textiles, leather 5806 5029 10835 Wood, paper, furniture 2509 4011 6520 Coke, refined petroleum 466 0 466 Chemicals 883 1472 2355 Non-metallic & mineral products 2426 3040 5466 Metals 1881 3432 5313 Machinery & equipment 476 370 846 Electricity, gas, water 11207 30 11237 Construction 17538 30576 48114 Trade 25459 31898 57358 Hotel & catering 4934 6846 11779 Transport 10952 15788 26740 Post & Telecoms 16240 0 16240 Financial Activities 19520 0 19520 Real estate, renting, business services (a) 4501 9059 13560 Public admin 19736 0 19736 Education 14354 0 14354 Health 7082 0 7082 Other Community etc 3384 3519 6903 Imputed rent 0 38353 38353 FISIM adjustment -17926 -17926 Total Gross Value Added 286232 174404 460635 Taxes and Subsidies on Products 59756 59756 Gross Domestic Product 345988 174404 520391
Notes: (a) Excludes the imputation for owner occupied dwellings which is shown separately.

Annex A ASSESSING AND ESTIMATING GDP IN ALBANIA
THE INFORMAL ECONOMY IN ALBANIA: ANALYSIS AND POLICY RECOMMENDATIONS - ISBN 92-64-010254 - ©OECD 2005 101
Table A.15: Formal and Informal Activity by Sector – Simulated estimates - % of GVA (2001)
% of GVA
Formal Informal
Ratio: Informal - Formal
Cereal Products 0.2 0.4 0.7 Other food 0.5 0.6 1.1 Textiles, leather 1.3 1.1 2.4 Wood, paper, furniture 0.5 0.9 1.4 Chemicals 0.2 0.3 0.5 Non-metallic & mineral products 0.5 0.7 1.2 Metals 0.4 0.7 1.2 Machinery & equipment 0.1 0.1 0.2 Construction 3.8 6.6 10.4 Trade 5.5 6.9 12.5 Hotel & catering 1.1 1.5 2.6 Transport 2.4 3.4 5.8 Real estate, renting, business services(a) 1.0 2.0 2.9 Other Community etc 0.7 0.8 1.5 Total 18.3 26.0 1.4
Notes: (a) Excludes the imputation for owner occupied dwellings.
Table A.15 can be further decomposed showing the contribution to formal and informal GVA made by:
• enterprises that pay VAT (Lek 59.0 billion formal, 57.0 billion informal),
• enterprises on the statistical register that that are not VAT registered (Lek 25.1 billion formal, Lek 38.9 billion informal)
• and unincorporated units not on the statistical register (Lek 24.0 billion all informal).
It is shown in section A.6.2 below, using VAT compliance as a checking-mechanism, that the VAT compliance rates implicit in simulated GVA tally closely to the estimates generated by the Vienna Institute; strengthening the notion that the simulated GVA estimates shown above are close to actual levels of informal + informal GVA.
A.3.4 Labour Input Methods
An alternative way to calculate estimates of gross value-added, recommended by Eurostat15 (the Statistical arm of the European Commission), is to compare employment data from demographic sources, such as a Labour Force Survey, against employment data underlying gross value-added estimates. This is commonly known as the Labour Input method16. Although the method is recommended as a means to check GDP estimates, some countries, such as Italy, use the method to estimate gross value-added directly in some industries.
Unfortunately, the data that is needed to carry out this assessment is only partially available. For example a Labour Force Survey is not performed in Albania. However, a recent Living Standards and Measurement Survey (LSMS) carried out under the auspices of the World Bank has collected some data on employment, albeit with a relatively small sample size17. This contains much of the information that one would expect to see in a conventional Labour Force Survey, such as occupation, hours worked, salary earned, and can be used to form the demographic input into the Labour Input Method since full time equivalent estimates of employees can be derived from this source. However, it is not clear that

Annex A: ASSESSING AND ESTIMATING GDP IN ALBANIA
102 THE INFORMAL ECONOMY IN ALBANIA: ANALYSIS AND POLICY RECOMMENDATIONS - ISBN 92-64-010254 - ©OECD 2005
Balance Sheet data (ASBS and VAT inquiry data), in its current form, can also be used to derive estimates of value-added by employee, since balance sheet data does not generally contain any information on full time equivalents, and, indeed, whether the self-employed (owners) are included in the employee estimates.
However, it is possible to produce an alternative estimate of GVA by assuming that the value-added per employee of employees working in sampled enterprises is the same as those working in non-sampled enterprises as shown in Table A.16 presented below, kindly provided by Luca Pappalardo of the Twinning Project.
The table, which is still provisional and so should only be regarded as illustrative at this stage, shows significant changes in GVA estimates across-the-board, with an overall 10% reduction in current estimates of GVA. This is broadly in line with the message that emerges from Tables A.14 and A.15 above, which also point in the direction of lower GVA estimates from those currently published by INSTAT. The main difference here, however, is in the fact that estimates for large and medium enterprises have also been changed (upwards) offsetting some of the downward change that comes through from small enterprises. The impact of these upward changes on total GVA is, however, minimal. Excluding them for example would leave the ‘revised’ GVA figure largely unchanged at 11.0% down rather than 10.4%. The provisional nature of the table also explains why estimates of changes in activity by industry and employment strata are not shown.
Table A.16: Implied changes to GVA estimates using value-added/labour ratios in surveyed enterprises to calculate value-added in un-surveyed enterprises
Total 2001
Total 2002
Mining and quarrying of energy producing materials 0.0% -1.1%
Mining and quarrying of except energy producing materials -3.3% 0.1%
Manufacture of products based on cereals -13.1% -16.7%
Other manufacture of food products -6.5% -5.7%
Manufacture of textile and leather products -12.0% -4.6%
Manufacture of wood, paper, furniture; publishing and printing
-19.5% -15.9%
Manufacture of coke, refined petroleum products and nuclear fuel
0.0% 1.1%
Manufacture of chemicals, chemical products, rubber and plastic products
-4.3% -0.8%
Manufacture of other non-metallic mineral products 1.4% -6.1%
Manufacture of basic metals and fabricated metal products -23.9% -13.3%
Manufacture of machinery and equipment 4.3% 1.4%
Electricity, gas and water supply 3.9% -0.1%
Construction 0.0% -3.1%
Trade -20.5% -23.8%
Hotel and restaurants -34.8% -31.6%
Transport -24.3% -21.1%
Post and communication 0.1% 0.0%
Real estate, renting and business activities -20.3% -20.8%
Other community, social and personal service activities -38.9% -35.9%
TOTAL (of the above) -15.1% -15.7%
Total GVA -10.7% -11.4%
Source: Twinning Project

Annex A ASSESSING AND ESTIMATING GDP IN ALBANIA
THE INFORMAL ECONOMY IN ALBANIA: ANALYSIS AND POLICY RECOMMENDATIONS - ISBN 92-64-010254 - ©OECD 2005 103
A.3.5 Tax Audit Data
Another approach to evaluate the size of the informal sector is to use tax-audit data. This approach has been used by INSEE (the French Statistical Office) and is described in Calzaroni and Madelin (2000).
The Tax Inspectorate provided data on the total number of inspections and on the number of inspections that resulted in the imposition of fines, including data on the value of unpaid taxes and the value of the fine imposed (if any). Unfortunately data disaggregated by category of enterprise and by sector of activity were not made available; although these do exist.
In 2003, 8974 companies were registered for VAT purposes (had a turnover of more than Lek 8 million). Of these 954 were inactive. Audits were carried out on 5223 companies; of which 2189 were performed with a specific purpose, see Table A.17.
Table A.17: Results of audits of VAT paying companies
VAT Profit Tax
Income Tax
Excise Gambling National Tax
Total
Tax Evasion Number of Companies Discovered 2417 2141 406 59 104 103 Value of Evasion (Lek billions) 1.23 1.96 0.17 0.04 0.01 0.10 3.51
Fines Number of Companies Fined 2442 1741 140 28 4 59 Value of fines imposed for evasion (Lek billions)
0.64 0.87 0.08 0.0 0.00 0.03 1.63
Interest Payments Number of companies required to pay interest costs
1079 337
Value of interest payments (Lek billions)
0.13 0.03 0.16
Source: Tax-Audit Data
Calculating under-declared profits and value-added for VAT registered enterprises
Given the information above it is possible to construct estimates of under-declared value-added that are consistent with these levels of evasion for VAT paying enterprises. A number of assumptions are used in the analysis that follows. The first is to assume that non-audited VAT paying companies display the same levels of evasion as audited companies18. With this assumption it is possible to calculate under-declared taxable profits for all VAT paying companies as Lek (8974-974)/5223 * 1.96*(1/0.25) billion = Lek 12.04 billion. (In other words, the total number of active companies/audited companies * discovered evasion * 1/(profit tax, 25%)).
In a similar way total undeclared personal income, consistent with the discovery of Lek 0.17 billion unpaid taxes, can be calculated. This gives an upper bound estimate for undeclared wages and salaries19 of Lek (8974-974)/5223*0.17*1/(0.05) billion = Lek 5.08 billion (the 0.05 reflects the lowest rate of income tax 5%).
Employers’ contributions also form part of value-added (compensation of employees). Assuming that the levels of detected evasion here are consistent with the calculated under-declaration of wages and salaries above, gives an upper-bound estimate of employers’ social security contributions (Lek 0.307*5.08 billion) = Lek 1.88 billion (The rates for employers’ social security contributions in

Annex A: ASSESSING AND ESTIMATING GDP IN ALBANIA
104 THE INFORMAL ECONOMY IN ALBANIA: ANALYSIS AND POLICY RECOMMENDATIONS - ISBN 92-64-010254 - ©OECD 2005
2003, were 29% for social insurance and 1.7% for health; levied on monthly earnings above Lek 10 343 per month up to Lek 51 715 per month).
Audit based estimates of under-declared value-added in VAT registered enterprises are much lower than official or simulated estimates
An upper-bound of total under-declared value-added for VAT paying companies is thus estimated at Lek 12.04+5.08+1.88 billion = Lek 19 billion. This compares with the current estimates of evasion in enterprises with more than Lek 8 million turnover of Lek 57.0 billion: of which evasion from large and medium companies alone is estimated at Lek 42.8 billion. It’s important to recall a number of points here before drawing some conclusions:
• Lek 19 billion is an upper-bound estimate of under-declared value-added in VAT registered companies based on audit data in 2003;
• Lek 57.0 billion is the estimate of under-declared value-added from all VAT-registered enterprises consistent with all estimates of GVA shown above in 2001 (levels in 2003 are likely to be higher, if only for inflation). This is the same as the estimates of ‘simulated’ GVA; since the only changes made in the simulation were to estimates of un-surveyed small enterprises. Recall also that the estimates from the Twinning Project suggested that under-declared value-added in medium and large enterprises was actually higher than the currently published estimates (Table A.16).
Calculating under-declared profits and value-added for non- VAT registered enterprises
For enterprises with less than Lek 8 million, the tax audit data showed that 39697 enterprises were registered and active in 2003. Audits were carried out on 2973 of these, of which 2121 were revealed to have under-declared their turnover.
The total value of under-declared taxes by these companies was Lek 0.16 billion (according to the audit data), equivalent to under-declared turnover of Lek 4.0 billion (0.16(1/0.04)), 0.04 (4%) being the rate of turnover tax.
Grossing up for all enterprises gives an upper-bound of under-declared turnover (consistent with the audit data) of Lek 4.0 billion * 39967/2973 = Lek 53.3 billion.
Audit based estimates of under-declared value-added in non VAT registered enterprises are much lower than official or simulated estimates
The ASBS data surveyed 4851 enterprises in 2001. Assuming that these enterprises have the same industrial distribution as the 39967 enterprises in 2003 and that the value-added to turnover ratio for these 39967 enterprises in 2003 is the same as the average ratio of the 4851 ASBS enterprises in 2001 (0.285), the Lek 53.3 of turnover translates into Lek 15.2 billion of value-added in 2003. This compares with the estimated informal GVA of Lek 38.9 billion, calculated for simulated GVA.
Annex A ASSESSING AND ESTIMATING GDP IN ALBANIA
THE INFORMAL ECONOMY IN ALBANIA: ANALYSIS AND POLICY RECOMMENDATIONS - ISBN 92-64-010254 - ©OECD 2005 105
Are tax-audit estimates credible?
Comparing estimates of evasion based on the tax-audit data with any of the estimates of informal activity shown above might lead to the conclusion that the estimates on informal GVA above, (even the lowest estimate) are considerably over-estimated. It seems more likely however, that the audit based figures demonstrate the ability of enterprises to conceal activity, even after being audited, and/or they give some indication as to the possible size of corruption, (see also Section 3 of the main report). This limits the current scope for using audit data to arrive at an independent estimate of informal activity but the possibility of using the approach above (preferably at the industry level) to assess possible changes over-time in the size of informality should not be ruled-out.
NOTES
1 The Italian Statistical Office
2 Statistical Classification of Economic Activities in the European Union.
3 And other enterprises with a turnover of less than Lek 8 million but which have opted to be VAT registered for trade purposes.
4 In the section that follows this assumption is assessed and some areas for improvement are outlined.
5 Comparisons are further complicated by the fact that exports are measured at a different valuation to imports: exports are measured at free on board prices but import prices include the costs of insurance and freight.
6 The United Nations Harmonised (commodity classification) System for trade in goods.
7 Indeed, although the majority (perhaps all) of non-surveyed enterprises are likely to declare turnovers of less than Lek 8 million, the current imputations made by INSTAT for the following sectors imply a turnover in 2001 of over Lek 8 million: Textiles (14.7m); Chemicals (14.9m); Metals (8.2m); Electricity (19.6m); Construction (10.8m); Trade (18.2m):
8 To calculate the average turnover and value-added for small enterprises using this approach, we first calculate the average employment per enterprise in non-surveyed enterprises (X+a, say, where X is an integer and a is less than 1). We then take the average value-added (VAX, VAX1) and turnover (TOX, TOX1) estimates for surveyed enterprises with employment levels immediately above (X+1) and below (X) the calculated average employment (X+a) and weight the average value-added and turnover figures in accordance with the average employment figures. So average VA for enterprises with X+a employees = (1-a)*VAX+a*VAX1.
9 Section 3.5.2 contains a detailed description of this data. A pro-forma questionnaire (Annex D) was used to collect key financial information such as: actual turnover, compensation of employees, social security payments, corporation tax and small business tax payments, net operating surplus. It is important to note from the outset that the size of the sample is not statistically significant. In addition one should note that the sample may be biased; for example the private finance institutions provided credit to small and micro enterprises only and the sample was not geographically weighted, and so may dis-proportionally reflect

Annex A: ASSESSING AND ESTIMATING GDP IN ALBANIA
106 THE INFORMAL ECONOMY IN ALBANIA: ANALYSIS AND POLICY RECOMMENDATIONS - ISBN 92-64-010254 - ©OECD 2005
activity outside of the key Tirana-Durres area. This is particularly important if levels of evasion also differ by region. This may depend for example on the ability of the tax authorities to conduct audits in different regions.
10 For a more detailed explanation of the tax system and tax rates in Albania, see Section 3 of the main report.
11 It was not possible to arrive at an empirically based estimate due to a lack of information on full time equivalents or the distribution of wages and salaries.
12 A further 9 companies were removed from the analysis here. These 9 companies declared no VAT payments according to the completed questionnaires provided by financial institutions. However their corporate tax payments were significantly higher than payments that could have been made by non VAT paying customers, leading to one of three conclusions. (1) That the returns were incorrectly completed. (2) That the returns reflected a number of establishments within the enterprise, each of whom were independently registered for tax purposes (with all, possibly, falling below the Lek 8 million threshold) or (3) that the company paid profit taxes as if it had a turnover greater than Lek 8 million but paid no VAT (or exported all goods). As it was not possible to establish which of these three possibilities was the most likely they were excluded them from the analysis.
13 Note that this is equivalent to assuming that the size of informal activity in VAT registered enterprises and incorporated non-VAT registered enterprises is the same (as a per cent of output).
14 In actual fact the total formal + informal turnover of these un-surveyed enterprises may be estimated to be higher than the Lek 40 million level because of the additional informal economy adjustments made by INSTAT.
15 Commission Decision NO 94/168/EC
16 For a fuller description of this method see the OECD Handbook on the Non Observed Economy (2002).
17 For more details see http://www.worldbank.org/html/prdph/lsms/country/alb2002/alb02docs.html
18 In fact this assumption will produce a higher bound estimate of value-added because audited companies are likely to be audited precisely because they are suspected of having unusually high levels of informality.
19 Not all taxes on income are derived from wages and salaries.

THE INFORMAL ECONOMY IN ALBANIA: ANALYSIS AND POLICY RECOMMENDATIONS - ISBN 92-64-010254 - ©OECD 2005 107
Annex B
INDUSTRIAL SECTORS USED BY INSTAT (AND CONCORDANCE WITH EUROPEAN NACE CLASSIFICATIONS).
Description Industry Number NACE Rev 1 equivalent
Agriculture 1 01,02
Fishing 2 05
Mining and Quarrying of energy products 3 10-12
Mining and Quarrying ex energy products 4 13,14
Cereal Products 5 15.6, 15.8
Other food 6 15 (ex 15.6, 15.8), 16
Textiles, leather 7 17-19
Wood, paper, furniture 8 20-22, 36.1
Coke, refined petroleum 9 23
Chemicals 10 24,25
Non-metallic and mineral products 11 26
Metals 12 27,28
Machinery & equipment 13 29-37 (ex 36.1)
Electricity, gas, water 14 40-41
Construction 15 45
Trade 16 50-52
Hotel & catering 17 55
Transport 18 60-63
Post & Telecoms 19 64
Financial Activities 20 65-67
Real estate, renting, business services 21 70-74
Public admin 22 75
Education 23 80
Health 24 85
Other Community etc 25 90-99

THE INFORMAL ECONOMY IN ALBANIA: ANALYSIS AND POLICY RECOMMENDATIONS - ISBN 92-64-010254 - ©OECD 2005 108
Annex C
COMPARING ESTIMATES OF FORMAL ACTIVITY WITH TAXES RECEIVED
This annex describes a simple procedure that can be used to (broadly) validate estimates of formal activity used in GDP estimation (where formal activities are defined here as activities that are declared to the tax authorities even if they are not picked-up in statistical surveys. This is particularly important in the context of this study since it stands to reason that in order to assess the size of the informal economy one must also know the size of formal economy.
Two validation procedures are used below. The first compares actual revenues from profit tax and the small business tax with calculated estimates of formal activity. Formal activity estimates are based here on the assumption that no non-surveyed small incorporated enterprises pay the profit tax of 25% but that all large and medium enterprises do. As do all small enterprises in the VAT inquiry and small enterprises with declared turnovers greater than Lek 8 million in the ASBS. This group of enterprises should correspond, in theory, to all registered companies with a declared turnover of greater than Lek 8 million and, so who are liable to corporate income tax of 25% of their declared profits. Small incorporated non-VAT paying enterprises, on the other hand, pay the small business tax of 4% on declared turnover. The second procedure compares expected VAT receipts from VAT-paying enterprises (and imports) with actual receipts.
Procedure 1
Value-added in the national accounts is equal to compensation of employees (wages and salaries and employers’ social security contributions) + consumption of fixed capital (depreciation) + net taxes and subsidies on production1+ net operating surplus2. This latter component, net operating surplus is comparable to but not the same as taxable profits, since other items apart from depreciation can be deducted from operating surplus.
For all incorporated enterprises information on employees is available, meaning that the basic building blocks to estimate taxable declared profits are also available.
To begin with it is assumed that the average declared figure of compensation of full time employees per employee in the private sector in 2001 was Lek 11000 per month3. To this is added compensation of employees by adding on employer’s social security contributions consistent with this salary. It is further assumed that each of the declared employees in the group of registered enterprises with more than Lek 8 million is a full time employee.
Deducting these derived estimates of compensation of employees from declared estimates of value-added produces an estimate of the gross operating surplus of Lek 80.3 billion. Total receipts of corporation profit tax in 2001 were Lek 10.3 billion. This implies that just over half (51%) of gross operating surplus was taxable, which is probably on the low side, implying that the group of companies may in fact include some enterprises that do not have turnovers over Lek 8 million. These results appear

Annex C COMPARING ESTIMATES OF FORMAL ACTIVITY WITH TAXES RECEIVED
THE INFORMAL ECONOMY IN ALBANIA: ANALYSIS AND POLICY RECOMMENDATIONS - ISBN 92-64-010254 - ©OECD 2005 109
to validate the conclusion formed in the main body of the paper that the population of non-sampled small enterprises consists only of those enterprises with less than Lek 8 million (declared) turnover.
A further check can be made on small business tax receipts against actual receipts. For enterprises with a turnover below Lek 8 million (non VAT registered, who pay the small business tax, levied on turnover) and where very little directly observed estimates are available in INSTAT, the estimates of the small business tax consistent with turnover estimates from scenario one in the main text are twice as high as actual receipts (Lek 3 billion versus Lek 1.5 billion, received; total receipts from the small business tax were Lek 1.9 billion in 2001, 0.4 billion of which is estimated to have come from small enterprises with less than Lek 8 million declared turnover surveyed in the ASBS). This implies that the estimates of turnover derived (and so the contribution of small non VAT registered incorporated) enterprises to the formal economy is probably closer to 2% of gross value-added than the 4.2% presented in Table A.7.
Procedure 2
Total formal value-added from VAT registered enterprises in 2001 is estimated at Lek 84.6 billion (of which Lek 59 billion is generated from industries where some informal activities are assumed to occur). This excludes the value-added of non-market sectors, agriculture, fishing and financial services. The total expected VAT revenue from this value-added is equivalent to Lek 16.9 billion. This is an upper-bound estimate since some production, for example pharmaceuticals and exports are VAT-exempt. Exports in 2001 are estimated at Lek 43.8 billion; two-thirds of which (Lek 29.3 billion) are clothing and footwear goods. However these figures are far in excess of the output figures used in the GVA estimates for the retail and clothing sector, suggesting that a significant part of the activity here is reprocessing.
To simplify matters it is assumed that 90% of all of the production of clothing/footwear sector is exported, meaning that calculated VAT receipts from value-added are reduced from Lek 16.9 billion to Lek 15.9 billion. From this must be excluded the VAT incorrectly calculated for exports (the remaining one-third; since clothing and footwear have already been excluded). Further it is assumed that 25% of the intermediate costs of exports are on VAT exempt goods (for example imports by exporting enterprises); giving a total of Lek 13.7 billion. Using estimates of VAT on imports (broken down by product group) in 2003, estimates of VAT on imports in 2001 were calculated at Lek 28.1 billion. This gives a total VAT figure of Lek 41.8 billion which compares with the actual received receipts of Lek 41.9 billion.
Of course a number of assumptions have been used to calculate the figure of Lek 41.8 billion, and moreover, it makes no adjustments for other VAT exempt goods (such as newspapers, post, buildings, land, and educational and cultural services). However even if these exemptions are removed from the expected VAT figures and the assumptions used above are modified a central range of between Lek 40-43 billion emerges.
1 This should not be confused with taxes and subsidies on products, such as VAT and excise duties. Nor
should it be confused with any taxes on income. For a complete description see SNA paragraphs 7.48-7.79. In total these taxes are not significant in this validation context.
2 This includes mixed income. See SNA paragraph 7.8
3 Estimate based on discussions with social security and labour administration officials.
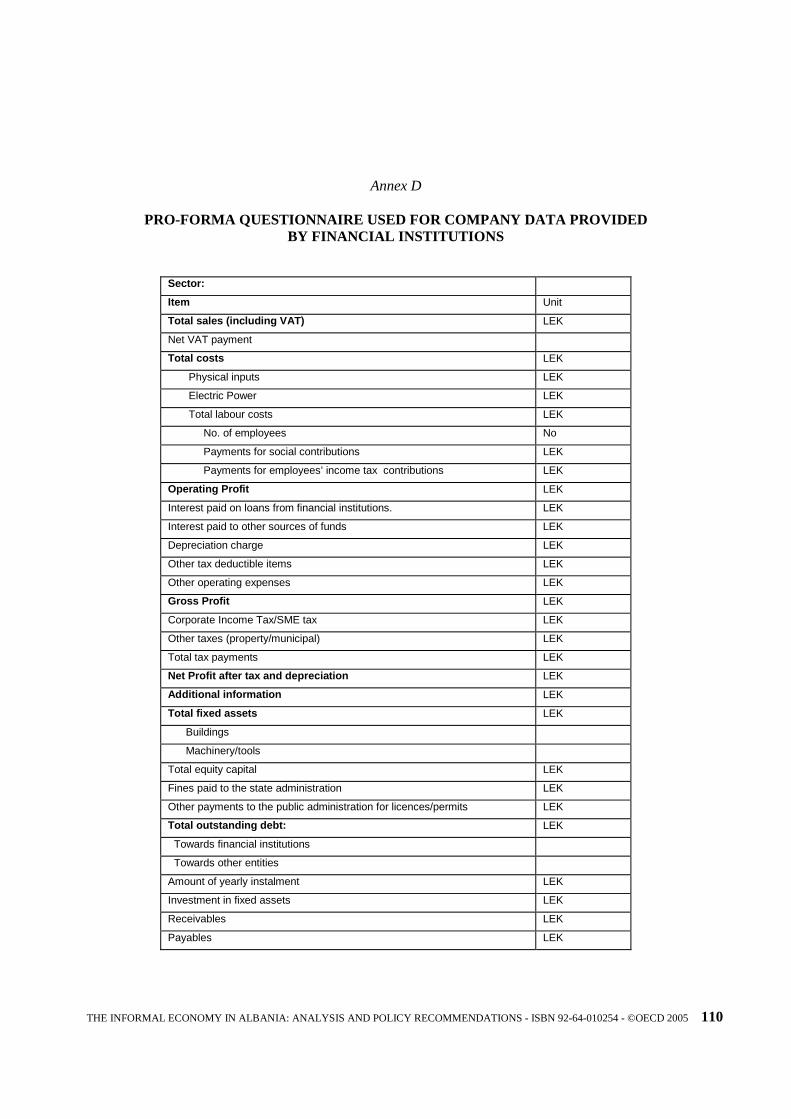
THE INFORMAL ECONOMY IN ALBANIA: ANALYSIS AND POLICY RECOMMENDATIONS - ISBN 92-64-010254 - ©OECD 2005 110
Annex D
PRO-FORMA QUESTIONNAIRE USED FOR COMPANY DATA PROVIDED BY FINANCIAL INSTITUTIONS
Sector:
Item Unit
Total sales (including VAT) LEK
Net VAT payment
Total costs LEK
Physical inputs LEK
Electric Power LEK
Total labour costs LEK
No. of employees No
Payments for social contributions LEK
Payments for employees’ income tax contributions LEK
Operating Profit LEK
Interest paid on loans from financial institutions. LEK
Interest paid to other sources of funds LEK
Depreciation charge LEK
Other tax deductible items LEK
Other operating expenses LEK
Gross Profit LEK
Corporate Income Tax/SME tax LEK
Other taxes (property/municipal) LEK
Total tax payments LEK
Net Profit after tax and depreciation LEK
Additional information LEK
Total fixed assets LEK
Buildings
Machinery/tools
Total equity capital LEK
Fines paid to the state administration LEK
Other payments to the public administration for licences/permits LEK
Total outstanding debt: LEK
Towards financial institutions
Towards other entities
Amount of yearly instalment LEK
Investment in fixed assets LEK
Receivables LEK
Payables LEK

THE INFORMAL ECONOMY IN ALBANIA: ANALYSIS AND POLICY RECOMMENDATIONS - ISBN 92-64-010254 - ©OECD 2005 111
Annex E
HOUSEHOLD TAX COMPLIANCE IN ALBANIA
Vienna Institute for International Economic Studies Report
By Edward Christie and Mario Holzner, WIIW1 October 2004
Abstract
This paper presents and applies a set of indicators of tax compliance in the household sector. These estimates are performed for Albania using available data for the years 1996 to 2000. Estimates of income declaration rates and of corresponding undeclared household income are computed using household consumption data as well as detailed data on household taxation. Specific aspects such as remittances and the role of agriculture are explicitly taken into account and discussed.
JEL Classification: H26, H31, P37 Keywords: Shadow economy, household sector, household savings rate, tax evasion, tax avoidance
Introduction
This paper is part of a wider effort coordinated by the OECD to investigate issues connected to the shadow economy in Albania. This includes notably the issue of the exhaustiveness of GDP measurement through better measurement of the non-observed economy. Our contribution concerns the measurement of tax compliance in the household sector, which is a connected issue as it touches on the consequences of having a large shadow economy, and is of prime interest to state authorities as it has a direct impact on tax revenues and therefore on the means that state authorities have at their disposal to provide public goods and services.
Our chosen base definition of the shadow economy, which we take from Mirus and Smith (1997), is the following: ‘economic activity which would generally be taxable were it reported to the tax authorities’. Hence, this would include all unreported activities related to legal goods and services. Activities related to illegal goods and services, i.e. criminal activities, are not part of this concept. Furthermore we must add that the expression “economic activity” should be understood as productive economic activity, in other words, that generates value added.
This definition of the shadow economy can be expressed according to the OECD terminology2: the shadow economy as defined here includes almost all of what is called “underground activity” (legal activities that are deliberately hidden in order to avoid taxation and/or compliance with regulations3), and the undeclared parts (from a fiscal point of view) of “informal activity” (activities conducted by

Annex E HOUSEHOLD TAX COMPLIANCE IN ALBANIA
112 THE INFORMAL ECONOMY IN ALBANIA: ANALYSIS AND POLICY RECOMMENDATIONS - ISBN 92-64-010254 - ©OECD 2005
unincorporated enterprises in the household sector) and “production of households for own final use” (self-explanatory) to the extent that these should be subject to taxation.
One important clarification must be made at this point: we are not attempting to measure “missing GDP” (referred to in OECD (2002a) as “non-observed GDP”). The issue of missing GDP, meaning value added that is somehow not captured by the official measure of GDP and which, when found, should be added to officially recorded GDP to obtain “actual GDP”, is a separate issue and a separate, different quantity. The issue of missing GDP is the issue of the exhaustiveness of the national accounts, which national statistical agencies try to tackle using a variety of direct and indirect methods. These efforts are supported by several international institutions and joint efforts to specify methods designed to achieve exhaustiveness can be found notably in OECD (2002a). Attempting to achieve an exhaustive estimate of GDP and its components is a complementary exercise to the estimate of the shadow economy which would make estimates of the size of the shadow economy more accurate, but they are distinct quantities. The shadow economy as defined in this paper may in principle be completely captured by the official measure of GDP. This would happen if the official measure of GDP were fully exhaustive. In practice full exhaustiveness is generally not reached, and so there is always some non-observed GDP.
The second necessary clarification concerns the way in which activities escape taxation. In this report we consider tax evasion and tax avoidance as a single activity, namely the activity of not declaring incomes that should generally be taxed. Whether this is done by under-reporting income (e.g. by forging or fabricating documents) or by legally exploiting taxation law loopholes is not relevant in our context.
In this report we purposely choose to limit ourselves to tax evasion and avoidance by households as a contributing factor to the shadow economy. In a more comprehensive framework one should add the contribution from the corporate sector (from non-declaration of profits) as well. Having said that we feel that our approach is quite comprehensive because our starting point is final household consumption as reported in the countries’ national accounts. This final consumption can be thought to have at its origin all kinds of recycled or grey incomes, along with declared, formal ones, although admittedly we do not deal with the extra complication of (hidden) capital flight.
Our general approach can be summarised as follows: using national accounts aggregates as our starting point, we construct estimates of the relevant tax bases for personal income tax, compulsory employee social security contributions, VAT and excise tax. For each of these main types of tax in turn, we compute estimates of compliance rates for each available year, based on the taxation laws and regulations and tax revenue data. We also conduct sensitivity analysis every time in order to present our results as ranges rather than just point estimates. Finally, we aggregate our findings to provide an overall estimate of the total undeclared household income for each available year. This allows us to compare Albania to other countries in Southeast Europe, for which we have relevant findings dating back to earlier research.
Personal Income Tax and Social Security Contribution Modelling
In this section we present our chosen methodology and assumptions for estimating compliance rates for compulsory Social Security and Personal Income taxation.
In order to calculate the theoretical tax base for Personal Income Tax (PIT) and compulsory employee Social Security Contributions (SSC) we would in principle need to know the true level of gross wages paid out, as well as other elements of the PIT tax base such as gains from games of chance, dividends and other incomes. We do not have such data, so we construct an estimate of net total household income (NTHI). We start off from official, published household final consumption (HHFC),

Annex E HOUSEHOLD TAX COMPLIANCE IN ALBANIA
THE INFORMAL ECONOMY IN ALBANIA: ANALYSIS AND POLICY RECOMMENDATIONS - ISBN 92-64-010254 - ©OECD 2005 113
from which we remove imputed rent (IR), which is included in HHFC according to SNA norms, but which is not part of our concept of income. We must then add household outlays for new dwellings which are not part of HHFC but of Gross Fixed Capital Formation (GFCF). We estimate these outlays by using 30% of the gross output of the construction industry due to the households (HHCO). This is the average share in the United Kingdom, it can be seen as a lower bound estimate for Albania. We also add savings under the assumption of a constant savings rate of 5% of NTHI.
)(95.0
105.0 HHCOIRHHFCNTHIHHCOIRHHFC
SHHCOIRHHFCNTHI
+−=⋅++−=
++−= (1)
We then take away from NTHI estimates of incomes which are exempt from PIT and SSC, namely household sector agricultural value added, which we proxy by using Agricultural Gross Value Added (AGVA), social benefits (SB) and remittances (REM). Finally, to switch from net after-PIT to gross pre-PIT income, we add paid personal income tax (PPIT) and paid social security contributions (PSSC). This gives us the social security contribution tax base SSCB:
PSSCPPITREMSBAGVANTHISSCB ++−−−= (2)
In addition we should treat certain specific types of incomes separately (notably gains from games of chance and dividends from owned shares, both of which are subject to a flat rate of income tax) but we do not have the relevant data at our disposal. We make the assumption that these are small amounts compared to PITB and SSCB, so that the small error made can be dealt with by the sensitivity analysis which we conduct later on.
For the personal income tax base PITB, we just need to subtract the theoretical social security contribution liability SSCL:
SSCLSSCBPITB −= (3)
The social security contribution liability SSCL must now be computed. The relevant Albanian regulations define a low bound and a high bound in terms of gross wage, and a single rate. Wages below the low bound are treated as if they were equal to the low bound (e.g. for 1998, the low bound being Lek 6040, a gross wage of, say, Lek 4000 is treated as if it were Lek 6040) while wages above the high bound are treated as if they were equal to the high bound (e.g. for 1998, the high bound being Lek 18 120, a gross wage of, say, Lek 26 000 is treated as if it were Lek 18 120). The contribution liability is then calculated as the fixed rate (11.7% for 1998-2001, 11.2% thereafter) multiplied by the transformed gross wage. The main consequence of this system is that the effective theoretical rate is not constant but regressive and of course the total liability depends strongly on the distribution of gross wages relative to the low and high bounds.
To arrive at a correct estimate of the total social security liability it is therefore necessary to have the distribution of gross wages. This is not available to us, but thanks to data from the Living Standard Measurement Survey of 2002 (LSMS 2002) we do have at our disposal a distribution of take-home (net and after-PIT) income as declared by heads of households (so-called “most knowledgeable persons”). In the LSMS 2002 survey households could report any level of take-home income, which resulted in there being 440 distinct reported income levels. The extremes of the distribution were surprising, the two lowest reported levels being zero and 1 and the two highest being Lek 9 999 997 and 9 999 998 per month. It immediately occurred to us that the surveyors and/or the data handlers may have wanted to

Annex E HOUSEHOLD TAX COMPLIANCE IN ALBANIA
114 THE INFORMAL ECONOMY IN ALBANIA: ANALYSIS AND POLICY RECOMMENDATIONS - ISBN 92-64-010254 - ©OECD 2005
encode qualitative information using such extreme (unrealistic) values. This was subsequently confirmed.
We assume that each ‘most knowledgeable person’ thinks strategically and declares to the LSMS 2002 interviewers the net income which he/she would get based on his/her true gross income if he/she had paid the full PIT liability. This is a working assumption in order to find a relatively simple way of converting the declared take-home incomes (supposed to be after-PIT incomes) to pre-PIT incomes. Concretely what we have done is to use the 2002 PIT schedule in order to reverse-compute pre-PIT incomes from take-home incomes. This then gives us our assumed true pre-PIT income distribution for 2002. Our second assumption is then that this distribution is true in relative terms for each year. Our third assumption is that this distribution holds true (in relative terms) for the whole population of income earners in Albania, rather than just for ‘most knowledgeable persons in households’.
We then use our estimates of the SSC tax bases for each year in term. We constrain the weighted sum of the income distribution (weighted by the number of ‘most knowledgeable persons’ reporting each income level) to be equal to the SSC tax base for each year in turn. This implies a corrective ratio which is applied equally to each income level, so that we end up, for each year, with an assumed gross income (pre-PIT and pre-SSC) for each year. This ensures that the distributions thus constructed sum up to the estimated tax bases while retaining the same relative structure as our assumed true pre-PIT income distribution for 2002.
For each year in turn we then compute the corresponding theoretical SSC liabilities for each income level. The total (national) SSC liabilities are then computed using a weighted sum of the liabilities for each individual level. The weighting scheme is the same as previously, i.e. using the number of ‘most knowledgeable persons’ reporting each income level. Having now SSCL for each year, we are able to compute the PIT base for each year using (3).
For each year in turn the income distribution is then made to fit the PIT tax base. For each converted income level we can compute the corresponding PIT liability. The total PIT liability is then computed as the weighted sum of each level-specific liability, analogously to what we describe above for the computation of the SSC liability.
Finally we compute the compliance rates for PIT and SSC for each year as being the ratio between actually paid PIT and SSC and the total PIT and SSC liabilities computed as described above.
In order to compute (1) and (2) we use officially published data on household final consumption (HHFC) available for the period 1996-2000 from the Albanian Institute of Statistics (INSTAT). For the period 2001-2003 we use data from the United Nations Statistics Division (UNSTATS). We use data on gross construction output (used for calculating HHCO) and Agricultural Gross Value Added (AGVA) from INSTAT. We therefore assume that they are correctly measured. We furthermore assume that AGVA is fully generated in the household sector, so that it exactly matches the exempted sum of profits and wages that households make in the agricultural sector. From LSMS 2002 data we obtain an estimate of the share of Imputed Rent (IR) in HHFC. We assume that this share is correct in the LSMS 2002 data and that it holds for all years. For remittances we use Balance of Payments data provided by the Bank of Albania on Private Transfers from abroad. We use data on State Transfers (ST) to the households (including state expenditures for Social Insurance, Unemployment Insurance and Social Assistance) provided by INSTAT and the International Monetary Fund (IMF) (the original source being the Ministry of Finance in both cases). From the same source we get data on state revenue from PIT and SSC. Information on Albanian tax law was gathered from the relevant ministry, the IMF and the International Bureau of Fiscal Documentation (IBFD).

Annex E HOUSEHOLD TAX COMPLIANCE IN ALBANIA
THE INFORMAL ECONOMY IN ALBANIA: ANALYSIS AND POLICY RECOMMENDATIONS - ISBN 92-64-010254 - ©OECD 2005 115
The results for social security compliance are as follows:
Year SSC Base Total SSC Liability
As a share of SSC base SSC Revenue Compliance Rate
2003 358443 29956 8.4% 7648 26% 2002 320974 26963 8.4% 6586 24% 2001 246971 14781 6.0% 5737 39% 2000 181913 13432 7.4% 5112 38% 1999 206363 14017 6.8% 4628 33% 1998 182507 13449 7.4% 4035 30%
All monetary amounts are expressed in millions of Lek at current prices.
What is remarkable about the results above is the inverted-U-shape of the compliance rate across time. Without any further analysis, one could (wrongly) conclude that the efficiency of the contribution collection process had been on a positive growth path until 2001, and that then, for some reason, this process would have started to be adversely affected. In reality the answer lies in the combination of an almost linear positive trend in revenues with abrupt changes to the regulations on social security, whereby the lower and upper bounds described earlier were increased significantly in two successive jumps in 2002 and in 20034. The decisive change came when it was decided that the upper bound would be set at five times the level of the lower bound, rather than three times the level of the lower bound as had previously been the case. This change provoked a jump in the SSC liability from around Lek 14 bn for 1998-2001 to about double that for 2002 and 2003. But as we can see, the increase in revenues was only gradual and fell far short of doubling. In light of these results we strongly suspect that there is a disconnect between individual liabilities and the contribution collection process. One explanation could be that the staff responsible for collecting contributions react only weakly to changes in the regulations, and instead set revenue targets according to different criteria, e.g. that they should collect x% more than the previous year in nominal terms, rather than try to improve on the compliance rate. As an indication, one can look at the percent increases in nominal revenues for each year compared to the previous year. This yields, from 1999 to 2003, the following values: +15%, +10%, +12%, +15% and +16%. These figures are of a similar order of magnitude to nominal GDP growth over the same years, so much so that in fact social security contributions revenues as a share of GDP are very stable over the whole period, while the liabilities are not.
Year Total SSC Liability SSC Revenue GDP Liability / GDP
Revenue / GDP
2003 29956 7648 744585 4.02% 1.03% 2002 26963 6586 677684 3.98% 0.97% 2001 14781 5737 610426 2.42% 0.94% 2000 13432 5112 551281 2.44% 0.93% 1999 14017 4628 488610 2.87% 0.95% 1998 13449 4035 425356 3.16% 0.95%
All monetary amounts are expressed in millions of Lek at current prices.
One could therefore speculate that the target of the social security administration is to reach a level
of revenues equal to a given share of GDP. As a complementary hint, one may look at the standard deviation of the liability / GDP and revenue / GDP series. We would be very interested in receiving feedback from appropriate persons in Albania to see whether this could be confirmed.

Annex E HOUSEHOLD TAX COMPLIANCE IN ALBANIA
116 THE INFORMAL ECONOMY IN ALBANIA: ANALYSIS AND POLICY RECOMMENDATIONS - ISBN 92-64-010254 - ©OECD 2005
The results for Personal Income Tax are the following:
Year PIT tax base PIT Liability As a share of PIT base PIT Revenue Compliance Rate 2003 328487 24868 7.6% 6414 26% 2002 294011 20467 7.0% 6149 30% 2001 232190 13396 5.8% 6300 47% 2000 168481 10965 6.5% 4590 42% 1999 192345 14479 7.5% 3110 21% 1998 169058 11428 6.8% 1167 10%
All monetary amounts are expressed in millions of Lek at current prices.
One again notices an inverted-U-shape of the compliance rate over time. What has happened is that
revenues have stagnated at approximately the same nominal level over the 2001-2003 period, while the total liability has jumped significantly between 2001 and 2002. However contrary to what is the case with social security the rates and income band limits did not change between 2001 and 2002. The driving force here is simply the quite strong increase in the (nominal) PIT tax base. As the PIT structure is (of course) progressive, this has a more than proportional effect on the total liability.
As we can see from our results, the compliance rate peeked at 47% in 2001 thanks to a large jump in revenues (+37% compared to 2000) while the increase in the liability was slightly smaller (+22% compared to 2000). We are however sceptical about the data for 2000. One sees that the PIT tax base in 2000 was (apparently) lower in 2000 than in 1999 and of about the same level as that of 1998. This is hard to believe as there was significant nominal GDP growth throughout the period. We come back to this issue at the end of this section.
Coming back to the results for the compliance rate, we seem to have a similar situation as with social security, i.e. that there may be PIT revenue targets that are set somewhere within the administration in nominal terms, rather than there being targets in terms of compliance rates. However the situation with PIT is clearly much worse than with SSC. Here the nominal revenue levels have essentially not changed over a period of three years, which is surprising given the relatively strong growth in the tax base. In fact the revenue level is so static over 2001-2003 that one cannot help but question whether it has been correctly measured. On the other hand one could imagine that a target of around Lek 6 bn was set (for whatever reason) and that, for some other reason, this target was not revised upward for 2 years. This again is pure speculation, but in any case the issue of target setting within the tax administration should be investigated further.
We now turn to the problematic data for the year 2000. The reason for our problem is that we deduct remittances from HHFC in our estimate of both tax bases and that remittances were much higher in 2000 than in 1999. It is not unlikely that the true impact of remittances is not correctly reflected either in our own assumptions (e.g. on the savings rate, which we fixed at 5% for each year) or in the national accounts data, or both. It is of course possible in principle that an increase in remittances may discourage residents of Albania to work (i.e. by increasing their reservation wage), but on the other hand this is difficult to square with the fact that GDP increased in 2000. Apart from the issue of savings, we would need to gather more data and more information on two main issues: the first is the actual level of remittances, and whether changes in measurement methodology may explain the rather strong fluctuations that we have seen in the data. The other possibility concerns the national accounts themselves, and the way in which HHFC (again) is measured. If a reasonably steady share of remittances goes into consumption then HHFC should have been substantially larger than reported in 2000. If one assumes that GDP was quite accurately estimated, we would then have to look at the reliability of trade statistics, which would provide the necessary balancing item (due to higher imports) which would

Annex E HOUSEHOLD TAX COMPLIANCE IN ALBANIA
THE INFORMAL ECONOMY IN ALBANIA: ANALYSIS AND POLICY RECOMMENDATIONS - ISBN 92-64-010254 - ©OECD 2005 117
account for a higher HHFC while holding GDP constant. Given the information available to us at this point in time, the evidence suggests that HHFC may have been underestimated, specifically, in 2000 compared to the other years.
Sensitivity Analysis for PIT and SSC compliance rates estimation
As we have seen several key variables, notably HHFC, may not be measured quite as precisely as we would wish. Valid concerns regarding some of our assumptions may also exist. For these reasons we move beyond the presentation of point estimates and provide results from a sensitivity analysis. We do not have at our disposal data samples that would make a classical stochastic approach feasible, so rather than make artificial assumptions about distributional properties, we opt for a deterministic approach whereby we run our method using lower and upper bound values for the main inputs, which are the tax bases. The lower bounds are set at 85% of the central values and the upper bounds are set at 115% of the central values. We present our results as lower bound – upper bound ranges.
For PIT we find the following:
Year Low Bound Compliance Rate High Bound Compliance Rate 2003 20.3% 34.3% 2002 23.5% 40.1% 2001 36.5% 63.7% 2000 32.4% 59.6% 1999 16.7% 29.0% 1998 7.9% 13.9%
As we can see, the results are in fact quite sensitive if compliance is high. This can best be seen graphically, as below. Our conclusion is that additional investigations would be needed to assess the quality of the input data. This would enable a narrowing of the range used for the sensitivity analysis and thus yield a narrower range for the compliance rate.
PIT Compliance Range
0%
10%
20%
30%
40%
50%
60%
70%
1998 1999 2000 2001 2002 2003
Low
Mid
High

Annex E HOUSEHOLD TAX COMPLIANCE IN ALBANIA
118 THE INFORMAL ECONOMY IN ALBANIA: ANALYSIS AND POLICY RECOMMENDATIONS - ISBN 92-64-010254 - ©OECD 2005
For SSC we find the following:
Year Low Bound Compliance Rate High Bound Compliance Rate 2003 15.9% 18.8% 2002 17.6% 20.9% 2001 33.4% 36.3% 2000 36.3% 40.6% 1999 31.7% 35.0% 1998 28.6% 32.0%
As previously stated, the results for social security are much less sensitive to measurement errors in the input data. This is very clear on the graph below:
SSC Compliance Range
0%
10%
20%
30%
40%
50%
1998 1999 2000 2001 2002 2003
Low
Mid
High
The main analysis developed previously concerning the central estimate for the SSC compliance rate remains valid. In this case the sensitivity analysis does not provide any source of additional concern.
Excise Tax and VAT Modelling
In this section we present our chosen modelling framework and assumptions for estimating compliance rates for VAT and excise taxation.
Our data inputs are the following: from household budget survey data (Living Standard Measurement Survey - LSMS 2002) we have declared values of purchased goods by type of good (items under the food and non-alcoholic beverages heading, alcohol, cigarettes, fuel as well as other non-food items). We assume that the shares for each type of purchased good in household final consumption (HHFC) derived from aggregating the LSMS 2002 data hold true for all years. Thus for each year we have at our disposal estimates of the declared amounts spent by households on goods that are not subject to excise taxation (DNEG) as well as on goods that are subject to excise taxation (DEG). Concretely, DNEG was calculated as a sum of HHFC and HHCO less DEG, household consumption of imputed rents, health services and non-purchased goods. Using the nominal excise tax rates given by the relevant legislation and computing a weighted average based on the declared shares of each type of excised good

Annex E HOUSEHOLD TAX COMPLIANCE IN ALBANIA
THE INFORMAL ECONOMY IN ALBANIA: ANALYSIS AND POLICY RECOMMENDATIONS - ISBN 92-64-010254 - ©OECD 2005 119
(fuel, cigarettes, alcohol, coffee, soft drinks and mineral water) we estimate an average statutory excise tax rate (γ). We also have at our disposal the tax revenues for each year for excise taxes (PEX) and for VAT (PVAT).
We construct a simple model of tax evasion based on the following assumptions:
• a share (1-ε) of goods purchased which should be subject to excise and VAT taxation evade both taxes simultaneously – thus ε is defined as the excise goods taxation compliance rate, which we further assume to be identical for all types of goods subject to excise tax
• a share (1-ν) of goods (or services) purchased which are not subject to excise taxation but which should be subject to VAT evade VAT taxation – thus ν is defined as the non-excised goods VAT compliance rate, which we further assume to be identical for all types of goods not subject to excise tax
• the declared shares for both types of goods (subject to excise tax and not subject to excise tax) found in the LSMS 2002 survey data are correct in paid value terms for all years
• the fact that we use the corresponding declared amounts DEG and DNEG which are based on taking the corresponding shares of officially published HHFC available for the period 1996-2003 from the Albanian Institute of Statistics (INSTAT) and UNSTATS implies that we assume officially published HHFC to be correct
• we assume that the tax revenue data (PEX and PVAT) as provided by the Albanian Ministry of Finance for each year is correctly measured
The mathematical formulation of the model following the assumptions above is therefore the following:
)2.12.01( εγε ++⋅= EGDEG (4)
)2.01( υ+⋅= NEGDNEG (5)
EGPEX ⋅= εγ (6)
)]1([2.0 γευ +⋅+⋅⋅= EGNEGPVAT (7)
Where EG and NEG are the net of tax values of theoretically excised and non-excised goods respectively. Equation (4) states that the declared value of purchased excised goods is equal to the net value of these goods plus excise tax applied to a share ε of the net value of these goods, as well as VAT of 20% applied to the after-excise-tax value of the same share. Equation (5) states that the declared value of non-excised goods is equal to the net value plus VAT of 20% on the net value of a share ν of the net total value.
Equations (6) and (7) simply match the model’s revenue equations with the observed revenues.
At this stage we must include corrections to this model due to the VAT threshold of Lek 8 million of turnover. Concretely, the law on VAT states that retailers netting less than Lek 8 million a year in turnover are not subject to VAT. We have further been informed by OECD staff who discussed this issue with Albanian officials that this implies, in practice and in most cases, that the wholesalers or producers

Annex E HOUSEHOLD TAX COMPLIANCE IN ALBANIA
120 THE INFORMAL ECONOMY IN ALBANIA: ANALYSIS AND POLICY RECOMMENDATIONS - ISBN 92-64-010254 - ©OECD 2005
further upstream who distribute goods or services to these small retailers also “skip” VAT, although they themselves may be above the Lek 8 million threshold. This information leads us to the following working assumption: the share of the VAT tax base which corresponds to the share of small retailer turnover in total turnover (nationally) is exempt from VAT altogether. We were provided with a lower bound estimate of this volume by OECD staff of 7.9%. In a later section of this paper we conduct a sensitivity analysis. So what we do now is to incorporate this correction into a revised version of the model.
We substitute the 20% VAT rate with the following expression:
)1(2.0 ρτ −⋅= (8)
Where τ is the “truly applicable” VAT rate and ρ is the share of small retailer turnover in total turnover.
Our transformed model is now as follows:
])1(1[ εγττε +++⋅= EGDEG (9)
)1( τυ+⋅= NEGDNEG (10)
EGPEX ⋅= εγ (11)
)]1([ γευτ +⋅+⋅⋅= EGNEGPVAT (12)
As previously stated, DEG, DNEG, PEX, PVAT, τ and γ are known quantities, while the corresponding net values EG and NEG and the compliance rates ε and ν are the unknowns. The model we have constructed is therefore a classical equation system with four equations and four unknowns which we solve as follows:
Using (11) to express epsilon and plugging it into (9), we obtain:
PEXPEX
DEGEG )1( τγ
τ +−−= (13)
Having EG enables us to compute ε :
EG
PEX
⋅=
γε (14)
Re-writing (12) and using (10) to substitute NEG, we get ν :
))1((
)1(1
γτεγτε
τυ
+−−+−=
EGPVATDNEG
EGPVAT (15)

Annex E HOUSEHOLD TAX COMPLIANCE IN ALBANIA
THE INFORMAL ECONOMY IN ALBANIA: ANALYSIS AND POLICY RECOMMENDATIONS - ISBN 92-64-010254 - ©OECD 2005 121
And finally NEG can be computed using (10) by re-writing it as:
τυ+=
1
DNEGNEG (16)
Before we turn to the results, we address in more detail the issue of our estimate of average statutory excise tax rate γ.
Data for the household consumption of fuels, cigarettes, alcohol, coffee, mineral water and fruit juice were taken either from existing LSMS 2002 aggregations provided to us by the OECD or were aggregated by us from the raw data. The last three items include food eaten outside of the home. The ratios were calculated as shares of total consumption including imputed rents and health expenditures.
Consumption Shares (LSMS 2002) % HHFC
Fuels 3.1% Cigarettes 2.2% Alcohol 1.0% Coffee (+ in Bar) 1.3% Mineral Water (+ in Bar) 0.3% Fruit Juice (+ in Bar) 0.3%
Total Excised Goods 8.0%
Total excised goods make about 8% of HHFC. Fuels, cigarettes and alcohol alone constitute 6.3%
of HHFC. This seems to be a rather low value compared to a neighbouring country like Macedonia, where these 3 items together represent more than 10% of total consumption in the 2002 household survey published in the Statistical Yearbook of Macedonia 2003. Though the survey methods are probably somewhat different the discrepancy seems to be rather large.
With regard to excise taxes we had to rely on the tax law data from end of August 2002 provided in the IMF country report 03/64 and apply it to the period of 1996-2003. Unfortunately historical tax law data for those years was not available.
Excise tax rates (2002)
Gasoline 90% Cigarettes 43% Beer 50% Coffee 20% Mineral Water 5% Soft Drinks 5%
For fuels excise taxation we applied the rate that was related to gasoline of 90 octane and more and
unleaded gasoline. In the case of cigarettes no ad valorem rate was provided. Here we used price and tax data from the World Health Organisation (WHO) European Country Profiles on Tobacco Control 2003 in order to calculate an ad valorem rate5. For alcohol we applied the ad valorem rate meant for beer as the other excised alcohols (raki, wine, etc.) were again only excised in Lek values per litre and for which we have no reliable average retail prices nor consumption shares within total alcohol consumption. The excise rates for coffee, mineral water and soft drinks were given in ad valorem rates.

Annex E HOUSEHOLD TAX COMPLIANCE IN ALBANIA
122 THE INFORMAL ECONOMY IN ALBANIA: ANALYSIS AND POLICY RECOMMENDATIONS - ISBN 92-64-010254 - ©OECD 2005
On the issue of VAT exempted retailers, we assumed a reduction of the VAT rate by 9.3%, which is based on the 7.9% lower bound estimate provided by OECD staff. This value was determined by imposing 0.85x=7.9.
Using the available data, which covers the years 1996 to 2003, and the excise rate computed as described above, and using equations (13) to (16), we find the following point estimates for the compliance rates:
Year
ε
ν
1996 48.1% 17.7% 1997 16.1% 38.6% 1998 33.2% 58.5% 1999 50.9% 55.6% 2000 74.7% 69.2% 2001 61.5% 59.9% 2002 45.7% 57.8% 2003 59.1% 56.3%
The results for the excised goods compliance rate show a marked fall for 1997, a turbulent year for
Albania6, followed by a steady improvement up to and including 2000. Interestingly there is no such dip for the non-excised goods VAT compliance rate, although there is likewise an encouraging steady trend towards higher values up to 2000. The period from 2001 to 2003 shows a stabilisation of the VAT compliance rate above 55%, while excise compliance rate dipped again in 2002 and came back in 2003 to a level of around 60%. Unlike in the case of the social security contributions these variations can’t be explained by changes in the law as we used the same rates for all the years. One explanation (according to anecdotal evidence) might be that the taxation of excised goods can be seen as a residual target for Albanian tax collectors in case it has not been possible to fulfil their overall tax goal by the end of the year.
At this stage we must recall our discussion on HHFC for 2000. As stated in the section on Personal Income Tax and Social Security Contributions, it is possible that remittances are either improperly measured or that their impact is not correctly accounted for in the national accounts (or both). If HHFC is indeed underestimated for 2000, this would imply that the tax base is larger than what we thought, and therefore that the compliance rate (for 2000 at least) is lower than what we have found.
Sensitivity Analysis for Excise Tax and VAT Modelling
A sensitivity analysis for the Excise Tax and VAT Modelling was conducted to see how the model reacts to rather large changes of input data. Starting from the central values (see table below) we assumed two extreme case scenarios where the consumption of excised goods increases (decreases) by 15% and simultaneously the excise tax rates increases (decreases) by 15% respectively. As a consequence VAT goods consumption automatically decreases (increases). We do not change the VAT rate as it is given by law as 20%. However we do change the VAT reduction rate for the VAT exempted retailers by a decrease (increase) of 15%. Resulting changes in total VAT compliance rates7 are rather moderate as they are being outbalanced by relatively strong alterations of the excise compliance rate. In the low bound case of the year 2000 estimated excise liability even drops below the actual excise revenues implying that Albanians have paid more than they should have which is rather unlikely. This result may have several explanations, one of them being the possibility of an under-estimation of official household final consumption for 2000. This is also discussed in the parts dealing with the Personal Income Tax and Social Security Contributions Modelling.

Annex E HOUSEHOLD TAX COMPLIANCE IN ALBANIA
THE INFORMAL ECONOMY IN ALBANIA: ANALYSIS AND POLICY RECOMMENDATIONS - ISBN 92-64-010254 - ©OECD 2005 123
+15% excised shares & rates, -15% non-VAT
-15% excised shares & rates, +15% non-VAT
CENTRAL VALUES HIGH BOUND LOW BOUND 2003 2003 2003
Total excise liability 20,751 Total excise liability 29,490 Total excise liability 13,402 Excise Revenue 12,258 Excise Revenue 12,258 Excise Revenue 12,258 Excise Compliance Rate
59.1% Excise Compliance Rate
41.6% Excise Compliance Rate 91.5%
Total VAT liability 89,338 Total VAT liability 92,320 Total VAT liability 86,652 VAT Revenue 50,625 VAT Revenwue 50,625 VAT Revenue 50,625 VAT Compliance Rate 56.7% VAT Compliance Rate 54.8% VAT Compliance Rate 58.4%
2002 2002 2002
Total excise liability 20,420 Total excise liability 28,562 Total excise liability 13,543 Excise Revenue 9,324 Excise Revenue 9,324 Excise Revenue 9,324 Excise Compliance Rate
45.7% Excise Compliance Rate
32.6% Excise Compliance Rate 68.8%
Total VAT liability 81,967 Total VAT liability 84,727 Total VAT liability 79,479 VAT Revenue 46,113 VAT Revenue 46,113 VAT Revenue 46,113 VAT Compliance Rate 56.3% VAT Compliance Rate 54.4% VAT Compliance Rate 58.0%
2001 2001 2001
Total excise liability 15,511 Total excise liability 22,106 Total excise liability 9,968 Excise Revenue 9,544 Excise Revenue 9,544 Excise Revenue 9,544 Excise Compliance Rate
61.5% Excise Compliance Rate
43.2% Excise Compliance Rate 95.7%
Total VAT liability 68,461 Total VAT liability 70,728 Total VAT liability 66,419 VAT Revenue 41,148 VAT Revenue 41,148 VAT Revenue 41,148 VAT Compliance Rate 60.1% VAT Compliance Rate 58.2% VAT Compliance Rate 62.0%
2000 2000 2000
Total excise liability 12,257 Total excise liability 17,738 Total excise liability 7,668 Excise Revenue 9,153 Excise Revenue 9,153 Excise Revenue 9,153 Excise Compliance Rate
74.7% Excise Compliance Rate
51.6% Excise Compliance Rate 119.4%
Total VAT liability 54,600 Total VAT liability 56,449 Total VAT liability 52,941 VAT Revenue 38,107 VAT Revenue 38,107 VAT Revenue 38,107 VAT Compliance Rate 69.8% VAT Compliance Rate 67.5% VAT Compliance Rate 72.0%
1999 1999 1999
Total excise liability 13,666 Total excise liability 19,235 Total excise liability 8,970 Excise Revenue 6,961 Excise Revenue 6,961 Excise Revenue 6,961 Excise Compliance Rate
50.9% Excise Compliance Rate
36.2% Excise Compliance Rate 77.6%
Total VAT liability 54,148 Total VAT liability 56,006 Total VAT liability 52,477 VAT Revenue 29,794 VAT Revenue 29,794 VAT Revenue 29,794 VAT Compliance Rate 55.0% VAT Compliance Rate 53.2% VAT Compliance Rate 56.8%
1998 1998 1998
Total excise liability 14,797 Total excise liability 20,389 Total excise liability 10,053 Excise Revenue 4,910 Excise Revenue 4,910 Excise Revenue 4,910 Excise Compliance Rate
33.2% Excise Compliance Rate
24.1% Excise Compliance Rate 48.8%
Total VAT liability 52,455 Total VAT liability 54,291 Total VAT liability 50,802 VAT Revenue 28,771 VAT Revenue 28,771 VAT Revenue 28,771 VAT Compliance Rate 54.8% VAT Compliance Rate 53.0% VAT Compliance Rate 56.6%

Annex E HOUSEHOLD TAX COMPLIANCE IN ALBANIA
124 THE INFORMAL ECONOMY IN ALBANIA: ANALYSIS AND POLICY RECOMMENDATIONS - ISBN 92-64-010254 - ©OECD 2005
1997 1997 1997
Total excise liability 13,478 Total excise liability 18,187 Total excise liability 9,457 Excise Revenue 2,168 Excise Revenue 2,168 Excise Revenue 2,168 Excise Compliance Rate
16.1% Excise Compliance Rate
11.9% Excise Compliance Rate 22.9%
Total VAT liability 44,554 Total VAT liability 46,106 Total VAT liability 43,151 VAT Revenue 15,655 VAT Revenue 15,655 VAT Revenue 15,655 VAT Compliance Rate 35.1% VAT Compliance Rate 34.0% VAT Compliance Rate 36.3%
1996 1996 1996
Total excise liability 10,295 Total excise liability 14,441 Total excise liability 6,796 Excise Revenue 4,947 Excise Revenue 4,947 Excise Revenue 4,947 Excise Compliance Rate
48.1% Excise Compliance Rate
34.3% Excise Compliance Rate 72.8%
Total VAT liability 42,289 Total VAT liability 43,702 Total VAT liability 41,014 VAT Revenue 9,076 VAT Revenue 9,076 VAT Revenue 9,076 VAT Compliance Rate 21.5% VAT Compliance Rate 20.8% VAT Compliance Rate 22.1%
+15% excised shares & rates, -15% non-
VAT -15% excised shares & rates, +15% non-
VAT CENTRAL VALUES HIGH BOUND LOW BOUND
Aggregate Results and International Comparison
In this section we use our findings for two purposes. On the one hand we would like to know the net revenue shortfall that Albania has suffered due to non-compliance for each type of tax we have analysed, as well as the total loss. This is done in a direct, ceteris paribus, fashion, simply imposing 100% compliance rates by multiplying the tax bases by the average theoretical rates for each type of tax and each year in turn. The goal of these results is to give a feel for the dimensions of the problem. These figures should not be interpreted as something that could truly have happened for two main reasons: first of all 100% compliance never happens anywhere for obvious reasons, and second, there are (and would have been) knock-on effects of better compliance for one type of tax onto the revenues of other taxes as changes in the compliance rates also modify the tax bases (e.g. if one had 100% compliance on personal income tax, then this would reduce the tax base for consumption taxes).
Estimated lost tax revenue due to tax evasion, by type of tax (1996-2003) 1996 1997 1998 1999 2000 2001 2002 2003
Personal Income Tax Loss, Lek mn . . 10,261 11,369 6,375 7,096 14,318 18,454 Personal Income Tax Loss, % of GDP . . 2.4 2.3 1.2 1.2 2.1 2.5
HH Social Security Contr. Loss, Lek mn . . 9,415 9,389 8,320 9,044 20,377 22,308 HH Social Security Contr. Loss, % of GDP . . 2.2 1.9 1.5 1.5 3.0 3.0
Excise Tax Loss, Lek mn 5,348 11,310 9,887 6,705 3,104 5,967 11,096 8,493 Excise Tax Loss, % of GDP 1.7 3.4 2.3 1.4 0.6 1.0 1.6 1.1
VAT Tax Loss, Lek mn 33,213 28,899 23,684 24,354 16,493 27,313 35,854 38,713 VAT Tax Loss, % of GDP 10.5 8.7 5.6 5.0 3.0 4.5 5.3 5.2
Total Tax Loss, Lek mn . . 53,247 51,816 34,293 49,420 81,645 87,967 Total Tax Loss, %GDP . . 12.5 10.6 6.2 8.1 12.0 11.8
Source: Own calculations.

Annex E HOUSEHOLD TAX COMPLIANCE IN ALBANIA
THE INFORMAL ECONOMY IN ALBANIA: ANALYSIS AND POLICY RECOMMENDATIONS - ISBN 92-64-010254 - ©OECD 2005 125
We now turn to our international comparison. A brief explanation of our previous work is necessary here for the reader to understand the nature of the results for the other countries. What we did in previous research covering countries in Central and Southeast Europe was to construct an estimate of an all-encompassing household statutory tax rate. This statutory tax rate (SHTR) is designed in such a way as to match the total theoretical tax liability for the four types of taxes when applied to total household income. For each country we estimated total household income from household final consumption, in a similar fashion as to what is presented in equation (1) on page 4. SHTR was computed following similar assumptions as those made in this paper except that the treatment of personal income tax was somewhat simplified by taking an average of the rates of each bracket, rather than using an income distribution. Confronting the theoretical revenues to the actual ones gave us estimates of an overall household income declaration rate (lambda in the table below) as well as an estimate of total undeclared household income, which we expressed as a share of GDP for comparative purposes (SEIH in the table below).
Estimates of shadow economy contribution from households, 2001
ß SHTR THTR/GDP ß*Lambda Lambda SEIH
Total household income as
share of GDP
Statutory household tax
rate
Total household tax revenue as share of GDP
Declared household
income as share of GDP
Household income
declaration rate
Undeclared household
income as share of GDP
Albania 87% 21% 10% 49% 56% 38%
SEE-5 Average 85% 40% 19% 49% 57% 36%
Bulgaria 78% 38% 17% 44% 56% 34%
Croatia 75% 49% 28% 57% 76% 18%
Macedonia 88% 54% 26% 49% 55% 39%
Romania 81% 41% 14% 35% 43% 46%
Kosovo 104% 18% 10% 58% 56% 45%
AC Average 72% 44% 22% 50% 69% 22%
Czech Republic 67% 39% 19% 48% 72% 18%
Estonia 77% 53% 32% 60% 78% 17%
Hungary 70% 45% 22% 49% 70% 21%
Latvia 74% 40% 19% 49% 66% 26%
Lithuania 75% 37% 19% 50% 67% 25%
Poland 78% 48% 22% 47% 60% 31%
Slovakia 65% 41% 18% 44% 67% 21%
Slovenia 72% 50% 27% 55% 76% 17%
Source: Own estimates
The results presented in the table are for the year 2001. As an indication we present an equivalent
measure for Albania based on the estimates found for this report. Albania’s SHTR here is based on the theoretical tax revenues which we determined in the previous sections. A word of caution concerning this comparison is that our original work covering the countries of the region did not remove imputed rents from HHFC, whereas we did that for Albania in this report. Also we had less detailed information on various tax deductions and exemptions (e.g. VAT thresholds) for the other countries. This correction would imply higher declaration rates and lower undeclared incomes for all the other countries. On the other hand we added in the case of Albania HHCO to HHFC. However, we stick to our general intuition

Annex E HOUSEHOLD TAX COMPLIANCE IN ALBANIA
126 THE INFORMAL ECONOMY IN ALBANIA: ANALYSIS AND POLICY RECOMMENDATIONS - ISBN 92-64-010254 - ©OECD 2005
that tax compliance is probably lower in Albania than in most transition countries and probably compares unfavourably even with other countries in Southeast Europe.
Finally we would like to present the shadow economy estimates due to household tax evasion in % of GDP for the complete Albanian time series of 1998-2003 (SEIH in the table below). Average undeclared household income as a share of GDP stands at about half of Albania’s GDP. Again, the result for 2000 supports our concern about HHFC and remittances for that year. This would place Albania even below the average of Southeast European countries rather than at the top end of the distribution.
Estimates of shadow economy contribution from households, Albania
ß SHTR THTR/GDP ß*Lambda Lambda SEIH
Total household income as
share of GDP
Statutory household tax
rate
Total household tax revenue as share of GDP
Declared household
income as share of GDP
Household income
declaration rate
Undeclared household
income as share of GDP
Average 88% 23% 10% 44% 50% 45%
2003 92% 24% 10% 43% 47% 49%
2002 92% 24% 10% 42% 46% 50%
2001 87% 21% 10% 49% 56% 38%
2000 79% 21% 10% 49% 62% 30%
1999 85% 23% 9% 39% 46% 46%
1998 93% 23% 9% 39% 42% 54%
Source: Own estimates
Conclusions
Our estimates of compliance rates for the various types of taxes and connected estimates such as our overall household income declaration rate show that tax compliance by households in Albania is, by European standards, very low. More disturbingly, compliance rates for personal income tax and for social security appear to have significantly worsened over the last few years. If our suspicion about revenue targets within the tax administration is correct, then it could very well be that some relatively easy improvements could be achieved simply by setting higher targets. This should certainly be the case for personal income tax. Certainly the analysis raises questions about how the tax administration could achieve impressive rises in PIT revenues between 2000 and 2001, but no nominal change since then. Another, related, policy recommendation would be to try to reconcile theoretical liability levels with revenue targets. There is a case for arguing that economic agents may take the law and the tax administration more seriously, and so increase formal production, if they see that a change in rates or band limits is reflected in what the state truly expects them to pay. Also, it would be very useful to look at the probability, level and impact of penalties for partial or non-payment of tax liabilities in more detail. From a research point of view, we would therefore advocate some additional work specifically on the issue of incentives and penalties.
Concerning VAT, it is clear that the turnover threshold provides a loophole which might inadvertently encourage informal activity, as larger firms supplying small retailers as well as small retailers with turnovers close to the threshold have strong incentives to evade. Also, from an analytical point of view, the existence of the threshold, as we have seen, makes it more difficult to correctly

Annex E HOUSEHOLD TAX COMPLIANCE IN ALBANIA
THE INFORMAL ECONOMY IN ALBANIA: ANALYSIS AND POLICY RECOMMENDATIONS - ISBN 92-64-010254 - ©OECD 2005 127
estimate theoretically expected VAT returns, and thus VAT compliance overall. One way forward would be to consider reducing the threshold, certainly bringing it closer to the levels seen in neighbouring countries. In conjunction with this the marginal rate of tax for companies operating just above the threshold should be modified so that the marginal rate is not greater than 100%, as is currently the case (in fact the figures shown in the main OECD report show that marginal tax rates just above the VAT threshold are significantly higher than this.) In such a scenario we would certainly not expect VAT returns to go down, in fact an increase would be the likeliest outcome, while the monitoring of compliance would be made easier and more precise. We also believe that it would be a good, simple, clear signal to the new private sector in Albania, removing the distortionary and prohibitively high marginal tax rates. This, at least, is our initial feeling based on the findings detailed in this report. A detailed impact study for such a reform should of course be undertaken.
Turning now to excise tax, the estimates showed quite strong fluctuations over time, while the sensitivity analysis showed that the results are very sensitive to measurement error in the input data. However if we are to believe that the trend over time shown by our central estimates is correct, then the likelihood remains that, here again, revenue targets are being set in nominal terms, and perhaps just as a complement to other revenue targets and/or actual revenues. If this were the case, we would again advocate switching to (relatively ambitious) targets in terms of compliance rates, which should be increased each year and backed up by a steadily stronger enforcement mechanism. The incremental aspect to this proposal is essential as a significant change in enforcement may be counter-productive and perversely increase levels of informality.
As underscored several times in this report, analysing tax compliance (or for that matter any other economic issue) in the Albanian context is difficult due to the generally poor quality and reliability of the data. This is a classical problem found to some extent elsewhere in Southeast Europe (most notably in Serbia and Montenegro and in Bosnia and Herzegovina) and of course we fully realise that resources for national statistics are limited in the region. Obviously this goes beyond the scope of this report and would require a separate assessment by appropriate bodies and authorities. We can only hope however that additional resources to undertake improvements will be forthcoming.
In the mean time, there are a certain number of very concrete issues which would make the monitoring of tax compliance easier and more efficient. Let us mention just two of them:
A single document should be made available which contains the rates and bands for all types of taxes, going back in time to, say, 1996, detailing each change in rates or bands made, and explicitly stating when the changes came into force (month and year). This document should then be updated every time a change in rates or bands is made. This document should also be permanently available online.
The other point which would be worthy of further investigation would be the level of household construction outlays. This will probably require additional resources for the Albanian Statistical Office which would be welcomed by us.

Annex E HOUSEHOLD TAX COMPLIANCE IN ALBANIA
128 THE INFORMAL ECONOMY IN ALBANIA: ANALYSIS AND POLICY RECOMMENDATIONS - ISBN 92-64-010254 - ©OECD 2005
NOTES
1 The Vienna Institute for International Economic Studies (wiiw) – http://www.wiiw.ac.at - The authors
may be contacted by email: [email protected] and [email protected]
2 As detailed in OECD (2002a).
3 That part of underground production which would be captured using a tax compliance approach is referred to in OECD (2002a) as untaxed production and is said to be “almost but not quite coincident” with underground production in OECD (2002a). The reason is the unlikelihood of productive activities being hidden in order to avoid regulations, and yet be truthfully reported to the tax authorities.
4 The lower bound was 6040 for 1998-2001, 9043 for 2002 and 10343 for 2003, while the upper bound was 18120 for 1998-2001, 47015 for 2002 and 51715 for 2003.
5 The rate was calculated under the assumption of a retail price of 60 Lek for the most popular and/or cheapest local brand and a 20% VAT and 15 Lek excise tax.
6 That year Albania experienced a significant breakdown in public order. This was essentially driven by popular anger due to the collapse of pyramidal saving schemes.
7 Please note that VAT compliance rates as provided in this section are somewhat different from the rate v in the modelling section as the rates here correspond to an average rate including the VAT evasion on excised goods which was calculated with the excised goods compliance rate.

THE INFORMAL ECONOMY IN ALBANIA: ANALYSIS AND POLICY RECOMMENDATIONS - ISBN 92-64-010254 - ©OECD 2005 129
Appendix to Annex E
Tax revenue, by type of tax (1996-2003)
1996 1997 1998 1999 2000 2001 2002 2003
Personal Income Tax Revenue, Lek mn . . 1,167 3,110 4,590 6,300 6,149 6,414 Personal Income Tax Revenue, % of GDP . . 0.3 0.6 0.8 1.0 0.9 0.9
HH Social Security Contr. Revenue, Lek mn . . 4,035 4,628 5,112 5,737 6,586 7,648 HH Social Security Contr. Revenue, % of GDP . . 0.9 0.9 0.9 0.9 1.0 1.0
Excise Tax Revenue, Lek mn 4,947 2,168 4,910 6,961 9,153 9,544 9,324 12,258 Excise Tax Revenue, % of GDP 1.6 0.7 1.2 1.4 1.7 1.6 1.4 1.6
VAT Tax Revenue, Lek mn 9,076 15,655 28,771 29,794 38,107 41,148 46,113 50,625 VAT Tax Revenue, % of GDP 2.9 4.7 6.8 6.1 6.9 6.7 6.8 6.8
Total Tax Revenue, Lek mn . . 38,883 44,493 56,962 62,729 68,172 76,945 Total Tax Rev., %GDP . . 9.1 9.1 10.3 10.3 10.1 10.3
Source: WIIW Own calculations.

Annex E HOUSEHOLD TAX COMPLIANCE IN ALBANIA
130 THE INFORMAL ECONOMY IN ALBANIA: ANALYSIS AND POLICY RECOMMENDATIONS - ISBN 92-64-010254 - ©OECD 2005
REFERENCES
Deloitte & Touche (2002), Central European Tax News, 2002.
Feige, E., L., (1979): How Big is the Irregular Economy? Challenge, Vol. 22, No. 1, pp.5-13.
Feige, E., L., (1989) (ed.): The underground economies. Tax evasion and information distortion. Cambridge, New York, Melbourne, Cambridge University Press.
Feige, E., L., (1996): Overseas holdings of U.S. currency and the underground economy, in: Pozo, Susan (ed.): Exploring the Underground Economy. Kalamazoo, Michigan, pp. 5-62.
Frey, B.,S., Weck-Hannemann, H., (1984): The hidden economy as an “unobserved” variable, European Economic Review, 26/1, pp. 33-53.
Gligorov V., Landesmann M., Holzner M., (2003), “Prospects for Further (South-) Eastern EU Enlargement: from Divergence to Convergence?”, wiiw Research Report No. 296, The Vienna Institute for International Economic Studies, June 2003
Gligorov V. (2003), “Serbia and Montenegro, Transition with Organised Crime”, wiiw Current Analyses and Country Profiles Series, No. 19, July 2003
Holzner, M. (2003), Measuring the informal economy, in: Gligorov, V., Christie, E., and Holzner, M., An Informal Discussion On the Informal Economy, paper presented at the wiiw-GDN Workshop on Enterprise Development, Informal Economy and Labour Markets, April 4-5, 2003, The Vienna Institute for International Economic Studies (wiiw).
IMF (2002): “Kosovo, Institutions and Policies for Reconstruction and Growth,” IMF 2002.
IMF (2003): “Albania: Selected Issues and Statistical Appendix,” IMF Country Report No. 03/64.
Ivanov, E., Stoykova, I., Palahanova, Y., (2002): Investment Guide for Southeast Europe 2002, 2nd edition, Bulgaria Economic Forum, 2002.
Ivanov, E., Stoykova, I., Palahanova, Y., (2003): Investment Guide for Southeast Europe 2003, 3rd edition, Bulgaria Economic Forum, 2003.
Jarass, L., Obermair, G. (2000), Structures of the Tax Systems in Estonia, Poland, Hungary, the Czech Republic and Slovenia, Report commissioned by the European Commission, DG XXI, May 2000.
Johnson, S., Kaufmann, D., Shleifer, A. (1997), The Unofficial Economy in Transition, Brookings Papers on Economic Activity, 2:1997.

Annex E HOUSEHOLD TAX COMPLIANCE IN ALBANIA
THE INFORMAL ECONOMY IN ALBANIA: ANALYSIS AND POLICY RECOMMENDATIONS - ISBN 92-64-010254 - ©OECD 2005 131
Kaufmann, D., Kaliberda, A., (1996), Integrating the unofficial economy into the dynamics of post socialist economies: A framework of analyses and evidence, Washington, D.C., The Worldbank, Policy research working paper 1691.
KPMG (2003), Investment Environment in the Baltic States, Comparative Guide, Edition 2003.
Kyle, S., Warner, A., Dimitrov, L., Krustev, R., Alexandrova, S., Stanchev, K., Stoev, G., (2001), “The Shadow Economy in Bulgaria”, Harvard University, Agency for Economic Analysis and Forecasting, Institute for Market Economics, Sofia, 2001.
Lackó, M., (1996): Hidden economy in East-European countries in international comparison, Laxenburg: International Institute for Applied Systems Analysis (IIASA), working paper.
Lackó, M., (1998): The hidden economies of Visegrad countries in international comparison: A household electricity approach, In: Halpern, L. and Wyplosz, Ch. (eds.), Hungary: Two wards a market economy, Cambridge (Mass.): Cambridge University Press, p.128-152.
Lackó, M., (1999): Hidden economy an unknown quantitiy? Comparative analyses of hidden economies in transition countries in 1989-95, Working paper 9905, Department of Economics, University of Linz, Austria.
Mirus, R., Smith, R.S., “Canada's Underground Economy: Measurement and Implications", in: The Underground Economy: Global Evidence of its Size and Impact, edited by Lippert, O., Walker, M., The Fraser Institute, Vancouver, 1997.
OECD (2002a): “Measuring the Non-Observed Economy – A Handbook”, OECD 2002.
OECD (2002b): “Taxing Wages 2001-2002”, OECD 2002.
Schneider, F., Enste, D. (2000): Shadow Economies Around the World: Size, Causes, and Consequences, IMF Working Paper 0026, International Monetary Fund.
Schneider, F., (2003): The Development of the Shadow Economies and Shadow Labour Force of 22 Transition Countries and 21 OECD Countries, Johannes Kepler University of Linz, First Draft, March 2003.
Stability Pact (2003): Tax Policy Assessment and Design in Support of Direct Investment – A Study of Countries in South East Europe, The Stability Pact Investment Compact SEE, April 2003.
Tanzi, V., (1980): “The Underground Economy in the United States: Estimates and Implications,” Banca Nazionale del Lavoro, 135:4, pp. 427-453.
Tanzi, V., (1983): “The Underground Economy in the United States: Annual Estimates, 1930-1980, “IMF-Staff Papers, 30:2, pp. 283-305.
UNECE (2003), “Non-Observed Economy in National Accounts – Survey of National Practices”, United Nations Economic Commission for Europe, Geneva, 2003.
Weck, H., (1983): Schattenwirtschaft: Eine Möglichkeit zur Einschränkung der öffentlichen Verwaltung? Eine ökonomische Analyse, Bern-Frankfurt.

THE INFORMAL ECONOMY IN ALBANIA: ANALYSIS AND POLICY RECOMMENDATIONS - ISBN 92-64-010254 - ©OECD 2005 132
Annex F
ORDER OF THE COUNCIL OF MINISTERS FOR THE ESTABLISHMENT OF A STEERING COMMITTEE
REPUBLIC OF ALBANIA
Council of Ministers
O R D E R
Nr. 180_, Date 11.11.2004_
FOR
THE ESTABLISHMENT OF A STEERING COMMITEE FOR DRAFTING AND IMPLEMENTING AN ACTION PLAN, FOR THE REDUCTION OF THE INFORMAL
ECONOMY Based on point 3, article 102, of the Albanian Constitution,
C O M M A N D:
1. The creation of a Steering Committee for drafting and implementing an Action Plan, for the reduction of the Informal Economy in Albania, based on the given recommendations of the OECD Investment Compact for South East Europe study on this phenomenon.
2. This Committee will be chaired by the Minister of Economy, in accordance with this order, and will be composed of:
a) Deputy Minister of Finance member; b) Deputy Minister of Labour and Social Affairs member; c) Director of the Institute of Statistics member; d) Director of the Institute of Social Insurances member;
The Governor of the Bank of Albania is also invited to join this Committee.

Annex F ORDER OF THE COUNCIL OF MINISTERS FOR THE ESTABLISHMENT OF A STEERING COMMITTEE
THE INFORMAL ECONOMY IN ALBANIA: ANALYSIS AND POLICY RECOMMENDATIONS - ISBN 92-64-010254 - ©OECD 2005 133
3. The Steering Committee has these tasks:
4. The establishment of technical sub-groups;
5. The preparation and monitoring of the Action Plan.
6. The Steering Committee should present a progress report to the Cabinet of the Prime Minister every two weeks.
7. The Steering Committee is in charge of preparing a detailed Action Plan until the 30th of December 2004, in accordance with this order.
8. The Minister of Economy is responsible for the execution of this order.
9. This order enters into force immediately.
P R I M E M I N I S T E R
FATOS NANO

THE INFORMAL ECONOMY IN ALBANIA: ANALYSIS AND POLICY RECOMMENDATIONS - ISBN 92-64-010254 - ©OECD 2005 134
Annex G
ACTION PLAN FOR THE REDUCTION OF THE INFORMAL ECONOMY IN ALBANIA Prepared by the Inter-Ministerial Task Force on the Informal Economy – December 2004
Objectives
Measures Responsible
Institutions Monitoring Indicators Deadline
Improvement and correction of statistic
evaluation for the GDP
Institute of Statistics
Setting-up the new method for evaluation of NOE (input labour method)
INSTAT
Methodological document
2005-2006
Improvement of calculation of the labour indicators
,based on the LSMS survey
Improved labour indicators
2005-2006
Adoption of the data coming from auditing
directory of tax-administration in order to improve the evaluation of
NOE
INSTAT+DPT New form for
identification of under-reporting of sales according to Nace
2005-2006
Adoption of the data coming from labour
inspection in order to improve the evaluation of
NOE
INSTAT+IP
New form for identification of
underreporting of employees according to
Nace
2005-2006
Setting up the methodology of input-output table
INSTAT
2005-2006
Short-terms Objectives
Improvement of the quality of the statistical business
register
INSTAT
Updates statistical business register
a)or includes to PSZ b)or special MOU with
courts
2005-2006
Improvement of the legal framework to
ensure the information coming from balance sheets
INSTAT
2005-2006
Additional technical staff in NA sector
INSTAT 2005-2006
Improvement of technical infrastructure in the
calculation of the GDP
INSTAT 2005-2006

Annex G ACTION PLAN FOR THE REDUCTION OF THE INFORMAL ECONOMY IN ALBANIA
THE INFORMAL ECONOMY IN ALBANIA: ANALYSIS AND POLICY RECOMMENDATIONS - ISBN 92-64-010254 - ©OECD 2005 135
Objectives
Measures Responsible
Institutions Monitoring Indicators Deadline
Labour force survey
INSTAT+MP 2007-2009
Implementation of the “input labour” method in the evaluation of NOE
INSTAT 2007-2009
Implementation of the a.m. method in to all time series
data of GDP INSTAT 2007-2009
Improvement and special attention in the calculation of the components of GDP, for enterprises which pay
INSTAT 2007-2009
Medium–term Objectives 2007-2009
Detailed analyses in the data regarding declared
VAT and expected
INSTAT +DPT
Survey in place, better estimated NOE
indicator
2007-2009
Implementation of the input-output table which
will be possible within the process of the development of the long-term statistical
program
INSTAT 2007-2009
Transform the existing method of evaluation of
NOE (static coefficient) in to dynamic one
2007-2009
Set-up an expert group to revise the static coefficient
available so far
INSTAT, (does not fit with the
objectives of the twining project)
2007-2009
Economic census for non-agricultural companies
INSTAT
2007-2009

Annex G ACTION PLAN FOR THE REDUCTION OF THE INFORMAL ECONOMY IN ALBANIA
136 THE INFORMAL ECONOMY IN ALBANIA: ANALYSIS AND POLICY RECOMMENDATIONS - ISBN 92-64-010254 - ©OECD 2005
Objectives
Measures Responsible
Institutions Monitoring Indicators Deadline
Improvement of tax and
customs regime and administration
Ministry of
Finance
Business register
procedures MoF Fiscal Package 2006 October 2005
Licensing procedures Tax Department
(TD)
Fiscal Package 2007 – prepared based on this
recommendations
October 2006
Administrative barriers Customs
Department (CD)
To improve financial and fiscal legal and
regulatory framework
Law enforce (of financial and fiscal procedures).
Review of fiscal burden and the tariff rate of social contributions
Analyze of the level of the fiscal burden;
MoF
Prepare the report of the actual level of fiscal burden in total and
detailed for each fiscal tax (obligations), based
on an analysis in comparison with the
other region countries
March 2005
Review of the fiscal burden for each fiscal obligation
level based on the analysis report of the fiscal burden
in Albania;
TD
Proposal for amendment on the fiscal package for
changes on the legal fiscal burden
June 2005
Review of the social and health insurance
contributions scheme
Ministry of Work and Social Affairs, Institute of Social
Insurance
Proposal for review of the social and health contributions scheme
June 2005
Fighting administrative corruption
Minister of State for Coordination
Implementing the Action Plan for fight of Corruption and money
laundering (MSFC)
Deadline of the action plan
(MSFC)
Report of unclear fiscal legislation that give
incentives for evasion, review of fiscal package focused on this objective
Ministry of Finance
Prepare report on review of the fiscal, package and propose for law
amendments that improve the legislative
framework
June 2005 Building Tax and
Customs institutions capacities
Fighting bureaucracy on implementing the tax
procedures law. TD,CD
Implementation of the matrix for removing the administrative barriers
(MoE)
Deadline of the matrixes for
fighting corruption and
removing administrative barriers of the
MSFC and MOE

Annex G ACTION PLAN FOR THE REDUCTION OF THE INFORMAL ECONOMY IN ALBANIA
THE INFORMAL ECONOMY IN ALBANIA: ANALYSIS AND POLICY RECOMMENDATIONS - ISBN 92-64-010254 - ©OECD 2005 137
Objectives
Measures Responsible
Institutions Monitoring Indicators Deadline
Harmonization of all three
taxes, in order to reduce tax elusion of non registered
taxable persons
Ministry of Finance Proposal for changes in
the tax rates June 2005
Improvement of tax audit TD
Tax audit outcomes, achievement of revenue targets for VAT, profit tax and small business
tax;
Monthly reporting of tax audit outcomes
Set up of a consultative process with private sector representatives, in order to find the right approach to
link the effective profit tax rate and social and health
contributions of small businesses, including VAT
Ministry of Local Government and Decentralization
Execution of the consultative process and
proposals March 2005
Analysis of profit tax, small business tax and
value added tax
Review (reduction) of profit tax rate (profit tax
rate has already been reduced in the Fiscal
Package 2005 approved by the Parliament, to 23% for 2005 and to 20% for 2006)
to attract more foreign direct investment
Ministry of Economy
Proposal on profit tax, based on the tax rate
review analysis – Fiscal package 2007
June 2005 / October 2006
Review of the implementation approach
of this tax, in order to reduce cases of false
financial reporting (data on turnover);;
Ministry of Finance
Report on tax implementation for
small businesses recommendations
April 2005
Review of law implementation and audit
regulations; TD
Draft of legal acts (regulations) on tax audit approach and
procedures
May 2005
Review of small business income tax and
simplified profit tax
Review of the registration threshold for small
businesses.
Ministry of Local Government and Decentralization
Fiscal package 2006 – review of turnover
threshold.
July 2005 / October 2005
Starting from January 1st, 2005, VAT is applied on all subjects defined by the law
as legal persons;
Ministry of Finance, TD
VAT law enforcement January 2005
Analysis of the new formula
Ministry of Finance, TD
Report on new formula outcomes;
February – March 2005
Further improvement of the formula and/or relative
regulations;
Ministry of Finance, TD
Proposals for further legislative
improvement; July 2005
Starting from January 1st, 2006, VAT is applied on
new building sales;
Ministry of Finance, TD
VAT law enforcement. January 2006
Analysis of the new approach for VAT
registration
Monitoring of VAT implementation in the construction sector.
Ministry of Finance, TD

Annex G ACTION PLAN FOR THE REDUCTION OF THE INFORMAL ECONOMY IN ALBANIA
138 THE INFORMAL ECONOMY IN ALBANIA: ANALYSIS AND POLICY RECOMMENDATIONS - ISBN 92-64-010254 - ©OECD 2005
Objectives
Measures Responsible
Institutions Monitoring Indicators Deadline
VAT refund system Ministry of Finance
Enforcement of new law provisions on VAT and
other taxes refund procedures
January 2005 Improvement of tax
refund system (procedures).
Other taxes refund system TD, CD
Report on the number of refund claims and refund executed
3-month based reports
Phone service for reporting
all cases of law infractions/abuses
Ministry of Finance Set up of the secretariat March 2005
Online service for
delivering tax forms and all other complementary
documents/information
TD On-line access of
information April 2005
Set up of a secretariat (nonstop service office online) for reporting all
kind of infractions related to taxes
Publication, delivery and easy access to fiscal legislation and fiscal
administration regulations, for both businesses and
individuals
CD Publication and delivery
of fiscal legislation August 2005
Customs control improvement, with regard
to volumes, quantities, costs and values –
reduction of cases of abuses in relation to payment and
refund requests of VAT
Ministry of Finance Report on customs
controls and measures taken
3 month based reports
Customs control improvement
Gradual abandoning of the reference prices approach in the imports evaluation
procedures
TD Reporting of cases of reference price use in customs procedures
3 month based reports
Improvements on the identification and collection of social
contributions
Ministry of
Labour and Social Affairs
Organization of a conference with social
partners for their sensibilization on the
importance that a reduced informal economy may
have in Albanian economic development
Ministry of Labour and Social Affairs,
Ministry of Economy
Increase the number of the insured persons and
their salary levels
Undertaking a study for the possibility of reduction of informal economy in the
construction sector
State Inspectorate of Labour
Social Insurance Institute
Tax Department
A considerable increase on the number of the insured persons and their salary levels
Third quarter of 2005
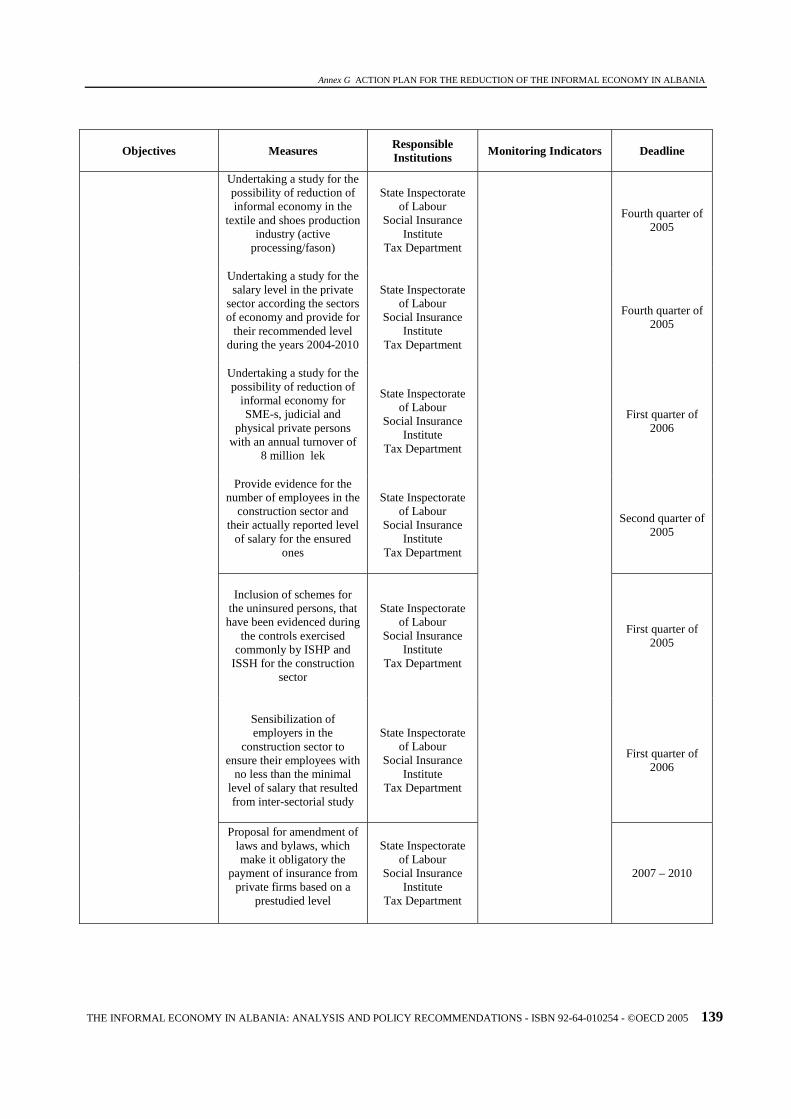
Annex G ACTION PLAN FOR THE REDUCTION OF THE INFORMAL ECONOMY IN ALBANIA
THE INFORMAL ECONOMY IN ALBANIA: ANALYSIS AND POLICY RECOMMENDATIONS - ISBN 92-64-010254 - ©OECD 2005 139
Objectives
Measures Responsible
Institutions Monitoring Indicators Deadline
Undertaking a study for the possibility of reduction of informal economy in the
textile and shoes production industry (active
processing/fason)
State Inspectorate of Labour
Social Insurance Institute
Tax Department
Fourth quarter of 2005
Undertaking a study for the salary level in the private
sector according the sectors of economy and provide for
their recommended level during the years 2004-2010
State Inspectorate of Labour
Social Insurance Institute
Tax Department
Fourth quarter of 2005
Undertaking a study for the possibility of reduction of
informal economy for SME-s, judicial and
physical private persons with an annual turnover of
8 million lek
State Inspectorate of Labour
Social Insurance Institute
Tax Department
First quarter of 2006
Provide evidence for the number of employees in the
construction sector and their actually reported level
of salary for the ensured ones
State Inspectorate of Labour
Social Insurance Institute
Tax Department
Second quarter of 2005
Inclusion of schemes for
the uninsured persons, that have been evidenced during
the controls exercised commonly by ISHP and
ISSH for the construction sector
State Inspectorate of Labour
Social Insurance Institute
Tax Department
First quarter of 2005
Sensibilization of employers in the
construction sector to ensure their employees with
no less than the minimal level of salary that resulted from inter-sectorial study
State Inspectorate of Labour
Social Insurance Institute
Tax Department
First quarter of 2006
Proposal for amendment of laws and bylaws, which make it obligatory the
payment of insurance from private firms based on a
prestudied level
State Inspectorate of Labour
Social Insurance Institute
Tax Department
2007 – 2010

Annex G ACTION PLAN FOR THE REDUCTION OF THE INFORMAL ECONOMY IN ALBANIA
140 THE INFORMAL ECONOMY IN ALBANIA: ANALYSIS AND POLICY RECOMMENDATIONS - ISBN 92-64-010254 - ©OECD 2005
Objectives
Measures Responsible
Institutions Monitoring Indicators Deadline
Study on possibility of
further reduction of contributions
Social Insurance Institute
First quarter of 2006
Study on the possibility of increasing the tax base or differentiated payment of
contribution based on realization of annual
turnover when it is less than 8 mln leke
Social Insurance Institute
Tax Department
Third quarter of 2006
Proposal for amendments to laws and bylaws, which
make the insurance payments obligatory by
private employers, subjects with turnover under 8 mln
leke based on a predetermined salary level by responsible institutions
State Inspectorate of Labour
Social Insurance Institute
Tax Department
Second quarter of 2007
Proposal for amendments to laws and bylaws which
make the insurance payments obligatory for
differentiated self employers, according
professions
State Inspectorate of Labour
Social Insurance Institute
Tax Department
2007
Further reduction of the actual level of social
contributions by expanding the base
taxation.
Proposal for improvements in procurement law that are
related to reduction of informality
State Inspectorate of Labour
Social Insurance Institute
Tax Department
A considerable reduction on the level of
social contributions
2007
Study on the level and
types of promotions that should be used to stimulate the work of inspectors both
of taxation and ISHP
State Inspectorate of Labour
Tax Department 2006 Improve the performance
and increase the responsibility from tax
and labour inspectors in executing their every day
duties
Preparation of legal framework for the
application of promotions
State Inspectorate of Labour
Tax Department
2007

Annex G ACTION PLAN FOR THE REDUCTION OF THE INFORMAL ECONOMY IN ALBANIA
THE INFORMAL ECONOMY IN ALBANIA: ANALYSIS AND POLICY RECOMMENDATIONS - ISBN 92-64-010254 - ©OECD 2005 141
Objectives
Measures Responsible
Institutions Monitoring Indicators Deadline
Preparation of bylaws for
the functioning of Supervisory Inspectorate
State Inspectorate of Labour
2007
Preparation of regulation on licensing
State Inspectorate of Labour
2007 Plotesimi i sistemit te Sigurimeve Shoqerore
Study on the possibility of creation of professional
sectors for employees that work in so called “difficult
jobs”
State Inspectorate
of Labour, Ministry of Labour and Social Affairs,
other line ministries
Effectiveness of the Supervisory Inspectorate
2006
Improvement of business environment through the reduction
of administrative barriers
Ministry of Economy
Finalization of a self assessment process in frame of reduction of administrative barriers to investment:
- Organization of a National Conference for administrative barriers in field of investments and presentation of its outcomes.
MoE, FDIPA with the support of FIAS, SOROS
Presentation of outcomes of self
assessment study on impacts of measures undertaken by the
government and the introduction of new
measures
March-April 2005
- Review of action plan for reduction of administrative barriers, based on outcomes of the study
Task Force/MoE, MoF,
MoJustice, Ministry of
Tourism, Ministry of economic Integration
Improvements with concrete measures for responsible institutions and deadlines for their
implementation
April-May 2005
- Amendment of Council of Ministers Decision No 561,
date 1.8.2003 Task Force/MoE
Amended Council of Ministers Decision
May-June 2005
Publication of the outcomes of the self assessment study and new action plan for the reduction of administrative
barriers
MoE, FDIPA with donors support
Published document in Albanian and English
April-May 2005
Reduction of barriers to business through the
implementation of Action Plan
Follow up and continuous coordination of
implementation of measures included in the
Action Plan
Task Force/MoE Continuously

Annex G ACTION PLAN FOR THE REDUCTION OF THE INFORMAL ECONOMY IN ALBANIA
142 THE INFORMAL ECONOMY IN ALBANIA: ANALYSIS AND POLICY RECOMMENDATIONS - ISBN 92-64-010254 - ©OECD 2005
Objectives
Measures Responsible
Institutions Monitoring Indicators Deadline
Implementation of
recommended measures for the establishment of public informing offices in some
ministries
MoE and other line ministries
Establishment of public informing offices in the
line ministries 2005
Amendment of law on commercial companies
MoJ, MoE/BAC
Increased level of transparency for
economic-financial indicators of
commercial companies
2005
Amendment of the law on commercial register
MoJ, MoE, FDIPA, BAC with the donors support
Reduction of timing and costs of business
registration, elimination of differences between
foreign and national businesses
2005
Realization of a study for
the possibility of establishing a one stop shop system for foreign investors
MoE, MoJ, FDIPA, BAC with the
donor’s support
Establishment of costs and introduction of the
project to potential donors for funding
potentials
2005
Facilitation of registration procedures
for businesses
Creation of a software for the registration of businesses online
MoE, MoJ, SMEA, BAC with the
donor’s support
Establishment of the cost and implementation
in practice 2006-2007
Improvements in laws and
bylaws related to the establishment of new structures for dispute
settlement of administrative and commercial issues
MoJ, MOE, BAC with the donors
support
Improvements of appealing structures and
implementation of “silent consent”
2006 Improvements of the
administrative appealing procedures and
commercial dispute settlement
Drafting and approval of a new law on arbitrage
MoJ, MOE, BAC with the donors
support
Establishment of an Arbitrage Body
2005
Improvements of functioning of Business
Advisory Council (BAC)
Realization of a study for establishing a new
government structure, called Secretariat of BAC
ME, BAC
Establishment of a new Secretariat of BCC,
within the Ministry of Economy
2005-2006

THE INFORMAL ECONOMY IN ALBANIA: ANALYSIS AND POLICY RECOMMENDATIONS - ISBN 92-64-010254 - ©OECD 2005 143
Annex H
ACRONYMS
ASBS: Annual Structural Business Survey
BEEP: Business Environment and Enterprise Performance (Survey). CEI: Central European Initiative
CIT: Corporate Income Tax
EBRD: European Bank of Reconstruction and Development
ETF: European Training Foundation
EPPA: SEE Enterprise Policy Performance Assessments
FIAS: Foreign Investment Advisory Service
GDP: Gross Domestic Product
GNI: Gross national Income
GVA: Gross Value-added
HHFC: Households Final Consumption
IC: Investment Compact
INSEE: Institut National de la Statistique et des Etudes Economiques. (National Institute for Statistics and Economic Studies, France)
IMF: International Monetary Fund
INSTAT: Social Insurance Institute and the National Institute of Statistics (Albania)
ISTAT: Instituto Nazionale di Statistica (Italian National Statistics Institute)
LSMS: Living Standards Measurement Survey
MoE: The Albanian Ministry of Economy
NACE: Nomenclature Générale des Activités Economiques dans les Communautés Européennes (Statistical Classification of Economic Activities in the European Community)
NOE: Non-Observed Economy
OECD: Organisation for Economic Co-operation and Development
PIT: Personal Income Tax
SAS®: Business analytics software SBT: Small Business Tax
SDDS: Special Data Dissemination Standard
SEE: South East Europe
SMEs: Small and Medium Enterprises
SSCs: Social Security Contributions
USAID: The United States Agency for International Development
VAT: Value Added Tax
WIIW: Vienna Institute of International Economic Studies

THE INFORMAL ECONOMY IN ALBANIA
ANALYSIS AND POLICYRECOMMENDATIONS
DECEMBER 2004
Report prepared by the OECD - Investment Compactfor the Ministry of Economy of Albania
ISBN 92-64-01025-4 INV
ES
TM
EN
T C
OM
PA
CT
The informal economy is a major obstacle to the development of a strongenterprise sector and to the building of a well functioning market economy.
Economists have only recently started to explore the role played by theinformal economy in transition countries and so far much of the attention has beendevoted to estimating the size of the informal sector and to evaluating the fiscalimplications.
This report, prepared by the OECD Investment Compact in co-operation withthe OECD Statistics Directorate, upon a request from the Albanian Ministry ofEconomy, analyses the case of Albania, from an enterprise policy perspective.The analysis was conducted using a combination of statistical, macro and micro-economic tools, based on official GDP data and a set of indirect observations.The report explores issues such the size and intensity of informal activities inthe enterprise sector, the impact of tax and social security regimes, and therelationship between the informal economy and the spreading of unfair competitionpractices.
The report provides a set of policy recommendations, to be used as inputsfor the elaboration by the Albanian Government, together with its social partners,of a medium term strategy aiming to reduce the size of the informal economy.
PUBLISHED WITH THE SUPPORT OF THE CENTRAL EUROPEAN INITIATIVE (CEI)