the infrastructure crisis facing low-income communities
TRANSCRIPT

Water, Health, and Equity
in partnership with
PHOTO: ISTOCK
The Infrastructure Crisis Facing Low-Income Communities & Communities
of Color — and How to Solve It

MORE THAN 27 MILLION AMERICANS ARE SERVED BY WATER SYSTEMS VIOLATING HEALTH-BASED STANDARDS ESTABLISHED IN THE SAFE DRINKING WATER ACT.
PHOTO: ISTOCK
3 INTRODUCTION
4 AMERICA’S FAILING WATER INFRASTRUCTURE
8 HEALTH IMPACTS IN LOW-INCOME COMMUNITIES AND COMMUNITIES OF COLOR
15 POLICY SOLUTIONS FOR HEALTHY, SUSTAINABLE WATER INFRASTRUCTURE
18 THE TRUMP INFRASTRUCTURE PLAN IS NOT THE ANSWER
2 CLEAN WATER FOR ALL

A recent study found that more than 27 million Americans are served by water systems violating health-based stan-dards established in the Safe Drinking Water Act.1
All too often, our water infrastructure is failing our communities—especially vulnerable populations, such as low-income communities and communities of color. Over time, infrastructure investments have closely followed the geography of wealth. As a result, higher-income areas enjoy high-quality infrastructure while low-income areas have suffered decades of underinvestment and disinvestment.2 People of color live in areas with higher rates of contaminated water, stormwater and wastewater overflows, and increased risks of flooding.3
This two-tiered system violates the American principles of equality and justice—and it has serious consequences for public health. The good news is that we know what needs to be done to solve our nation’s water infrastructure prob-
lems. The bad news is that the plan proposed by President Trump is not the answer.
This paper will explain why America’s water infrastructure is failing and describe the impacts those failures can have on public health in low-income communities and commu-nities of color. It will propose policy solutions, developed and advocated by the Clean Water for All coalition, that can create a national water infrastructure that works for everyone. Finally, it will explain why the Trump adminis-tration’s infrastructure plan is fundamentally flawed and will not help the communities that need assistance and justice the most.
With infrastructure prominent in the national conversation, this moment in time provides an opportunity to speak out against the administration’s inadequate and harmful proposals, and to fight for policies that will further our shared goal of clean water for all.
Introduction
WATER INFRASTRUCTURE DIRECTLY AFFECTS OUR HEALTH. When it works properly, it provides us with safe drinking water and limits pollution in our local rivers and streams. On the other hand, when it falls into disrepair, it can lead to contamination that can make people sick.
PHOTO: ISTOCK
WATER, HEALTH, AND EQUITY 3
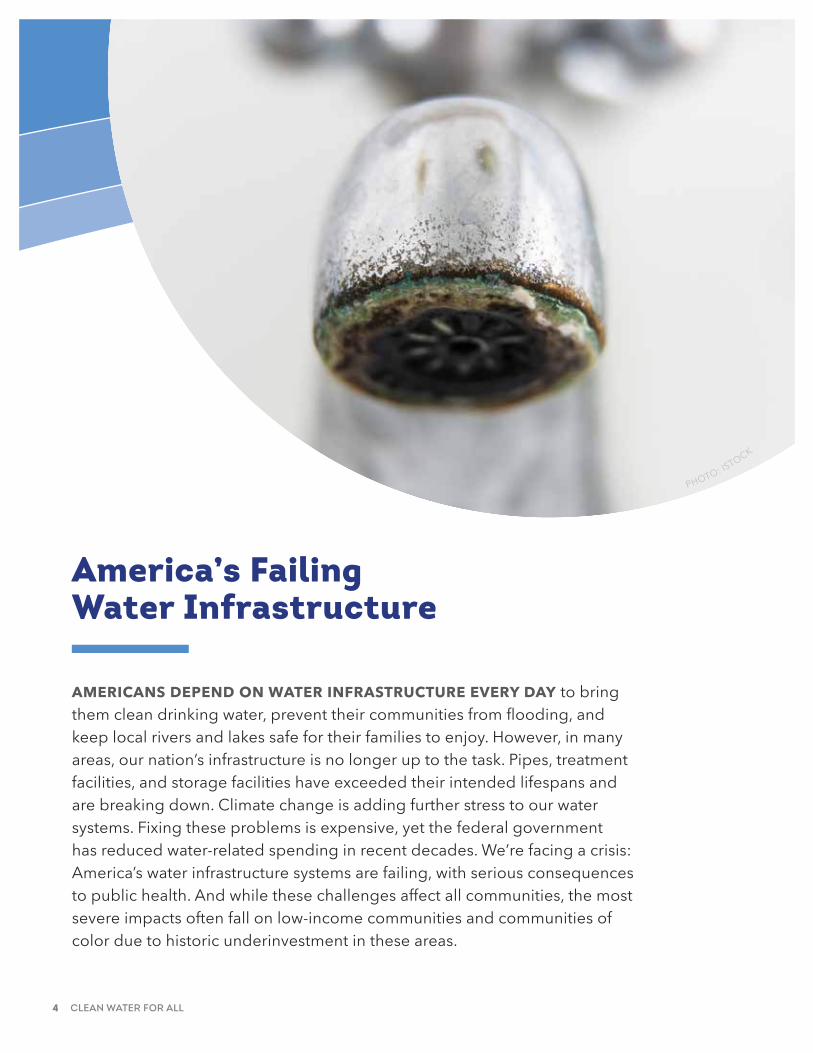
AMERICANS DEPEND ON WATER INFRASTRUCTURE EVERY DAY to bring them clean drinking water, prevent their communities from flooding, and keep local rivers and lakes safe for their families to enjoy. However, in many areas, our nation’s infrastructure is no longer up to the task. Pipes, treatment facilities, and storage facilities have exceeded their intended lifespans and are breaking down. Climate change is adding further stress to our water systems. Fixing these problems is expensive, yet the federal government has reduced water-related spending in recent decades. We’re facing a crisis: America’s water infrastructure systems are failing, with serious consequences to public health. And while these challenges affect all communities, the most severe impacts often fall on low-income communities and communities of color due to historic underinvestment in these areas.
PHOTO: ISTOCK
America’s Failing Water Infrastructure
4 CLEAN WATER FOR ALL

PHOTO: ISTOCK
AMERICA’S WATER INFRASTRUCTURE IS AGING
Much of America’s water infrastructure is nearing the end of its useful life. In many regions of the country, commu-nities are served by outdated systems, some more than 100 years old.4 In East Coast cities like Philadelphia, water pipes installed before the Civil War are still in use today.5
As underground water and sewer pipes exceed their intended life expectancy, many systems across the country are literally falling apart. Old pipes are easily broken by roots and other disturbances, allowing drinking water to be wasted or contaminated, or sanitary sewers to leak or overflow. Nationwide, communities lose six billion gallons of clean drinking water every day because of broken and leaking pipes, accounting for 14% to 18% of America’s total water use.6 What’s more, older water systems are more likely to include lead pipes, which Congress banned
in the 1980s.7 Approximately 15 to 22 million Americans nationally are still served by lead water lines.8
It is largely because of these aging systems that the Amer-ican Society of Civil Engineers gave the nation’s drinking water a “D” grade, and its wastewater infrastructure a “D+,” in its 2017 infrastructure report card.9 But with utili-ties averaging a pipe replacement rate of 0.5% per year, at the current pace it will take an estimated 200 years to replace these antiquated systems.10
CLIMATE CHANGE EXACERBATES THE CHALLENGES OF AGING INFRASTRUCTURE AND ADDS NEW CHALLENGES
America’s water systems, and the communities that depend on them, are already feeling the strain of climate change. As global climate patterns continue to shift, no
America’s water infrastructure systems include drinking water, wastewater, and stormwater infrastructure. Drinking water infrastructure collects water from the source, cleans it, and delivers it to users for drinking and other daily uses. It includes wells, reservoirs, headwater areas, facilities to treat water, laboratories to test water, distri-bution pumps and pipelines, storage tanks, and service lines. Wastewater infrastructure collects wastewater from homes and businesses, treats it, and conveys it back into rivers, lakes, or the ocean. It includes sewer lines, tanks, and treatment facilities. Stormwater infrastructure collects rainfall and conveys it into the nearest waterway, typically without treatment. It includes storm drains, stormwater pipes, storm sewer outfalls, and green storm-water infrastructure. In most places, wastewater and stormwater are conveyed in separate pipes, but in some older cities, stormwater and wastewater travel through the same set of pipes. These “combined” systems are designed to overflow into local waterways during rain events to avoid overwhelming wastewater treatment facilities. All of these different types of infrastructure can be publicly or privately owned. Even within the same commu-nity, they may be managed by different agencies, departments, or utilities.
WHAT IS WATER INFRASTRUCTURE?
PHOTO: ISTOCK
WATER, HEALTH, AND EQUITY 5

resource will be affected more profoundly than water. The current and projected future impacts of climate change on our water infrastructure include sea level rise, storm surge, extreme precipitation, decreased water quality, water shortages due to drought, flooding, increased water treat-ment requirements and costs, and higher energy demand for treatment plants.11 Because low-income communities and communities of color are more frequently located in areas vulnerable to these impacts, climate change will hit them especially hard.12
Wastewater treatment plants are typically located at the bottom of watersheds or in coastal areas. Given these loca-tions, these facilities are particularly vulnerable to increases in flood risk and sea level rise. For instance, during Super-storm Sandy in 2012, several wastewater treatment plants in New York and New Jersey were inundated with storm surge, causing hundreds of millions of gallons of untreated sewage to spill into neighboring waterways.13
Climate change is also expected to increase exposure to waterborne pathogens that cause a variety of illnesses, such as gastrointestinal illness and diarrhea.14 According to research from the Centers for Disease Control and Prevention, hospitalizations from three common and preventable waterborne diseases—Legionnaire’s disease, cryptosporidiosis and giardiasis—already cost the U.S. an estimated $539 million dollars each year.15 Increased exposure could exacerbate the risk already faced by low-income areas served by substandard or deteriorating water infrastructure.16
COMMUNITIES LACK THE FUNDING TO ADDRESS THESE CHALLENGES
These water infrastructure threats come with a large price tag. The Environmental Protection Agency conducts water infrastructure needs assessments every four years. The most recent studies show that we need to invest $743 billion in maintaining and repairing our water infrastruc-ture over the next twenty years just to meet current envi-ronmental and health standards—$271 billion for wastewa-ter and stormwater, and $473 billion for drinking water.17 Moreover, the impacts of climate change could increase our costs substantially. One water utility study estimated that climate change could add an additional $448 to $944 billion in infrastructure funding needs through the middle of the century.18
Yet at the same time that our nation’s infrastructure faces increasing challenges, our society is committing less money to its upkeep and repair. Federal spending on water infrastructure is decreasing, leaving states and local governments to pick up the tab.
An analysis of Congressional Budget Office data found that federal funding for water and wastewater utilities has decreased nearly fourfold between 1980 and 2014.19 On a per capita basis, from 1977 to 2014, federal spending on water infrastructure fell from $76 per person to $11 per person (expressed in 2014 dollars).20 The consequence of decreased federal funding for communities nationwide is even more significant when considering that a majority of the federal funds in the 1970s and 1980s were provided as grants, while the majority of the funds provided since the 1990s have primarily been loans.21 As a result, the gap between state and local government spending and federal government spending has widened over time. State and local governments now account for 96% of all public spending on water and wastewater utilities.22
6 CLEAN WATER FOR ALL
AFFORDABILITY IS AN INCREASINGLY DIRE PROBLEM AS COMMUNITIES STRUGGLE TO PROVIDE CLEAN, SAFE WATER
The costs of maintaining and improving water infrastruc-ture are becoming increasingly difficult for communities to afford, and the passing on of` those costs to consumers has created an affordability crisis for many in this country. Since the year 2000, water and wastewater prices have more than doubled, far exceeding the price increases of electricity, rent, and gasoline.23 Some estimates show that the average monthly residential bill for drinking water has gone up by 48 percent since 2010.24 Meanwhile, for most U.S. workers, real wages have barely budged in decades.25
In the many small-to-midsized American cities that are shrinking and generally more economically depressed, fewer ratepayers and a declining tax base make it difficult to raise funds for infrastructure investments. To deal with demographic changes, utilities must raise rates on the people who remain, burdening those who can least afford rate increases.26
The water affordability crisis is even more pronounced for lower-income customers, whose water and wastewater costs represent a comparatively higher proportion of monthly household expenses. In particular, those on fixed incomes can face trade-offs between paying for water services and necessities like housing, food, medicine, and other utility bills. In Gary, Indiana, 31 percent of customers are unable to pay their water bills, followed by Detroit, Michigan, at 14 percent.27 Since 2014, over 100,000 homes in Detroit have had their water shut off.28
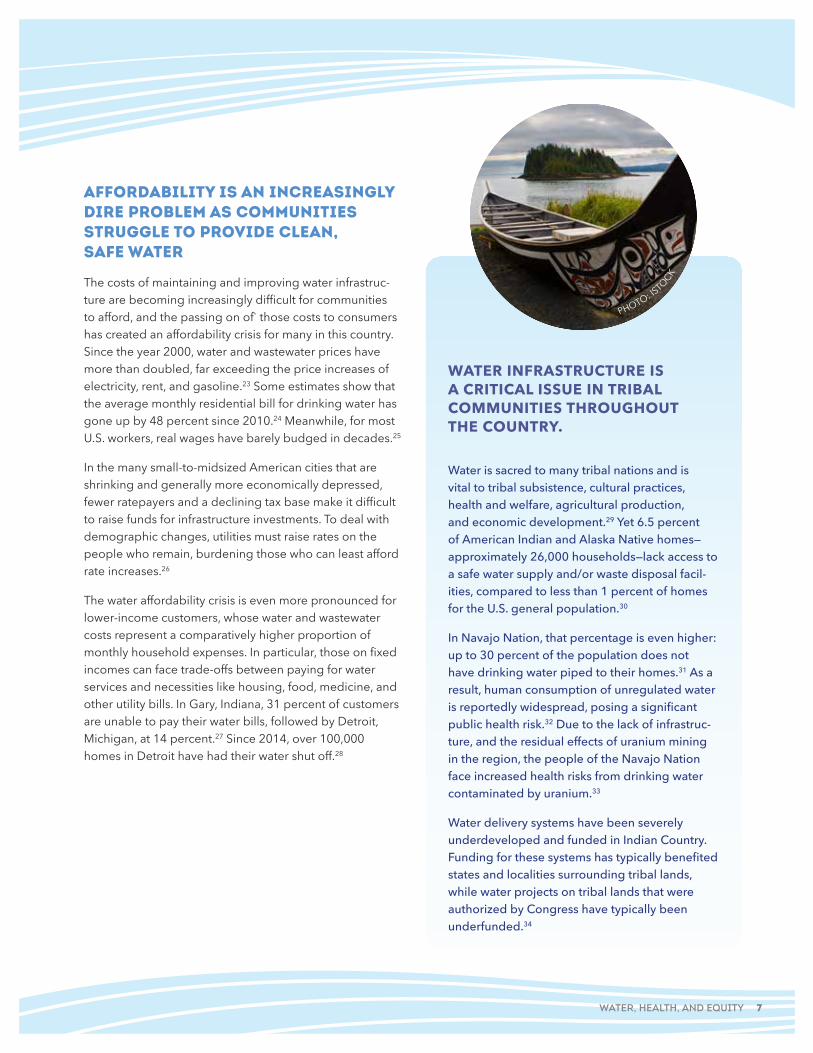
Water is sacred to many tribal nations and is vital to tribal subsistence, cultural practices, health and welfare, agricultural production, and economic development.29 Yet 6.5 percent of American Indian and Alaska Native homes—approximately 26,000 households—lack access to a safe water supply and/or waste disposal facil-ities, compared to less than 1 percent of homes for the U.S. general population.30
In Navajo Nation, that percentage is even higher: up to 30 percent of the population does not have drinking water piped to their homes.31 As a result, human consumption of unregulated water is reportedly widespread, posing a significant public health risk.32 Due to the lack of infrastruc-ture, and the residual effects of uranium mining in the region, the people of the Navajo Nation face increased health risks from drinking water contaminated by uranium.33
Water delivery systems have been severely underdeveloped and funded in Indian Country. Funding for these systems has typically benefited states and localities surrounding tribal lands, while water projects on tribal lands that were authorized by Congress have typically been underfunded.34
WATER INFRASTRUCTURE IS A CRITICAL ISSUE IN TRIBAL COMMUNITIES THROUGHOUT THE COUNTRY.
PHOTO: ISTOCK
WATER, HEALTH, AND EQUITY 7

THE HEALTH AND WELL-BEING OF LOW-INCOME COMMUNITIES AND COMMUNITIES OF COLOR IS INEXTRICABLY TIED TO THE ENVIRONMENT IN WHICH THEY LIVE, WORK, AND PLAY. These communities bear disproportionate health burdens from toxic drinking water; disease, displacement, and damage that result from natural disasters; harmful algal blooms from agricultural runoff in rural areas; and aging and crumbling infrastructure.
Health Impacts in Low-Income Communities and Communities of Color
PHOTO: ISTOCK
8 CLEAN WATER FOR ALL

TOXIC DRINKING WATER
Environmental health risks, such as lead-or arsenic-con-taminated drinking water, can be especially damaging when exposures take place during prenatal and early life development, when sensitive systems like the brain are especially vulnerable to even low-level or transient chemi-cal assault.35 A dose of lead that would have little effect on an adult can have a significant effect on a child.36 Lead can transfer from a pregnant woman to her fetus through the blood circulation, increasing the risk of low birth weight infants with slower physical development.37 Lead poison-ing in the fetus, infants, and young children can cause long-lasting or permanent physical and functional effects at very low exposure levels; no “safe” level of exposure has been established for lead poisoning during these critical windows of development.38 Adverse effects can include permanent damage to the central and peripheral nervous system, behavior and learning disabilities that can last into adult-hood, shorter stature, impaired hearing, and impaired formation and function of blood cells.39
On average, the EPA estimates that drinking water can make up 20% or more of a person’s total exposure to lead, but for babies, it can be the primary source of exposure.40 Young bottle-fed infants who consume mostly formula mixed with tap water can receive 85% of their exposure to lead from drinking water.41
According to the Centers for Disease Control and Prevention (CDC), about half a million children in the U.S. between the age of 1 and 5 years old are poisoned with blood lead levels above the CDC reference level trigger-ing the need for public health interventions (5 micrograms of lead per deciliter of blood).42 African-American children are at least 3 times more likely than white children to have elevated blood lead levels.43
Additionally, even low levels of environmental lead poisoning in adults is a significant risk factor for disability and death from cardiovascular disease and ischemic heart disease, causing an estimated 441,000 deaths annually in the U.S.44 The elevated risk from lead poisoning is
higher than from elevated cholesterol, and similar to smoking.45 These health effects are particularly concerning for non-Hispanic black populations, who are about 20 to 30 percent more likely to die from heart disease than non-Hispanic white populations.46
TOXIC WATER AND REPRODUCTIVE HEALTH
Environmental toxicants present in drinking water due to insufficient infrastructure can negatively affect human reproduction and development in several ways. One way is through endocrine disruption, “the process of synthetic
or naturally occurring chemicals altering the body’s normal hormonal activity.”47 Studies of laboratory animals and wildlife suggest that exposure to endocrine-dis-rupting chemicals (EDCs) can cause many reproductive health problems and adverse birth outcomes, including feminization of males, abnormal sexual behavior, altered metabolism and obesity, and prostate cancer.48
For example, one class of chemicals with endocrine-dis-rupting effects is polyfluoroalkyl and perfluoroalkyl substances (PFAS), which have also been associated with myriad other negative health impacts, including immune system toxicity, thyroid toxicity, kidney and testicular cancer, birth defects, delayed development, and newborn deaths.49 These toxic chemicals are released from indus-trial, firefighting, and military operations.50 Researchers recently identified PFAS in the drinking water supplies of more than six million Americans at levels higher than the EPA’s health advisory.51 The authors of that study have found that sources of PFAS contamination are often located in low-income communities, creating environmen-tal justice concerns.52
YOUNG BOTTLE-FED INFANTS WHO CONSUME MOSTLY FORMULA MIXED WITH TAP WATER CAN RECEIVE 85% OF THEIR EXPOSURE TO LEAD FROM DRINKING WATER.
WATER, HEALTH, AND EQUITY 9

LEAD AND MATERNAL HEALTH IN FLINT, MICHIGAN
Environmental toxicants in water can also impact repro-duction and development in other ways. For example, exposure to many types of pesticides found in drinking water have been linked to spontaneous abortions and birth defects in offspring.53 As described above, lead can disrupt brain development in fetuses.54
These challenges are especially present in the San Joaquin and Salinas Valleys in California, rural regions with large Latinx populations where intensive agricultural practices have resulted in the contamination of drinking water with nitrates.59 Nitrates are byproducts of nitrogen in synthetic fertilizers, animal manure, septic tanks, and wastewater treatment plants. Nitrates are difficult to remove from drinking water supplies, especially in systems that rely on untreated groundwater and do not have the necessary water treatment infrastructure.
Studies have linked high nitrate exposures in adults with miscarriage, digestive disorders, thyroid damage, and certain types of cancers in adults.60 Infants and newborns are particularly vulnerable to the adverse effects of nitrates.61 High nitrate levels in drinking water have also been linked to methemoglobinemia (a decrease in the oxygen-carrying capacity of red blood cells), which causes serious illness and sometimes death in infants.62
California leads the nation in food production.63 For decades, nitrate contamination has been a cost of that
When the city of Flint, Michigan, temporarily switched its water source to the Flint River in 2014, it failed to treat the water with corrosion inhibitors, which were needed to reduce the leaching of lead from the city’s pipes. As a result, the improperly treated river water corroded lead pipes and allowed high levels of lead to contaminate people’s tap water. Given that the population of Flint is over 50 percent black,55 this lapse had profound consequences for the health of Afri-can-American women and babies. Studies have raised concerns that the contamination in Flint may have impacted fertility, fetal development, and infant health.56
Even as the evidence mounts of adverse human health effects of chemical contamination of drinking water, few studies have been able to capture the full breadth. Generally, there is little research assessing the cumulative risk of exposure to multiple chemicals and classes of chemicals, and the effects of exposure to these chemicals over a full lifetime.57
TOXIC WATER AND RURAL COMMUNITY HEALTH
Many rural communities of color—particularly small farm-ing communities, indigenous communities, and migrant farmworker communities—have long faced challenges with toxic water due to insufficient water infrastructure.58
PHOTO: ISTOCK
10 CLEAN WATER FOR ALL
productivity. State officials now know the primary sources of contamination, just how extensive it is, and who is shouldering the burden.64
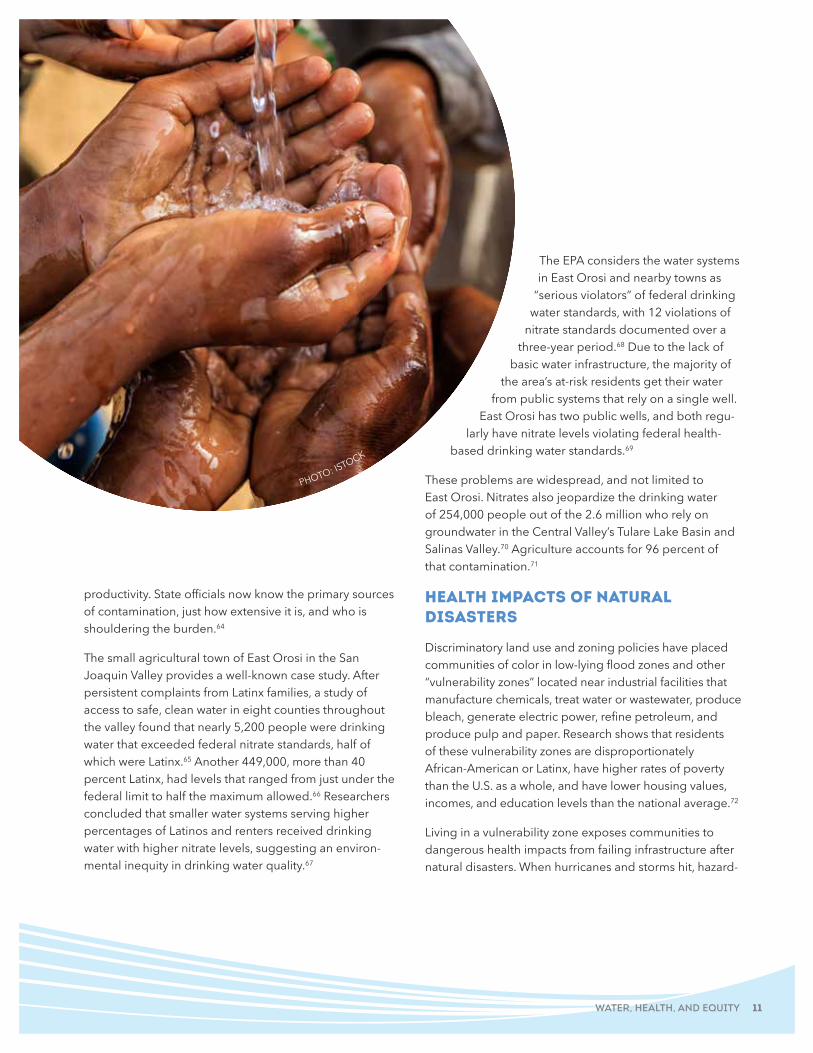
The small agricultural town of East Orosi in the San Joaquin Valley provides a well-known case study. After persistent complaints from Latinx families, a study of access to safe, clean water in eight counties throughout the valley found that nearly 5,200 people were drinking water that exceeded federal nitrate standards, half of which were Latinx.65 Another 449,000, more than 40 percent Latinx, had levels that ranged from just under the federal limit to half the maximum allowed.66 Researchers concluded that smaller water systems serving higher percentages of Latinos and renters received drinking water with higher nitrate levels, suggesting an environ-mental inequity in drinking water quality.67
The EPA considers the water systems in East Orosi and nearby towns as
“serious violators” of federal drinking water standards, with 12 violations of
nitrate standards documented over a three-year period.68 Due to the lack of
basic water infrastructure, the majority of the area’s at-risk residents get their water
from public systems that rely on a single well. East Orosi has two public wells, and both regu-
larly have nitrate levels violating federal health-based drinking water standards.69
These problems are widespread, and not limited to East Orosi. Nitrates also jeopardize the drinking water of 254,000 people out of the 2.6 million who rely on groundwater in the Central Valley’s Tulare Lake Basin and Salinas Valley.70 Agriculture accounts for 96 percent of that contamination.71
HEALTH IMPACTS OF NATURAL DISASTERS
Discriminatory land use and zoning policies have placed communities of color in low-lying flood zones and other “vulnerability zones” located near industrial facilities that manufacture chemicals, treat water or wastewater, produce bleach, generate electric power, refine petroleum, and produce pulp and paper. Research shows that residents of these vulnerability zones are disproportionately African-American or Latinx, have higher rates of poverty than the U.S. as a whole, and have lower housing values, incomes, and education levels than the national average.72
Living in a vulnerability zone exposes communities to dangerous health impacts from failing infrastructure after natural disasters. When hurricanes and storms hit, hazard-
PHOTO: ISTOCK
WATER, HEALTH, AND EQUITY 11

ous sites can overflow, spill, or leak. When wastewater treatment sites and other toxic waste management facili-ties lose power, they can release thousands of gallons of contaminants into floodwaters or nearby waterways, often affecting communities of color.73
A rise in the frequency and severity of weather events like hurricanes can have considerable impact on public health.74 Due to underinvestment, many communities lack the infrastructure necessary to protect against raging storms and flooding, particularly natural infrastructure.75 Additionally, climate change models project that powerful hurricanes like Katrina and Harvey will likely occur more frequently in the future, and their impacts will be more severe.76 Communities of color, particularly black and Latinx communities, are often located in the areas most vulnerable to flooding.77 The flooding, devastation, trau-matic loss, and displacement that accompany disasters are detrimental to the physical, mental, and emotional well-being of survivors.78 Marginalization of minority ethnic groups and indigenous peoples can become exacerbated in the aftermath of disaster, leading to difficulties in accessing resources and assistance.79 As a result, the failure of our nation’s infrastructure to protect communities from flooding and extreme weather can disproportionately harm the mental health and physical safety of communities of color.
Women of color face particularly heightened risks. Glob-ally, natural disasters lower the life expectancy of women more than that of men; in other words, natural disasters on average kill more women than men, or kill women at an earlier age than men.80 This gender disparity is even stronger for women of lower socioeconomic status.81
The experience of communities of color—especially women in those communities—during and after Hurricane Katrina illustrates these disparities. African-American women were among the worst affected by the storm and the flooding that followed. Even before the storm, black women and children were more socially and economically vulnerable to displacement, with 37% of black women and girls in New Orleans living in poverty, compared to just 9.5% of white women and girls.82 At the time Hurri-cane Katrina hit, women made up just over half of the population in New Orleans, yet they made up 80% of the people unable to evacuate the city before the storm.83 The experience of trauma, instability and extreme loss that they carry with them in the days, months and years that follow create stress and poor mental health.
For example, after Katrina, studies showed that low-in-come black women—particularly young, single women and mothers between the ages of 18 and 34—had among
the highest rates of poor mental health and post-trau-matic stress syndrome of any demographic group.84 These mothers relied heavily on the social networks and resources in their communities to provide for themselves and their children. The displacement that occurred after Katrina eroded these critical support networks and drastically impacted their ability to recover mentally, emotionally, and physically. Research shows that black mothers who were displaced experienced long-term chronic stress, depression, anxiety, and post-traumatic stress disorder.85
Pregnant women and infants had unique health concerns in the aftermath of Hurricane Katrina. Although exact numbers are lacking, researchers estimate that approxi-mately 56,000 pregnant women and 75,000 infants were directly affected by the hurricane.86 Disruptions in the supply of clean water for drinking and bathing, inade-quate access to safe food, exposure to environmental contaminants, interruption of health care, crowded condi-tions in shelters, gender-based violence and a limited ability to move around made pregnant women and nurs-ing mothers more vulnerable to injury, disease, and poor mental health in the aftermath of the storm.87
As this post-Katrina research demonstrates, when drinking water, flood prevention, and other types of infrastructure fail during natural disasters, the impact is dispropor-tionately borne by low-income women, and particularly women of color.
HEALTH IMPACTS OF ALGAL BLOOMS
For communities in both rural areas and cities, algal blooms from agricultural runoff are an increasingly serious threat to public health. Indeed, harmful algal blooms are a major environmental problem in all 50 states.88
Heavy rain washes large amounts of nitrate-based fertiliz-ers used in industrial farming and suburban landscaping into local lakes, rivers, streams, and reservoirs. Too many nitrates and other agricultural nutrients in the water cause the algae naturally found in these water bodies to grow out of control, forming “algal blooms.” These blooms look like thick red, blue, or green layers of film, scum, or even mats on the water’s surface, and they release toxins that can sicken or even kill people.89
Lakes and reservoirs that serve as sources of drinking water for between 30 million and 48 million Americans in the Midwest, West, and Southern states may be periodi-cally contaminated by algal toxins.90 Water contaminated by algal toxins can cause skin rashes, stomach or liver illness if consumed, and respiratory problems if inhaled.91
12 CLEAN WATER FOR ALL

ALGAL TOXINS CAN CAUSE SKIN RASHES, STOMACH OR LIVER ILLNESS IF CONSUMED, AND RESPIRATORY PROBLEMS IF INHALED
PHOTO: ISTOCK WATER, HEALTH, AND EQUITY 13

Cyanobacterial neurotoxins have also been identified as a potential factor causing neurodegenerative diseases.92
Certain drinking water treatment processes can remove algal toxins, but treatment processes are not always successful due to poorly maintained and outdated facili-ties. Efficacy of treatment processes has varied from 60% to 99.9%.93 Ineffective treatment can compromise the
quality of drinking water for entire communities and cause severe treatment disruption or even complete shutdowns of treatment plants.94 As a result, people can be left without a source of safe drinking water; boiling the water after it comes out of the tap cannot destroy or eliminate the toxins released by algae, and in fact can increase the amount of toxin in the water by concentrating it.95
For example, such an event occurred in Toledo, Ohio, in August 2014, when nearly 500,000 residents lost access to their drink-ing water for three days after tests revealed the presence of toxins from a cyanobacterial bloom in Lake Erie near the water plant’s
intake. The outbreak sickened over 100 people.96 Many of the communities most susceptible to the adverse impacts of Tole-do’s contaminated water are the commu-nities in the urban core where a majority of residents are low-income and non-white.97
TOXIC WATER IN TOLEDO
PHOTO: ISTOCK
14 CLEAN WATER FOR ALL

ONE: INCREASE OUR INVESTMENT
Congress must significantly increase federal funding for our nation’s water infrastructure by growing existing fund-ing sources and developing new and innovative sources. As discussed above, the EPA has identified hundreds of billions of dollars in need just to keep our water systems functioning—and that total does not include the costs of adapting to climate change.
We must do more. In the words of the EPA:
“Historically, investment has not been enough to meet the ongoing need to maintain and renew these systems. Over the coming decades, this pattern of underinvestment needs to change and practices put in place to sustain the water services provided by water infrastructure and utilities. Doing so is vital to public, economic, and environmental health.”98
We can tackle this problem by increasing existing sources of funding and financing, like tripling appropriations for the Clean Water and Drinking Water State Revolving Funds, as well as seeking out new and innovative sources of water infrastructure funding.99 This approach enjoys broad public
THE CLEAN WATER FOR ALL COALITION — a broad coalition of environmental, equity-focused, conservation, sportsmen, and community groups—is working to advance policy solutions that will help us tackle America’s water infrastructure crisis and improve the health of our communities, especially low-income communities and communities of color. Specifically, the Coalition believes that four key principles should be promoted and adopted at the federal level.
Policy Solutions for Healthy, Sustainable Water Infrastructure
support: 88 percent of Americans support increasing federal investment to rebuild our water infrastructure.100
This increased funding should not come at the expense of reductions in federal funding for other environmental investments or regulatory programs. After all, water infrastructure investments are good for public health and the economy. According to the CDC, even modest investments in infrastructure upgrades and other efforts that prevent waterborne diseases could lead to reduced incidence of disease and significant healthcare cost savings.101 Additionally, the Economic Policy Institute found that spending $188.4 billion on water infrastruc-ture over a five-year period would yield $265 billion in economic activity and create 1.9 million jobs.102
The jobs created by increased federal funding should result in high-road employment through the enforcement of the Davis-Bacon Act prevailing wage, project labor agreements, green job opportunities, local job training programs, and Buy American domestic sourcing require-ments. Further, water infrastructure investments should target inclusion of disadvantaged workers and firms for training, jobs, and contracts in design, construction,
WATER, HEALTH, AND EQUITY 15

operations, and maintenance of water infrastructure.
As we increase the overall amount of funding for water systems, we must also ensure that this new funding is directed, under principles of equity, to the communities that need it most. That includes areas that have critical infrastructure needs but lack the abil-ity to meet those needs by raising or repaying funds from local sources. It also includes setting aside funding for disadvantaged communities that face the most serious water quality problems due to historic underinvestment in their infrastructure, including tribal communities. These communities should not be required to compete with higher-capacity, wealthier areas for the resources they critically need.
TWO: SUPPORT NATURAL INFRASTRUCTURE
Not all water infrastructure investments are equally beneficial to our communities. Nature-based solutions offer a wide range of social, economic, and environmental advantages that conventional methods do not provide.
Natural infrastructure, also known as green infrastructure, uses techniques that protect, restore, and replicate natu-ral systems. These nature-based solutions can include choosing to plant trees and restore wetlands rather than building a costly new water treatment plant. They could mean prioritizing water efficiency and conservation over building dams, using green roofs and rain gardens to capture stormwater instead of relying on single-purpose underground tanks, and restoring floodplains instead of building levees. As proven in communities around the country, these approaches can save money, grow the economy, and improve lives.103 Natural infrastructure can also provide effective flood protection, support ecosystem health, lower energy use, and provide new educational opportunities to communities.104 Notably, natural green space in cities provides critically important health benefits to the surrounding population.105
Nature-based solutions can be implemented on their own or integrated with traditional infrastructure. But where we have the opportunity, our infrastructure
investments should prioritize these approaches before resorting to conventional methods. That means, at the federal level, infrastructure funding opportunities should explicitly require, incentivize, and support the use of natural infrastructure.
Moreover, implementation of natural infrastructure should focus on low-income communities and communities of color, which have traditionally not enjoyed equal access to green space and its benefits compared to areas with wealthier populations.106
THREE: ENSURE AFFORDABILITY FOR ALL
Communities of color and low-income communities are disproportionately impacted by contaminated water that results from outdated, inadequate, or failing infrastructure. We cannot support a two-tiered system in America where the wealthy have access to water that is clean and safe for their families, while disadvantaged communities are forced to accept second-class water and wastewater systems that pose risks to their health and environment. Because every human being needs safe, clean water and sanitation, we must find ways to ensure that low-income households can afford water services.
As discussed above, federal water infrastructure funding can address this problem by directing assistance to the communities that need it most—like those facing large gaps between their infrastructure needs and their ability to pay. At the same time, we should promote affordability at the local level by encouraging states and water utilities to adopt low-income customer assistance programs, equi-table rate structures, and strategies that reduce system-wide costs borne by all customers. We should also make
THE ECONOMIC POLICY INSTITUTE FOUND THAT SPENDING $188.4 BILLION ON WATER INFRASTRUCTURE OVER A FIVE-YEAR PERIOD WOULD YIELD $265 BILLION IN ECONOMIC ACTIVITY AND CREATE
1.9 MILLION JOBS
16 CLEAN WATER FOR ALL

it easier for water systems to hold polluters account-able for paying to clean up contamination that they cause.
Congress can promote the use of local customer assistance programs to mitigate water and sewer costs for low-income households by providing grants to utilities supporting the establishment of those programs. It can also create a more comprehensive federal program for water utility bill assistance analogous to the Low Income Home Energy Assistance Program.107 Meanwhile, the EPA has provided recommendations for equitable rate structures, including “lifeline rates,” where low-income households are charged lower rates on non-discretionary water consumption (the minimum sani-tary requirement) and higher rates on water consumed beyond that amount.108
Some communities are already working to implement affordability programs. For example, Philadelphia has established an income-based water affordability program, which offers low-income customers a consistent monthly bill based on their income.109 This approach is expected to help prevent water shutoffs in the city. But piecemeal efforts at the local level are not enough. Federal interven-tion is needed to ensure that all water and wastewater systems provide safe and affordable service to everyone in their communities.
FOUR: MAINTAIN ENVIRONMENTAL SAFEGUARDS
Finally, our nation’s bedrock environmental protections must be maintained and enforced, and never sacrificed in the name of infrastructure “streamlining.” Infrastructure projects can have enormous consequences for our water. Roads and other developments create polluted runoff and destroy precious wetlands. Dams divert water from fragile
ecosystems. Pipelines create the risk of dangerous oil and
gas spills into rivers and streams. For these reasons, our laws provide
for careful review of proposed projects. We must ensure that projects are carefully sited
and designed to avoid damage to our waterways—or not built at all if the risks of harm are too great.
While the poor state of our infrastructure demands near-term action, we should never rush into projects without evaluating their long-term impacts. Laws such as the Clean Water Act, Safe Drinking Water Act, National Envi-ronmental Policy Act, and Endangered Species Act enable us to look before we leap. They demand that we pause, reflect, and ensure that our infrastructure projects will provide the best and most environmentally sustainable solutions to our needs. We must not weaken or forego these protections in our haste to move projects forward. Doing so could place low-income communities and communities of color at an even greater risk of suffering harm to their environment and public health.
Advocates of so-called regulatory “streamlining” claim that environmental reviews are the cause of unnecessary project delays. But study after study has proven that requirements to evaluate the environmental and commu-nity impacts of infrastructure projects are not a major cause of delays.110
We do not have to choose between new infrastructure improvements and a safe environment. According to a national poll, 94 percent of Americans, including 92 percent of Trump voters, agree that the country can build infrastructure while keeping environmental protections in place.111
PHOTO: ISTOCK
WATER, HEALTH, AND EQUITY 17

IN FEBRUARY 2018, THE TRUMP ADMINISTRATION RELEASED ITS COMPREHENSIVE INFRASTRUCTURE PLAN.112 The proposal does not satisfy a single one of the four principles for healthy, sustainable infrastructure described above. Instead, the plan promises a meager pot of money attached to rollbacks of the nation’s environmental safeguards.
The Trump Infrastructure Plan Is Not the Answer
PHOTO
: ISTO
CK
18 CLEAN WATER FOR ALL

Under this plan, local governments and private interests would be forced to foot the bill for infrastructure improve-ments. Where they are unable or unwilling to step up, communities would not get the infrastructure improve-ments they need, leaving local waterways polluted and critical water systems outdated and crumbling. At the same time, Americans would have a harder time keeping our lakes, bays, and creeks safe from pipelines and other massive development projects.
Not only does the plan fail to prioritize nature-based solutions, but it offers no prioritization system at all to target the most beneficial projects or the areas with the greatest need. And it does nothing to ensure that our investments are affordable for the most vulnerable communities and individuals.
THE PLAN UNDERINVESTS IN WATER
President Trump’s plan proposes to invest $200 billion in federal funds, which is intended to “stimulate” $1.5 trillion in total infrastructure spending. This proposed federal invest-ment is simply too small. $200 billion is not enough to cover our nation’s water infrastructure needs alone—yet the admin-istration proposes to divide it among all types of infrastruc-ture, including transportation. In the words of Phil Murphy, the governor of New Jersey, “This is probably a fraction of what our state needs or, frankly, the country needs.”113
The plan contains no money for the Clean Water and Drinking Water State Revolving Funds, tested and reliable programs that have been used for decades to fund water infrastructure projects. Instead, the only pot of funding allocated specifically to water infrastructure is an unspecified portion of a $14 billion infusion into existing infrastructure financing programs. The water financing program under the Water Infrastructure Finance and Innovation Act (WIFIA) would receive some fraction of that total. But even that investment in water infrastructure
would be smaller than it appears, as the plan would allow Superfund and brownfields clean-up projects to become eligible for funding under WIFIA. Those are important projects, but allowing them to receive WIFIA funds would reduce the amount remaining for water infrastructure.
What’s worse, the plan includes no new money for infra-structure. According to the White House, the plan’s $200 billion in new investment would be paid for through cuts in other existing infrastructure programs.114
THE PLAN WON’T HELP LOW-INCOME COMMUNITIES
Perhaps the most problematic aspect of the plan is that it would force other entities—state and local governments and private businesses—to bear the vast majority of the cost.
Under the Trump proposal, the largest allocation of newly available federal funds could be used to pay for only 20 percent of the cost of any given infrastructure project. That new money would not fund any construction or repairs of water or wastewater facilities unless states, local governments, or private companies contributed the remaining 80 percent.
As discussed above, cities, counties, and states have already stretched their infrastructure spending to the limit because of a lack of adequate federal funds. In 2014, state and local governments spent 24 times as much as the federal government on water and wastewater infra-structure.115 Not only is it unreasonable to ask them to contribute even more, many of them simply do not have more to give, especially low-income and economically distressed communities.
Moreover, this approach is unjust and inequitable. Shifting an increased financial burden to local government and the private sector raises significant environmental justice concerns. Private investors often decline to provide water
WATER, HEALTH, AND EQUITY 19

The plan would gut project reviews under the National Environmental Policy Act (NEPA).118 It also proposes to roll back Clean Water Act requirements designed to protect water quality and safety. These anti-clean water proposals fall into four main categories.
First, the plan would make it less clear which waterways should be protected from harm. It would take away the EPA’s authority to decide which waters are protected from the dredging and dumping of material, and give that authority to the Army Corps of Engineers. This proposal would create inconsistency and confusion, as the EPA would still determine which waters are covered under other regulatory programs. Moreover, the EPA has more expertise and experience making these important decisions, while the Army Corps is more likely to exclude waterways from protection.
services to low-income communities because doing so is not profitable.116 This aspect of the plan, therefore, all but guarantees that little or no federal money will be directed toward low-income communities where non-federal investment is unavailable. For example, cities already struggling to pay for water infrastructure, like Flint, Mich-igan, would have difficulty accessing any of the money made available under this plan.
THE PLAN FAILS TO PRIORITIZE THE MOST BENEFICIAL PROJECTS
Half the plan’s investment— $100 billion—would be spent through the so-called “infrastructure incentives program.” This program would fund a wide range of infrastructure projects, chosen based on a few specific criteria. Critically, the most important factor by which projects would be evaluated is “how the applicant will secure and commit new, non-Federal revenue.” This factor is weighted at 70%, compared to just 5% for the actual utility of the project (“economic and social returns on investment”).
In other words, projects would be chosen for funding not based on the good they would do for communities, but rather how much money project applicants bring to the table. That is not a strategic way to choose water infra-structure projects, and it disadvantages projects carried out in low-income communities.
Instead, funding criteria should focus on a project’s water quality or public health benefits. That would mean direct-ing money to areas with the worst water quality problems, or to projects that could make the biggest difference to their communities. We should also be prioritizing resilient nature-based solutions that reduce water treatment costs and provide greater community benefits.
The plan inefficiently allocates funding in one additional way: it would not require infrastructure investments to account for the impacts of climate change. As a result, proj-ects could be built in the wrong place and designed for the wrong climate—wasting billions of taxpayer dollars.117
THE PLAN GUTS CRITICAL WATER SAFEGUARDS
Not only does the plan fail to provide a meaningful invest-ment in water infrastructure, it also proposes to weaken our nation’s environmental laws in order to fast-track projects. These ill-advised changes would make it harder to prevent irreversible damage to local waterways and our communities’ sources of drinking water.
In 2008, the Army Corps received a request to determine how much of the Los Angeles River should be protected by the Clean Water Act. The Corps decided that only 3.75 miles of the river—out of its 51-mile length—should be covered by the law’s safeguards. The EPA had to step in and overrule that decision, finding that the entire river should be protected by the Act. If the Army Corps decision had been allowed to stand, 93% of the LA River—which flows through many low-income neighborhoods and communities of color—would have been more vulnerable to unregulated pollution.122
Second, the administration’s infrastructure plan would dramatically reduce the scrutiny we give to proposed projects, making it harder to know whether our sources of drinking water could be put at risk. The plan would elimi-nate independent review of federal infrastructure projects’ impacts on wetlands. It would shorten the environmental review process for projects that affect existing Army Corps infrastructure like dams, levees, seawalls, and piers. It would allow non-federal infrastructure projects carried out in waterways to be approved based on a review of preliminary, incomplete project designs. And it would
20 CLEAN WATER FOR ALL
limit states’ authority under the Clean Water Act to review any proposed project that requires a federal permit for compliance with the state’s water quality requirements.
Third, it would make it harder to stop projects that are known to be harmful. Under current law, the Clean Water Act allows EPA to veto an Army Corps decision to grant a dredge-and-fill permit for extremely destructive infra-structure projects. EPA exercises this veto sparingly.120 Even still, President Trump’s plan would eliminate this critical environmental backstop by taking away EPA’s authority to veto a permit. Projects with exceptionally harmful impacts could be approved more easily, includ-ing projects that have previously been subject to the veto such as trash dumps, dams, and large developments in sensitive areas. These types of projects, particularly energy infrastructure projects, have been documented to have a disproportionate impact on low-income communi-ties and communities of color.121
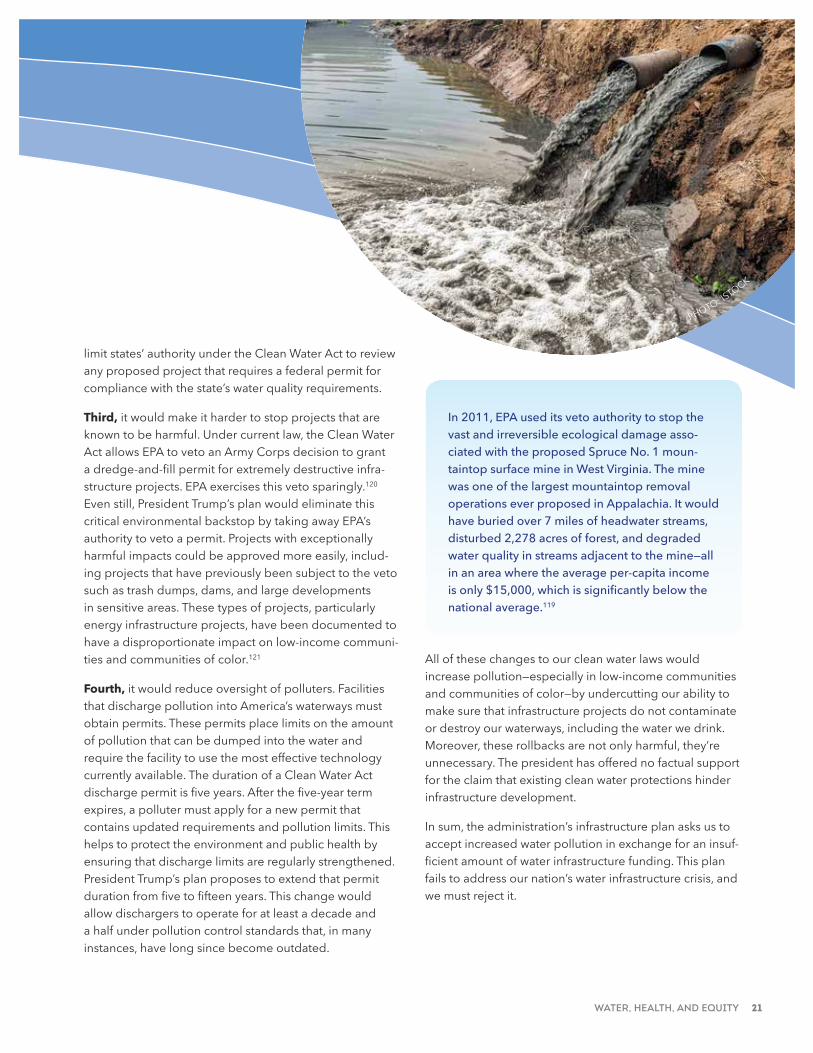
Fourth, it would reduce oversight of polluters. Facilities that discharge pollution into America’s waterways must obtain permits. These permits place limits on the amount of pollution that can be dumped into the water and require the facility to use the most effective technology currently available. The duration of a Clean Water Act discharge permit is five years. After the five-year term expires, a polluter must apply for a new permit that contains updated requirements and pollution limits. This helps to protect the environment and public health by ensuring that discharge limits are regularly strengthened. President Trump’s plan proposes to extend that permit duration from five to fifteen years. This change would allow dischargers to operate for at least a decade and a half under pollution control standards that, in many instances, have long since become outdated.
All of these changes to our clean water laws would increase pollution—especially in low-income communities and communities of color—by undercutting our ability to make sure that infrastructure projects do not contaminate or destroy our waterways, including the water we drink. Moreover, these rollbacks are not only harmful, they’re unnecessary. The president has offered no factual support for the claim that existing clean water protections hinder infrastructure development.
In sum, the administration’s infrastructure plan asks us to accept increased water pollution in exchange for an insuf-ficient amount of water infrastructure funding. This plan fails to address our nation’s water infrastructure crisis, and we must reject it.
In 2011, EPA used its veto authority to stop the vast and irreversible ecological damage asso-ciated with the proposed Spruce No. 1 moun-taintop surface mine in West Virginia. The mine was one of the largest mountaintop removal operations ever proposed in Appalachia. It would have buried over 7 miles of headwater streams, disturbed 2,278 acres of forest, and degraded water quality in streams adjacent to the mine—all in an area where the average per-capita income is only $15,000, which is significantly below the national average.119
PHOTO: ISTOCK
WATER, HEALTH, AND EQUITY 21

PHOTO: ISTOCK
22 CLEAN WATER FOR ALL

All Americans deserve clean, safe water.
To achieve it, we must all work proactively and speak out for the policy solutions needed to fix our infra-structure problems.
Now is our moment to act. The communities hit hardest by water infrastructure failures are building collective power by raising their voices and working together, advocating for better access to clean water and mean-ingful investments in water infrastructure. We must build on this authentic movement by supporting these communities and building even more new advocates to demand change.
Since President Trump unveiled his infrastructure plan in February, it has failed to gain traction, and its future prospects in Congress remain unclear.123 It is clear that momentum and public support are on the side of our movement. This is our opportunity to call on the administration to propose a new plan, in line with the key priorities outlined above, for healthy, sustainable, and equitable water infrastructure that benefits all Americans, especially those in low-income communi-ties and communities of color who have been denied equal access to clean water for far too long.
Other infrastructure plans proposed in 2018 have presented smarter strategies for addressing our nation’s water infrastructure woes, such as the Senate Democrats’ Jobs & Infrastructure Plan for America’s Workers124 and the House Sustainable Energy and
Environment Coalition (SEEC)’s Sustainable Infra-structure Proposal.125 These competing plans present viable alternatives to the administration’s insufficient plan, as they both recognize and support the need for increased federal water infrastructure funding, affordability considerations for low-income families and communities, support for natural infrastructure, and preservation of bedrock environmental and public health protections. They are worthy of support.
Even without any forward movement on a compre-hensive infrastructure plan in the legislature, in the near term, we must ensure that the EPA continues to enforce the Safe Drinking Water Act and Clean Water Act to protect public health.
It is time to advance solutions that protect human health and ensure low-income communities and communities of color will not be exposed to toxic contaminants where they live, work, and play. Issues of clean water access should be prioritized as a national public health issue, not as unique problems isolated in cities with significant populations of color such as Flint, Michigan or Chicago, Illinois.
Together, we can ensure a future when all Ameri-cans—no matter the color of their skin or the amount of money in their wallet—can enjoy clean, safe, and affordable water.
WATER, HEALTH, AND EQUITY 23

Clean Water for All (CWFA) is a coalition that’s fighting for the water resource protections we want and need to provide clean and safe water for all communities. Created in 2017, the Clean Water for All Coalition seeks to build a broad, diverse, national movement to drive change around the shared causes of: Defending and expanding clean water protections; Expanding investment in sustainable, equitable water infrastructure; and Reducing nutrient pollution for positive public health outcomes and stronger ecosystems. This Coalition is broad and inclusive. It includes not just environmentalists and outdoor enthusiasts, but also people working on social justice, public and community health, sustainable businesses, labor, and faith-based issues. In the face of immediate and coming threats to the nation’s waters this coalition is engaging and mobilizing Americans to get involved in the fight to protect clean water.
Acknowledgments
SPECIAL ACKNOWLEDGEMENTS:
ROSEMARY ENOBAKHARE
Rosemary Enobakhare currently serves as the Clean Water for All Coalition Director. In this role, she is responsible for working with a broad range of partners to create and execute a Coalition that advocates and defends clean water protections at the Federal level. She was previously appointed by the Obama Administra-tion to serve as the Deputy Associate Administrator for Public Engagement and Environmental Education in the Office of the Administrator at the United States Environmental Protection Agency (EPA). In this role, she led the agency’s community outreach program and developed strategic engagement plans to positively impact the EPA’s public policy to ensure nontraditional communities were both apart of the conversations and the solu-tion. Ms. Enobakhare also served as the Deputy Director of Public Engagement and Faith-based Initiatives, in this capacity she was over the coordination of outreach to the African American, faith, women and business communities on behalf of the EPA Admin-istrator. Prior to joining the Administration, Rosemary served as the Director of African American Outreach for the Democratic National Committee, leading the party’s efforts around engaging the African American Community in the 2012 election. Rosemary is a native of Jackson, Mississippi and received her Bachelor’s Degree in Economics from Spelman College.
KAYLA SMITH, M.A.
Kayla Smith is the Coalitions Operations Manager for the Clean Water for All Coalition and is DC-based. Prior to joining the Clean Water for All team she worked on the Clean Cars Campaign organizing groups from the labor, faith, health, environmental, and consumer spaces to fight the Trump administration’s fuel economy and greenhouse gas emissions standards rollback. Before her cars work, she worked on a campaign to coalesce state and national environmental groups to protect clean air and elevate non-traditional voices in the environmental space. She has a Bachelor’s degree in International Relations from Suffolk Univer-sity and a Master’s degree in Diplomacy and International Rela-tions from Seton Hall University. Although she resides in Virginia, Kayla is a proud New Englander and is originally from Maine.
24 CLEAN WATER FOR ALL

Since 1983, Black Women’s Health Imperative (BWHI) has been the only national organization dedicated solely to improving the health and well-ness of our nation’s 21 million Black women and girls – physically, emotion-ally and financially. Their vision is for Black women to enjoy optimal health and well-being in a socially just society. BWHI’s mission is to lead the effort to solve the most pressing health issues that affect Black women and girls in the U.S. Through investments in evidence-based strategies, we deliver bold new programs and advocate health-promoting policies.
SPECIAL ACKNOWLEDGEMENTS:
VEDETTE GAVIN, MPH, M.P.A.
Vedette Gavin serves as a board member for the Black Women’s Health Imperative. She is also the Director of Research and Partnerships for Conservation Law Foundation Ventures. In this capacity, she is responsible for building cross-sector partnerships with public agencies, non-profit organizations, academic leaders, community groups, and neighborhood residents to understand complex challenges at the intersection of urban development, neighborhoods and health. Vedette was previously the Director of Community Engagement at the Case Western Reserve Center for Reducing Health Disparities at MetroHealth in Cleveland, Ohio, where she launched Healthy Eating Active Living, a community-led partnership that engaged residents in transform-ing neighborhood conditions to foster better health. Vedette is an Ohio native and holds a BS from the University of Maryland, College Park, an MPH from The Ohio State University, and a MPA from the Harvard Kennedy School of Government where she was an inaugural Sheila C. Johnson Leadership Fellow.
TAMMY BOYD, MPH, J.D.
Tammy Boyd serves as the Director of Health Policy and Legis-lative Affairs. Tammy is an established healthcare executive with proven expertise in government relations, political compliance, and advocacy. She has extensive experience in creating and executing federal legislative policy strategy and facilitating outreach to members of the United States House of Representa-tives and the United States Senate. Previously Ms. Boyd served as Managing Partner, for TKB Global Strategies, LLC /Watts Partners, where she successfully executed government affairs strategies through engagement of the U.S. House of Representatives, U.S. Senate, and federal agencies such as the Food and Drug Administration (FDA), Department of Health and Human Services (HHS), Centers for Medicaid and Medicare Services (CMS), and
Department of Veteran Affairs. Along with her past roles with DaVita, Inc., and Johnson and Johnson, Boyd also served as Legislative Director for Congressman John Lewis (D-GA) where she exercised oversight over legislative activities within the office, including tax, trade, health care (Medicare, Medicaid, and Grad-uate Medical Education), financial services, judiciary and energy. Tammy is a member of the American, National, and Mississippi Bar Associations and the Delta Sigma Theta Sorority, Inc. She received an M.P.H. degree from Emory University School of Public Health and a Juris Doctorate degree from American University, Washington College of Law.
LINDA GOLER BLOUNT, M.P.H.
Linda Goler Blount, joined the Black Women’s Health Imperative (BWHI) as the president and chief executive officer in February 2014. Linda oversees BWHI’s strategic direction and is responsi-ble for directing the organization toward achieving its mission of leading efforts to solve the most pressing health issues that affect Black women and girls in the United States. Before joining BWHI, Linda served as the vice president of programmatic impact for the United Way of Greater Atlanta. Prior to that position, Linda was the first-ever national vice president of health disparities at the American Cancer Society. A Michigan native, Linda holds a Master of Public Health degree in Epidemiology from the Univer-sity of Michigan and a Bachelor of Science in Computer Engi-neering/Operations Research from Eastern Michigan University.
WATER, HEALTH, AND EQUITY 25

PolicyLink is a national research and action institute advancing racial and economic equity by Lifting Up What Works®. PolicyLink seeks to deliver and scale results in the following arenas: Equitable Economy: Promote economic inclusion and ownership to eliminate poverty, shrink inequality, and increase mobility. Healthy Communities of Opportunity: Create and maintain opportunity-rich communities in all neighborhoods and all regions of the country through strong networks and social capital, equitable development, and infrastructure investments that enable low-income people and communities of color to thrive. Just Society: Build power and expand agency to ensure that all systems and institutions are just, free of racial bias, and lead to a vibrant democracy where all, especially the most vulnerable, can participate and prosper.
SPECIAL ACKNOWLEDGEMENTS:
LISA CYLAR BARRETT, J.D.
Lisa Cylar Barrett, is the Managing Director of Federal Policy for Policy Link. Lisa works tirelessly to effectively execute multi-pronged strategies to secure justice for and improve the lives of everyday Americans, especially those in low-income communities and communities of color. As the director of federal policy at PolicyLink, Lisa collaborates with other senior staff to develop and execute federal policy and advocacy strategies to advance economic and social equity. Lisa also serves as the co-director of the Promise Neighborhoods Institute at PolicyLink (PNI), where she leads and manages PNI’s policy efforts to sustain and advance the Promise Neighborhoods cradle-to-career strategy, manages PNI’s relationships with other stakeholder organizations, as well as its day-to-day operations. A lawyer by training, Lisa practiced law prior to beginning her career in the philanthropic and nonprofit sectors. She holds a BA in English from Spelman College and a JD from Case Western Reserve University School of Law.
KALIMA ROSE, VICE PRESIDENT FOR STRATEGIC INITIATIVES
Kalima Rose, serves as Vice President for Strategic Initiatives. She brings a three-decade history of working to advance infrastruc-ture equity, housing, sustainable communities, and equitable development policy. In partnership with communities of color, low-income communities, tribal communities, and equity-fo-cused municipal, regional, state, and federal leaders, Kalima has helped win new investments, resources, and jobs for disinvested communities, underemployed workers, and firms and artists of color. Over the last decade, Kalima played leadership roles in implementing the federal Sustainable Communities initiative, the
Acknowledgments cont’d.
new Affirmatively Furthering Fair Housing rule, and key equitable development initiatives in New Orleans’ Katrina recovery. She developed the PolicyLink Equitable Development toolkit, led national efforts to advance inclusionary housing in cities across the country, and is a national strategist in anti-displacement policy work. Her most recent publications, Healthy Communities of Opportunity: A Blueprint for Addressing America’s Housing Challenges, A Roadmap Toward Equity: Housing Solutions for Oakland, California, and Creating Change through Arts, Culture, and Equitable Development: A Policy and Practice Primer, lay the groundwork for addressing some of the nation’s most challeng-ing problems through effective policy change.
ANITA COZART, MANAGING DIRECTOR
Anita Cozart, serves as a Managing Director with Policy Link. She leads place-based, equitable development initiatives. During her time at PolicyLink Anita has established the Transportation Equity Caucus, a national coalition that promotes policies that yield just and fair infrastructure investment; led a philanthropic partnership dedicated to expanding access to housing and opportunity; and served as a lead coordinator of Equity Summit 2015. Prior to joining PolicyLink, Anita spent six years with the Washington, DC Office of Planning where she served first as a neighborhood and citywide planner, and ultimately as the chief of staff, leading the agency’s media activities, legislative initiatives, and special proj-ects. She serves on the boards of Jobs to Move America, Shared Use Mobility Center, and Smart Growth America. Anita holds a master’s in city and regional planning from the University of Cali-fornia, Berkeley. She resides in Washington, D.C. with her spouse and three children, and is an active member of the historic Shiloh Baptist Church.
26 CLEAN WATER FOR ALL

The Natural Resources Defense Council (NRDC) a United States-based, non-profit international environmental advocacy group, with its headquarters in New York City and offices in Washington, D.C.; San Francisco; Los Angeles; New Delhi, India; Chicago; Bozeman, Montana; and Beijing, China. Founded in 1970, NRDC works to safeguard the earth—its people, its plants and animals, and the natural systems on which all life depends. They combine the power of more than three million members and online activists with the expertise of some 600 scientists, lawyers, and policy advocates across the globe to ensure the rights of all people to the air, the water, and the wild.
SPECIAL ACKNOWLEDGEMENT:
BECKY HAMMER, J.D.
Becky Hammer is the Deputy Director for Federal Water Policy and a senior attorney in the Nature Program with the Natural Resources Defense Council. Becky focuses on stormwater runoff, green infrastructure, low-impact development, water-pollution permitting issues, and climate change preparedness. Before joining NRDC in 2009, she interned at the U.S. Environmental Protection Agency. Hammer is a graduate of Harvard College and Harvard Law School. She is based in Washington, D.C.
CHIONE L. FLEGAL, MANAGING DIRECTOR
Chione L. Flegal, serves as a Managing Director with Policy Link. She leads an extraordinarily committed team working to promote social, economic, and environmental equity in California. With deep expertise on issues of infrastructure, land use, housing, and environmental policy, Chione has nearly 20 years of experience building coalitions and leading policy campaigns to improve outcomes for low-income communities and communities of color in California. Prior to joining PolicyLink, Chione managed Latino Issues Forum’s Sustainable Development program and directed the organization’s environmental health and justice work. She has worked as a consultant for organizations in the United States and abroad including, CARE International and the Food and Agricultural Organization of the United Nations. Chione currently serves on the climate justice working group for the California Natural Resources Agency and on the board of directors of Housing California. She holds a master’s degree in city planning and a BS in environmental science, policy, and manage-ment from the University of California, Berkeley.
WATER, HEALTH, AND EQUITY 27

Endnotes
1. Natural Resources Defense Council, “Threats on Tap: Widespread Violations Highlight Need for Investment in Water Infrastructure and Protections” (2017), https://www.nrdc.org/resources/threats-tap-widespread-violations-water-infrastructure.
2. American Rivers, Naturally Stronger: How Natural Water Infrastructure Can Save Money and Improve Lives (2017), https://www.americanrivers.org/conservation-resource/naturally-stronger/.
3. Pacific Institute, A Twenty-First Century U.S. Water Policy, Chapter 3: Water and Environmental Justice (2012), http://pacinst.org/wp-content/uploads/2013/02/water_and_environmental_justice_ch3.pdf.
4. U.S. Environmental Protection Agency, “Building Sustainable Water Infrastructure,” https://www.epa.gov/sustainable-water-infrastructure/building-sustainable-water-infrastructure.
5. Circle of Blue, “The Age of U.S. Drinking Water Pipes — From Civil War Era to Today” (Feb. 18, 2016), https://www.circleofblue.org/2016/world/infographic-the-age-of-u-s-drinking-water-pipes-from-civil-war-era-to-today/.
6. American Society of Civil Engineers, 2017 Infrastructure Report Card: Drinking Water (2017), https://www.infrastructurereportcard.org/wp-content/uploads/2017/01/Drinking-Water-Final.pdf.
7. U.S. EPA, “Use of Lead Free Pipes, Fittings, Fixtures, Solder and Flux for Drinking Water,” https://www.epa.gov/dwstandardsregulations/use-lead-free-pipes-fittings-fixtures-solder-and-flux-drinking-water.
8. American Water Works Association, “Lead service line analysis examines scope of challenge” (Mar. 10, 2016), https://www.awwa.org/resources-tools/public-affairs/press-room/press-release/articleid/4074/lead-ser.aspx.
9. Id.; American Society of Civil Engineers, 2017 Infrastructure Report Card: Wastewater (2017), https://www.infrastructurereportcard.org/wp-content/uploads/2017/01/Wastewater-Final.pdf.
10. ASCE, 2017 Infrastructure Report Card: Drinking Water, supra note 6.
11. See National Association of Clean Water Agencies & Association of Metropolitan Water Agencies, Confronting Climate Change: An Early Analysis of Water and Wastewater Adaptation Costs (2009), https://www.amwa.net/galleries/climate-change/ConfrontingClimateChangeOct09.pdf.
12. Pacific Institute, A Twenty-First Century U.S. Water Policy, Chapter 3: Water and Environmental Justice, supra note 3.
13. ASCE, 2017 Infrastructure Report Card: Wastewater, supra note 9.
14. U.S. Environmental Protection Agency, Climate Change, Health, and Environmental Justice (2016), https://www.cmu.edu/steinbrenner/EPA%20Factsheets/ej-health-climate-change.pdf.
15. Centers for Disease Control and Prevention, Press Release, “Waterborne Diseases Could Cost Over $500 Million Annually in U.S.” (July 14, 2010), https://www.cdc.gov/media/pressrel/2010/r100714.htm.
16. U.S. Environmental Protection Agency, Climate Change, Health, and Environmental Justice, supra note 14. For more information on the health impacts of climate change, see American Public Health Association, “Warmer Water and
Flooding Increase the Risk of Illness and Injury,” https://apha.org/-/media/files/pdf/factsheets/climate/warmer_water.ashx; American Public Health Association, “Extreme Rainfall and Drought,” https://apha.org/-/media/files/pdf/factsheets/climate/precipitation.ashx.
17. U.S. Environmental Protection Agency, Drinking Water Infrastructure Needs Survey and Assessment: Sixth Report to Congress (2018), https://www.epa.gov/sites/production/files/2018-03/documents/sixth_drinking_water_infrastructure_needs_survey_and_assessment.pdf; U.S. EPA, Clean Watersheds Needs Survey 2012: Report to Congress (2016), https://www.epa.gov/sites/production/files/2015-12/documents/cwns_2012_report_to_congress-508-opt.pdf.
18. NACWA & AMWA, Confronting Climate Change, supra note 11.
19. University of North Carolina Environmental Finance Center, “Federal Funding Trends for Water and Wastewater Utilities (1956-2014)” (May 14, 2015), http://efc.web.unc.edu/2015/05/14/federal-funding-trends-for-water-and-wastewater/.
20. Value of Water Campaign, The Economic Benefits of Investing in Water Infrastructure (2017), http://thevalueofwater.org/sites/default/files/Economic%20Impact%20of%20Investing%20in%20Water%20Infrastructure_VOW_FINAL_pages.pdf.
21. UNC Environmental Finance Center, “Federal Funding Trends for Water and Wastewater Utilities (1956-2014),” supra note 19.
22. University of North Carolina Environmental Finance Center, “Four Trends in Government Spending on Water and Wastewater Utilities Since 1956” (Sept. 9, 2015), http://efc.web.unc.edu/2015/09/09/four-trends-government-spending-water/.
23. Brookings, “Striking a Better Balance between Water Investment and Affordability” (Sept. 12, 2016), https://www.brookings.edu/blog/the-avenue/2016/09/12/striking-a-better-balance-between-water-investment-and-affordability/.
24. Circle of Blue, “Price of Water 2016: Up 5 Percent in 30 Major U.S. Cities; 48 Percent Increase Since 2010” (2016), https://www.circleofblue.org/2016/world/price-water-2016-5-percent-30-major-u-s-cities-48-percent-increase-since-2010-2/.
25. Pew Research Center, “For Most U.S. Workers, Real Wages Have Barely Budged in Decades” (Aug. 7, 2018), http://www.pewresearch.org/fact-tank/2018/08/07/for-most-us-workers-real-wages-have-barely-budged-for-decades/.
26. ASCE, 2017 Infrastructure Report Card: Drinking Water, supra note 6.
27. Rep. Brenda Lawrence (D-Mich.), The Hill, “Environmental Injustice: Access and Affordability of Clean Water” (May 17, 2018), http://thehill.com/blogs/congress-blog/politics/388154-environmental-injustice-access-and-affordability-of-clean-water.
28. Id.
29. See National Congress of American Indians, “Water,” http://www.ncai.org/policy-issues/land-natural-resources/water.
30. Indian Health Service, “Safe Water and Waste Disposal Facilities” (2016), https://www.ihs.gov/newsroom/factsheets/safewater/.
31. U.S. EPA, “Providing Safe Drinking Water in Areas with Abandoned Uranium Mines,” https://www.epa.gov/navajo-
28 CLEAN WATER FOR ALL

nation-uranium-cleanup/providing-safe-drinking-water-areas-abandoned-uranium-mines.
32. Id.
33. Id.; Carrie Arnold, “Once Upon a Mine: The Legacy of Uranium on the Navajo Nation,” Environmental Health Perspectives, Vol. 122, No. 2 (Feb. 2014), https://ehp.niehs.nih.gov/doi/10.1289/ehp.122-a44.
34. See National Congress of American Indians, Tribal Infrastructure: Investing in Indian Country for a Stronger America (2017), http://www.ncai.org/NCAI-InfrastructureReport-FINAL.pdf.
35. Philippe Grandjean & Philip Landrigan, “Neurobehavioral Effects of Developmental Toxicity,” The Lancet Neurology, Vol. 13, Issue 3, 330-338 (Mar. 2014), https://www.thelancet.com/journals/laneur/article/PIIS1474-4422(13)70278-3/fulltext.
36. World Health Organization, Childhood Lead Poisoning (2010), http://www.who.int/ceh/publications/leadguidance.pdf.
37. Id.
38. U.S. Environmental Protection Agency, “Basic Information about Lead in Drinking Water,” https://www.epa.gov/ground-water-and-drinking-water/basic-information-about-lead-drinking-water#health.
39. Id.; WHO, Childhood Lead Poisoning, supra note 36.
40. U.S. Environmental Protection Agency, “Basic Information about Lead in Drinking Water,” https://www.epa.gov/ground-water-and-drinking-water/basic-information-about-lead-drinking-water#health.
41. Maximum Contaminant Level Goals and National Primary Drinking Water Regulations for Lead and Copper, 56 Fed. Reg. 26,460, 26,468 (June 7, 1991) (codified at 40 C.F.R. Part 141 Subpart I) (“Lead and Copper Rule”).
42. Centers for Disease Control and Prevention, “Lead” (2018), https://www.cdc.gov/nceh/lead/.
43. Susan M. Bernard & Michael A. McGeehin, “Prevalence of Blood Lead Levels ≥5 μg/dL Among US Children 1 to 5 Years of Age and Socioeconomic and Demographic Factors Associated With Blood of Lead Levels 5 to 10 μg/dL, Third National Health and Nutrition Examination Survey, 1988–1994,” Pediatrics, Vol. 112, Issue 6 (Dec. 2003), http://pediatrics.aappublications.org/content/112/6/1308?download=true.
44. Lanphear, B.P., et al., “Low-Level Lead Exposure and Mortality in U.S. Adults: A Population-Based Cohort Study,” Lancet Public Health, Vol. 3, Issue 4, e177-e184 (Apr. 2018), https://www.thelancet.com/journals/lanpub/article/PIIS2468-2667(18)30025-2/fulltext.
45. Id.
46. See U.S. Department of Health and Human Services, Office of Minority Health, “Heart Disease and African Americans,” https://minorityhealth.hhs.gov/omh/browse.aspx?lvl=4&lvlid=19.
47. Guttmacher Institute, “Environmental Justice Campaigns Provide Fertile Ground For Joint Efforts with Reproductive Rights Advocates” (2016), https://www.guttmacher.org/gpr/2006/03/environmental-justice-campaigns-provide-fertile-ground-joint-efforts-reproductive.
48. Id.; A.M. Soto & C. Sonnenschein, “Environmental Causes of Cancer: Endocrine Disruptors as Carcinogens,” Nature Reviews Endocrinology, Vol. 6, Issue 7, 363-370 (July 2010), https://www.ncbi.nlm.nih.gov/pubmed/20498677.
49. U.S. Department of Health and Human Services, Agency for Toxic Substances and Disease Registry, Toxicological Profile for Perfluoroalkyls: Draft for Public Comment (June 2018), https://www.atsdr.cdc.gov/toxprofiles/tp200.pdf.
50. Blum, Arlene, et al., “The Madrid Statement on Poly- and Perfluoroalkyl Substances (PFASs),” Environmental Health Perspectives 123 (2015), A107–A111, http://dx.doi.org/10.1289/ehp.1509934.
51. Hu, XC, et al., “Detection of Poly- and Perfluoroalkyl Substances (PFASs) in U.S. Drinking Water Linked to Industrial Sites, Military Fire Training Areas and Wastewater Treatment Plants,” Environmental Science & Technology Letters, Vol. 3, no. 10 (2016), https://www.ncbi.nlm.nih.gov/pubmed/27752509.
52. See Letter from Arlene Blum, Green Science Policy Institute, to New Jersey Drinking Water Quality Institute (Nov. 21, 2016), https://www.state.nj.us/dep/watersupply/pdf/comment6.pdf.
53. Farmworker Justice & Migrant Clinicians Network, Reproductive Health Effects of Pesticide Exposure (2008), https://www.farmworkerjustice.org/sites/default/files/documents/Reproductive%20Health%20Effects%20of%20Pesticide%20Exposure.pdf.
54. Guttmacher Institute, “Environmental Justice Campaigns Provide Fertile Ground For Joint Efforts with Reproductive Rights Advocates,” supra note 47.
55. U.S. Census Bureau, “Quick Facts: Flint, Michigan,” https://www.census.gov/quickfacts/fact/table/flintcitymichigan/PST045217.
56. Daniel Grossman & David Slutsky, West Virginia University, “The Effect of an Increase in Lead in the Water System on Fertility and Birth Outcomes: The Case of Flint, Michigan” (2017), https://business.wvu.edu/files/d/6ea15ab7-2e8b-4a0a-93bf-a1f12c3af1d6/17-25.pdf
57. Guttmacher Institute, “Environmental Justice Campaigns Provide Fertile Ground For Joint Efforts with Reproductive Rights Advocates,” supra note 47.
58. See Pacific Institute, A Twenty-First Century U.S. Water Policy, Chapter 3, supra note 3; The New Republic, “Rural America’s Drinking-Water Crisis” (Feb. 2018), https://newrepublic.com/article/147011/rural-americas-drinking-water-crisis.
59. Safe Water Alliance et al., Racial Discrimination and Access to Safe, Affordable Water for Communities of Color in California (Aug. 2014), https://tbinternet.ohchr.org/Treaties/CERD/Shared%20Documents/USA/INT_CERD_NGO_USA_17884_E.pdf.
60. See U.S. Environmental Protection Agency, Nitrates and Nitrites (2007), https://archive.epa.gov/region5/teach/web/pdf/nitrates_summary.pdf; Environmental Working Group, Troubled Waters: Farm Pollution Threatens Drinking Water (Apr. 2012), http://static.ewg.org/reports/2012/troubled_waters/troubled_waters.pdf.
61. Mary H. Ward, “Too Much of a Good Thing? Nitrate from Nitrogen Fertilizers and Cancer,” Reviews on Environmental Health, Vol. 24, Issue 4, 357-363 (2009), https://www.ncbi.nlm.nih.gov/pmc/articles/PMC3068045/.
62. State-EPA Nutrient Innovations Task Group, An Urgent Call to Action: Report of the State-EPA Nutrient Innovations Task Group (Aug. 2009), https://www.epa.gov/sites/production/files/documents/nitgreport.pdf.
63. See California Department of Food & Agriculture, California Agricultural Statistics Review 2015-2016, https://www.cdfa.ca.gov/statistics/PDFs/2016Report.pdf.
64. See California State Water Resources Control Board, “Nitrate Project,” https://www.waterboards.ca.gov/water_issues/programs/nitrate_project/.
65. Scientific American, “Pollution, Poverty and People of Color: Don’t Drink the Water” (June 2012), https://www.scientificamerican.com/article/pollution-poverty-people-color-dont-drink-water/.
WATER, HEALTH, AND EQUITY 29

66. Id.
67. Balazs, C., et al., “Social Disparities in Nitrate-Contaminated Drinking Water in California’s San Joaquin Valley,” Environmental Health Perspectives, Vol. 119, Issue 9 (Sept. 2011), https://ehp.niehs.nih.gov/doi/10.1289/ehp.1002878.
68. Scientific American, “Pollution, Poverty and People of Color: Don’t Drink the Water,” supra note 65.
69. Id.; see also Environmental Working Group, “Tap Water Database: East Orosi Community Services District,” https://www.ewg.org/tapwater/system.php?pws=CA5401003#.W4qzaOhKiM8.
70. University of California, Davis, Center for Watershed Sciences, Addressing Nitrate in California’s Drinking Water (Jan. 2012), http://groundwaternitrate.ucdavis.edu/files/138956.pdf.
71. Id.
72. Environmental Justice and Health Alliance for Chemical Policy Reform, Who’s In Danger? Race, Poverty, and Chemical Disasters (2014), https://comingcleaninc.org/assets/media/images/Reports/Who%27s%20in%20Danger%20Report%20FINAL.pdf.
73. See EPA, Power Resilience: Guide for Water and Wastewater Utilities (Dec. 2015), https://www.epa.gov/sites/production/files/2016-03/documents/160212-powerresilienceguide508.pdf (“An extended power loss can have devastating impacts on drinking water and wastewater utilities and the communities they serve. … For wastewater utilities, losing pumps may lead to direct discharge of untreated sewage to rivers and streams or sewage backup into homes and businesses.”); Pacific Institute, A Twenty-First Century U.S. Water Policy, Chapter 3: Water and Environmental Justice, supra note 3 (describing the “complex ways th[at] low-income communities and communities of color come to live in areas with high rates of contamination [and] storm and wastewater overflows …”).
74. See Climate Nexus, “How Extreme Weather Impacts Public Health,” https://climatenexus.org/climate-issues/health/public-health-impacts-of-extreme-weather/.
75. See Bipartisan Policy Center, “Hurricane Harvey and the Critical Importance of Stormwater Infrastructure” (Sept. 5, 2017), https://bipartisanpolicy.org/blog/hurricane-harvey-and-the-critical-importance-of-stormwater-infrastructure/; Brenden Jongman, “Effective Adaptation to Rising Flood Risk,” Nature Communications, Vol. 9 (2018), https://www.nature.com/articles/s41467-018-04396-1.
76. U.S. Global Change Research Program, Climate Science Special Report: Fourth National Climate Assessment, Volume 1, Chapter 9: Extreme Storms (2017), https://science2017.globalchange.gov/chapter/9/.
77. See Marilyn Montgomery and Jayajit Chakraborty, “Assessing the Environmental Justice Consequences of Flood Risk: A Case Study in Miami, Florida,” Environmental Research Letters, Vol. 10 (2015), http://iopscience.iop.org/article/10.1088/1748-9326/10/9/095010/meta; Marilyn Montgomery and Jayajit Chakraborty, “Social Vulnerability to Coastal and Inland Flood Hazards: A Comparison of GIS-Based Spatial Interpolation Methods,” International Journal of Applied Geospatial Research, Vol. 4, Issue 3 (2013), https://www.igi-global.com/gateway/article/77925.
78. See Center for Climate Change & Health and Public Health Institute, Rainfall & Storms, Climate Change and Health (2016), http://climatehealthconnect.org/wp-content/uploads/2016/09/RainfallStorms.pdf.
79. United Nations Office for Disaster Risk Reduction, Consideration of Marginalized and Minority Groups in a National Disaster Risk Assessment (2017), https://www.unisdr.org/files/52828_kconsiderationofmarginalized%5B1%5D.pdf.
80. Eric Neumayer and Thomas Plumper, “The Gendered Nature of Natural Disasters: The Impact of Catastrophic Events on the Gender Gap in Life Expectancy, 1981-2002,” Annals of the Association of American Geographers, Vol. 9, No. 3, 551-566 (2007), http://www.lse.ac.uk/website-archive/GeographyAndEnvironment/neumayer/pdf/Article%20in%20Annals%20(natural%20disasters).pdf.
81. Id.
82. Institute for Women’s Policy Research, Fact Sheet—Women in New Orleans: Race, Poverty, and Hurricane Katrina (Aug. 2010), https://iwpr.org/wp-content/uploads/wpallimport/files/iwpr-export/publications/D490.pdf.
83. Laura Butterbaugh, “Why Did Hurricane Katrina Hit Women So Hard?”, Off Our Backs, Vol. 35, No. 9/10, 17-19 (Sept-Oct 2005), https://www.jstor.org/stable/20838463?seq=1#page_scan_tab_contents.
84. Rhodes, Jean, et al., “The Impact of Hurricane Katrina on the Mental and Physical Health of Low-Income Parents in New Orleans,” American Journal of Orthopsychiatry, Vol. 80, Issue 2 (2010), https://www.ncbi.nlm.nih.gov/pmc/articles/PMC3276074/.
85. Fussell, E. & Lowe, S.R., “The Impact of Housing Displacement on the Mental Health of Low-Income Parents After Hurricane Katrina,” Social Science & Medicine, Vol. 113, 137-144 (2014), https://www.ncbi.nlm.nih.gov/pubmed/24866205.
86. Callaghan, W.M., et al., “Health Concerns of Women and Infants in Times of Natural Disasters: Lessons Learned from Hurricane Katrina,” Maternal and Child Health Journal, Vol. 11, No. 4, 307-311 (2007), https://www.ncbi.nlm.nih.gov/pubmed/17253147.
87. Id.
88. EPA, “Harmful Algal Blooms,” https://www.epa.gov/nutrientpollution/harmful-algal-blooms.
89. See generally Centers for Disease Control and Prevention, “Harmful Algal Bloom (HAB)-Associated Illness,” https://www.cdc.gov/habs/index.html.
90. See Science Daily, “Climate Change Projected to Significantly Increase Harmful Algal Blooms in U.S. Freshwaters” (Aug. 15, 2017), https://www.sciencedaily.com/releases/2017/08/170815120444.htm.
91. U.S. EPA, “Nutrient Pollution—The Effects: Human Health,” https://www.epa.gov/nutrientpollution/effects-human-health.
92. See Wendee Holtcamp, “The Emerging Science of BMAA: Do Cyanobacteria Contribute to Neurodegenerative Disease?”, Environmental Health Perspectives, Vol. 120, No. 3 (2012), https://www.ncbi.nlm.nih.gov/pmc/articles/PMC3295368/.
93. U.S. Global Change Research Program, The Impacts of Climate Change on Human Health in the United States: A Scientific Assessment, Chapter 6: Water-Related Illness (2016), https://health2016.globalchange.gov/water-related-illness.
94. Id.
95. Centers for Disease Control and Prevention, “Harmful Algal Bloom-Associated Illnesses: Prevention & Control,” https://www.cdc.gov/habs/prevention-control.html.
96. See NPR, “Algae Toxins in Drinking Water Sickened People in 2 Outbreaks” (Nov. 9, 2017), https://www.npr.org/sections/health-shots/2017/11/09/563073022/algae-contaminates-drinking-water.
97. Toledo Blade, “Algae Termed Environmental Justice Issue” (Mar. 23, 2017), http://www.toledoblade.com/Politics/2017/03/23/Algae-termed-environmental-justice-issue.html; see also City of Toledo, Consolidated Plan FY2010-2015, https://toledo.oh.gov/media/2284/section2-community-
30 CLEAN WATER FOR ALL

profile.pdf (showing demographics of downtown core of Toledo).
98. EPA, “Building Sustainable Water Infrastructure,” supra note 4.
99. For more recommendations regarding the State Revolving Funds, see NRDC, Go Back to the Well: States and the Federal Government Are Neglecting a Key Funding Source for Water Infrastructure (May 2018), https://www.nrdc.org/sites/default/files/state-revolving-fund-water-infrastructure-ip.pdf.
100. Value of Water Campaign, American Support for Investments in Water Infrastructure: Key Findings from a National Voter Survey Conducted March 11-15, 2018 (2018), http://thevalueofwater.org/sites/default/files/To%20share%20website%20-%202018%20VOW%20Poll%20Results.pdf.
101. CDC, “Waterborne Diseases Could Cost Over $500 Million Annually in U.S.,” supra note 15.
102. Economic Policy Institute, Water Works: Rebuilding Infrastructure, Creating Jobs, and Greening the Environment (2011), https://www.epi.org/publication/water-works-infrastructure-report/.
103. American Rivers, Naturally Stronger: How Natural Water Infrastructure Can Save Money and Improve Lives, supra note 2.
104. Id.
105. Prevention Institute, A Time of Opportunity: Water, Health, and Equity in the Los Angeles Region (2018), https://www.preventioninstitute.org/sites/default/files/uploads/A%20Time%20of%20Opportunity%20July%202018.pdf.
106. Id.
107. See National Drinking Water Advisory Council, Affordability Work Group, Recommendations of the National Drinking Water Advisory Council to the U.S. EPA on its National Small Systems Affordability Criteria (July 2003), https://www.nclc.org/images/pdf/energy_utility_telecom/water/recommendations_july2003.pdf.
108. U.S. Environmental Protection Agency, “Pricing and Affordability of Water Services,” https://www.epa.gov/sustainable-water-infrastructure/pricing-and-affordability-water-services.
109. See City of Philadelphia, Press Release, “Philadelphia Launches New, Income-Based, Tiered Assistance Program” (June 20, 2017), https://www.phila.gov/press-releases/mayor/philadelphia-launches-new-income-based-tiered-assistance-program/.
110. AECOM, 40 Proposed U.S. Transportation and Water Infrastructure Projects of Major Economic Significance, prepared for the Build America Investment Initiative (2016), https://www.treasury.gov/connect/blog/Documents/final-infrastructure-report.pdf.
111. The Hill, “Virtually All Americans Oppose Any Infrastructure Plan That Sacrifices the Environment” (Jan. 26, 2018), http://thehill.com/opinion/energy-environment/370882-virtually-all-americans-oppose-any-infrastructure-plan-that.
112. The White House, Legislative Outline for Rebuilding Infrastructure in America (2018), https://www.whitehouse.gov/wp-content/uploads/2018/02/INFRASTRUCTURE-211.pdf.
113. Politico, “Trump Takes Aim at Blue States in Infrastructure Plan” (Feb. 12, 2018), https://www.politico.com/story/2018/02/12/trump-infrastructure-blue-states-transit-405993.
114. Roll Call, “Trump Adviser Says Infrastructure Push Won’t Have New Revenue” (Jan. 25, 2018), https://www.rollcall.com/news/politics/trump-adviser-says-infrastructure-push-wont-new-revenue.
115. UNC Environmental Finance Center, “Four Trends in Government Spending on Water and Wastewater Utilities Since 1956,” supra note 22.
116. Pacific Institute, A Twenty-First Century U.S. Water Policy, Chapter 3, supra note 3 (“Providing water services to a low-income, rural community will not be profitable.”).
117. See Joel Scata, NRDC, “WH Infrastructure Plan Could Have a Costly Maintenance Bill” (Feb. 14, 2018), https://www.nrdc.org/experts/joel-scata/wh-infrastructure-plan-could-have-costly-maintenance-bill.
118. See Amanda Rodewald, The Hill, “Trump’s Infrastructure Plan Builds Barriers to Public Engagement” (Feb. 20, 2018), http://thehill.com/opinion/energy-environment/374664-trumps-infrastructure-plan-builds-barriers-to-public-engagement.
119. U.S. EPA Region IX, Special Case Evaluation Regarding Status of the Los Angeles River, California, as a Traditional Navigable Water (2010), https://archive.epa.gov/region9/mediacenter/web/pdf/laspecialcaseletterandevaluation.pdf.
120. See EPA, Clean Water Act Section 404(c) “Veto Authority” (2016), https://www.epa.gov/sites/production/files/2016-03/documents/404c.pdf (showing that EPA has exercised its veto authority only 13 times in 45 years).
121. Pacific Institute, A Twenty-First Century U.S. Water Policy, Chapter 3, supra note 3.
122. See U.S. EPA, Final Determination of the U.S. Environmental Protection Agency Pursuant to § 404(c) of the Clean Water Act Concerning the Spruce No. 1 Mine, Logan County, West Virginia (2011), https://www.epa.gov/sites/production/files/2015-12/documents/1_spruce_no_1_mine_final_determination_011311.pdf.
123. See The Hill, “Trump’s Infrastructure Plan Hits a Dead End” (May 18, 2018), http://thehill.com/policy/transportation/388071-trumps-infrastructure-plan-hits-a-dead-end; The Nation, “The Shrinking Ambitions of Donald Trump’s ‘Infrastructure’ Plan” (July 2, 2018), https://www.thenation.com/article/shrinking-ambitions-donald-trumps-infrastructure-plan/.
124. Senate Democrats’ Jobs & Infrastructure Plan for America’s Workers (March 7, 2018), https://www.democrats.senate.gov/imo/media/doc/Senate%20Democrats’%20Jobs%20and%20Infrastructure%20Plan.pdf.
125. House of Representatives Sustainable Energy & Environment Coalition, Sustainable Infrastructure Proposal (Feb. 12, 2018), https://seec-tonko.house.gov/sites/sustainableenergyandenvironmentcoalitioncaucus.house.gov/files/documents/SEEC%20Sustainable%20Infrastructure%20Proposal%202.12.18.pdf.
WATER, HEALTH, AND EQUITY 31