the international center for tropical agriculture...
TRANSCRIPT
The International Center for Tropical Agriculture (CIAT) – a member of the CGIAR Consortium – develops technologies, innovative methods, and new knowledge that better enable farmers, especially smallholders, to make agriculture eco-efficient – that is, competitive and profitable as well as sustainable and resilient. Eco-efficient agriculture reduces hunger and poverty, improves human nutrition, and offers solutions to environmental degradation and climate change in the tropics. Headquartered near Cali, Colombia, CIAT conducts research for development in tropical regions of Latin America, Africa, and Asia.
www.ciat.cgiar.org
CGIAR is a global agricultural research partnership for a food secure future. Its science is carried out by the 15 research centers who are members of the CGIAR Consortium in collaboration with hundreds of partner organizations.
www.cgiar.org
ISBN 978-958-694-143-3
Centro Internacional de Agricultura TropicalInternational Center for Tropical Agriculture P. O. Box 6713Cali, ColombiaPhone: 57 2 4450000Fax: 57 2 4450073E-mail: [email protected]: www.ciat.cgiar.org
CIAT Publication No. 400Print run: 100Printed in ColombiaDecember 2014
Global Strategic Trends and Agricultural Research and Development in Latin America and the Caribbean: A Framework for Analysis / Eugenio Díaz-Bonilla, Eugenia Saini, Guy Henry, Bernardo Creamer, and Eduardo Trigo -- Cali, CO : Centro Internacional de Agricultura Tropical (CIAT), 2014.
49 p. -- (CIAT Publication No. 400)ISBN (printed version): 978-958-694-142-6ISBN (web version): 978-958-694-143-3
AGROVOC Descriptors:1. Productivity. 2. Production data. 3. Statistical analysis. 4. Trade. 5. Economic growth. 6. Agriculture. 7. Climate change. 8. Smallholders.
Local Descriptors:1. Agriculture.
Descriptores AGROVOC:1. Productividad. 2. Datos de producción. 3. Análisis estadístico. 4. Comercio. 5. Crecimiento económico. 6. Agricultura. 7. Cambio climático. 8. Pequeños agricultores.
Descriptores locales:1. Agricultura.
AGRIS Subject Category: A01 Agriculture in general
LC Classification:
I. Tit. II. Díaz-Bonilla, Eugenio. III. Saini, Eugenia. IV. Henry, Guy. V. Creamer, Bernardo. VI. Trigo, Eduardo. VII. Centro Internacional de Agricultura Tropical.
Copyright © CIAT 2014. All rights reserved.
CIAT encourages wide dissemination of its printed and electronic publications for maximum public benefit. Thus, in most cases, colleagues working in research and development should feel free to use CIAT materials for noncommercial purposes. However, the Center prohibits modification of these materials, and we expect to receive due credit. Though CIAT prepares its publications with considerable care, the Center does not guarantee their accuracy and completeness.
Foreword
In 2012, CIAT joined forces with the Inter-American Development Bank (IDB) and other organizations to create a “foresight framework” in support of strategic planning for agriculture in Latin America and the Caribbean (LAC), with the aim of fostering well-founded decisions that reinforce renewed efforts to achieve food security in LAC and beyond.
Initial results were presented at the 2012 Global Conference on Agricultural Research for Development (GCARD), held in late October at Punta del Este, Uruguay, where foresight was a central theme. Key findings from this work shed much light on emerging challenges and opportunities for the region.
The studies suggest, for example, that LAC will most likely retain its new status as a global food basket, helping stabilize prices through world trade. The region already accounts for a slightly bigger share of world agricultural production than the European Union or the USA plus Canada, and in the last decade, it has become the world’s principal net food-exporting region. Simulation studies suggest that LAC will continue to have a significant influence on global food security.
Foresight studies also underline LAC’s strategic importance as a major provider of global ecosystem services. In fact, it is the developing world’s biggest provider of such services. For that reason, rapid land-use change in the region is a matter of great concern because of its effects on greenhouse gas emissions and on the region’s rich stores of biodiversity. Several countries, including Colombia, have embarked on
initiatives to reduce emissions from deforestation and forest degradation.
The studies further indicate how LAC can play its vital dual role – as a global food basket and provider of ecosystem services – even better by intensifying agricultural research and development (R&D), with benefits for this region and the entire world. This activity has evolved considerably in the region, leading in recent years to active roles for the private sector and civil society in technology development and diffusion. While public investment in R&D has also risen over the last decade, just a few countries, notably Brazil, account for much of the increase, and investment has declined in smaller countries where it is needed most. To meet regional needs and make global contributions, LAC must intensify R&D along the whole agricultural value chain, widening the scope of this work beyond the staple crops produced by smallholders.
New foresight studies, like the work reported in this publication, form part of a wider effort in CIAT to re-route agricultural development in LAC and other regions toward an eco-efficient future, characterized by increased productivity, competitive strength, and resilience, with a much-reduced environmental footprint. In LAC particularly, this requires a major push to sharpen the competitive edge of high-priority sub-regions and value chains against the background of trade liberalization policies, accompanied by wise stewardship of the region’s extraordinary endowment of biodiversity and other natural riches.
Ruben EcheverríaDirector General, CIAT
Contents
Introduction 1
LAC’s Agriculture and Food Developments: Looking to the Past, Thinking about the Future 2 Food Availability 2
Production 2
Trade 3
Land, Labor, and Other Inputs 4
Productivity and R&D 6
Trends in Productivity 6
Investments in R&D 8
Some Institutional Aspects 10
Deforestation and GHG Emissions 11
Socioeconomic Developments 12
Economic and Social Actors in Agriculture 12
Other Socioeconomic Developments 14
Some Final Comments 15
Strategic Dimensions and Trends 16 Strategic Dimension 1: Global Governance and Globalization 16
Strategic Dimension 2: Growth 17
Overall View 17
Potential Developments 19
Strategic Dimension 3: Population, Urbanization, and Consumption 20
Population Structure and Economic Growth 20
Urbanization 21
Consumption Patterns 22
Potential Developments 23
Strategic Dimension 4: Energy 23
Historical View 24
Long-Term Energy Outlook 24
Potential Developments 26
Strategic Dimension 5: Climate Change 26
Longer Term Trends and Shorter Term Volatility 26
Some Final Comments 29
Strategic Dimension 6: Technology 29
Some Relevant Technological Developments 29
Institutional and Policy Issues 31
The Evolution of the Agrarian Structure in LAC 32
Challenges for LAC Agriculture and R&D 34 A Dual Role and an Enormous Challenge: The Need to Increase R&D Investments 34
Agriculture’s Shifting Terrain and R&D Priorities: More than Staple Crops 35
Along with High-Growth, High-Demand Scenarios, other less Buoyant Futures should be Considered 36
Agricultural R&D in LAC must Look at the Energy–Agriculture Link in General, including Biofuels, but Taking a Broader View 36
Regarding Climate Change, the more Immediate Concerns Are Extreme Events
and Water Stress 37
The Importance of “Multiple-Win” Technologies 37
Waste Reduction and Agricultural R&D 38
Agricultural R&D must closely Follow Changes in Consumers’ Preferences and
Public Policies on Health 38
Continuous Adaptation and Improvement of the Institutional R&D Framework Is Crucial 39
R&D Priority Setting cannot Follow just One Approach 40
Final Comments 41 AnnexesAnnex 1. List of Participants in the Meetings (March 2012, IDB, Washington, DC, USA,
and October 2012, CIAT, Cali, Colombia) of the LAC Foresight Study 42
Annex 2. A Suggestion of Key Priorities for Research 43
References 45
TablesTable 1. Agriculture and food growth rate in per capita terms (% per year) 2
Table 2. Share of world agricultural production (%) 3
Table 3. Increases in production and area 5
Table 4. Fertilizer consumption and tractors (average for 2000s) 6
Table 5. Irrigation (in 000 ha) 7
Table 6. Land and labor productivity 8
Table 7. TFP growth rates in LAC (%) for 1961−80 and 1981−2001 8
Table 8. Public R&D as % of agricultural GDP (average for 2000s) 10
Table 9. Forest area (million hectares) 11
Table 10. Poverty in LAC (millions of people) 14
Table 11. Growth rates per capita 19
Table 12. Projections of world oil prices 25
Table 13. Biophysical effects of climate change on yield (% change from 2000 climate to 2050 climate) 28
FiguresFigure 1. Net agricultural trade (billion US$) 4
Figure 2. Agricultural land and labor productivity, 1961–2010 (measured in 2004–2006
international dollars) 7
Figure 3. Growth in food and agricultural R&D expenditures 9
Figure 4. Public agricultural R&D spending worldwide, 1970 vs. 2005 9
Figure 5. Food and agricultural research intensity ratios, 1970–2005 9
Figure 6. Average world oil price 24
9
CIA
T ©
201
3.

1
Global Strategic Trends and Agricultural Research and Development in Latin America and the Caribbean: A Framework for Analysis1
Eugenio Díaz-Bonilla, Eugenia Saini, Guy Henry,2 Bernardo Creamer, and Eduardo Trigo3
IntroductionThis document is a partial output of a larger exercise in support of strategic planning and decision making about priorities for agricultural research and development (R&D) in Latin America and the Caribbean (LAC). A workshop was held at the Inter-American Development Bank (IDB) in Washington, DC, during March 2012, to analyze global trends and scenarios. Later, in October 2012, the implications for agricultural R&D were explored at an expert consultation (see list of participants in Annex 1) organized at the International Center for Tropical Agriculture (CIAT) in Colombia. The discussions in those events are a substantial input for this document.
The overall objective is to strengthen food security at the local, national, and global levels and foster sustainable development to generate income and employment in the region, particularly for the poor and vulnerable. The specific aim of this exercise is to present a general framework that could later be used for a more detailed analysis in particular sub-regions, countries, agro-ecological zones, value chains, or products. A policy brief (Díaz-Bonilla et al., 2012)
summarizing the first version of this document was presented at the Global Conference on Agricultural Research for Development (GCARD) 2012, and a longer document was finished in January 2013 (Díaz-Bonilla et al., 2013). Here, we concentrate mostly on strategic dimensions and trends, while trying to highlight implications for agricultural R&D in LAC and for the formulation of the CIAT strategy. The discussion on foresight methodologies and a suggested set of scenarios can be found in Díaz-Bonilla et al. (2013).
This document contains an introduction (Section 1) and three other sections. Section 2 briefly characterizes LAC’s agriculture and food developments during the past half century, as background to the identification of drivers and trends for the next decades. Section 3 focuses on different strategic dimensions and potential trends, related to macro-economics, demography, poverty, climate change, technology, and agrarian structure, whose evolution and combinations define future scenarios for the agricultural sector in the region. Section 4 finalizes with some conclusions related to LAC agriculture and strategic issues for R&D.
1 Acknowledgement: The research and consultation process of LAC Foresight activities was made possible through the strategic and generous contributions from the Inter-American Institute for Cooperation on Agriculture (IICA), International Development Bank (IDB), and Regional Fund for Agricultural Technology (FONTAGRO).
2 Corresponding author: [email protected] Eugenio Díaz-Bonilla was a consultant with the International Center for Tropical Agriculture (CIAT). He is currently a senior visiting researcher
with the International Food Policy Research Institute (IFPRI), Washington, DC. Eugenia Saini was a consultant with IICA. She is currently a project manager with FONTAGRO, Washington, DC. Guy Henry is a policy economist with Agricultural Research for Development (Cirad), France, seconded to CIAT, Colombia. Bernardo Creamer is a policy economist with CIAT and IFPRI. Eduardo Trigo is an agricultural economist and director of CEO Group, Buenos Aires.
2
Prospective analysis usually benefits from a consideration of the past for at least two reasons. First, the current situation is the baseline for future scenarios. And second, at least some of the trends and drivers that shaped the current situation may well be also operative in the future. Therefore, in what follows, we discuss some indicators of the evolution of LAC’s agriculture since the 1960s.4
Food Availability
Food availability per capita (based on data from FAOSTAT – the Statistics Division of the Food and Agriculture Organization of the United States [FAO]) increased between the 1960s and the 2000s. While in the 1960s the average daily calories per capita were between 2,100 and 2,300 depending on the sub-regions of LAC, the average for the 2000s was from 2,580 to almost 3,000 (increases of 20−30%). Daily protein per capita increased from 51−64 grams per capita (1960s) to 61−84 (2000s), while fats moved from 47−52 grams per capita (1960s) to 62−91 (2000s). Mexico, Central America, and South America (the main LAC sub-regions considered in the data) have maintained larger absolute values of food availability
LAC’s Agriculture and Food Developments: Looking to the Past, Thinking about the Future
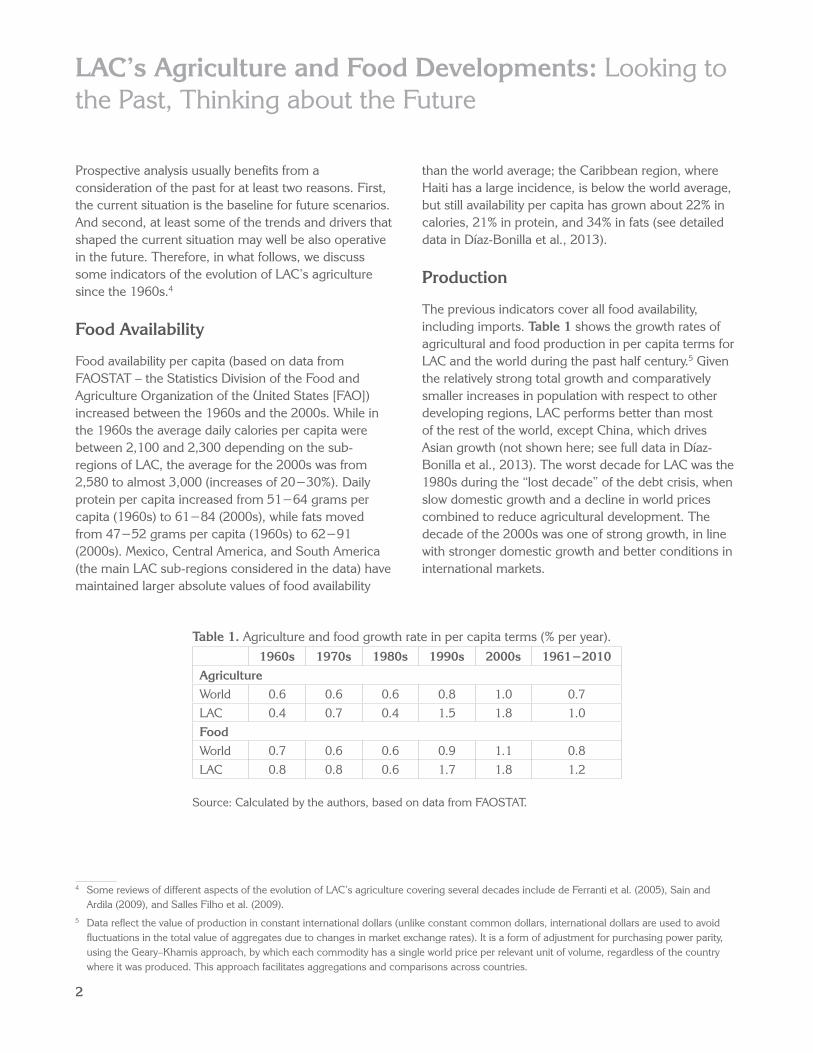
Table 1. Agriculture and food growth rate in per capita terms (% per year).1960s 1970s 1980s 1990s 2000s 1961−2010
AgricultureWorld 0.6 0.6 0.6 0.8 1.0 0.7LAC 0.4 0.7 0.4 1.5 1.8 1.0Food World 0.7 0.6 0.6 0.9 1.1 0.8LAC 0.8 0.8 0.6 1.7 1.8 1.2
Source: Calculated by the authors, based on data from FAOSTAT.
than the world average; the Caribbean region, where Haiti has a large incidence, is below the world average, but still availability per capita has grown about 22% in calories, 21% in protein, and 34% in fats (see detailed data in Díaz-Bonilla et al., 2013).
Production
The previous indicators cover all food availability, including imports. Table 1 shows the growth rates of agricultural and food production in per capita terms for LAC and the world during the past half century.5 Given the relatively strong total growth and comparatively smaller increases in population with respect to other developing regions, LAC performs better than most of the rest of the world, except China, which drives Asian growth (not shown here; see full data in Díaz-Bonilla et al., 2013). The worst decade for LAC was the 1980s during the “lost decade” of the debt crisis, when slow domestic growth and a decline in world prices combined to reduce agricultural development. The decade of the 2000s was one of strong growth, in line with stronger domestic growth and better conditions in international markets.
4 Some reviews of different aspects of the evolution of LAC’s agriculture covering several decades include de Ferranti et al. (2005), Sain and Ardila (2009), and Salles Filho et al. (2009).
5 Data reflect the value of production in constant international dollars (unlike constant common dollars, international dollars are used to avoid fluctuations in the total value of aggregates due to changes in market exchange rates). It is a form of adjustment for purchasing power parity, using the Geary–Khamis approach, by which each commodity has a single world price per relevant unit of volume, regardless of the country where it was produced. This approach facilitates aggregations and comparisons across countries.
3
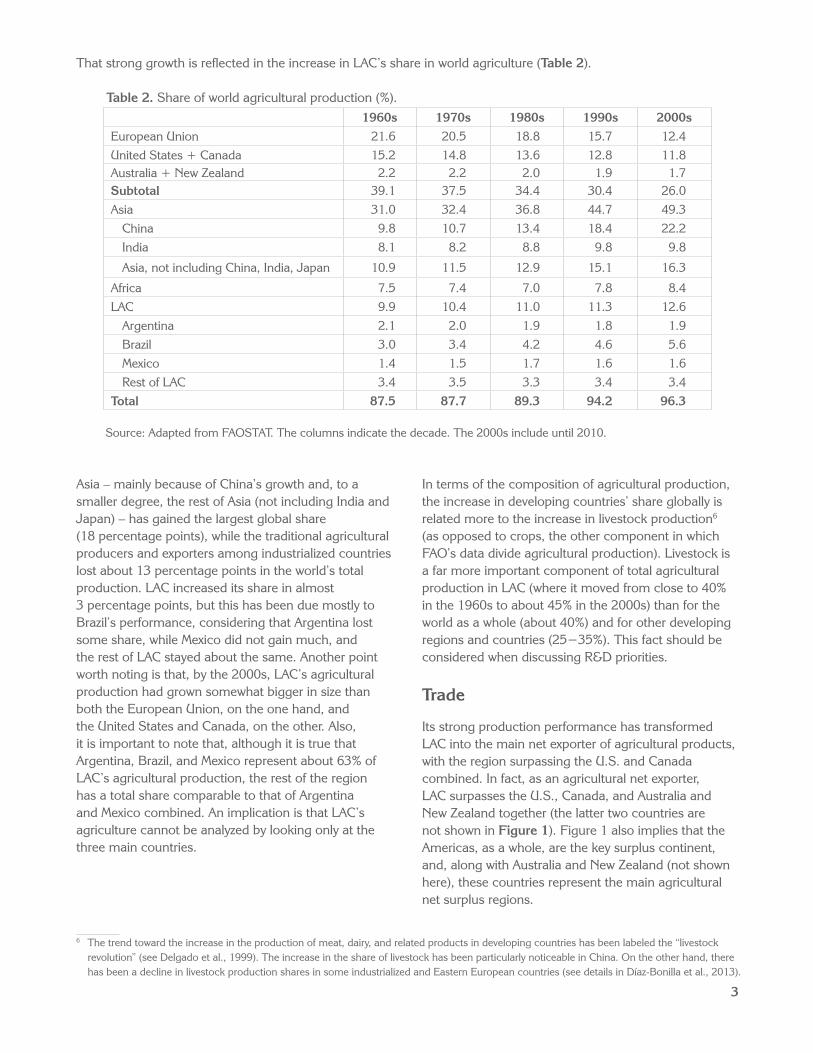
That strong growth is reflected in the increase in LAC’s share in world agriculture (Table 2).
Table 2. Share of world agricultural production (%).1960s 1970s 1980s 1990s 2000s
European Union 21.6 20.5 18.8 15.7 12.4United States + Canada 15.2 14.8 13.6 12.8 11.8Australia + New Zealand 2.2 2.2 2.0 1.9 1.7Subtotal 39.1 37.5 34.4 30.4 26.0Asia 31.0 32.4 36.8 44.7 49.3
China 9.8 10.7 13.4 18.4 22.2India 8.1 8.2 8.8 9.8 9.8
Asia, not including China, India, Japan 10.9 11.5 12.9 15.1 16.3
Africa 7.5 7.4 7.0 7.8 8.4LAC 9.9 10.4 11.0 11.3 12.6
Argentina 2.1 2.0 1.9 1.8 1.9Brazil 3.0 3.4 4.2 4.6 5.6Mexico 1.4 1.5 1.7 1.6 1.6Rest of LAC 3.4 3.5 3.3 3.4 3.4
Total 87.5 87.7 89.3 94.2 96.3
Source: Adapted from FAOSTAT. The columns indicate the decade. The 2000s include until 2010.
Asia – mainly because of China’s growth and, to a smaller degree, the rest of Asia (not including India and Japan) – has gained the largest global share (18 percentage points), while the traditional agricultural producers and exporters among industrialized countries lost about 13 percentage points in the world’s total production. LAC increased its share in almost 3 percentage points, but this has been due mostly to Brazil’s performance, considering that Argentina lost some share, while Mexico did not gain much, and the rest of LAC stayed about the same. Another point worth noting is that, by the 2000s, LAC’s agricultural production had grown somewhat bigger in size than both the European Union, on the one hand, and the United States and Canada, on the other. Also, it is important to note that, although it is true that Argentina, Brazil, and Mexico represent about 63% of LAC’s agricultural production, the rest of the region has a total share comparable to that of Argentina and Mexico combined. An implication is that LAC’s agriculture cannot be analyzed by looking only at the three main countries.
In terms of the composition of agricultural production, the increase in developing countries’ share globally is related more to the increase in livestock production6 (as opposed to crops, the other component in which FAO’s data divide agricultural production). Livestock is a far more important component of total agricultural production in LAC (where it moved from close to 40% in the 1960s to about 45% in the 2000s) than for the world as a whole (about 40%) and for other developing regions and countries (25−35%). This fact should be considered when discussing R&D priorities.
Trade
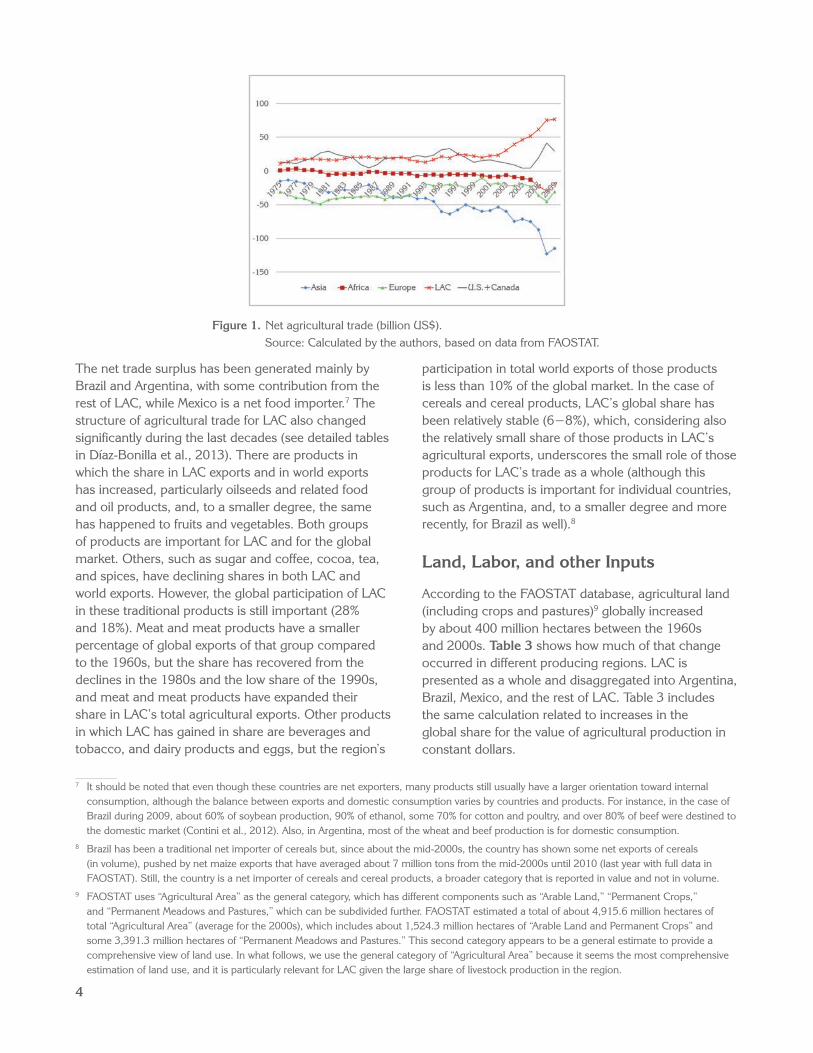
Its strong production performance has transformed LAC into the main net exporter of agricultural products, with the region surpassing the U.S. and Canada combined. In fact, as an agricultural net exporter, LAC surpasses the U.S., Canada, and Australia and New Zealand together (the latter two countries are not shown in Figure 1). Figure 1 also implies that the Americas, as a whole, are the key surplus continent, and, along with Australia and New Zealand (not shown here), these countries represent the main agricultural net surplus regions.
6 The trend toward the increase in the production of meat, dairy, and related products in developing countries has been labeled the “livestock revolution” (see Delgado et al., 1999). The increase in the share of livestock has been particularly noticeable in China. On the other hand, there has been a decline in livestock production shares in some industrialized and Eastern European countries (see details in Díaz-Bonilla et al., 2013).
4
The net trade surplus has been generated mainly by Brazil and Argentina, with some contribution from the rest of LAC, while Mexico is a net food importer.7 The structure of agricultural trade for LAC also changed significantly during the last decades (see detailed tables in Díaz-Bonilla et al., 2013). There are products in which the share in LAC exports and in world exports has increased, particularly oilseeds and related food and oil products, and, to a smaller degree, the same has happened to fruits and vegetables. Both groups of products are important for LAC and for the global market. Others, such as sugar and coffee, cocoa, tea, and spices, have declining shares in both LAC and world exports. However, the global participation of LAC in these traditional products is still important (28% and 18%). Meat and meat products have a smaller percentage of global exports of that group compared to the 1960s, but the share has recovered from the declines in the 1980s and the low share of the 1990s, and meat and meat products have expanded their share in LAC’s total agricultural exports. Other products in which LAC has gained in share are beverages and tobacco, and dairy products and eggs, but the region’s
participation in total world exports of those products is less than 10% of the global market. In the case of cereals and cereal products, LAC’s global share has been relatively stable (6−8%), which, considering also the relatively small share of those products in LAC’s agricultural exports, underscores the small role of those products for LAC’s trade as a whole (although this group of products is important for individual countries, such as Argentina, and, to a smaller degree and more recently, for Brazil as well).8
Land, Labor, and other Inputs
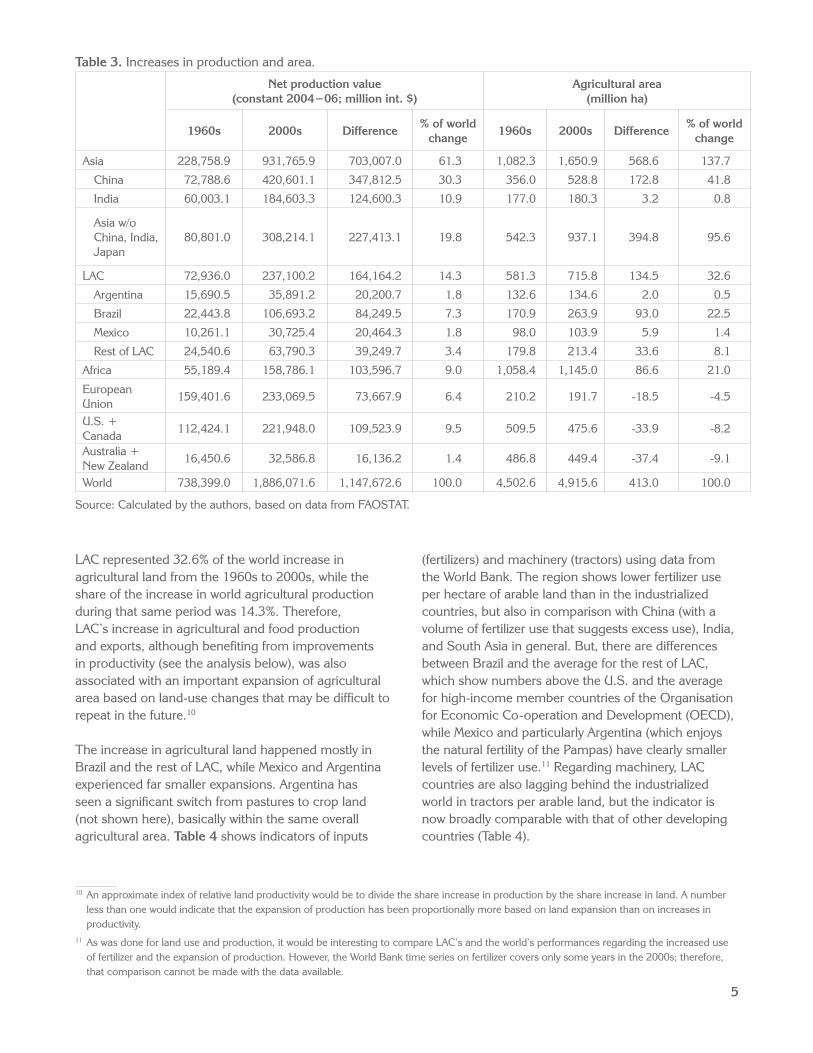
According to the FAOSTAT database, agricultural land (including crops and pastures)9 globally increased by about 400 million hectares between the 1960s and 2000s. Table 3 shows how much of that change occurred in different producing regions. LAC is presented as a whole and disaggregated into Argentina, Brazil, Mexico, and the rest of LAC. Table 3 includes the same calculation related to increases in the global share for the value of agricultural production in constant dollars.
7 It should be noted that even though these countries are net exporters, many products still usually have a larger orientation toward internal consumption, although the balance between exports and domestic consumption varies by countries and products. For instance, in the case of Brazil during 2009, about 60% of soybean production, 90% of ethanol, some 70% for cotton and poultry, and over 80% of beef were destined to the domestic market (Contini et al., 2012). Also, in Argentina, most of the wheat and beef production is for domestic consumption.
8 Brazil has been a traditional net importer of cereals but, since about the mid-2000s, the country has shown some net exports of cereals (in volume), pushed by net maize exports that have averaged about 7 million tons from the mid-2000s until 2010 (last year with full data in FAOSTAT). Still, the country is a net importer of cereals and cereal products, a broader category that is reported in value and not in volume.
9 FAOSTAT uses “Agricultural Area” as the general category, which has different components such as “Arable Land,” “Permanent Crops,” and “Permanent Meadows and Pastures,” which can be subdivided further. FAOSTAT estimated a total of about 4,915.6 million hectares of total “Agricultural Area” (average for the 2000s), which includes about 1,524.3 million hectares of “Arable Land and Permanent Crops” and some 3,391.3 million hectares of “Permanent Meadows and Pastures.” This second category appears to be a general estimate to provide a comprehensive view of land use. In what follows, we use the general category of “Agricultural Area” because it seems the most comprehensive estimation of land use, and it is particularly relevant for LAC given the large share of livestock production in the region.
Figure 1. Net agricultural trade (billion US$). Source: Calculated by the authors, based on data from FAOSTAT.
5
Table 3. Increases in production and area.
Net production value (constant 2004−06; million int. $)
Agricultural area (million ha)
1960s 2000s Difference% of world
change1960s 2000s Difference
% of world change
Asia 228,758.9 931,765.9 703,007.0 61.3 1,082.3 1,650.9 568.6 137.7
China 72,788.6 420,601.1 347,812.5 30.3 356.0 528.8 172.8 41.8
India 60,003.1 184,603.3 124,600.3 10.9 177.0 180.3 3.2 0.8
Asia w/o China, India, Japan
80,801.0 308,214.1 227,413.1 19.8 542.3 937.1 394.8 95.6
LAC 72,936.0 237,100.2 164,164.2 14.3 581.3 715.8 134.5 32.6
Argentina 15,690.5 35,891.2 20,200.7 1.8 132.6 134.6 2.0 0.5
Brazil 22,443.8 106,693.2 84,249.5 7.3 170.9 263.9 93.0 22.5
Mexico 10,261.1 30,725.4 20,464.3 1.8 98.0 103.9 5.9 1.4
Rest of LAC 24,540.6 63,790.3 39,249.7 3.4 179.8 213.4 33.6 8.1
Africa 55,189.4 158,786.1 103,596.7 9.0 1,058.4 1,145.0 86.6 21.0
European Union
159,401.6 233,069.5 73,667.9 6.4 210.2 191.7 -18.5 -4.5
U.S. + Canada
112,424.1 221,948.0 109,523.9 9.5 509.5 475.6 -33.9 -8.2
Australia + New Zealand
16,450.6 32,586.8 16,136.2 1.4 486.8 449.4 -37.4 -9.1
World 738,399.0 1,886,071.6 1,147,672.6 100.0 4,502.6 4,915.6 413.0 100.0
Source: Calculated by the authors, based on data from FAOSTAT.
LAC represented 32.6% of the world increase in agricultural land from the 1960s to 2000s, while the share of the increase in world agricultural production during that same period was 14.3%. Therefore, LAC’s increase in agricultural and food production and exports, although benefiting from improvements in productivity (see the analysis below), was also associated with an important expansion of agricultural area based on land-use changes that may be difficult to repeat in the future.10
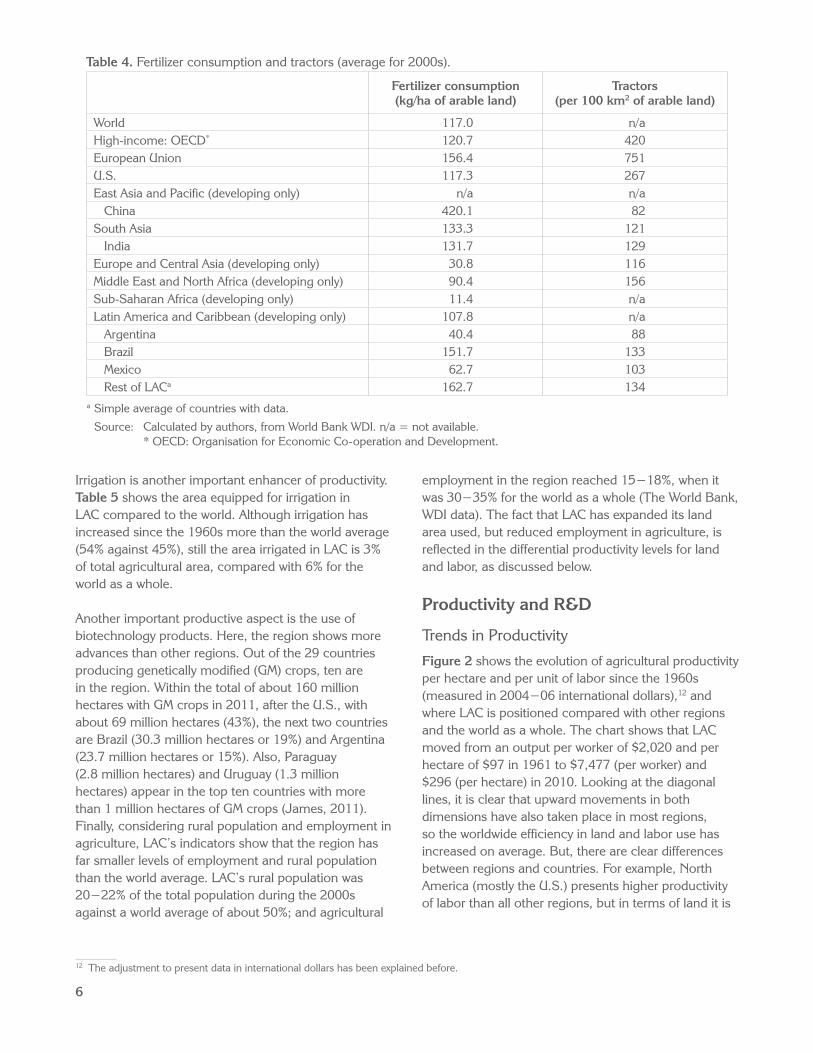
The increase in agricultural land happened mostly in Brazil and the rest of LAC, while Mexico and Argentina experienced far smaller expansions. Argentina has seen a significant switch from pastures to crop land (not shown here), basically within the same overall agricultural area. Table 4 shows indicators of inputs
(fertilizers) and machinery (tractors) using data from the World Bank. The region shows lower fertilizer use per hectare of arable land than in the industrialized countries, but also in comparison with China (with a volume of fertilizer use that suggests excess use), India, and South Asia in general. But, there are differences between Brazil and the average for the rest of LAC, which show numbers above the U.S. and the average for high-income member countries of the Organisation for Economic Co-operation and Development (OECD), while Mexico and particularly Argentina (which enjoys the natural fertility of the Pampas) have clearly smaller levels of fertilizer use.11 Regarding machinery, LAC countries are also lagging behind the industrialized world in tractors per arable land, but the indicator is now broadly comparable with that of other developing countries (Table 4).
10 An approximate index of relative land productivity would be to divide the share increase in production by the share increase in land. A number less than one would indicate that the expansion of production has been proportionally more based on land expansion than on increases in productivity.
11 As was done for land use and production, it would be interesting to compare LAC’s and the world’s performances regarding the increased use of fertilizer and the expansion of production. However, the World Bank time series on fertilizer covers only some years in the 2000s; therefore, that comparison cannot be made with the data available.
6
Table 4. Fertilizer consumption and tractors (average for 2000s).
Fertilizer consumption (kg/ha of arable land)
Tractors(per 100 km2 of arable land)
World 117.0 n/aHigh-income: OECD* 120.7 420European Union 156.4 751U.S. 117.3 267East Asia and Pacific (developing only) n/a n/a China 420.1 82South Asia 133.3 121 India 131.7 129Europe and Central Asia (developing only) 30.8 116Middle East and North Africa (developing only) 90.4 156Sub-Saharan Africa (developing only) 11.4 n/aLatin America and Caribbean (developing only) 107.8 n/a Argentina 40.4 88 Brazil 151.7 133 Mexico 62.7 103 Rest of LACa 162.7 134
a Simple average of countries with data.
Source: Calculated by authors, from World Bank WDI. n/a = not available. * OECD: Organisation for Economic Co-operation and Development.
Irrigation is another important enhancer of productivity. Table 5 shows the area equipped for irrigation in LAC compared to the world. Although irrigation has increased since the 1960s more than the world average (54% against 45%), still the area irrigated in LAC is 3% of total agricultural area, compared with 6% for the world as a whole.
Another important productive aspect is the use of biotechnology products. Here, the region shows more advances than other regions. Out of the 29 countries producing genetically modified (GM) crops, ten are in the region. Within the total of about 160 million hectares with GM crops in 2011, after the U.S., with about 69 million hectares (43%), the next two countries are Brazil (30.3 million hectares or 19%) and Argentina (23.7 million hectares or 15%). Also, Paraguay (2.8 million hectares) and Uruguay (1.3 million hectares) appear in the top ten countries with more than 1 million hectares of GM crops (James, 2011). Finally, considering rural population and employment in agriculture, LAC’s indicators show that the region has far smaller levels of employment and rural population than the world average. LAC’s rural population was 20−22% of the total population during the 2000s against a world average of about 50%; and agricultural
employment in the region reached 15−18%, when it was 30−35% for the world as a whole (The World Bank, WDI data). The fact that LAC has expanded its land area used, but reduced employment in agriculture, is reflected in the differential productivity levels for land and labor, as discussed below.
Productivity and R&D
Trends in Productivity
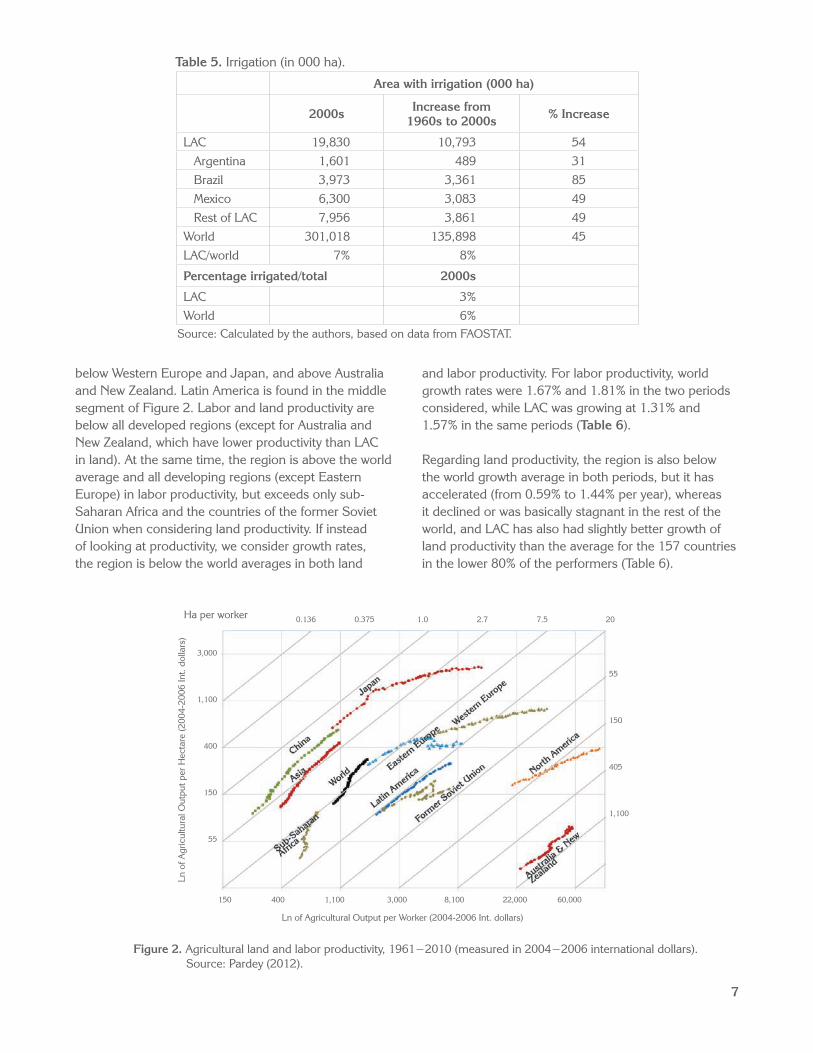
Figure 2 shows the evolution of agricultural productivity per hectare and per unit of labor since the 1960s (measured in 2004−06 international dollars),12 and where LAC is positioned compared with other regions and the world as a whole. The chart shows that LAC moved from an output per worker of $2,020 and per hectare of $97 in 1961 to $7,477 (per worker) and $296 (per hectare) in 2010. Looking at the diagonal lines, it is clear that upward movements in both dimensions have also taken place in most regions, so the worldwide efficiency in land and labor use has increased on average. But, there are clear differences between regions and countries. For example, North America (mostly the U.S.) presents higher productivity of labor than all other regions, but in terms of land it is
12 The adjustment to present data in international dollars has been explained before.
7
below Western Europe and Japan, and above Australia and New Zealand. Latin America is found in the middle segment of Figure 2. Labor and land productivity are below all developed regions (except for Australia and New Zealand, which have lower productivity than LAC in land). At the same time, the region is above the world average and all developing regions (except Eastern Europe) in labor productivity, but exceeds only sub-Saharan Africa and the countries of the former Soviet Union when considering land productivity. If instead of looking at productivity, we consider growth rates, the region is below the world averages in both land
Table 5. Irrigation (in 000 ha).
Area with irrigation (000 ha)
2000s Increase from 1960s to 2000s % Increase
LAC 19,830 10,793 54 Argentina 1,601 489 31 Brazil 3,973 3,361 85 Mexico 6,300 3,083 49 Rest of LAC 7,956 3,861 49World 301,018 135,898 45LAC/world 7% 8%
Percentage irrigated/total 2000s
LAC 3%World 6%
Source: Calculated by the authors, based on data from FAOSTAT.
and labor productivity. For labor productivity, world growth rates were 1.67% and 1.81% in the two periods considered, while LAC was growing at 1.31% and 1.57% in the same periods (Table 6).
Regarding land productivity, the region is also below the world growth average in both periods, but it has accelerated (from 0.59% to 1.44% per year), whereas it declined or was basically stagnant in the rest of the world, and LAC has also had slightly better growth of land productivity than the average for the 157 countries in the lower 80% of the performers (Table 6).
Figure 2. Agricultural land and labor productivity, 1961−2010 (measured in 2004−2006 international dollars). Source: Pardey (2012).
Ha per worker 0.136 0.375 1.0 2.7 7.5 20
3,000
1,100
400
150
55
55
150
405
1,100
150 400 1,100 3,000 8,100 22,000 60,000
Ln o
f Agr
icul
tura
l Out
put p
er H
ecta
re (2
004-
2006
Int.
dolla
rs)
Ln of Agricultural Output per Worker (2004-2006 Int. dollars)
8
Table 6. Land and labor productivity.
GroupingsLand Productivity Labor Productivity
1961–90 1990–10 Difference 1961–90 1990–10 Difference
Percent per year
World 1.67 1.51 -0.16 1.67 1.81 0.14
World minus China 1.66 1.49 -0.16 1.66 1.80 0.13
80% (N=23) 2.06 2.12 0.06 2.69 3.01 0.32
80% minus China 1.99 2.04 0.05 2.71 2.97 0.27
<80% (N=157) 1.61 1.42 -0.19 1.52 1.63 0.12
LAC 0.59 1.44 0.85 1.31 1.57 0.27Source: Pardey (2012).
Table 7. TFP growth rates in LAC (%) for 1961−80 and 1981−2001.Agriculture Livestock Average per period Average
1961−1980 1981−2001 1961−1980 1981−2001 1961−1980 1981−2001 1961−2001
Southern Cone 1.49 3.14 0.72 2.51 1.02 2.81 1.92
Andean Countries 1.11 1.71 1.73 1.92 1.41 1.81 1.61
Mexico and Central America
1.65 1.05 2.77 1.53 2.17 1.32 1.74
Caribbean 0.74 -2.05 1.20 0.64 0.98 0.29 0.64Average LAC 1.45 2.26 1.39 2.13 1.36 2.24 1.80
Asia 1.71 2.02 2.20 3.45 1.92 2.50 2.21Africa 1.03 1.74 1.49 1.09 1.20 1.68 1.44
Source: Avila and Evenson (2005).
13 Data on R&D expenditures are currently being extended to include private-sector statistics, which will provide a better view of the current situation.
Another approach to look at the evolution of productivity in the region is to analyze the growth rate of total factor productivity (TFP). Table 7, adapted from Avila and Evenson (2005), shows TFP growth rates from the 1960s to the early 2000s. For almost every period and product, average TFP in LAC was below the average for Asia and above that of Africa (these regions include only developing countries). At the same time, the detailed tables in Avila and Evenson (2005) (see also Díaz-Bonilla et al., 2013) show that there was a large dispersion in TFP growth rates, from Argentina, Bolivia, and Venezuela with 2% or more to the negative value in Cuba and the low growth rates in Guatemala, Uruguay, and Trinidad and Tobago, among others. A second point is that, considering TFP growth rates for individual countries, there were several cases with rates above the best performers in LAC, such as India, China, and Malaysia in Asia, and Mauritania, Benin, Nigeria, and Tunisia in Africa, among others (see more detailed tables
in Avila and Evenson, 2005). Those numbers reinforce the idea that LAC’s productivity, on average, has been in the middle range for the world as a whole.
Investments in R&D
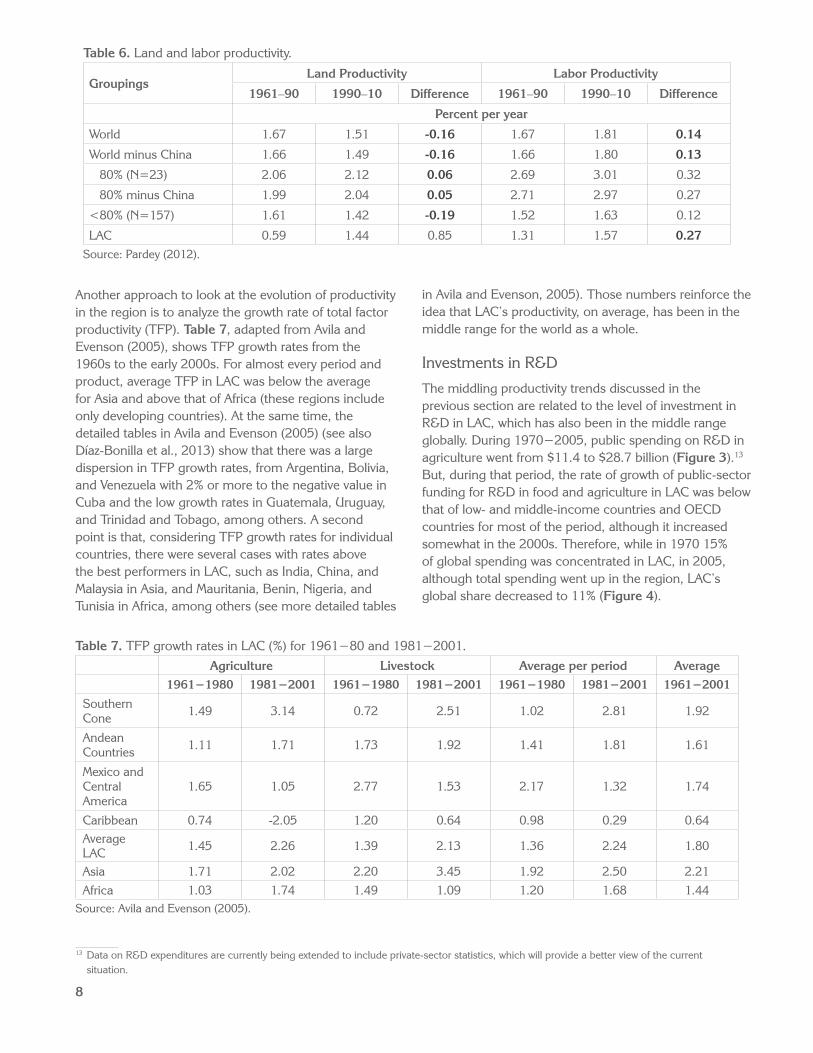
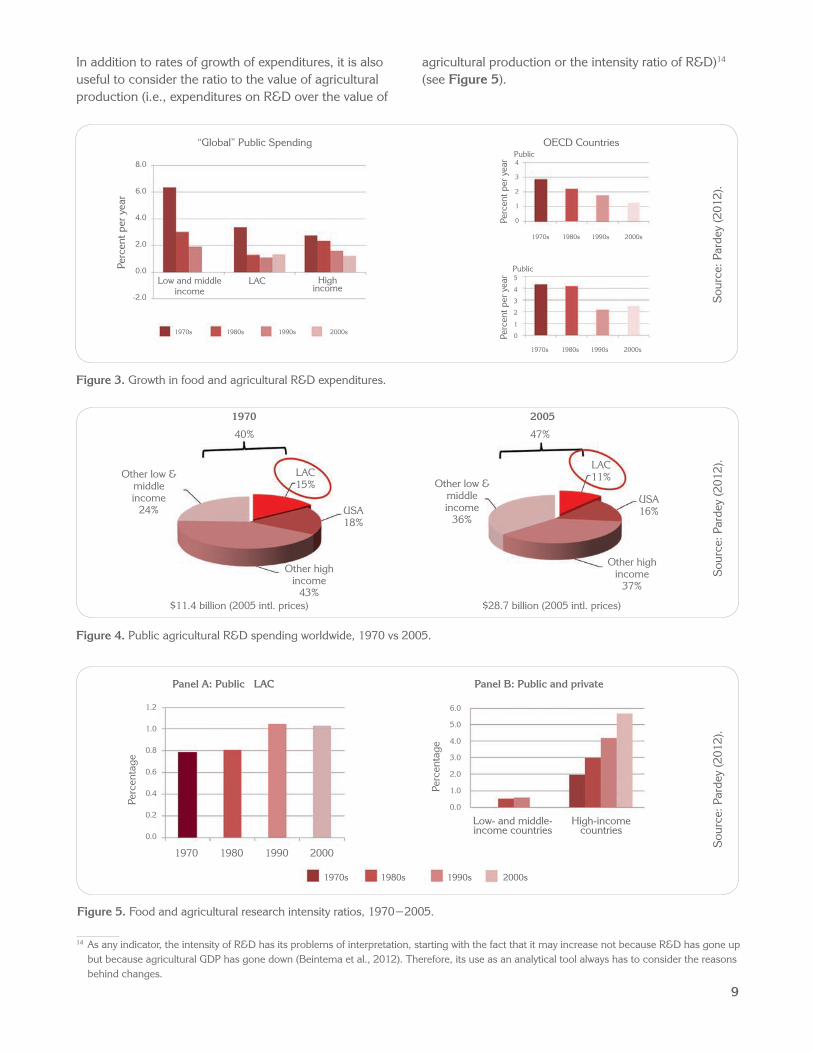
The middling productivity trends discussed in the previous section are related to the level of investment in R&D in LAC, which has also been in the middle range globally. During 1970−2005, public spending on R&D in agriculture went from $11.4 to $28.7 billion (Figure 3).13 But, during that period, the rate of growth of public-sector funding for R&D in food and agriculture in LAC was below that of low- and middle-income countries and OECD countries for most of the period, although it increased somewhat in the 2000s. Therefore, while in 1970 15% of global spending was concentrated in LAC, in 2005, although total spending went up in the region, LAC’s global share decreased to 11% (Figure 4).
9
“Global” Public Spending OECD CountriesPublic
Public
4
3
2
1
0
5
4
3
2
1
0
Perc
ent p
er y
ear
Perc
ent p
er y
ear
Perc
ent p
er y
ear
1970s 1980s 1990s 2000s
1970s 1980s 1990s 2000s
1970s 1980s 1990s 2000s
8.0
6.0
4.0
2.0
0.0
-2.0
Low and middle income
LAC High income
In addition to rates of growth of expenditures, it is also useful to consider the ratio to the value of agricultural production (i.e., expenditures on R&D over the value of
1970 2005
40% 47%
Other low &middleincome
24%
Other low &middleincome
36%
Other highincome
43%
Other highincome
37%
LAC15%
LAC11%
USA18%
USA16%
$11.4 billion (2005 intl. prices) $28.7 billion (2005 intl. prices)
Sou
rce:
Par
dey
(201
2).
1970s 1980s 1990s 2000s
Low- and middle- income countries
High-income countries
Panel A: Public LAC Panel B: Public and private
1.2
1.0
0.8
0.6
0.4
0.2
0.0
6.0
5.0
4.0
3.0
2.0
1.0
0.0
Perc
enta
ge
Perc
enta
ge
1970 1980 1990 2000
Sou
rce:
Par
dey
(201
2).
Figure 3. Growth in food and agricultural R&D expenditures.
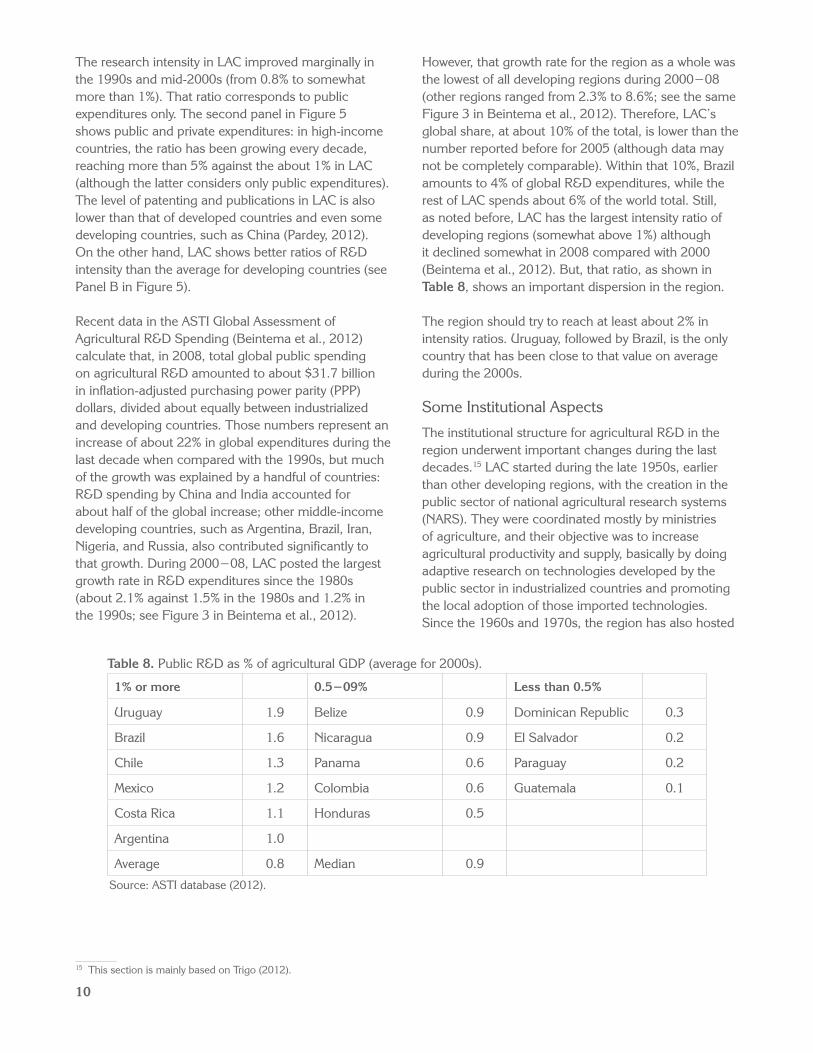
agricultural production or the intensity ratio of R&D)14 (see Figure 5).
Figure 4. Public agricultural R&D spending worldwide, 1970 vs 2005.
Figure 5. Food and agricultural research intensity ratios, 1970−2005.
14 As any indicator, the intensity of R&D has its problems of interpretation, starting with the fact that it may increase not because R&D has gone up but because agricultural GDP has gone down (Beintema et al., 2012). Therefore, its use as an analytical tool always has to consider the reasons behind changes.
Sou
rce:
Par
dey
(201
2).
10
The research intensity in LAC improved marginally in the 1990s and mid-2000s (from 0.8% to somewhat more than 1%). That ratio corresponds to public expenditures only. The second panel in Figure 5 shows public and private expenditures: in high-income countries, the ratio has been growing every decade, reaching more than 5% against the about 1% in LAC (although the latter considers only public expenditures). The level of patenting and publications in LAC is also lower than that of developed countries and even some developing countries, such as China (Pardey, 2012). On the other hand, LAC shows better ratios of R&D intensity than the average for developing countries (see Panel B in Figure 5).
Recent data in the ASTI Global Assessment of Agricultural R&D Spending (Beintema et al., 2012) calculate that, in 2008, total global public spending on agricultural R&D amounted to about $31.7 billion in inflation-adjusted purchasing power parity (PPP) dollars, divided about equally between industrialized and developing countries. Those numbers represent an increase of about 22% in global expenditures during the last decade when compared with the 1990s, but much of the growth was explained by a handful of countries: R&D spending by China and India accounted for about half of the global increase; other middle-income developing countries, such as Argentina, Brazil, Iran, Nigeria, and Russia, also contributed significantly to that growth. During 2000−08, LAC posted the largest growth rate in R&D expenditures since the 1980s (about 2.1% against 1.5% in the 1980s and 1.2% in the 1990s; see Figure 3 in Beintema et al., 2012).
However, that growth rate for the region as a whole was the lowest of all developing regions during 2000−08 (other regions ranged from 2.3% to 8.6%; see the same Figure 3 in Beintema et al., 2012). Therefore, LAC’s global share, at about 10% of the total, is lower than the number reported before for 2005 (although data may not be completely comparable). Within that 10%, Brazil amounts to 4% of global R&D expenditures, while the rest of LAC spends about 6% of the world total. Still, as noted before, LAC has the largest intensity ratio of developing regions (somewhat above 1%) although it declined somewhat in 2008 compared with 2000 (Beintema et al., 2012). But, that ratio, as shown in Table 8, shows an important dispersion in the region.
The region should try to reach at least about 2% in intensity ratios. Uruguay, followed by Brazil, is the only country that has been close to that value on average during the 2000s.
Some Institutional Aspects
The institutional structure for agricultural R&D in the region underwent important changes during the last decades.15 LAC started during the late 1950s, earlier than other developing regions, with the creation in the public sector of national agricultural research systems (NARS). They were coordinated mostly by ministries of agriculture, and their objective was to increase agricultural productivity and supply, basically by doing adaptive research on technologies developed by the public sector in industrialized countries and promoting the local adoption of those imported technologies. Since the 1960s and 1970s, the region has also hosted
Table 8. Public R&D as % of agricultural GDP (average for 2000s).
1% or more 0.5−09% Less than 0.5%
Uruguay 1.9 Belize 0.9 Dominican Republic 0.3
Brazil 1.6 Nicaragua 0.9 El Salvador 0.2
Chile 1.3 Panama 0.6 Paraguay 0.2
Mexico 1.2 Colombia 0.6 Guatemala 0.1
Costa Rica 1.1 Honduras 0.5
Argentina 1.0
Average 0.8 Median 0.9
Source: ASTI database (2012).
15 This section is mainly based on Trigo (2012).
11
three of the international centers of the CGIAR system: the International Maize and Wheat Improvement Center (CIMMYT), International Center for Tropical Agriculture (CIAT), and International Potato Center (CIP).
In the 1980s and 1990s, macro-economic crises led to important changes in agricultural policies in LAC, with the dismantling of supporting services that provided key inputs, such as seeds, credit, and marketing. The NARS began to focus more on smallholders and poverty issues while moving at the same time toward broader approaches such as “rural development,” in which agricultural R&D became just a component of a larger approach, along with extension services, the provision of rural infrastructure, access to markets, and education.
Over time, a complex regional institutional framework has developed in LAC, which includes, in addition to the NARS and the CGIAR Centers, cooperation programs, such as the PROCIs (PROCISUR, PROCIANDINO, PROCITROPICOS, SICTA, PROMECAFE, PROCICARIBE, and PROCINORTE); FORAGRO with IICA as its secretariat; regional centers such as CATIE and CARDI; FONTAGRO; and technical and financial cooperation organizations of developed countries. More recently, the private sector – from multinational companies to producers associations – and civil society have also taken up active roles in the development and dissemination of agricultural technology,16 while at the same time new public actors (such as universities) have emerged. In several cases, these private-sector initiatives helped develop new products or strengthen the competitiveness of traditional ones, with limited or no participation from the public sector.
The previous brief summary of institutional developments must recognize that large differences
exist across countries (see for instance Sain and Ardila [2009], who classified countries in the region using two indices: one that tries to capture a country’s ability to innovate, and another that focuses on the capacity to adapt technological innovations that come from other countries). The different profiles should be considered when designing appropriate strategies for technological development in each country. Given the disparities, it is crucial to strengthen the link among countries in the region that have different abilities to create and adopt agricultural technological innovations. Therefore, regional cooperation networks become important tools.
The recent ASTI assessment (Beintema et al., 2012) also noted a variety of human capacity challenges, including the older average age of scientists and low salaries and uncompetitive conditions of service in public agricultural R&D, which have led to high staff turnover and “brain drain” to the private sector, CGIAR, or abroad. Beintema et al. (2012) also highlight the lack of a critical mass of well-qualified researchers in small countries, which underscores the need for regional initiatives that can help them to better use limited resources and avoid duplications. Currently, different ongoing changes in basic and applied science, in institutions and policies, and in the objectives that agricultural R&D should focus on, are changing the setting in which NARS must operate. These aspects will be discussed later in the strategic dimension focusing on technology.
Deforestation and GHG Emissions
The increases in LAC’s agricultural land discussed before have been accompanied by a decline in forest area in the region (Table 9). LAC lost almost 9% of its forest between 1990 and 2010, while the world lost about 3%. Therefore, the region represents about two-thirds of all the forest lost globally during that period.
Table 9. Forest area (million hectares).
1990 2010 Lost forest (million ha)
Lost forest as % of total forest in 1990
World 4,158.2 4,020.4 -137.8 3.3
LAC 1,038.9 946.0 -92.9 8.9
LAC as % world lost forest area 25.0 23.5 67.4Source: Calculated by the authors, based on data from FAOSTAT and the World Bank.
16 See, for instance, Gillespie (2005).
12
17 LAC has 0.3 kg of CO2-equivalent emissions per 2005 $GDP measured in PPP, compared with 0.7 kg for all developing countries and 0.5 kg for the world as a whole (average for the 2000s from World Development Indicators, World Bank).
18 Greenhouse gas emissions from agriculture result mainly from the management of agricultural soils, livestock, rice production, and biomass burning. LUCF greenhouse gas emissions primarily include carbon dioxide (CO2) emissions from deforestation, land clearing for agriculture, and fires or decay of peat soils; they do not include the CO2 that ecosystems remove from the atmosphere.
19 The countries are Argentina, Bolivia, Brazil, Chile, Colombia, Mexico, Peru, Uruguay, and Venezuela. 20 Studies conducted by the Comité Interamericano de Desarrollo Agrícola (CIDA), with the participation of FAO, IDB, the Organization of
American States (OAS), and the Economic Commission for Latin America and the Caribbean (ECLAC). The studies included Argentina (1965), Brazil (1966), Chile (1966), Colombia (1966), Ecuador (1965), Guatemala (1965), and Peru (1966). There were other subsequent analyses (see Barraclough and Collarte, 1973).
Not surprisingly, and although LAC has comparatively low greenhouse gas (GHG) emissions (particularly when measured per unit of GDP at PPP),17 land-use changes and forestry (LUCF) and agriculture represent important components of GHG emissions in LAC.18 For the world as a whole, LUCF emissions amounted to 17% of global GHG emissions in 2004, and agriculture emissions represented 14%. But, for LAC, LUCF emissions represent the largest percentage of GHG emissions: 46%, compared with 17% for the world and 30% for developing countries (de la Torre et al., 2009). Houghton (2008) estimated that the region represented 41% of LUCF emissions globally (data for 2005).
According to de la Torre et al. (2009), the main source of land-use emissions in the region is Brazil, representing about 58% of LAC’s total. However, the percentage contribution of forest clearing to total agricultural GHG may be significant within other countries or regions, such as in Central America and the Caribbean, where LUCF represents 60% of the emissions from those countries. The share of GHG emissions from LAC related to agriculture (as separate from LUCF) compared with world emissions from the sector amounted to about 15.5% of the total (based on nine countries).19
In summary, even though LAC’s total emissions are globally less important than those from other developed and developing regions, both LUCF and agriculture have a large incidence within the region, and for the world as a whole in those categories.
Socioeconomic Developments
Economic and Social Actors in Agriculture
The changes in LAC’s agricultural production discussed before have taken place against a background of important changes in both agrarian structure (linked to land tenure patterns) and in the organization of the broader value chains (within which land-related issues are just one component).
Land Tenure Issues
The dual structure “latifundio-minifundio,” with the large inequalities in land tenure and socioeconomic power emanating from this, has been a historical trait of many LAC countries since the colonial period. From time to time, it led to peasants’ revolts and attempts to reform some of the main inequalities. Before the 1960s, there were several important land reforms (Mexico in the 1920s, Bolivia and Guatemala in the early 1950s, and Cuba in the late 1950s), but it was the Alliance for Progress, launched in 1961, that put in motion a larger process of agrarian reform in LAC. It was considered that the dual land structure imposed heavy costs on LAC’s development efforts, and created unequal societies with weak democracies and periodic bouts of violence.20
During the next decades, several countries in LAC implemented agrarian reforms: Chile, from the mid-1960s to mid-1970s, Peru during the 1970s, and Nicaragua and El Salvador in the 1980s (FAO, 2012). These reforms, along with the process of urbanization, the expansion of new agricultural technologies, and somewhat improved public agricultural services and rural infrastructure, reduced the pressure of rural movements, and, with the fading threat of a Cuban-like revolution in the region, agrarian reforms slowed down or stopped. The integration of rural and urban markets and the expansion of exports also led to the development of new value chains, the emergence of new types of large and medium-sized producers, and the transformation of traditional peasants. Although tensions around land issues have continued, they are now also linked to new problems, such as guerrilla and drug-related rural violence (CEPAL/FAO/IICA, 2012).
The return of democracy in many LAC countries in the 1980s and 1990s slowly brought again to the public agenda the issue of unequal land tenure. In the mid-1980s, Brazil expanded its work on agrarian reform, and other countries, such as Bolivia, Colombia, Paraguay, and Venezuela, passed or modified land
13
reform laws during the 1990s (CEPAL/FAO/IICA, 2012). Along with these more traditional approaches to agrarian reform, another strategy was to facilitate access through credit to small buyers to purchase land, but the amount of land distributed has been small (CEPAL/FAO/IICA, 2012).
Still, LAC continues to be the region with the largest inequalities in landholdings. In the late 1990s and early 2000s, the concentration measured by the Gini coefficient for landholdings in LAC was about 0.82 (the closer to 1, the more concentrated) against 0.53 in Africa, 0.57 in Asia (developing), 0.59 in the European Union, and 0.64 in Canada (Diao et al., 2005). During the past decade, the process of concentration may have increased further in several countries, notwithstanding the efforts at land redistribution mentioned, although the evidence is not clear because many countries have not completed censuses of agriculture since the 1990s, and the information available in agricultural and household surveys and population censuses is inconclusive (CEPAL/FAO/IICA, 2012).21 In contrast with those trends, in Mexico, land appears to have subdivided further, with the number of production units increasing from 3.8 million to 4.1 million and the average area of production units declining from 8 hectares to 7.3 hectares between 1991 and 2007 (CEPAL/FAO/IICA, 2012).
Other trends and facts related to land issues (CEPAL/FAO/IICA, 2012; and FAO, 2012) follow: (1) many farms lack a title to the land in LAC (about 50%); (2) there has been an expansion of land buying in the region mainly by regional firms (“translatinas”) and local groups expanding into neighboring countries; (3) besides land purchases, there have been other ways to concentrate production and achieve economies of scale (such as planting pools in the Southern Cone and the expansion of contract farming in most LAC countries); and (4) cross-border movement of agricultural producers; although this is a long-standing trend in some countries, mainly in the Southern Cone, it may have strengthened in the last decade or so (Dirven, 2011).22
21 For instance, in Paraguay, the Gini coefficient increased from 0.91 in 1991 to 0.93 in 2008. In Chile, the 2007 census showed that 242,000 farms had less than 12 hectares of basic irrigation (HRB, in Spanish, is a standardized measure to make land area comparable), while 25,000 farms with more than 12 HRB controlled 80% of the agricultural land (FAO, 2012; Dirven 2011). Considering production, Ribeiro Vieira Filho et al. (2011) report that, in Brazil, 8% of the farms produced 85% of the value of agricultural production.
22 Another trend related to land, but largely exceeding the productive aspects, is the indigenous movements that claim land ownership but as a component of a broader process of establishing an indigenous identity and achieving recognition of special rights and their own internal political processes (CEPAL/FAO/IICA, 2012). Other land-related issues include the expansion of cities and other activities, such as industry, tourism, and infrastructure that are impinging on farm land, and the new notions about the multiple functions of land beyond the provision of food and fiber to include environmental, tourism, recreational, and biodiversity services (CEPAL/FAO/IICA, 2012).
Labor Markets
Besides the changes in land structure and other land-related issues, there have been other important developments in rural labor markets of LAC countries, including (1) the reduction in the importance of agricultural employment; (2) the increase in women’s employment, but still with a low participation compared with other developing regions; (3) the increase in urban residence among agricultural workers during the last decade in 10 out of the 12 countries with comparable data, helped by improved transportation infrastructure (although the definition as “urban” of some population centers is debatable); and (4) youth migration to urban centers and the aging of LAC farmers as a part of a broader demographic change in the LAC population, but with differences between the older populations in the Southern Cone and the younger ones mainly in Central America (CEPAL/FAO/IICA, 2012). Also, there has been a diversity of trends in the proportion of salaried labor, self-employment, and nonpaid family employment, depending on whether it is agricultural employment or nonagricultural rural employment (CEPAL/FAO/IICA, 2012).
Agribusiness and Supermarkets
At the level of actors in the agribusiness and marketing space, there have also been important changes. International seed companies and other input providers have expanded in the region, providing technology mainly for cereals and oilseeds. Machinery and irrigation companies have also extended their operations in the region. Meat conglomerates have been organizing the value chain through larger scale operations in beef, poultry, and pork production. But, probably the most important change has been supermarkets restructuring the whole food chain, including processed and fresh products, such as fruits, vegetables, and specialties (Reardon and Timmer, 2012). LAC is the developing region where the expansion of supermarkets started earlier and has gone further: in the 1990s, they were a niche retail market occupied by domestic firms covering 10−20% of national food retail sales; by 2000, supermarkets
14
had increased to 50−60% of national food retail sales in many countries in the region, getting in one decade closer to the 70−80% share of the United States that took five decades to reach. Brazil has the highest share, followed by Argentina, Chile, Costa Rica, Colombia, and Mexico. The takeover of food retailing by supermarkets has developed faster in processed, dry, and packaged foods (in which economies of scale are important), but has also been increasing in fresh products, including vegetables, fruits, and different types of meats. Still, the share of supermarkets in fresh foods is about half the share in packaged foods. But, for some fresh products, such as fruits and vegetables, supermarkets in Latin America buy about 2.5 times more of those products from local producers than the amount exported to world markets. Another point to be noted is that the expansion of supermarkets has been driven by foreign direct investments. According to some estimates in LAC, multinational chains constitute 70−80% of the top five chains in several countries (Reardon and Berdegué, 2002; Reardon et al., 2004).
Other Socioeconomic Developments
During the last decades, LAC countries also showed other important socioeconomic changes (data from World Development Indicators/The World Bank, 2012). Since the 1960s, GDP per capita (in constant dollars) increased by 85%, to an average of $8,500 (GNI Atlas method) in 2011, while the world as a whole increased by 81%. LAC had an average of about $8,500 per capita (GNI Atlas method) in 2011 compared with $3,600 for all developing countries, but this is still far below the $39,800 per capita of developed countries. The percentage of the population suffering from poverty declined from 24% in 1980 to 12% in 2008
(latest World Bank data, using a poverty line of US$2/day in PPP terms), a level well below the average for developing countries. At the same time, LAC remains the most unequal region of the world: for instance, while the average Gini index for 135 countries with data for the 2000s is 40.8 (median 39.7), for the 20 LAC countries with data during the same period the average is 52.2 (median 52.1) (data from The World Bank, WDI, 2012).
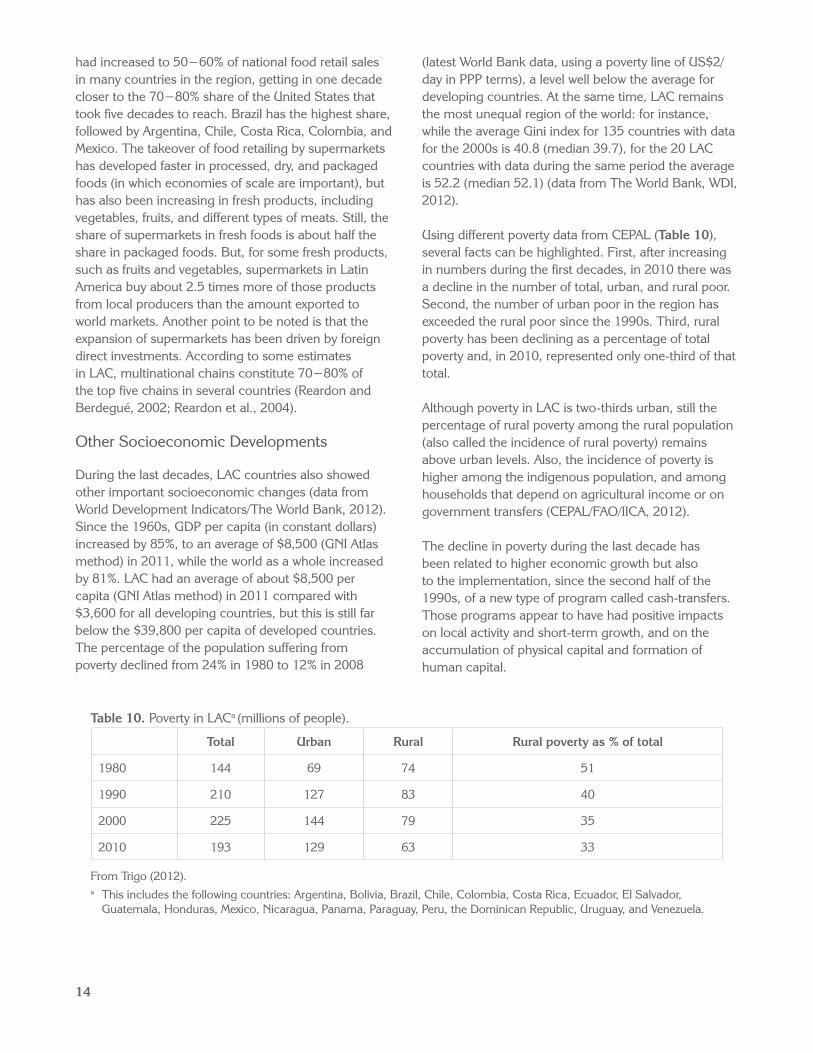
Using different poverty data from CEPAL (Table 10), several facts can be highlighted. First, after increasing in numbers during the first decades, in 2010 there was a decline in the number of total, urban, and rural poor. Second, the number of urban poor in the region has exceeded the rural poor since the 1990s. Third, rural poverty has been declining as a percentage of total poverty and, in 2010, represented only one-third of that total.
Although poverty in LAC is two-thirds urban, still the percentage of rural poverty among the rural population (also called the incidence of rural poverty) remains above urban levels. Also, the incidence of poverty is higher among the indigenous population, and among households that depend on agricultural income or on government transfers (CEPAL/FAO/IICA, 2012).
The decline in poverty during the last decade has been related to higher economic growth but also to the implementation, since the second half of the 1990s, of a new type of program called cash-transfers. Those programs appear to have had positive impacts on local activity and short-term growth, and on the accumulation of physical capital and formation of human capital.
Table 10. Poverty in LACa (millions of people).
Total Urban Rural Rural poverty as % of total
1980 144 69 74 51
1990 210 127 83 40
2000 225 144 79 35
2010 193 129 63 33
From Trigo (2012).a This includes the following countries: Argentina, Bolivia, Brazil, Chile, Colombia, Costa Rica, Ecuador, El Salvador,
Guatemala, Honduras, Mexico, Nicaragua, Panama, Paraguay, Peru, the Dominican Republic, Uruguay, and Venezuela.

15
With regard to food security, LAC also shows somewhat better indicators than other developing regions (see for instance the cluster analysis of 167 developed and developing countries in Díaz-Bonilla et al., 2006, and the Global Hunger Index calculated by the International Food Policy Research Institute (IFPRI), Concern Worldwide, and Welthungerhilfe and Green Scenery).
However, the decline in poverty and food insecurity in the region has also been accompanied by problems of excess weight and obesity. This has been called the “double burden” of malnutrition, in which hunger, due to a lack of calories and deficiencies in the intake of key nutrients,23 coexists with excess consumption of sugar, fats, and salt, leading to diabetes, hypertension, and heart disease problems (FAO, 2006; Pinstrup-Andersen, 2011). This may happen even within the same families, as analyzed by Garret and Ruel (2003).
Other indicators also merit attention. Since the 1960s, the average inhabitant of LAC countries has added 18 years to life expectancy (reaching 74 years at the end of the 2000s) and achieved 91% literacy (the world added 17 years, reaching 70 years of life expectancy, and had an average literacy rate of 83%).
LAC is the most urbanized region in the world, even surpassing recently developed countries’ rate of urbanization: the percentage of the urban population increased from 53% in the 1960s to 79% in 2010 (changes globally were from 34% to about 50% during the same period; the current urbanization rate in developed countries is 77%).
Some Final Comments
The previous historical overview shows that LAC faces complex challenges for agricultural development and the related R&D activities. The region plays a dual role by contributing to both food security and environmental sustainability at the national and global levels. The trade-offs mentioned between contributing to global, regional, and national food security and environmental public goods involve multiple dimensions. To play that role effectively, R&D activities are and will be crucial. But, technological levels vary significantly between and within countries and across the variety of producers groups. Agricultural R&D in LAC must include, but also go beyond, a limited focus on staple crops produced mainly by small and family farms if the most pressing concerns for food security and environmental sustainability playing out in the region are to be addressed.
23 Lack of calories and nutrient deficiencies can be considered as two separate issues. In fact, Per Pinstrup-Andersen (2011) refers to the “triple burden” of malnutrition, differentiating between these two very different problems.
16
Strategic Dimensions and Trends
The large period of world integration (final decades of the 19th century) contributed to faster world growth. LAC benefited from the expansion of trade and investments,24 growing about 1.8% per capita annually between 1900 and 1913, and integrating within the global economy as a supplier of primary commodities. However, the two world wars and the Great Depression interrupted that period and the region slowed down significantly (Díaz-Bonilla et al., 2013).
After World War II (WWII), with a new architecture for international economic governance (based on the Bretton Woods agreement) that fostered increasing global economic integration,25 the world economy accelerated to about 2.2% per capita in the period 1950−2010. LAC’s per-capita growth was about 1.8%. Particularly in the last decade, and after recovering from the debt crisis of the 1980s, the region benefited from the integration in the world economy of the Asian countries, especially China, as consumers of agricultural and food products and other commodities.
An important question for the future is whether this process of global economic integration, which has supported higher world growth during the last
decades, will continue or eventually may stop or even be reversed. If that is the case, the high global growth experienced recently may not be sustained, which will affect LAC’s growth and its agricultural sector (Spence, 2011; Dadush and Shaw, 2011).
Some of the doubts about the future of global integration and global governance are of a relatively shorter term nature, and they relate to the impact of the current financial crisis on public debt sustainability and the strength of financial institutions in developed countries. Both aspects are interrelated, because, on the one hand, the public sector is the final guarantor of financial stability (including the guarantee on bank deposits), and, on the other hand, the financial sector is an important holder of public debt (and its own stability would be affected by fiscal problems that impair public debt valuations). Another round of world economic turmoil will negatively affect LAC (it must be remembered that, during the 2009 crisis, while the world economy declined by 0.6%, LAC’s growth dropped by 1.5% (-1.5%).
A second and more general issue is the evolution of global economic imbalances and the potential for currency and trade conflicts.26 A key global policy question is which international arrangements or institutions can coordinate a cooperative solution to the current economic problems and potentially prevent the kinds of trade and financial imbalances that caused the current crisis? Although there have been some improvements in redressing current global imbalances (which are linked in part to the U.S. dollar as the main global currency for trade and investment and to the U.S. consumer as “the buyer of last resort”), the disequilibrium in current accounts is still high (although smaller than at the peak in 2006–08) (see, for instance, Obstfeld, 2012; and IMF, 2012). A more profound restructuring of global financial and macro-economic institutions may be needed, including the adoption of a truly universal currency based on, but likely going beyond, the Special Drawings Rights (SDRs) issued by the International Monetary Fund (IMF). The correction of these global imbalances also has an important
24 The LAC countries with data for that period are Argentina, Brazil, Chile, Colombia, Mexico, Peru, Uruguay, and Venezuela. 25 For instance, foreign direct investment (FDI) as a percentage of world GDP moved from about 0.5% in the 1970s to more than 4% in the last
two cycles of international capital flows. Trade (exports plus imports) as a percentage of the world GDP also increased from about 25% in the 1960s to almost 40% in the 1980s and early 1990s, but then jumped to 60% until the current crisis reduced that percentage.
26 The minister of finance from Brazil has recently referred to “currency wars,” a term that has been popularized by the economic press.
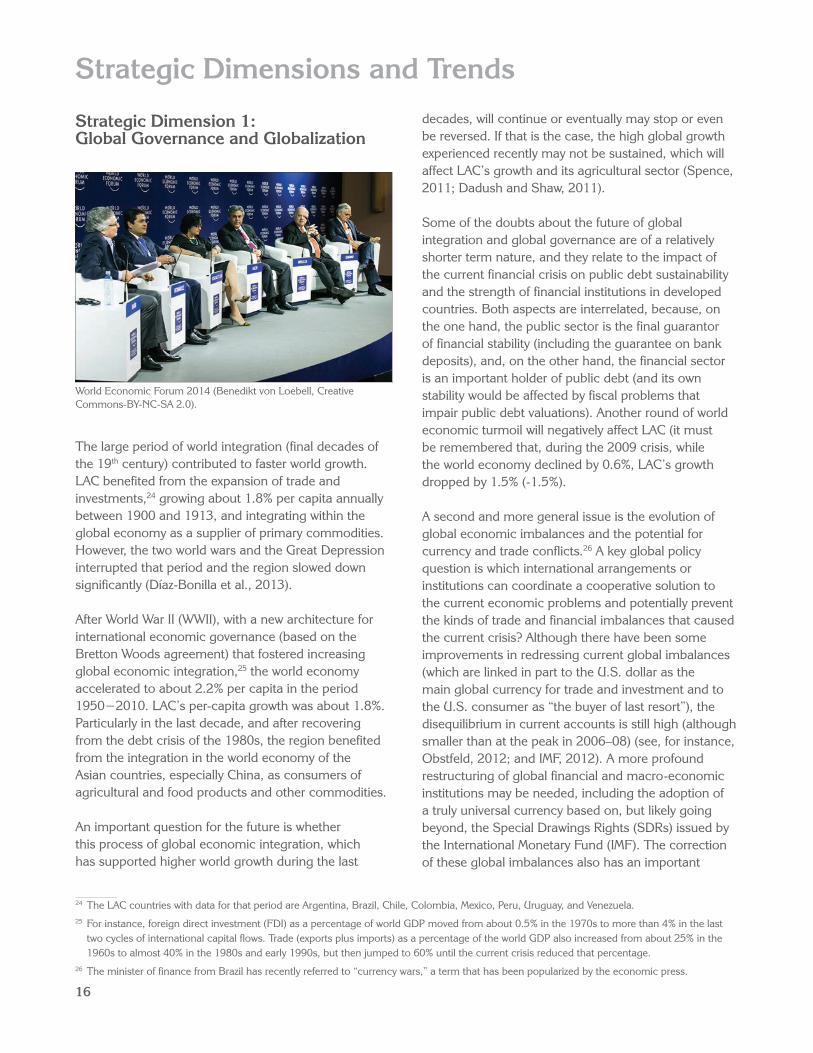
Strategic Dimension 1: Global Governance and Globalization
World Economic Forum 2014 (Benedikt von Loebell, Creative Commons-BY-NC-SA 2.0).
17
geopolitical component related to the changing relative positions between developed and large and fast-growing developing countries, particularly in Asia. In that context, how the U.S. and China manage their bilateral relations has global implications. A proper resolution of these issues is crucial for growth and poverty alleviation in many developing countries, including those in LAC whose exports have been helped by the current configuration of world integration.
The third main global issue is related to the evolution of the energy matrix and climate change negotiations. The interaction among energy, agriculture, the resource base, climate change, and the environment poses major longer term challenges. Potential imbalances loom in world energy markets in the coming years (see the sections on energy and climate change below), and the implications of energy consumption for climate change may have significant consequences for the world in the medium to long term. The complex issues linking energy use, economic development, poverty alleviation, and climate change are also affected by a market coordination failure of global proportions, which, like the macro-economic global imbalances, lacks a widely accepted and truly operational international mechanism for resolution, and is immersed as well in the geopolitical rebalancing taking place globally. LAC, as a supplier of both global environmental public goods and food and energy products, will be deeply affected by whether those issues are managed in a coordinated or fractured manner globally.
The architecture that was created by the industrialized countries after WWII is challenged by the emergence of new power centers among developing countries: witness the replacement of the G-7 by the G-20, which originally included the participation of finance ministers and central bank governors only but has evolved since the crisis into a global policy-coordinating body involving presidents and heads of states. At the same time, the difficulties of this last group to operate adequately, after the initial coordinated response in 2008−09, indicate that, although the old system of global governance and coordination may not be working properly, there has not yet emerged a functioning new system to replace it. Again, the evolution of U.S. and China bilateral relations will have major implications for the resolution of those issues, including for LAC, whose growth in the last decades has been supported by the increasing integration of the world economy and a particular configuration of trade and investment flows, which, as in the period before
WWI, increased demand for many of the region’s export goods.
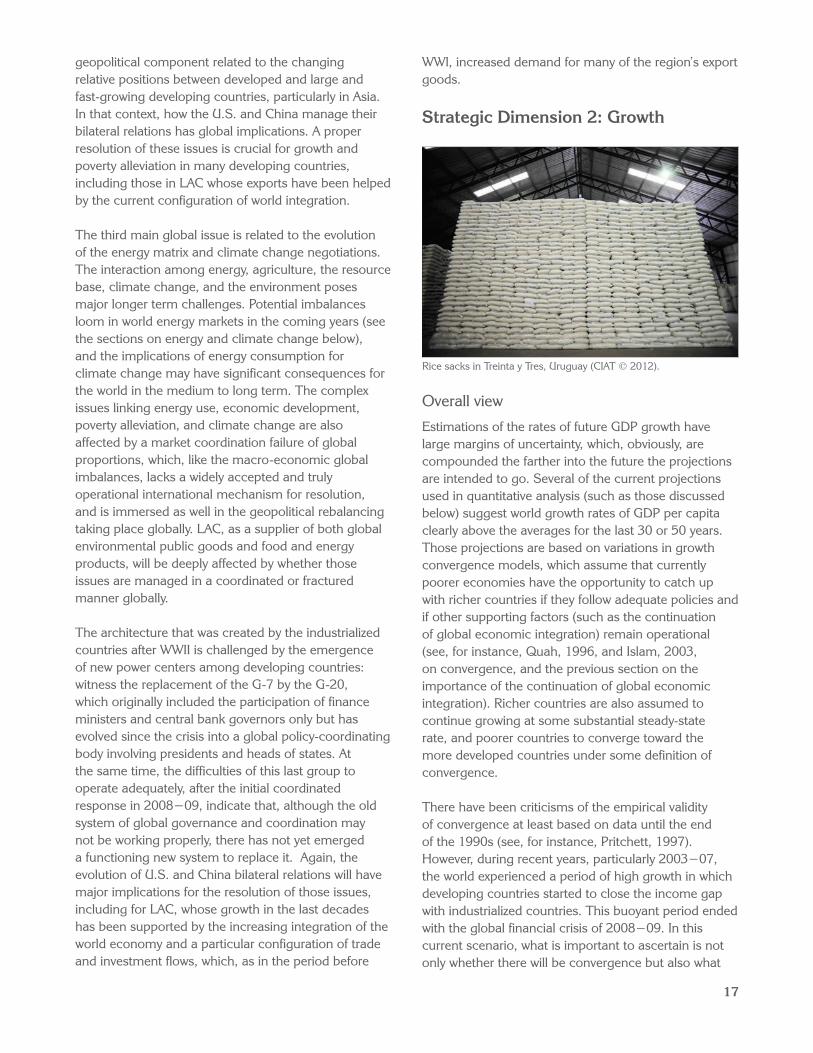
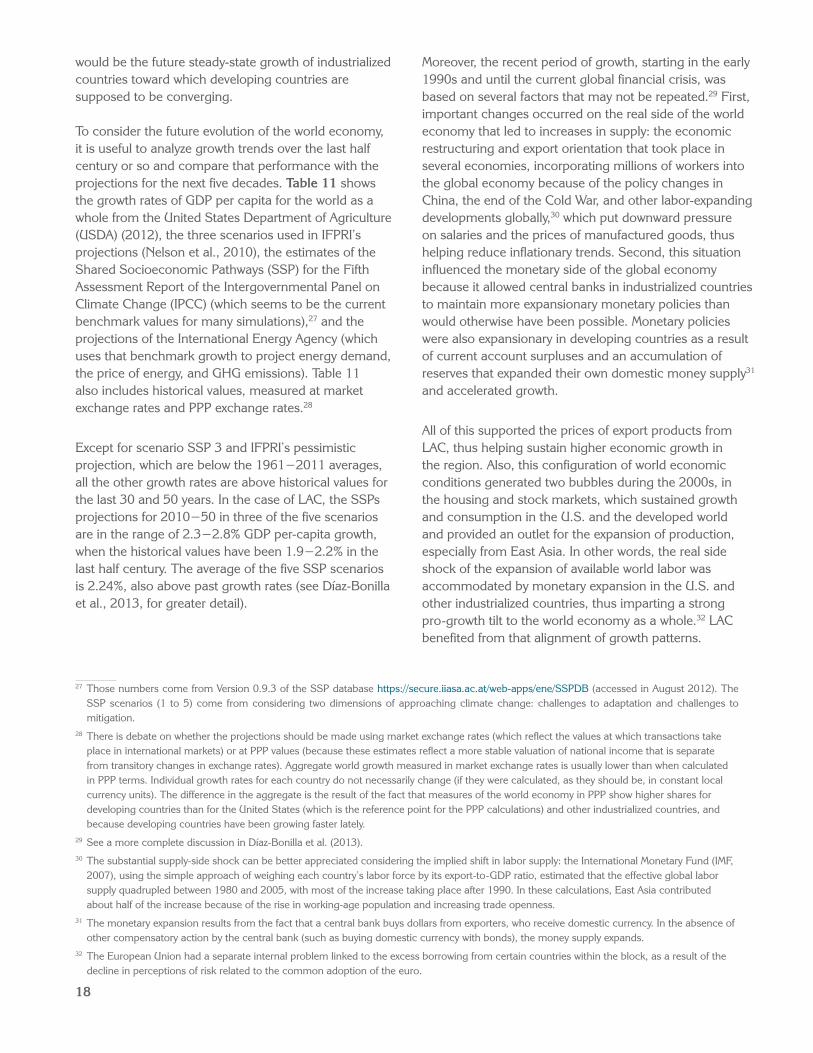
Strategic Dimension 2: Growth
Overall view
Estimations of the rates of future GDP growth have large margins of uncertainty, which, obviously, are compounded the farther into the future the projections are intended to go. Several of the current projections used in quantitative analysis (such as those discussed below) suggest world growth rates of GDP per capita clearly above the averages for the last 30 or 50 years. Those projections are based on variations in growth convergence models, which assume that currently poorer economies have the opportunity to catch up with richer countries if they follow adequate policies and if other supporting factors (such as the continuation of global economic integration) remain operational (see, for instance, Quah, 1996, and Islam, 2003, on convergence, and the previous section on the importance of the continuation of global economic integration). Richer countries are also assumed to continue growing at some substantial steady-state rate, and poorer countries to converge toward the more developed countries under some definition of convergence.
There have been criticisms of the empirical validity of convergence at least based on data until the end of the 1990s (see, for instance, Pritchett, 1997). However, during recent years, particularly 2003−07, the world experienced a period of high growth in which developing countries started to close the income gap with industrialized countries. This buoyant period ended with the global financial crisis of 2008−09. In this current scenario, what is important to ascertain is not only whether there will be convergence but also what
Rice sacks in Treinta y Tres, Uruguay (CIAT © 2012).
18
would be the future steady-state growth of industrialized countries toward which developing countries are supposed to be converging.
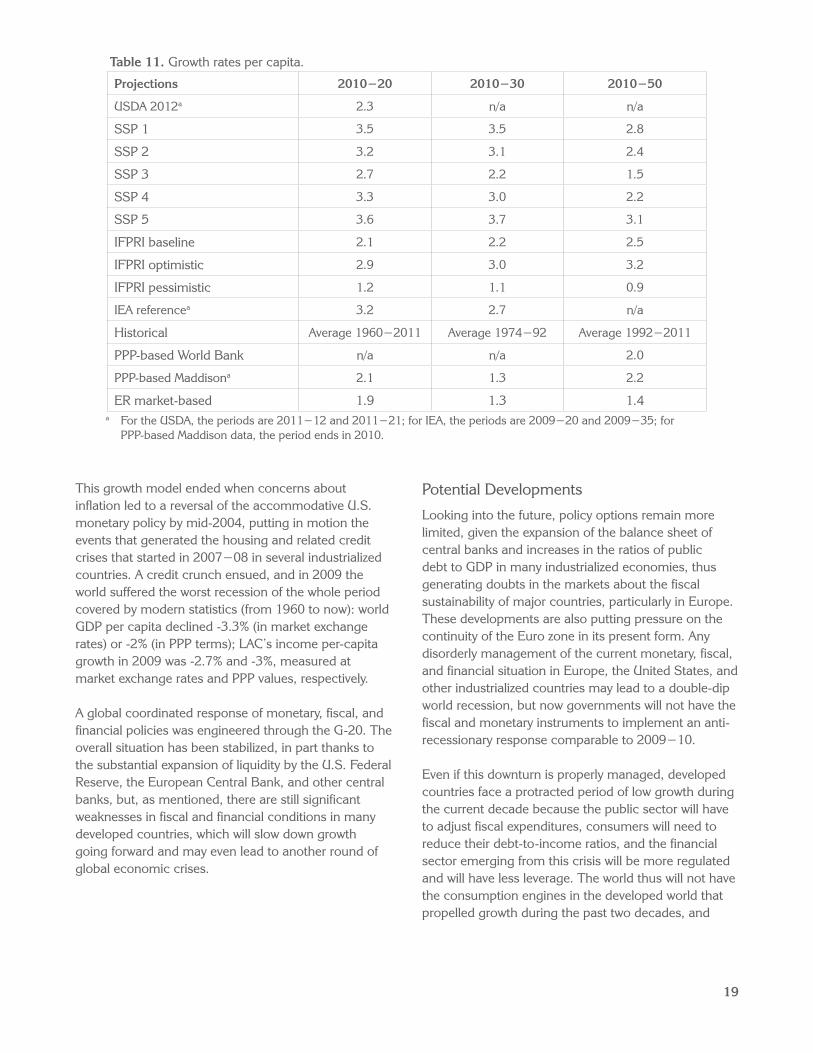
To consider the future evolution of the world economy, it is useful to analyze growth trends over the last half century or so and compare that performance with the projections for the next five decades. Table 11 shows the growth rates of GDP per capita for the world as a whole from the United States Department of Agriculture (USDA) (2012), the three scenarios used in IFPRI’s projections (Nelson et al., 2010), the estimates of the Shared Socioeconomic Pathways (SSP) for the Fifth Assessment Report of the Intergovernmental Panel on Climate Change (IPCC) (which seems to be the current benchmark values for many simulations),27 and the projections of the International Energy Agency (which uses that benchmark growth to project energy demand, the price of energy, and GHG emissions). Table 11 also includes historical values, measured at market exchange rates and PPP exchange rates.28
Except for scenario SSP 3 and IFPRI’s pessimistic projection, which are below the 1961−2011 averages, all the other growth rates are above historical values for the last 30 and 50 years. In the case of LAC, the SSPs projections for 2010−50 in three of the five scenarios are in the range of 2.3−2.8% GDP per-capita growth, when the historical values have been 1.9−2.2% in the last half century. The average of the five SSP scenarios is 2.24%, also above past growth rates (see Díaz-Bonilla et al., 2013, for greater detail).
27 Those numbers come from Version 0.9.3 of the SSP database https://secure.iiasa.ac.at/web-apps/ene/SSPDB (accessed in August 2012). The SSP scenarios (1 to 5) come from considering two dimensions of approaching climate change: challenges to adaptation and challenges to mitigation.
28 There is debate on whether the projections should be made using market exchange rates (which reflect the values at which transactions take place in international markets) or at PPP values (because these estimates reflect a more stable valuation of national income that is separate from transitory changes in exchange rates). Aggregate world growth measured in market exchange rates is usually lower than when calculated in PPP terms. Individual growth rates for each country do not necessarily change (if they were calculated, as they should be, in constant local currency units). The difference in the aggregate is the result of the fact that measures of the world economy in PPP show higher shares for developing countries than for the United States (which is the reference point for the PPP calculations) and other industrialized countries, and because developing countries have been growing faster lately.
29 See a more complete discussion in Díaz-Bonilla et al. (2013).30 The substantial supply-side shock can be better appreciated considering the implied shift in labor supply: the International Monetary Fund (IMF,
2007), using the simple approach of weighing each country’s labor force by its export-to-GDP ratio, estimated that the effective global labor supply quadrupled between 1980 and 2005, with most of the increase taking place after 1990. In these calculations, East Asia contributed about half of the increase because of the rise in working-age population and increasing trade openness.
31 The monetary expansion results from the fact that a central bank buys dollars from exporters, who receive domestic currency. In the absence of other compensatory action by the central bank (such as buying domestic currency with bonds), the money supply expands.
32 The European Union had a separate internal problem linked to the excess borrowing from certain countries within the block, as a result of the decline in perceptions of risk related to the common adoption of the euro.
Moreover, the recent period of growth, starting in the early 1990s and until the current global financial crisis, was based on several factors that may not be repeated.29 First, important changes occurred on the real side of the world economy that led to increases in supply: the economic restructuring and export orientation that took place in several economies, incorporating millions of workers into the global economy because of the policy changes in China, the end of the Cold War, and other labor-expanding developments globally,30 which put downward pressure on salaries and the prices of manufactured goods, thus helping reduce inflationary trends. Second, this situation influenced the monetary side of the global economy because it allowed central banks in industrialized countries to maintain more expansionary monetary policies than would otherwise have been possible. Monetary policies were also expansionary in developing countries as a result of current account surpluses and an accumulation of reserves that expanded their own domestic money supply31 and accelerated growth.
All of this supported the prices of export products from LAC, thus helping sustain higher economic growth in the region. Also, this configuration of world economic conditions generated two bubbles during the 2000s, in the housing and stock markets, which sustained growth and consumption in the U.S. and the developed world and provided an outlet for the expansion of production, especially from East Asia. In other words, the real side shock of the expansion of available world labor was accommodated by monetary expansion in the U.S. and other industrialized countries, thus imparting a strong pro-growth tilt to the world economy as a whole.32 LAC benefited from that alignment of growth patterns.
19
Table 11. Growth rates per capita.
Projections 2010−20 2010−30 2010−50
USDA 2012a 2.3 n/a n/a
SSP 1 3.5 3.5 2.8
SSP 2 3.2 3.1 2.4
SSP 3 2.7 2.2 1.5
SSP 4 3.3 3.0 2.2
SSP 5 3.6 3.7 3.1
IFPRI baseline 2.1 2.2 2.5
IFPRI optimistic 2.9 3.0 3.2
IFPRI pessimistic 1.2 1.1 0.9
IEA referencea 3.2 2.7 n/a
Historical Average 1960−2011 Average 1974−92 Average 1992−2011
PPP-based World Bank n/a n/a 2.0
PPP-based Maddisona 2.1 1.3 2.2
ER market-based 1.9 1.3 1.4a For the USDA, the periods are 2011−12 and 2011−21; for IEA, the periods are 2009−20 and 2009−35; for
PPP-based Maddison data, the period ends in 2010.
This growth model ended when concerns about inflation led to a reversal of the accommodative U.S. monetary policy by mid-2004, putting in motion the events that generated the housing and related credit crises that started in 2007−08 in several industrialized countries. A credit crunch ensued, and in 2009 the world suffered the worst recession of the whole period covered by modern statistics (from 1960 to now): world GDP per capita declined -3.3% (in market exchange rates) or -2% (in PPP terms); LAC’s income per-capita growth in 2009 was -2.7% and -3%, measured at market exchange rates and PPP values, respectively.
A global coordinated response of monetary, fiscal, and financial policies was engineered through the G-20. The overall situation has been stabilized, in part thanks to the substantial expansion of liquidity by the U.S. Federal Reserve, the European Central Bank, and other central banks, but, as mentioned, there are still significant weaknesses in fiscal and financial conditions in many developed countries, which will slow down growth going forward and may even lead to another round of global economic crises.
Potential Developments
Looking into the future, policy options remain more limited, given the expansion of the balance sheet of central banks and increases in the ratios of public debt to GDP in many industrialized economies, thus generating doubts in the markets about the fiscal sustainability of major countries, particularly in Europe. These developments are also putting pressure on the continuity of the Euro zone in its present form. Any disorderly management of the current monetary, fiscal, and financial situation in Europe, the United States, and other industrialized countries may lead to a double-dip world recession, but now governments will not have the fiscal and monetary instruments to implement an anti-recessionary response comparable to 2009−10.
Even if this downturn is properly managed, developed countries face a protracted period of low growth during the current decade because the public sector will have to adjust fiscal expenditures, consumers will need to reduce their debt-to-income ratios, and the financial sector emerging from this crisis will be more regulated and will have less leverage. The world thus will not have the consumption engines in the developed world that propelled growth during the past two decades, and
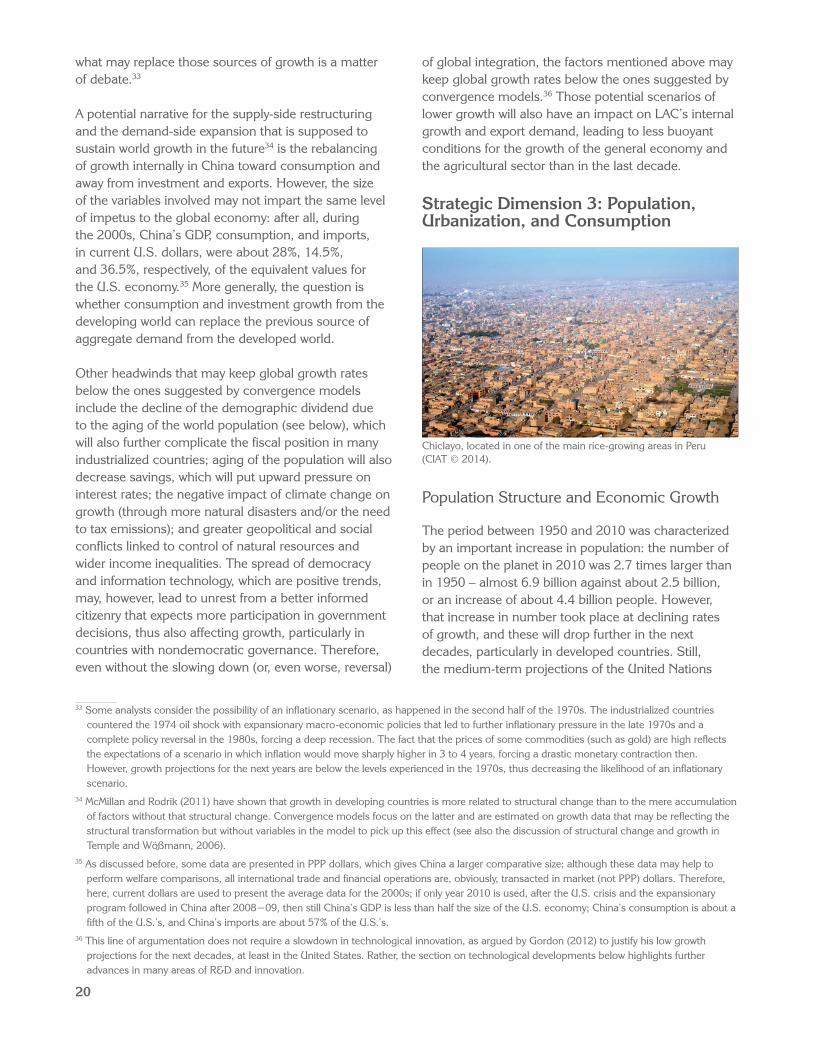
20
33 Some analysts consider the possibility of an inflationary scenario, as happened in the second half of the 1970s. The industrialized countries countered the 1974 oil shock with expansionary macro-economic policies that led to further inflationary pressure in the late 1970s and a complete policy reversal in the 1980s, forcing a deep recession. The fact that the prices of some commodities (such as gold) are high reflects the expectations of a scenario in which inflation would move sharply higher in 3 to 4 years, forcing a drastic monetary contraction then. However, growth projections for the next years are below the levels experienced in the 1970s, thus decreasing the likelihood of an inflationary scenario.
34 McMillan and Rodrik (2011) have shown that growth in developing countries is more related to structural change than to the mere accumulation of factors without that structural change. Convergence models focus on the latter and are estimated on growth data that may be reflecting the structural transformation but without variables in the model to pick up this effect (see also the discussion of structural change and growth in Temple and Wößmann, 2006).
35 As discussed before, some data are presented in PPP dollars, which gives China a larger comparative size; although these data may help to perform welfare comparisons, all international trade and financial operations are, obviously, transacted in market (not PPP) dollars. Therefore, here, current dollars are used to present the average data for the 2000s; if only year 2010 is used, after the U.S. crisis and the expansionary program followed in China after 2008−09, then still China’s GDP is less than half the size of the U.S. economy; China’s consumption is about a fifth of the U.S.’s, and China’s imports are about 57% of the U.S.’s.
36 This line of argumentation does not require a slowdown in technological innovation, as argued by Gordon (2012) to justify his low growth projections for the next decades, at least in the United States. Rather, the section on technological developments below highlights further advances in many areas of R&D and innovation.
what may replace those sources of growth is a matter of debate.33
A potential narrative for the supply-side restructuring and the demand-side expansion that is supposed to sustain world growth in the future34 is the rebalancing of growth internally in China toward consumption and away from investment and exports. However, the size of the variables involved may not impart the same level of impetus to the global economy: after all, during the 2000s, China’s GDP, consumption, and imports, in current U.S. dollars, were about 28%, 14.5%, and 36.5%, respectively, of the equivalent values for the U.S. economy.35 More generally, the question is whether consumption and investment growth from the developing world can replace the previous source of aggregate demand from the developed world.
Other headwinds that may keep global growth rates below the ones suggested by convergence models include the decline of the demographic dividend due to the aging of the world population (see below), which will also further complicate the fiscal position in many industrialized countries; aging of the population will also decrease savings, which will put upward pressure on interest rates; the negative impact of climate change on growth (through more natural disasters and/or the need to tax emissions); and greater geopolitical and social conflicts linked to control of natural resources and wider income inequalities. The spread of democracy and information technology, which are positive trends, may, however, lead to unrest from a better informed citizenry that expects more participation in government decisions, thus also affecting growth, particularly in countries with nondemocratic governance. Therefore, even without the slowing down (or, even worse, reversal)
of global integration, the factors mentioned above may keep global growth rates below the ones suggested by convergence models.36 Those potential scenarios of lower growth will also have an impact on LAC’s internal growth and export demand, leading to less buoyant conditions for the growth of the general economy and the agricultural sector than in the last decade.
Strategic Dimension 3: Population, Urbanization, and Consumption
Chiclayo, located in one of the main rice-growing areas in Peru (CIAT © 2014).
Population Structure and Economic Growth
The period between 1950 and 2010 was characterized by an important increase in population: the number of people on the planet in 2010 was 2.7 times larger than in 1950 – almost 6.9 billion against about 2.5 billion, or an increase of about 4.4 billion people. However, that increase in number took place at declining rates of growth, and these will drop further in the next decades, particularly in developed countries. Still, the medium-term projections of the United Nations
21
calculate that the world may reach 8.3 billion in 2030 and 9.3 billion in 2050. The increase will happen basically in developing countries (representing 95% of the additional 2.4 billion people in 2050), although with different speeds in the various regions. The largest increases in population are projected to take place in Africa, which will surpass China in the middle of the 2020s and also overtake India sometime at the beginning of the 2030s. India, in turn, is also estimated to exceed China’s population earlier in the 2020s.
In 2050, the total population in Latin America is estimated at nearly 700 million, with an almost equal participation between men and women (Samaniego, 2012). All the Americas (i.e., including the U.S. and Canada) may reach a total population close to that of China at that time, suggesting an important demographic presence for the continent as a whole.
There will also be substantial changes in the structure of the population, as a result of dramatic reductions in birth and death rates, particularly in developing countries. The adjustments in the age structure of the population influence GDP growth: countries or regions whose middle-age segments (between 20 and 50 years) are expanding would benefit (other things being equal) from the positive impact on growth of what has been called the “demographic dividend” (see Bloom et al., 2001).
During 1980−2010, between 20–30% of the accumulated growth in most South American countries (except some with older demographic structures, such as Argentina) could be attributed to the demographic dividend (Samaniego, 2012). Countries, such as China, have enjoyed that dividend in recent decades, but this is changing and now the positive impact of the age structure will act in reverse with the aging of the population.37 India, on the other hand, will enjoy (potentially) a demographic dividend in the next decades (Wolf et al., 2011). Important segments of the world economy will enter into what has been called the phase of “aged economies,” defined as the situation in which a country devotes to the elderly population more resources than to children (Samaniego, 2012). The “aged economies” will dominate the world demography in the next decades, with important implications for growth, consumption patterns (see below), and other demographic dimensions.
Urbanization
Urbanization is a fundamental dimension of the demographic analysis, and it has implications for many other crucial issues, such as growth and productivity; governance; consumption of food, energy, and natural resources; and GHG emissions and environmental sustainability (see, for instance, Erdmann, 2012). Cities now occupy around 3% of the Earth but they accommodate about half the world’s population and account for more than two-thirds of the total energy use and GHG emissions (Samaniego, 2012). In fact, in 2007, for the first time in world history, the total urban population exceeded the number of those living in rural areas (see The World Bank, 2012). The trend toward increased urbanization is projected to continue although with differences between countries and regions.
In past decades, the trend toward increased urbanization was more accentuated in several countries of LAC and the Middle East. Notwithstanding the current high percentages of urbanization in LAC, those rates will further increase in the following decades (to about 85% by 2030 from close to 80% now), particularly in Argentina, Brazil, Chile, and Mexico, followed by Colombia and Ecuador (while in Central America and Bolivia and Paraguay the process will be slower) (Samaniego, 2012).
Urbanization presents challenges and opportunities for agriculture and food security in LAC. On the one hand, population growth and urban sprawl will continue to increase the proportion of poverty belts and gaps in living conditions and basic needs, such as access to drinking water, housing, and sanitation services. Approximately 23% of the urban residents in LAC are now in this situation (Samaniego, 2012). As noted before, poverty is, in numbers, an urban problem in LAC, even though rural areas, depending on the country, suffer from larger incidence and severity of poverty. A corollary is that, considering sheer numbers, food security concerns in LAC are and will continue to be mostly in urban areas, but, at the same time, specific rural programs are also required in places where the incidence and severity of poverty may be significant. Also, urban centers will place increasing demands on water, agricultural land, energy resources, and waste disposal.
37 In fact, recent data from the National Bureau of Statistics of China indicates that population in the working-age bracket of 15–59 decreased in 2012 by almost 3.5 million (for a total of about 937 million) (“China’s Economy Achieved a Stabilized and Accelerated Development in the Year 2012,” National Bureau of Statistics of China. 18 January 2013. www.stats.gov.cn/english/pressrelease/t20130118_402867147.htm). This is the first such decline in modern Chinese history, reaching a turning point that was expected to happen later, on, or after 2015.
22
On the other hand, urban centers also represent opportunities to the extent that they are the locus of most economic growth and creativity, and new technologies are being deployed to improve welfare and to use scarce resources more efficiently (Erdmann, 2012). For agriculture and food production, urban centers represent the consolidation and centralization of places of increasing demand by expanding middle classes, and they provide market opportunities that disperse rural populations cannot offer.
Consumption Patterns
Usually, economic analysis of food demand is linked to income, prices, and urbanization trends. But, other aspects such as marketing policies and the expansion of supermarkets, health concerns, and social and ethical values (e.g., organic and sustainable production, animal welfare, and religious beliefs, such as those related to beef or pork consumption in some countries) influence consumption patterns as well (see Foresight, 2011e). Also, there is a related tendency in some countries toward public policies fostering diets that are healthy and sustainable, although the definitions tend to diverge, especially about sustainability, for which the economic, social, and environmental aspects may point in different directions (Foresight, 2011e).
Some countries have issued guidelines that may eventually change the patterns of food consumption, particularly regarding red meats, foods that are transported by air, and/or products derived from methods with high fuel inputs and low feed conversion (see Foresight, 2011e). The link of obesity to diabetes, hypertension, and heart disease, has led to policy proposals in developed countries to tax products associated with people’s excess weight. At the same time, in developing countries, it has increased the recognition of the “double burden” of malnutrition, of which both under- and over-nutrition may coexist even within the same families (see the study by Garret and Ruel, 2003, already mentioned).
Within that context, projections of meat consumption pose special problems, in both developed and developing countries. It is difficult to determine whether cultural differences will maintain intakes low in several populous developing countries or there will be a stronger convergence to higher consumption (Foresight, 2011b;
Zahniser, 2012; see the alternative projections in Msangi and Rosegrant, 2011). This is particularly important for LAC, which is a major exporter of animal feed and whose livestock sector has a larger incidence in total agricultural production than in other regions.
Concerns about food waste will have an impact on food demand as well (Foresight, 2011d). Waste and losses are influenced by global drivers, such as urbanization (which requires that food supply chains be extended to feed urban populations); the dietary transition from consumption of less perishable starchy food staples and toward a diet with more perishable products, such as fresh fruits and vegetables, dairy, meat, and fish; and the expansion of international trade in food products (which further extends the length of the food supply chains) (Foresight, 2011d). If waste is assumed to reach 30% of total food and by 2050 the usually quoted expansion of 70% of food production would be needed to feed the growing population, then halving that waste by 2050 would contribute about 25% of today’s production (Foresight, 2011d).
Of course, much of the waste to be avoided would come from private-sector decisions (mainly in the food chain beyond the farm and closer to the final consumer) and/or public-sector investments unrelated to agricultural R&D as such. But, a strong effort to reduce waste might then mitigate the imperative for R&D to increase production in the agricultural and food sector.
It must be emphasized that the sources of waste and the place in the food chain differ significantly between developed and developing countries. In the first case, they occur more at the level of the end-user (related in many cases to private-sector standards and consumer choices); in the second case, losses happen mostly between harvest and processing (usually because of a lack of infrastructure) (see Foresight, 2011e).38
Another aspect relates to the composition of age and gender of the population to project future demand. Most exercises generally assume a relatively stable demographic structure; however, as discussed before, that age structure is changing, particularly in systemically important countries, such as China (Zhong et al., 2012). Aging of the population would imply that per-capita calorie intake may not be growing as fast as simply a
38 A recent study by the Asian Development Bank and IFPRI (Reardon et al., 2012) on food value chains for rice and potatoes in Bangladesh, China, and India, has shown that, contrary to common perception, waste (at least for those staple crops) does not seem that important (between 1–7% of physical wastage against usual estimates of 30-40%). This appears to be the result of better infrastructure (cold storage and road infrastructure) and the spread of mobile phones. There are no similar detailed analyses for other products and countries.
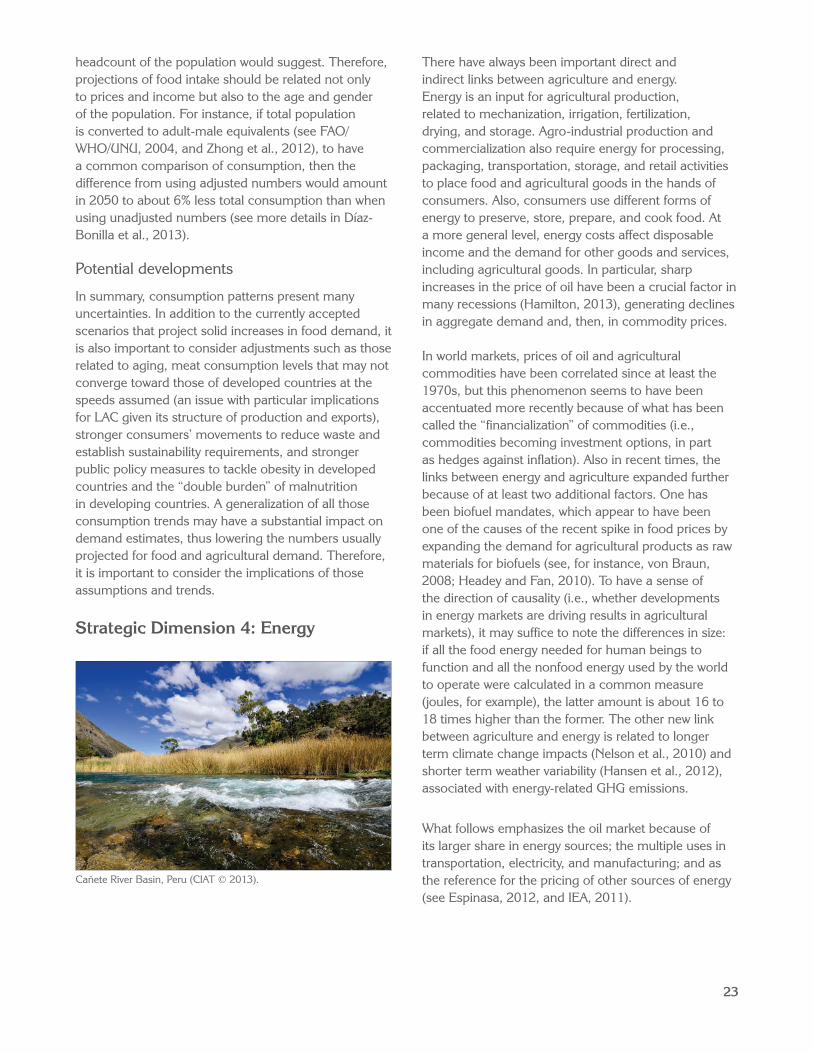
23
headcount of the population would suggest. Therefore, projections of food intake should be related not only to prices and income but also to the age and gender of the population. For instance, if total population is converted to adult-male equivalents (see FAO/WHO/UNU, 2004, and Zhong et al., 2012), to have a common comparison of consumption, then the difference from using adjusted numbers would amount in 2050 to about 6% less total consumption than when using unadjusted numbers (see more details in Díaz-Bonilla et al., 2013).
Potential developments
In summary, consumption patterns present many uncertainties. In addition to the currently accepted scenarios that project solid increases in food demand, it is also important to consider adjustments such as those related to aging, meat consumption levels that may not converge toward those of developed countries at the speeds assumed (an issue with particular implications for LAC given its structure of production and exports), stronger consumers’ movements to reduce waste and establish sustainability requirements, and stronger public policy measures to tackle obesity in developed countries and the “double burden” of malnutrition in developing countries. A generalization of all those consumption trends may have a substantial impact on demand estimates, thus lowering the numbers usually projected for food and agricultural demand. Therefore, it is important to consider the implications of those assumptions and trends.
Strategic Dimension 4: Energy
There have always been important direct and indirect links between agriculture and energy. Energy is an input for agricultural production, related to mechanization, irrigation, fertilization, drying, and storage. Agro-industrial production and commercialization also require energy for processing, packaging, transportation, storage, and retail activities to place food and agricultural goods in the hands of consumers. Also, consumers use different forms of energy to preserve, store, prepare, and cook food. At a more general level, energy costs affect disposable income and the demand for other goods and services, including agricultural goods. In particular, sharp increases in the price of oil have been a crucial factor in many recessions (Hamilton, 2013), generating declines in aggregate demand and, then, in commodity prices.
In world markets, prices of oil and agricultural commodities have been correlated since at least the 1970s, but this phenomenon seems to have been accentuated more recently because of what has been called the “financialization” of commodities (i.e., commodities becoming investment options, in part as hedges against inflation). Also in recent times, the links between energy and agriculture expanded further because of at least two additional factors. One has been biofuel mandates, which appear to have been one of the causes of the recent spike in food prices by expanding the demand for agricultural products as raw materials for biofuels (see, for instance, von Braun, 2008; Headey and Fan, 2010). To have a sense of the direction of causality (i.e., whether developments in energy markets are driving results in agricultural markets), it may suffice to note the differences in size: if all the food energy needed for human beings to function and all the nonfood energy used by the world to operate were calculated in a common measure (joules, for example), the latter amount is about 16 to 18 times higher than the former. The other new link between agriculture and energy is related to longer term climate change impacts (Nelson et al., 2010) and shorter term weather variability (Hansen et al., 2012), associated with energy-related GHG emissions.
What follows emphasizes the oil market because of its larger share in energy sources; the multiple uses in transportation, electricity, and manufacturing; and as the reference for the pricing of other sources of energy (see Espinasa, 2012, and IEA, 2011).
Cañete River Basin, Peru (CIAT © 2013).
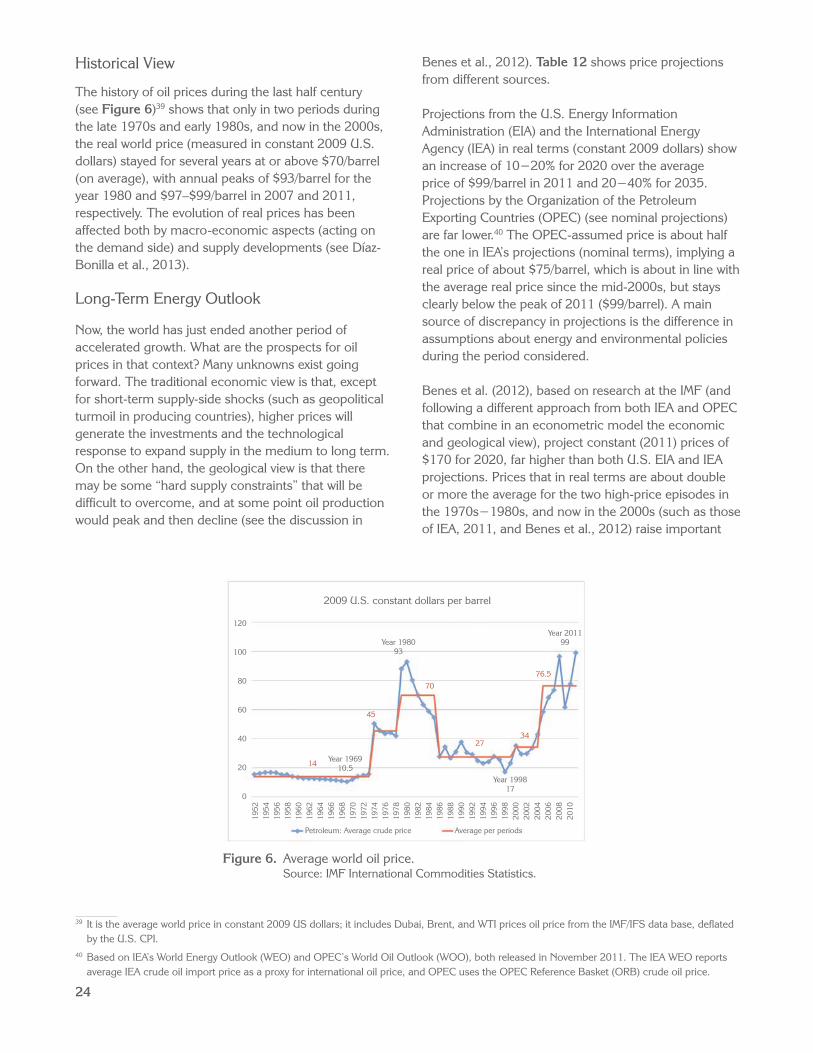
24
Historical View
The history of oil prices during the last half century (see Figure 6)39 shows that only in two periods during the late 1970s and early 1980s, and now in the 2000s, the real world price (measured in constant 2009 U.S. dollars) stayed for several years at or above $70/barrel (on average), with annual peaks of $93/barrel for the year 1980 and $97–$99/barrel in 2007 and 2011, respectively. The evolution of real prices has been affected both by macro-economic aspects (acting on the demand side) and supply developments (see Díaz-Bonilla et al., 2013).
Long-Term Energy Outlook
Now, the world has just ended another period of accelerated growth. What are the prospects for oil prices in that context? Many unknowns exist going forward. The traditional economic view is that, except for short-term supply-side shocks (such as geopolitical turmoil in producing countries), higher prices will generate the investments and the technological response to expand supply in the medium to long term. On the other hand, the geological view is that there may be some “hard supply constraints” that will be difficult to overcome, and at some point oil production would peak and then decline (see the discussion in
Benes et al., 2012). Table 12 shows price projections from different sources.
Projections from the U.S. Energy Information Administration (EIA) and the International Energy Agency (IEA) in real terms (constant 2009 dollars) show an increase of 10−20% for 2020 over the average price of $99/barrel in 2011 and 20−40% for 2035. Projections by the Organization of the Petroleum Exporting Countries (OPEC) (see nominal projections) are far lower.40 The OPEC-assumed price is about half the one in IEA’s projections (nominal terms), implying a real price of about $75/barrel, which is about in line with the average real price since the mid-2000s, but stays clearly below the peak of 2011 ($99/barrel). A main source of discrepancy in projections is the difference in assumptions about energy and environmental policies during the period considered.
Benes et al. (2012), based on research at the IMF (and following a different approach from both IEA and OPEC that combine in an econometric model the economic and geological view), project constant (2011) prices of $170 for 2020, far higher than both U.S. EIA and IEA projections. Prices that in real terms are about double or more the average for the two high-price episodes in the 1970s−1980s, and now in the 2000s (such as those of IEA, 2011, and Benes et al., 2012) raise important
39 It is the average world price in constant 2009 US dollars; it includes Dubai, Brent, and WTI prices oil price from the IMF/IFS data base, deflated by the U.S. CPI.
40 Based on IEA’s World Energy Outlook (WEO) and OPEC’s World Oil Outlook (WOO), both released in November 2011. The IEA WEO reports average IEA crude oil import price as a proxy for international oil price, and OPEC uses the OPEC Reference Basket (ORB) crude oil price.
2009 U.S. constant dollars per barrel
120
100
80
60
40
20
0
1952
1954
1956
1958
1960
1962
1964
1966
1968
1970
1972
1974
1976
1978
1980
1982
1984
1986
1988
1990
1992
1994
1996
1998
2000
2002
2004
2006
2008
2010
14
45
70
2734
76.5
Year 196910.5
Year 199817
Year 198093
Year 201199
Petroleum: Average crude price Average per periods
Figure 6. Average world oil price. Source: IMF International Commodities Statistics.
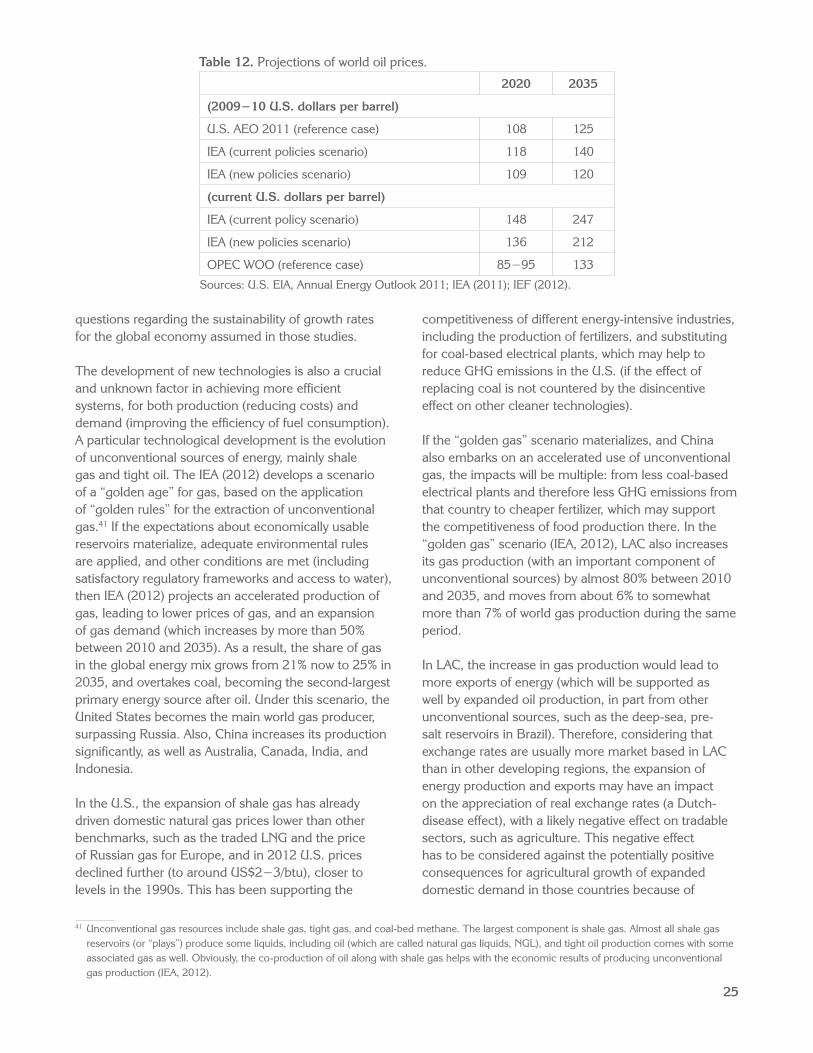
25
Table 12. Projections of world oil prices.
2020 2035
(2009−10 U.S. dollars per barrel)
U.S. AEO 2011 (reference case) 108 125
IEA (current policies scenario) 118 140
IEA (new policies scenario) 109 120
(current U.S. dollars per barrel)
IEA (current policy scenario) 148 247
IEA (new policies scenario) 136 212
OPEC WOO (reference case) 85−95 133
Sources: U.S. EIA, Annual Energy Outlook 2011; IEA (2011); IEF (2012).
questions regarding the sustainability of growth rates for the global economy assumed in those studies.
The development of new technologies is also a crucial and unknown factor in achieving more efficient systems, for both production (reducing costs) and demand (improving the efficiency of fuel consumption). A particular technological development is the evolution of unconventional sources of energy, mainly shale gas and tight oil. The IEA (2012) develops a scenario of a “golden age” for gas, based on the application of “golden rules” for the extraction of unconventional gas.41 If the expectations about economically usable reservoirs materialize, adequate environmental rules are applied, and other conditions are met (including satisfactory regulatory frameworks and access to water), then IEA (2012) projects an accelerated production of gas, leading to lower prices of gas, and an expansion of gas demand (which increases by more than 50% between 2010 and 2035). As a result, the share of gas in the global energy mix grows from 21% now to 25% in 2035, and overtakes coal, becoming the second-largest primary energy source after oil. Under this scenario, the United States becomes the main world gas producer, surpassing Russia. Also, China increases its production significantly, as well as Australia, Canada, India, and Indonesia.
In the U.S., the expansion of shale gas has already driven domestic natural gas prices lower than other benchmarks, such as the traded LNG and the price of Russian gas for Europe, and in 2012 U.S. prices declined further (to around US$2−3/btu), closer to levels in the 1990s. This has been supporting the
41 Unconventional gas resources include shale gas, tight gas, and coal-bed methane. The largest component is shale gas. Almost all shale gas reservoirs (or “plays”) produce some liquids, including oil (which are called natural gas liquids, NGL), and tight oil production comes with some associated gas as well. Obviously, the co-production of oil along with shale gas helps with the economic results of producing unconventional gas production (IEA, 2012).
competitiveness of different energy-intensive industries, including the production of fertilizers, and substituting for coal-based electrical plants, which may help to reduce GHG emissions in the U.S. (if the effect of replacing coal is not countered by the disincentive effect on other cleaner technologies).
If the “golden gas” scenario materializes, and China also embarks on an accelerated use of unconventional gas, the impacts will be multiple: from less coal-based electrical plants and therefore less GHG emissions from that country to cheaper fertilizer, which may support the competitiveness of food production there. In the “golden gas” scenario (IEA, 2012), LAC also increases its gas production (with an important component of unconventional sources) by almost 80% between 2010 and 2035, and moves from about 6% to somewhat more than 7% of world gas production during the same period.
In LAC, the increase in gas production would lead to more exports of energy (which will be supported as well by expanded oil production, in part from other unconventional sources, such as the deep-sea, pre-salt reservoirs in Brazil). Therefore, considering that exchange rates are usually more market based in LAC than in other developing regions, the expansion of energy production and exports may have an impact on the appreciation of real exchange rates (a Dutch-disease effect), with a likely negative effect on tradable sectors, such as agriculture. This negative effect has to be considered against the potentially positive consequences for agricultural growth of expanded domestic demand in those countries because of
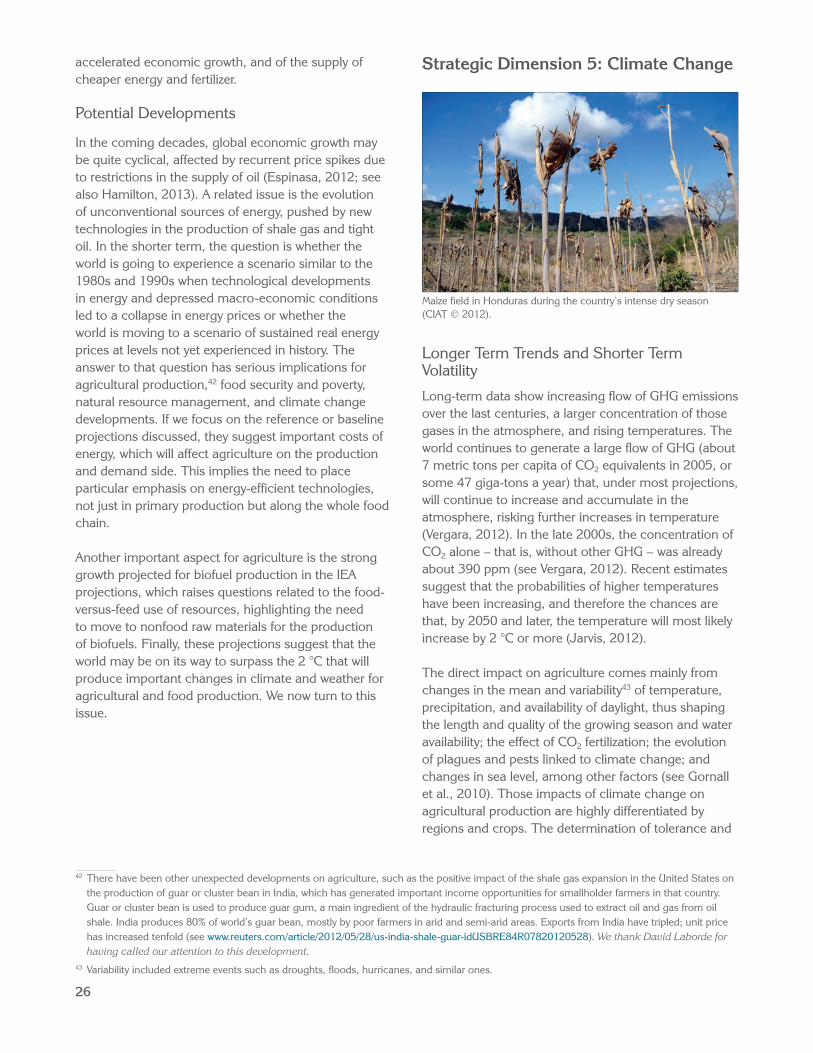
26
accelerated economic growth, and of the supply of cheaper energy and fertilizer.
Potential Developments
In the coming decades, global economic growth may be quite cyclical, affected by recurrent price spikes due to restrictions in the supply of oil (Espinasa, 2012; see also Hamilton, 2013). A related issue is the evolution of unconventional sources of energy, pushed by new technologies in the production of shale gas and tight oil. In the shorter term, the question is whether the world is going to experience a scenario similar to the 1980s and 1990s when technological developments in energy and depressed macro-economic conditions led to a collapse in energy prices or whether the world is moving to a scenario of sustained real energy prices at levels not yet experienced in history. The answer to that question has serious implications for agricultural production,42 food security and poverty, natural resource management, and climate change developments. If we focus on the reference or baseline projections discussed, they suggest important costs of energy, which will affect agriculture on the production and demand side. This implies the need to place particular emphasis on energy-efficient technologies, not just in primary production but along the whole food chain.
Another important aspect for agriculture is the strong growth projected for biofuel production in the IEA projections, which raises questions related to the food-versus-feed use of resources, highlighting the need to move to nonfood raw materials for the production of biofuels. Finally, these projections suggest that the world may be on its way to surpass the 2 °C that will produce important changes in climate and weather for agricultural and food production. We now turn to this issue.
42 There have been other unexpected developments on agriculture, such as the positive impact of the shale gas expansion in the United States on the production of guar or cluster bean in India, which has generated important income opportunities for smallholder farmers in that country. Guar or cluster bean is used to produce guar gum, a main ingredient of the hydraulic fracturing process used to extract oil and gas from oil shale. India produces 80% of world’s guar bean, mostly by poor farmers in arid and semi-arid areas. Exports from India have tripled; unit price has increased tenfold (see www.reuters.com/article/2012/05/28/us-india-shale-guar-idUSBRE84R07820120528). We thank David Laborde for having called our attention to this development.
43 Variability included extreme events such as droughts, floods, hurricanes, and similar ones.
Strategic Dimension 5: Climate Change
Longer Term Trends and Shorter Term Volatility
Long-term data show increasing flow of GHG emissions over the last centuries, a larger concentration of those gases in the atmosphere, and rising temperatures. The world continues to generate a large flow of GHG (about 7 metric tons per capita of CO2 equivalents in 2005, or some 47 giga-tons a year) that, under most projections, will continue to increase and accumulate in the atmosphere, risking further increases in temperature (Vergara, 2012). In the late 2000s, the concentration of CO2 alone – that is, without other GHG – was already about 390 ppm (see Vergara, 2012). Recent estimates suggest that the probabilities of higher temperatures have been increasing, and therefore the chances are that, by 2050 and later, the temperature will most likely increase by 2 °C or more (Jarvis, 2012).
The direct impact on agriculture comes mainly from changes in the mean and variability43 of temperature, precipitation, and availability of daylight, thus shaping the length and quality of the growing season and water availability; the effect of CO2 fertilization; the evolution of plagues and pests linked to climate change; and changes in sea level, among other factors (see Gornall et al., 2010). Those impacts of climate change on agricultural production are highly differentiated by regions and crops. The determination of tolerance and
Maize field in Honduras during the country’s intense dry season (CIAT © 2012).
27
resistance thresholds for specific crops is a complex undertaking given the nonlinear relations between the different relevant variables. Furthermore, in climate change simulations, different General Circulation Models (GCM) offer diverse projections of what climate outcomes may result from the same levels of accumulation of GHG and aerosols in the atmosphere.
For instance, recent projections by IFPRI (Nelson et al., 2010) consider two completely different scenarios for climate change, one based on a model developed by Australia’s Commonwealth Scientific and Industrial Research Organisation (CSIRO) (which tends to project a drier world with lower increases in temperature) and the other using the Model for Interdisciplinary Research on Climate (MIROC), implemented by the University of Tokyo’s Center for Climate System Research (which suggests greater increases in precipitation and a hotter world on average).44 It must also be noted that the uncertainties about the path of GHG emissions and the impact on climate may not be solved by the Fifth Assessment of the IPCC, considering that the more sophisticated GCMs used in this Assessment are likely to expand, rather than narrow, the range of potential climate change outcomes (Maslin and Austin, 2012).
Changes in precipitation and temperature translate into yield changes in agricultural production. Table 13 (also from Nelson et al., 2010) presents estimates for three main crops: maize, rice, and wheat. They do not include the potential effect of atmospheric CO2 fertilization (which may help to increase yield) and the possibility of expanded pests and plagues linked to climate change (which may reduce yield).45
The very different temperature and rainfall projections from the same emissions scenario produce important changes in projections: for instance, using MIROC with scenario A1B,46 the yield for cereals in the U.S. declines 33% in 2050 compared with the climate in 2000, and, because of that, developed countries, which
historically have been important cereal exporters, suffer a significant decline in their net exports. With the results of other GCMs, the impacts of the same levels of GHG concentration produce very different projections of yield, production, and trade.
The Economic Commission for Latin America and the Caribbean (ECLAC, 2010) also discusses other estimates for specific countries and regions in LAC. For instance, in Paraguay, the impacts of climate change estimated as an average of GCMs47 suggest that, in scenario A2,48 soybeans, which are the worst affected segment of agriculture with a decline of -10% in 2050, are estimated to be equivalent to about 1.9% of the GDP in 2050. The impact in the case of scenario B249 is even higher. In the case of wheat, the same scenario A2 and decline in yield imply a loss of GDP of about 0.3% of 2008 GDP in 2050. On the other hand, the productivity of some crops important for family farms (sesame, beans, cassava, and sugarcane) appears to be positively affected by climate change. However, livestock and cotton productivity are projected to decline (ECLAC, 2010).
ECLAC (2010) discusses as well the impact on yield for corn (maize), beans, and rice in Central America. Beans appear negatively affected by 2050, while trends in the other crops are more difficult to discern, at least until mid-century (after that, the negative impacts are clearer). However, considering all impacts on agriculture, ECLAC (2010) estimates that, in scenario A2, and with a low discount rate (0.5%), losses in that sector for Central America may amount to 2.5% of the 2008 GDP in 2030 (about 3.7% in 2050). Those negative effects plus impacts on biodiversity, water, and the generation of extreme events may add up to losses of 4.3% of the GDP in 2030 and 10.7% in 2050. Probably the strongest impact would be through an increase in the frequency of hurricanes, which have become much more frequent in the past four decades, and particularly during the 2000s.
44 They report some results from two other GCMs but the main simulations are based on CSIRO and MIROC. 45 The description of the scenarios in IPCC Fourth Assessment Report AR4 (A1, A2, B1, B2 and families) can be seen at
www.ipcc.ch/pdf/special-reports/spm/sres-en.pdf46 The A1 storyline and scenario family describes a future world of very rapid economic growth, low population growth, and the rapid introduction
of new and more efficient technologies. A1B is a sub-scenario in A1 with balanced emissions from fossil and non-fossil energy sources, compared to other two scenarios with fossil, A1F, and non-fossil, A1T, sources.
47 There is debate about what are the analytical meaning and practical use of averaging results from so different GCMs. The other option is to present results for the GCMs generating more extreme values (as done in Nelson et al., 2010).
48 The A2 scenario family describes a heterogeneous world, with self-reliance and preservation of local identities, high population growth, and per-capita economic growth and technological change more fragmented and slower than in other scenarios.
49 The B2 scenario is a world that emphasizes local solutions to economic, social, and environmental sustainability, moderate population growth, intermediate economic development, and less rapid and more diverse technological change than in the B1 and A1 storylines.
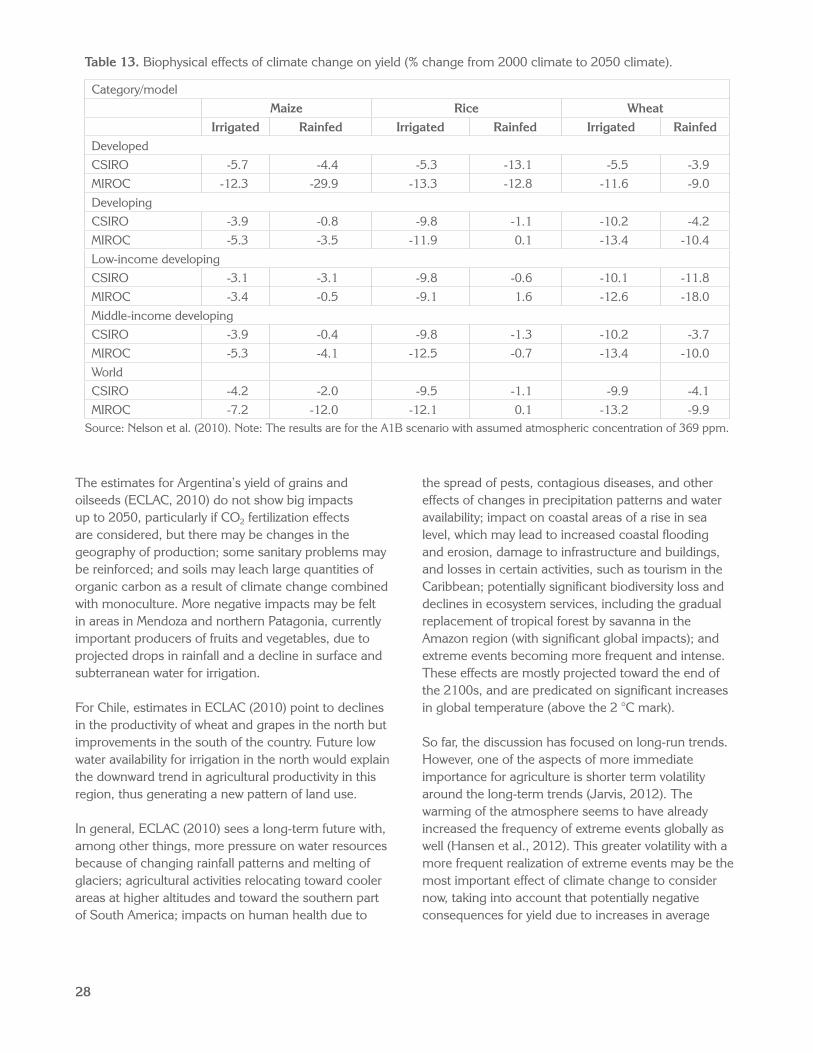
28
Table 13. Biophysical effects of climate change on yield (% change from 2000 climate to 2050 climate).
Category/modelMaize Rice Wheat
Irrigated Rainfed Irrigated Rainfed Irrigated RainfedDevelopedCSIRO -5.7 -4.4 -5.3 -13.1 -5.5 -3.9MIROC -12.3 -29.9 -13.3 -12.8 -11.6 -9.0DevelopingCSIRO -3.9 -0.8 -9.8 -1.1 -10.2 -4.2MIROC -5.3 -3.5 -11.9 0.1 -13.4 -10.4Low-income developingCSIRO -3.1 -3.1 -9.8 -0.6 -10.1 -11.8MIROC -3.4 -0.5 -9.1 1.6 -12.6 -18.0Middle-income developingCSIRO -3.9 -0.4 -9.8 -1.3 -10.2 -3.7MIROC -5.3 -4.1 -12.5 -0.7 -13.4 -10.0WorldCSIRO -4.2 -2.0 -9.5 -1.1 -9.9 -4.1MIROC -7.2 -12.0 -12.1 0.1 -13.2 -9.9
Source: Nelson et al. (2010). Note: The results are for the A1B scenario with assumed atmospheric concentration of 369 ppm.
The estimates for Argentina’s yield of grains and oilseeds (ECLAC, 2010) do not show big impacts up to 2050, particularly if CO2 fertilization effects are considered, but there may be changes in the geography of production; some sanitary problems may be reinforced; and soils may leach large quantities of organic carbon as a result of climate change combined with monoculture. More negative impacts may be felt in areas in Mendoza and northern Patagonia, currently important producers of fruits and vegetables, due to projected drops in rainfall and a decline in surface and subterranean water for irrigation.
For Chile, estimates in ECLAC (2010) point to declines in the productivity of wheat and grapes in the north but improvements in the south of the country. Future low water availability for irrigation in the north would explain the downward trend in agricultural productivity in this region, thus generating a new pattern of land use.
In general, ECLAC (2010) sees a long-term future with, among other things, more pressure on water resources because of changing rainfall patterns and melting of glaciers; agricultural activities relocating toward cooler areas at higher altitudes and toward the southern part of South America; impacts on human health due to
the spread of pests, contagious diseases, and other effects of changes in precipitation patterns and water availability; impact on coastal areas of a rise in sea level, which may lead to increased coastal flooding and erosion, damage to infrastructure and buildings, and losses in certain activities, such as tourism in the Caribbean; potentially significant biodiversity loss and declines in ecosystem services, including the gradual replacement of tropical forest by savanna in the Amazon region (with significant global impacts); and extreme events becoming more frequent and intense. These effects are mostly projected toward the end of the 2100s, and are predicated on significant increases in global temperature (above the 2 °C mark).
So far, the discussion has focused on long-run trends. However, one of the aspects of more immediate importance for agriculture is shorter term volatility around the long-term trends (Jarvis, 2012). The warming of the atmosphere seems to have already increased the frequency of extreme events globally as well (Hansen et al., 2012). This greater volatility with a more frequent realization of extreme events may be the most important effect of climate change to consider now, taking into account that potentially negative consequences for yield due to increases in average
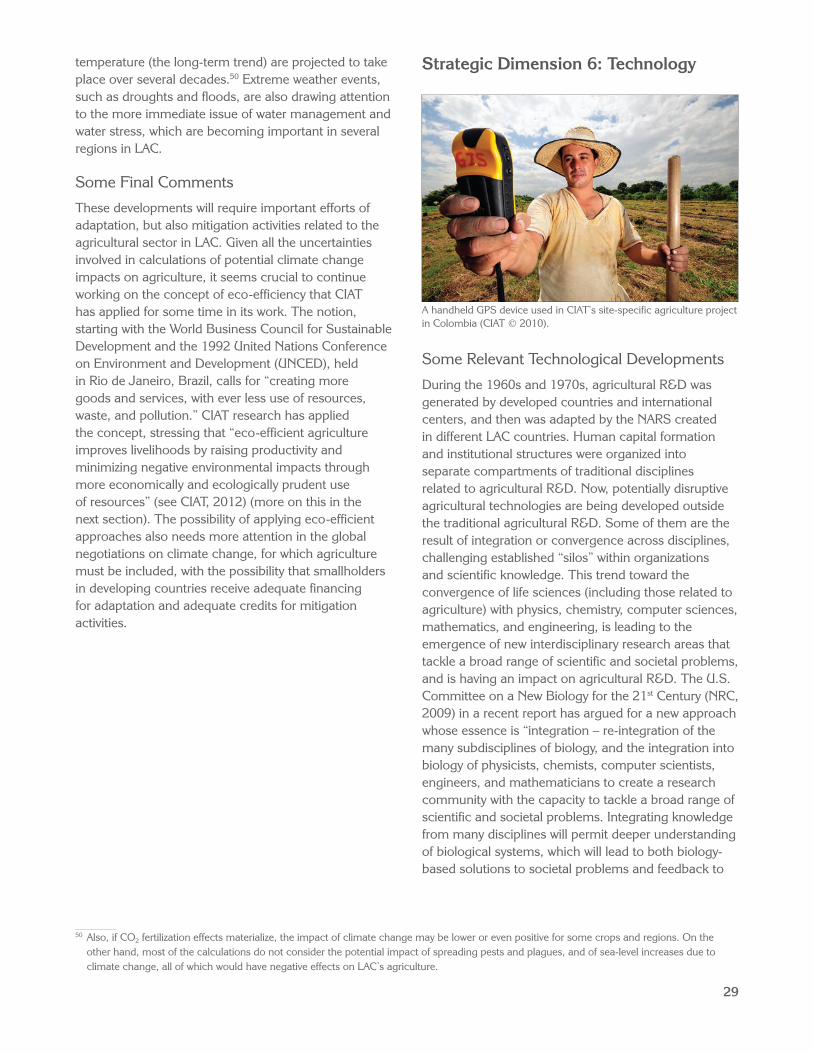
29
temperature (the long-term trend) are projected to take place over several decades.50 Extreme weather events, such as droughts and floods, are also drawing attention to the more immediate issue of water management and water stress, which are becoming important in several regions in LAC.
Some Final Comments
These developments will require important efforts of adaptation, but also mitigation activities related to the agricultural sector in LAC. Given all the uncertainties involved in calculations of potential climate change impacts on agriculture, it seems crucial to continue working on the concept of eco-efficiency that CIAT has applied for some time in its work. The notion, starting with the World Business Council for Sustainable Development and the 1992 United Nations Conference on Environment and Development (UNCED), held in Rio de Janeiro, Brazil, calls for “creating more goods and services, with ever less use of resources, waste, and pollution.” CIAT research has applied the concept, stressing that “eco-efficient agriculture improves livelihoods by raising productivity and minimizing negative environmental impacts through more economically and ecologically prudent use of resources” (see CIAT, 2012) (more on this in the next section). The possibility of applying eco-efficient approaches also needs more attention in the global negotiations on climate change, for which agriculture must be included, with the possibility that smallholders in developing countries receive adequate financing for adaptation and adequate credits for mitigation activities.
50 Also, if CO2 fertilization effects materialize, the impact of climate change may be lower or even positive for some crops and regions. On the other hand, most of the calculations do not consider the potential impact of spreading pests and plagues, and of sea-level increases due to climate change, all of which would have negative effects on LAC’s agriculture.
Strategic Dimension 6: Technology
Some Relevant Technological Developments
During the 1960s and 1970s, agricultural R&D was generated by developed countries and international centers, and then was adapted by the NARS created in different LAC countries. Human capital formation and institutional structures were organized into separate compartments of traditional disciplines related to agricultural R&D. Now, potentially disruptive agricultural technologies are being developed outside the traditional agricultural R&D. Some of them are the result of integration or convergence across disciplines, challenging established “silos” within organizations and scientific knowledge. This trend toward the convergence of life sciences (including those related to agriculture) with physics, chemistry, computer sciences, mathematics, and engineering, is leading to the emergence of new interdisciplinary research areas that tackle a broad range of scientific and societal problems, and is having an impact on agricultural R&D. The U.S. Committee on a New Biology for the 21st Century (NRC, 2009) in a recent report has argued for a new approach whose essence is “integration – re-integration of the many subdisciplines of biology, and the integration into biology of physicists, chemists, computer scientists, engineers, and mathematicians to create a research community with the capacity to tackle a broad range of scientific and societal problems. Integrating knowledge from many disciplines will permit deeper understanding of biological systems, which will lead to both biology-based solutions to societal problems and feedback to
A handheld GPS device used in CIAT’s site-specific agriculture project in Colombia (CIAT © 2010).
30
enrich the individual scientific disciplines that contribute new insights” (NRC, 2009).
Similarly, the Massachusetts Institute of Technology (MIT, 2011) describes a “Third Revolution” with the combination of the first revolution (linked to molecular and cellular biology that helps understand cells at the molecular level, the “hardware”) and the second revolution (the study of an organism’s entire genome, which facilitates the understanding of what drives cell processes, the “software”), while at the same time both are converging with engineering and physics. The latter has also been changed by advances in information technology, materials, imaging, nanotechnology, optics, and quantum physics, coupled with advances in computing, modeling, and simulation (MIT, 2011). This convergence, or integration, is making it possible to predict and control the activities of biological systems in increasing detail. Such convergence requires not only collaboration between disciplines, but, more fundamentally, it needs true disciplinary integration (MIT, 2011). This new paradigm is challenging existing organizational structures and current models of funding and investing in science. The National Research Council (NRC, 2009) suggested the need to organize the work of the “New Biology” around four main global challenges: (1) generate food plants to adapt and grow sustainably in changing environments, (2) understand and sustain ecosystem functions and biodiversity in the face of rapid change, (3) expand sustainable alternatives to fossil fuels, and (4) understand individual health.
Although all four challenges have implications for agricultural R&D, here we highlight the opportunities that the New Biology may offer for agriculture, as detailed in the report by the Committee (NRC, 2009):
a) Understanding plant growth Integrating life science research with physical
science, engineering, computational science, and mathematics, will facilitate the development of models of plant growth in cellular and molecular detail, a knowledge that does not exist yet. With that information plus an adequate catalogue of plant biodiversity, it would be possible to target genetic changes resulting in new crops and crops well adapted to their environments. This will allow a much faster and less costly development of plant varieties with desired traits.
b) Genetically informed breeding The sequencing of the plant genome, its analysis,
and advances in bioinformatics allow breeders to identify the genomes and genes associated with specific and desirable traits, through quantitative mapping. Then, millions of offspring can be identified and catalogued and only those with desired traits are retained, without the lengthy traditional methods that use screening after a full life cycle has been completed. This method will greatly accelerate the process of breeding plants with desired nutritional and other characteristics, and will allow the development of plants that can grow and thrive under local conditions and different stresses. Other applications relate to improvements in the use of nonfood crops and organic material for bio-energy.
c) Transgenic and genetic engineering of crops This is already happening, but deeper knowledge of
growth processes and a more detailed mapping of biodiversity will expand the possibilities of “crop or product design.” Some of those options, such as improving the nutritional value of crops, have already been implemented. The NRC also mentions other possibilities: for example, the potential of transferring C4 photosynthetic capabilities to crops that normally use conventional C3 photosynthesis, which could increase photosynthetic rates in most of the world’s food crops.
d) Biodiversity, systematics, and evolutionary genomics
New technologies in information processing, imaging, and high-throughput sequencing, among others, will help to develop a deeper knowledge of plant diversity and evolutionary biology, thus facilitating the identification of genes and traits that can be used to strengthen current crops or develop new ones. The NRC report (2009) uses the simile of “building a fully stocked parts warehouse with an inventory control system that quickly locates exactly the right part.”
e) Crops as ecosystems The goal is to understand how productivity and plant
growth are linked to the complex ecosystem they are part of, which includes different environmental parameters (temperature, moisture, and light), biological parameters (viruses, bacteria, fungi, insects, birds, other animals), and other interacting factors (soil and the complex microbial communities in the soil).
31
The NRC focused on biological issues, but the convergence across disciplines is also happening in other areas, such as engineering, imaging, information and communications technologies (ICTs), global positioning, and computing, all of which are increasing efficiency and productivity while reducing costs by allowing more precise delivery of water and nutrients through precision farming and precision irrigation. Sensors and ICTs are also supporting more rapid and routine surveillance for pests and diseases, as well as improving the ability to predict weather patterns. On a different level, other technological developments with implications for agriculture include (a) big data collection, analysis, and delivery of information, using cloud-based systems, better data-mining software, and social networks (which can facilitate the production of highly specialized information for different regions, products, and farmers); (b) additive manufacturing or 3D printing (which would allow the development of customized products at low cost), and the development of new materials that support that technology; (c) improvements in solar energy (which, among other things, may reduce the costs of operating irrigation and other equipment); and (d) developments in human health technology that can be applied to crop and livestock production.
Institutional and Policy Issues
Those technological trends, plus other ongoing developments, are changing the setting where NARS and the research, development, and innovation (R&D&I) of LAC must now operate. First, the “New Biology” requires institutional changes to ensure coordination across disciplines. This does not necessarily mean placing scientists and experts under the same institutional structure, but should involve new organizational ways for collaboration, using advanced communication and informatics infrastructures (NRC, 2009). The integration of disciplines also requires collaboration across R&D institutions in the public and private sector working on specific projects at different levels. This approach would call for new forms of funding as well (NRC, 2009; MIT, 2011). The advanced research areas, because they place new demands on agricultural scientists, will need significant capacity building and interdisciplinary integration in LAC and other developing countries. They also pose important institutional challenges. In particular, NARS must strengthen their human resource and financial management, while also better positioning
themselves within the broader science, technology, and innovation policies and structures.
In addition to the fact that biological sciences, engineering, and information technology seem to be entering into a new paradigm of convergence or integration, at least three other ongoing developments are also placing institutional demands on how to conduct R&D activities. First, the private sector – from multinational companies to producers associations – and civil society have also taken up active roles in the development and diffusion of agricultural technology, while at the same time new public actors (such as universities) have emerged beyond the NARS (see, for instance, Gillespie, 2005).51 In several instances, the private sector has stronger capabilities than NARS in modern techniques, such as recombinant DNA, genetic transformation, and functional and structural genomics, although with variations across countries.
A second development is the multiplicity of demands now placed on agriculture in addition to increasing supply and alleviating poverty, which include specific consumer’s preferences, health and equity requirements, and environmental sustainability and climate change challenges. The implication of these multiple demands is that agricultural R&D needs to go beyond an exclusive focus on primary production to now include the forward and backward linkages of the value chain, considering the views of a variety of social actors.
The third development is the realization that the problems affecting societies require a conceptual movement from more limited R&D approaches to an innovation focus, which is a broader concept (Trigo, 2012). All these challenges suggest that a strategy of strengthening agricultural R&D in the region must consider at least three levels (Trigo, 2012): first, the national level of policies and institutions of the innovation system; second, the general system of R&D and transfer; and third, at the level of strengthening the individual NARS. All this will imply new organizational approaches, particularly to coordinate across multiple actors and networks. Also, in many cases, individual countries in the region do not have the scale to undertake some of the R&D activities alone and there is, therefore, a need to expand regional and international networks.
51 Gillespie (2005) notes that, although the case for public R&D continues to be strong (based on the nature of public goods and the presence of market failures), a variety of new private-sector actors, from multinational companies to farmers organizations, are financing and carrying out R&D activities in the agricultural and food sectors.
32
The challenges mentioned have implications not only for the organizational aspects of agricultural R&D, but also for the crucial issue of funding those activities. In this regard, two separate questions should be answered: what level of investments is needed? And, what are the appropriate financing mechanisms? (Trigo, 2012). Regarding the first question, it was already noted that public investments in agricultural R&D in the region have increased somewhat, particularly during the last decade. But, LAC’s average ratios are still well below the levels of developed nations, and a few countries, particularly Brazil, account for many of the improvements, while investments have declined in the smaller and poorer countries that are most in need of agricultural R&D.
Regarding the second question, most of the funding is public and focuses on the NARS (e.g., INIA-Uruguay receives 60% of the total funds invested in that country, INTA-Argentina 59%, and EMBRAPA-Brazil 57% [Trigo, 2012]). In a similar way, the training of human resources is located mainly in the NARS, followed by universities and other higher education institutions. At the same time, countries have developed several strategies regarding funding mechanisms, from specific allocations in the national budget to inter-institutional special funds.52 These mechanisms should ensure the participation of the public and private actors involved through agile operational schemes and structures that allow the integration of resources and capabilities from the institutions involved (Echeverría et al., 1996; Trigo, 2012).
The Evolution of the Agrarian Structure in LAC
A key issue is the evolution of the agrarian structure and the role of family farming within it. It may not be an independent strategic dimension, to the extent that it is heavily influenced by other factors, such as growth and trade, technological developments, and population trends. Still, it merits a separate consideration. It was noted earlier the heterogeneity of the agrarian structure in LAC. In particular, family farming is recognized as a
diverse social group, with different definitions based on the use of family labor, size of land and other assets, and income (Hazell et al., 2010; IFAD, 2010; Lipton, 2005; Nagayets, 2005; Wiggins et al., 2010).
It has been estimated (Berdegué and Fuentealba, 2011) that, in LAC, family agriculture accounts for approximately 15 million households and 400 million hectares, which can be subdivided into subsistence farmers (almost 10 million and 100 million hectares), intermediate groups with market access but limitations in terms of assets and surrounding context (4 million and 200 million ha), and family farmers who have some permanent hired labor (1 to 100 million ha).53 Some other smallholders have an income that derives from sources different from agriculture, such as state contributions or other non-agricultural sectors (temporal or informal jobs), thus promoting migration from rural areas to cities. The other groups include producers who make a profit from agriculture. And, within the last group of family farmers, some may be at the boundary between family farms and commercial/corporate agriculture. In general, it is complex to quantify appropriately family farming in LAC because of the great heterogeneity of conditions as well as the criteria used to classify them. For example, the classification may have to consider not only specific family characteristics, but also the geographic dimension, for which both the traditional issues of quality of productive resources and climate and the levels of public investments and policy support in an area must be considered. That heterogeneity makes it necessary to investigate those differences. The importance of the evolution of the agrarian structure for strategic planning and decision making regarding the type of technologies and innovations required to boost productivity and sustainable management of natural resources, especially land and water, seems undeniable.
The evolution of the agrarian structure is closely related to the relative advantages of commercial/large versus family/small farms (Deininger and Byerlee, 2011). The former may have advantages of scale, such as in the case of some plantation crops, or benefit from access
52 For an early discussion of changes in R&D financing in LAC, see Echeverría et al. (1996).53 Other studies include the following: Chiriboga (1999) estimated that 15 LAC countries have about 11 million households (subsistence) that
control 3% of the land. Schejtman and Berdegué (2009) estimated 7.3 million family farmers considering Brazil, Chile, Colombia, Honduras, Mexico, Paraguay, and Peru. Soto Baquero et al. (2007) conclude that 11 million households are found in Brazil, Chile, Colombia, Ecuador, Mexico, and Nicaragua, and that they control 30−60% of the land. These authors differentiate three strata: subsistence farmers (7 million units and 63 million ha), farmers in transition (3 million units and 43 million ha), and established producers (1 million units and 29 million ha). However, Schejtman (2008) added information from six countries (Argentina, Bolivia, Guatemala, Paraguay, Peru, and Uruguay), concluding that the region has 14 million family farmer units, of which approximately 60% are subsistence producers, 28% small-scale producers in transition, and 12% established producers.
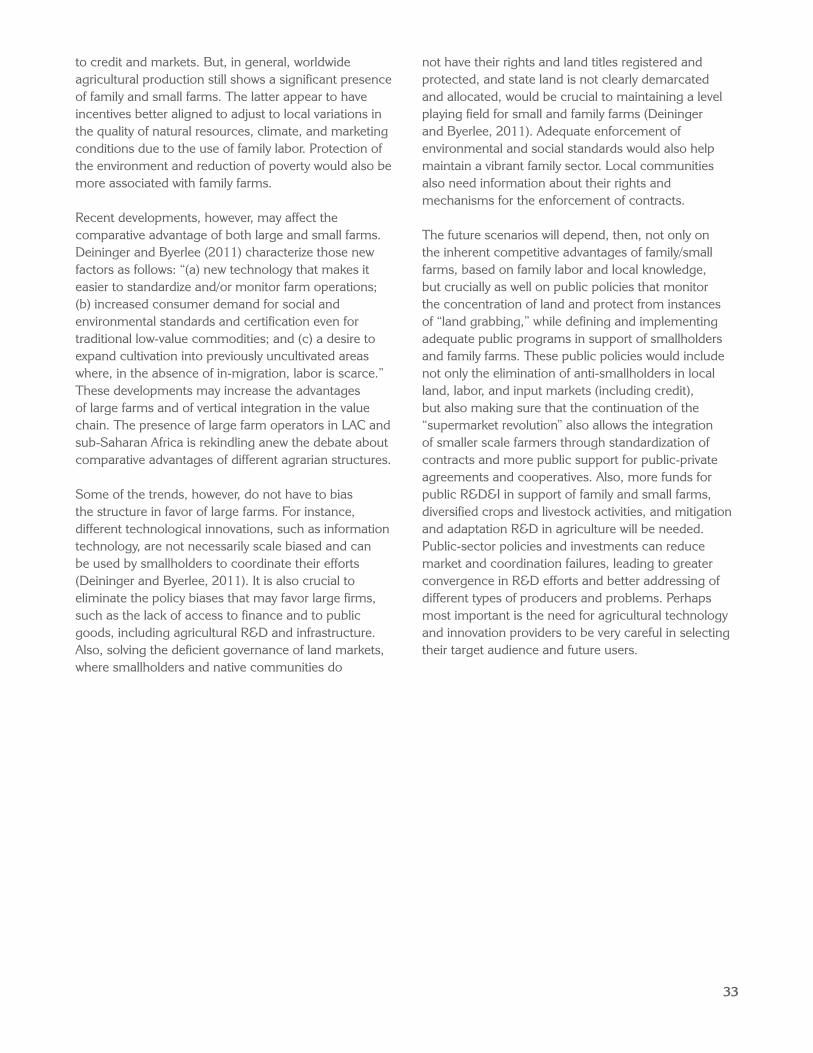
33
to credit and markets. But, in general, worldwide agricultural production still shows a significant presence of family and small farms. The latter appear to have incentives better aligned to adjust to local variations in the quality of natural resources, climate, and marketing conditions due to the use of family labor. Protection of the environment and reduction of poverty would also be more associated with family farms.
Recent developments, however, may affect the comparative advantage of both large and small farms. Deininger and Byerlee (2011) characterize those new factors as follows: “(a) new technology that makes it easier to standardize and/or monitor farm operations; (b) increased consumer demand for social and environmental standards and certification even for traditional low-value commodities; and (c) a desire to expand cultivation into previously uncultivated areas where, in the absence of in-migration, labor is scarce.” These developments may increase the advantages of large farms and of vertical integration in the value chain. The presence of large farm operators in LAC and sub-Saharan Africa is rekindling anew the debate about comparative advantages of different agrarian structures.
Some of the trends, however, do not have to bias the structure in favor of large farms. For instance, different technological innovations, such as information technology, are not necessarily scale biased and can be used by smallholders to coordinate their efforts (Deininger and Byerlee, 2011). It is also crucial to eliminate the policy biases that may favor large firms, such as the lack of access to finance and to public goods, including agricultural R&D and infrastructure. Also, solving the deficient governance of land markets, where smallholders and native communities do
not have their rights and land titles registered and protected, and state land is not clearly demarcated and allocated, would be crucial to maintaining a level playing field for small and family farms (Deininger and Byerlee, 2011). Adequate enforcement of environmental and social standards would also help maintain a vibrant family sector. Local communities also need information about their rights and mechanisms for the enforcement of contracts.
The future scenarios will depend, then, not only on the inherent competitive advantages of family/small farms, based on family labor and local knowledge, but crucially as well on public policies that monitor the concentration of land and protect from instances of “land grabbing,” while defining and implementing adequate public programs in support of smallholders and family farms. These public policies would include not only the elimination of anti-smallholders in local land, labor, and input markets (including credit), but also making sure that the continuation of the “supermarket revolution” also allows the integration of smaller scale farmers through standardization of contracts and more public support for public-private agreements and cooperatives. Also, more funds for public R&D&I in support of family and small farms, diversified crops and livestock activities, and mitigation and adaptation R&D in agriculture will be needed. Public-sector policies and investments can reduce market and coordination failures, leading to greater convergence in R&D efforts and better addressing of different types of producers and problems. Perhaps most important is the need for agricultural technology and innovation providers to be very careful in selecting their target audience and future users.
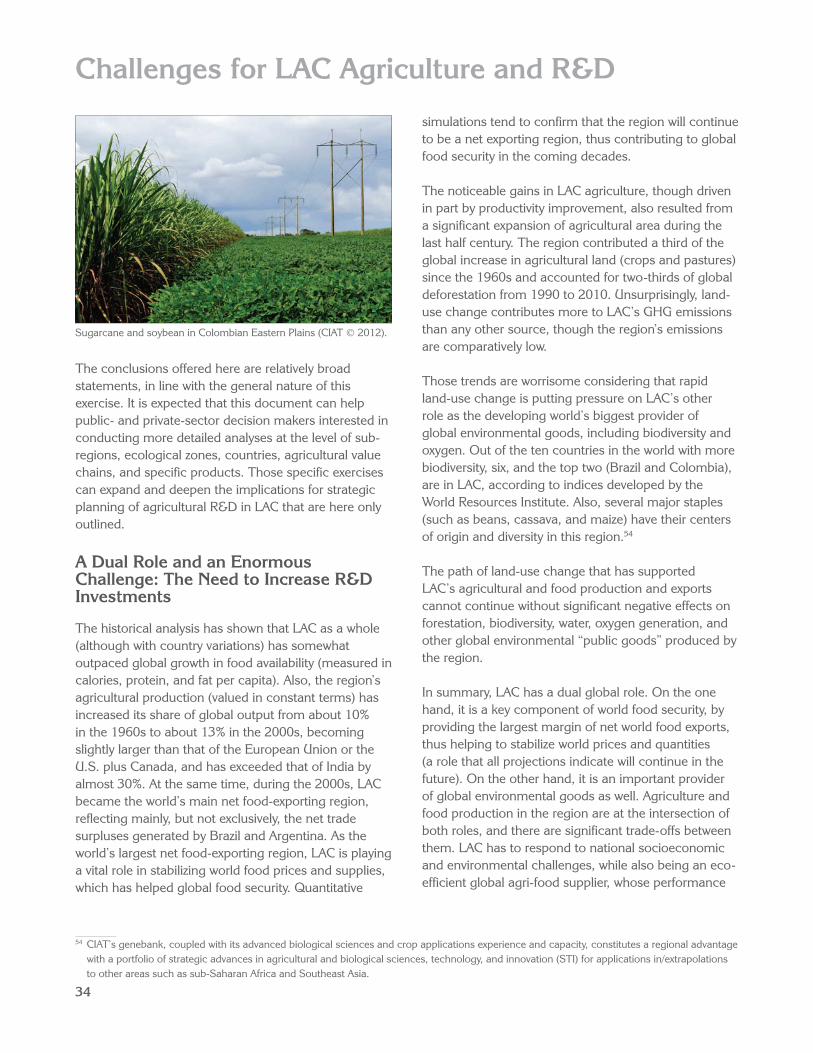
34
Challenges for LAC Agriculture and R&D
The conclusions offered here are relatively broad statements, in line with the general nature of this exercise. It is expected that this document can help public- and private-sector decision makers interested in conducting more detailed analyses at the level of sub-regions, ecological zones, countries, agricultural value chains, and specific products. Those specific exercises can expand and deepen the implications for strategic planning of agricultural R&D in LAC that are here only outlined.
A Dual Role and an Enormous Challenge: The Need to Increase R&D Investments
The historical analysis has shown that LAC as a whole (although with country variations) has somewhat outpaced global growth in food availability (measured in calories, protein, and fat per capita). Also, the region’s agricultural production (valued in constant terms) has increased its share of global output from about 10% in the 1960s to about 13% in the 2000s, becoming slightly larger than that of the European Union or the U.S. plus Canada, and has exceeded that of India by almost 30%. At the same time, during the 2000s, LAC became the world’s main net food-exporting region, reflecting mainly, but not exclusively, the net trade surpluses generated by Brazil and Argentina. As the world’s largest net food-exporting region, LAC is playing a vital role in stabilizing world food prices and supplies, which has helped global food security. Quantitative
54 CIAT’s genebank, coupled with its advanced biological sciences and crop applications experience and capacity, constitutes a regional advantage with a portfolio of strategic advances in agricultural and biological sciences, technology, and innovation (STI) for applications in/extrapolations to other areas such as sub-Saharan Africa and Southeast Asia.
simulations tend to confirm that the region will continue to be a net exporting region, thus contributing to global food security in the coming decades.
The noticeable gains in LAC agriculture, though driven in part by productivity improvement, also resulted from a significant expansion of agricultural area during the last half century. The region contributed a third of the global increase in agricultural land (crops and pastures) since the 1960s and accounted for two-thirds of global deforestation from 1990 to 2010. Unsurprisingly, land-use change contributes more to LAC’s GHG emissions than any other source, though the region’s emissions are comparatively low.
Those trends are worrisome considering that rapid land-use change is putting pressure on LAC’s other role as the developing world’s biggest provider of global environmental goods, including biodiversity and oxygen. Out of the ten countries in the world with more biodiversity, six, and the top two (Brazil and Colombia), are in LAC, according to indices developed by the World Resources Institute. Also, several major staples (such as beans, cassava, and maize) have their centers of origin and diversity in this region.54
The path of land-use change that has supported LAC’s agricultural and food production and exports cannot continue without significant negative effects on forestation, biodiversity, water, oxygen generation, and other global environmental “public goods” produced by the region.
In summary, LAC has a dual global role. On the one hand, it is a key component of world food security, by providing the largest margin of net world food exports, thus helping to stabilize world prices and quantities (a role that all projections indicate will continue in the future). On the other hand, it is an important provider of global environmental goods as well. Agriculture and food production in the region are at the intersection of both roles, and there are significant trade-offs between them. LAC has to respond to national socioeconomic and environmental challenges, while also being an eco-efficient global agri-food supplier, whose performance
Sugarcane and soybean in Colombian Eastern Plains (CIAT © 2012).
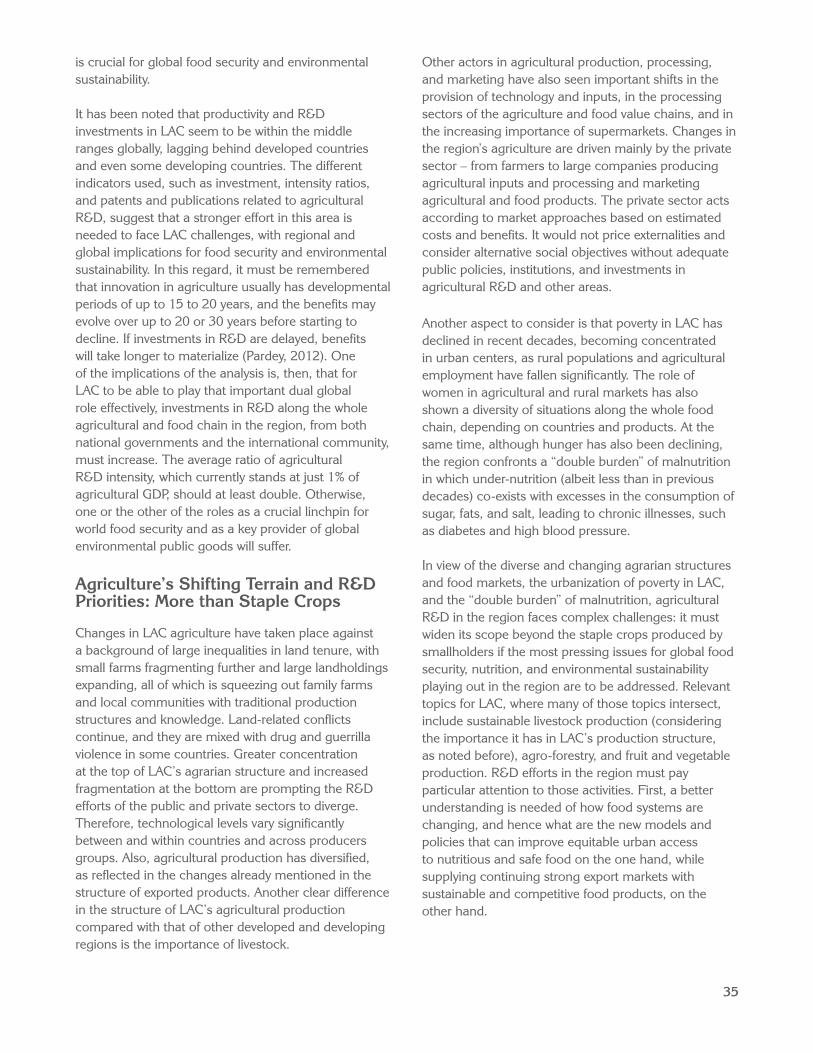
35
is crucial for global food security and environmental sustainability.
It has been noted that productivity and R&D investments in LAC seem to be within the middle ranges globally, lagging behind developed countries and even some developing countries. The different indicators used, such as investment, intensity ratios, and patents and publications related to agricultural R&D, suggest that a stronger effort in this area is needed to face LAC challenges, with regional and global implications for food security and environmental sustainability. In this regard, it must be remembered that innovation in agriculture usually has developmental periods of up to 15 to 20 years, and the benefits may evolve over up to 20 or 30 years before starting to decline. If investments in R&D are delayed, benefits will take longer to materialize (Pardey, 2012). One of the implications of the analysis is, then, that for LAC to be able to play that important dual global role effectively, investments in R&D along the whole agricultural and food chain in the region, from both national governments and the international community, must increase. The average ratio of agricultural R&D intensity, which currently stands at just 1% of agricultural GDP, should at least double. Otherwise, one or the other of the roles as a crucial linchpin for world food security and as a key provider of global environmental public goods will suffer.
Agriculture’s Shifting Terrain and R&D Priorities: More than Staple Crops
Changes in LAC agriculture have taken place against a background of large inequalities in land tenure, with small farms fragmenting further and large landholdings expanding, all of which is squeezing out family farms and local communities with traditional production structures and knowledge. Land-related conflicts continue, and they are mixed with drug and guerrilla violence in some countries. Greater concentration at the top of LAC’s agrarian structure and increased fragmentation at the bottom are prompting the R&D efforts of the public and private sectors to diverge. Therefore, technological levels vary significantly between and within countries and across producers groups. Also, agricultural production has diversified, as reflected in the changes already mentioned in the structure of exported products. Another clear difference in the structure of LAC’s agricultural production compared with that of other developed and developing regions is the importance of livestock.
Other actors in agricultural production, processing, and marketing have also seen important shifts in the provision of technology and inputs, in the processing sectors of the agriculture and food value chains, and in the increasing importance of supermarkets. Changes in the region’s agriculture are driven mainly by the private sector – from farmers to large companies producing agricultural inputs and processing and marketing agricultural and food products. The private sector acts according to market approaches based on estimated costs and benefits. It would not price externalities and consider alternative social objectives without adequate public policies, institutions, and investments in agricultural R&D and other areas.
Another aspect to consider is that poverty in LAC has declined in recent decades, becoming concentrated in urban centers, as rural populations and agricultural employment have fallen significantly. The role of women in agricultural and rural markets has also shown a diversity of situations along the whole food chain, depending on countries and products. At the same time, although hunger has also been declining, the region confronts a “double burden” of malnutrition in which under-nutrition (albeit less than in previous decades) co-exists with excesses in the consumption of sugar, fats, and salt, leading to chronic illnesses, such as diabetes and high blood pressure.
In view of the diverse and changing agrarian structures and food markets, the urbanization of poverty in LAC, and the “double burden” of malnutrition, agricultural R&D in the region faces complex challenges: it must widen its scope beyond the staple crops produced by smallholders if the most pressing issues for global food security, nutrition, and environmental sustainability playing out in the region are to be addressed. Relevant topics for LAC, where many of those topics intersect, include sustainable livestock production (considering the importance it has in LAC’s production structure, as noted before), agro-forestry, and fruit and vegetable production. R&D efforts in the region must pay particular attention to those activities. First, a better understanding is needed of how food systems are changing, and hence what are the new models and policies that can improve equitable urban access to nutritious and safe food on the one hand, while supplying continuing strong export markets with sustainable and competitive food products, on the other hand.
36
Along with High-Growth, High-Demand Scenarios, other less Buoyant Futures should be Considered
Going forward, large uncertainties exist related to GDP growth, the aging population, changes in consumption patterns, the impact of climate change, and institutional challenges globally, regionally, and nationally. However, many scenarios tend to project a world with high rates of economic growth in which demand for food and agricultural goods is strong, leading to higher food prices in real terms.55 Still, the analysis of strategic dimensions and scenarios shows that combinations of events may point to less rapid expansion in demand and, therefore, to real prices lower than projected. On the other hand, this lower growth may have some positive consequences: pressure on LAC forests may lessen and the current process of land concentration may slow down, thus opening opportunities for the expansion of family/small farms.
Overall, although it is appropriate to use the high-growth, high-price projections as a benchmark, it would also be prudent to consider (and run quantitatively) less optimistic scenarios. In these scenarios, slow recovery from the current global financial crisis and the exhaustion of key sources of growth in recent decades are combined with trade and financial conflicts and geopolitical tensions that undermine world economic integration, and with lower food consumption as a result of aging populations, and a serious movement to tackle food waste and health and nutritional concerns.
Of course, projections suggesting lower food demand growth may also face in the future a more constrained supply response if climate change developments end up being more negative than is currently estimated, or if the technological promises of the new convergence of sciences do not materialize. In that case, lower demand projections may be countered by lackluster supply responses, with the result that prices could still remain high.
Agricultural R&D in LAC must Look at the Energy–Agriculture Link in General, including Biofuels, but Taking a Broader View
Usually, when discussing the issue of energy and agriculture, the main topic appears to be biofuels and the food–feed–fuel competition (particularly in the case of biofuels based on maize and soybeans). The usual R&D recommendations focus on finding nonfood raw materials for the production of biofuels (such as using lignocellulosic materials and other non-edible sources in the second and third generation of biofuels) (see, for instance, NRC, 2009). Another important issue is the use and recycling of biomass and organic material as a source of energy in agricultural production and urban waste (streams). An additional challenge is to develop production models in which small and family farms can participate (competitively) in agro-energy production, and integrate those models into local development strategies (FORAGRO, 2010).
At the same time, the analysis in the previous sections suggests the need to expand the study related to energy and agriculture to more than biofuels and biomass. Increasing energy efficiency and energy capture and recycling in the whole agricultural production, processing, and transportation value chain is a “multiple-win” approach by reducing costs and decreasing the GHG emissions related to agricultural activities and food consumption. In a perhaps not distant future, the requirement to generate those energy efficiencies may also come from public policies and/or private standards (based on consumers’ preferences) that mandate the disclosure of the energy and carbon footprints of food products, with the aim to reduce them.
More generally, it is important to monitor the global scenarios to determine whether the world is going to have a similar cycle as in the 1980s and 1990s, when technological developments in energy and depressed macro-economic conditions led to a collapse in energy prices, or whether the world is moving toward a scenario of sustained real energy prices at levels not yet experienced in history. In the particular case of LAC, a main unknown is the evolution of nonconventional energy sources, such as shale gas and oil (which
55 As has been shown in other places (Díaz-Bonilla and Ron, 2010, and Díaz-Bonilla, 2011), part of the price increases is related to the devaluation of the U.S. dollar, the currency in which the prices of commodities are usually quoted. If prices are presented in a more stable measure of value, such as Special Drawing Rights, the composite currency used by the IMF, the nominal price increases of recent years are clearly smaller than what appears when commodity prices are quoted in U.S. dollars.

37
are starting to look quite promising). The answers to those questions, which have important implications for agricultural production, food security and poverty, natural resource management, and climate change developments, require a more systematic and integral view of the complex links between energy and agriculture.
In the case of agricultural R&D priorities in LAC, there are at least two implications. First, it is important to consider energy topics that include, but go beyond, biofuels. Second, R&D activities should also focus on energy efficiency, looking at the whole food value chain, including urban consumers (and waste) and not only at the farm level.
Regarding Climate Change, the more Immediate Concerns Are Extreme Events and Water Stress
The energy projections discussed before suggest that the world may be on its way to surpass the mark of a 2 °C increase in the average temperature by 2050, which will produce important changes in climate and weather patterns, affecting agricultural and food production. Although this trend is obviously worrisome, there is a more immediate problem for agriculture: the fact that weather volatility has gone up around the trend (Jarvis, 2012), with the warming of the atmosphere increasing already the frequency of extreme events globally (Hansen et al., 2012). This more frequent realization of extreme events may be the most important effect of climate change to consider now, taking into account that potentially negative consequences for yield due to increases in average temperature are projected to take place over several decades. Extreme weather events, such as droughts and floods, are calling attention to the more immediate topic of greater efficiency in water management, which is an important issue in several LAC countries. The low development of irrigation in LAC needs to be addressed.
Notwithstanding all the uncertainties, managing and adapting to those risks in LAC’s agriculture merit special attention. The agricultural sector in the region needs to consider research and investments for adaptation to climate change in agriculture, such as the development of new varieties, using both biotechnology and conventional approaches, to enhance adaptation to highly variable conditions; different planting and/or harvesting dates; shifting areas for production,
considering changes in temperature, rainfall, daylight, and the evolution of pests and diseases; and, in general, improve risk management systems. In particular, extreme weather events, especially droughts and floods, demonstrate the urgent need for building resilience into production systems, including improved irrigation and water management schemes to achieve a more efficient use of the resource. Variable weather patterns require strengthening early warning and early response systems.
But, agricultural R&D must include both adaptation and mitigation issues, considering that, in LAC, agriculture and land-use changes contribute up to two-thirds of the GHG emissions against less than one-third globally. Therefore, to contribute to maintaining GHG emissions on a sustainable path, LAC’s R&D must focus on forest preservation, recovery of degraded pastures, use of minimum-tillage approaches, the development of other carbon sinks, sustainable livestock production (as recent CIAT research is demonstrating), emissions reduction in rice production, appropriate fertilizer use, and integrated management of pests and nutrients. As part of both adaptation and mitigation, R&D should also be a priority on biodiversity identification, sustainable use, and conservation.
The Importance of “Multiple-Win” Technologies
Society is expecting agriculture and food production to address those complex challenges in an interrelated way. Therefore, any approach to decision making regarding R&D in agriculture needs to consider technologies that generate “multiple wins.” For instance, technologies can be graded considering several dimensions, such as (a) increases in yield, efficiency, and productivity in general; (b) a reduction in the use of material inputs (agrochemicals, water, and energy); (c) support for family and small farms, while being gender and ethnically sensitive, and socially equitable; (d) strengthening the resilience of farmers and vulnerable rural populations in different climate change scenarios; and (e) reducing GHG emissions from agriculture while increasing carbon storage on farmland, with adequate management of natural resources and biodiversity, and avoiding local pollution. At the same time, other criteria, such as scientific merits and programmatic concerns (including feasibility and readiness, and logistics and infrastructure), may have to be considered in agricultural R&D decisions (Popper et al., 2000).
38
In this regard, CIAT’s “eco-efficiency” approach (CIAT, 2013) is a helpful way to assess technologies according to their ability to generate multiple wins. Defining and using this type of complex metrics to decide across R&D&I options is still a work in progress (see, for instance, Pardey, 2012; and CIAT, 2013). However, some of the components of that multi-criteria approach may be imposed in the end by the private sector, following perceived consumers’ preferences (such as carbon footprint, energy use, impact on biodiversity, fair-trade approaches, etc.).
On this subject, CIAT published a study on “eco-efficiency” (CIAT, 2013), in which different paths are discussed to obtain multiple objectives: (a) increase productivity with lower inputs of all types, including water and energy, and with adequate management of natural resources (see Keating et al., 2013); (b) support smallholders while being gender sensitive and socially equitable; (c) strengthen the resilience of farmers and vulnerable rural population to climate change; and (d) reduce GHG emissions from agriculture while increasing carbon storage on farmland.
Therefore, from the point of view of agricultural technology R&D&I, fostering eco-efficiency must consider “multiple-win” technologies, that is, in which several of the multiple objectives can be attained in parallel by a given technology or a package of technologies. A key issue is how to build adequate metrics that can capture and rank this multidimensional approach. To identify the most promising technologies, it will be necessary to apply new tools and concepts, such as product life-cycle analysis, green value chains, and carbon footprint measurement, with approaches based on participatory research, dynamic knowledge sharing, and capacity building (CIAT, 2012). In addition, scientific merits (such as the potential for further technological advances) and programmatic concerns (such as feasibility and readiness, logistics and infrastructure, and research community commitment) may drive final decisions on agricultural R&D.56
Waste Reduction and Agricultural R&D
FAO (2011) estimates that perhaps as much as 30% of global food today is lost or wasted. The Foresight Report (2011a) notes that food waste and the impact on food production and consumption tend to be
56 For instance, Popper et al. (2000), when reviewing the setting of priorities for R&D in the U.S. federal system, consider the approach they call “alternative weightings,” for which three blocks of general categories are considered: “scientific merit,” “social benefits,” and “programmatic concerns.” Within each area are other subcriteria.
30−40%, but there are not many detailed studies across products and countries. More analyses on these topics (see Reardon et al., 2012) are needed to ascertain the amount of waste across food value chains, and the sources and principal causes for this.
Still, it is appropriate to include crop loss and food waste reduction as one of the R&D priorities. As discussed before, the sources of waste and the place in the food chain differ significantly between developed and developing countries. In the first case, they occur more at the level of the end-user (related in many cases to private-sector standards and consumers’ choices), while in the second case, losses happen mostly between harvest and processing (usually because of a lack of infrastructure) (see Foresight, 2011e).
Of course, much of the waste to be avoided would result from private-sector decisions (mainly in the food chain beyond the farm and closer to the final consumer) and/or public-sector investments unrelated to agricultural R&D as such. Those non-R&D interventions may include infrastructure improvements (cold storage, transportation), better demand and weather forecasts, consumer education, and changes in standards (to avoid discarding edible food just because of external appearance). Many of these interventions are not necessarily related to agricultural R&D as usually interpreted, but there are different pre- and post-harvest processes in which agricultural R&D is relevant, such as reducing the incidence of pests or improved storage equipment and practices. A strong and successful effort to reduce waste may then reduce the need to increase overall production by the percentages usually estimated.
Agricultural R&D must closely Follow Changes in Consumers’ Preferences and Public Policies on Health
A clear imperative flowing from consumers’ preferences is the need to produce healthy, safe, and high-quality food products. Agricultural R&D activities must incorporate those concerns. The development of standards should consider the possibility of smallholders participating in those markets, the need to avoid waste, and the need for sanitary standards to converge in export and domestic markets.
39
Also, it was argued before that decision making about R&D priorities might need to use multiple criteria. Defining and using complex metrics to decide across R&D options is still a work in progress. However, some of the components of that multi-criteria approach may be imposed in the end by the private sector following perceived consumers’ preferences, such as carbon footprint, energy use, the impact on biodiversity, fair-trade approaches, and similar concerns. Consumers’ desire for novelty can be addressed by developing little-known species and varieties, now produced by traditional farmers and consumed in local markets. Focused R&D efforts can help create specialty markets for those products in which (some) smallholders can possibly participate.
The increased urbanization of LAC, and the fact that the number of poor and food-insecure is larger in urban centers, requires a more detailed consideration of urban food systems. Also, different developing countries, including many in LAC, are experiencing the “double burden” of malnutrition, which is correlated with health issues because of both under-nutrition and over-nutrition. An efficient way of improving health is to enhance the nutritional quality of the staple crops consumed by low-income populations, as does part of the ongoing research on biofortified crops (rice, beans, cassava) in Latin America, Asia, and Africa (HarvestPlus project).57 Finally, the evolution of meat consumption in both developed and developing countries, the impact of the aging population on food consumption, strong policy drives to reduce waste, unequal access to nutritious food, and health concerns (perhaps leading to taxes on different types of foods considered unhealthy) may change the level and composition of expected food demand. Scenarios such as policy reform and global change reflect those trends.
All those consumer concerns and related public policy initiatives must be acknowledged within agricultural R&D priorities, requiring a comprehensive consideration of the options involved, and given rapid changes, the need for better understanding of these dynamics.
Continuous Adaptation and Improvement of the Institutional R&D Framework Is Crucial
Whatever the decisions about R&D priorities may be, it is crucial to consider the institutional aspects linked to
their implementation: how to build capacity in public and private organizations; how to establish successful cooperation and networks across public and private initiatives (including farmers and indigenous and rural communities possessing traditional knowledge, consumers, upstream and downstream agro-industries, and supermarkets and other outlets working directly with consumers); how to strengthen channels for the transfer of innovations; the establishment of regulatory frameworks for the management of natural resources, such as water, biodiversity, and forests; and, crucially, how to finance all of the above.
As discussed before, the institutions for agricultural R&D in the region have evolved considerably, starting with the creation of public-sector NARS in the late 1950s, earlier than in other developing regions. Over time, a complex regional institutional framework took shape. More recently, the private sector, including multinational companies, producers associations, and NGOs, has been expanding its activities in the development and dissemination of agricultural technology and, in many cases, the private sector has stronger capacity than NARS in modern techniques, such as those linked to -omics, engineering, and informatics.
Other important developments are changing the landscape in which agricultural R&D institutions, especially public ones, must operate. One is related to the trend toward the convergence of life sciences (including those related to agriculture) with physics, chemistry, computer sciences, mathematics, and engineering, leading to the emergence of new interdisciplinary research areas. As argued, these new research areas require significant capacity building and interdisciplinary integration in LAC, as well as institutional changes. Supporting institutional innovation and expanding human capital and capacity are particularly important, given that many researchers in LAC’s public institutions are approaching retirement age.
Another development is that agriculture is expected to attend multiple demands, from increasing supply and alleviating poverty to considering health and equity requirements, and environmental sustainability and climate change challenges. Those multiple expectations about agriculture also affect R&D institutions, which must go beyond a primary production focus to include the forward and backward linkages of the value chain,
57 www.harvestplus.org
40
and consider the views of a variety of social actors. As was noted before, private-sector actors would follow market approaches based on private estimates of costs and benefits. The consideration and pricing of externalities and alternative societal objectives requires strengthening public policies, institutions, and investments related to agricultural R&D.
There is also the realization that the problems affecting society require us to focus on innovation, which is a broader concept than R&D. Therefore, adjustments in R&D institutions must operate at three levels: first, the individual NARS; second, the national system of R&D and technology transfer; and, finally, the more general system of the national policies and institutions of the innovation system (Trigo, 2012).
All these developments are profoundly changing the setting in which NARS now operate. Therefore, they need significant adjustments in their operations and financing, and require new organizational approaches, particularly to coordinate networks across multiple actors. In many cases, individual countries in the region do not have the scale to undertake some of the R&D activities alone; therefore, a central task is to expand regional and international networks. This is particularly important for the smaller and poorer countries in the region.
A crucial issue is funding those activities, which includes two separate questions: What is the level of investments? And, what are the financing mechanisms? (Trigo, 2012). Regarding the first issue, it was already mentioned that R&D investments in the region should at least be doubled, particularly in the smaller and poorer countries that are most in need of expanding agricultural R&D activities. These countries will also benefit from support to integrate them in regional and international networks. Regarding the second question, most of the funding is public and focuses on the NARS. But, it is necessary to innovate in funding mechanisms, which must ensure agile operational approaches and the integration of resources and capabilities from the institutions involved, including private-sector participation.
In summary, the current system will have to expand into coordinated national, regional, and global systems and networks of innovation, including reformed NARS, international organizations, universities, the private sector, consumers, and other stakeholders. Also, country investments in LAC must double the current
average ratio of agricultural R&D intensity in LAC of about 1% of agricultural GDP. In most of the scenarios, this will not happen spontaneously, or will not happen at all, without decisive public policy decisions and investments.
R&D Priority Setting cannot Follow just One Approach
One thing to be noted is that there are different approaches to increasing agricultural and food availability (see the more detailed discussion in Díaz-Bonilla et al., 2013). One is to eliminate waste (more on this below). A second way of increasing production would be to ensure that “yield gaps” or “best-practice gaps” are closed across farmers, regions, and countries. This would require some agricultural R&D on adaptation activities, but most public-sector interventions would be in other areas, such as strengthening extension services; providing health and education services in rural areas; expanding financing and sustainable risk-management techniques; facilitating efficient and transparent markets; and ensuring access to land and water, especially for the rural poor, among other things. In all these interventions, it is crucial to consider gender issues and the impact on vulnerable and marginal groups. Finally, a third way is to increase the “production possibility frontier.” This is the context in which most agricultural R&D is usually discussed. A useful discussion on this is provided by Keating and Carberry (2010).
Complex decisions need to be made across all those options, including (a) What are the main problems to be solved, the overall implications for human well-being, and who is being affected (distributive impacts)? (b) What should be the overall allocation of funds to the problems/issues? (c) How are funds further distributed regarding the different approaches to potential solutions? and (d) What are the complementarities between the public and private sectors to address those issues?
An approach to answering those questions is to work with overlapping sets of information showing the spatial concentration of (a) the production of the relevant crops considered, (b) population and poverty distribution, and (c) market access (Pardey, 2012). Combining agronomic, climate, social, and market information (reflecting consumers’ changing preferences) in geo-referenced maps can help to better guide R&D efforts. However, spatial data, although
41
58 Another thorough revision of R&D priorities for LAC can be found in Armbrecht and Avila (2009). See also the list of priorities for research attached in Annex 2.
increasingly available, require a concerted effort to get them into usable form (Pardey, 2012). Modeling approaches can also be used to estimate the overall implications of investing in one product or another. For instance, Nelson et al. (2010) model the differential impact of increasing yield trend growth in different crops from the baseline values to a fixed 2% per year to 2050. The simulations include those increases in productivity in maize, wheat, and cassava. Depending on the crop in which those productivity increases take place, the simulations show different impacts on world prices (its own and other products), available calories, malnourished children, and net trade. Conceivably, it would be possible to standardize the simulations so as to make comparisons that can suggest a ranking across products for a comparable increase in productivity (which would be different from a simulation that postulates a uniform increase to 2% for each crop). Another issue would be how much does it cost to generate comparable (however defined) improvements in productivity? A preliminary exercise to answer that question was attempted in Díaz-Bonilla et al. (2003) (see a brief discussion in Díaz-Bonilla et al., 2013).
Even if those or other modeling exercises provide a broad view of what products may have a better payoff (however defined), there is still a further issue: how to evaluate the range of potentially relevant technologies for a specific product (crop or livestock) or problem. That list may be long, as demonstrated by the priorities presented by FORAGRO at GCARD I (see Díaz-Bonilla et al., 2013). In particular, biotechnology will be crucial to achieve better productivity, for both crops and livestock, helping increase the tolerance of biotic (pests and diseases) and abiotic (climate and soil) stresses. In addition, more efficient agronomic practices are needed for water management, improved zero tillage, integrated soil fertility management, integrated pest management, and a reduction in post-harvest losses.58
Finally, foresight exercises based on global scenarios, while helping with the broad outline of R&D strategies that would be robust across potential futures, may be too aggregate for the type of detailed decision making required at more operational levels. In this regard, what may be needed to identify the most promising technologies is the application of some of the more focused methods discussed, and the use of new tools
and concepts, such as product life-cycle analysis, green value chains, and carbon footprint measurement, with approaches based on participatory research (Open Science), dynamic knowledge sharing, big data management, and capacity building (CIAT, 2012).
Therefore, it seems important to maintain the diversity in foresight approaches and other strategic planning and methods of prioritizing technology decisions, some of which can be used at a world or regional scale, while others can be used for specific problems, areas, agricultural activities, and/or types of producers. Certainly, no single method can address all the questions and issues that are relevant for planning and implementing agricultural technology activities.
Final Comments
This review highlights the enormous challenges that lie ahead for agricultural R&D in LAC, involving concerns about food security, poverty, malnutrition, and environmental sustainability in the face of climate change. Powerful socioeconomic drivers could keep this region and the world on a business-as-usual path that may prove to be unsustainable. Re-shaping those trends requires multiple interventions that go beyond the scope of agricultural R&D in LAC countries, and range from land distribution problems to solving global macro-economic imbalances and restoring world energy and climate balances. In all scenarios, however, the need for higher sustained investment in agricultural technology and innovation in LAC appears as a robust conclusion. Greater investment in LAC’s agricultural and food production, including R&D, is vital for achieving food and nutrition security and environmental sustainability – not just in this region but for the entire world.
As part of those efforts, and along with its responsibilities to other developing regions, the institutions involved in this exercise (see Annex 1) will continue to support foresight work and strategic planning in LAC that can help identify and develop appropriate agricultural technology options generating income and employment for family farms and the rural poor in that region, while fostering local, national, and global food security and sustainability. This document intends to be an input into that process.
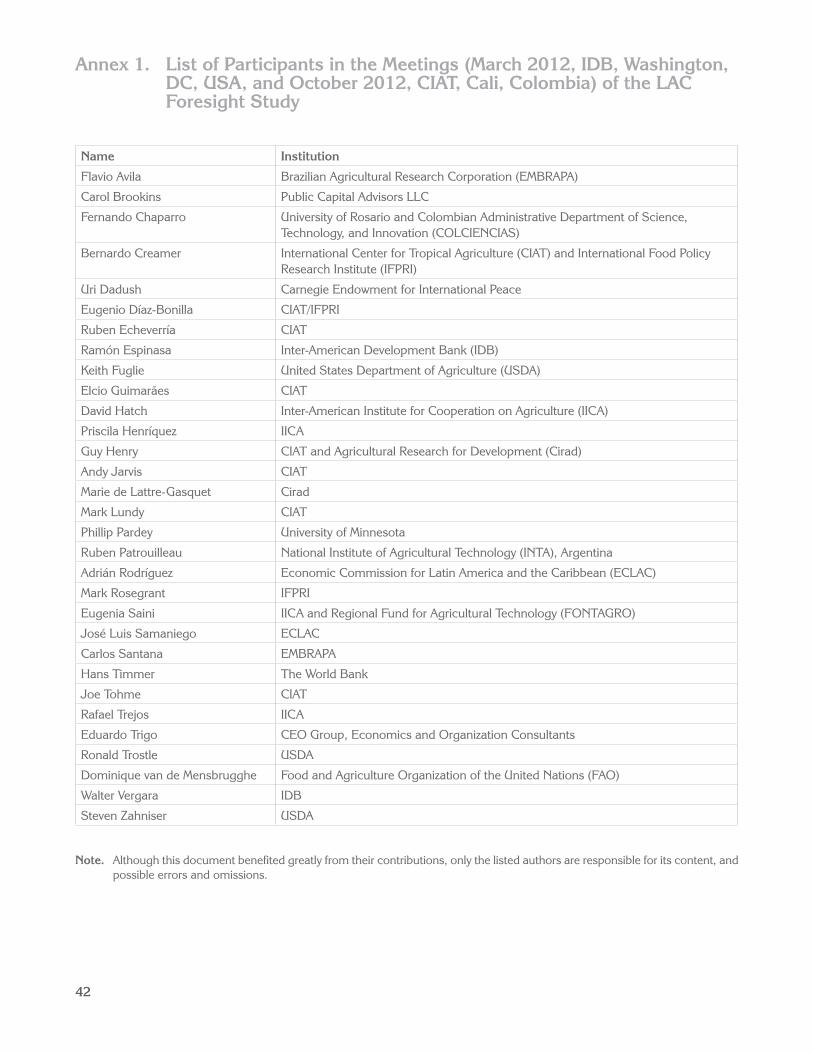
42
Annex 1. List of Participants in the Meetings (March 2012, IDB, Washington, DC, USA, and October 2012, CIAT, Cali, Colombia) of the LAC Foresight Study
Name Institution
Flavio Avila Brazilian Agricultural Research Corporation (EMBRAPA)
Carol Brookins Public Capital Advisors LLC
Fernando Chaparro University of Rosario and Colombian Administrative Department of Science, Technology, and Innovation (COLCIENCIAS)
Bernardo Creamer International Center for Tropical Agriculture (CIAT) and International Food Policy Research Institute (IFPRI)
Uri Dadush Carnegie Endowment for International Peace
Eugenio Díaz-Bonilla CIAT/IFPRI
Ruben Echeverría CIAT
Ramón Espinasa Inter-American Development Bank (IDB)
Keith Fuglie United States Department of Agriculture (USDA)
Elcio Guimarães CIAT
David Hatch Inter-American Institute for Cooperation on Agriculture (IICA)
Priscila Henríquez IICA
Guy Henry CIAT and Agricultural Research for Development (Cirad)
Andy Jarvis CIAT
Marie de Lattre-Gasquet Cirad
Mark Lundy CIAT
Phillip Pardey University of Minnesota
Ruben Patrouilleau National Institute of Agricultural Technology (INTA), Argentina
Adrián Rodríguez Economic Commission for Latin America and the Caribbean (ECLAC)
Mark Rosegrant IFPRI
Eugenia Saini IICA and Regional Fund for Agricultural Technology (FONTAGRO)
José Luis Samaniego ECLAC
Carlos Santana EMBRAPA
Hans Timmer The World Bank
Joe Tohme CIAT
Rafael Trejos IICA
Eduardo Trigo CEO Group, Economics and Organization Consultants
Ronald Trostle USDA
Dominique van de Mensbrugghe Food and Agriculture Organization of the United Nations (FAO)
Walter Vergara IDB
Steven Zahniser USDA
Note. Although this document benefited greatly from their contributions, only the listed authors are responsible for its content, and possible errors and omissions.
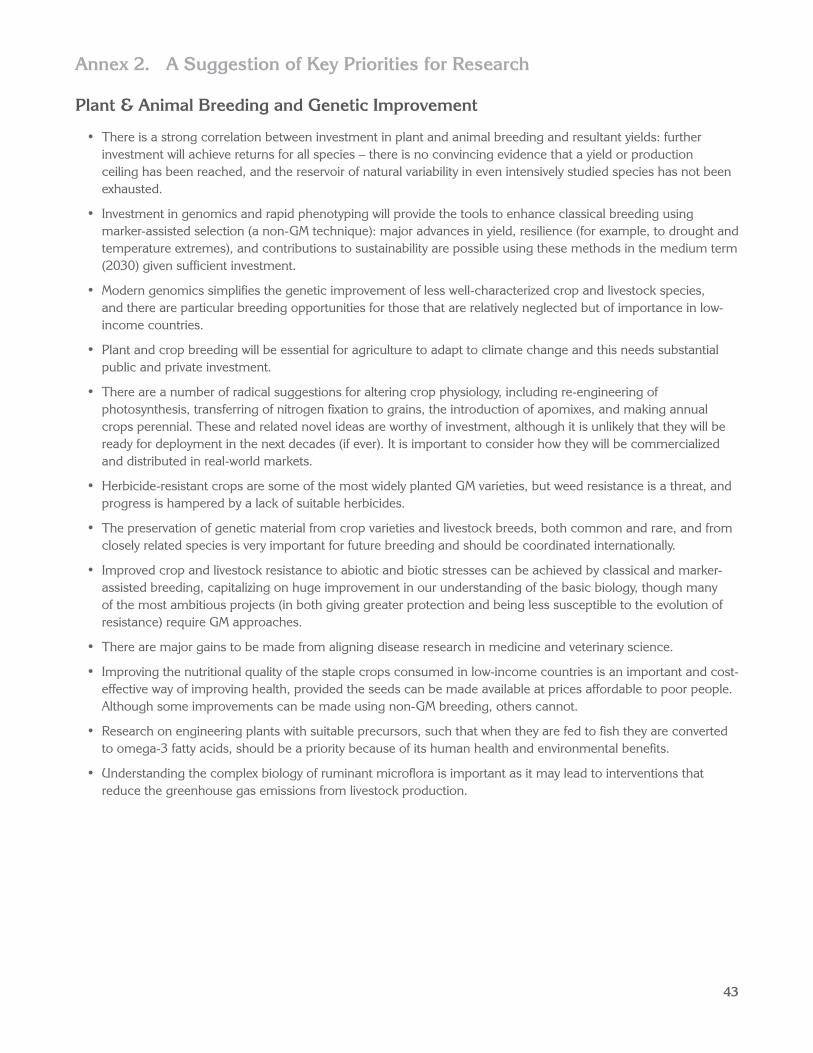
43
Annex 2. A Suggestion of Key Priorities for Research
Plant & Animal Breeding and Genetic Improvement
• There is a strong correlation between investment in plant and animal breeding and resultant yields: further investment will achieve returns for all species – there is no convincing evidence that a yield or production ceiling has been reached, and the reservoir of natural variability in even intensively studied species has not been exhausted.
• Investment in genomics and rapid phenotyping will provide the tools to enhance classical breeding using marker-assisted selection (a non-GM technique): major advances in yield, resilience (for example, to drought and temperature extremes), and contributions to sustainability are possible using these methods in the medium term (2030) given sufficient investment.
• Modern genomics simplifies the genetic improvement of less well-characterized crop and livestock species, and there are particular breeding opportunities for those that are relatively neglected but of importance in low-income countries.
• Plant and crop breeding will be essential for agriculture to adapt to climate change and this needs substantial public and private investment.
• There are a number of radical suggestions for altering crop physiology, including re-engineering of photosynthesis, transferring of nitrogen fixation to grains, the introduction of apomixes, and making annual crops perennial. These and related novel ideas are worthy of investment, although it is unlikely that they will be ready for deployment in the next decades (if ever). It is important to consider how they will be commercialized and distributed in real-world markets.
• Herbicide-resistant crops are some of the most widely planted GM varieties, but weed resistance is a threat, and progress is hampered by a lack of suitable herbicides.
• The preservation of genetic material from crop varieties and livestock breeds, both common and rare, and from closely related species is very important for future breeding and should be coordinated internationally.
• Improved crop and livestock resistance to abiotic and biotic stresses can be achieved by classical and marker-assisted breeding, capitalizing on huge improvement in our understanding of the basic biology, though many of the most ambitious projects (in both giving greater protection and being less susceptible to the evolution of resistance) require GM approaches.
• There are major gains to be made from aligning disease research in medicine and veterinary science.
• Improving the nutritional quality of the staple crops consumed in low-income countries is an important and cost-effective way of improving health, provided the seeds can be made available at prices affordable to poor people. Although some improvements can be made using non-GM breeding, others cannot.
• Research on engineering plants with suitable precursors, such that when they are fed to fish they are converted to omega-3 fatty acids, should be a priority because of its human health and environmental benefits.
• Understanding the complex biology of ruminant microflora is important as it may lead to interventions that reduce the greenhouse gas emissions from livestock production.
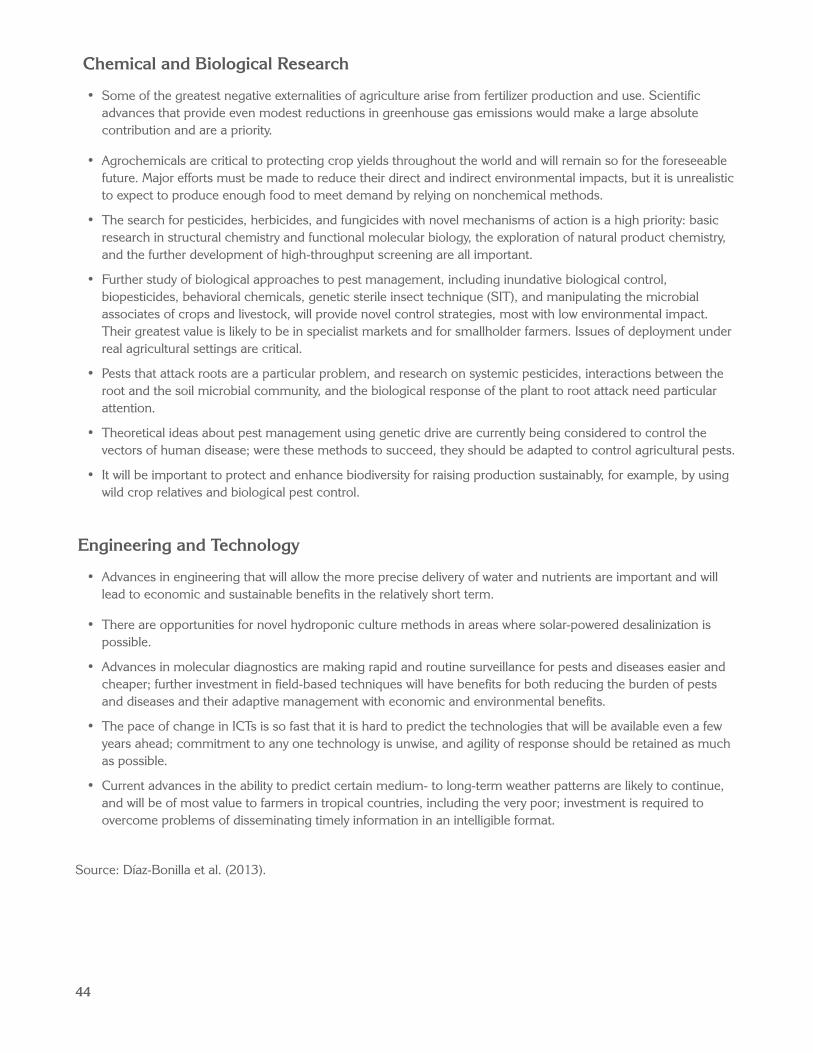
44
Chemical and Biological Research
• Some of the greatest negative externalities of agriculture arise from fertilizer production and use. Scientific advances that provide even modest reductions in greenhouse gas emissions would make a large absolute contribution and are a priority.
• Agrochemicals are critical to protecting crop yields throughout the world and will remain so for the foreseeable future. Major efforts must be made to reduce their direct and indirect environmental impacts, but it is unrealistic to expect to produce enough food to meet demand by relying on nonchemical methods.
• The search for pesticides, herbicides, and fungicides with novel mechanisms of action is a high priority: basic research in structural chemistry and functional molecular biology, the exploration of natural product chemistry, and the further development of high-throughput screening are all important.
• Further study of biological approaches to pest management, including inundative biological control, biopesticides, behavioral chemicals, genetic sterile insect technique (SIT), and manipulating the microbial associates of crops and livestock, will provide novel control strategies, most with low environmental impact. Their greatest value is likely to be in specialist markets and for smallholder farmers. Issues of deployment under real agricultural settings are critical.
• Pests that attack roots are a particular problem, and research on systemic pesticides, interactions between the root and the soil microbial community, and the biological response of the plant to root attack need particular attention.
• Theoretical ideas about pest management using genetic drive are currently being considered to control the vectors of human disease; were these methods to succeed, they should be adapted to control agricultural pests.
• It will be important to protect and enhance biodiversity for raising production sustainably, for example, by using wild crop relatives and biological pest control.
Engineering and Technology
• Advances in engineering that will allow the more precise delivery of water and nutrients are important and will lead to economic and sustainable benefits in the relatively short term.
• There are opportunities for novel hydroponic culture methods in areas where solar-powered desalinization is possible.
• Advances in molecular diagnostics are making rapid and routine surveillance for pests and diseases easier and cheaper; further investment in field-based techniques will have benefits for both reducing the burden of pests and diseases and their adaptive management with economic and environmental benefits.
• The pace of change in ICTs is so fast that it is hard to predict the technologies that will be available even a few years ahead; commitment to any one technology is unwise, and agility of response should be retained as much as possible.
• Current advances in the ability to predict certain medium- to long-term weather patterns are likely to continue, and will be of most value to farmers in tropical countries, including the very poor; investment is required to overcome problems of disseminating timely information in an intelligible format.
Source: Díaz-Bonilla et al. (2013).
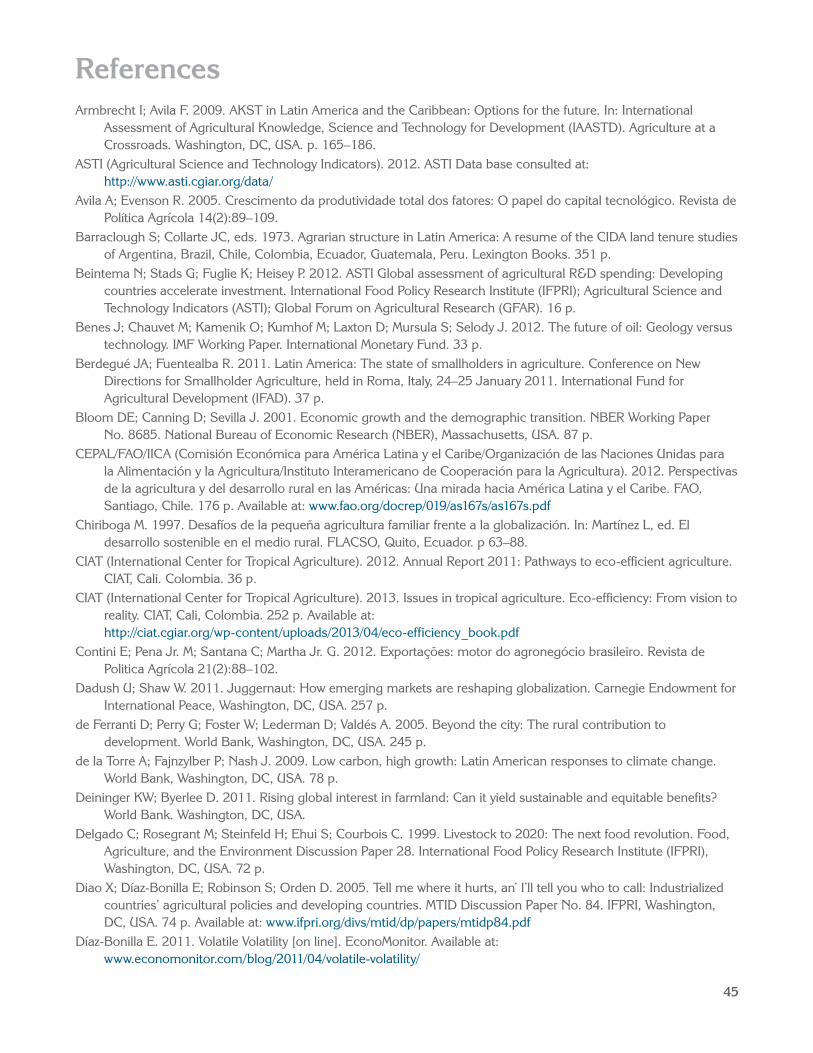
45
ReferencesArmbrecht I; Avila F. 2009. AKST in Latin America and the Caribbean: Options for the future. In: International
Assessment of Agricultural Knowledge, Science and Technology for Development (IAASTD). Agriculture at a Crossroads. Washington, DC, USA. p. 165–186.
ASTI (Agricultural Science and Technology Indicators). 2012. ASTI Data base consulted at: http://www.asti.cgiar.org/data/
Avila A; Evenson R. 2005. Crescimento da produtividade total dos fatores: O papel do capital tecnológico. Revista de Política Agrícola 14(2):89–109.
Barraclough S; Collarte JC, eds. 1973. Agrarian structure in Latin America: A resume of the CIDA land tenure studies of Argentina, Brazil, Chile, Colombia, Ecuador, Guatemala, Peru. Lexington Books. 351 p.
Beintema N; Stads G; Fuglie K; Heisey P. 2012. ASTI Global assessment of agricultural R&D spending: Developing countries accelerate investment. International Food Policy Research Institute (IFPRI); Agricultural Science and Technology Indicators (ASTI); Global Forum on Agricultural Research (GFAR). 16 p.
Benes J; Chauvet M; Kamenik O; Kumhof M; Laxton D; Mursula S; Selody J. 2012. The future of oil: Geology versus technology. IMF Working Paper. International Monetary Fund. 33 p.
Berdegué JA; Fuentealba R. 2011. Latin America: The state of smallholders in agriculture. Conference on New Directions for Smallholder Agriculture, held in Roma, Italy, 24–25 January 2011. International Fund for Agricultural Development (IFAD). 37 p.
Bloom DE; Canning D; Sevilla J. 2001. Economic growth and the demographic transition. NBER Working Paper No. 8685. National Bureau of Economic Research (NBER), Massachusetts, USA. 87 p.
CEPAL/FAO/IICA (Comisión Económica para América Latina y el Caribe/Organización de las Naciones Unidas para la Alimentación y la Agricultura/Instituto Interamericano de Cooperación para la Agricultura). 2012. Perspectivas de la agricultura y del desarrollo rural en las Américas: Una mirada hacia América Latina y el Caribe. FAO, Santiago, Chile. 176 p. Available at: www.fao.org/docrep/019/as167s/as167s.pdf
Chiriboga M. 1997. Desafíos de la pequeña agricultura familiar frente a la globalización. In: Martínez L, ed. El desarrollo sostenible en el medio rural. FLACSO, Quito, Ecuador. p 63–88.
CIAT (International Center for Tropical Agriculture). 2012. Annual Report 2011: Pathways to eco-efficient agriculture. CIAT, Cali. Colombia. 36 p.
CIAT (International Center for Tropical Agriculture). 2013. Issues in tropical agriculture. Eco-efficiency: From vision to reality. CIAT, Cali, Colombia. 252 p. Available at: http://ciat.cgiar.org/wp-content/uploads/2013/04/eco-efficiency_book.pdf
Contini E; Pena Jr. M; Santana C; Martha Jr. G. 2012. Exportações: motor do agronegócio brasileiro. Revista de Politica Agrícola 21(2):88–102.
Dadush U; Shaw W. 2011. Juggernaut: How emerging markets are reshaping globalization. Carnegie Endowment for International Peace, Washington, DC, USA. 257 p.
de Ferranti D; Perry G; Foster W; Lederman D; Valdés A. 2005. Beyond the city: The rural contribution to development. World Bank, Washington, DC, USA. 245 p.
de la Torre A; Fajnzylber P; Nash J. 2009. Low carbon, high growth: Latin American responses to climate change. World Bank, Washington, DC, USA. 78 p.
Deininger KW; Byerlee D. 2011. Rising global interest in farmland: Can it yield sustainable and equitable benefits? World Bank. Washington, DC, USA.
Delgado C; Rosegrant M; Steinfeld H; Ehui S; Courbois C. 1999. Livestock to 2020: The next food revolution. Food, Agriculture, and the Environment Discussion Paper 28. International Food Policy Research Institute (IFPRI), Washington, DC, USA. 72 p.
Diao X; Díaz-Bonilla E; Robinson S; Orden D. 2005. Tell me where it hurts, an’ I’ll tell you who to call: Industrialized countries’ agricultural policies and developing countries. MTID Discussion Paper No. 84. IFPRI, Washington, DC, USA. 74 p. Available at: www.ifpri.org/divs/mtid/dp/papers/mtidp84.pdf
Díaz-Bonilla E. 2011. Volatile Volatility [on line]. EconoMonitor. Available at: www.economonitor.com/blog/2011/04/volatile-volatility/
46
Díaz-Bonilla E; Ron JF. 2010. Food security, price volatility and trade: Some reflections for developing countries. Issue Paper No. 28. International Center for Trade and Sustainable Development (ICTSD), Geneva, Switzerland. 57 p. Available at: http://ictsd.org/downloads/2011/12/food-security-price-volatility-and-trade.pdf
Díaz-Bonilla E; Reca L; Espinal CF; Piñeiro V. 2003. Globalización y agricultura en las Américas: Escenarios para el desarrollo tecnológico de la agricultura hemisférica. Regional Fund for Agricultural Technology (FONTAGRO); Inter-American Institute for Cooperation on Agriculture (IICA); International Food Policy Research Institute (IFPRI). 319 p.
Díaz-Bonilla E; Thomas M; Robinson S; Cattaneo A. 2006. Food security and the World Trade Organization: A typology of countries. In: Díaz-Bonilla E; Frandsen SE; Robinson S, eds. WTO negotiations and agricultural trade liberalization: The effect of developed countries’ policies on developing countries. CAB International. p. 162–183.
Díaz-Bonilla E; Saini E; Henry G; Creamer B. 2012. Better foresighted than myopic – Supporting decisions about agricultural research for development in Latin America and the Caribbean. CIAT Policy Brief. 6 p. Available at: http://ciat.cgiar.org/wp-content/uploads/2012/11/synthesis_foresight.pdf
Díaz-Bonilla E; Saini E; Creamer B; Henry G. 2013. Better to be foresighted than myopic: A foresight framework for agriculture, food security and R&D in Latin America and the Caribbean. CIAT Working document. 194 p. Available at: http://ciat.cgiar.org/wp-content/uploads/2012/11/Better_to_be_Foresighted_than_Myopic.pdf
Dirven M. 2011. Dinámicas del mercado de tierras en los países del Mercosur y Chile: Una mirada analítica-crítica. Food and Agriculture Organization of the United Nations (FAO). 34 p. Available at: www.rlc.fao.org/fileadmin/content/events/semtierras/estudios/dirven.pdf
Echeverría R; Trigo E; Byerlee D. 1996. Institutional change and effective financing of agricultural research in Latin America. World Bank Technical Paper 330. World Bank, Washington, DC, USA. 34 p.
ECLAC (Economic Commission for Latin America and the Caribbean). 2010. Economics of climate change in Latin America and the Caribbean: Summary 2010. United Nations, Santiago, Chile. 107 p. Available at: www.eclac.org/ddsah/publicaciones/xml/9/41909/2010-914-Climate_change-COMPLETO_WEB.pdf
EIA (U.S. Energy Information Administration). 2011. Annual Energy Outlook 2011 – with projections to 2035. DOE/EIA 0383(2011). April 2011.
Erdmann D. 2012. Urbanization and its challenges [on line]. Available at: http://gt2030.com/2012/07/16/urbanization-and-its-challenges-introduction-to-the-week-of-july-15-21-discussion/
Espinasa R. 2012. The dynamics of world petroleum markets: 1986 to 2010, Scenario 2030 [presentation]. Inter-American Development Bank. Available at: http://ciat.cgiar.org/wp-content/uploads/2012/11/the_dynamics_of_world_petroleum_markets.pdf
FAO (Food and Agriculture Organization of the United Nations). 2006. The double burden of malnutrition: Case studies from six developing countries. FAO Food and Nutrition Paper 84. FAO, Rome, Italy. 97 p. Available at: ftp://ftp.fao.org/docrep/fao/009/a0442e/a0442e00.pdf
FAO (Food and Agriculture Organization of the United Nations) 2011. Global food losses and food waste. Extent, causes and prevention. Study conducted for the International Congress. Safe Food! At Interpack2011 Düsseldorf, Germany.
FAO (Food and Agriculture Organization of the United Nations). 2012. Dinámicas del mercado de la tierra en América Latina y el Caribe: Concentración y extranjerización. FAO, Rome, Italy. 592 p. Available at: www.fao.org/docrep/019/i2547s/i2547s.pdf
FAO/WHO/UNU (Food and Agriculture Organization of the United Nations/World Health Organization/United Nations University). 2004. Human Energy Requirements: Report of a Joint FAO/WHO/UNU Expert Consultation. FAO, Rome, Italy, October 17–24, 2001. 96 p. Available at: ftp://ftp.fao.org/docrep/fao/007/y5686e/y5686e00.pdf
FAOSTAT (The Statistics Division of the FAO). http://www.fao.org/economic/ess/en/#.VIDIvzHF-aI Accessed during April–July 2012.
FORAGRO (Forum of the Americas for Agricultural Research and Technology Development). 2010. Agriculture and rural prosperity from the perspective of technological research and innovation in Latin America and the Caribbean. FORAGRO Position 2010: Executive Summary. Available at: http://infoagro.net/archivos_Infoagro/Infotec/biblioteca/Summary%20FORAGRO%20Position_Eng.pdf
47
Foresight. 2011a. The future of food and farming: Final Project Report. The Government Office for Science, London, UK. Available at: https://www.gov.uk/government/uploads/system/uploads/attachment_data/file/288329/11-546-future-of-food-and-farming-report.pdf
Foresight. 2011b. Foresight project on global food and farming futures. Synthesis Report C4: Food system scenarios and modelling.
Foresight. 2011c. Foresight project on global food and farming futures. Synthesis Report C6: Raising the limits of sustainable production. London, UK. 27 p. Available at: www.bis.gov.uk/assets/foresight/docs/food-and-farming/synthesis/11-626-c6-raising-limits-of-sustainable-production.pdf
Foresight. 2011d. Foresight project on global food and farming futures. Synthesis Report C7: Reducing waste. London, UK. 19 p. Available at: www.bis.gov.uk/assets/foresight/docs/food-and-farming/synthesis/11-627-c7-reducing-waste.pdf
Foresight. 2011e. Foresight project on global food and farming futures. Synthesis Report C8: Changing consumption patterns. London, UK. 23 p. Available at: www.bis.gov.uk/assets/foresight/docs/food-and-farming/synthesis/11-628-c8-changing-consumption-patterns.pdf
Garret J; Ruel M. 2003. Stunted children–overweight mother pairs: An emerging policy concern? Discussion Paper 148. International Food Policy Research Institute (IFPRI), Washington, DC, USA. Available at: http://ageconsearch.umn.edu/bitstream/15953/1/dp03148b.pdf
Gillespie J. 2005. Review of book, Byerlee D; Echeverría R, eds. 2002. Agricultural research policy in an era of privatization. Wallingford Oxon, UK: CABI Publishing. 300 p. American Journal of Agricultural Economics 87(1):267–269.
Gordon R. 2012. Is U.S. economic growth over? Faltering innovation confronts the six headwinds. NBER Working Paper 18315. National Bureau of Economic Research.
Gornall J; Betts R; Burke E; Clark R; Camp J; Willett K; Wiltshire A. 2010. Implications of climate change for agricultural productivity in the early twenty-first century. Philosophical Transactions of the Royal Society, Biological Sciences 365:2973–2989.
Hamilton J. 2013. History of oil shocks. In: Parker R; Whaples R, eds. Routledge handbook of major events in economic history. Routledge, London, UK. 456 p.
Hansen J; Sato M; Ruedy R. 2012. Perceptions of climate change. Proceedings of the National Academy of Sciences of the United States of America 109(37)E2415–E2423. DOI:10.1073/pnas.1205276109
Hazell P; Poulton C; Wiggins S; Dorward A. 2010. The future of small farms: Trajectories and policy priorities. World Development 38(10):1349–1361.
Headey D; Fan S. 2010. Reflections on the global food crisis: How did it happen? How has it hurt? And how can we prevent the next one? Research Monograph 165. IFPRI, Washington, DC, USA. 122 p.
Houghton RA. 2008. Carbon flux to the atmosphere from land-use changes 1850–2005 [on line]. TRENDS: A Compendium of Data on Global Change. Carbon Dioxide Information Analysis Center, Oak Ridge National Laboratory, U.S. Department of Energy, Oak Ridge, Tenn, USA. Available at: http://cdiac.esd.ornl.gov/trends/landuse/houghton/houghton.html
IEA (International Energy Agency). 2011. World Energy Outlook. IEA, Paris, France. IEA (International Energy Agency). 2012. Golden rules for a golden age of gas. IEA, Paris, France. 143 p. Available at:
www.worldenergyoutlook.org/media/weowebsite/2012/goldenrules/WEO2012_GoldenRulesReport.pdfIEF (International Energy Forum). 2012. Introductory paper. Symposium on Energy Outlooks held in Riyadh, 23–24
January. Available at: www.ief.org/_resources/files/events/2nd-iea-ief-opec-symposium-on-energy-outlooks/introductory-paper.pdf
IFAD (International Fund for Agricultural Development). 2010. Rural Poverty Report 2011. Rome, Italy.IMF (International Monetary Fund). 2006. World Economic Outlook April 2007: Spillovers and Cycles in the Global
Economy. 316 p. Available at: www.imf.org/external/pubs/cat/longres.aspx?sk=19780.0 IMF (International Monetary Fund). 2012. World Economic Outlook: Coping with high debt and sluggish growth.
October 2012. Available at: www.imf.org/external/pubs/ft/weo/2012/02/Islam N. 2003. What have we learnt from the convergence debate? Journal of Economic Surveys 17(3):309–362.
48
James C. 2011. Global status of commercialized Biotech/GM crops. ISAAA Brief 43-2011. The International Service for the Acquisition of Agri-biotech Applications (ISAAA), Ithaca, New York, USA. Available at: www.isaaa.org/resources/publications/briefs/43/executivesummary/default.asp
Jarvis A. 2012. Presentation at the Foresight in Agriculture. A Workshop on Agricultural and Food Production in Latin America and the Caribbean (LAC). 2–3 October 2012. CIAT, Cali, Colombia.
Keating B; Carberry P. 2010. Sustainable production, food security and supply chain implications. Aspects of Applied Biology 102:7–20.
Keating B; Carberry P; Thomas S; Clark J. 2013. Eco-efficient agriculture and climate change: Conceptual foundations and frameworks. In: International Center for Tropical Agriculture (CIAT). Eco-efficiency: From vision to reality. CIAT, Cali, Colombia. p. 19–28.
Lipton M. 2005. The family farm in a globalizing world: The role of crop science in alleviating poverty. 2020 Discussion Paper No. 40. Washington, DC, USA: International Food Policy Research Institute.
Maslin M; Austin P. 2012. Uncertainty: Climate models at their limit? Nature 486:183–184. McMillan M; Rodrik D. 2011. Globalization, structural change and productivity growth. NBER Working Paper 17143.
National Bureau of Economic Research (NBER), Massachusetts, USA. 54 p. MIT (Massachusetts Institute of Technology). 2011. The third revolution: The convergence of the life sciences,
physical sciences, and engineering. MIT, Washington, DC, USA. 34 p. Msangi S; Rosegrant M. 2011. Feeding the future’s changing diets: Implications for agriculture markets, nutrition,
and policy. 2020 Conference Paper 3. Conference: Leveraging Agriculture for Improving Nutrition and Health, held in New Delhi, India, February 10–12. 12 p. Available at: www.ifpri.org/sites/default/files/publications/2020anhconfpaper03.pdf
Nagayets O. 2005. Small farms: Current status and key trends. In: The future of small farms. Proceedings of a Research Workshop, Wye, UK, June 26–29. Washington, DC: International Food Policy Research Institute.
Nelson G; Rosegrant M; Palazzo A; Gray I; Ingersoll C; Robertson R; Tokgoz S; Zhu T; Sulser T; Ringler C; Msangi S; You L. 2010. Food security, farming, and climate change to 2050: Scenarios, results, policy options. IFPRI, Washington, DC, USA. 131 p. Available at: www.ifpri.org/sites/default/files/publications/rr172.pdf
NRC (National Research Council). 2009. A new biology for the 21st century: Ensuring the United States leads the coming biology revolution. The National Academies Press, Washington, DC, USA. 112 p.
Obstfeld M. 2012. The current account and global financial markets. IMF Conference on Analyzing (External) Imbalances. February 2, Washington, DC, USA. Available at: www.imf.org/external/np/seminars/eng/2012/imbalances/pdf/obstfeld.pdf
Pardey PG. 2012. Foresight in LAC agriculture: Agricultural technology & intellectual property [presentation]. Workshop on Foresight in Agriculture: Future Challenges and Opportunities for Latin America and the Caribbean held in the Inter-American Development Bank, Washington, DC, USA, March 30.
Pinstrup-Andersen P. 2011. The food system and its interaction with human health and nutrition. IFPRI. 2020 Conference Brief 13. IFPRI, Washington, DC, USA. 4 p. Available at: www.ifpri.org/sites/default/files/publications/2020anhconfbr13.pdf
Popper S; Wagner C; Fossum D; Stiles W. 2000. Setting priorities and coordinating federal R&D across fields of science: A literature review. Prepared for the National Science Board. RAND Corporation. 77 p.
Pritchett L. 1997. Divergence, big time. The Journal of Economic Perspectives 11(3):3–17. Quah D. 1996. Twin peaks: Growth and convergence in models of distribution dynamics. Centre for Economic
Performance Discussion Paper No. 280. Centre for Economic Performance, London, UK. 24 p. Reardon T; Berdegué JA. 2002. The rapid rise of supermarkets in Latin America: Challenges and opportunities for
development. Overseas Development Institute, Oxford, UK. Development Policy Review 20(4):371–388. Reardon T; Timmer P. 2012. The economics of the food system revolution. Annual Review of Resource Economics
4:225–264. Reardon T; Timmer P; Berdegué J. 2004. The rapid rise of supermarkets in developing countries: Induced
organizational, institutional, and technological change in agrifood systems. Journal of Agricultural and Development Economics 1(2):168–183.
49
Reardon T; Chen K; Minten B; Adriano L. 2012. The quiet revolution in staple food value chains: Enter the dragon, the elephant and the tiger. Asian Development Bank and IFPRI, Manila, Philippines. 286 p. Available at: www.adb.org/sites/default/files/pub/2012/quiet-revolution-staple-food-value-chains.pdf
Ribeiro Vieira Filho JE; Garcia Gasques J; Gervásio de Sousa A. 2011. Agricultura e crescimento: Cenários e projeções. Institute for Applied Economic Research (IPEA), Brasilia, Brazil. 33 p.
Sain G; Ardila J. 2009. Temas y oportunidades para la investigación agropecuaria en América Latina y el Caribe. Programa Cooperativo para el Desarrollo Tecnológico Agroalimentario y Agroindustrial del Cono Sur (PROCISUR); Inter-American Institute for Cooperation on Agriculture (IICA). 41 p.
Salles Filho D; Bin A; Gianoni C; Mendes PJ; Rio C. 2009. GCARD Regional Review for Latin America and Caribbean. FORAGRO; GFAR; GCARD; IICA; PROCISUR. 48 p.
Samaniego JL. 2012. Demography, urbanization and natural resources in Latin America and the Caribbean: Trends and forecasts [presentation]. Foresight in Agriculture: A Workshop on Future Challenges and Opportunities for Latin America and the Caribbean, held at the Inter-American Development Bank, Washington, DC, USA, March 30. Available at: http://ciat.cgiar.org/wp-content/uploads/2012/11/2012_samaniego_cepal.pdf
Schejtman A. 2008. Alcances sobre la agricultura familiar en América Latina. Latin American Center for Rural Development, Santiago, Chile. 26 p.
Schejtman A; Berdegué JA. 2009. The social impact of regional integration in rural Latin America. In: Giordano P, ed. Trade and poverty in Latin America. Washington, DC, USA, Inter-American Development Bank (IDB). p. 249–320.
Soto-Baquero F; Rodríguez M; Falconi C, eds. 2007. Políticas para la agricultura familiar en América Latina y el Caribe. Food and Agriculture Organization of the United Nations (FAO), Inter-American Development Bank (IDB). Santiago, Chile. 145 p.
Spence M. 2011. The next convergence: The future of economic growth in a multispeed world. Farrar, Straus, and Giroux, New York, USA. 320 p.
Temple J; Wößmann L. 2006. Dualism and cross-country growth regressions. Journal of Economic Growth 11(3): 187–228.
The World Bank. 2012. World Development Indicators Database.Trigo E. 2012. Los nuevos escenarios para la institucionalidad de la investigación agroalimentaria en América Latina
y el Caribe [draft]. Buenos Aires, Argentina. Vergara W. 2012. The impacts of climate change in agriculture [presentation]. Foresight in Agriculture: A Workshop
on Future Challenges and Opportunities for Latin America and the Caribbean, held at the Inter-American Development Bank, Washington, DC, USA, March 30.
von Braun J. 2008. When food makes fuel: The promises and challenges of biofuels. In: Brown AG, ed. Biofuels, energy and agriculture: Powering towards or away from food security? Proceedings of the Thirteenth Annual Development Conference held in Canberra, Australia, 15 August 2007. ATSE Crawford Fund. p. 5–13. Available at: www.ifpri.org/sites/default/files/publications/vonbraun08_03.pdf
Wiggins S; Kirsten J; Llambí L. 2010. The future of small farms. World Development 38(10):1341–1348.Wolf C; Dalal S; DaVanzo J; Larson EV; Akhmedjonov A; Dogo H; Huang M; Montoya S. 2011. China and India 2025:
A comparative assessment. RAND Corporation, Santa Monica, CA, USA. 145 p. Available at: www.rand.org/pubs/monographs/MG1009
Zahniser S. 2012. Commodity markets and the USDA agricultural projections to 2020 [presentation]. Foresight in Agriculture: A Workshop on Future Challenges and Opportunities for Latin America and the Caribbean, held at the Inter-American Development Bank, Washington, DC, USA, March 30. Available at: http://ciat.cgiar.org/wp-content/uploads/2012/11/Commodity_Markets_and_the_USDA_Agricultural_projections_to_2020.pdf
Zhong F; Xiang J; Zhu J. 2012. Impact of demographic dynamics on food consumption: A case study of energy intake in China. China Economic Review 23(4):1011–1019.


Cover and layout design: Julio César MartínezProduction editing: Victoria Eugenia RengifoPhoto credits: Neil Palmer/CIAT and Benedikt von Loebell (p. 16)Printing: Velásquez Digital S.A.S., Cali, Colombia

ISBN 978-958-694-143-3