the international communications market 2016
TRANSCRIPT

72
The International Communications Market 2016
3
3 Telecoms and networks
73
Contents
3.1 Telecoms: overview and key market developments 74
Overview 74
Broadband Scorecard 77
Availability and take-up of 4G services continue to grow 79
3.2 The telecoms industry 85
3.3 Fixed voice services 87
3.4 Mobile voice and messaging services 92
3.5 Broadband services 99
Coverage 99
Take-up and use 106
Choice 114

74
3.1 Telecoms: overview and key market developments
A note on the data presented in this chapter
The aim of the ICMR is to benchmark the UK communications sector against a range of comparator countries. In order to allow for international comparability, we have had to source and use the best metrics available. As a result, some of the metrics presented in this chapter differs from those presented in the Connected Nations 2016 report on several counts, such as time periods and definitions.
For example, the data used in the Telecoms chapter are for the year ended December 2015 while the data shown in Connected Nations 2016 report relate to June 2016. In terms of definitions, 3G and 4G mobile coverage in the ICMR represent outdoor population coverage from at least one operator. However, the Connected Nations report focuses on the percentage of premises that have indoor coverage from all four operators, as well as geographic coverage from all four operators. In the case of mobile coverage, there is no international industry standard and available figures used in the ICMR tend to be based on total outdoor coverage.
Overview
Mobile services made up the greatest proportion of telecoms revenues in most of our comparator countries
Total retail telecoms revenues across our comparator countries were £597bn in 2015, with mobile voice and mobile data services contributing almost two-thirds (64%) of this total. Mobile services made up the greatest proportion of telecoms revenues in most of our comparator countries.
The UK had the highest number of fixed voice connections per 100 people, of all comparator countries
The UK had 62 fixed voice connections per 100 people (including managed VoIP) in 2015, up one connection since 2014. The UK was one of only three comparator countries where fixed voice take-up increased.
The proportion of total fixed voice connections that were managed VoIP increased in all comparator countries
In the UK, managed VoIP connections made up only 16.2% of the total, ranking the UK twelfth among the comparator countries. However, the UK proportion had increased, by 1.7pp, since 2014.
The UK had the second highest average number of monthly fixed voice call minutes per person
In all our comparator countries, the average monthly fixed voice call minutes per person declined in 2015. The UK ranked second among our comparator countries, at 122 minutes per person per month, down 12 minutes per month (8.8%) since 2014.
The UK had the highest average per-capita revenue for fixed voice services
The highest average revenue for fixed voice services (including managed VoIP services) was generated in the UK in 2015, at £11.58 per person per month. It was lowest in China, India and Nigeria, at less than £1 per person in all three countries.

75
Household penetration of fixed broadband reached 80% in the UK
The household penetration of fixed broadband increased across most of our comparator countries in 2015. In the UK, it reached 80% by end of 2015, an increase of 3 percentage points since 2014, putting the UK fifth among our comparator countries.
Fixed data traffic volumes grew in most of our comparator countries
With the increasing use of high-speed fixed broadband services, fixed data traffic volumes grew in most of our comparator countries in 2015, pushing down the price per unit of fixed broadband data across most markets. However, there were some countries where the prices increased as more consumers migrated to superfast services, which tend to be more expensive than standard broadband. In the UK, fixed data volumes per head reached 27GB per month as the price declined by 7%, to £0.26 per GB in 2015.
Seventy-two per cent of respondents in the UK were satisfied with the reliability of their household fixed broadband services
Overall satisfaction with fixed broadband services was 70% or higher in five out of nine of the comparator countries in which our consumer research took place, with the UK at 76%. The UK ranked highest, along with the US, on satisfaction with the reliability of household fixed broadband services.
The majority of our comparator countries had more mobile connections than people
In the majority of our comparator countries, the number of mobile connections per 100 people was up in 2015; it ranged from 77 in India to 175 in Russia. The UK was ninth of 18 comparator countries, with 131 mobile connections per 100 people.
Most comparator countries saw an increase in the number of average mobile call minutes per person
In the UK, average use increased by 3.3% to 184 minutes per person in 2015, putting the UK ninth among the comparator countries.
The average number of monthly mobile messages per person decreased in most of our comparator countries
This is mainly due to increasing smartphone take-up, as these devices enable consumers to access alternative text-based services, such as email and instant messaging. The UK had the third highest average mobile messaging use among the comparator countries, with 131 messages per person per month.
Eighty-five per cent of respondents in the UK indicated that they were satisfied with their overall mobile service
Overall satisfaction with mobile services was 80% or higher in five out of nine of the comparator countries in which our consumer research took place, with the UK at 85%.
Mobile data consumption increased in all comparator countries
In 2015, mobile data volumes per capita per month increased in all our comparator countries. In the UK, mobile data consumption reached 1.2GB per head per month, with 4G data accounting for over 85% of total volumes, while the price per unit declined by 33% to £6.68, partly because bundled data allowances continued to increase.

76
Figure 3.1 Key metrics: 2015
Source: IHS / industry data / Ofcom Note: For the purposes of this table most of the figures have been rounded to the nearest whole number. The superfast fixed broadband coverage in this table differs from the 89% premise coverage for speeds of 'up to' 30Mbit/s or more and 90% for speeds of 'up to' 24Mbit/s or more stated in our Connected Nations 2016 report, which were calculated based on detailed premises-level data inputs provided by UK communications providers and relate to June 2016.
UK
FR
A
GE
R
ITA
US
A
JPN
AU
S
ES
P
NE
D
SW
E
PO
L
SG
P
KO
R
BR
A
RU
S
IND
CH
N
NG
A
Telecoms service revenues (£bn) 29 16 23 14 186 70 15 14 6 4 6 3 20 24 14 18 130 6
Monthly telecoms revenues per capita (£)
38 21 23 19 48 46 51 26 31 34 12 49 34 10 8 1 8 3
Total fixed voice revenues, incl. managed VoIP (£bn)
9 4 6 4 23 12 3 3 1 1 1 0.5 2 7 4 2 5 0.02
Fixed voice connections per 100 population (incl. managed VoIP)
62 60 46 38 38 44 38 41 41 36 15 36 51 21 25 2 18 0.1
Managed VoIP connections as % of total fixed voice connections
16 67 58 15 49 54 11 31 80 52 27 32 38 17 8 0.4 6 n/a
Monthly outbound fixed voice call minutes per capita (mins)
122 109 144 68 99 77 101 68 78 85 20 73 92 62 76 4 7 0.1
Total fixed broadband revenues (£bn)
5 2 3 2 38 17 5 3 1 1 1 1 5 6 2 1 40 0.004
Average monthly fixed data volumes per capita (GB)
27 15 12 8 22 38 15 11 19 35 5 21 50 3 5 0.2 4 0.001
Superfast fixed broadband coverage (% of households)
88 41 77 44 88 98 31 77 98 78 53 99 100 54 67 4 48 1
Total mobile revenues (£bn) 15 10 14 9 126 41 7 9 4 2 4 2 13 11 8 15 85 6
Mobile connections per 100 population
131 128 141 155 117 138 130 118 139 164 147 167 117 124 175 77 98 83
Monthly outbound mobile voice call minutes per capita
184 197 118 236 367 159 170 148 138 255 199 220 207 170 321 141 173 70
Mobile broadband connections per 100 people (4G/3G)
110 75 105 108 103 138 125 107 94 126 118 146 117 84 36 11 57 34
Average monthly mobile data volumes per capita (GB)
1.2 0.8 0.6 1.1 2.6 2.4 1.6 0.7 0.6 4.2 1.2 1.9 3.0 0.3 0.3 0.0 0.2 0.1
4G mobile network availability (% of population coverage of at least one operator)
93 80 95 91 98 99 89 81 100 99 100 100 100 48 59 6 87 14
4G as % of all mobile connections
36 27 20 17 50 49 54 26 31 39 14 44 71 10 9 0.2 29 1
4G as % of total mobile data use 85 65 70 47 82 82 75 67 57 57 54 67 97 50 55 8 61 2

77
Broadband Scorecard
We have benchmarked the UK against 18 other European and global peers using a number of broadband metrics, as summarised in Figure 3.2.79 Our key findings include:
ADSL fixed broadband services are widely available in most of our comparator countries. Eight countries, including the UK, had ADSL coverage of 99% or more households by the end of 2015, while Nigeria was the only country where ADSL-based services were available to less than half of households.
Standard fixed broadband services offering advertised speeds of ‘up to’ 10Mbit/s or more were available to 95% or more of households in eight of our comparator countries, including the UK (97%), at the end of 2015. Singapore, South Korea and Japan had the highest availability of these services.
The UK compared favourably to most of the comparator countries in terms of the availability of superfast broadband products (those with advertised speeds of ‘up to’ 30Mbit/s) ranking seventh at 88% of households. South Korea had the highest household superfast product availability at almost 100%, while the Netherlands was highest among our European comparator countries, at 98%.
The UK performed well on the availability of fibre broadband (FTTx) networks; 84% of households were in areas served by fibre, ranking fifth after the Netherlands, South Korea, Singapore and Japan. South Korea, Japan and Singapore typically tend to lead on deployment of new infrastructure, and rank highly on many metrics.
The UK, however, is notable for its limited availability of ‘full fibre’ fibre-to-the-building/fibre-to-the-home (FTTB/H) services, which can offer download speeds of 1Gbit/s or more. These services were available to just over 1% of UK households at the end of 2015, ranking the UK 17th out of 19 countries. In countries such as South Korea, Singapore and Japan, ‘full fibre’ services were available to more than 95% of homes.
The comparatively low availability of ‘full fibre’ services in the UK is partly a result of BT’s decision to use VDSL for the last-mile connectivity of most of its fibre broadband network, and the UK’s lowest rank (18th) was for the proportion of fixed broadband connections that were ‘full fibre’. Japan ranked first on the proportion of ‘full fibre’ broadband connections (73%) followed by South Korea (71%) and Singapore (60%).
The proportion of superfast broadband connections with an advertised speed of ‘up to’ 30Mbit/s or higher increased in all of our comparator countries. In seven comparator countries, more than half of fixed broadband connections were superfast at the end of 2015. In the UK, this proportion was 40%, ranking ninth among our 19 countries. The UK ranked better on connections with advertised speeds ≥30Mbit/s and <100Mbit/s (fifth, at 32%), than on those with advertised speeds ≥100Mbit/s where it was 11th with 7%.80
Eleven comparator countries had 4G mobile population coverage of 90% or more at the end of 2015, while six had 99% or higher coverage. The UK ranked tenth on availability of 4G networks (93%), 81 an increase of 9pp since the end of 2014.
79 The EU5 and EU28 scorecards are provided as appendices to this report. Both can be found at: https://www.ofcom.org.uk/research-and-data/broadband-research/eu-bbroadand-scorecard 80 The UK ranks 17/19 on household coverage of ultrafast fixed broadband with advertised speeds of 300Mbit/s or higher (2%) based on figures provided by Analysys Mason as of September 2016. 81 This represents outdoor population coverage from at least one operator. This differs from the 4G (figure of 72.2%) and 3G (78.1%) coverage stated in our Connected Nations 2016 report, which focuses on the percentage of premises that have indoor coverage from all operators.

78
Figure 3.2 Broadband Scorecard: UK’s position relative to 18 other comparator countries: 2015
UK RANKING
LOWEST HIGHEST
COVERAGE (HOUSEHOLDS) 19 18 17 16 15 14 13 12 11 10 9 8 7 6 5 4 3 2 1 Lead
Country
ADSL
99.9% 100%
CABLE
47% 99%
FTTx
84% 100%
VDSL
83% 95%
FTTB/H
1% 99%
Advertised speed >=10Mbit/s
97% 100%
Advertised speed >=30Mbit/s
88% 100%
Advertised speed >=100Mbit/s
48% 100%
3G mobile
99.0% 100%
4G mobile
93% 100%
CONNECTIONS 19 18 17 16 15 14 13 12 11 10 9 8 7 6 5 4 3 2 1 Lead
Country
ADSL
59% 90%
CABLE
19% 57%
FTTx
22% 73%
FTTB/H 0.3% 73%
>=10Mbit/s and <30Mbit/s
53% 79%
>=30Mbit/s
40% 92%
>=30Mbit/s and <100Mbit/s
32% 49%
>=100Mbit/s
7% 66%
3G mobile
48% 66%
4G mobile
36% 71%
USAGE 19 18 17 16 15 14 13 12 11 10 9 8 7 6 5 4 3 2 1 Lead
Country
Fixed data per capita per month 27GB 50 GB
Mobile data per capita per month 1.2GB 4.2 GB
Source: IHS Notes:
1. For the purposes of this table most of the figures have been rounded to the nearest whole number.
2. Coverage and connections data are for the year-end 2015 3. Mobile broadband includes all data connections made via 3G or 4G cellular networks,
including those made via mobile handsets and using dedicated mobile data dongles and SIMs.
4. In order to provide a comparative benchmark across all 19 countries, 4G (93%) and 3G (99%) mobile coverage encompasses outdoor population coverage from at least one operator. This differs from the 4G (72.2%) and 3G (78.1%) coverage stated in our Connected Nations 2016 report, which focuses on the percentage of premises that have indoor coverage from all operators. The report can be found here: https://www.ofcom.org.uk/research-and-data/infrastructure-research/connected-nations-2016
79
Availability and take-up of 4G services continue to grow
4th generation (4G) mobile communications standard
4G stands for 4th generation, and describes the 4th generation mobile communications standard, which allows internet access at higher speeds than previous standards. All premium smartphones can use 4G services while still being compatible with the previous standards, 2G and 3G.
The first commercial 4G service in the UK was launched in October 2012 by EE after it was granted a licence modification allowing it to use its existing 1800MHz spectrum for 4G. The auction for 4G spectrum concluded in February 2013, with EE, Telefonica (O2), Vodafone, Three and Niche Spectrum Ventures Ltd (a BT Group subsidiary) receiving licences. Vodafone and Telefonica launched their 4G services in August 2013, while Three started its London-based release in December 2013, followed by national roll-out in March 2014.
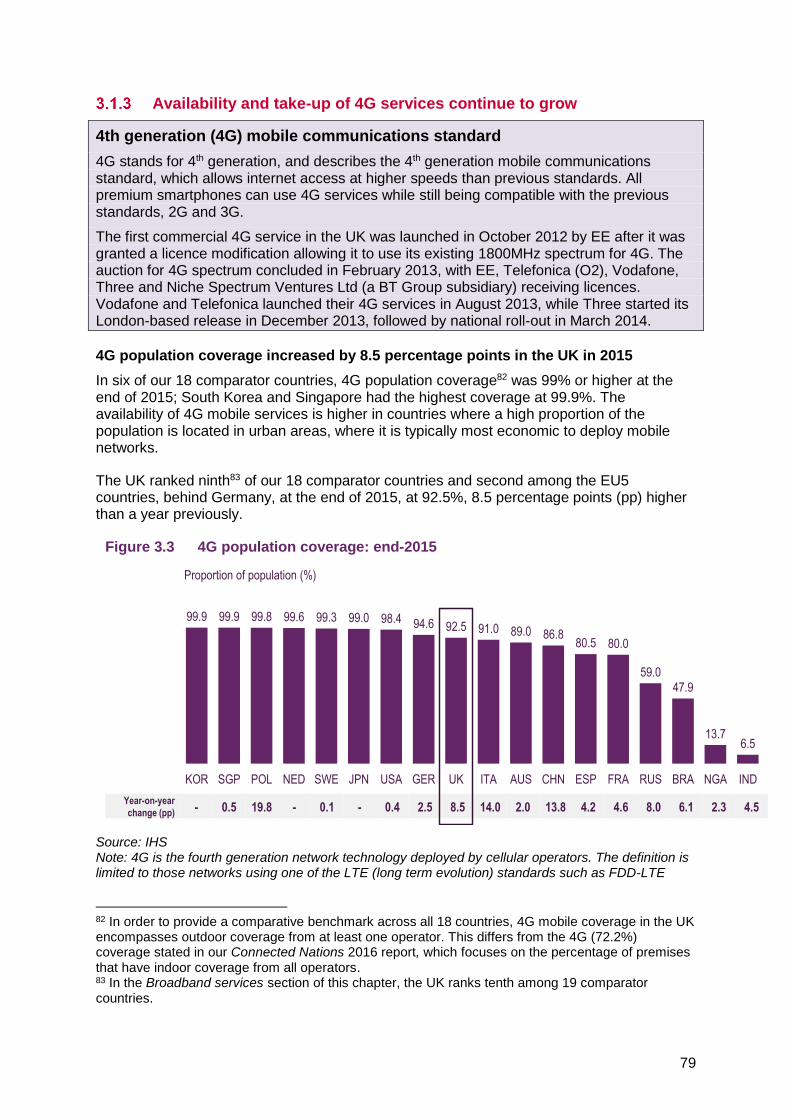
4G population coverage increased by 8.5 percentage points in the UK in 2015
In six of our 18 comparator countries, 4G population coverage82 was 99% or higher at the end of 2015; South Korea and Singapore had the highest coverage at 99.9%. The availability of 4G mobile services is higher in countries where a high proportion of the population is located in urban areas, where it is typically most economic to deploy mobile networks.
The UK ranked ninth83 of our 18 comparator countries and second among the EU5 countries, behind Germany, at the end of 2015, at 92.5%, 8.5 percentage points (pp) higher than a year previously.
Figure 3.3 4G population coverage: end-2015
Source: IHS Note: 4G is the fourth generation network technology deployed by cellular operators. The definition is limited to those networks using one of the LTE (long term evolution) standards such as FDD-LTE
82 In order to provide a comparative benchmark across all 18 countries, 4G mobile coverage in the UK encompasses outdoor coverage from at least one operator. This differs from the 4G (72.2%) coverage stated in our Connected Nations 2016 report, which focuses on the percentage of premises that have indoor coverage from all operators. 83 In the Broadband services section of this chapter, the UK ranks tenth among 19 comparator countries.
99.9 99.9 99.8 99.6 99.3 99.0 98.4 94.6 92.5 91.0 89.0 86.880.5 80.0
59.047.9
13.76.5
KOR SGP POL NED SWE JPN USA GER UK ITA AUS CHN ESP FRA RUS BRA NGA IND
Proportion of population (%)
Year-on-year
change (pp) - 0.5 19.8 - 0.1 - 0.4 2.5 8.5 14.0 2.0 13.8 4.2 4.6 8.0 6.1 2.3 4.5
80
(frequency division duplexing LTE) or TD-LTE (time division LTE); HSPA+ networks or WiMAX networks are not included.
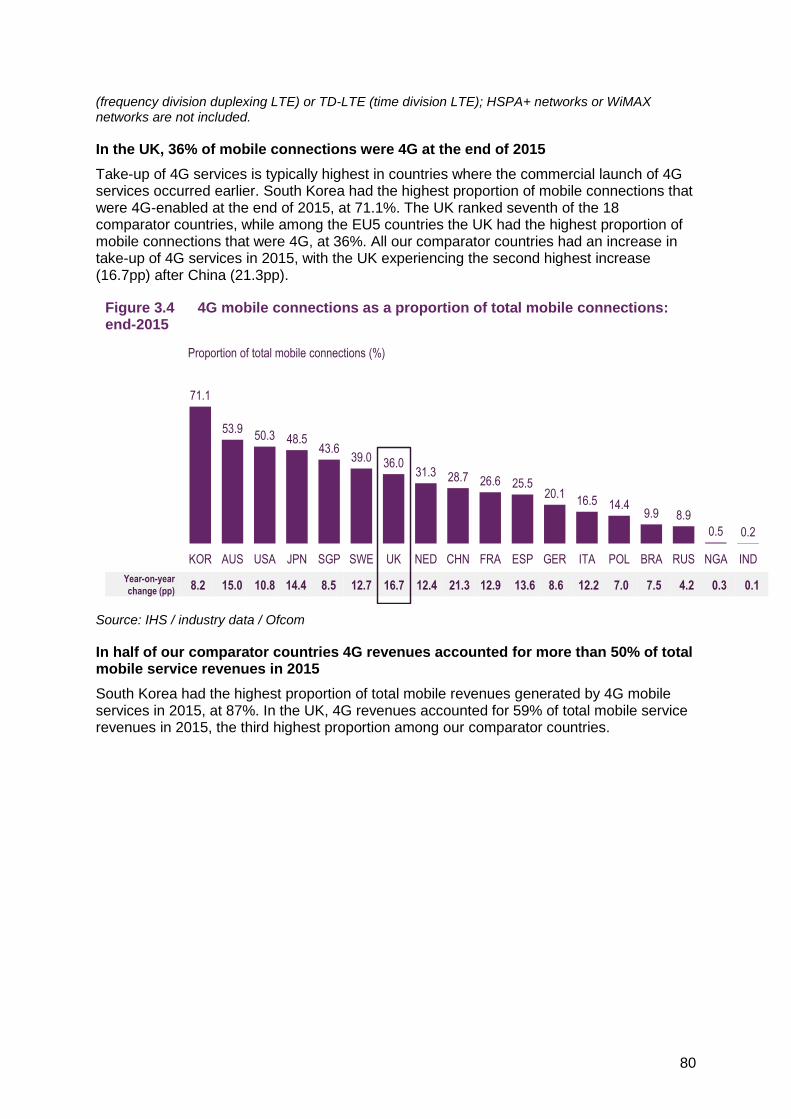
In the UK, 36% of mobile connections were 4G at the end of 2015
Take-up of 4G services is typically highest in countries where the commercial launch of 4G services occurred earlier. South Korea had the highest proportion of mobile connections that were 4G-enabled at the end of 2015, at 71.1%. The UK ranked seventh of the 18 comparator countries, while among the EU5 countries the UK had the highest proportion of mobile connections that were 4G, at 36%. All our comparator countries had an increase in take-up of 4G services in 2015, with the UK experiencing the second highest increase (16.7pp) after China (21.3pp).
Figure 3.4 4G mobile connections as a proportion of total mobile connections: end-2015
Source: IHS / industry data / Ofcom
In half of our comparator countries 4G revenues accounted for more than 50% of total mobile service revenues in 2015
South Korea had the highest proportion of total mobile revenues generated by 4G mobile services in 2015, at 87%. In the UK, 4G revenues accounted for 59% of total mobile service revenues in 2015, the third highest proportion among our comparator countries.
71.1
53.950.3 48.5
43.639.0 36.0
31.3 28.7 26.6 25.520.1
16.5 14.49.9 8.9
0.5 0.2
KOR AUS USA JPN SGP SWE UK NED CHN FRA ESP GER ITA POL BRA RUS NGA IND
Proportion of total mobile connections (%)
Year-on-year
change (pp) 8.2 15.0 10.8 14.4 8.5 12.7 16.7 12.4 21.3 12.9 13.6 8.6 12.2 7.0 7.5 4.2 0.3 0.1

81
Figure 3.5 4G mobile revenue as a proportion of total mobile revenue: 2015
Source: IHS / industry data / Ofcom
87.081.9
58.9 58.955.1 52.5 52.0 51.8 50.7
41.336.6
32.7
23.4 22.015.8 14.8
0.6 0.4
KOR AUS UK NED USA SGP CHN SWE JPN FRA ITA ESP GER RUS BRA POL NGA IND
Proportion of total mobile revenues (%)
Year-on-year
change (pp) 9.5 24.1 34.1 28.1 9.8 11.3 41.2 20.2 15.3 21.0 24.7 17.5 8.2 12.1 11.4 7.1 0.6 0.3

82
In the UK, 85.1% of mobile data use was generated by 4G services in 2015
In most comparator countries, more than half the total mobile data use was generated by 4G services in 2015, led by South Korea, where almost all mobile data use was 4G (97.2%). This is due to the very high population coverage in South Korea and the high number of 4G mobile connections as a proportion of total mobile connections. The UK had the second highest proportion of 4G mobile data use in 2015, at 85.1%, 28.6pp higher than in 2014.
Figure 3.6 4G mobile data use as a proportion of total mobile data use: 2015
Source: IHS / industry data / Ofcom
Sweden had the highest average monthly 4G mobile data use per 4G connection, of all our comparator countries in 2015, at 4.6GB
Average monthly 4G mobile data use was 2.8GB in the UK in 2015, eighth among our comparator countries. The majority of the countries saw an increase in 2016, and 4G data use in Poland and the US almost doubled compared to the previous year. In the UK, the average monthly 4G mobile data use per 4G connection increased by 2.1% in 2015.
Figure 3.7 Average monthly 4G data use per 4G connection: 2015
Source: IHS
97.2
85.1 82.4 82.374.8
69.7 66.6 66.5 65.060.7 57.4 57.3 54.8 54.5
49.6 47.0
7.61.9
KOR UK USA JPN AUS GER SGP ESP FRA CHN NED SWE RUS POL BRA ITA IND NGA
Proportion of total mobile data use (%)
Year-on-year
change (pp)6.0 28.6 11.0 17.8 16.6 16.3 15.1 22.2 20.4 33.7 11.8 15.8 20.0 28.2 18.9 30.2 3.6 1.0
4.64.2
4.03.8
3.5 3.43.1
2.8
2.1 2.0 2.0 1.9 1.9 1.81.5
1.0 0.8 0.7
SWE USA POL KOR JPN IND ITA UK ESP GER SGP FRA AUS BRA RUS NED CHN NGA
Average monthly 4G data used (GB)
Year-on-year
change (%)-0.7 85.8 96.4 32.1 20.7 -23.2 4.0 2.1 0.8 1.7 14.6 14.0 21.8 -35.5 6.3 1.1 -17.5 37.0
83
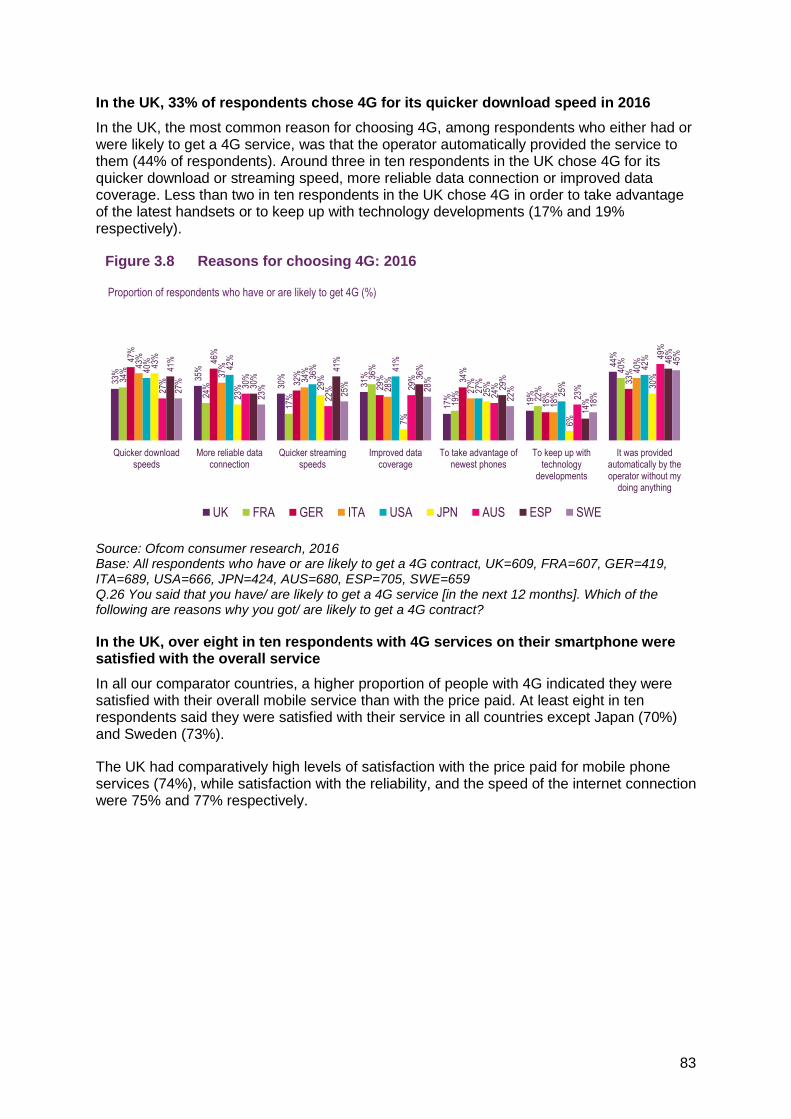
In the UK, 33% of respondents chose 4G for its quicker download speed in 2016
In the UK, the most common reason for choosing 4G, among respondents who either had or were likely to get a 4G service, was that the operator automatically provided the service to them (44% of respondents). Around three in ten respondents in the UK chose 4G for its quicker download or streaming speed, more reliable data connection or improved data coverage. Less than two in ten respondents in the UK chose 4G in order to take advantage of the latest handsets or to keep up with technology developments (17% and 19% respectively).
Figure 3.8 Reasons for choosing 4G: 2016
Source: Ofcom consumer research, 2016 Base: All respondents who have or are likely to get a 4G contract, UK=609, FRA=607, GER=419, ITA=689, USA=666, JPN=424, AUS=680, ESP=705, SWE=659 Q.26 You said that you have/ are likely to get a 4G service [in the next 12 months]. Which of the following are reasons why you got/ are likely to get a 4G contract?
In the UK, over eight in ten respondents with 4G services on their smartphone were satisfied with the overall service
In all our comparator countries, a higher proportion of people with 4G indicated they were satisfied with their overall mobile service than with the price paid. At least eight in ten respondents said they were satisfied with their service in all countries except Japan (70%) and Sweden (73%).
The UK had comparatively high levels of satisfaction with the price paid for mobile phone services (74%), while satisfaction with the reliability, and the speed of the internet connection were 75% and 77% respectively.
33%
35%
30%
31%
17%
19%
44%
34%
24%
17%
36%
19% 22
%
40%47
%
46%
32%
29% 34
%
18%
33%
43%
37%
34%
28%
27%
18%
40%
40%
42%
36% 41
%
27%
25%
42%
43%
23% 29
%
7%
25%
6%
30%
27% 30
%
22% 29
%
24%
23%
49%
41%
30%
41%
36%
29%
14%
46%
27%
23%
25% 28
%
22%
18%
45%
Quicker downloadspeeds
More reliable dataconnection
Quicker streamingspeeds
Improved datacoverage
To take advantage ofnewest phones
To keep up withtechnology
developments
It was providedautomatically by theoperator without my
doing anything
UK FRA GER ITA USA JPN AUS ESP SWE
Proportion of respondents who have or are likely to get 4G (%)

84
Figure 3.9 Satisfaction with 4G mobile phone services: 2016
Source: Ofcom consumer research, 2016 Base: All respondents with a smartphone who are on a 4G network, UK =455, FRA=454, GER=290, ITA=466, USA=485, JPN=331, AUS=515, ESP=507, SWE=523 Q.27 To what extent are you satisfied or dissatisfied with the following aspects of your mobile phone service?
86%
74%
75%
77%
84%
63%
72%
70%
86%
69%
76% 80
%83%
69%
79%
80%
88%
67%
84%
85%
70%
35%
60%
59%
81%
69%
76%
75%
83%
56%
79%
76%
73%
55%
74%
73%
Overall service Price paid Ability to access network/ Reliability ofinternet connection
Speed of internet connection
UK FRA GER ITA USA JPN AUS ESP SWE
Proportion of those with 4G on their smartphone (%) – net rating 8-10 on aspects of service

85
3.2 The telecoms industry Mobile voice and mobile data services generated 63.8% of total telecoms revenues across our comparator countries in 2015
Total retail telecoms revenues across our comparator countries were £597bn in 2015. Mobile voice services generated the greatest proportion of this total in 2015, at 32.2% (£192bn), followed by mobile data at 31.6% (£188bn), while fixed broadband contributed 22.0% (£131bn) and fixed voice 14.2% (£85bn).
Figure 3.10 Total comparator country retail telecoms revenues, by sector: 2010 - 15
Source: IHS / industry data / Ofcom Note: Fixed voice revenues include managed VoIP revenues; fixed and mobile voice revenues include access/line rental revenues and may include revenues relating to bundled data services. All figures expressed in nominal terms.
The UK had the fourth highest retail telecoms revenues of all comparator countries in 2015
The US had the highest retail telecoms revenues of all comparator countries, at £186bn in 2015. Between them, the US and China generated more than half (52.9%) of the total. The UK generated £29bn, the fourth highest total of our comparator countries. Mobile services (mobile data and mobile voice) made up the greatest proportion of telecoms revenues in all the countries we looked at, except for Australia and Brazil. In Australia, fixed broadband, while in Brazil, fixed voice made up the greatest proportion.
129 118 108 99 90 85
75 82 90 98 109 131
231 228 223 213 201 192
103 122 146 166 177 188
2010 2011 2012 2013 2014 2015
Mobile data
Mobile voice
Fixed broadband
Fixed voice
Revenue (£bn)
Total 537 550 567 576 577 597

86
Figure 3.11 Telecoms service retail revenues, by country and sector: 2015
Source: IHS / industry data / Ofcom Note: Fixed voice revenues include managed VoIP revenues. All figures expressed in nominal terms.
The UK had the fifth highest per-capita monthly telecoms service revenues, of all the comparator countries, in 2015
The UK had the fifth highest average telecoms revenues of the comparator countries, at £37.78 per person per month. Revenues were lowest among the BRIC countries and Nigeria.
Figure 3.12 Per-capita monthly telecoms service revenues: 2015
Source: IHS / industry data / Ofcom. Note: Includes spend by businesses, and is therefore not representative of average consumer spend; all figures expressed in nominal terms.
97 6
2 24 3 3 4 4
1 1 0 1 0
56
3
5
1
2 53
2 2
1 10
1
6
76
77
106 3
5 5 5
2 24 1
1
8
5
76
55
4 4 3 4
2 1 11
1
29
2423
20
1816
15 14 14 14
6 6 64
9
0
5
10
15
20
25
30
35
UK BRA GER KOR IND FRA AUS ESP RUS ITA NED POL NGA SWE SGP
Mobile data
Mobile voice
Fixedbroadband
Fixed voice235 12
38
40 17
64
48
9
62
37
32
186
130
70
0
20
40
60
80
100
120
140
160
180
200
USA CHN JPN
Revenue (£bn)
50.9448.87 48.46
45.77
37.7833.82 33.73
30.72
25.6823.12
21.22 19.33
12.159.74 8.19 7.87
2.55 1.14
AUS SGP USA JPN UK SWE KOR NED ESP GER FRA ITA POL BRA RUS CHN NGA IND
£ per month

87
3.3 Fixed voice services The UK had the highest number of fixed voice connections per 100 people, of all comparator countries, in 2015
The UK had 62 fixed voice connections per 100 people (including managed VoIP) in 2015, up one connection since 2014. The UK was one of only three comparator countries where fixed voice take-up increased (alongside Germany and Italy).
Figure 3.13 Fixed voice connections per 100 people: end of 2015
Source: IHS / industry data / Ofcom Note: Includes managed VoIP connections
France had the highest number of managed VoIP84 connections per 100 people in 2015
The UK had ten managed VoIP85 connections per 100 people in 2015, up by one connection since 2014. In the majority of our comparator countries the number of managed VoIP connections per 100 people had increased since 2014, only in South Korea and Brazil did this measure decline.
84 Managed VoIP refers to the provision of a packet-switched voice over internet protocol (VoIP) service over a fixed broadband network such as xDSL, FTTP and cable. Managed VoIP includes VoIP as a primary service (such as VoIP over FTTP or naked xDSL) and as a secondary service (such as VoIP over xDSL, where the subscriber also pays a monthly fee for a PSTN line). OTT VoIP services consumed over fixed broadband connections, such as Skype, are not included within the definition of managed VoIP because they do not support emergency calling and are therefore not marketed as landline replacement services. 85 The Narrowband Market Review consultation document stated that in the UK, managed VoIP is not used in the residential sector to any significant extent.
62 60
5146 44
41 4138 38 38 36 36
2521
1815
2 0
UK FRA KOR GER JPN NED ESP USA ITA AUS SWE SGP RUS BRA CHN POL IND NGA
Connections per 100 population
Year-on-year
Change (connections)
1 0 -2 1 0 0 0 -2 1 -1 -3 0 -2 -1 -1 -1 0 0
88
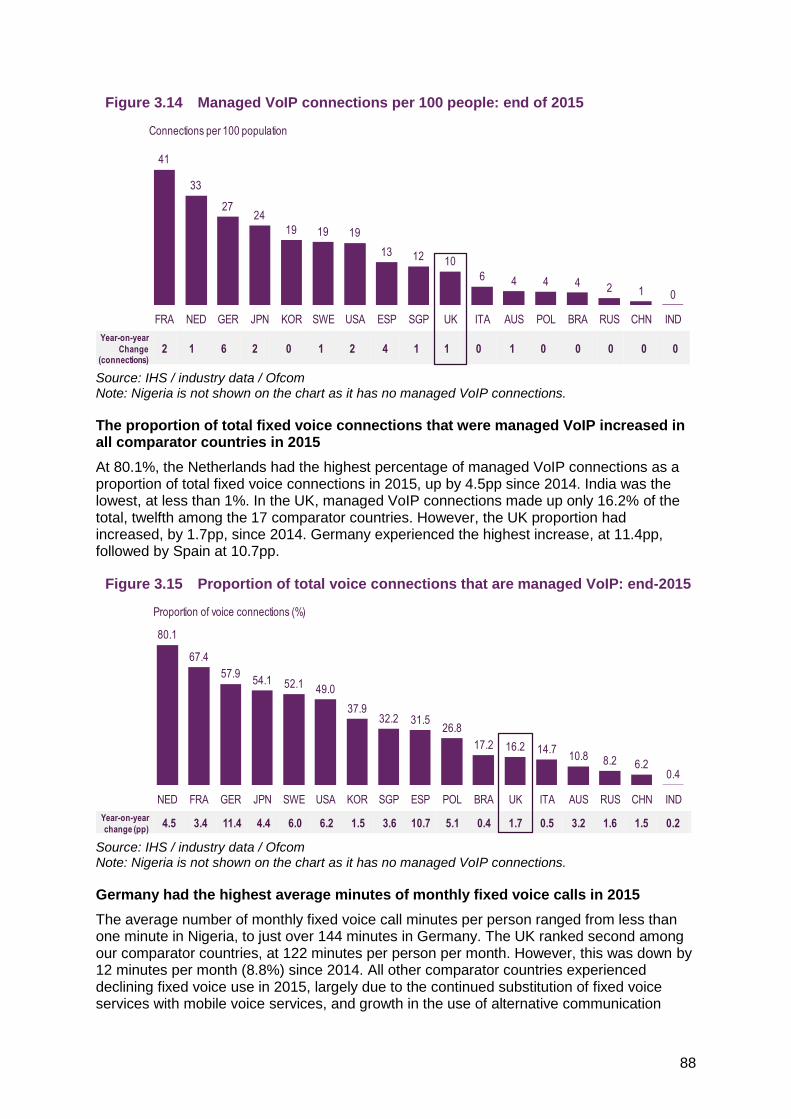
Figure 3.14 Managed VoIP connections per 100 people: end of 2015
Source: IHS / industry data / Ofcom Note: Nigeria is not shown on the chart as it has no managed VoIP connections.
The proportion of total fixed voice connections that were managed VoIP increased in all comparator countries in 2015
At 80.1%, the Netherlands had the highest percentage of managed VoIP connections as a proportion of total fixed voice connections in 2015, up by 4.5pp since 2014. India was the lowest, at less than 1%. In the UK, managed VoIP connections made up only 16.2% of the total, twelfth among the 17 comparator countries. However, the UK proportion had increased, by 1.7pp, since 2014. Germany experienced the highest increase, at 11.4pp, followed by Spain at 10.7pp.
Figure 3.15 Proportion of total voice connections that are managed VoIP: end-2015
Source: IHS / industry data / Ofcom Note: Nigeria is not shown on the chart as it has no managed VoIP connections.
Germany had the highest average minutes of monthly fixed voice calls in 2015
The average number of monthly fixed voice call minutes per person ranged from less than one minute in Nigeria, to just over 144 minutes in Germany. The UK ranked second among our comparator countries, at 122 minutes per person per month. However, this was down by 12 minutes per month (8.8%) since 2014. All other comparator countries experienced declining fixed voice use in 2015, largely due to the continued substitution of fixed voice services with mobile voice services, and growth in the use of alternative communication
41
33
2724
19 19 19
13 12 10
6 4 4 4 2 1 0
FRA NED GER JPN KOR SWE USA ESP SGP UK ITA AUS POL BRA RUS CHN IND
Connections per 100 population
Year-on-year
Change (connections)
2 1 6 2 0 1 2 4 1 1 0 1 0 0 0 0 0
80.1
67.4
57.954.1 52.1 49.0
37.932.2 31.5
26.8
17.2 16.2 14.710.8 8.2 6.2
0.4
NED FRA GER JPN SWE USA KOR SGP ESP POL BRA UK ITA AUS RUS CHN IND
Proportion of voice connections (%)
Year-on-year
change (pp)4.5 3.4 11.4 4.4 6.0 6.2 1.5 3.6 10.7 5.1 0.4 1.7 0.5 3.2 1.6 1.5 0.2

89
methods. While Nigeria had the largest proportional year-on-year fall (32.7%), this was only a small decrease in volume terms.
Figure 3.16 Per capita monthly fixed voice call minutes: 2015
Source: IHS / industry data / Ofcom. Note: Includes managed VoIP calls.
The UK had the highest average per-capita revenue for fixed voice services in 2015
The highest average revenue for fixed voice services (including managed VoIP services) was generated in the UK in 2015, at £11.58 per person per month. It was lowest in China, India and Nigeria, at less than £1 per person in all three countries. As shown in Figure 3.16, monthly fixed voice call minutes per capita were also lowest in these countries.
Figure 3.17 Average monthly per-capita fixed voice revenues: 2015
Source: IHS / industry data / Ofcom Note: Includes managed VoIP revenues. All figures expressed in nominal terms.
The UK had the third-highest average price of a fixed voice call minute, among our comparator countries, in 2015
At 10 pence per minute, the average price of a fixed voice call minute was highest in Japan (though similar to Australia at 9.9 pence). Conversely, it was lowest in India, at 2.9 pence. The UK had the third highest price, at 9.5 pence per minute in 2015, an 8.6% increase compared to 2014.
144
122109
101 9992
8578 77 76 73 68 68 62
207 4 0
GER UK FRA AUS USA KOR SWE NED JPN RUS SGP ESP ITA BRA POL CHN IND NGA
Minutes
Year-on-year
change (%)-5.8 -8.8 -8.2 -17.4 -10.4 -7.4 -15.2 -13.5 -6.4 -6.4 -8.3 -13.9 -16.6 -8.1 -12.0 -9.7 -7.9 -32.7
11.58
10.01
7.756.85 6.50 6.22 6.03 5.66
4.95 4.74 4.473.38
2.68 2.351.51
0.29 0.11 0.01
UK AUS JPN SGP NED GER USA SWE ITA FRA ESP KOR BRA RUS POL CHN IND NGA
£ per capita
Year-on-year
change (%)-1.0 -7.8 -2.9 -3.9 -9.2 -1.2 -7.0 -16.5 -15.9 -9.7 -11.2 -7.0 -3.7 -7.0 -13.4 -6.1 -9.1 -32.8
90
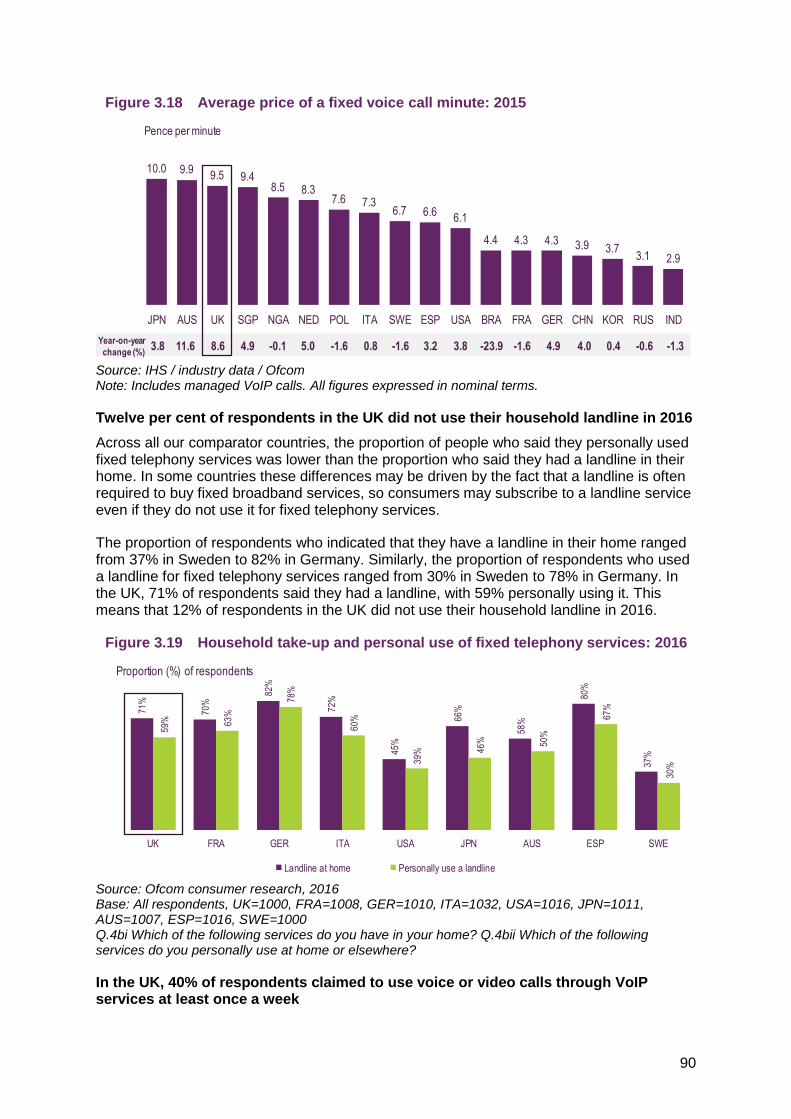
Figure 3.18 Average price of a fixed voice call minute: 2015
Source: IHS / industry data / Ofcom Note: Includes managed VoIP calls. All figures expressed in nominal terms.
Twelve per cent of respondents in the UK did not use their household landline in 2016
Across all our comparator countries, the proportion of people who said they personally used fixed telephony services was lower than the proportion who said they had a landline in their home. In some countries these differences may be driven by the fact that a landline is often required to buy fixed broadband services, so consumers may subscribe to a landline service even if they do not use it for fixed telephony services.
The proportion of respondents who indicated that they have a landline in their home ranged from 37% in Sweden to 82% in Germany. Similarly, the proportion of respondents who used a landline for fixed telephony services ranged from 30% in Sweden to 78% in Germany. In the UK, 71% of respondents said they had a landline, with 59% personally using it. This means that 12% of respondents in the UK did not use their household landline in 2016.
Figure 3.19 Household take-up and personal use of fixed telephony services: 2016
Source: Ofcom consumer research, 2016 Base: All respondents, UK=1000, FRA=1008, GER=1010, ITA=1032, USA=1016, JPN=1011, AUS=1007, ESP=1016, SWE=1000 Q.4bi Which of the following services do you have in your home? Q.4bii Which of the following services do you personally use at home or elsewhere?
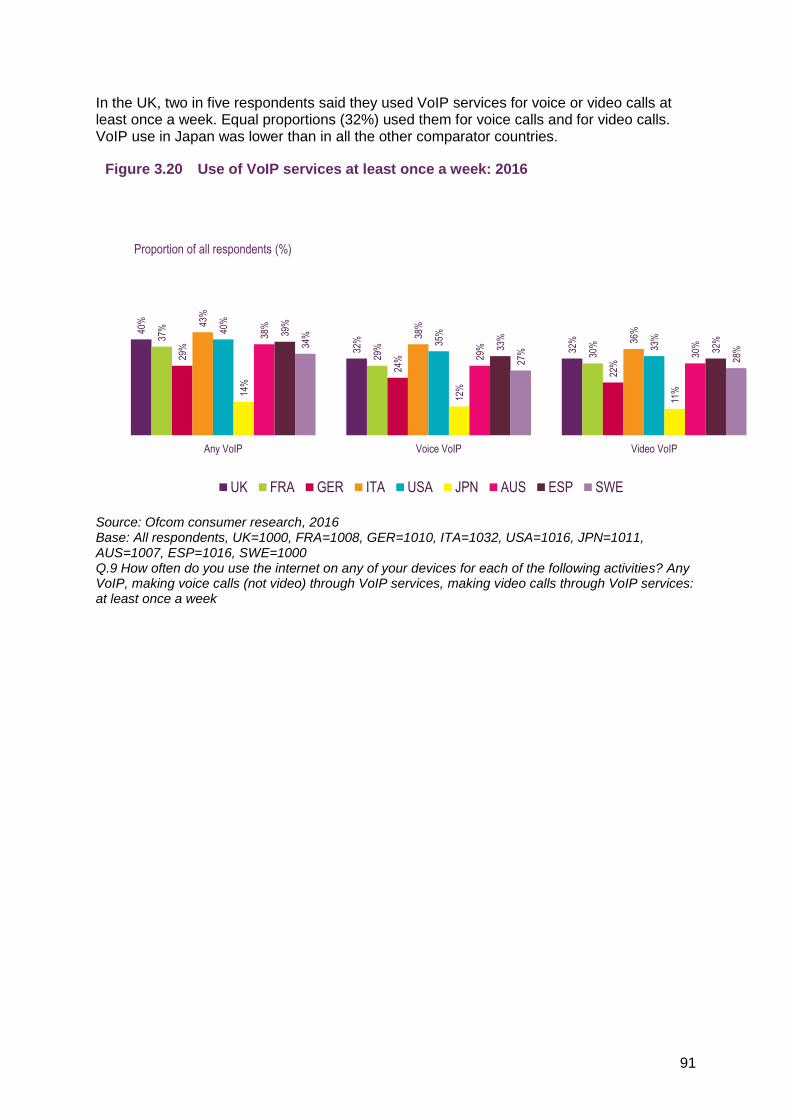
In the UK, 40% of respondents claimed to use voice or video calls through VoIP services at least once a week
10.0 9.99.5 9.4
8.5 8.37.6 7.3
6.7 6.66.1
4.4 4.3 4.3 3.9 3.73.1 2.9
JPN AUS UK SGP NGA NED POL ITA SWE ESP USA BRA FRA GER CHN KOR RUS IND
Pence per minute
Year-on-year
change (%)3.8 11.6 8.6 4.9 -0.1 5.0 -1.6 0.8 -1.6 3.2 3.8 -23.9 -1.6 4.9 4.0 0.4 -0.6 -1.3
71%
70%
82%
72%
45%
66%
58%
80%
37%
59% 63
%
78%
60%
39% 46
% 50%
67%
30%
UK FRA GER ITA USA JPN AUS ESP SWE
Landline at home Personally use a landline
Proportion (%) of respondents
91
In the UK, two in five respondents said they used VoIP services for voice or video calls at least once a week. Equal proportions (32%) used them for voice calls and for video calls. VoIP use in Japan was lower than in all the other comparator countries.
Figure 3.20 Use of VoIP services at least once a week: 2016
Source: Ofcom consumer research, 2016 Base: All respondents, UK=1000, FRA=1008, GER=1010, ITA=1032, USA=1016, JPN=1011, AUS=1007, ESP=1016, SWE=1000 Q.9 How often do you use the internet on any of your devices for each of the following activities? Any VoIP, making voice calls (not video) through VoIP services, making video calls through VoIP services: at least once a week
40%
32%
32%37
%
29%
30%
29%
24%
22%
43%
38%
36%40
%
35%
33%
14%
12%
11%
38%
29%
30%
39%
33%
32%34
%
27%
28%
Any VoIP Voice VoIP Video VoIP
UK FRA GER ITA USA JPN AUS ESP SWE
Proportion of all respondents (%)

92
3.4 Mobile voice and messaging services The majority of our comparator countries had 99% or higher population coverage86 of 2G
Fifteen of our 18 comparator countries had 2G population coverage of 99% or higher at the end of 2015: only in Russia, Nigeria and India was 2G availability lower (at 98%, 96% and 87% respectively).
Figure 3.21 2G mobile network availability: end-2015
Source: IHS / industry data / Ofcom
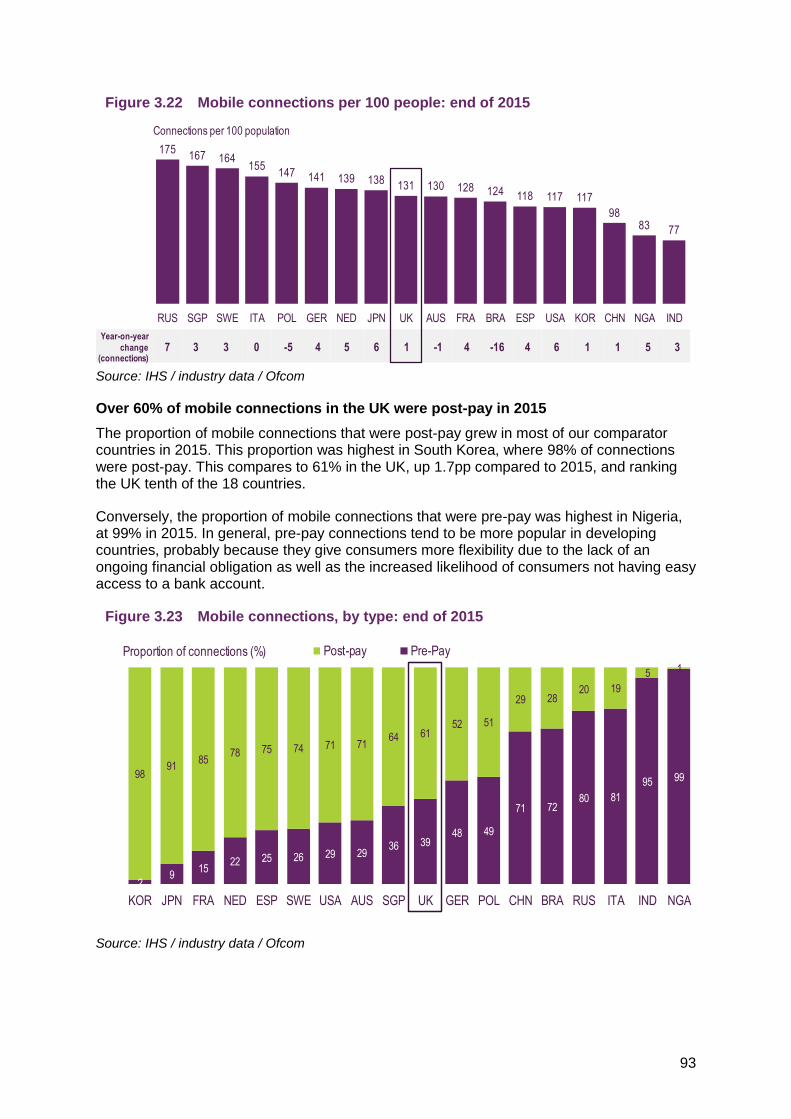
The majority of our comparator countries had more mobile connections than people in 2015
The number of mobile connections per 100 people ranged from 77 in India to 175 in Russia in 2015. The UK was ninth of 18, with 131 mobile connections per 100 people. In only three countries (Poland, Australia and Brazil) did the number decrease between 2014 and 2015. Brazil had the greatest decrease, down by 16 connections, following a purge of inactive pre-pay mobile connections. In comparison, Russia experienced the greatest increase, up by seven connections per 100 people.
86 Outdoor coverage by at least one operator, geographic coverage would be lower. The UK figure differs from the 67% stated in our Connected Nations 2016 report, which measures indoor coverage by all operators, voice and text (incl. VoLTE).
100 100 100 100 100 100 100 100 100 100 100 100 100 99 99 98 9687
UK ITA ESP USA AUS JPN BRA FRA SWE NED POL SGP KOR CHN GER RUS NGA IND
Population coverage (%)
93
Figure 3.22 Mobile connections per 100 people: end of 2015
Source: IHS / industry data / Ofcom
Over 60% of mobile connections in the UK were post-pay in 2015
The proportion of mobile connections that were post-pay grew in most of our comparator countries in 2015. This proportion was highest in South Korea, where 98% of connections were post-pay. This compares to 61% in the UK, up 1.7pp compared to 2015, and ranking the UK tenth of the 18 countries.
Conversely, the proportion of mobile connections that were pre-pay was highest in Nigeria, at 99% in 2015. In general, pre-pay connections tend to be more popular in developing countries, probably because they give consumers more flexibility due to the lack of an ongoing financial obligation as well as the increased likelihood of consumers not having easy access to a bank account.
Figure 3.23 Mobile connections, by type: end of 2015
Source: IHS / industry data / Ofcom
175167 164
155147 141 139 138 131 130 128 124 118 117 117
9883 77
RUS SGP SWE ITA POL GER NED JPN UK AUS FRA BRA ESP USA KOR CHN NGA IND
Connections per 100 population
Year-on-year
change (connections)
7 3 3 0 -5 4 5 6 1 -1 4 -16 4 6 1 1 5 3
29
1522 25 26 29 29
36 3948 49
71 7280 81
95 999891
8578 75 74 71 71
64 6152 51
29 2820 19
5 1
KOR JPN FRA NED ESP SWE USA AUS SGP UK GER POL CHN BRA RUS ITA IND NGA
Post-pay Pre-PayProportion of connections (%)

94
Average per-capita monthly mobile retail revenue in the UK was £19.57 in 2015
Per-capita spend on mobile services ranged from £32.65 per month in the US to less than £1 per month in India in 2015. In the UK, the average spend was £19.57 per person – the seventh highest of our comparator countries.
Figure 3.24 Average per-capita monthly retail mobile revenue: 2015
Source: IHS / industry data / Ofcom. Note: All figures expressed in nominal terms.
Most comparator countries saw an increase in the number of average monthly mobile call minutes per person
Average outgoing per-capita mobile call minutes were highest in the US in 2015, at 367 per month; the US also had the largest percentage increase since 2014 (16.4%). Average outgoing monthly mobile call minutes per person increased in the majority of our comparator countries in 2015, with the exception of Singapore, South Korea, China and Brazil. In the UK, average use increased by 3.3% to 184 minutes per person, putting the UK ninth highest of the comparator countries.
Figure 3.25 Average per-capita monthly mobile voice call minutes: 2015
Source: IHS / industry data / Ofcom
The UK had the third highest average number of monthly mobile messages per person
The average number of monthly mobile messages per person (which includes SMS and MMS messages) ranged from zero in Japan (where, as mentioned earlier, consumers tend
32.65 32.58
27.1024.73
22.1819.74 19.57
17.9916.42
13.82 13.40 11.98
8.035.18 4.77 4.53
2.540.96
USA SGP JPN AUS KOR SWE UK NED ESP GER FRA ITA POL CHN RUS BRA NGA IND
£ per capita
Year-on-year
change (%)1.3 -1.2 2.0 1.7 0.1 1.6 -0.9 -2.8 -2.7 -2.0 -3.6 -0.6 1.0 -2.6 1.5 -2.1 0.0 11.8
367
321
255236
220 207 199 197 184 173 170 170 159 148 141 138118
70
USA RUS SWE ITA SGP KOR POL FRA UK CHN AUS BRA JPN ESP IND NED GER NGA
Minutes
Year-on-year
change (%)16.4 3.9 10.3 4.2 -14.5 -0.7 10.6 2.9 3.3 -3.2 5.5 -6.4 12.9 5.2 5.9 7.5 4.5 13.4
95
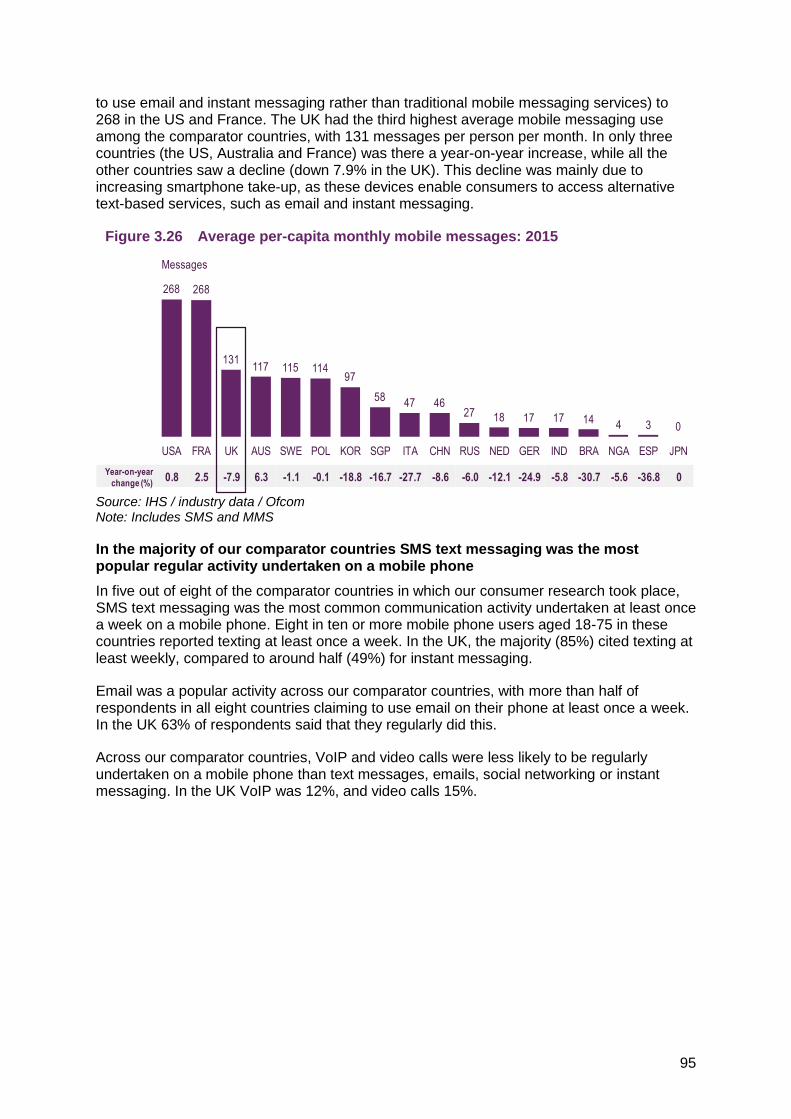
to use email and instant messaging rather than traditional mobile messaging services) to 268 in the US and France. The UK had the third highest average mobile messaging use among the comparator countries, with 131 messages per person per month. In only three countries (the US, Australia and France) was there a year-on-year increase, while all the other countries saw a decline (down 7.9% in the UK). This decline was mainly due to increasing smartphone take-up, as these devices enable consumers to access alternative text-based services, such as email and instant messaging.
Figure 3.26 Average per-capita monthly mobile messages: 2015
Source: IHS / industry data / Ofcom Note: Includes SMS and MMS
In the majority of our comparator countries SMS text messaging was the most popular regular activity undertaken on a mobile phone
In five out of eight of the comparator countries in which our consumer research took place, SMS text messaging was the most common communication activity undertaken at least once a week on a mobile phone. Eight in ten or more mobile phone users aged 18-75 in these countries reported texting at least once a week. In the UK, the majority (85%) cited texting at least weekly, compared to around half (49%) for instant messaging.
Email was a popular activity across our comparator countries, with more than half of respondents in all eight countries claiming to use email on their phone at least once a week. In the UK 63% of respondents said that they regularly did this.
Across our comparator countries, VoIP and video calls were less likely to be regularly undertaken on a mobile phone than text messages, emails, social networking or instant messaging. In the UK VoIP was 12%, and video calls 15%.
268 268
131117 115 114
97
5847 46
27 18 17 17 14 4 3 0
USA FRA UK AUS SWE POL KOR SGP ITA CHN RUS NED GER IND BRA NGA ESP JPN
Messages
Year-on-year
change (%)0.8 2.5 -7.9 6.3 -1.1 -0.1 -18.8 -16.7 -27.7 -8.6 -6.0 -12.1 -24.9 -5.8 -30.7 -5.6 -36.8 0

96
Figure 3.27 Communication activities on a mobile phone at least once a week: 2016
Source: Deloitte Global Mobile Consumer Survey 2016 Base: All adults 18-75 who have a phone or smartphone UK=3712, GER=1838, JPN=1431, AUS=1864, ITA=1862, SWE=1906, FRA=1847, USA=1774 Q.34 Please state which, if any, you have used (at least once a week)? Note: Text messaging is not relevant for Japan, as respondents may have confused text messaging with similar services that are available.
Two-thirds of mobile users in the UK stated that they always have a mobile signal
In the UK, around two-thirds of mobile users claimed that they always had a mobile signal when they wanted to make a voice call, that they could always connect to the internet on their mobile network when they wanted to, and that they had a fast-enough internet connection.
Of our comparator countries, the US had the highest proportion of respondents who claimed to always have a mobile signal when they wanted to make a voice call (75%). Italy had the highest proportion of mobile users who found that mobile speed varied according to the time of the day (67%). In the UK, 53% of respondents said that their mobile speed varied throughout the day.
85%
63%
53%
49%
15%
12%
89%
60%
43%
32%
11%
9%
50%
57%
41%
66%
9%
16%
71%
65%
58%
73%
16%
30%
80%
65%
56%
40%
22%
18%
32%
65%
27%
38%
5%
16%
86%
63%
55%
44%
15%
13%
87%
67%
60%
47%
14%
12%
Text messages Emails Social networks Instant messaging Video calls VoIP
UK FRA GER ITA USA JPN AUS SWE
Proportion of those with a mobile phone (%)

97
Figure 3.28 Mobile phone connectivity: 2016
Source: Ofcom consumer research, 2016 Base: All respondents who use a smartphone or mobile phone, UK=799, FRA=825, GER=861, ITA=939, USA=782, JPN=759, AUS=851, ESP=877, SWE=854 (mobile signal). Base: all respondents who use a smartphone, UK=730, FRA=781, GER=791, ITA=922, USA=695, JPN=740, AUS=794, ESP=873, SWE=811 (internet connection) Q.24 Thinking about when you use your mobile phone, please select an answer to each of the following...
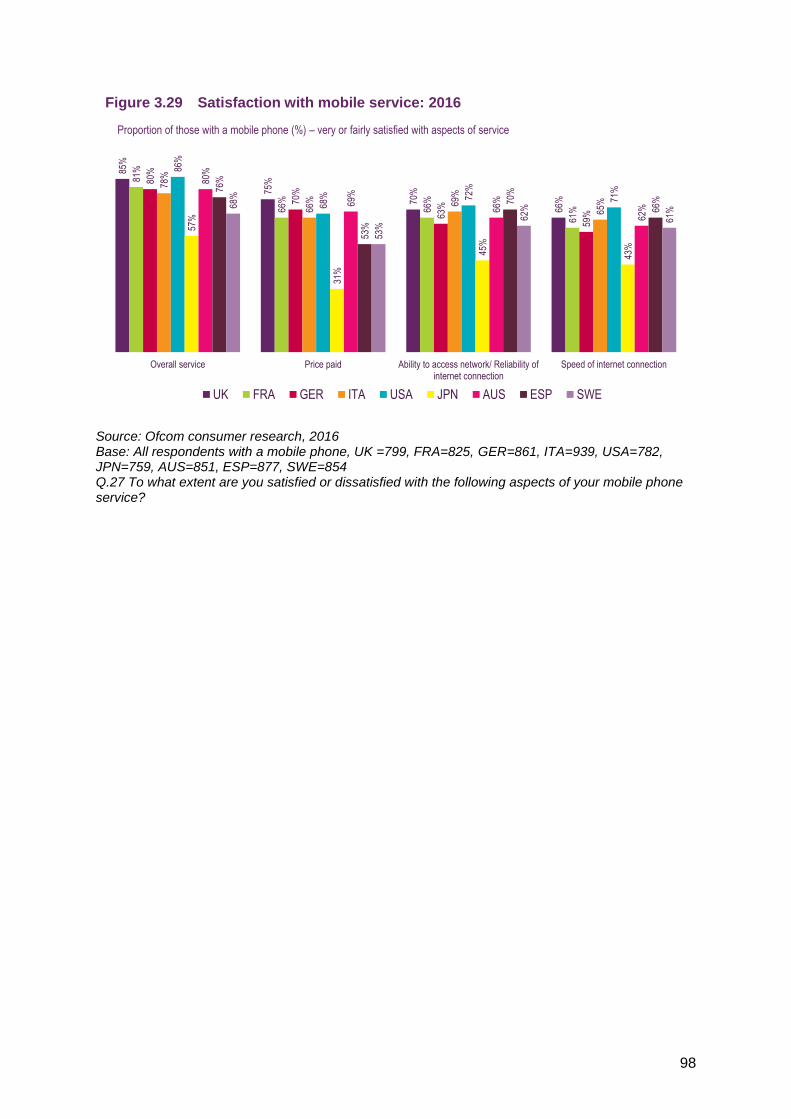
Eighty-five per cent of respondents in the UK indicated that they were satisfied with their overall mobile service
Consumer satisfaction with different aspects of mobile services was comparatively high in the UK, with more than six in ten respondents saying that they were either very, or fairly, satisfied with the price paid for their mobile service, the ability to access the network and the speed of their internet connection.
Overall satisfaction with mobile services was 80% or higher in five out of nine of our comparator countries in which our consumer research took place, with the UK at 85%. By comparison, satisfaction levels with all of the mobile service aspects we asked about were low in Japan, particularly in relation to price (31%).
65%
67%
64%
53%
70%
63%
59%
54%
68%
67%
62%
40%
65%
65% 70
%
67%
75%
75%
73%
53%
60%
71%
55%
46%
69%
66%
62%
51%
70% 73
%
67%
41%
65% 70
%
66%
43%
I always have a mobile signal when Iwant to make a call
I can always connect to the internetwhen I want to
My internet connection is always fastenough for what I do online
My connection speed varies accordingto the time of day
UK FRA GER ITA USA JPN AUS ESP SWE
Proportion of those with a mobile phone (%)
98
Figure 3.29 Satisfaction with mobile service: 2016
Source: Ofcom consumer research, 2016 Base: All respondents with a mobile phone, UK =799, FRA=825, GER=861, ITA=939, USA=782, JPN=759, AUS=851, ESP=877, SWE=854 Q.27 To what extent are you satisfied or dissatisfied with the following aspects of your mobile phone service?
85%
75%
70%
66%
81%
66%
66%
61%
80%
70%
63%
59%
78%
66% 69
%
65%
86%
68% 72
%
71%
57%
31%
45%
43%
80%
69%
66%
62%
76%
53%
70%
66%
68%
53%
62%
61%
Overall service Price paid Ability to access network/ Reliability ofinternet connection
Speed of internet connection
UK FRA GER ITA USA JPN AUS ESP SWE
Proportion of those with a mobile phone (%) – very or fairly satisfied with aspects of service

99
3.5 Broadband services This section benchmarks the UK’s performance against that of comparator countries, in terms of various fixed and mobile broadband market indicators.87
In previous years, the European Broadband Scorecard has been published as a stand-alone report, comparing broadband development across EU countries. However, this year we have included the Scorecard as a section within the Telecoms chapter of the International Communications Market Report, and have widened its scope by including additional non-EU comparator countries. In addition to the data on the 18 countries included in this report, we have included Portugal, to provide an example of a country where duct and pole access already exists. Our aim is to provide a more comprehensive view of the development of fixed and mobile broadband infrastructure and services in different countries.88
We focus on the UK’s position using broadband metrics including coverage, take-up, speed and choice, wherever sufficiently comparable, reliable and consistent data are available. A comparison of fixed broadband service pricing can be found in the International pricing benchmarking chapter of the report (Chapter 2).
For the purpose of continuity with previous reports, we also compare the metrics for the EU5 and EU28,89 where such data are available.
Coverage
The UK was one of eight comparator countries where ADSL was available to 99% or more households in 2015.
In eight of our comparator countries, including the UK, ADSL networks have been deployed to 99% or more households.90 Nigeria was the only comparator country in which ADSL networks had been deployed to less than half of all households (4%), although coverage there had increased marginally since 2014.
87 Mobile broadband includes all data connections made via 3G or 4G cellular networks, including those made via mobile handsets and using dedicated mobile data dongles and SIMs. 88 Portugal (in addition to Spain and France) has used duct access to build extensive FTTP networks, encouraging innovation and providing improved service quality and faster broadband speeds. https://www.ofcom.org.uk/__data/assets/pdf_file/0021/63444/digital-comms-review.pdf 89 The EU5 and EU28 appendices can be found here: https://www.ofcom.org.uk/research-and-data/broadband-research/eu-bbroadand-scorecard 90 It is important to note that some premises in ADSL-enabled areas may not be able to receive broadband services, or may only be able to access very low speeds due to reasons such as long length, or poor quality, of the copper telephone line from the premises to the local exchange.

100
Figure 3.30 Percentage of households in areas served by ADSL broadband: year-end 2015
Source: IHS Note: NGA is the country code for Nigeria, and does not refer to next generation access technologies. All figures have been rounded to the nearest whole number.
The UK ranked eighth in cable broadband coverage
Singapore had the highest coverage of cable broadband network, deployed largely by StarHub Ltd, at 99% of households at the end of 2015.
The Netherlands had the second highest cable availability, at 95%, followed by the US (90%), while the UK ranked eighth (47%). In the UK, Virgin Media (the largest cable broadband provider), is extending its DOCSIS3.1 network through ‘Project Lightning’,91 which is expected to extend cable and FTTP to up to 60-65% of UK premises by 2020.
91 http://www.virginmediabusiness.co.uk/news-and-events/news/news-archives/2015/Virgin-Media-and-Liberty-Global-announce-largest-investment-in-UKs-internet-infrastructure-for-more-than-a-decade/
101
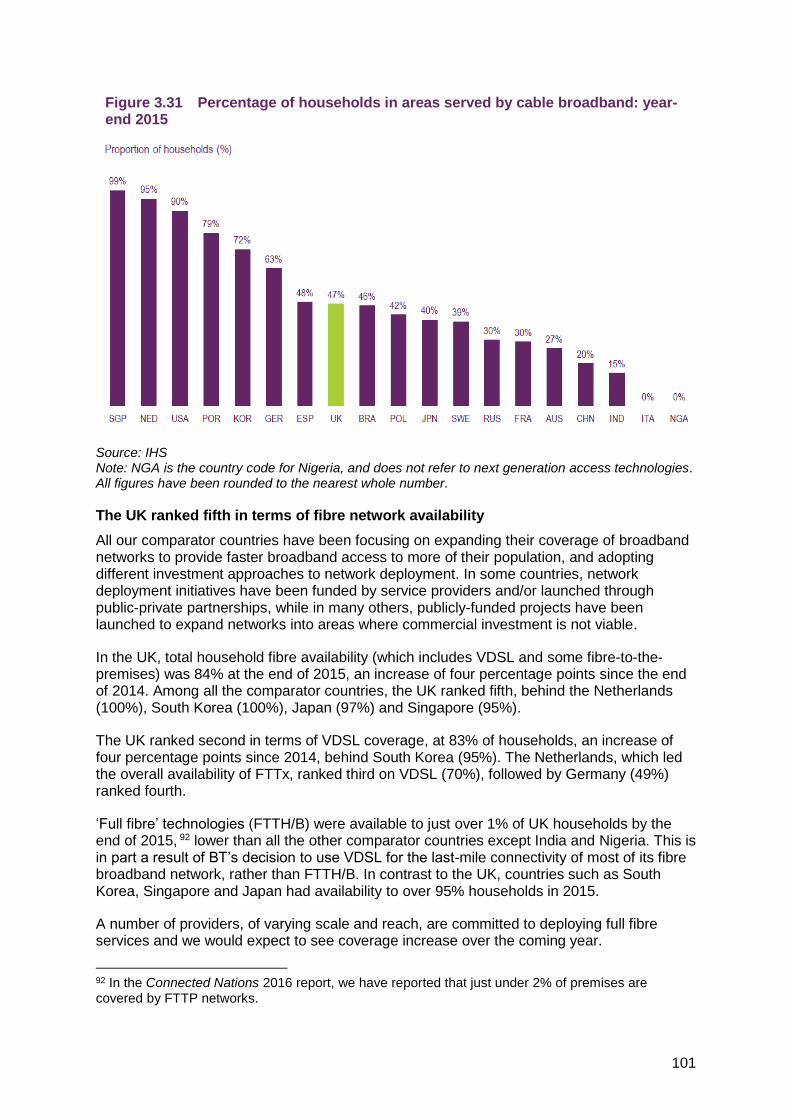
Figure 3.31 Percentage of households in areas served by cable broadband: year-end 2015
Source: IHS Note: NGA is the country code for Nigeria, and does not refer to next generation access technologies. All figures have been rounded to the nearest whole number.
The UK ranked fifth in terms of fibre network availability
All our comparator countries have been focusing on expanding their coverage of broadband networks to provide faster broadband access to more of their population, and adopting different investment approaches to network deployment. In some countries, network deployment initiatives have been funded by service providers and/or launched through public-private partnerships, while in many others, publicly-funded projects have been launched to expand networks into areas where commercial investment is not viable.
In the UK, total household fibre availability (which includes VDSL and some fibre-to-the-premises) was 84% at the end of 2015, an increase of four percentage points since the end of 2014. Among all the comparator countries, the UK ranked fifth, behind the Netherlands (100%), South Korea (100%), Japan (97%) and Singapore (95%).
The UK ranked second in terms of VDSL coverage, at 83% of households, an increase of four percentage points since 2014, behind South Korea (95%). The Netherlands, which led the overall availability of FTTx, ranked third on VDSL (70%), followed by Germany (49%) ranked fourth.
‘Full fibre’ technologies (FTTH/B) were available to just over 1% of UK households by the end of 2015, 92 lower than all the other comparator countries except India and Nigeria. This is in part a result of BT’s decision to use VDSL for the last-mile connectivity of most of its fibre broadband network, rather than FTTH/B. In contrast to the UK, countries such as South Korea, Singapore and Japan had availability to over 95% households in 2015.
A number of providers, of varying scale and reach, are committed to deploying full fibre services and we would expect to see coverage increase over the coming year.
92 In the Connected Nations 2016 report, we have reported that just under 2% of premises are covered by FTTP networks.

102
Figure 3.32 Percentage of households in areas served by FTTx broadband networks (including VDSL and FTTH/B): year-end 2015
Source: IHS Note: NGA is the country code for Nigeria, and does not refer to next generation access technologies. All figures have been rounded to the nearest whole number.
UK superfast broadband availability increased in 2015, although it continued to lag behind countries such as South Korea, Japan and Singapore
At the end of 2015, standard fixed broadband services with an advertised speed of 10Mbit/s or more were available to almost all households in three comparator countries (South Korea, Japan and Singapore). Standard broadband with advertised speeds of 10Mbit/s or more was available to 97% of households in the UK, an increase of one percentage point (pp) since 2014. The UK ranked seventh in terms of availability of superfast broadband (SFBB) products (those with advertised speeds of 30Mbit/s or more), at 88% of households. Services with advertised speeds of 100Mbit/s or more were available to 48% of households in the UK.
In Ofcom’s Connected Nations 2016 report,93 we state that 100%94 of UK premises were able to receive fixed broadband95 services by June 2016, and that 89% were able to receive superfast broadband services with an actual download speed of 30Mbit/s or higher.96
93 https://www.ofcom.org.uk/research-and-data/infrastructure-research/connected-nations-2016 94 There may be a very small number of UK residential properties that may not be able to receive broadband services, or may only be able to access very low speeds. 95 Fixed broadband is a data service or connection generally defined as being 'always on' and providing a bandwidth greater than narrowband connections. 96 We calculated this based on detailed premises-level data inputs provided by UK communications providers.

103
Figure 3.33 Percentage of households passed by fixed broadband networks: year-end 2015
Source: IHS Note: NGA is the country code for Nigeria, and does not refer to next-generation access technologies. All figures have been rounded to the nearest whole number.
Availability and adoption of ultrafast broadband 97 is increasing
For this report, we have defined ultrafast services as those delivering a download speed of 300Mbit/s or more,98 delivered over fibre or hybrid fibre-coaxial cable networks.99
The deployment of ultrafast broadband has started to gather pace, although roll-out is largely limited to developed countries mainly in Asia-Pacific that already have high availability of superfast broadband. Singapore ranked first, with universal availability of ultrafast broadband, followed by South Korea at 98%, as at September 2016.
The availability of ultrafast broadband networks is relatively lower in Europe. Among our European comparator countries, only four had ultrafast household availability of 50% or more, with the Netherlands in the lead (87%) due to the availability of ultrafast cable broadband services followed by Spain (75%), Sweden (69%) and Portugal (64%). Among the EU5, France had the highest ultrafast availability at 29%. In the UK, ultrafast broadband was available to 2% of households, the lowest among all comparator countries except India and Nigeria.
97 We were not able to obtain data on household availability of ultrafast broadband services from IHS (which provided the coverage-related metrics in the rest of this chapter) and we therefore use September 2016 figures provided by Analysys Mason, which are based on the availability of ultrafast networks capable of supporting advertised speeds of 300Mbit/s or higher. Due to the difference in methodology and time period for which the information is available, the ultrafast broadband product availability data shown below are not comparable with other coverage information in this chapter. 98 There is not yet a consensus on a definition for ultrafast services. We will continue to monitor the coverage of these faster services and may, if appropriate, refine our definition as the market evolves. 99 Ultrafast services rely on technologies such as GPON, EPON, active Ethernet, DOCSIS3.0 or 3.1, and G.fast.
Proportion of households (%)
100%
100%
100%
98%
95%
94% 97
%
96%
94%
92%
91%
89%
84%
68%
95%
95%
93%
26%
1%
100%
99%
98%
98%
91%
88%
88%
78%
77%
77%
67%
54%
53%
48%
44%
41%
31%
4%
1%
100%
99%
98%
98%
88%
68%
48%
58% 64
%
74%
62%
11%
36% 42
%
20%
28%
21%
1% 0%
KOR SGP JPN NED POR USA UK SWE GER ESP RUS BRA POL CHN ITA FRA AUS IND NGA
>=10Mbit/s
>=30Mbit/s
>=100Mbit/s

104
Figure 3.34 Percentage of households in areas served by ultrafast broadband products (with advertised speeds of 300Mbit/s or more): September 2016
Source: Analysys Mason Note: NGA is the country code for Nigeria, and does not refer to next generation access technologies. All figures have been rounded to the nearest whole number.
Six comparator countries had 4G mobile broadband population coverage of 99% or more
Eight of our comparator countries had at least 95% population in areas served by 4G mobile broadband, and six (Japan, South Korea, Singapore, Poland, the Netherlands and Sweden) had 99% or higher. The UK ranked tenth100 among our 19 comparator countries, with 93% population coverage,101 an increase of 9pp compared to end-2014.
In 13 comparator countries, including the UK, 95% or more of the population was in areas served by 3G mobile broadband. All the countries with less than 95% coverage were developing markets, except for Germany102 (93%).
100 In the Key Market Developments section Error! Reference source not found. of this chapter, the UK ranks ninth among 18 comparator countries. 101 In order to provide a comparative benchmark across all 19 countries, 4G (93%) and 3G (99%) mobile coverage in the UK encompasses outdoor coverage from at least one operator. This differs from the 4G (72.2%) and 3G (78.1%) coverage stated in our Connected Nations 2016 report, which focuses on the percentage of premises that have indoor coverage from all operators. 102 Note that Germany’s 3G coverage is likely to be understated as the country generally applies a more rigorous definition of mobile coverage, which is based on actual download speeds rather than simple reception of a signal.
100%98% 96%
87%
75%
69%64%
29%
22%19%
13%8% 7% 7%
4% 3% 2% 0% 0%
SGP KOR JPN NED ESP SWE POR FRA GER USA AUS POL BRA RUS CHN ITA UK IND NGA
Proportion of households (%)

105
Figure 3.35 Percentage of population in areas served by 3G and 4G mobile broadband: year-end 2015
Source: IHS Note: NGA is the country code for Nigeria. All figures have been rounded to the nearest whole number. Data in this chart differs from the 4G (72.2%) and 3G (78.1%) coverage stated in our Connected Nations 2016 report, which focuses on the percentage of premises that have indoor coverage from all operators.
100%
100%
100%
100%
99%
100%
99%
93% 97
%
99%
99%
100%
84%
100%
100%
89% 93
%
71%
54%
100%
100%
100%
100%
99%
99%
98%
95%
94%
93%
91%
89%
87%
81%
80%
59%
48%
14%
6%
KOR SGP POL NED SWE JPN USA GER POR UK ITA AUS CHN ESP FRA RUS BRA NGA IND
3G 4G
Proportion of population (%)
4G 0 0 2 0 0 0 0 2 n/a 9 14 2 14 4 5 8 6 2 4
3G 0 0 0 0 0 0 0 1 n/a 0 1 1 0 0 0 6 1 7 22
Year-on-
year
change
(pp)
106
Take-up and use
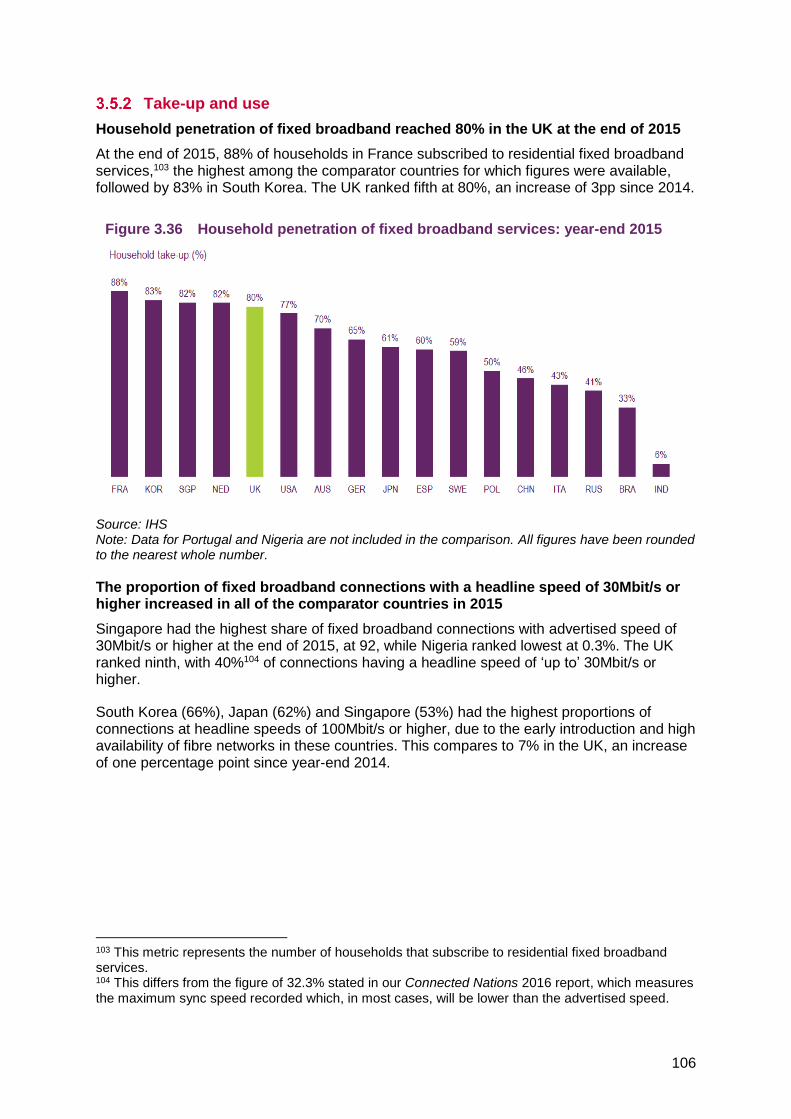
Household penetration of fixed broadband reached 80% in the UK at the end of 2015
At the end of 2015, 88% of households in France subscribed to residential fixed broadband services,103 the highest among the comparator countries for which figures were available, followed by 83% in South Korea. The UK ranked fifth at 80%, an increase of 3pp since 2014.
Figure 3.36 Household penetration of fixed broadband services: year-end 2015
Source: IHS Note: Data for Portugal and Nigeria are not included in the comparison. All figures have been rounded to the nearest whole number.
The proportion of fixed broadband connections with a headline speed of 30Mbit/s or higher increased in all of the comparator countries in 2015
Singapore had the highest share of fixed broadband connections with advertised speed of 30Mbit/s or higher at the end of 2015, at 92, while Nigeria ranked lowest at 0.3%. The UK ranked ninth, with 40%104 of connections having a headline speed of ‘up to’ 30Mbit/s or higher.
South Korea (66%), Japan (62%) and Singapore (53%) had the highest proportions of connections at headline speeds of 100Mbit/s or higher, due to the early introduction and high availability of fibre networks in these countries. This compares to 7% in the UK, an increase of one percentage point since year-end 2014.
103 This metric represents the number of households that subscribe to residential fixed broadband services. 104 This differs from the figure of 32.3% stated in our Connected Nations 2016 report, which measures the maximum sync speed recorded which, in most cases, will be lower than the advertised speed.

107
Figure 3.37 Proportion of fixed broadband connections, by advertised speed: year-end 2015
Source: IHS Note: NGA is the country code for Nigeria, and does not refer to next generation access technologies. All figures have been rounded to the nearest whole number.
China was the fastest growing market for FTTx connections, which accounted for 50% of total fixed broadband connections in 2015
FTTx accounted for half or more of fixed broadband connections in five of our comparator countries at the end of 2015. The UK was ninth, at 22% FTTx connections, while FTTH/B accounted for just 0.3% of total fixed broadband connections. China was the fastest growing market (up 18pp since 2014), as China Telecom and China Unicom increased their focus on deployment of FTTB/H networks.
Figure 3.38 Percentage of fixed broadband connections, by technology: year-end 2015
Source: IHS Note: NGA is the country code for Nigeria, and does not refer to next generation access technologies. All figures have been rounded to the nearest whole number.
1%
18%
3%
16%8%
24%
6%
44%
7%
39%
16%
28%
69%
18%
74%79%
96%
9%14%
7%
25%
40%22%
63% 26%
79%
27%
53%
36%
29%
43%
19%
59%
21%18%
4%
25%
22% 39%
16%
31% 44%
15%
38%
7%
21%32%
18%
49%
26%
10%
22%
4% 3%
66%62%
53%
42%
26%18% 14% 12%
8% 8% 7% 6% 6% 2%
KOR JPN SGP SWE POR NED ESP USA FRA POL UK GER RUS CHN BRA AUS ITA IND NGA
>=100Mbit/s
>=30Mbit/s and<100Mbit/s
>=10Mbit/s and<30Mbit/s
<10Mbit/s
Proportion of connections (%)

108
In the UK, 4G connections accounted for 36% of total mobile connections at the end of 2015, a 17pp year on year increase
At the end of 2015, 4G mobile broadband connections accounted for at least 50% of total mobile connections (including M2M connections) in South Korea, Australia and the US. South Korea ranked first, with 71%, having migrated its remaining 2G connections onto 3G or 4G networks in 2015. Among our comparator countries, only Japan and South Korea had all their mobile connections on 3G or 4G networks.
The UK was seventh (36% of total UK mobile connections were 4G at the end of 2015), up by 17pp from year-end 2014. The increased availability of 4G networks and growing consumer appetite for mobile data has helped drive take-up of 4G services in the UK.
Figure 3.39 Percentage of 3G and 4G connections as a proportion of total mobile connections: year-end 2015
Source: IHS Note: NGA is the country code for Nigeria. All figures have been rounded to the nearest whole number. The countries are ranked by 4G connections as a proportion of total mobile connections
Mobile broadband connections per 100 people increased in all of the comparator countries at the end of 2015
Singapore had the highest number of mobile broadband connections (aggregating 3G and 4G) per 100 people at 146, driven by high rates of multi-SIM and multi-device use. India had the fewest connections (11), due in part to the low levels of 3G and 4G availability, which is concentrated largely in urban areas. By comparison, the UK had 110 mobile broadband connections per 100 people, ranking eighth among our comparator countries.
The number of 4G mobile broadband connections per 100 people had increased in all comparator countries at the end of 2015. South Korea led this growth (83), while the UK ranked seventh (47). Poland had the most 3G connections per 100 people, at 97, while the UK fell from 84 3G connections per 100 people (year-end 2014) to 63, as customers migrated to 4G services.
29%
42%38%
51%43%
38%48%
36%30%
53%
32%
65%
54% 53%
66%58%
12%
41%
14%
71%54%
50%
49%
44%
39%
36%
31%
29%
28%
27%
26%
20%17%
14%
10%
9%
1%
0%
100% 96%
88%
100%
87%
77%
84%
68%
59%
82%
59%
90%
74%70%
81%
68%
21%
42%
14%
KOR AUS USA JPN SGP SWE UK NED CHN POR FRA ESP GER ITA POL BRA RUS NGA IND
4G
3G
Proportion of connections (%)
4G 8 15 11 14 8 13 17 12 21 n/a 13 14 9 12 7 7 4 0 0
3G -7 -11 -6 -14 -9 -12 -17 -6 -7 n/a -8 -9 -2 -7 -4 7 0 10 4
Year-on-
year
change
(pp)

109
Figure 3.40 Mobile broadband connections per 100 people: year-end 2015
Source: IHS Note: Mobile broadband includes all data connections made on cellular networks, including those made via mobile handsets and using dedicated mobile data dongles and SIMs. NGA is the country code for Nigeria. All figures have been rounded to the nearest whole number. The countries are ranked by 4G connections per 100 people.
The UK ranked fourth for fixed data volume consumption per head, at 27GB per month in 2015
With the increase in availability and adoption of fixed broadband, data traffic volumes grew in most of our comparator countries in 2015. South Korea had the highest fixed data volume per head, at 50GB per month. The UK was fourth, at 27GB, an increase of 5GB (from 22GB in 2014).
Figure 3.41 Fixed data volume per capita per month: 2015
Source: IHS Note: NGA is the country code for Nigeria. All figures have been rounded to the nearest whole number.
50
3835
27
2221
19
16 15 1512 11
85 5 4
30 0
KOR JPN SWE UK USA SGP NED POR FRA AUS GER ESP ITA POL RUS CHN BRA IND NGA
GB per capita

110
Mobile data volume per capita in the UK reached 1.2GB per month in 2015, an increase of 63% since 2014.
In the UK, the increasing adoption of smartphones, used by 72% of the respondents in the UK, and 4G services, has led to this growth in mobile data consumption, which reached 1.2GB per month in 2015, with 4G data accounting for 85% of total mobile data volume. Please see chapter 6 Internet and online content for further details on smartphone take-up among our comparator countries. Sweden had the highest mobile data volume per person, at 4.2GB per month, followed by South Korea at 3.0GB per month.
Figure 3.42 Mobile data volume per person per month: 2015
Source: IHS Note: NGA is the country code for Nigeria
Of all our comparator countries, the UK and the US had the highest levels of satisfaction with reliability of household fixed broadband services
In the UK and the US, 72% of respondents were either 'very' or 'fairly' satisfied with the reliability of their fixed broadband connection in 2016. More than three-quarters of respondents in the UK were also satisfied with their overall fixed broadband service.
2.42.9
2.21.9
1.3 1.2
0.61.0
0.5 0.5 0.5 0.4 0.4 0.3 0.2 0.1 0.1 0.0 0.0
1.8
0.1
0.50.4
0.7
0.4
0.50.2
0.60.3 0.2 0.2 0.2 0.3
0.1 0.1 0.10.1 0.0
4.2
3.0
2.6
2.4
1.9
1.6
1.2 1.21.1
0.8 0.7 0.6 0.6 0.6
0.3 0.3 0.20.1 0.0
SWE KOR USA JPN SGP AUS POL UK ITA FRA ESP GER POR NED RUS BRA CHN NGA IND
3G/2G
4G
4G as
proportion of total (%)
GB per capita
57 97 82 82 67 75 54 85 47 65 67 70 70 57 55 50 61 2 8

111
Figure 3.43 Satisfaction with fixed broadband service: 2016
Source: Ofcom consumer research 2016 Base: All respondents who use the internet at least once a week, UK=744, FRA=786, GER=655, ITA=644, USA=531, JPN=513, AUS=656, ESP=679, SWE=701 Q.30 To what extent are you satisfied or dissatisfied with the following aspects of your current home broadband service? A: Very or fairly satisfied
Australia had the highest average fixed broadband revenue per connection, at £53.82 per month in 2015
Fixed broadband revenue per connection was highest in Australia in 2015, at £53.82 per month, followed by Singapore at £38.39. China had the largest increase in average revenue per connection, driven by an increase in the adoption of faster broadband services. The UK ranked ninth, at £17.69 in 2015.
Figure 3.44 Average monthly fixed broadband revenue per connection: 2015
Source: IHS Note: NGA is the country code for Nigeria, and does not refer to next generation access technologies.
76%
71%
69% 72
%
68%
77%
66% 71
%
71%
69%
76%
71%
70%
71%
68%
69%
62% 64
% 67%
62%
78%
73%
71%
72%
68%
54%
48%
46%
54%
43%
74%
65%
62%
68%
61%
67%
63%
63% 65
%
62%65
%
65%
66%
67%
63%
Overall service Download speeds Upload speeds Reliability of connection Quality/speed of connectionwith more than one device
UK FRA GER ITA USA JPN AUS ESP SWE
Proportion of respondents (%). Figures represent those who were ‘very’ or ‘fairly’ satisfied
53.82
38.39 37.36
31.97
23.88 23.5420.78
18.61 17.69 16.9515.39 15.14
13.44 12.6810.36
8.38 7.465.62 4.68
AUS SGP JPN USA SWE BRA KOR NGA UK ESP POR NED CHN POL ITA GER FRA RUS IND
£ per month

112
Average monthly non-messaging mobile data revenue per mobile connection in the UK was £5.77 in 2015
In 2015, the average monthly non-messaging mobile data revenue per mobile connection ranged from £0.43 in India to £15.41 in Japan. The US and Japan were the only comparator countries where non-messaging mobile data revenues were more than £10 per connection per month. In the UK, the average monthly non-messaging mobile data revenue reached £5.77 in 2015, as more consumers migrated to 4G services and data consumption increased.
Figure 3.45 Average non-messaging mobile data revenue per mobile connection: 2015
Source: IHS Note: NGA is the country code for Nigeria
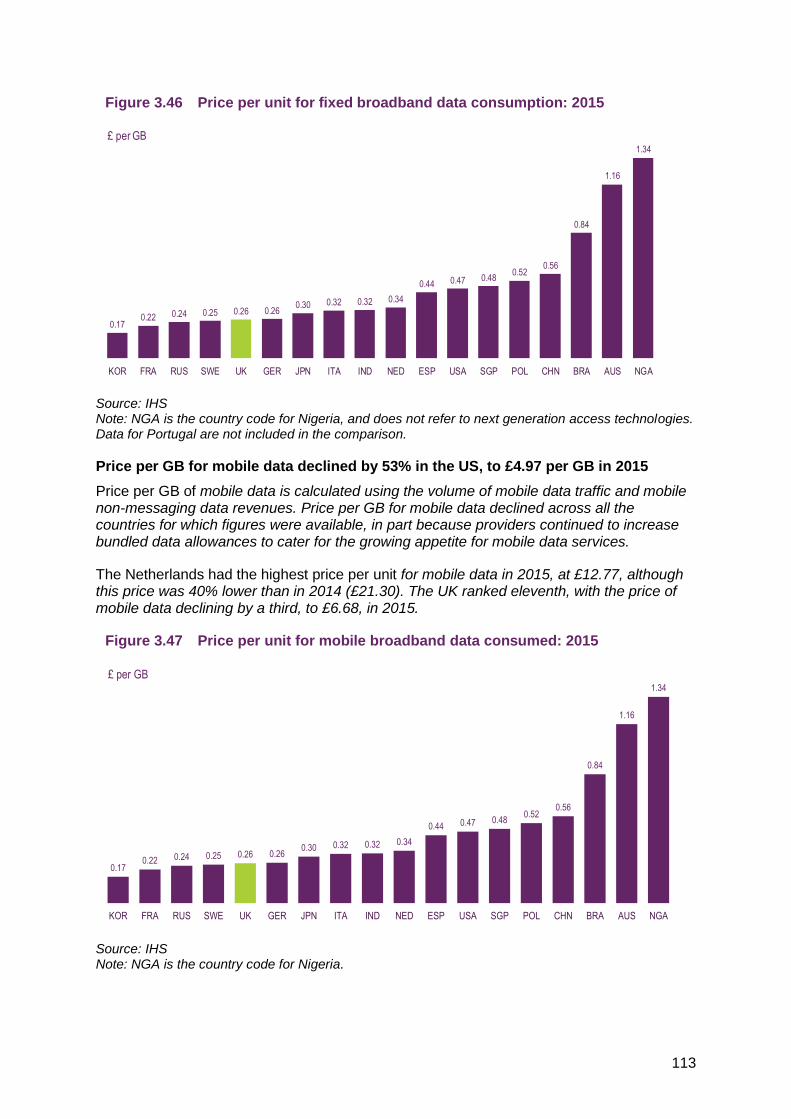
Nigeria had the highest price per GB for fixed broadband data, at £1.34 in 2015
Price per GB of fixed broadband data is calculated using volume of fixed broadband data traffic and fixed broadband revenue. South Korea had the cheapest price for fixed broadband data, at £0.17, per GB, while Nigeria was the most expensive, at £1.34, of the comparator countries for which figures were available. Prices in many markets declined, although there were exceptions such as China, where the price increased by 8.2% to £0.56 in 2015, as more consumers migrated to FTTx services. The UK ranked fifth, at £0.26 per GB, a decline of 6.9% since 2014.
15.41
10.90
8.617.86
7.41
6.175.77
5.25
4.373.72 3.52
2.592.26
1.881.30 1.28
0.80 0.66 0.43
JPN USA KOR SGP AUS ESP UK NED SWE GER FRA ITA POR CHN BRA POL RUS NGA IND
£ per month
113
Figure 3.46 Price per unit for fixed broadband data consumption: 2015
Source: IHS Note: NGA is the country code for Nigeria, and does not refer to next generation access technologies. Data for Portugal are not included in the comparison.
Price per GB for mobile data declined by 53% in the US, to £4.97 per GB in 2015
Price per GB of mobile data is calculated using the volume of mobile data traffic and mobile non-messaging data revenues. Price per GB for mobile data declined across all the countries for which figures were available, in part because providers continued to increase bundled data allowances to cater for the growing appetite for mobile data services.
The Netherlands had the highest price per unit for mobile data in 2015, at £12.77, although this price was 40% lower than in 2014 (£21.30). The UK ranked eleventh, with the price of mobile data declining by a third, to £6.68, in 2015.
Figure 3.47 Price per unit for mobile broadband data consumed: 2015
Source: IHS Note: NGA is the country code for Nigeria.
0.170.22 0.24 0.25 0.26 0.26
0.30 0.32 0.32 0.34
0.44 0.47 0.480.52
0.56
0.84
1.16
1.34
KOR FRA RUS SWE UK GER JPN ITA IND NED ESP USA SGP POL CHN BRA AUS NGA
£ per GB
0.170.22 0.24 0.25 0.26 0.26
0.30 0.32 0.32 0.34
0.44 0.47 0.480.52
0.56
0.84
1.16
1.34
KOR FRA RUS SWE UK GER JPN ITA IND NED ESP USA SGP POL CHN BRA AUS NGA
£ per GB

114
Choice
To compare the amount of choice available to consumers in the fixed and mobile broadband markets, we have used some proxy measures of consumer choice. For the fixed broadband market, we have compared the percentage of fixed broadband subscriptions that the incumbent provides, while for the mobile broadband market, we have considered the market share of the largest mobile network operator (MNO) and the Herfindahl-Hirschman index of market concentration (HHI) in each country (Figure 3.50).
The proportion of retail fixed broadband lines operated by incumbents remains broadly stable
The incumbent fixed broadband providers in India (BSNL) and Australia (Telstra) operated the highest proportion of lines, at 54%, closely followed by the Italian incumbent (Telecom Italia) at 51% at the end of 2015. The US and Sweden were the only comparator countries in which the incumbent fixed broadband provider operated less than 25% of lines at the end of 2015. In the UK, incumbent provider BT operated 32% of fixed broadband lines, lower than that of the incumbent providers in all other EU5 markets and many other comparator countries. However, in 2016, BT completed the acquisition of EE, which has a small share of the fixed broadband market, so BT’s overall retail share of fixed broadband lines is likely to increase.
Figure 3.48 Percentage of fixed broadband lines operated by incumbent: year-end 2015
Source: IHS Note: Data for Nigeria are not included in the comparison. All figures have been rounded to the nearest whole number.
China Mobile had the largest market share of any leading MNO in the comparator countries, at 63% at the end of 2015
Among the comparator countries, India was the only country where the leading MNO (Bharti Airtel) had less than 25% share of mobile connections at the end of 2015. China’s leading MNO and the largest mobile operator in the world by number of connections, China Mobile, had a 63% share. The second most concentrated market was Australia, where Telstra had a 54% share, followed by Singapore, where SingTel had a 50% share. In the UK, the largest MNO, EE, had a 34% market share (including wholesale and hosted MVNO connections).
17%
22%
25%
32%35% 36%
40%41% 41% 41% 42%
43% 44% 44% 45%
51%
54% 54%
SWE USA POL UK SGP BRA FRA GER RUS NED KOR AUS ESP POR CHN ITA JPN IND
Share of lines (%)
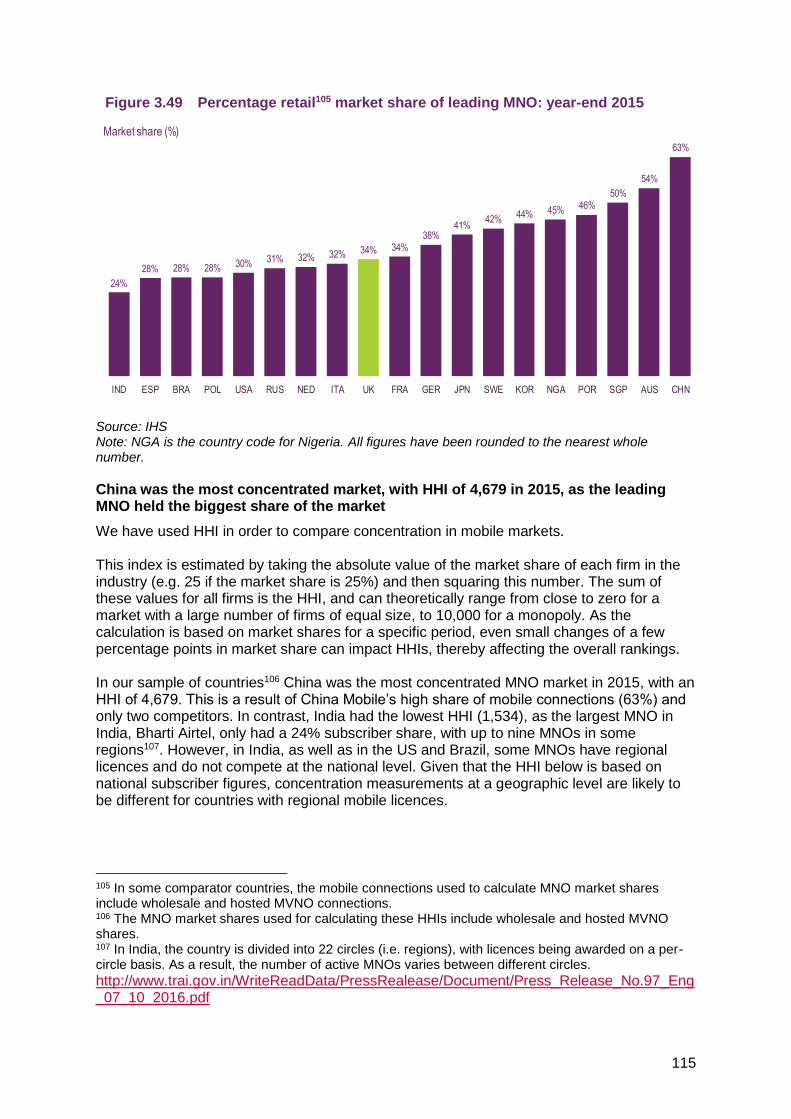
115
Figure 3.49 Percentage retail105 market share of leading MNO: year-end 2015
Source: IHS Note: NGA is the country code for Nigeria. All figures have been rounded to the nearest whole number.
China was the most concentrated market, with HHI of 4,679 in 2015, as the leading MNO held the biggest share of the market
We have used HHI in order to compare concentration in mobile markets. This index is estimated by taking the absolute value of the market share of each firm in the industry (e.g. 25 if the market share is 25%) and then squaring this number. The sum of these values for all firms is the HHI, and can theoretically range from close to zero for a market with a large number of firms of equal size, to 10,000 for a monopoly. As the calculation is based on market shares for a specific period, even small changes of a few percentage points in market share can impact HHIs, thereby affecting the overall rankings. In our sample of countries106 China was the most concentrated MNO market in 2015, with an HHI of 4,679. This is a result of China Mobile’s high share of mobile connections (63%) and only two competitors. In contrast, India had the lowest HHI (1,534), as the largest MNO in India, Bharti Airtel, only had a 24% subscriber share, with up to nine MNOs in some regions107. However, in India, as well as in the US and Brazil, some MNOs have regional licences and do not compete at the national level. Given that the HHI below is based on national subscriber figures, concentration measurements at a geographic level are likely to be different for countries with regional mobile licences.
105 In some comparator countries, the mobile connections used to calculate MNO market shares include wholesale and hosted MVNO connections. 106 The MNO market shares used for calculating these HHIs include wholesale and hosted MVNO shares. 107 In India, the country is divided into 22 circles (i.e. regions), with licences being awarded on a per-circle basis. As a result, the number of active MNOs varies between different circles.
http://www.trai.gov.in/WriteReadData/PressRealease/Document/Press_Release_No.97_Eng_07_10_2016.pdf
24%
28% 28% 28% 30% 31% 32% 32% 34% 34%38%
41%42%
44% 45% 46%50%
54%
63%
IND ESP BRA POL USA RUS NED ITA UK FRA GER JPN SWE KOR NGA POR SGP AUS CHN
Market share (%)

116
In our comparison the UK ranked sixth with an HHI of 2,877;108 a lower concentration index than Japan, South Korea and Germany but higher than the US and Russia, among others.
Figure 3.50 Mobile market HHI, MNOs (including wholesale and hosted MVNO): year-end 2015
Source: IHS Note: NGA is the country code for Nigeria
108 In November 2016 we published Award of the 2.3 and 3.4 GHz spectrum bands: Competition issues and auction regulations document. Here, the HHI indices were calculated using a different source for the market share data (Analysys Mason), covering a different set of countries. As a result, the estimated HHIs are different, especially for the Netherlands (3,495), France (2,788) and Sweden (2,859), with small differences for Italy (2,812), Spain (2,970) and the UK (2,869). See figure A6.22 of https://www.ofcom.org.uk/__data/assets/pdf_file/0026/93545/award-of-the-spectrum-bands-consultation.pdf
1,535
2,449 2,538 2,5462,657
2,756 2,7842,885 2,967 2,992 3,011
3,4053,502
3,603 3,6103,749 3,752
4,079
4,680
IND BRA POL GER RUS USA UK FRA ESP SWE NGA ITA JPN POR NED KOR SGP AUS CHN