the iphc management strategy evaluation process
TRANSCRIPT

The IPHC Management StrategyEvaluation Process
Bruce Leaman and Allan Hicks
April 2016 NPFMC 1

• What is the current IPHC process for management
• Why we need a different process
• What are the benefits of MSE
• How the IPHC is implementing MSE
Outline
April 2016 NPFMC Slide 2

Some industry views on where we have been
• Frequent model changes for assessments – why?
• Decision-making process unclear
• Issues indirectly related to stock status ignored
• Model doesn’t reflect “real world” experience
• Impediments to communication
• Perceived or real participation gaps
• Stakeholders losing confidence in existing approach
• Conflicts between users that science cannot and should not resolve
• Conflicts between scientists!
3April 2016 NPFMC
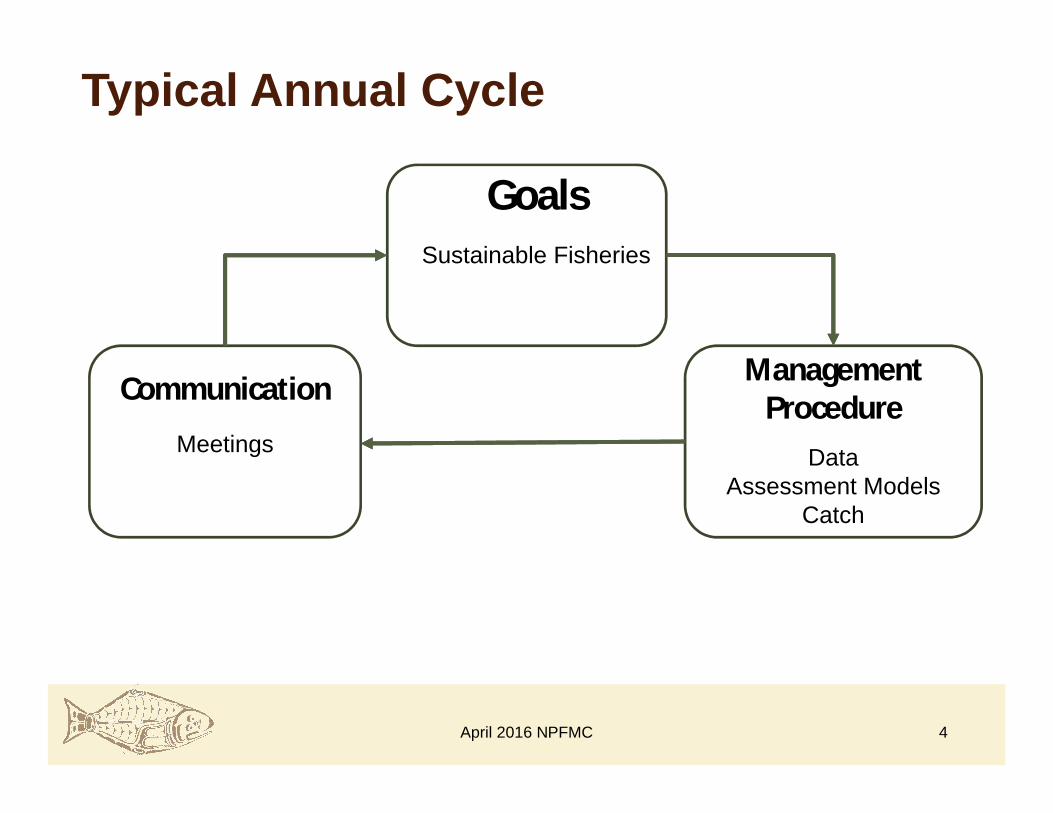
Typical Annual Cycle
Management Procedure
Goals
Communication
DataAssessment Models
Catch
Meetings
Sustainable Fisheries
4April 2016 NPFMC
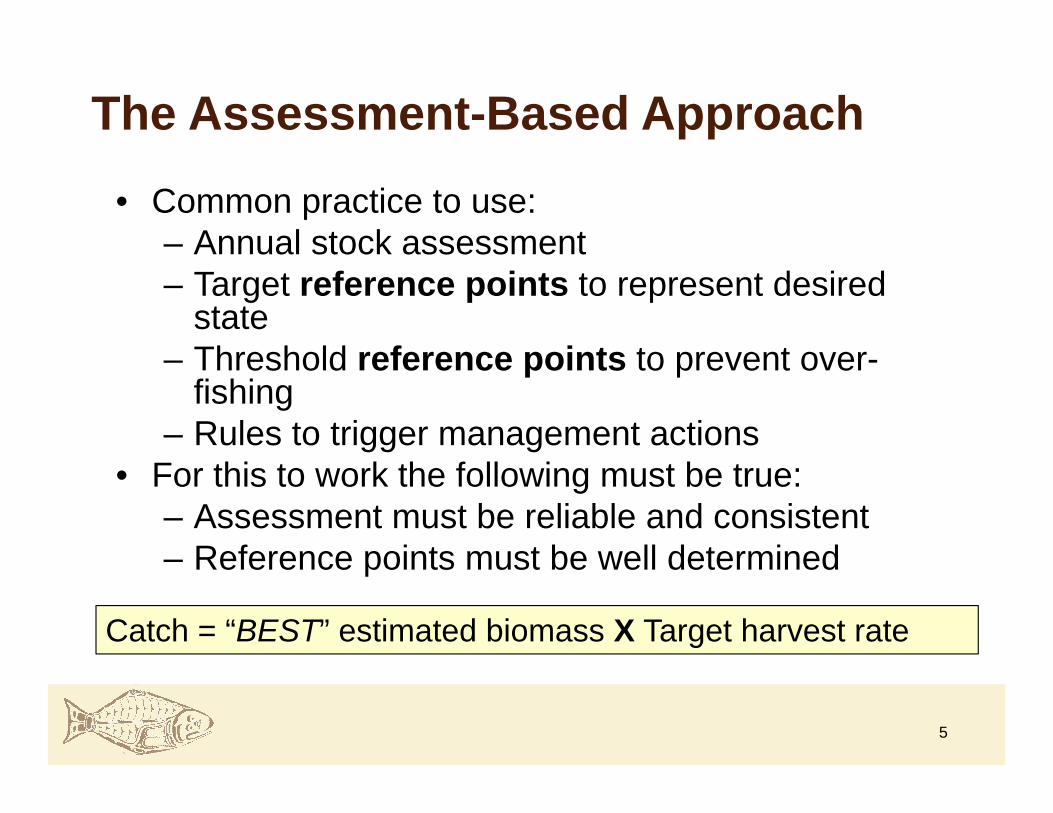
The Assessment-Based Approach
• Common practice to use:– Annual stock assessment– Target reference points to represent desired
state– Threshold reference points to prevent over-
fishing– Rules to trigger management actions
• For this to work the following must be true:– Assessment must be reliable and consistent– Reference points must be well determined
Catch = “BEST” estimated biomass X Target harvest rate
5
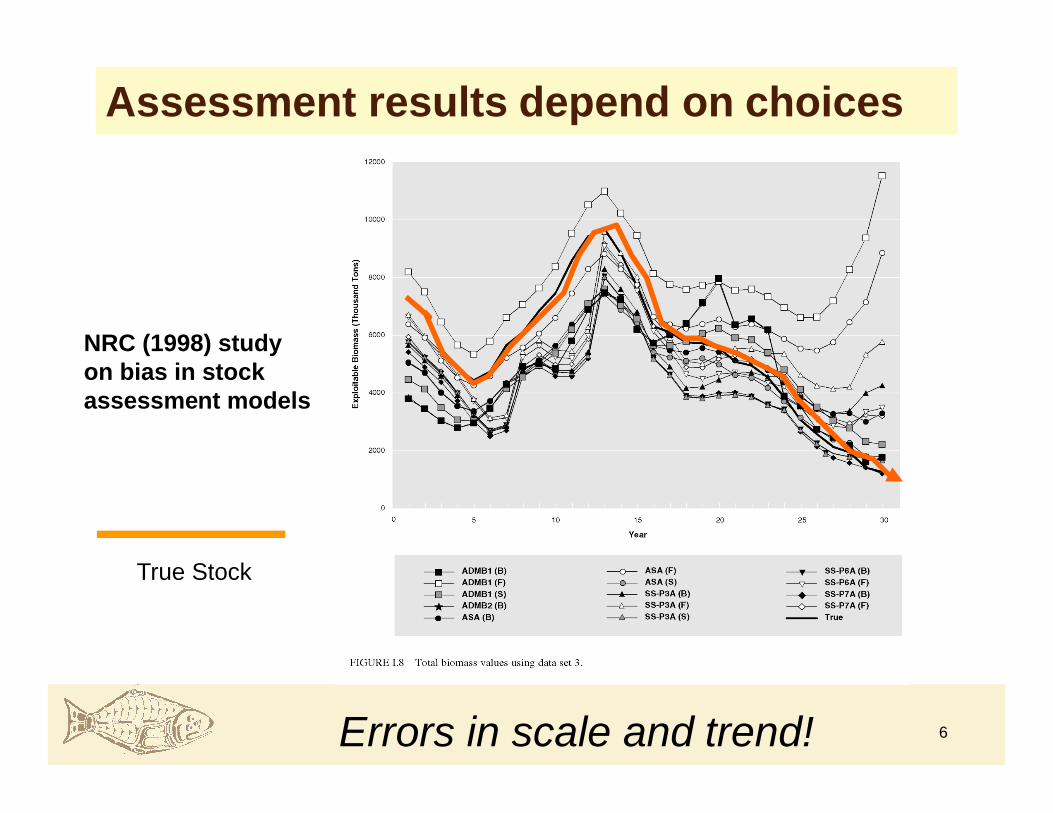
Assessment results depend on choices
NRC (1998) studyon bias in stock assessment models
True Stock
6Errors in scale and trend!
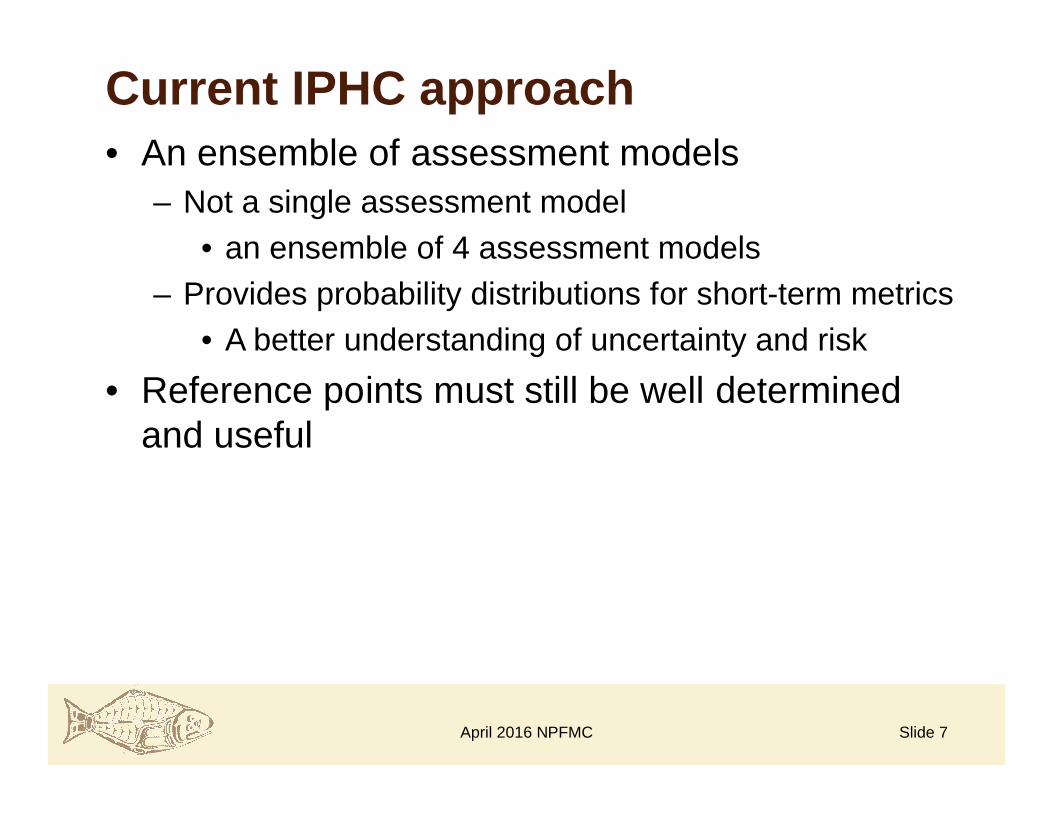
• An ensemble of assessment models– Not a single assessment model
• an ensemble of 4 assessment models
– Provides probability distributions for short-term metrics
• A better understanding of uncertainty and risk
• Reference points must still be well determined and useful
Current IPHC approach
April 2016 NPFMC Slide 7
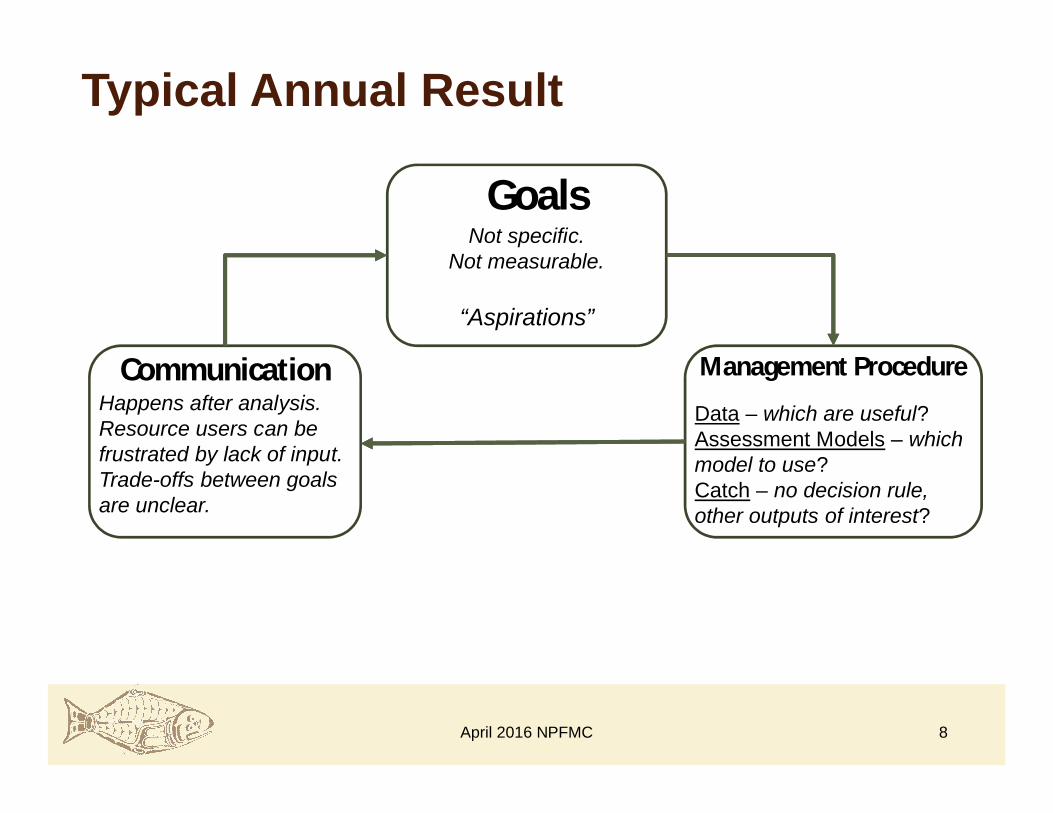
Typical Annual Result
Management Procedure
Goals
Communication
8April 2016 NPFMC
Not specific.Not measurable.
“Aspirations”
Data – which are useful?Assessment Models – which model to use?Catch – no decision rule, other outputs of interest?
Happens after analysis.Resource users can be frustrated by lack of input.Trade-offs between goals are unclear.
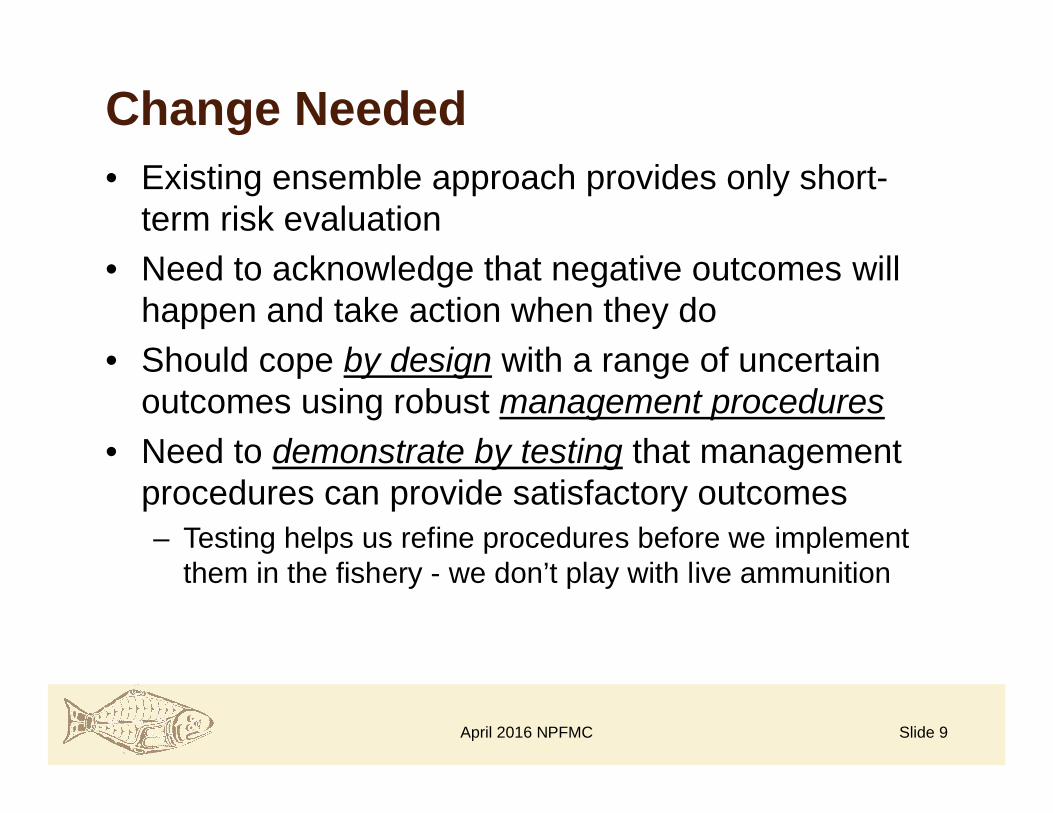
• Existing ensemble approach provides only short-term risk evaluation
• Need to acknowledge that negative outcomes will happen and take action when they do
• Should cope by design with a range of uncertain outcomes using robust management procedures
• Need to demonstrate by testing that management procedures can provide satisfactory outcomes– Testing helps us refine procedures before we implement
them in the fishery - we don’t play with live ammunition
Change Needed
April 2016 NPFMC Slide 9

Improvements?
• Can we modify existing annual cycle to:
– Increase engagement of resource users
– Demonstrate policy goals are being met
– Direct energy to decision-making rather than confrontation
10April 2016 NPFMC
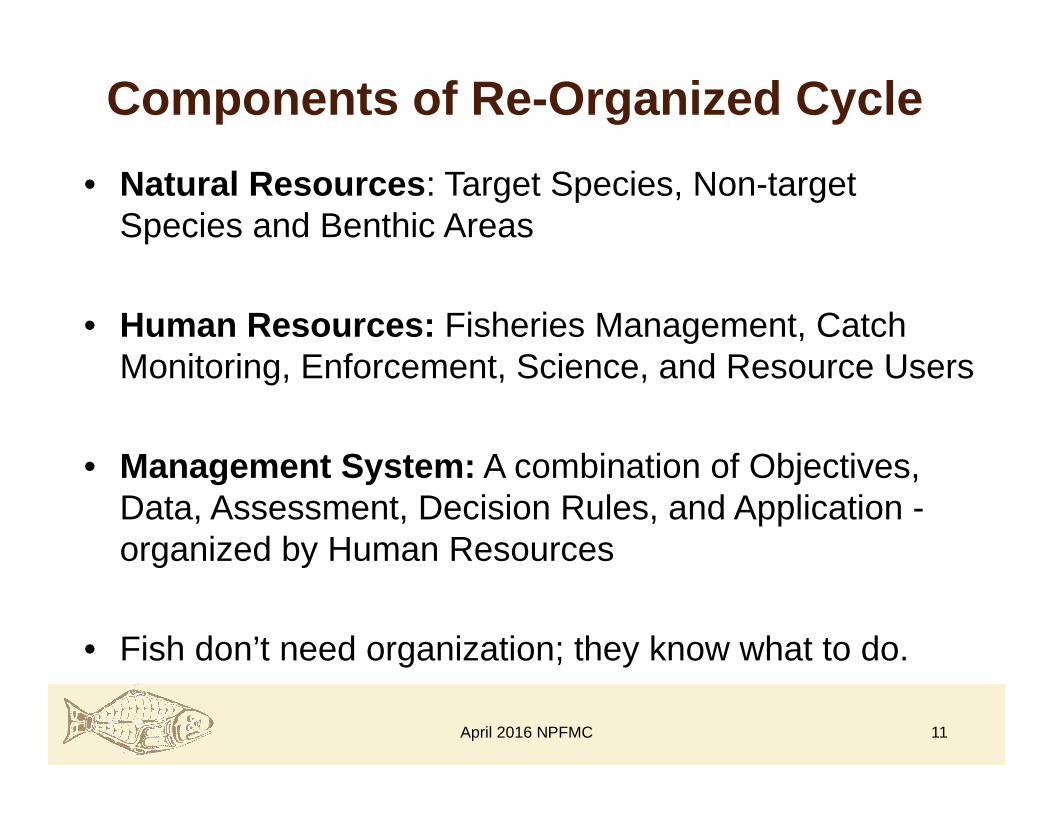
Components of Re-Organized Cycle
• Natural Resources: Target Species, Non-target Species and Benthic Areas
• Human Resources: Fisheries Management, Catch Monitoring, Enforcement, Science, and Resource Users
• Management System: A combination of Objectives, Data, Assessment, Decision Rules, and Application -organized by Human Resources
• Fish don’t need organization; they know what to do.
11April 2016 NPFMC
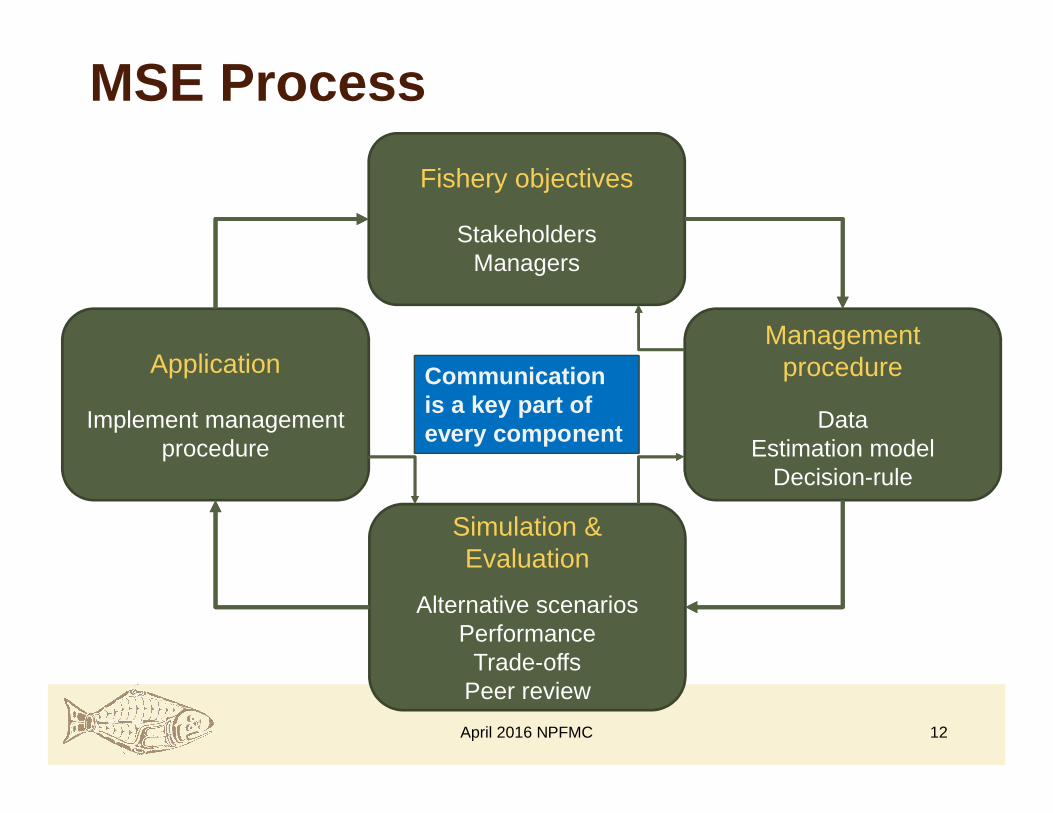
Fishery objectives
StakeholdersManagers
Management procedure
DataEstimation model
Decision-rule
Simulation & Evaluation
Alternative scenariosPerformance
Trade-offsPeer review
Application
Implement management procedure
MSE Process
12April 2016 NPFMC
Communication is a key part of every component
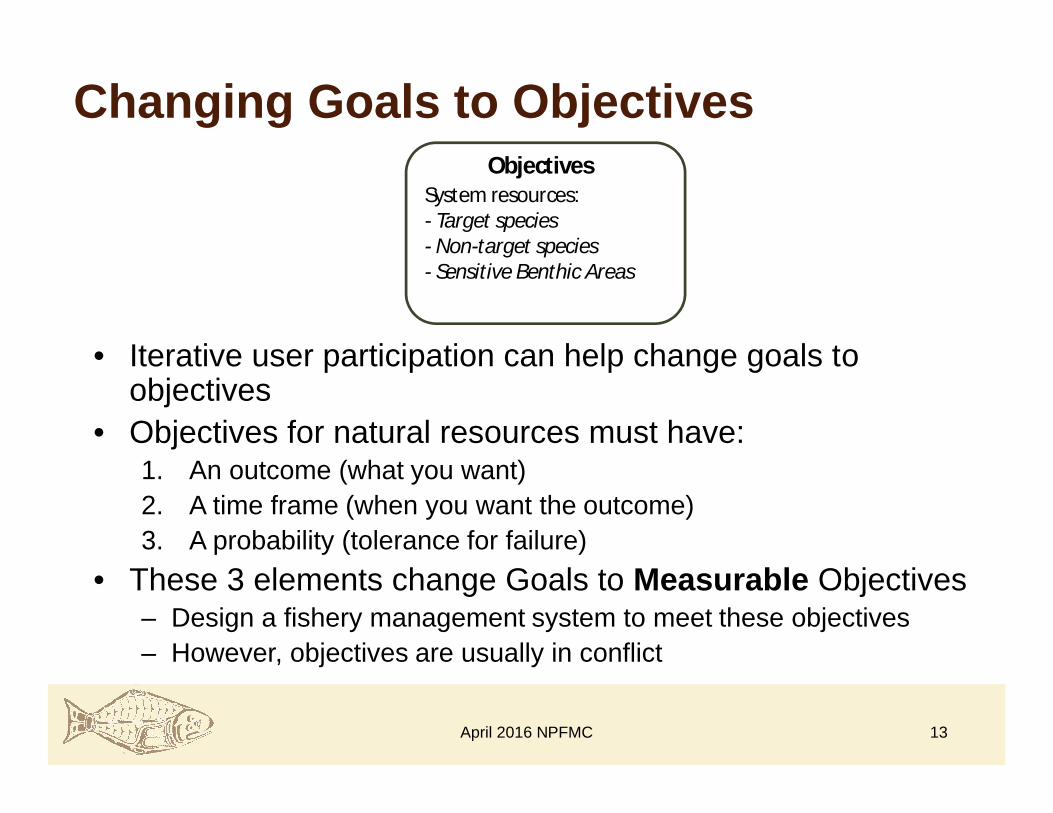
System resources:- Target species- Non-target species- Sensitive Benthic Areas
Changing Goals to ObjectivesObjectives
13
• Iterative user participation can help change goals to objectives
• Objectives for natural resources must have:1. An outcome (what you want)2. A time frame (when you want the outcome)3. A probability (tolerance for failure)
• These 3 elements change Goals to Measurable Objectives– Design a fishery management system to meet these objectives– However, objectives are usually in conflict
April 2016 NPFMC
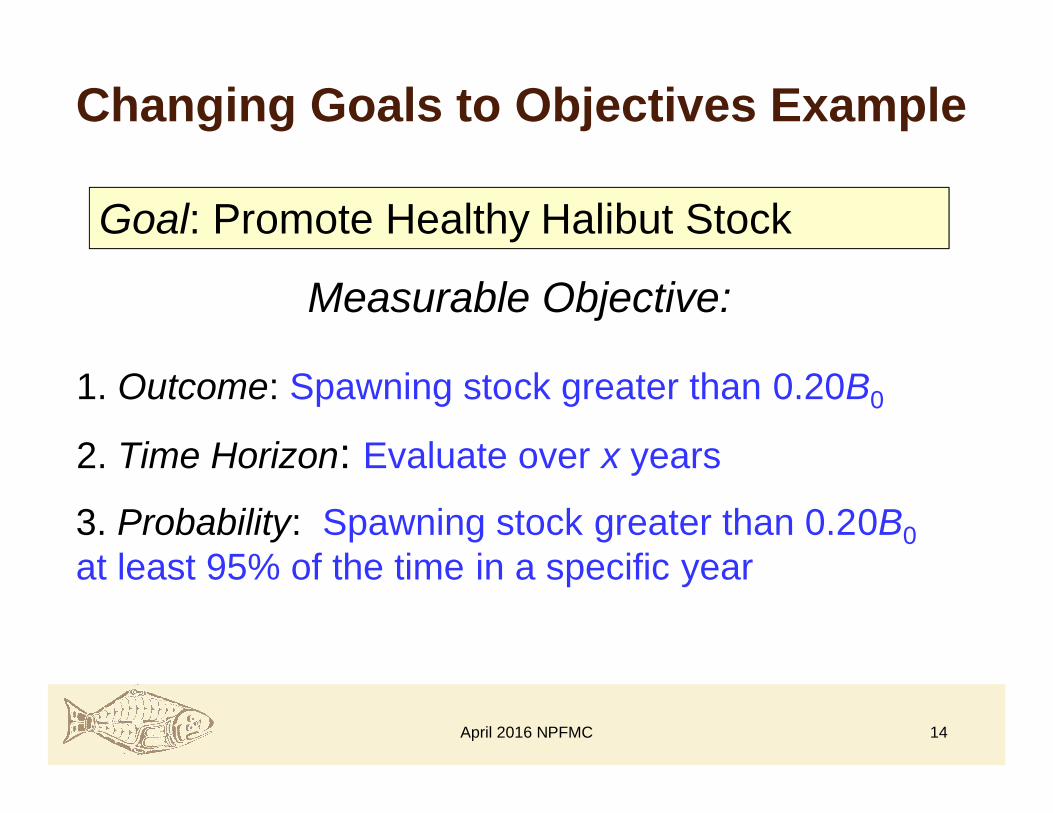
Changing Goals to Objectives Example
1. Outcome: Spawning stock greater than 0.20B0
2. Time Horizon: Evaluate over x years
3. Probability: Spawning stock greater than 0.20B0
at least 95% of the time in a specific year
Goal: Promote Healthy Halibut Stock
Measurable Objective:
14April 2016 NPFMC
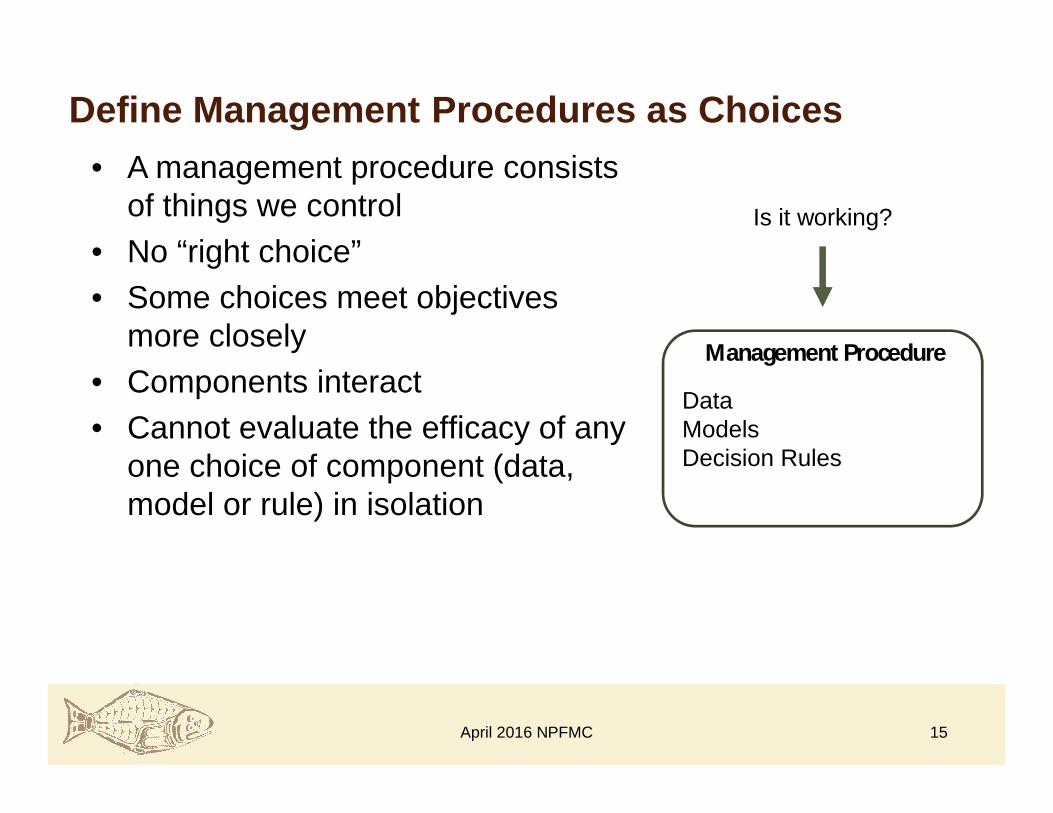
Define Management Procedures as Choices
DataModelsDecision Rules
Management Procedure
15
• A management procedure consists of things we control
• No “right choice”
• Some choices meet objectives more closely
• Components interact
• Cannot evaluate the efficacy of any one choice of component (data, model or rule) in isolation
Is it working?
April 2016 NPFMC

Performance measures re: ObjectivesTechnical analysisRobustness tests = risk assessmentOutputs for decision-making
Simulation and Evaluation
Evaluation
16
• Testing a choice of management procedures against alternative scenarios – what does this achieve?– Defines risk assessment by admitting uncertainty in natural
systems (alternative hypotheses)• Simulated with operating models
– Calculation of performance measures to measure whether objectives are likely to be met
– Compliance with Precautionary Approach, world-wide “best practices”
– Exposes trade-offs between objectives – users get to see this
April 2016 NPFMC

Operating model vs. mgmt procedure
Operating model
Stock-recruitment relationship
Natural mortality
Selectivity (time-varying?)
Movement and life history
Growth (time-varying?)
Predator-prey drivers
Environmental drivers
Discard mortality (by gear types?)
Recruitment forecasting
17
Management Procedure
Survey index (frequency, sample size?)
Biological data (frequency, which samples?)
Estimation models (simple or complex)
Assessment frequency
Harvest control rule
- Form of rule shape
- Choice of control points
Biomass control points
Fishing rate control points
ChoicesScenarios
We don’t control these thingsWe make assumptionsWe might have data to help
We make these choices
April 2016 NPFMC

Testing Candidate Procedures
18
Apply each candidate procedure against each Scenario generated by the Operating Model.
Do this many times with random noise on each repeated trial (or replicate) to capture uncertainty.
Scenario A
Scenario C
Scenario B
Procedure 1
Procedure 2
Procedure 3
Procedure 1
Procedure 2
Procedure 3
Procedure 1
Procedure 2
Procedure 3
Procedure 4
Procedure 4
Procedure 4
April 2016 NPFMC

Decision Making
Conservation
Yield StabilityYield
• Can’t maximize conservation, yield, and stability objectives at the same time – these objectives trade-off
• Pick management procedure (data, assessment, rule) not the TAC
19April 2016 NPFMC

Performance Trade-offs
0.25 0.30 0.35 0.40
3000
3200
3400
3600
3800
4000
4200
Average Depletion
Ave
rag
e C
atc
h (
t)
Lower Risk
Higher Risk
Procedure 1
Procedure 2
Procedure 3
Procedure 4
Relative Stock Size
More $$$
Less $$$
Scenario A
20April 2016 NPFMC
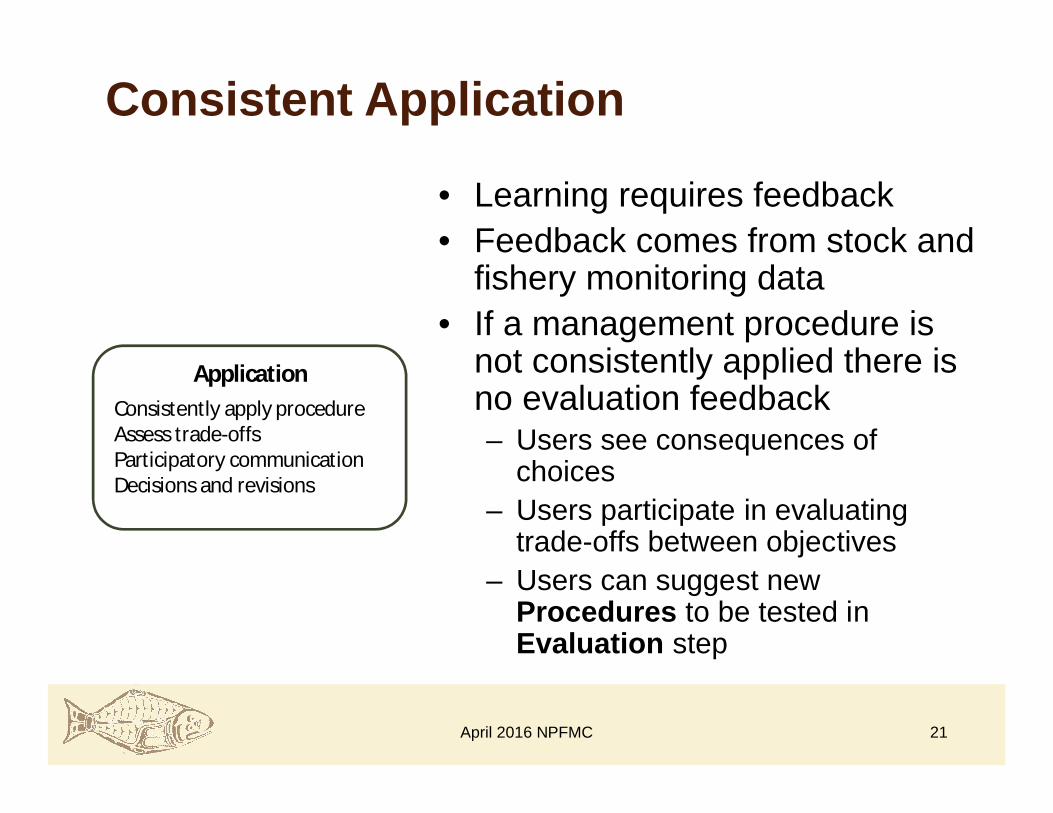
Consistent Application
Application
21
• Learning requires feedback• Feedback comes from stock and
fishery monitoring data• If a management procedure is
not consistently applied there is no evaluation feedback– Users see consequences of
choices– Users participate in evaluating
trade-offs between objectives– Users can suggest new
Procedures to be tested in Evaluation step
Consistently apply procedureAssess trade-offsParticipatory communicationDecisions and revisions
April 2016 NPFMC

Fishery objectivesSystem Resources• Target species• Non-target species• Sensitive benthic areas
“Measurable”
Management procedure
Historical and future dataModelsDecision-rule
“Choices”
Simulation & EvaluationPerformance measures • re: objectivesTechnical analystsRobustness tests – risk assessmentOutputs for decision making
“Learning”
Application
Consistently apply procedureAssess trade-offsParticipation and communicationDecisions and revisions
“Consequences”
A process not a product
22April 2016 NPFMC

• Is not an annual process
• It will likely take longer than a year to get to Application
• However, once a management procedure is applied, it can be left in place for many years– Consistent application
– Evaluated and chosen to be robust
• The annual process is to apply the management procedure
The MSE Process
April 2016 NPFMC Slide 23
How the IPHC is implementing MSE
April 2016 NPFMC Slide 24

Management Strategy Advisory Board
April 2016 NPFMC Slide 25
Commercial harvestersRecreational harvestersTribal/First NationsProcessorsManagersScientists
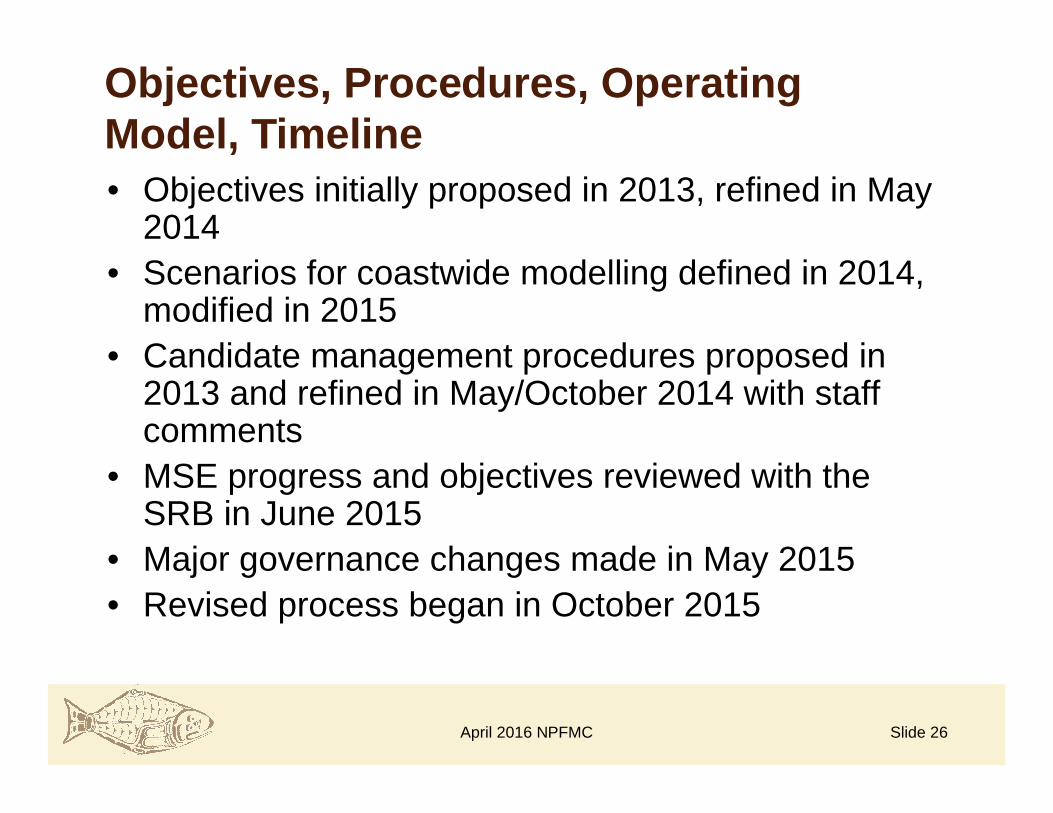
• Objectives initially proposed in 2013, refined in May 2014
• Scenarios for coastwide modelling defined in 2014, modified in 2015
• Candidate management procedures proposed in 2013 and refined in May/October 2014 with staff comments
• MSE progress and objectives reviewed with the SRB in June 2015
• Major governance changes made in May 2015• Revised process began in October 2015
Objectives, Procedures, Operating Model, Timeline
April 2016 NPFMC Slide 26

Slide 27
Five Overarching Objectives• Biological sustainability – identify stock conservation objectives• Fishery (all directed fisheries) sustainability and stability – identify harvest
minimum and acceptable variability• Assurance of access – minimize probability of fishery closures• Minimize bycatch mortality• Serve consumer needs
Management Procedures Initially Proposed for Examination• Total mortality: Direct accounting by area for all sources of mortality in that
area, including sublegals.• Size limits: No size limit, current minimum size limit, 26 inches instead of 32,
slot limits.• Harvest strategies: 30:20 control rule, reference removal rate
21.5%/16.125%, coastwide and by area.• National shares: catch limits by areas would be allocated rather than based
on apportionment.• Bycatch mitigation: Impacts among areas for bycatch in a particular area.
Review of Objectives
April 2016 NPFMC

Slide 28April 2016 NPFMC
Goals Objective Outcome Probability Time frame
Biologicalsustainability
Keep abundance above a certain level
(Limit)
Maintain aminimum of number of mature female halibut coast-wide (e.g., one million)
0.99 Each year
Maintain aminimum spawning stock biomass of
20% of the unfishedbiomass
0.95 Each year
Reduce harvest rate when abundance is below a certain
level(Threshold)
Maintain aminimum spawning stock biomass of
30% of the unfished biomass0.75 Each year
Risk tolerance and assessment uncertainty
When the estimated biomass is between the limit and threshold, reduce the
probability of further declines0.05-0.5 10 years
Candidate goals and objectives for MSE process – May 2014
Slide 29April 2016 NPFMC
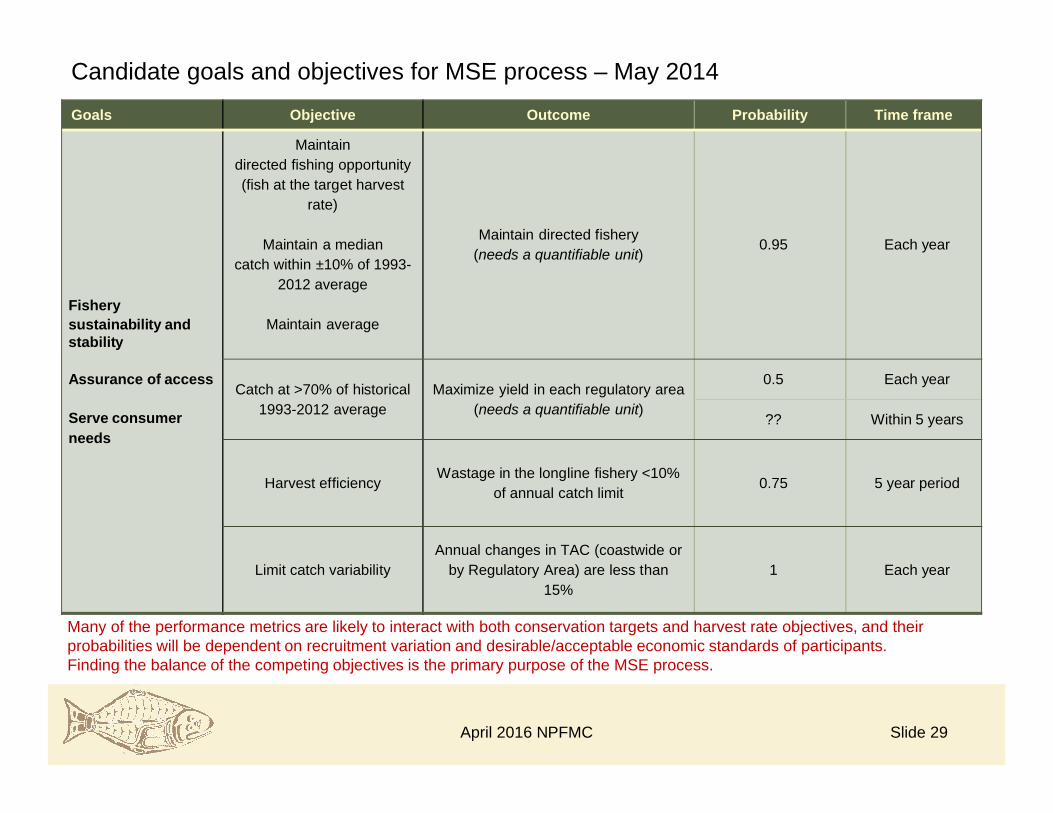
Goals Objective Outcome Probability Time frame
Fisherysustainability and stability
Assurance of access
Serve consumer needs
Maintaindirected fishing opportunity(fish at the target harvest
rate)
Maintain a mediancatch within ±10% of 1993-
2012 average
Maintain average
Maintain directed fishery(needs a quantifiable unit)
0.95 Each year
Catch at >70% of historical 1993-2012 average
Maximize yield in each regulatory area(needs a quantifiable unit)
0.5 Each year
?? Within 5 years
Harvest efficiencyWastage in the longline fishery <10%
of annual catch limit0.75 5 year period
Limit catch variabilityAnnual changes in TAC (coastwide or
by Regulatory Area) are less than 15%
1 Each year
Many of the performance metrics are likely to interact with both conservation targets and harvest rate objectives, and their probabilities will be dependent on recruitment variation and desirable/acceptable economic standards of participants. Finding the balance of the competing objectives is the primary purpose of the MSE process.
Candidate goals and objectives for MSE process – May 2014

• Fisheries selectivity,
• Minimum and maximum size limits,
• Discard mortality rate (DMR) for the directed fishery,
• Average selectivity in bycatch fisheries,
• Bycatch mortality from all other fleets, and
• Price per pound for four different size grades.
Harvest variables implemented in coastwide equilibrium model
Slide 30April 2016 NPFMC

Slide 31April 2016 NPFMC

Slide 32April 2016 NPFMC

• Key Results
• Summary of Actions
MSAB October 2015 Meeting
Slide 33April 2016 NPFMC

• The group brainstormed the roles of MSAB members, IPHC staff, and stakeholder constituents (to be refined as needed), and the group discussed the relationship of the MSAB to the Commission and other Commission advisory bodies
• Representatives of the bycatch fisheries need to be engaged in the future given the huge influence that bycatch mortality has on the directed fishery overseen by the IPHC
• The MSAB will continue to use the coastwide operating model though IPHC staff will continue to develop the spatially explicit model given that many ecological, political, and management issues are specific to halibut management areas
• Four management procedures were evaluated in a group exercise; board members gained greater working capability with the IPHC MSE Tool, and a variety of lessons were learned in terms of the effectiveness of some management procedures with respect to objectives for the fishery
Summary of Key Outcomes 1
Slide 34April 2016 NPFMC

• The group had a first look at the notion of “fishery footprint” which is a measure of fishery impact on the spawning capital and which can be used as a way to understand the relative impacts of the directed and bycatch fisheries on the halibut stock
• A draft outreach strategy including objectives of outreach, who the MSAB engages with, what content is shared out and what input is sought, what tools are used for outreach, and when outreach occurs was reviewed
• Several next steps were identified for co-chairs, the agenda committee, and IPHC staff with respect to documenting the MSE and MSAB’s terms of reference, a presentation at the IPHC annual meeting, preparation for the next MSAB meeting in May 2016, and securing additional resources to support the MSAB in the MSE process
• Future facilitation needs were discussed in a closed door session, and the MSAB agreed that the use of a facilitator but also co-chairs and the agenda committee helped make for a very successful meeting, and that upon further consideration the MSAB continue with facilitation
Summary of Key Outcomes 2
Slide 35April 2016 NPFMC
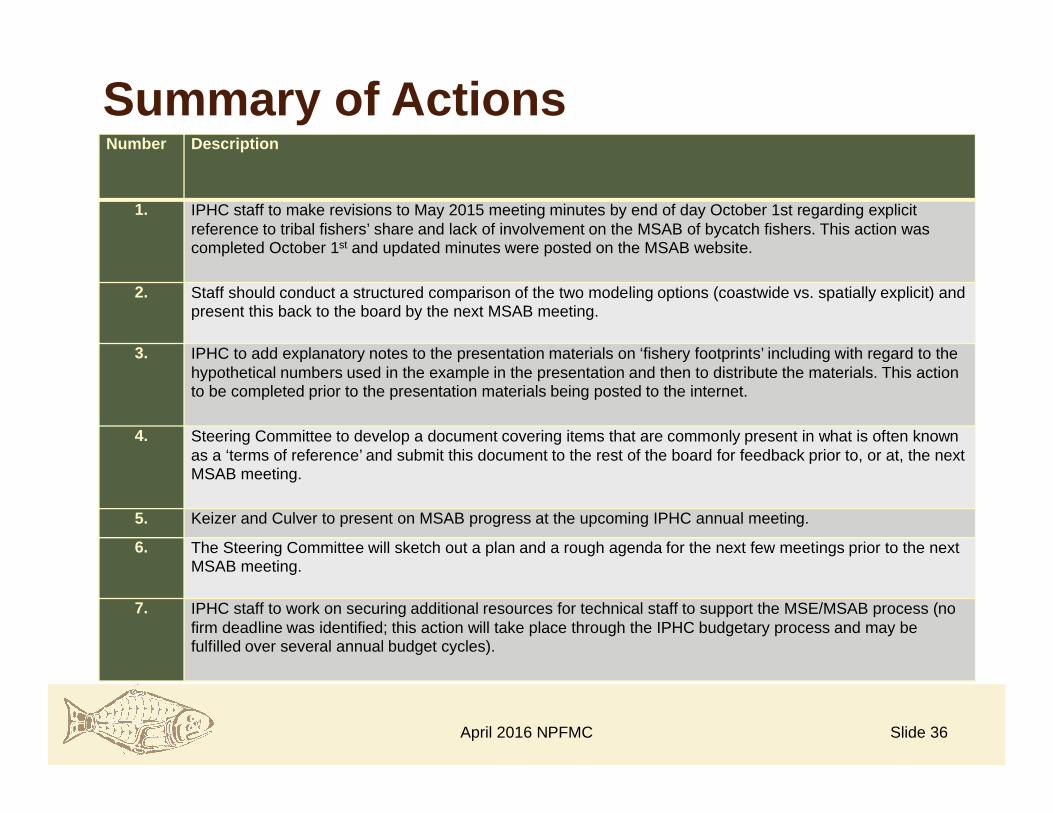
Number Description
1. IPHC staff to make revisions to May 2015 meeting minutes by end of day October 1st regarding explicit reference to tribal fishers’ share and lack of involvement on the MSAB of bycatch fishers. This action was completed October 1st and updated minutes were posted on the MSAB website.
2. Staff should conduct a structured comparison of the two modeling options (coastwide vs. spatially explicit) and present this back to the board by the next MSAB meeting.
3. IPHC to add explanatory notes to the presentation materials on ‘fishery footprints’ including with regard to the hypothetical numbers used in the example in the presentation and then to distribute the materials. This action to be completed prior to the presentation materials being posted to the internet.
4. Steering Committee to develop a document covering items that are commonly present in what is often known as a ‘terms of reference’ and submit this document to the rest of the board for feedback prior to, or at, the next MSAB meeting.
5. Keizer and Culver to present on MSAB progress at the upcoming IPHC annual meeting.
6. The Steering Committee will sketch out a plan and a rough agenda for the next few meetings prior to the next MSAB meeting.
7. IPHC staff to work on securing additional resources for technical staff to support the MSE/MSAB process (no firm deadline was identified; this action will take place through the IPHC budgetary process and may be fulfilled over several annual budget cycles).
Summary of Actions
Slide 36April 2016 NPFMC
• May 2016 meeting– Terms of Reference developed and approved for
recommendation to the Commission
– Two-year work plan developed with Dr. Hicks and other IPHC staff
– Introduce concepts of Closed-loop MSE and data-based vs. model-based control rules
– Finalize Outreach Plan developed by consultants in 2015
– Plan elements of October 2016 meeting
Next steps
April 2016 NPFMC Slide 37
April 2016 NPFMC Slide 38