the japanese market for seafood - food and agriculture ... · the japanese market for seafood ......
TRANSCRIPT
GLOBEFISH RESEARCH PROGRAMME
The Japanese market for seafood
Volume 117
Food and Agriculture Organization of the United NationsFisheries and Aquaculture Policy and Economics DivisionProducts, Trade and Marketing BranchViale delle Terme di Caracalla00153 Rome, ItalyTel.: +39 06 5705 2884Fax: +39 06 5705 3020www.globefish.org
GRP117coverB5.indd 1GRP117coverB5.indd 1 04/02/2015 11:39:0204/02/2015 11:39:02
The Japanese market for seafood
by
Andreas Kamoey
(January, 2015)
The GLOBEFISH Research Programme is an activity initiated by FAO's Products, Trade and Marketing Branch, Fisheries and Aquaculture Policy and Economics Division, Rome, Italy and it is partly financed by its Partners and Associate Members. For further information please refer to www.globefish.org
ii
The designations employed and the presentation of material in this information product do not imply the expression of any opinion whatsoever on the part of the Food and Agriculture Organization of the United Nations (FAO) concerning the legal or development status of any country, territory, city or area or of its authorities, or concerning the delimitation of its frontiers or boundaries. The mention of specific companies or products of manufacturers, whether or not these have been patented, does not imply that these have been endorsed or recommended by FAO in preference to others of a similar nature that are not mentioned. The views expressed in this information product are those of the author(s) and do not necessarily reflect the views of FAO.
Andreas KAMOEY, GLOBEFISH intern. THE JAPANESE MARKET FOR SEAFOOD. GLOBEFISH Research Programme, Vol. 117, Rome, FAO 2015. 45p.
Japan remains one of the world’s largest consumers of fish and seafood products, with considerable dependence on foreign fisheries resources, initially through the operation of its distant water fishing fleets, and later through imports. The main objective of this report is to cover major drivers and effects of current changes in the Japanese seafood market. Editing: Tarlochan Singh Layout: Gloria Loriente Cover photographs: Courtesy of Matthew Stark
All rights reserved. FAO encourages the reproduction and dissemination of material in this information product. Non-commercial uses will be authorized free of charge, upon request. Reproduction for resale or other commercial purposes, including educational purposes, may incur fees. Applications for permission to reproduce or disseminate FAO copyright materials, and all queries concerning rights and licences, should be addressed by e-mail to [email protected] or to the Chief, Publishing Policy and Support Branch, Office of Knowledge Exchange, Research and Extension, FAO, Viale delle Terme di Caracalla, 00153 Rome, Italy.
© FAO 2015
iii
TABLE OF CONTENT
EXECUTIVE SUMMARY 1
1. INTRODUCTION 2 1.1. GEOGRAPHIC SITUATION 2 1.2. POPULATION 2 3.3. ECONOMIC SITUATION
2. FISHING INDUSTRY 4 2.1. DOMESTIC PRODUCTION 4 2.2. EFFECT OF THE GREAT EAST JAPAN EARTHQUAKE 12
3. SEAFOOD TRADE 14 3.1. IMPORTS 14 3.2. EXPORTS 20 3.3. SELF-SUFFICIENCY RATE 23
4. CONSUMPTION 25 4.1. FOOD CONSUMPTION TRENDS 25
4.2. FISH AND SEAFOOD CONSUMPTION 26 4.3. MARKET SEGMENTATION 29
5. DISTRIBUTION 31 5.1. DISTRIBUTION CHANNELS 31 5.2. PRICING STRUCTURE 34 5.3. ALTERNATIVE CHANNELS 35 5.4. PROCESSING 35
6. SUPPLIER INFORMATION 37 6.1. IMPORTING 37 6.2. FISHERIES ADMINISTRATION 37 6.3. TRADE INFORMATION 38
7. CONCLUSION 39
8. BIBLIOGRAPHY 40 ANNEX 1 Importers of seafood products 43 ANNEX 2 Processors and wholesalers 44 ANNEX 3 Trading companies 45

iv
FIGURES 1. Production by type of fishery 5 2. Imports to Japan by volume and value 14 3. Import value: Alaska Pollock 16 4. Import value: salmon 16 5. Import value liver and roe 17 6. Import value: eel 17 7. Import value: tuna 18 8. Import value: trout 19 9. Import value: shrimp/prawn 19 10. Exports from Japan by volume and value 20 11. Export value: sea cucumbers 22 12. Export value: tuna 22 13. Export value: scallop 23 14. Self-sufficiency rate 23 15. Seafood distribution channel 32 16. Pricing structure 34
TABLES
1. Major marine aquaculture species 7 2. Imports by origin 14 3. Exports by destination 21 4. Kilogram per capita food supply 25 5. Annual fish purchase of major species (gram) 27
1
EXECUTIVE SUMMARY
Japan is one of the world’s key players in production, consumption and trade of fish and seafood products with a long history, and has developed unique traditions and values in terms of fisheries. After the restrictions of the Second World War were lifted, Japan’s rapidly expanding shipbuilding industry launched their fishing fleet into a worldwide expansion. However, as the 200 nautical mile exclusive economic zones around the world were adopted, Japan lost access to many of its fishing grounds. The objective of this report is to provide an overview of the Japanese fishery sector. The first chapter gives a brief overview of basic properties of the nation: geographic situation, population and economic situation. The second chapter describes developments in the domestic production sector over the last 30 years, as well as the status of the fishing fleet and workforce. Despite a significant fall in domestic production since the 1980s, Japan is still among the top ten of the world’s fishery producers. Chapter three is dedicated to international trade, describing import and export tendencies with an overview of the main products and trading partners. Japan’s fisheries industry is unable to meet the huge domestic demand, which consequently has made Japan one of the world’s largest importers of seafood. Despite the booming popularity of Japanese food around the world, the Japanese fisheries producers have become almost entirely dependent on meeting domestic demand and hence have not developed a significant export industry. The fourth chapter provides an overview of consumption trends, describing how the Japanese have developed a food culture around the high diversity of fresh fish and seafood which is unmatched by any other country. However, given the low birthrate and graying population, along with the changes in Japanese food preferences, domestic consumption is expected to continue to decline gradually over the next few years. In chapter five the traditional distribution system is explained, as well as alternative channels increasingly used by both foreign and domestic players. The last chapter of this report provides guidance to seafood suppliers on where to find the latest information and statistics on import regulations, tariffs, consumption data and management.
2
1. INTRODUCTION
1.1. GEOGRAPHIC SITUATION
Japan or Nihon in Japanese, is an island nation in the Pacific Ocean in East Asia. With a land area of 377 796 square kilometres Japan is roughly as large as Germany. It is composed of a total of 6 852 islands, of which from north to south, Hokkaido, Honshu, Shikoku and Kyushu are the four largest. The Japanese archipelago stretches for more than 3 200 kilometres, covering subarctic climate around Hokkaido to tropical climate in the south around Okinawa. It has four distinct seasons, with hot humid summers and cold, dry winters. The land is full of undulations, with mountain regions accounting for about three-quarters of its total land area; because of this scarcity of arable land Japan had to look to the surrounding seas to supplement its limited food source. The Sea of Japan, The Sea of Okhotsk, the Pacific Ocean, the East China Sea and Philippine Sea are some of the world’s richest fishing grounds that have supplied Japan with fish and established its ancient tradition of fisheries.
1.2. POPULATION
Since the 1980s the population of Japan has declined sharply. Total population at the beginning of 2014 was around 127 million people, a decline of above 240 000 people from the previous year according to the Japanese Statistics Bureau. Japan is experiencing a demographic shift. The Japanese people live longer than almost any of the world’s people, and Japan is facing a rapidly growing aging population with more than 20 percent of its population aged 65 or above, which is one of the highest proportions of elderly people in the world. Furthermore, the number of people living on their own is above 30 percent. Another issue is the high population density - Japan is one of the most densely populated countries in the world. As a result of that, around 70 percent of the land is unsuitable for residential use; the habitable areas mainly located along the coast, have extremely high population densities. Curbing the declining birth rates in order to achieve medium and long term economic growth has become one of the most important political agendas. The Japanese government has set a goal of stabilizing the population at around 100 million people; however, if the ongoing trend continues the population will be reduced to around one third of the current population.
1.3. ECONOMIC SITUATION
Japan is neither large geographically nor rich in natural resources. For this reason trade has played a significant role in making Japan the third largest economy in the world behind the United States of America and the People’s Republic of China. Due to the lack of natural resources, Japan relies heavily on imports. Much of the country’s modern success can be traced back to the ingenuity of its technologically advanced industries.
3
However, the Japanese economy has suffered from deflation and slow economic growth for almost two decades, known as the “two lost decades” in Japan, since the bubble burst in 1991. Against this backdrop, while many economists have expressed anxieties regarding Japan’s economic development, the country continues to have one of the highest purchasing power parity per capita which has enabled it to become one of the largest markets for international fish trade. Prime Minister Shinzo Abe’s reforms, dubbed “Abenomics”, are a three-pronged approach to restore healthy economic growth through monetary, fiscal and structural policies. Both the monetary and fiscal policies have been carried out as planned; however, structural policies including changes in corporate and labour market regulations, improving international competitiveness as well as an emphasis on improving female labour participation has remained limited. Japan’s total Gross Domestic Product (GDP) in 2012 was USD4 737 trillion according to the Japanese Ministry of Agriculture, Forestry and Fisheries (MAFF). Despite the historical significance of Japanese manufacturing, the service sector is by far the largest component of the economy. The contribution of fisheries to Japan’s economy is fairly small when compared to the manufacturing and service sector. In 2012, fisheries made up less than 0.2 percent of the nation’s GDP. Although its contribution appears to be minute, fisheries are still a highly important component of Japan’s economy and society through its secondary effects. Japan’s labour market is tight to bursting with an unemployment rate of less than four percent. The government has, therefore, looked to women as Japan has one of the lowest female labour participation rates of developed countries. Japanese fisheries, however, have traditionally put women in management positions. In this regard, the fisheries industry could serve as a case study for other industries to learn from.
4
2. FISHING INDUSTRY
Japan is surrounded by rich fishing grounds as a result of the cold ocean current Oyashio from the north colliding with the warm ocean current Kuroshio of the Pacific Ocean. Due to Japan’s geographical features and proximity to desirable currents, fisheries traditionally play an important role in food security and are as old as Japanese culture itself. However, recently there has been a shift, where Japanese consumers are becoming less familiar with fish, particularly among the younger generation. Meanwhile over 90 percent of Japan’s domestic production is supplied for domestic consumption, which compared to other fishing nations is very high, indicating a strong dependence on a declining domestic demand. Japan’s fishery output has been on the decline for the last three decades, due to an aging fishing fleet and workforce that has, according to the MAFF, brought concerns that fishery resources in Japanese waters are not fully utilized.
2.1. DOMESTIC PRODUCTION
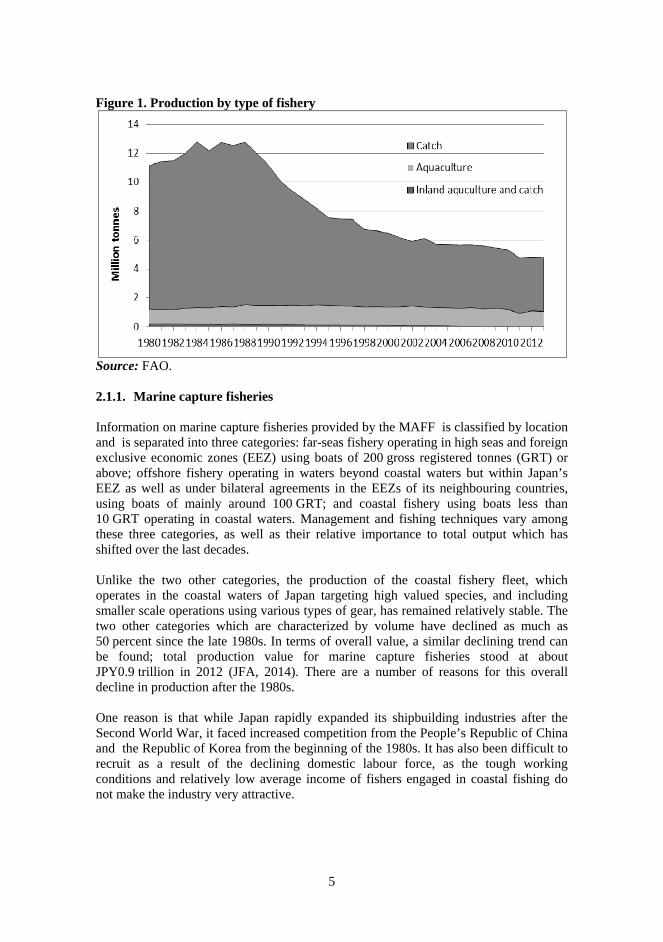
According to FAO’s FishStatJ (2014a), Japan was the world’s largest producer when it reached its peak production in 1984, producing 12.8 million tonnes (including marine, inland fisheries and aquaculture); since then the production has been declining and Japan was the world’s sixth largest producer of seafood with a total output of 4.8 million tonnes in 2012. In a similar manner, total value of fishery production, which reached its peak at almost JPY3 trillion in 1982, has also been on a decreasing trend; recent statistics from the Japanese Fisheries Agency (JFA) (2014) show that the production value was JPY1.42 trillion in 2012. Despite that Japan provides one of the world’s most reliable and detailed economic and social statistics. Japan has had some serious problems with illegal, unreported and unregulated (IUU) fishing which FAO statistics so far has never attempted to account for (Smil and Kobayashi, 2012). This undermines some of the validity of the information provided and should be taken into consideration. Japanese fish production consists of marine and inland water fisheries and aquaculture production. Marine capture fisheries and aquaculture are by far the most significant contributors to domestic production accounting for more than 98 percent of the total average (Figure 1).
5
Figure 1. Production by type of fishery
Source: FAO. 2.1.1. Marine capture fisheries Information on marine capture fisheries provided by the MAFF is classified by location and is separated into three categories: far-seas fishery operating in high seas and foreign exclusive economic zones (EEZ) using boats of 200 gross registered tonnes (GRT) or above; offshore fishery operating in waters beyond coastal waters but within Japan’s EEZ as well as under bilateral agreements in the EEZs of its neighbouring countries, using boats of mainly around 100 GRT; and coastal fishery using boats less than 10 GRT operating in coastal waters. Management and fishing techniques vary among these three categories, as well as their relative importance to total output which has shifted over the last decades. Unlike the two other categories, the production of the coastal fishery fleet, which operates in the coastal waters of Japan targeting high valued species, and including smaller scale operations using various types of gear, has remained relatively stable. The two other categories which are characterized by volume have declined as much as 50 percent since the late 1980s. In terms of overall value, a similar declining trend can be found; total production value for marine capture fisheries stood at about JPY0.9 trillion in 2012 (JFA, 2014). There are a number of reasons for this overall decline in production after the 1980s. One reason is that while Japan rapidly expanded its shipbuilding industries after the Second World War, it faced increased competition from the People’s Republic of China and the Republic of Korea from the beginning of the 1980s. It has also been difficult to recruit as a result of the declining domestic labour force, as the tough working conditions and relatively low average income of fishers engaged in coastal fishing do not make the industry very attractive.

6
Before the international acceptance of EEZs in the 1970s, Japanese far-seas fishery fleets were present in distant and rich fishing grounds around the world, supplying Japanese consumers with a large variety of species, thus creating a domestic demand for species from around the world, which naturally cannot be met by only fishing in Japan’s EEZ. After the adoption of the EEZs, Japanese vessels lost access to many of their historical fishing grounds. The capture of Japanese sardine by the offshore fishery fleet has been the most dramatic decline of all species in Japan. In 1988, at its peak production, the Japanese sardine yield was 4.5 million tonnes, roughly one-third of total production. In 2008 it had fallen to only 35 000 tonnes (MAFF, 2013a). This sudden drop of Japanese sardine yield is believed to be caused by an abrupt change in the Kuroshio Current’s temperature. Subsequently it led to a drastic overall production fall in offshore fisheries. Japan has also reduced its tariffs on fish and seafood imports as a result of WTO negotiations and now has a generally low average tariff level (USTR, 2012). Recently Japanese fishers and farmers have taken to the streets in Tokyo, making headlines by demonstrating against the Trans-Pacific Partnership (TPP) free trade negotiations, which aim to create a free trade area across the Pacific. Japan joined the TPP discussion in 2013, estimating that it will increase its total GDP output by JPY3.2 trillion (0.66 percent) through further reduction of tariffs and subsidies. On the other hand, it is likely to have a negative impact on domestic agriculture, forestry and fishery output by JPY3 trillion (MAFF, 2013b). Although Japan’s fishery industry is small, it is one of the major topics of discussion concerning Japan’s participation in the TPP agreements. If the proposed ban on fishing subsidies is implemented it will have major impacts on the future of the heavily subsidized Japanese fishing industry. 2.1.1.1 . Fishing fleet In general, the Japanese fishing fleet is decreasing and aging. Due to the stagnation of fishery income and increased costs of fuel and feed, the fishery industry and fishing companies cannot afford to build or invest in new vessels. Furthermore, the Japanese government has implemented various policies in order to reduce its fleet since the 1980s in order to tackle overcapacity; the fleet was further reduced as a consequence of the tsunami in 2011. However, from 2011 to 2012 actions were taken to incorporate new and more powerful vessels resulting in a net increase, with a total number of 254 052 registered fishing vessels in Japan by 2012. Small scale vessels of less than 5GRT made up 90 percent of the fleet, with pole-and-line, shellfish and seaweed collecting vessels making up the majority of the fleet (MAFF, 2013a). 2.1.1.2. Fishery resources and management Japan’s 200 nautical miles EEZ is the world’s sixth largest and covers approximately 10 times the land area (JFA, 2013). The rich fishing waters in the Northwest Pacific surrounding Japan, have the highest production yield of any of the FAO statistical areas and yielded 26 percent of the world’s total marine capture in 2011 (FAO, 2014a). Nevertheless, according to a recent stock assessment report, more than 40 percent of the major 84 stocks are at low levels (JFA, 2013). Japan is involved in disputes with several
7
of its Asian neighbouring countries including the Republic of Korea, the Russian Federation and the People’s Republic of China over territorial islands affecting the size of their EEZs and possibilities to operate in these waters. Around Japan, fisheries are diverse with approximately 3 300 different species in Japanese waters (JFA, 2012). This has led to a unique and complex management composition, with a long tradition of coastal community based fisheries management which entails that the right to fish is granted by the prefecture government to the local Fisheries Cooperative Associations (FCA) with authority for a particular geographical area. In Japan, nearly all commercial fishers belong to a FCA where the fishers’ knowledge of the local sea has been used as the main principle in decision making. A community based fisheries management system has many advantages; for example, decision making is decentralized and there is an adaptive management structure that uses both local and scientific knowledge. As highlighted earlier, the Japanese fishery sector consists of three different categories, i.e. far-seas fishery, offshore fishery and coastal fishery, which are managed differently: Far-seas and offshore fisheries have a commercial and industrialized orientation,
and are regulated under the MAFF, or the prefectural government issuing permits, as well as with the use a system that sets the annual total allowable catch volume (TAC) managed under an agreement concluded among fishers (JFA, 2013). The TAC volumes are set by the JFA and are currently implemented for seven commercially important species.
Coastal fisheries on the other hand are more community-oriented, and are managed by the prefectural government which grants common fishery rights to fishery cooperatives. These rights are exclusive and you have to be a member of the local cooperative to gain the right. In theory any resident in the designated cooperative can become a member under certain conditions, but in practice fishing rights are transferred within families (Schmidt, 2003).
Many of the 6 298 fishing communities are located in geographically disadvantaged areas e.g. islands, peninsulas and under-populated areas. In addition to ensuring a sustainable and economical stable management, these communities have developed unique cultures which still remain, and provide a place for cultural and rural exchange (JFA, 2013). Furthermore, these communities are important after natural disasters as supporters in rescue operations. To keep maintaining and developing these communities for the future poses a vital challenge for Japan. The crucial question now for Japan is how to slow down declining production and promote the recovery of the fishing industry. While the present system only allows outside investors to enter by forming partnerships with fishers or claiming leftover fishing rights, a new proposal (with special zones) has been launched in order to make it easier for outsiders, investors and private companies to break into the traditional system, dominated by the FCAs. The new proposal is currently only imposed in a special zone in Miyagi prefecture, but the goal is that it will attract capital and new technology needed to restructure the fishing industry. However, this suggestion has sparked criticism from the FCAs which are partly financed through fees paid by their members. Since it is the FCAs and members which have the right to distribute fishing rights, they
8
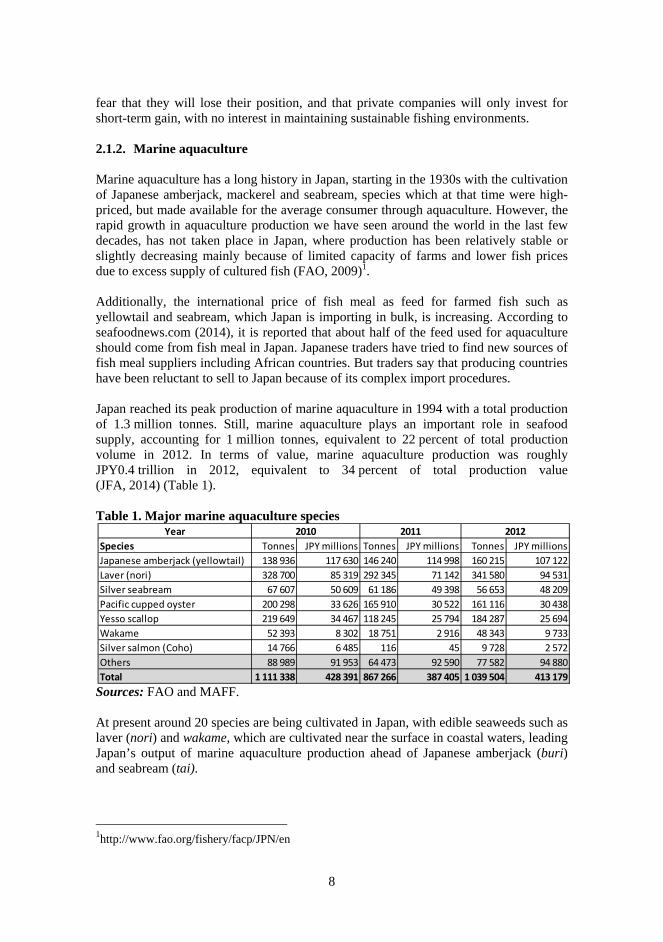
fear that they will lose their position, and that private companies will only invest for short-term gain, with no interest in maintaining sustainable fishing environments. 2.1.2. Marine aquaculture Marine aquaculture has a long history in Japan, starting in the 1930s with the cultivation of Japanese amberjack, mackerel and seabream, species which at that time were high-priced, but made available for the average consumer through aquaculture. However, the rapid growth in aquaculture production we have seen around the world in the last few decades, has not taken place in Japan, where production has been relatively stable or slightly decreasing mainly because of limited capacity of farms and lower fish prices due to excess supply of cultured fish (FAO, 2009)1. Additionally, the international price of fish meal as feed for farmed fish such as yellowtail and seabream, which Japan is importing in bulk, is increasing. According to seafoodnews.com (2014), it is reported that about half of the feed used for aquaculture should come from fish meal in Japan. Japanese traders have tried to find new sources of fish meal suppliers including African countries. But traders say that producing countries have been reluctant to sell to Japan because of its complex import procedures. Japan reached its peak production of marine aquaculture in 1994 with a total production of 1.3 million tonnes. Still, marine aquaculture plays an important role in seafood supply, accounting for 1 million tonnes, equivalent to 22 percent of total production volume in 2012. In terms of value, marine aquaculture production was roughly JPY0.4 trillion in 2012, equivalent to 34 percent of total production value (JFA, 2014) (Table 1). Table 1. Major marine aquaculture species
Sources: FAO and MAFF. At present around 20 species are being cultivated in Japan, with edible seaweeds such as laver (nori) and wakame, which are cultivated near the surface in coastal waters, leading Japan’s output of marine aquaculture production ahead of Japanese amberjack (buri) and seabream (tai).
1http://www.fao.org/fishery/facp/JPN/en
Year
Species Tonnes JPY millions Tonnes JPY millions Tonnes JPY millions
Japanese amberjack (yellowtail) 138 936 117 630 146 240 114 998 160 215 107 122
Laver (nori) 328 700 85 319 292 345 71 142 341 580 94 531
Silver seabream 67 607 50 609 61 186 49 398 56 653 48 209
Pacific cupped oyster 200 298 33 626 165 910 30 522 161 116 30 438
Yesso scallop 219 649 34 467 118 245 25 794 184 287 25 694
Wakame 52 393 8 302 18 751 2 916 48 343 9 733
Silver salmon (Coho) 14 766 6 485 116 45 9 728 2 572
Others 88 989 91 953 64 473 92 590 77 582 94 880
Total 1 111 338 428 391 867 266 387 405 1 039 504 413 179
2010 2011 2012
9
Because of Japan’s long tradition of aquaculture, several countries have benefited from its aquaculture technology. In order to play a further role in the rapidly growing global aquaculture industry, the Japanese are now putting their trust in Kinki University researchers to pursue their work towards commercialization of bluefin tuna raised in closed recirculation farms. Today, a large quantity of tuna is farm-raised; however, these are wild-caught juvenile fish, raised in the fish farms before being sold. In 2002 Kinki University announced that, after more than 30 years of research, captive bluefin tuna had been spawned. However, the commercialization process is still not completed, but if they succeed it could help to provide a stable supply of bluefin tuna to keep up with the huge demand of the widely overfished species. 2.1.3. Inland water Inland water fisheries and aquaculture production have a rather insignificant role in the Japanese fishing industry, with a total production of 67 000 tonnes, or 1.3 percent of total production in 2012. While the total value of the production in 2012 came to JPY89 billion, equivalent to 6 percent of the total production value (JFA, 2014). Although the size of inland water production is relatively small it supplies some high value species such as freshwater Japanese eel, known as unagi in Japan. Japan is the largest market in the world for eel, and unagi is considered as a relatively expensive delicacy. In recent years the price has risen, because of a decrease of eel stocks, which are now so low that it is considered as an endangered species by the International Union for Conservation of Nature (IUCN). 2.1.4. Employment in fisheries Over the last decade the number of people engaged in fisheries has declined by almost 30 percent and in 2012 amounted to 173 660 (MAFF, 2013a). As elsewhere in other capital-intensive economies, e.g. Norway, Iceland and North America, employment in fisheries has been decreasing (FAO, 2014a,b) . However, of particular importance to the future of Japan’s fishing industry is the skewed age distribution: 43 percent of employees are over 60 years, and only 15 percent are under 40 years (MAFF, 2013a). In order to address the problem of the shrinking and aging workforce, the Japanese government supports programmes to encourage students to join the industry and organizes fishery events with well recognized companies (JFA, 2013). In addition, the industry is also increasingly relying on foreign workers, mostly hired as trainees to man Japan’s fishing fleet (Fusako, 2013). How to attract new recruits to the fishery industry has become a major task given the changing demographics and the constraints of the government’s fiscal position to rebuild infrastructure after the Fukushima accident. A possible solution for improving the status quo of the workforce might be to examine how to trigger higher employment rates of females. Overall, female employees were estimated to constitute 14 percent of the total fisheries workforce in 2012 (MAFF, 2013a). In general, the traditional role of women in Japan has been limited to the home. While female labour participation has been increasing in recent years it has not advanced as much as in many western countries with regard to the
10
total workforce. However, in some areas of the fisheries industry the majority of the workforce consists of women (e.g. in processing facilities). Compared to other industries in Japan, female labour participation in the fishing industry is unique because women have for many years been given authority and actively taken part in decision-making processes. By working with onland operations, women have been able for generations to generate income and have hence tremendously contributed to the livelihoods of their families and their coastal communities. Another aspect of people engaged in fisheries in Japan is the large number of recreational fishers. According to a survey, there were 39 million people in 2008 participating in recreational fishing with a total catch of 29 000 tonnes (MAFF, 2013a). This large number of recreational fishers, who are not subject to much regulation, has naturally caused conflicts with professional fishers. 2.1.5. Important species 2.1.5.1. Mackerel Mackerel is one of the leading commercial fish in Japan. Known as assaba, there are two different types of mackerel produced in Japan: blue mackerel and chub mackerel. Chub mackerel has for the last decade had the largest production of any species in terms of volume caught by the Japanese fishing fleet, with a total catch of 443 000 tonnes in 2012, up 13 percent from the previous year, when domestic production was hit in the Tohoku region because of the tsunami. Although, chub mackerel has the highest production volume of all species in Japan, it still only accounts for 11 percent of total catch. Known in Japan as masaba, chub mackerel is caught all year with the highest quantity of landings in summer and autumn. It is mainly used for human consumption and is prepared in numerous ways but mostly salted or eaten fresh, whereas other smaller and less expensive types are often used for other than human consumption purposes. 2.1.5.2. Seaweed Various species of seaweeds have traditionally been produced in Japan since ancient times and are an essential part of the Japanese diet. Laver, now perhaps mostly known as nori after the popularity of sushi spread across the world, is used as wrapping in sushi. In terms of volume, nori is one of the most produced species of all aquatic products in Japan with a total production of 341 580 tonnes in 2012. Production of nori is considered to be one of the most profitable of Japan’s fisheries activities. It takes place on nets suspended in shallow waters near the coast and the seaweed is mechanically harvested and processed. Similar to other types of aquaculture, cultivation of nori has experienced difficulties with outbreaks of diseases and needs to be carefully regulated. Together with other species of seaweed, nori hardly contains any calories, therefore its contribution to overall energy and protein supply is insignificant; however, seaweeds are
11
regarded as an affordable, healthy food rich in minerals and vitamins. Umami, one of the five basic tastes, together with sweet, salty, sour and bitter, is the “secret” flavour of Japanese cuisine often found in dashi a fish broth used to make miso soup. The savoury taste of umami is believed to have been discovered by a Japanese scientist from kelp (kombu), one of the large variety of species of seaweeds consumed in Japan. 2.1.5.3. Scallops The scallop caught in Japan is known as Yesso scallop or Japanese scallop and hotategai in Japanese. They are both wild caught and farm raised. In 2012 Japan landed 315 000 tonnes from the wild while an additional 184 000 tonnes were farmed. Production of scallops using hanging culture methods was developed in Japan. Similar techniques based on the Japanese experiences are now utilized all over the world for a wide range of scallop species. The method is similar to farming of seaweed using floating rafts or lines on the surface, from which the scallops are suspended (FAO, 2014b, c). In 2013 the Japanese scallop fishery in Hokkaido’s FCA, which is one of the world’s largest scallop harvesters, was granted a certification by the Marine Stewardship Council (MSC) for global standard for sustainable and well-managed fisheries and is therefore eligible to use the blue MSC eco-label. Eco-label recognition has slowly been gaining ground among Japanese consumers and the Japanese Fisheries Agency expects eco-labels to become increasingly important. 2.1.5.4. Tuna There is perhaps no more iconic fish category in Japan’s seafood market than the various kinds of tuna. Domestic supply of tuna in Japan, which is in the range of 450 000 tonnes a year, is composed of six different types. Although their volume only accounted for 10 percent of total catch, they are highly valued because of decreasing stocks that have been extensively overfished and a sharp rise in demand worldwide over the last three decades. Tunas are migratory fish species, found in warm waters around the world. Japanese fishing vessels equipped with ultra-low-temperature freezers sail out to, for example, the Western Central Pacific, Indian Ocean and Atlantic Ocean, using longlines in the pursuit of tuna for sashimi (JFA, 2013). Just a few decades ago tuna was worthless in most parts of the world, but this changed when tuna became popular among the world’s sushi diners. The value of tuna skyrocketed and the average price for bluefin tuna paid to Atlantic fishermen rose by 10 000 percent between the 1970s and 1990s (Issenberg, 2007). In Japan tuna has long been a part of the diet, but its fatty texture did not appeal to most consumers; however, preferences changed and the fatty tuna belly and the sides just below the midline are now the most expensive parts. Fat content is related to the size of the fish and the seasonality of the catch; those caught in cold water feeding grounds and just before spawning have the highest fat content

12
(FAO, 2010). These are primarily the bluefins, referred to in Japan as maguro, or honmaguro meaning real tuna, with two types: the Pacific Bluefin and the Atlantic Bluefin. The Southern Bluefin tuna is also considered a maguro, but to confuse matters more, it is referred to as minamimaguro. According to the Japanese Fisheries Association (JFA, 2012), Japan catches about 70 percent of the Pacific Bluefin tuna and consumes about 80 percent of the world supply. The most commonly caught tuna in terms of volume is skipjack with annual catches fluctuating around 300 000 tonnes for the last decade, followed by yellowfin, bigeye and albacore. Unlike several other types of tuna, skipjack tuna stocks do not appear to be overfished (FAO, 2014a, b). In Japan skipjack tuna is referred to as katsuo and is a popular part of Japanese cuisine used in a variety of ways. Although skipjack is a member of the tuna family, it is not considered a tuna in Japan, and is not included in official statistics from the MAFF as a tuna because its smell and texture is different from other tunas.
2.2. EFFECTS OF THE GREAT EAST JAPAN EARTHQUAKE
On 11th March 2011, the fifth strongest earthquake recorded in world history, occurred in the Pacific Ocean near the coast of northern Japan, often referred to in Japan as the Great East Japan Earthquake. The tsunami that followed struck Japan and more than 18 000 people were killed or went missing. It caused extensive damage to all aspects of the fishing industry along the Pacific coast, particularly in seven prefectures: Hokkaido, Aomori, Iwate, Miyagi, Fukushima, Ibaraki and Chiba. Fishing operations in these prefectures were left devastated. Estimates from the MAFF have placed the total damage to the fishery industry at JPY1.26 trillion, a figure comparable to Japan’s overall fishery landing value. The seven prefectures mentioned above are among Japan’s most productive regions in terms of fisheries production. According to the Japanese Fisheries Agency (JFA, 2013) the tsunami damaged more than 28 000 fishing vessels and 319 fishing ports, in addition to damaging processing facilities. Japan’s total catch following the destruction of fishing vessels and infrastructure, was forecast to be reduced by one-third; however, the actual decrease in comparison to 2010 was about 10 percent (FAO, 2014a, b). The tsunami also caused nuclear accidents with the meltdown of Fukushima Dai-Ichi reactor and the subsequent detection of radioactive water in the Pacific Ocean, extending the damage to Japan’s fishing industry to more than simply a reduction in production capability. It quickly spurred a fear of Japanese seafood not only domestically but also internationally. Immediately after the accident, around 50 countries tightened their import restrictions on Japanese seafood from the Fukushima area. While several countries announced they would lift their restrictions, the Republic of Korea, however, in 2013 further expanded this ban because of consumers’ fears of contamination. Japan has appealed this decision to the World Trade Organization (WTO), claiming that the expanded scope is based on consumer sentiment rather than on scientific evidence. Although Japan’s export of seafood has been stagnant, it is a number which the government is interested in increasing but it will take time to fully restore confidence in Japanese seafood products.

13
Following the disaster, the Japanese government provided additional funding and the Fisheries Agency has formulated a Master Plan for Fishery Reconstruction, which serves as a framework towards the reconstruction of the fishing sector (JFA, 2012). Commercial fishing in the coast around Fukushima prefecture is still not permitted. However, trial fishing operations are being conducted through collaboration between local fishers, fishery operators, research institutes and administrative agencies. In the aftermath of the tragic event, it is clear that the disaster sparked a turning point for the Japanese fishing industry - progress has slowly taken place and could lead to a larger revitalization of the industry.

14
3. SEAFOOD TRADE
The Japanese fishing industry manifests itself as strongly oriented towards domestic consumption; above 90 percent of Japan’s seafood production is used domestically. While domestic production has had a declining trend for the last three decades, imports have been increasing in order to meet domestic demand. Japanese fish exports are marginal compared to imports; in 2013 total value of imports was more than seven times greater than exports.
3.1. IMPORTS
Japan now imports roughly 40 percent of its total fish supply. Over the last 30 years Japan and the United States of America have been the leading markets in the world for fish imports and in 2012 Japan again became the world’s largest importer of fishery products ahead of the United States of America in terms of value (FAO, 2014a, b) . Figure 2. Imports to Japan by volume and value
Source: FAO. Japan’s import of fish and fishery products has been increasing since the end of the 1970s for a variety of reasons closely tied to the overall economic situation of the country. The implementation of EEZs, which reduced Japan’s access to global fishing grounds and reduced labour costs in developing countries, has shifted processing out of Japan. Furthermore, import tariffs have been reduced and the appreciation of the Japanese yen contributed to low prices on seafood imports. Total import value decreased by almost 15 percent to USD15.6 billion in 2013compared with the previous year. In the same year total volume decreased by almost 10 percent to a total of 2.48 million tonnes due to a worldwide growth in demand for key species such as shrimp and tuna, as well as a depreciating yen which had a weakening effect on imports in 2013 (Figure 2).
15
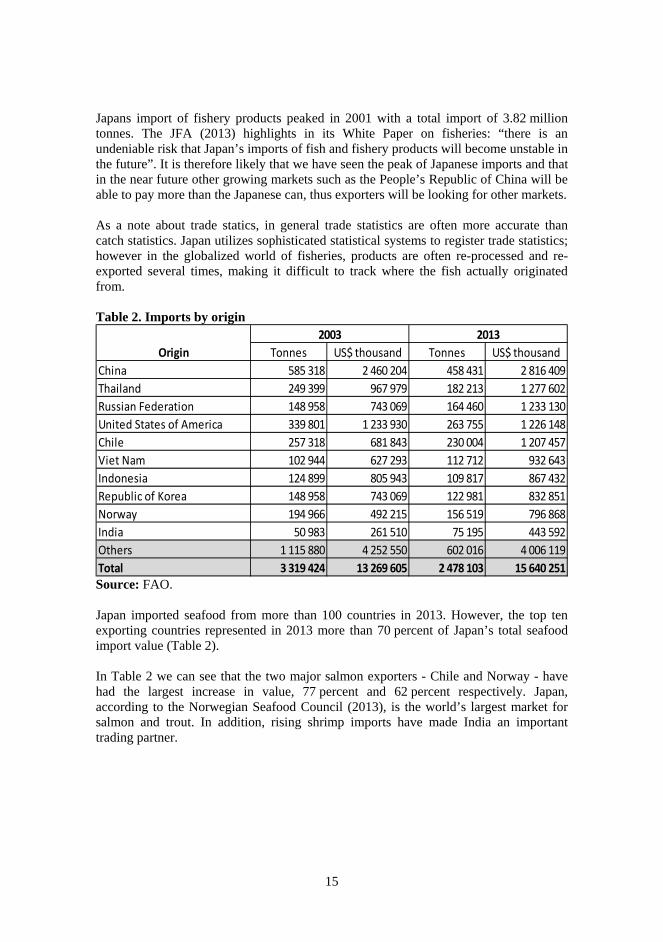
Japans import of fishery products peaked in 2001 with a total import of 3.82 million tonnes. The JFA (2013) highlights in its White Paper on fisheries: “there is an undeniable risk that Japan’s imports of fish and fishery products will become unstable in the future”. It is therefore likely that we have seen the peak of Japanese imports and that in the near future other growing markets such as the People’s Republic of China will be able to pay more than the Japanese can, thus exporters will be looking for other markets. As a note about trade statics, in general trade statistics are often more accurate than catch statistics. Japan utilizes sophisticated statistical systems to register trade statistics; however in the globalized world of fisheries, products are often re-processed and re-exported several times, making it difficult to track where the fish actually originated from. Table 2. Imports by origin
Source: FAO. Japan imported seafood from more than 100 countries in 2013. However, the top ten exporting countries represented in 2013 more than 70 percent of Japan’s total seafood import value (Table 2). In Table 2 we can see that the two major salmon exporters - Chile and Norway - have had the largest increase in value, 77 percent and 62 percent respectively. Japan, according to the Norwegian Seafood Council (2013), is the world’s largest market for salmon and trout. In addition, rising shrimp imports have made India an important trading partner.
Tonnes US$ thousand Tonnes US$ thousand
China 585 318 2 460 204 458 431 2 816 409
Thailand 249 399 967 979 182 213 1 277 602
Russian Federation 148 958 743 069 164 460 1 233 130
United States of America 339 801 1 233 930 263 755 1 226 148
Chile 257 318 681 843 230 004 1 207 457
Viet Nam 102 944 627 293 112 712 932 643
Indonesia 124 899 805 943 109 817 867 432
Republic of Korea 148 958 743 069 122 981 832 851
Norway 194 966 492 215 156 519 796 868
India 50 983 261 510 75 195 443 592
Others 1 115 880 4 252 550 602 016 4 006 119
Total 3 319 424 13 269 605 2 478 103 15 640 251
Origin
20132003
16
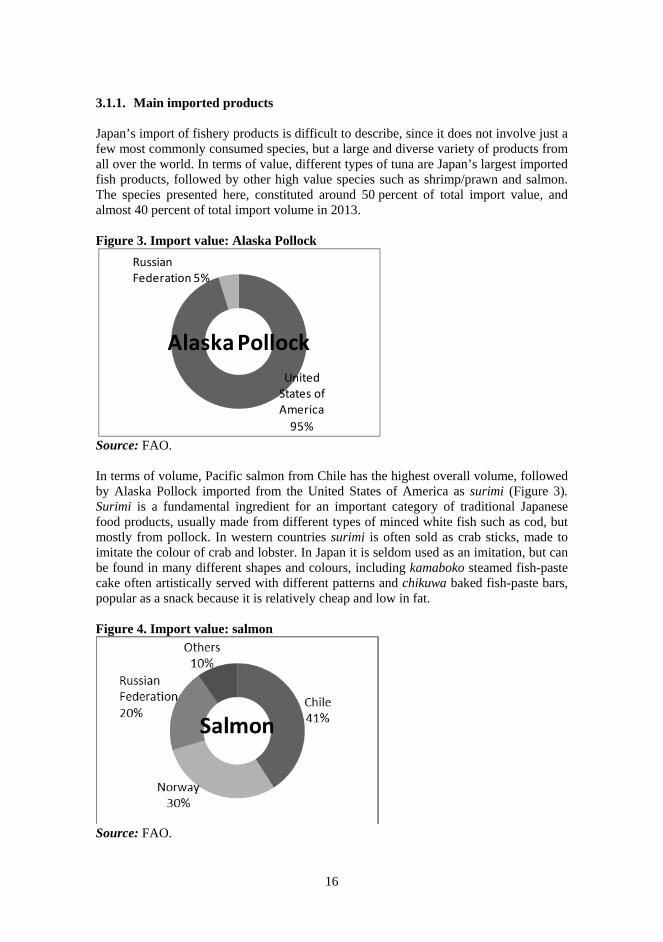
3.1.1. Main imported products Japan’s import of fishery products is difficult to describe, since it does not involve just a few most commonly consumed species, but a large and diverse variety of products from all over the world. In terms of value, different types of tuna are Japan’s largest imported fish products, followed by other high value species such as shrimp/prawn and salmon. The species presented here, constituted around 50 percent of total import value, and almost 40 percent of total import volume in 2013. Figure 3. Import value: Alaska Pollock
Source: FAO. In terms of volume, Pacific salmon from Chile has the highest overall volume, followed by Alaska Pollock imported from the United States of America as surimi (Figure 3). Surimi is a fundamental ingredient for an important category of traditional Japanese food products, usually made from different types of minced white fish such as cod, but mostly from pollock. In western countries surimi is often sold as crab sticks, made to imitate the colour of crab and lobster. In Japan it is seldom used as an imitation, but can be found in many different shapes and colours, including kamaboko steamed fish-paste cake often artistically served with different patterns and chikuwa baked fish-paste bars, popular as a snack because it is relatively cheap and low in fat. Figure 4. Import value: salmon
Source: FAO.
United States of America
95%
Alaska Pollock
Russian Federation 5%
17
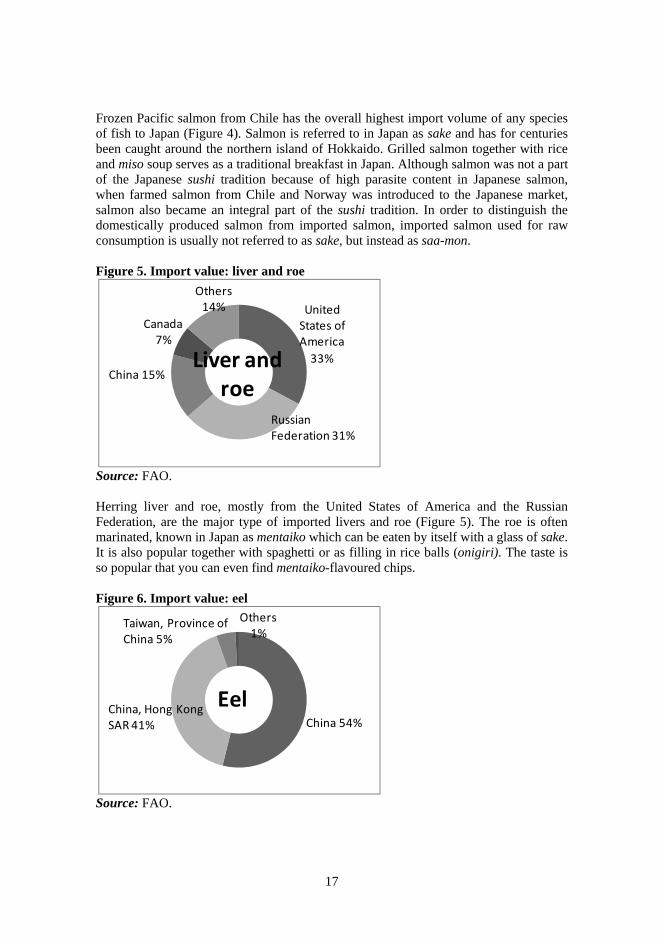
Frozen Pacific salmon from Chile has the overall highest import volume of any species of fish to Japan (Figure 4). Salmon is referred to in Japan as sake and has for centuries been caught around the northern island of Hokkaido. Grilled salmon together with rice and miso soup serves as a traditional breakfast in Japan. Although salmon was not a part of the Japanese sushi tradition because of high parasite content in Japanese salmon, when farmed salmon from Chile and Norway was introduced to the Japanese market, salmon also became an integral part of the sushi tradition. In order to distinguish the domestically produced salmon from imported salmon, imported salmon used for raw consumption is usually not referred to as sake, but instead as saa-mon. Figure 5. Import value: liver and roe
Source: FAO. Herring liver and roe, mostly from the United States of America and the Russian Federation, are the major type of imported livers and roe (Figure 5). The roe is often marinated, known in Japan as mentaiko which can be eaten by itself with a glass of sake. It is also popular together with spaghetti or as filling in rice balls (onigiri). The taste is so popular that you can even find mentaiko-flavoured chips. Figure 6. Import value: eel
Source: FAO.
United States of America
33%
Canada 7%
Others 14%
Liver and roe
China 15%
Russian Federation 31%
Others 1%
Eel
Taiwan, Province of China 5%
China 54%China, Hong Kong SAR 41%
18
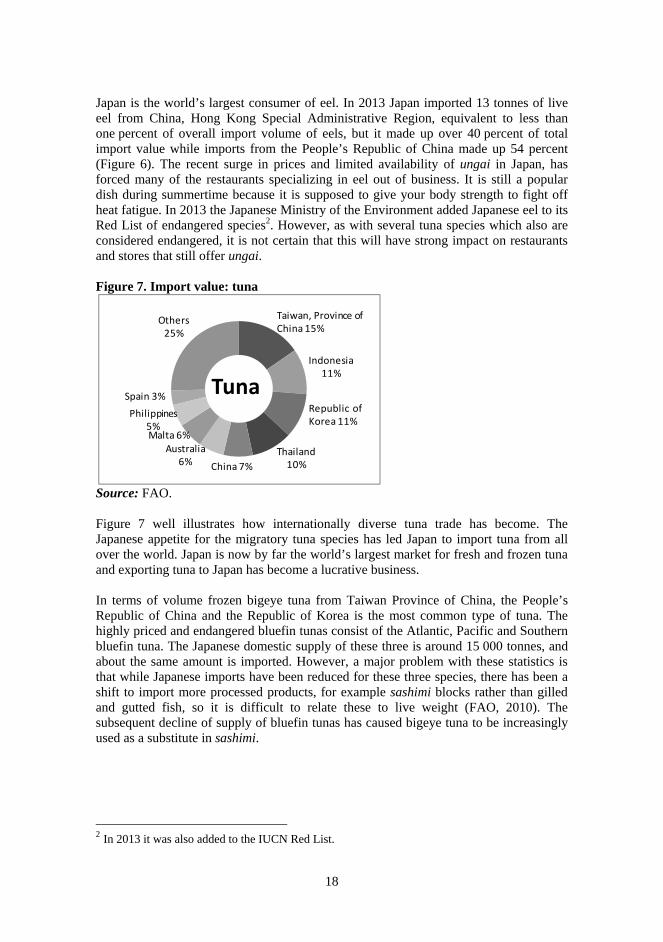
Japan is the world’s largest consumer of eel. In 2013 Japan imported 13 tonnes of live eel from China, Hong Kong Special Administrative Region, equivalent to less than one percent of overall import volume of eels, but it made up over 40 percent of total import value while imports from the People’s Republic of China made up 54 percent (Figure 6). The recent surge in prices and limited availability of ungai in Japan, has forced many of the restaurants specializing in eel out of business. It is still a popular dish during summertime because it is supposed to give your body strength to fight off heat fatigue. In 2013 the Japanese Ministry of the Environment added Japanese eel to its Red List of endangered species2. However, as with several tuna species which also are considered endangered, it is not certain that this will have strong impact on restaurants and stores that still offer ungai. Figure 7. Import value: tuna
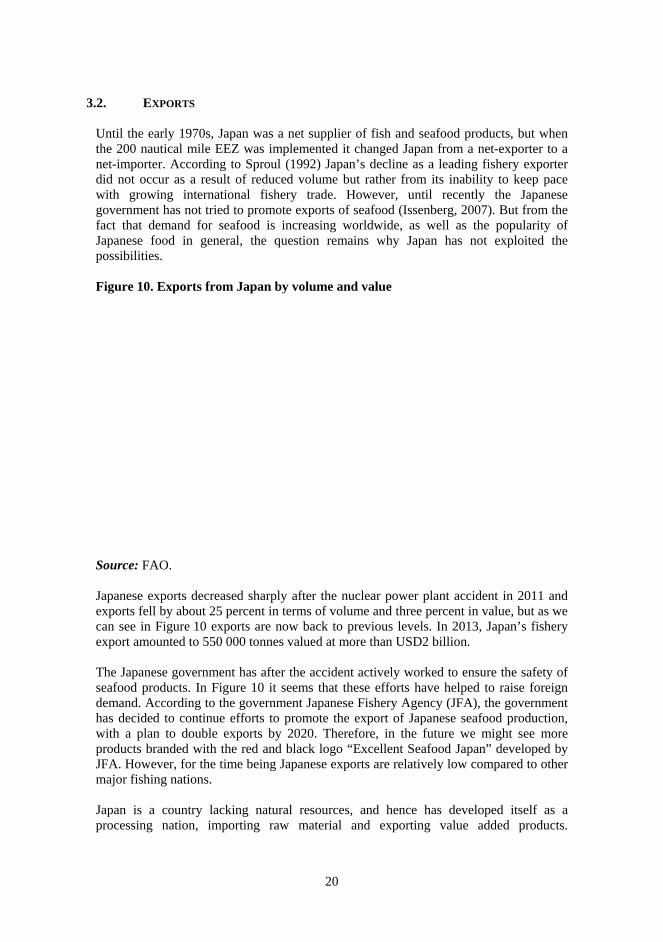
Source: FAO. Figure 7 well illustrates how internationally diverse tuna trade has become. The Japanese appetite for the migratory tuna species has led Japan to import tuna from all over the world. Japan is now by far the world’s largest market for fresh and frozen tuna and exporting tuna to Japan has become a lucrative business. In terms of volume frozen bigeye tuna from Taiwan Province of China, the People’s Republic of China and the Republic of Korea is the most common type of tuna. The highly priced and endangered bluefin tunas consist of the Atlantic, Pacific and Southern bluefin tuna. The Japanese domestic supply of these three is around 15 000 tonnes, and about the same amount is imported. However, a major problem with these statistics is that while Japanese imports have been reduced for these three species, there has been a shift to import more processed products, for example sashimi blocks rather than gilled and gutted fish, so it is difficult to relate these to live weight (FAO, 2010). The subsequent decline of supply of bluefin tunas has caused bigeye tuna to be increasingly used as a substitute in sashimi.
2 In 2013 it was also added to the IUCN Red List.
Indonesia 11%
Thailand 10%
Australia 6%
Malta 6%
Philippines 5%
Spain 3%
Others 25%
Tuna
Taiwan, Province of China 15%
Republic of Korea 11%
China 7%

19
Figure 8. Import value: trout
Source: FAO. As seen from Figure 8, Chile is the dominant supplier of trout. The trout originating from Norway is mostly fresh, while trout from Chile is mainly whole frozen fish or frozen filets. Trout is often sold in Japan under the commercial name “trout salmon”, and is known for its versatile usage, e.g. for pan-frying, raw consumption or salted and sliced as kirimi. Because of its versatility it has gained a strong position in the Japanese market. In addition, it serves to some degree as a substitute for salmon, in particular for moriawase, a combination platter of various kinds of sashimi. Figure 9. Import value: shrimp/prawn
Source: FAO. After tuna, imports of shrimp and prawn (Figure 9) represent the highest value of total imports, about 14 percent of total import value in 20133. Shrimps and prawns are popular ingredients for tempura, a preparation of different types of battered and deep fried vegetables and seafood, in particular shrimp (ebi). Since there are no other products that can replace shrimps and prawns, they are under the strong influence of factors such as the amount of production and price. 3 Not included processed shrimps and prawns.
Chile 90%
Norway 6%
Others 4%
Trout
Indonesia 19%
India 15%
Thailand 10%
Argentina 6%
Others 15%
Shrimp/PrawnChina 7%
Viet Nam 20%
20
3.2. EXPORTS
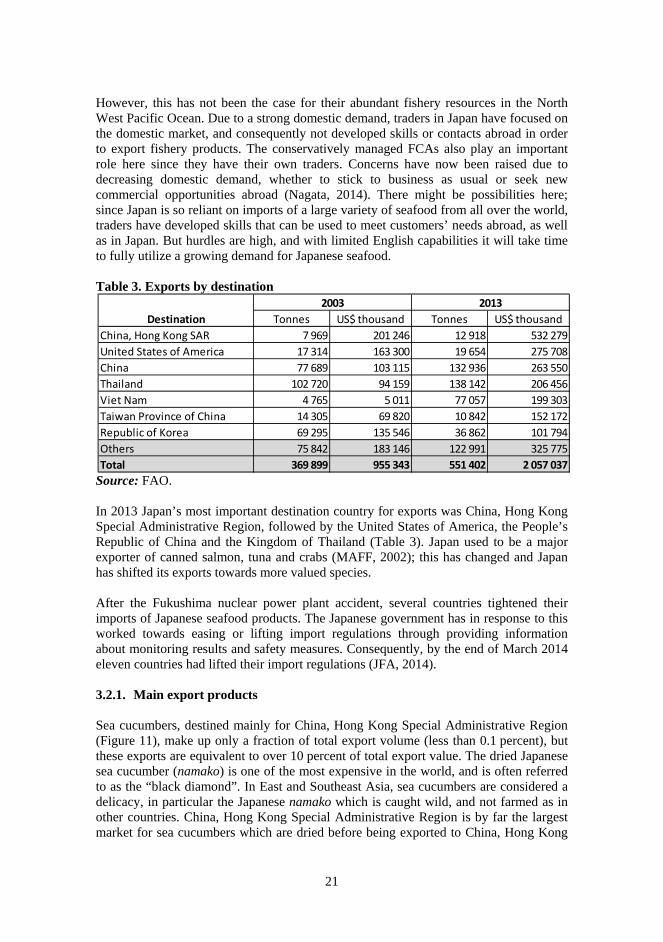
Until the early 1970s, Japan was a net supplier of fish and seafood products, but when the 200 nautical mile EEZ was implemented it changed Japan from a net-exporter to a net-importer. According to Sproul (1992) Japan’s decline as a leading fishery exporter did not occur as a result of reduced volume but rather from its inability to keep pace with growing international fishery trade. However, until recently the Japanese government has not tried to promote exports of seafood (Issenberg, 2007). But from the fact that demand for seafood is increasing worldwide, as well as the popularity of Japanese food in general, the question remains why Japan has not exploited the possibilities. Figure 10. Exports from Japan by volume and value
Source: FAO. Japanese exports decreased sharply after the nuclear power plant accident in 2011 and exports fell by about 25 percent in terms of volume and three percent in value, but as we can see in Figure 10 exports are now back to previous levels. In 2013, Japan’s fishery export amounted to 550 000 tonnes valued at more than USD2 billion. The Japanese government has after the accident actively worked to ensure the safety of seafood products. In Figure 10 it seems that these efforts have helped to raise foreign demand. According to the government Japanese Fishery Agency (JFA), the government has decided to continue efforts to promote the export of Japanese seafood production, with a plan to double exports by 2020. Therefore, in the future we might see more products branded with the red and black logo “Excellent Seafood Japan” developed by JFA. However, for the time being Japanese exports are relatively low compared to other major fishing nations. Japan is a country lacking natural resources, and hence has developed itself as a processing nation, importing raw material and exporting value added products.
21
However, this has not been the case for their abundant fishery resources in the North West Pacific Ocean. Due to a strong domestic demand, traders in Japan have focused on the domestic market, and consequently not developed skills or contacts abroad in order to export fishery products. The conservatively managed FCAs also play an important role here since they have their own traders. Concerns have now been raised due to decreasing domestic demand, whether to stick to business as usual or seek new commercial opportunities abroad (Nagata, 2014). There might be possibilities here; since Japan is so reliant on imports of a large variety of seafood from all over the world, traders have developed skills that can be used to meet customers’ needs abroad, as well as in Japan. But hurdles are high, and with limited English capabilities it will take time to fully utilize a growing demand for Japanese seafood. Table 3. Exports by destination
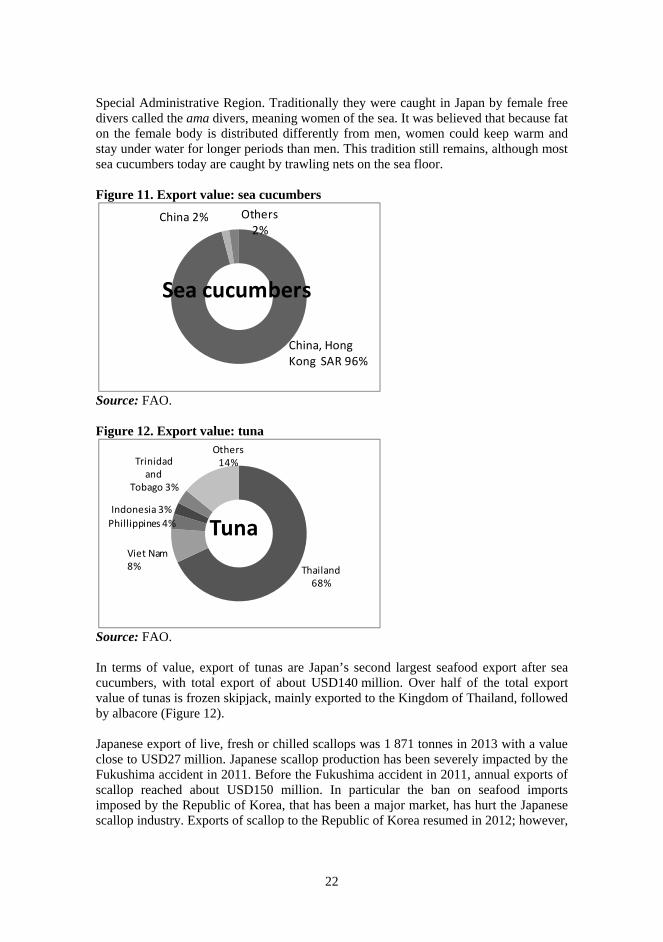
Source: FAO. In 2013 Japan’s most important destination country for exports was China, Hong Kong Special Administrative Region, followed by the United States of America, the People’s Republic of China and the Kingdom of Thailand (Table 3). Japan used to be a major exporter of canned salmon, tuna and crabs (MAFF, 2002); this has changed and Japan has shifted its exports towards more valued species. After the Fukushima nuclear power plant accident, several countries tightened their imports of Japanese seafood products. The Japanese government has in response to this worked towards easing or lifting import regulations through providing information about monitoring results and safety measures. Consequently, by the end of March 2014 eleven countries had lifted their import regulations (JFA, 2014). 3.2.1. Main export products Sea cucumbers, destined mainly for China, Hong Kong Special Administrative Region (Figure 11), make up only a fraction of total export volume (less than 0.1 percent), but these exports are equivalent to over 10 percent of total export value. The dried Japanese sea cucumber (namako) is one of the most expensive in the world, and is often referred to as the “black diamond”. In East and Southeast Asia, sea cucumbers are considered a delicacy, in particular the Japanese namako which is caught wild, and not farmed as in other countries. China, Hong Kong Special Administrative Region is by far the largest market for sea cucumbers which are dried before being exported to China, Hong Kong
Tonnes US$ thousand Tonnes US$ thousand
China, Hong Kong SAR 7 969 201 246 12 918 532 279
United States of America 17 314 163 300 19 654 275 708
China 77 689 103 115 132 936 263 550
Thailand 102 720 94 159 138 142 206 456
Viet Nam 4 765 5 011 77 057 199 303
Taiwan Province of China 14 305 69 820 10 842 152 172
Republic of Korea 69 295 135 546 36 862 101 794
Others 75 842 183 146 122 991 325 775
Total 369 899 955 343 551 402 2 057 037
Destination
20132003
22
Special Administrative Region. Traditionally they were caught in Japan by female free divers called the ama divers, meaning women of the sea. It was believed that because fat on the female body is distributed differently from men, women could keep warm and stay under water for longer periods than men. This tradition still remains, although most sea cucumbers today are caught by trawling nets on the sea floor. Figure 11. Export value: sea cucumbers
Source: FAO. Figure 12. Export value: tuna
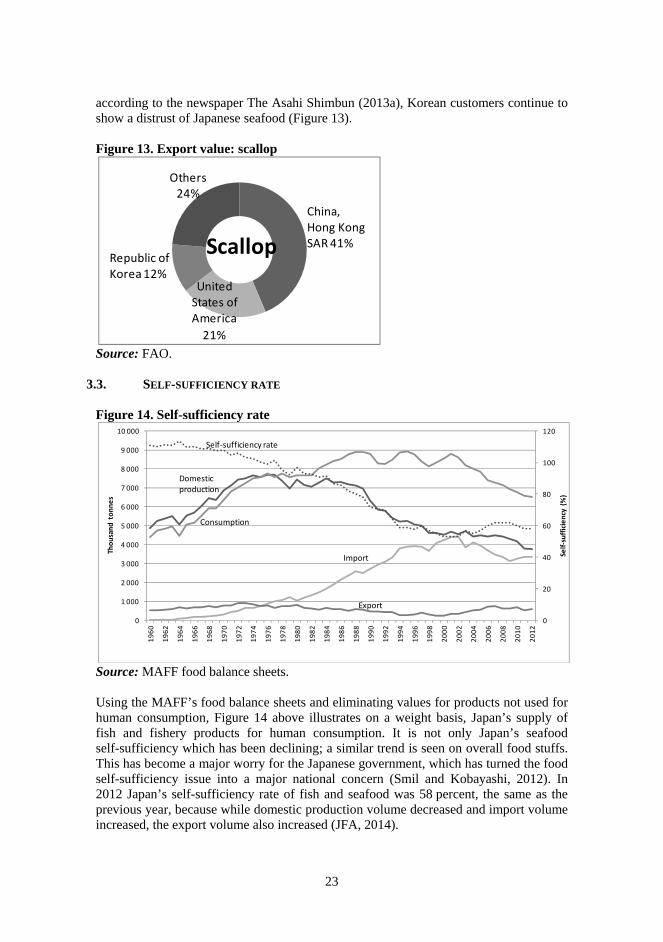
Source: FAO. In terms of value, export of tunas are Japan’s second largest seafood export after sea cucumbers, with total export of about USD140 million. Over half of the total export value of tunas is frozen skipjack, mainly exported to the Kingdom of Thailand, followed by albacore (Figure 12). Japanese export of live, fresh or chilled scallops was 1 871 tonnes in 2013 with a value close to USD27 million. Japanese scallop production has been severely impacted by the Fukushima accident in 2011. Before the Fukushima accident in 2011, annual exports of scallop reached about USD150 million. In particular the ban on seafood imports imposed by the Republic of Korea, that has been a major market, has hurt the Japanese scallop industry. Exports of scallop to the Republic of Korea resumed in 2012; however,
Others 2%
Sea cucumbers
China 2%
China, HongKong SAR 96%
Thailand 68%
Trinidad and
Tobago 3%
Others 14%
TunaViet Nam 8%
Phillippines 4%
Indonesia 3%
23
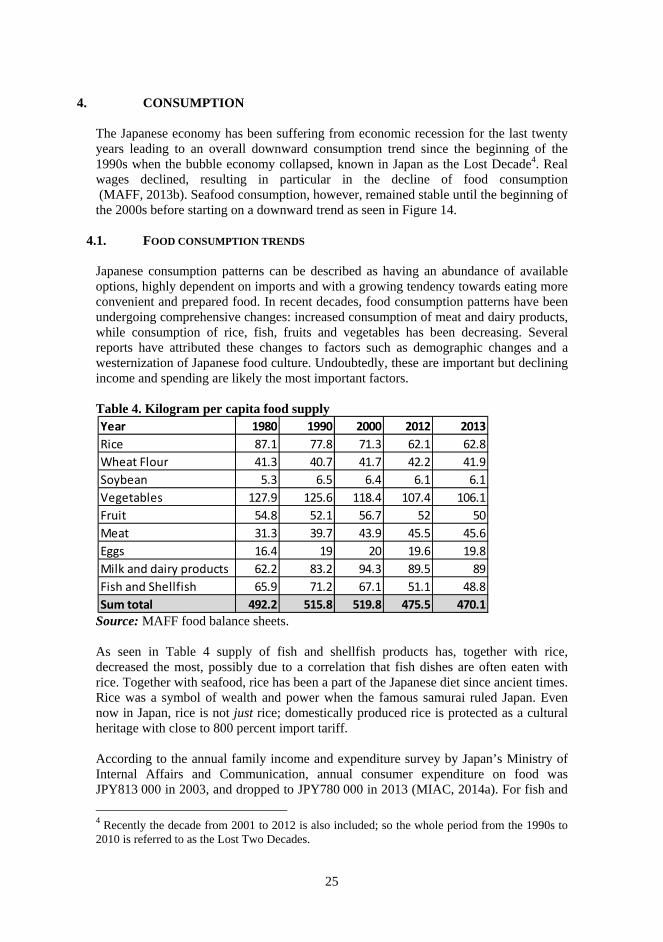
according to the newspaper The Asahi Shimbun (2013a), Korean customers continue to show a distrust of Japanese seafood (Figure 13). Figure 13. Export value: scallop
Source: FAO.
3.3. SELF-SUFFICIENCY RATE Figure 14. Self-sufficiency rate
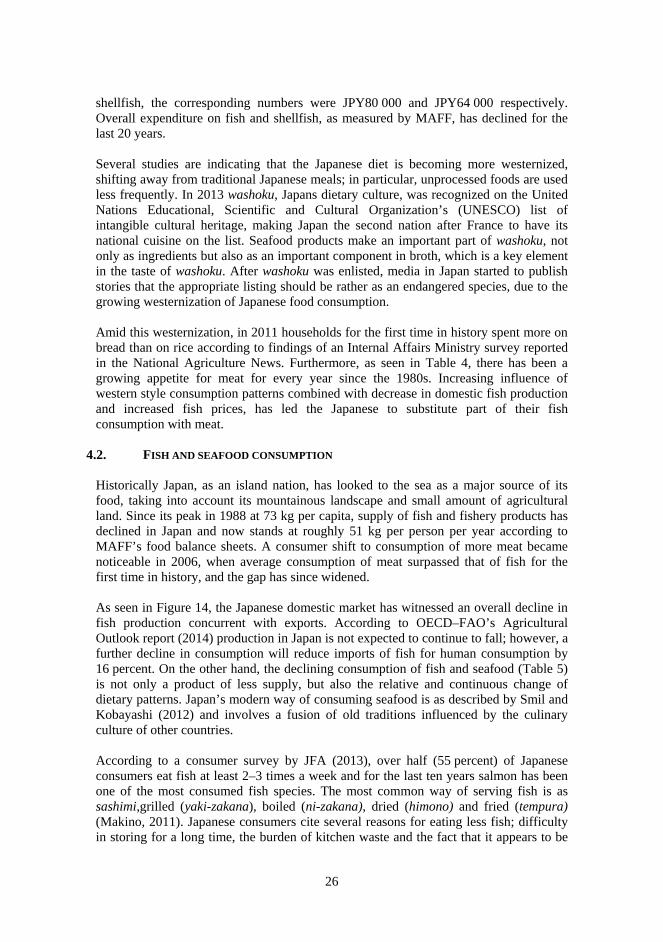
Source: MAFF food balance sheets. Using the MAFF’s food balance sheets and eliminating values for products not used for human consumption, Figure 14 above illustrates on a weight basis, Japan’s supply of fish and fishery products for human consumption. It is not only Japan’s seafood self-sufficiency which has been declining; a similar trend is seen on overall food stuffs. This has become a major worry for the Japanese government, which has turned the food self-sufficiency issue into a major national concern (Smil and Kobayashi, 2012). In 2012 Japan’s self-sufficiency rate of fish and seafood was 58 percent, the same as the previous year, because while domestic production volume decreased and import volume increased, the export volume also increased (JFA, 2014).
United States of America
21%
Others 24%
Scallop
China,Hong Kong SAR 41%
Republic of Korea 12%
0
20
40
60
80
100
120
0
1 000
2 000
3 000
4 000
5 000
6 000
7 000
8 000
9 000
10 000
1960
1962
1964
1966
1968
1970
1972
1974
1976
1978
1980
1982
1984
1986
1988
1990
1992
1994
1996
1998
2000
2002
2004
2006
2008
2010
2012
Self‐sufficiency (%)
Thousand tonnes
Self‐sufficiency rate
Consumption
Export
Import
Domestic production

24
While Japan was self-sufficient in seafood until the end of the 1970s, in a ten year span up to the beginning of the 1990s Japan had become one of the world’s largest importers of seafood. In recent years the self-sufficiency rate of fish and supply of fishery products has shown a slight increase or remained flat. However, there are few other countries which import as much of their seafood supply as Japan does. Since Japan is so reliant on imports, this in turn, has a number of unintended consequences for the Japanese industry and government. Fears that Japan’s struggling fishing industry will be driven further out of business if the developments seen in Figure 3.10 of a declining self-sufficiency rate and increasing imports continues are used by fishers to bolster their arguments against the ongoing TPP free trade discussions. Stories about the self-sufficiency rate are frequent in the Japanese media and the government faces political pressure to adjust its policies. The government has tried to pass enactments to slow down this tendency, but so far policies have been driven by other factors not directly related to improving productivity, instead of on rural development of the fishing communities and income support to fishers. Since the Japanese fishing industry, according to MAFF, is only responsible for a fraction of Japan’s total GDP, around 0.2 percent in 2012, fishers’ criticism of the TPP might not be enough to bar participation. Furthermore in recent years, according to Hahirian (2011), a growing ethnocentrism towards food products has been observed, where domestically produced products are generating increased interest among Japanese consumers. The Japanese government has shifted the focus from improving productivity to the customers to resorting to food education projects (shokuiku), such as promoting “Delights of a Fish-Rich Country” (sakana no kuni no shiawase) aimed at increasing the consumption of locally produced seafood. This comprehensive approach towards promoting domestically produced seafood and other domestically produced food stuff, as well as the frequent media coverage of the declining self-sufficiency rate is likely to be the underlying reasons for the growing ethnocentrism.
As the self-sufficiency rate became an issue, MAFF was put into a conflict of interest; on the one hand you have a major problem of stock depletion; the high and varied seafood consumption of the Japanese cannot be used as a global model. On the other hand MAFF is telling people to eat more seafood and promotes consumption of Japanese fishery products. Promoting consumption of locally produced products can work well, but as long as the declining self-sufficiency rate trend continues it is being further enhanced by foreign exporters who see this as major business opportunity.
25
4. CONSUMPTION
The Japanese economy has been suffering from economic recession for the last twenty years leading to an overall downward consumption trend since the beginning of the 1990s when the bubble economy collapsed, known in Japan as the Lost Decade4. Real wages declined, resulting in particular in the decline of food consumption (MAFF, 2013b). Seafood consumption, however, remained stable until the beginning of the 2000s before starting on a downward trend as seen in Figure 14.
4.1. FOOD CONSUMPTION TRENDS
Japanese consumption patterns can be described as having an abundance of available options, highly dependent on imports and with a growing tendency towards eating more convenient and prepared food. In recent decades, food consumption patterns have been undergoing comprehensive changes: increased consumption of meat and dairy products, while consumption of rice, fish, fruits and vegetables has been decreasing. Several reports have attributed these changes to factors such as demographic changes and a westernization of Japanese food culture. Undoubtedly, these are important but declining income and spending are likely the most important factors. Table 4. Kilogram per capita food supply
Source: MAFF food balance sheets. As seen in Table 4 supply of fish and shellfish products has, together with rice, decreased the most, possibly due to a correlation that fish dishes are often eaten with rice. Together with seafood, rice has been a part of the Japanese diet since ancient times. Rice was a symbol of wealth and power when the famous samurai ruled Japan. Even now in Japan, rice is not just rice; domestically produced rice is protected as a cultural heritage with close to 800 percent import tariff. According to the annual family income and expenditure survey by Japan’s Ministry of Internal Affairs and Communication, annual consumer expenditure on food was JPY813 000 in 2003, and dropped to JPY780 000 in 2013 (MIAC, 2014a). For fish and
4 Recently the decade from 2001 to 2012 is also included; so the whole period from the 1990s to 2010 is referred to as the Lost Two Decades.
Year 1980 1990 2000 2012 2013
Rice 87.1 77.8 71.3 62.1 62.8
Wheat Flour 41.3 40.7 41.7 42.2 41.9
Soybean 5.3 6.5 6.4 6.1 6.1
Vegetables 127.9 125.6 118.4 107.4 106.1
Fruit 54.8 52.1 56.7 52 50
Meat 31.3 39.7 43.9 45.5 45.6
Eggs 16.4 19 20 19.6 19.8
Milk and dairy products 62.2 83.2 94.3 89.5 89
Fish and Shellfish 65.9 71.2 67.1 51.1 48.8
Sum total 492.2 515.8 519.8 475.5 470.1
26
shellfish, the corresponding numbers were JPY80 000 and JPY64 000 respectively. Overall expenditure on fish and shellfish, as measured by MAFF, has declined for the last 20 years. Several studies are indicating that the Japanese diet is becoming more westernized, shifting away from traditional Japanese meals; in particular, unprocessed foods are used less frequently. In 2013 washoku, Japans dietary culture, was recognized on the United Nations Educational, Scientific and Cultural Organization’s (UNESCO) list of intangible cultural heritage, making Japan the second nation after France to have its national cuisine on the list. Seafood products make an important part of washoku, not only as ingredients but also as an important component in broth, which is a key element in the taste of washoku. After washoku was enlisted, media in Japan started to publish stories that the appropriate listing should be rather as an endangered species, due to the growing westernization of Japanese food consumption. Amid this westernization, in 2011 households for the first time in history spent more on bread than on rice according to findings of an Internal Affairs Ministry survey reported in the National Agriculture News. Furthermore, as seen in Table 4, there has been a growing appetite for meat for every year since the 1980s. Increasing influence of western style consumption patterns combined with decrease in domestic fish production and increased fish prices, has led the Japanese to substitute part of their fish consumption with meat.
4.2. FISH AND SEAFOOD CONSUMPTION
Historically Japan, as an island nation, has looked to the sea as a major source of its food, taking into account its mountainous landscape and small amount of agricultural land. Since its peak in 1988 at 73 kg per capita, supply of fish and fishery products has declined in Japan and now stands at roughly 51 kg per person per year according to MAFF’s food balance sheets. A consumer shift to consumption of more meat became noticeable in 2006, when average consumption of meat surpassed that of fish for the first time in history, and the gap has since widened. As seen in Figure 14, the Japanese domestic market has witnessed an overall decline in fish production concurrent with exports. According to OECD–FAO’s Agricultural Outlook report (2014) production in Japan is not expected to continue to fall; however, a further decline in consumption will reduce imports of fish for human consumption by 16 percent. On the other hand, the declining consumption of fish and seafood (Table 5) is not only a product of less supply, but also the relative and continuous change of dietary patterns. Japan’s modern way of consuming seafood is as described by Smil and Kobayashi (2012) and involves a fusion of old traditions influenced by the culinary culture of other countries. According to a consumer survey by JFA (2013), over half (55 percent) of Japanese consumers eat fish at least 2–3 times a week and for the last ten years salmon has been one of the most consumed fish species. The most common way of serving fish is as sashimi,grilled (yaki-zakana), boiled (ni-zakana), dried (himono) and fried (tempura) (Makino, 2011). Japanese consumers cite several reasons for eating less fish; difficulty in storing for a long time, the burden of kitchen waste and the fact that it appears to be
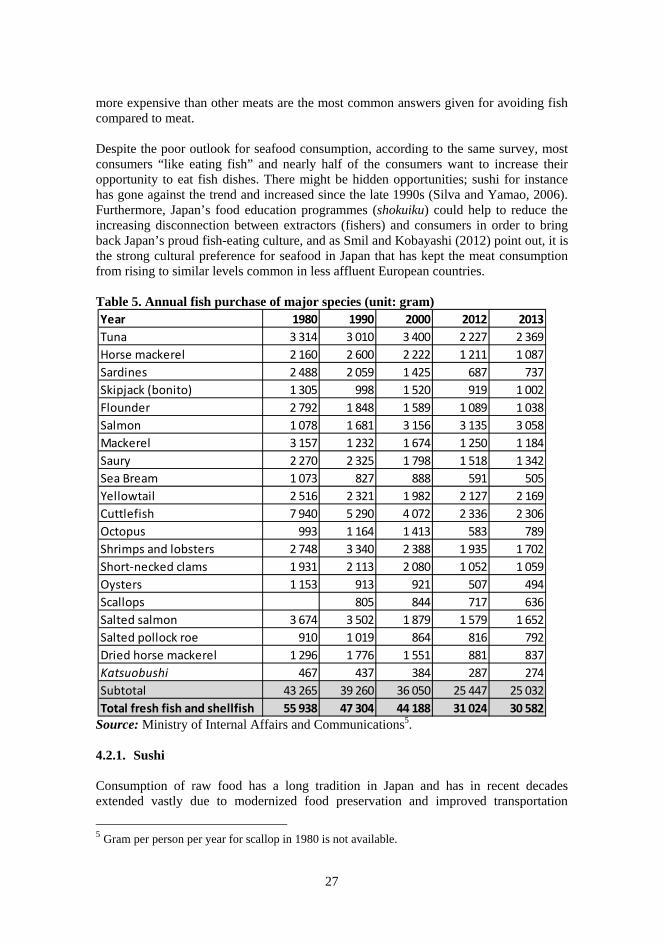
27
more expensive than other meats are the most common answers given for avoiding fish compared to meat. Despite the poor outlook for seafood consumption, according to the same survey, most consumers “like eating fish” and nearly half of the consumers want to increase their opportunity to eat fish dishes. There might be hidden opportunities; sushi for instance has gone against the trend and increased since the late 1990s (Silva and Yamao, 2006). Furthermore, Japan’s food education programmes (shokuiku) could help to reduce the increasing disconnection between extractors (fishers) and consumers in order to bring back Japan’s proud fish-eating culture, and as Smil and Kobayashi (2012) point out, it is the strong cultural preference for seafood in Japan that has kept the meat consumption from rising to similar levels common in less affluent European countries. Table 5. Annual fish purchase of major species (unit: gram)
Source: Ministry of Internal Affairs and Communications5. 4.2.1. Sushi Consumption of raw food has a long tradition in Japan and has in recent decades extended vastly due to modernized food preservation and improved transportation
5 Gram per person per year for scallop in 1980 is not available.
Year 1980 1990 2000 2012 2013
Tuna 3 314 3 010 3 400 2 227 2 369
Horse mackerel 2 160 2 600 2 222 1 211 1 087
Sardines 2 488 2 059 1 425 687 737
Skipjack (bonito) 1 305 998 1 520 919 1 002
Flounder 2 792 1 848 1 589 1 089 1 038
Salmon 1 078 1 681 3 156 3 135 3 058
Mackerel 3 157 1 232 1 674 1 250 1 184
Saury 2 270 2 325 1 798 1 518 1 342
Sea Bream 1 073 827 888 591 505
Yellowtail 2 516 2 321 1 982 2 127 2 169
Cuttlefish 7 940 5 290 4 072 2 336 2 306
Octopus 993 1 164 1 413 583 789
Shrimps and lobsters 2 748 3 340 2 388 1 935 1 702
Short‐necked clams 1 931 2 113 2 080 1 052 1 059
Oysters 1 153 913 921 507 494
Scallops 805 844 717 636
Salted salmon 3 674 3 502 1 879 1 579 1 652
Salted pollock roe 910 1 019 864 816 792
Dried horse mackerel 1 296 1 776 1 551 881 837
Katsuobushi 467 437 384 287 274
Subtotal 43 265 39 260 36 050 25 447 25 032
Total fresh fish and shellfish 55 938 47 304 44 188 31 024 30 582
28
methods. There is perhaps no other Japanese dish that has influenced global cuisine more than sushi. However, the terms sushi and sashimi are often misunderstood and misused. In Japan eating raw food, is not limited to fish. Sashimi in Japan refers to different kinds of raw fish and also meat, such as horse sashimi (basashi) usually eaten with a soy sauce dip. Other common raw dishes are: raw eggs mixed with boiled rice and soy sauce (tamagogohan), and also raw chicken (torisashi) despite the fact that every year there are several cases of Salmonella poisoning. The price of sashimi used for seafood is mainly determined by its freshness, therefore prices of the same size and species vary depending on the freshness (Makino, 2011). The fondness for and the large amount of raw food consumed in Japan demonstrates the confidence consumers have in the government and local businesses. Sushi is a combination of sashimi or vegetables laid on top of vinegar cooked rice. Traditionally mixing fish with vinegared rice was used to preserve the fish, and once deemed ready to eat, the rice was shelved. The more contemporary version of sushi started in the 19th century in Edo, now Tokyo, as a street snack. Sold by vendors, vinegared rice with a slice of raw fish became popular as a fast-food (Silva and Yamao, 2006). 4.2.2. Use of by-products Japan’s average per capita supply of food (2,719 kcal/capita/day in 2011) has always been significantly lower compared to the United States (3,639 kcal/capita/day in 2011) and other major economies in the European Union such as Germany (3,539 kcal/capita/day in 2011) according to FAO’s FAOSTAT. However, this is not a sign of an inferior diet, but more a sign of less wasteful consumption (Smil and Kobayashi, 2012). From MAFF’s food balance sheets, after extracting values for non-human consumption, recent average per capita food supply was about 51 kg per capita per year. As expected, seafood supply contains a relatively large degree of what is considered to be waste, for example heads, guts, bones, fins, belly flaps, livers and roe. Utilization of this waste as by-products for human consumption is limited in the western part of the world, where the preference is to eat only clean, boneless filets. By-products may constitute as much as 70 percent of fish and shellfish (Olsen, Toppe and Karunasagar, 2014). According to MAFF’s food balance sheets, Japan’s average yield for seafood is 55.5 percent, leaving around 28 kg a year per person for actual consumption. Japan has a long tradition of using by-products which are excellent sources of many essential minerals and vitamins. Some examples of utilization of by-products are: One of the simplest dishes to utilize the by-products is arajiru. After cutting off the
fish filets, the rough parts (ara) of the fish are left; these are added to a soup (jiru) and thus called arajiru. In addition, instead of being used in soup, the left-over parts are also grilled, such as kabutoyaki, grilled fish heads often from sea bream or yellowtail.
Tuna eye (maguro no medama) is found in supermarkets and some restaurants in Japan. They eyeball itself is not eaten, but the fatty meat surrounding the eyeball is
29
considered to be good for health as it contains high values of vitamin B and is usually served in a stew.
Fish powder Gyofunis made from fish that has been used to make fish oil. After the oil is extracted, the fish is dried and pulverized. It is used as feed, fertilizer and also for human consumption as a condiment for noodle dishes.
A large variety of livers and roes are consumed in Japan. Different kinds of roes are used for sushi or eaten as sashimi. Roe is very nutritious with large amounts of omega-3 and high protein content. Sometimes referred to as the foiegras of the seas, the liver of monkfish (ankimo) is a traditional delicacy usually eaten in winter in Japan.
These are some examples of the comprehensive use of by-products in Japan. Japanese cuisine has influenced the eating habits of people around the world; hopefully it will extend its impacts and challenge the common approach of looking at by-products as waste.
4.3. MARKET SEGMENTATION
Japanese consumers are perceived as among the world’s most demanding consumers with regard to product quality and freshness, as Haghirian (2011) highlights: “one of the most important issues – indeed probably the most important issue in selling to the Japanese is quality”. This demand for quality and freshness, frequent transportation and complex distribution structures consequently made Japanese consumers tolerate relatively high prices for seafood. The willingness to pay for quality and freshness has always been held as the guiding principle in the seafood market; however, it seems that amidst the long lasting economic downturn and demographic change, the Japanese customer demanding fresh and high quality products has ceased to be the majority. It should be noticed that consumption varies largely depending on where people live and their age, but there are some underlying trends: Because of the longevity of the Japanese, one of the most influential customer groups in Japan is the senior market, often referred to as the silver market. Already, above one in three of Japan’s citizens are 60 years or older. They grew up eating fish every day for their whole life, and weigh in heavily on prospects for the future seafood market. For older consumers safety of food products tend to be the most important factor when purchasing, even before quality and price. Some believe that the silver market will help to bring back demand for a more traditional diet, with less meat and more vegetables, fruits and fish. However, as the JFA (2013) argues, the “age-related effect”, whereby fish consumption increases with age, is no longer seen among older generations. More Japanese, including the elderly, are opting to live alone because of the continuous urbanization of Japan. Sizes of household are shrinking, and currently more than one-third of households in Japan consist of only one person (MIAC, 2014b), a figure which is expected to further increase. Also, with greater female work participation, it is likely that Japanese consumers will seek more convenient ways of food consumption. Women have an important role in the demand for fish and seafood products, as they tend to decide on what types of food to be purchased.
30
This fundamental shift in the attitudes and behaviour of Japanese consumers seems likely to persist and under these circumstances sales of affordable private-label food products have greatly increased. Seeking to meet the demand for more convenient products, JFA started in 2012 to promote products labeled as “fast fish”, boneless easy-to-cook and ready-to-eat. Especially targeting young people and families, “fast fish” products are being sold at lower prices in medium sized packages in supermarkets around Japan. AEON, Japan’s largest supermarket chain, sold in less than two months around 400 000 packs of boneless mackerel labelled as “fast fish”, and is planning to release more products with different flavours, according to The Asahi Shimbun (2013b). Furthermore, consumption volume of frozen products has over the past 20 years doubled, and frozen products are gathering more attention in the retail and distribution industry (JMA, 2013). 4.3.1. Seasonal Japanese consumers are highly sensitive to seasonal changes, originating from one of the key concepts in Japanese cuisines hun, describing when seasonal food is at its best and should be consumed. When the seasons change, so does the choice of fish, as consumers emphasize, according to the JFA, one of the strong points of eating fish is to “feel a sense of seasons” (JFA, 2013). For example, the best season for cod, salmon and tuna is in the winter, when the fat content is at its highest. While for the poisonous and very expensive blowfish (fugu), as well as whale meat, springtime is the best. Among the younger generations, the feeling of seasonal food traditions has weakened somewhat over time because most foodstuffs are available all year-round. However, the Japanese consumer has grown so accustomed to this concept that ubiquitous limited edition (gentei) products still make it easy to feel seasonal transitions. The challenge for marketers is running the risk of overdoing gentei offerings so consumers get tired of it. In addition to seasonal trends, Japanese consumption is also based on social events and major holidays, when prices and quantities for some seafood products rise. For example, the Japanese receive large work “bonuses” usually in June and December. Although the bonus is normally used as an incentive to make people work, in Japan it is an integral part of the salary. Furthermore, periodic gift-giving through the year is a long tradition in Japan; the two major occasions are in the middle of the year (ochugen) and at the end of the year (oseibo) when a box of salted herring roe or salmon are popular choices.
31
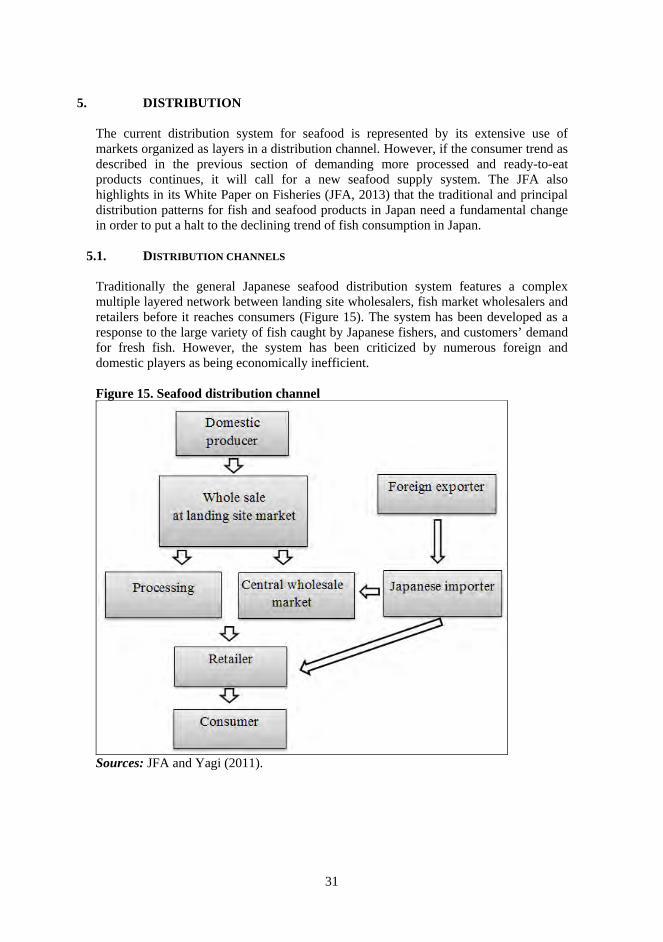
5. DISTRIBUTION The current distribution system for seafood is represented by its extensive use of markets organized as layers in a distribution channel. However, if the consumer trend as described in the previous section of demanding more processed and ready-to-eat products continues, it will call for a new seafood supply system. The JFA also highlights in its White Paper on Fisheries (JFA, 2013) that the traditional and principal distribution patterns for fish and seafood products in Japan need a fundamental change in order to put a halt to the declining trend of fish consumption in Japan.
5.1. DISTRIBUTION CHANNELS
Traditionally the general Japanese seafood distribution system features a complex multiple layered network between landing site wholesalers, fish market wholesalers and retailers before it reaches consumers (Figure 15). The system has been developed as a response to the large variety of fish caught by Japanese fishers, and customers’ demand for fresh fish. However, the system has been criticized by numerous foreign and domestic players as being economically inefficient. Figure 15. Seafood distribution channel
Sources: JFA and Yagi (2011).
32
5.1.1. Wholesale at landing site Out of Japan’s 2 909 ports, as of 2013, 822 ports have their own landing markets (MAFF, 2014). After fishers land their catches at landing sites, the fish is sorted for processing, feed or sale as fresh products depending on the size and quality. Prices are negotiated at the site between middlemen, acting as commission agents for fishers, and intermediaries. At some of the smaller landing sites trading volumes are very small and this has caused problems including giving little leeway for price-setting (JFA, 2014). Many of the wholesale markets at the landing sites have been established and are managed by the FCAs, which also use their own middlemen, meaning they are both middlemen and operators in their own markets (Yagi, 2011). 5.1.2. Central wholesale markets There is a central wholesale market, established by the local Japanese government in almost every major city in Japan; in 2013 there were 34 in total according to the Fishery Census by MAFF (2014). The size of the market facilities varies, but they function as the starting point for distribution in their respective consumption areas and handle both domestic and imported fish. The number of central wholesale markets as well as trading volume has been steadily decreasing, a trend which is expected to continue. However, they offer an amazing track record; Tsukiji, the most famous of the central wholesale markets in Japan is believed to have been operating since 1590 (Bestor, 2004). 5.1.2.1. Tokyo Metropolitan Central Wholesale Market Throughout the world fishing industry the Tokyo Metropolitan Central Wholesale Market, nicknamed Tsukiji for the neighborhood that surrounds it, is renowned for its morning tuna auctions and its unending small wholesale stalls selling every conceivable type of seafood. It is the world’s largest seafood market and hosts the New Year’s tuna auctions where prices of a single tuna have exceeded USD1.7 million. The market opens every day at 3:00 am with the arrival of seafood from different landing sites throughout the country, and by ship or by plane from all over the world. It handles more than 400 different species and above half-a-million tonnes of seafood every year. At Tsukiji there are seven licensed firms operating their own auction houses, where intermediate wholesalers and authorized buyers come to purchase seafood. The intermediate wholesalers are licensed by the local government to resell the seafood from their own stalls at Tsukiji. It is estimated that around 36 000 buyers come every day to buy fish from the intermediate wholesalers; these buyers include secondary wholesalers, chefs and retail fishmongers. The authorized buyers are generally agents for supermarkets, restaurants and other larger institutions (Bestor, 2004). Trade at other wholesale markets, as well as at Tsukiji, has been declining and efforts have been made in wholesale markets in consumption areas to strengthen competitiveness through consolidation and increase transaction efficiency (JFA, 2014). However, auctions at the wholesale markets around Japan still all rely on the same
33
method of simultaneous bidding, which has earned them the description of the most materially backward institutions in Japan’s high-tech society. It has been decided numerous times since the 1990s to relocate Tsukiji; the latest scheduled move is to take place by 2016. The new location at Toyosu in Tokyo Bay, once finished, will be 80 percent bigger with better facilities. The question, however, remains whether the central wholesaler markets can compete with other channels of distribution that avoid or bypass the traditional system. 5.1.3. Retail channels Japanese consumers mainly buy seafood products at supermarkets (MAFF, 2013a). The two major national supermarket retailers are AEON and Ito Yokado. Strong price competition, innovation and expansion of these two chains over the last decade, has allowed the market to demand lower prices. The market for standard supermarkets is now considered to be mature at full saturation levels (Aoki and Frazier, 2013). A characteristic of Japan is the large number of regional supermarket chains, they are less known, but are able to offer local specialties and tap into local cultural preference. For example, the supermarket chain SuperTamade operating in Osaka can best be described as a discotheque, with speakers on high volume and flashy design. It offers the lowest prices to the young and vibrant Osaka people who are known to be economically frugal. Due to limited space, parking areas in Japan are limited, therefore a large number of customers do shopping by bicycle or on foot. Average spending is therefore low and consumers doing daily grocery shopping are common. As the share of the supermarket in retail sales of fish has been increasing and Japanese consumers are looking for one-stop shopping facilities, the share of specialty stores, which used to be where most Japanese shopped for fish, is decreasing. The convenience store is the most rapidly expanding type of food retailer in Japan. Seven-Eleven, Lawson and Family Mart are the major chains, and although it previously was believed that the market for convenience stores was saturated, in 2013 almost 4 500 new stores opened. This expansion will, according to the newspaper NIKKEI (2014), continue in 2014. Convenience stores in Japan, offer a number of services, in addition to food, such as baking, postal and copy services. Still, seafood purchase at convenience stores is limited in Japan. That having been said, convenience stores are meeting the increasing demand of customers to buy prepared food such as home meal replacement products (HMR). The Japanese seafood industry is putting more effort to develop prepared seafood products, suggesting that in the future, convenience stores will play an important role in seafood distribution. The HMR category is grouped in-between eating outside and meals prepared at home. The market for HMR has had increasing sales in every retail area, and it is estimated that 35 percent of all meals in Japan are HMR (Aoki and Frazier, 2013) with products such as sonigiria rice ball often containing fish and lunch boxes (bento) usually containing rice, fish or meat and vegetables. Often these products can be heated at the store, at work or even at home and are therefore increasingly popular for dinner as well as lunch.
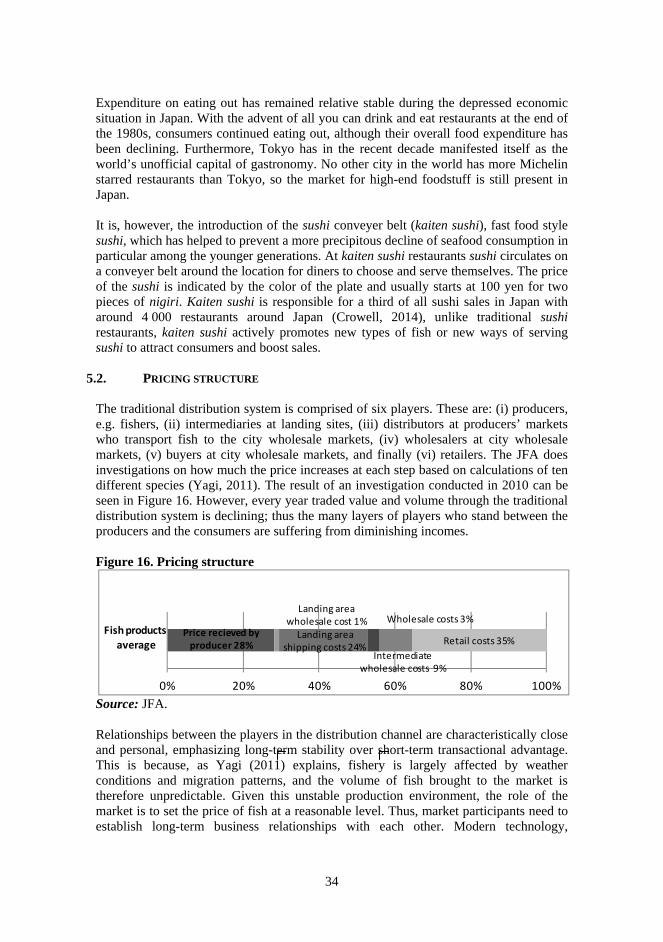
34
Expenditure on eating out has remained relative stable during the depressed economic situation in Japan. With the advent of all you can drink and eat restaurants at the end of the 1980s, consumers continued eating out, although their overall food expenditure has been declining. Furthermore, Tokyo has in the recent decade manifested itself as the world’s unofficial capital of gastronomy. No other city in the world has more Michelin starred restaurants than Tokyo, so the market for high-end foodstuff is still present in Japan. It is, however, the introduction of the sushi conveyer belt (kaiten sushi), fast food style sushi, which has helped to prevent a more precipitous decline of seafood consumption in particular among the younger generations. At kaiten sushi restaurants sushi circulates on a conveyer belt around the location for diners to choose and serve themselves. The price of the sushi is indicated by the color of the plate and usually starts at 100 yen for two pieces of nigiri. Kaiten sushi is responsible for a third of all sushi sales in Japan with around 4 000 restaurants around Japan (Crowell, 2014), unlike traditional sushi restaurants, kaiten sushi actively promotes new types of fish or new ways of serving sushi to attract consumers and boost sales.
5.2. PRICING STRUCTURE
The traditional distribution system is comprised of six players. These are: (i) producers, e.g. fishers, (ii) intermediaries at landing sites, (iii) distributors at producers’ markets who transport fish to the city wholesale markets, (iv) wholesalers at city wholesale markets, (v) buyers at city wholesale markets, and finally (vi) retailers. The JFA does investigations on how much the price increases at each step based on calculations of ten different species (Yagi, 2011). The result of an investigation conducted in 2010 can be seen in Figure 16. However, every year traded value and volume through the traditional distribution system is declining; thus the many layers of players who stand between the producers and the consumers are suffering from diminishing incomes. Figure 16. Pricing structure
Source: JFA. Relationships between the players in the distribution channel are characteristically close and personal, emphasizing long-term stability over short-term transactional advantage. This is because, as Yagi (2011) explains, fishery is largely affected by weather conditions and migration patterns, and the volume of fish brought to the market is therefore unpredictable. Given this unstable production environment, the role of the market is to set the price of fish at a reasonable level. Thus, market participants need to establish long-term business relationships with each other. Modern technology,
Price recieved by producer 28%
Landing area wholesale cost 1%Landing area
shipping costs 24%
Wholesale costs 3%
Intermediate wholesale costs 9%
Retail costs 35%
0% 20% 40% 60% 80% 100%
Fish products
average

35
however, allows fishermen to catch fish under more adverse conditions. In addition, imported seafood is also available, ensuring a less volatile market situation. Thus, long-term relationships among market participants may become less important for the stabilization of market prices.
5.3. ALTERNATIVE CHANNELS The traditional characteristics of multiple-layered wholesalers in the Japanese distribution system can be traced back to Japan’s social, demographic and economic features. It enables customers to buy a vast number of species from many different suppliers and ensures quality and freshness. However, as a new and different demand has emerged, the traditional distribution system is losing its relevance. As a consequence the number of players is declining, while others have found alternative opportunities outside the traditional distribution channels. There is a trend that a larger concentration of trade is occurring through direct distribution, omitting the use of intermediaries such as players at the wholesale markets. Actors need to be of some critical size to engage in this kind of trade, where seafood, instead of being sold in market auctions, entire catches are traded (FAO, 2010). This sort of trade was actually not considered suitable in Japan, because of consumers’ preference for quality and freshness over prices, but it is increasingly occurring and this trend has had a clear impact on distribution practices, which has moved the power from the central wholesalers over to the large retailers. According to Bestor (2004), although the traditional system confines some traders and excludes others, it is not required by law to utilize it. The largest retailer in Asia with its headquarters in Japan, AEON, is utilizing and taking advantage of its size by bypassing the traditional distribution channel. AEON is involved in all the stages of distribution, from management of production to the final sale. In addition, AEON also purchases large volumes through fixed contracts with foreign suppliers. These strategies have enabled the retailer to develop its own private brand product line. Other distribution systems have emerged in recent years, in particular related to the development in communications and transportation. Some Japanese fishers have begun to challenge the traditional system by establishing their own companies and selling seafood products online and providing home-delivery services, in order to have more control over prices and other aspects of the business. Seafood from the landing site market can be ordered online and delivered directly to consumers. These products are popular because they are regarded as safe and since they utilize a system with fewer middlemen, they also increase traceability, which is important to Japanese consumers. Fishers hope that their restructuring efforts will increase efficiency, and in the end, put them in a better position in the distribution channel.
5.4. PROCESSING Around half of seafood in Japan is processed and consumed salted, dried, smoked, as fish paste or canned, according to the MAFF’s food balance sheet. Consumers preferences for more easy-to-use processed products has increased, the seafood

36
processing industry has therefore become increasingly important. However, in the last few years, there has been, according to JFA (2014), a decreasing number of establishments in the fishery processing industry, and more of the processing is taking place overseas and, in particular, in the People’s Republic of China. The People’s Republic of China has since 2002 been by far the world’s largest exporter of fish and seafood products, but its imports have also steadily increased. The People’s Republic of China has in recent years become the world’s third-largest importing country, after Japan and the United States of America. The increased import is, according to FAO (2014c), in part a result of outsourcing of processing to the People’s Republic of China. The main driving force for the expanding outsourcing of processing from Japan to the People’s Republic of China is lower production costs. In addition, because of Japan’s dwindling domestic production, fish processors have experienced difficulties obtaining local raw materials. Labour shortage may also have been a driving force behind the expanding seafood trade between Japan and the People’s Republic of China for re-processing for the last 20 years (Kuroki et al., 2012). Because of the increasing volume of processing and re-exporting from the People’s Republic of China, Japan’s overall decrease in import volumes should be viewed with caution. In earlier years, fish used to be imported in gilled and gutted form; however, as more products are imported after processing, at least a part of the decline in import volume reflects changes to more reduced product forms. The Japanese are in general deeply skeptical towards almost anything that is produced abroad. Hence, Japanese companies set strict requirements for Chinese processing facilities and have raised the level of production conditions to meet Japanese requirements. Furthermore, since Japanese are obsessed with hygiene and food safety, Japanese companies send their employees around the world to educate, to examine and in some cases handpick fish in accordance with Japanese consumer specifications. As a result of the growing tendency of re-processing abroad, as well as an increased demand for traceability and food safety of seafood products, a new law was implemented in 2007 in Japan, requiring all seafood packaging to be labelled with both country of origin and the country where it was reprocessed (PROMAR, 2010).
37
6. SUPPLIER INFORMATION
6.1. IMPORTING For seafood exporters to Japan, the most common route of distribution is usually through one of the Japanese trading companies. Trading companies within the seafood industry sell the seafood to retailers or to central wholesale markets; by utilizing this route imported fish can skip the first steps as seen in Figure 15. Some exporters have also set up their own import companies; however they are dependent on finding their own access to retailers and customers. An appreciating yen and a stagnant domestic market have caused Japanese trading companies to increasingly expand their control of the seafood distribution channel, rather than merely acting as intermediaries. Trading companies, such as Mitsubishi and Mitsui, operate in a wide range of industries and are extremely diversified with revenues comparable to small countries’ GDPs. In their pursuit of expanding and improving control of the seafood supply chain, trading companies are consolidating both upstream and downstream. Regarding this trend of further consolidation, in order to avoid pitfalls and provide a brief insight of some Japanese characteristics some general advice based on personal experiences is provided below: One of the defining attributes of Japanese culture is their attention to detail. This can often be a source of frustration. For example, according to a 2012 McKinsey & Company report, a Japanese company’s due diligence checklist is typically three times longer compared to one from a European or North American company; thus the Japanese can tend to lose sight of the bigger picture. Furthermore, when negotiating it is seldom that the Japanese says bluntly “no”; they are very polite and do not want to embarrass their counterpart with a negative response, thus a typical answer is often to support parts or provide another aspect or proposal. The decision making process in Japan is, in part due to their attention to detail, often very lengthy. It requires a considerable amount of time to consult all participants and build consensus around decisions. However, once decisions are made it ensures that everyone’s perspectives are taken into consideration with an equally shared responsibility.
6.2. FISHERIES ADMINISTRATION The national administrative body of fisheries in Japan is the Japanese Fisheries Agency (JFA) which is under the supervision of the Ministry of Agriculture, Forestry and Fisheries (MAFF). The JFA is responsible for preserving and managing marine biological resources and fishery production activities (JFA, 2012). In Japan, marine waters are divided into a number of sea areas as administrative units. Therefore, in practice many of the administrative tasks, especially relating to the coastal fisheries have been delegated to the prefectural governments. Within the framework laid out by the prefectural governments, for example, fishing rights, which apply only to coastal
38
fishing areas, are issued by the governor to the Fisheries Cooperative Associations (FCAs). In terms of day-to-day operations, the FCAs, although subjected to higher level of regulation, are essentially self-managed. MAFF and JFA publish a large number of statistics and reports which can be accessed through their webpage, such as the Fishery Census, White Paper on Fisheries and annual statistics on fishery and aquaculture production that can be used to gain an understanding of the current status and dynamics of the Japanese fishery industry. The Japan Fisheries Association represents more than 400 private companies and fishers’ organizations in Japan. Although it has close links with the Japanese Fisheries Agency, it should not be confused with it. The Japanese Fisheries Association conducts various kinds of activities e.g. public relations, lobbying, research on domestic and international trends and work towards increase seafood consumption. On their webpage, they publish reports on current topics in the seafood market.
6.3. TRADE INFORMATION
Over the past half century, the Japan External Trade Organization (JETRO) has played a central role in Japan’s international trade. JETRO is an independent government agency established by the Ministry of Economy, Trade and Industry, initially with the purpose of promoting Japanese exports abroad; however, it has shifted more towards promoting foreign direct investment and import promotion to Japan. JETRO provides a wide range of information and support to foreign companies in search of successful entry and expansion in the Japanese market. Information regarding import regulations, labelling and certification can be found through their webpage. In addition, JETRO has regional offices in over 50 countries worldwide. Trade statics and tariff rates on fish and seafood products are available through the Japanese Customs webpage. Overall, import tariffs for fish and seafood products are relatively low in Japan. As of 2013, tariff rate varies from 0 to 15 percent but the average is roughly 4 percent, making Japan an attractive market for foreign exporters. The annual International Seafood & Technology Expo held in Tokyo and Osaka are Japan’s largest seafood exhibitions sponsored by the Japan Fisheries Association. It brings together professionals and experts from all aspects of the industry and provides an opportunity to exchange the latest and useful information about the Japanese seafood market.
39
7. CONCLUSIONS The Japanese have been pioneering the international seafood industry over the past half century; however, these developments did not happen by chance. Their approach is still controversial, such as their ongoing whaling programme, but they have brought innovations and trends that have influenced the globalization and modernization of the seafood industry. Overcoming current challenges the industry is facing will not be easy, particularly in light of the Great East Japan Earthquake in 2011, but the aftermath of the disaster demonstrates the wisdom of the Japanese word “crisis” (危機) which is made up of the combination of two Chinese characters, “danger” and “opportunity”. Japan is a creative and dynamic society. Over its long history the country has repeatedly demonstrated its ability to overcome difficulties. While pursuing the opportunity for a full revival of the industry will take time, it appears that the Japanese seafood market is at a turning point. Nevertheless, the primary driver of the seafood market in Japan will be the overall strength of the country’s economy and the industry’s capability to face the demographic realities. While uncertainties abound, taking into account that Japan’s export of seafood so far has been relatively negligible, the Japanese food boom worldwide offers opportunities. Depending on how well Japanese exporters can capitalize on this trend, dishes such as sushi and tempura already have a worldwide recognition; expanding their exports could do a great deal to cushion the impacts of a declining domestic seafood consumption. Japan faces many challenges that call for a renewal of its model, from increased efforts in modernization of the industry, such as improving distribution channels, developing its aquaculture industry and adjusting to consumers’ altering demands. Addressing these challenges makes the future of the seafood market in Japan intriguing on several levels.
40
8. BIBLIOGRAPHY Aoki, S.T. & Frazier, J. 2013. Japan Retail Foods. Tokyo: USDA Foreign Agricultural
Service. Bestor, T. 2004. Tsukiji: The fish market at the center of the world. Univ of California
Press. Clark, M. 2011. The Impacts of the 3-11 Tsunami on Regional Fisheries in Japan. The
Maureen and Mike Mansfield Foundation. Crowell, T. 2014. Asia Sentinel. Retrieved from Abenomics’ Losers: Conveyor Belt
Sushi: http://www.asiasentinel.com/econ-business/abenomics-conveyor-belt-sushi/ FAO. 2009. Fishery and Aquaculture Country Profiles. Retrieved from FAO:
http://www.fao.org/fishery/facp/JPN/en FAO. 2010. Recent developments in the tuna industry. Rome: FAO. FAO. 2014a. Fishery and Aquaculture Statistics. Global capture and aquaculture
production, 1950-2012 (FishstatJ). FAO Fisheries and Aquaculture Department [online or CD-ROM]. Rome. http://www.fao.org/fishery/statistics/software/ fishstatj/en
FAO. 2014b. The State of World Fisheries and Aquaculture. Rome: FAO. FAO. 2014c. FAO Fisheries and Aquaculture Department, Cultured Aquatic Species
Information Programme. Retrieved from FAO: http://www.fao.org/ fishery/culturedspecies/Patinopecten_yessoensis/en
Fusako, G. 2013. Japan's fishing industry offers huge opportunities for young Indonesians. Retrieved from The Asahi Shimbun: http://ajw.asahi.com/ article/business/AJ201301140062
Hahirian, P. 2011. Japanese Consumer Dynamics. Hampshire: Palgrave Macmillian. Honda, K., Lostaglio, K. & Oka, G. 2012. A yen for global growth. McKinsey &
Company. Issenberg, S. 2007. The Sushi Economy. New York: Gotham Books. IUCN. 2014. IUCN Red List of Threatened Species. Retrieved from
http://www.iucnredlist.org/details/166184/0 Japan Fisheries Association. 2012. Osakana tabeyou network. Tokyo: Japanese
Fisheries Association. JFA. 2012. Japan's fishery at a glance. Tokyo: Japan Fishery Agency. (also available at
www.jfa.maff.go.jp) JFA. 2013. FY2012 Trends in Fisheries FY 2013 Fishery Policy, White Paper on
Fisheries. Tokyo: Japan Fisheries Agency. JFA. 2014. FY2013 Trends in Fisheries FY2014 Fishery Policy White Paper on
Fisheries. Tokyo: Japan Fisheries Agency. JMA. 2013, April 17. Foodex Japan 2015. Retrieved from Japanese Management
Association: http://www3.jma.or.jp/foodex/en/sc/jtoday.html Kuroki, A., Hayashida, J., Tsai, P. & Lambert, A. 2012. 2012 Update on Mackerel
market segmentation study. Tokyo: Promar consulting. MAFF. 2002. Report on Agricultural, Forestry and Fishery Trade . Tokyo: Ministry of
Agriculture, Forestry, and Fisheries. MAFF. 2013a. The 88th Statistical Yearbook. Tokyo: Ministry of Agriculture, Forestry
and Fisheries.
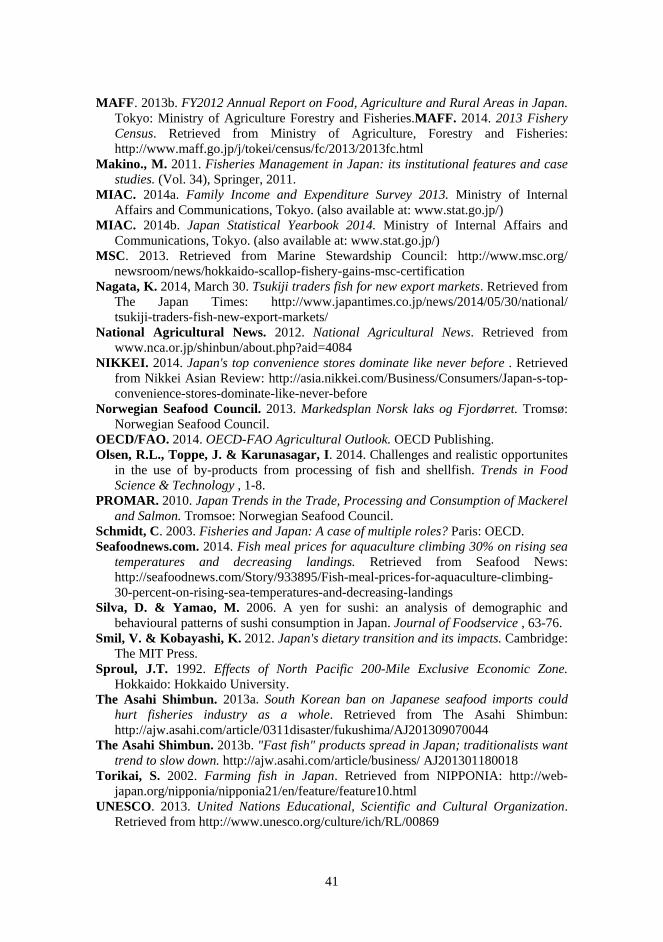
41
MAFF. 2013b. FY2012 Annual Report on Food, Agriculture and Rural Areas in Japan. Tokyo: Ministry of Agriculture Forestry and Fisheries.MAFF. 2014. 2013 Fishery Census. Retrieved from Ministry of Agriculture, Forestry and Fisheries: http://www.maff.go.jp/j/tokei/census/fc/2013/2013fc.html
Makino., M. 2011. Fisheries Management in Japan: its institutional features and case studies. (Vol. 34), Springer, 2011.
MIAC. 2014a. Family Income and Expenditure Survey 2013. Ministry of Internal Affairs and Communications, Tokyo. (also available at: www.stat.go.jp/)
MIAC. 2014b. Japan Statistical Yearbook 2014. Ministry of Internal Affairs and Communications, Tokyo. (also available at: www.stat.go.jp/)
MSC. 2013. Retrieved from Marine Stewardship Council: http://www.msc.org/ newsroom/news/hokkaido-scallop-fishery-gains-msc-certification
Nagata, K. 2014, March 30. Tsukiji traders fish for new export markets. Retrieved from The Japan Times: http://www.japantimes.co.jp/news/2014/05/30/national/ tsukiji-traders-fish-new-export-markets/
National Agricultural News. 2012. National Agricultural News. Retrieved from www.nca.or.jp/shinbun/about.php?aid=4084
NIKKEI. 2014. Japan's top convenience stores dominate like never before . Retrieved from Nikkei Asian Review: http://asia.nikkei.com/Business/Consumers/Japan-s-top-convenience-stores-dominate-like-never-before
Norwegian Seafood Council. 2013. Markedsplan Norsk laks og Fjordørret. Tromsø: Norwegian Seafood Council.
OECD/FAO. 2014. OECD-FAO Agricultural Outlook. OECD Publishing. Olsen, R.L., Toppe, J. & Karunasagar, I. 2014. Challenges and realistic opportunites
in the use of by-products from processing of fish and shellfish. Trends in Food Science & Technology , 1-8.
PROMAR. 2010. Japan Trends in the Trade, Processing and Consumption of Mackerel and Salmon. Tromsoe: Norwegian Seafood Council.
Schmidt, C. 2003. Fisheries and Japan: A case of multiple roles? Paris: OECD. Seafoodnews.com. 2014. Fish meal prices for aquaculture climbing 30% on rising sea
temperatures and decreasing landings. Retrieved from Seafood News: http://seafoodnews.com/Story/933895/Fish-meal-prices-for-aquaculture-climbing-30-percent-on-rising-sea-temperatures-and-decreasing-landings
Silva, D. & Yamao, M. 2006. A yen for sushi: an analysis of demographic and behavioural patterns of sushi consumption in Japan. Journal of Foodservice , 63-76.
Smil, V. & Kobayashi, K. 2012. Japan's dietary transition and its impacts. Cambridge: The MIT Press.
Sproul, J.T. 1992. Effects of North Pacific 200-Mile Exclusive Economic Zone. Hokkaido: Hokkaido University.
The Asahi Shimbun. 2013a. South Korean ban on Japanese seafood imports could hurt fisheries industry as a whole. Retrieved from The Asahi Shimbun: http://ajw.asahi.com/article/0311disaster/fukushima/AJ201309070044
The Asahi Shimbun. 2013b. "Fast fish" products spread in Japan; traditionalists want trend to slow down. http://ajw.asahi.com/article/business/ AJ201301180018
Torikai, S. 2002. Farming fish in Japan. Retrieved from NIPPONIA: http://web-japan.org/nipponia/nipponia21/en/feature/feature10.html
UNESCO. 2013. United Nations Educational, Scientific and Cultural Organization. Retrieved from http://www.unesco.org/culture/ich/RL/00869

42
USTR. 2012. Foreign trade barriers. Washington: Office of the United States Trade Representative.
Yagi, N. 2011. Value Chains of Fishery Products Japan. Tokyo.
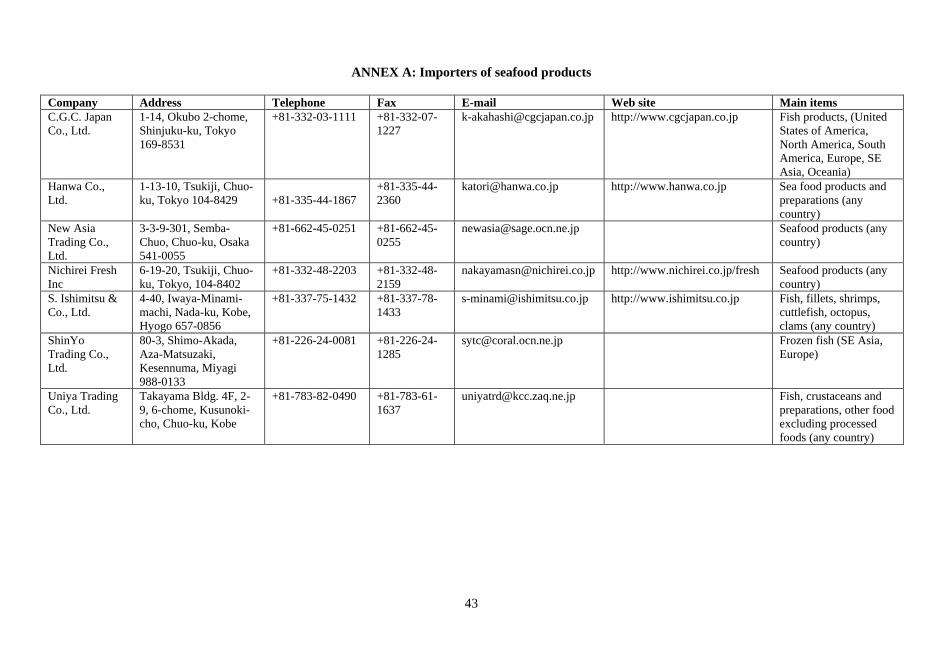
43
ANNEX A: Importers of seafood products
Company Address Telephone Fax E-mail Web site Main items C.G.C. Japan Co., Ltd.
1-14, Okubo 2-chome, Shinjuku-ku, Tokyo 169-8531
+81-332-03-1111 +81-332-07-1227
[email protected] http://www.cgcjapan.co.jp Fish products, (United States of America, North America, South America, Europe, SE Asia, Oceania)
Hanwa Co., Ltd.
1-13-10, Tsukiji, Chuo-ku, Tokyo 104-8429 +81-335-44-1867
+81-335-44-2360
[email protected] http://www.hanwa.co.jp Sea food products and preparations (any country)
New Asia Trading Co., Ltd.
3-3-9-301, Semba-Chuo, Chuo-ku, Osaka 541-0055
+81-662-45-0251 +81-662-45-0255
[email protected] Seafood products (any country)
Nichirei Fresh Inc
6-19-20, Tsukiji, Chuo-ku, Tokyo, 104-8402
+81-332-48-2203 +81-332-48-2159
[email protected] http://www.nichirei.co.jp/fresh Seafood products (any country)
S. Ishimitsu & Co., Ltd.
4-40, Iwaya-Minami-machi, Nada-ku, Kobe, Hyogo 657-0856
+81-337-75-1432 +81-337-78-1433
[email protected] http://www.ishimitsu.co.jp Fish, fillets, shrimps, cuttlefish, octopus, clams (any country)
ShinYo Trading Co., Ltd.
80-3, Shimo-Akada, Aza-Matsuzaki, Kesennuma, Miyagi 988-0133
+81-226-24-0081 +81-226-24-1285
[email protected] Frozen fish (SE Asia, Europe)
Uniya Trading Co., Ltd.
Takayama Bldg. 4F, 2-9, 6-chome, Kusunoki-cho, Chuo-ku, Kobe
+81-783-82-0490 +81-783-61-1637
[email protected] Fish, crustaceans and preparations, other food excluding processed foods (any country)

44
ANNEX B: Processors and wholesalers
Company Address Telephone E-mail Website Main items Urashima Shyoten Inc.
64-2.shinden, Oofunatocyo, Oofuna-shi, Iwate, 022-0002 Japan
+81-192-27-0111
[email protected] http://iwateurashima.com Fresh fish, fried seafood, smoked seafood, frozen seafood products, shellfish and crustacean
Kitani Ikeda Co., Ltd.
Minato 1-chome 6-3 Wakkanai, Hokkaido 097-0021 Japan
+81-162-23-2996
Fresh fish, frozen fish, smoked seafood, dried seafood, shellfish and Crustacean
Kumokawa Bussan Co., Ltd.
1564-36, Saiwaimati, Matsue City, Shimane 690-0041 Japan
+81-852-21-4321
[email protected] www.kobikiya.co.jp Seaweed, crustacean and shellfish
Shimizu Shoten Co., Ltd
6881-72, Isohama Oarai Higashi-ibaraki, Ibaraki Japan
+81-292-66-2211
www.shi-mi-zu.net Octopus and squid
Dainichi Corporation.
1385 Yorimatsu-ko, Uwajima, Ehime Japan
+81 895-27-3200
[email protected] www.dainichi-ff.co.jp Import and sales of aquaculture feed. Sale of fish and processed seafood
Nanyo Bejoy Co., Ltd.
381-91 Sakashizu, Uwajima, Ehime, 798-0087 Japan
+81-895-22-7300
[email protected] www.nanyo-bejoy.co.jp Red seabream, smoked Red seabream and smoked Yellow tail. Sale of aquaculture feed
Nihonkai Oki Katsugyo Club Co., Ltd.
544-38, Uragou, Nishinoshima-cho, Oki-gun, Shimane, 684-0211 Japan
+81-851-46-1385
[email protected] www.oki-katsugyo.jp Live squid, oyster, fresh and live fish, and frozen squid,
Hamasui Co., Ltd. Mashike-cho Betsukari 417-1 Mashike-gun, Hokkaido 077-0217 Japan
+81-164-53-9410
www.hamasui-y.com Frozen, fresh and canned: octopus, squid, shrimp and crustacean
Hayashi Trout Farm,Inc.
66 Ushirohara Odakura Nishigo Nishishirakawa-gun Fukushima 961-8061 Japan
+81-248-25-2041
www.hayashitrout.com Production and sales of Abukuma River Maple Salmon, smoked Maple Salmon and Red Caviar
HidaTorafugu Kenkyuukai.
8-17, Tonomachi, Furukawa-cho, Hida-shi, Gifu. 509-4224 Japan
+81-577-73-7006
[email protected] http://hidatorafugu.com/ Fresh Japanese puffer fish
Marujin 2-132-2 Goyoumai, Nemuro-shi, Hokkaido 087-0164 Japan
+81-153-28-2315
[email protected] www.nosappu.com Fresh, dried and frozen fish, shellfish, crustacean and seaweed
45
ANNEX C: Trading Companies
Company Address Telephone Web site Main items Ajinomoto Trading Inc. 6-11, Ariake 3-chome, Koto-ku, Tokyo 135-
8071 +81-335-28-4411
www.ajitrade.com/en/index.html Seafood
Central Trading Co., Ltd. 7-8, Shintomi 2-chome, Chuo-ku, Tokyo104-0041
+81-335-52-6906
www.boeki.co.jp/ Processed seafood products
COFCO Japan Co., Ltd. 7-6, Nihonbashi Kayaba-cho 2-chome, Chuo-ku, Tokyo 103-0025
+81-336-68-7741
www.cofco.jp Processed seafood products
Good Live Co., Ltd. 12-7, Nihonbashi Kayaba-cho 2-chome, Chuo-ku, Tokyo 103-0025
+81-336-68-3588
www.goodlive.co.jp Crab and seaweed
Hyogo Trading Co., Ltd. 1-12, Goko-dori 6-chome, Chuo-ku, Hyogo 651-0087
+81-782-52-1251
www.hyogo-kobe.co.jp Fresh, frozen, salted and processed seafood
Japan Food Corporation. 11-36, Mita 3-chome, Minato-ku, Tokyo 108-0073
+81-354-41-8500
www.japanfoodcorp.co.jp Seafood
Kawasho Foods Corporation
14-8, Uchikanda 3-chome, Chiyoda-ku, Tokyo 101-0047
+81-352-98-5827
www.kawasho-foods.co.jp Seafood
Kobe Yoko, Ltd. 2-8, Isobe-dori 4-chome, Chuo-ku, Hyogo 651-0084
+81-782-32-3621
www.kobeyoko.co.jp Seafood
Kowa Corporation 3-31, Nishi Kujo 1-chome, Konohana-ku, Osaka554-0012
+81-664-62-7155
www.kwk.co.jp Shellfish
Mitsubishi Shokuhin Co., Ltd.
1-1, Heiwajima 6-chome, Ota-ku, Tokyo 143-6556
+81-337-67-5111
www.mitsubishi-shokuhin.com/en/ Seafood
Mitsui Foods Co., Ltd. 10-9, Hatchobori 2-chome, Chuo-ku, Tokyo 104-8277
+81-335-51-1211
www.mitsuifoods.co.jp Seafood
Morirei Co., Ltd. 5-12, Ryutsu Center Minami 3-chome, Yahaba-cho, Shiwa-gun, Iwate
+81-196-38-9812
www.morirei.co.jp Seafood
Nippon Access, Inc. 1-3, Ikejiri 3-chome, Setagaya-ku, Tokyo154-8501
+81-368-59-1111
www.nippon-access.co.jp Seafood
Nomura Trading Co., Ltd.
7-3, Azuchi-machi 1-chome, Chuo-ku, Osaka, Osaka 541-0052
+81-662-68-8111
www.nomuratrading.co.jp Seafood
S. Ishimitsu & Co., Ltd. 4-40, Iwaya Minami-machi, Nada-ku, Hyogo 657-0856
+81-788-61-7791
www.ishimitsu.co.jp Mainly squid, octopus and shrimp
Takase Trading Co., Ltd. 1-8, Tsukiji 2-chome, Chuo-ku, Tokyo104-0045
+81-335-45-7520
www.takasebussan.co.jp Fish filets, kirimi, shellfish, crab and roe
Toho Bussan Kaisha, Ltd. 4-1, Shiba Koen 2-chome, Minato-ku, Tokyo105-0011
+81-334-38-5711
www.tohob.co.jp Seafood


GLOBEFISH MARKET RESEARCH PROGRAMME
Vol 117 The Japanese market for seafood (45p.) Jan-15 € 30 Vol 116 The European market for bivalves other than mussels (53p.) May-14 € 30 Vol 115 The European market for mussels (65p.) Apr-14 € 30 Vol 114 Eel (Anguilla spp.): Production and trade according to Washing Convention
Legislation * Apr-14 ---
Vol 113 Exchange rates and the seafood trade (43p.) * Jan-14 € 30 Vol 112 By-products of tuna processing (48p.) Jul-13 € 30 Vol 111 Technical guide to fish canning (69p.) May-13 € 30 Vol 110 Innovative uses of fisheries by-products (53p.) Feb-13 € 30 Vol 109 Seafood markets in Southern Africa: Potential of regional trade and
aquaculture development (53p.)
Jan-13
€ 30 Vol 108 Risks and benefits of seafood consumption (29p.) * Jan-13 € 30 Vol 107 El eco-etiquetado de productos pesqueros en España (56p.) Sep-12 € 30 Vol 106 El mercado de productos pesqueros en España: Efectos de la crisis en la
producción y el consumo (73p.)
Aug-12
€ 30 Vol 105 The European market for shrimp: Trade interactions in the import of warm
water and coldwater shrimp to the main European shrimp markets (39p.)
Aug-12
€ 30 Vol 104 The French market for seafood (48p.) Aug-11 € 30 Vol 103 Turbot - Production technology and markets (31p.) Feb-11 € 30 Vol 102 The Ornamental Fish trade (134p.) Nov-10 € 40 Vol 101 Markets for Tilapia (37p.) Jun-10 € 30 Vol 100 Importance of APEC in world fisheries and aquaculture (34p.) Mar-10 € 30 Vol 99 VietNam Seafood from waterland (124p.) Mar-10 € 30 Vol 98 The Seafood market in Greece (33p.) Mar-10 € 30 Vol 97 Private standards in fisheries and aquaculture (64p.) Apr-09 € 30 * Free electronic version available at www.globefish.org/globefish-research-programme.html ***********************************************************************
ORDER FORM COPIES ARE AVAILABLE FROM:
FAO - GLOBEFISH - Fisheries and Aquaculture Policy and Economics Division
Viale delle Terme di Caracalla, 00153 Rome, Italy Tel: (39-06) 570 52692 - Fax: (39-06) 570 53020 - Email: [email protected] - http://www.globefish.org
20% DISCOUNT IS OFFERED IF YOU ORDER TWO OR MORE HARD COPIES
I would like to order _________ copy(ies) of the following GRPs ________________________ €_________ By bank cheque/draft in €_______ payable to GLOBEFISH (see address above) By credit card: Card No: ______________________ Visa Mastercard Expiry date: ____________________ Signature: _____________________ Bank transfer to: FAO Trust Fund (EUR), HSBC Bank Plc, 8 Canada Square, London E14 5HQ, UK A/C No: 67115083 (Swift Code MIDLGB22) - IBAN GB04MIDL40051567115083, referencing GLOBEFISH Name: _________________________________ Company: ______________________________ Street Address: ____________________________________________________________________________ City and Postcode: _______________________ Country: _______________________________ Tel: ________________ Fax: _______________ E-mail: _________________________________

GLOBEFISH RESEARCH PROGRAMME
The Japanese market for seafood
Volume 117
Food and Agriculture Organization of the United NationsFisheries and Aquaculture Policy and Economics DivisionProducts, Trade and Marketing BranchViale delle Terme di Caracalla00153 Rome, ItalyTel.: +39 06 5705 2884Fax: +39 06 5705 3020www.globefish.org
GRP117coverB5.indd 1GRP117coverB5.indd 1 04/02/2015 11:39:0204/02/2015 11:39:02