the lebanese diaspora: an exploration of assimilation and
TRANSCRIPT

University of San Diego University of San Diego
Digital USD Digital USD
Dissertations Theses and Dissertations
2018-05-20
The Lebanese Diaspora: An Exploration of Assimilation and The Lebanese Diaspora: An Exploration of Assimilation and
Success in the United States Success in the United States
Elissa Haddad University of San Diego
Follow this and additional works at: https://digital.sandiego.edu/dissertations
Part of the Other Languages, Societies, and Cultures Commons, Race, Ethnicity and Post-Colonial
Studies Commons, and the Sociology of Culture Commons
Digital USD Citation Digital USD Citation Haddad, Elissa, "The Lebanese Diaspora: An Exploration of Assimilation and Success in the United States" (2018). Dissertations. 103. https://digital.sandiego.edu/dissertations/103
This Dissertation: Open Access is brought to you for free and open access by the Theses and Dissertations at Digital USD. It has been accepted for inclusion in Dissertations by an authorized administrator of Digital USD. For more information, please contact [email protected].

THE LEBANESE DIASPORA: AN EXPLORATION OF ASSIMILATION AND
SUCCESS IN THE UNITED STATES
by
Elissa Haddad
A dissertation submitted in partial fulfillment
of the requirements for the degree of
Doctor of Philosophy
May 2018
Dissertation Committee
Afsaneh Nahavandi, PhD
Fred J. Galloway, EdD
Juan Roche, PhD
University of San Diego

Copyright/Blank page

University of San Diego
School of Leadership and Education Sciences
CANDIDATE’S NAME: Elissa Haddad
TITLE OF DISSERTATION: THE LEBANESE DIASPORA: AN
EXPLORATION OF ASSIMILATION AND
SUCCESS IN THE UNITED STATES
APPROVAL:
_____________________________________, Chair
Afsaneh Nahavandi, PhD
_____________________________________, Member
Fred J. Galloway, EdD
_____________________________________, Member
Juan Roche, PhD
DATE: March 12, 2018

ABSTRACT
Starting in the mid-nineteenth century, people from Lebanon began moving in
large numbers to North and South America, Africa and Northern Europe. Today, the
Lebanese diaspora is estimated to be around 14 million people. Many Lebanese
entrepreneurs worldwide have proven to be very successful in a variety of contexts.
However, while there is evidence suggesting that the Lebanese diaspora has been among
the most successful around the world, the reasons for this success have not yet been
systematically studied. For this reason, there is a pressing need for studies that identify
and examine the individual and cultural factors that may contribute to the success of this
diaspora. Relying on theories of cultural values and individual resilience, this study
examined individuals who make up the Lebanese diaspora in the United States. In this
study, 398 members of the Lebanese diaspora participated in a quantitative survey that
included 80 questions. Findings indicated that gender and time spent in Lebanon affect
cultural values and success. This study further validated the research on the cultural
antecedents of resilience. Findings showed that assimilation, competition, superiority,
uncertainty acceptance and impulse control are positively correlated with resilience.
Additionally, it shed light on the degree to which Lebanese cultural values impact the
success of the Lebanese diaspora. Findings showed that the ability to assimilate has a
positive effect on income. This study also contributed to the existing literature on cultural
research in that it investigated the relationship among various cultural variables. Results
indicated that uncertainty acceptance has a positive effect on the ability to assimilate.
Another contribution to the literature is related to the relationship among various success
outcomes. This study found that happiness contributes to income and job value.

Researcher subjectivity, psychometric properties of the survey instrument and
generalizability are important considerations in this study. However, this study
contributes to our understanding of the demographic and personal factors that have
contributed to the considerable success of the Lebanese diaspora. The findings can also
shed some light on the success and experiences of other immigrant groups and can add
significant knowledge to the field of migration studies.

vi
TABLE OF CONTENTS
TABLE OF CONTENTS ................................................................................................... vi
LIST OF TABLES ........................................................................................................... xiii
LIST OF FIGURES ....................................................................................................... xviii
CHAPTER ONE: OVERVIEW OF THE STUDY .............................................................1
Background to the Study ..........................................................................................1
Geographic Location and Spoken Languages ..............................................1
Religions in Lebanon ...................................................................................2
Cultural Values in Lebanon .........................................................................3
Adversity and Instability in Lebanon ...........................................................4
Lebanon’s Recent History............................................................................4
Waves of Migration .....................................................................................8
Theoretical Frame ....................................................................................................9
Statement of the Problem.......................................................................................13
Purpose of the Study .............................................................................................14
Research Questions ................................................................................................15
CHAPTER TWO: A REVIEW OF THE LITERATURE .................................................18
Implications of Culture ..........................................................................................19
Cultural Values Framework ...................................................................................21
Hofstede’s Cultural Dimensions ................................................................21
Power distance ..............................................................................21
Individualism versus collectivism ................................................23
Masculinity versus femininity ......................................................25

vii
Uncertainty avoidance versus uncertainty acceptance ...................25
Indulgence versus restraint ............................................................27
Triple Package Theory ...............................................................................27
Superiority .....................................................................................27
Insecurity........................................................................................29
Impulse Control..............................................................................31
Pilot Study ................................................................................................. 32
Participants and data collection procedures ...................................32
Data analysis and findings .............................................................33
Discussion ......................................................................................35
Learning ............................................................................35
Adversity............................................................................35
Assimilation .......................................................................36
A strong sense of being worthy .........................................37
A deep fear of failure .........................................................37
Theories of Resilience............................................................................................38
Concept Definitions ...................................................................................38
Defining Attributes ....................................................................................39
Antecedents and Consequences ................................................................ 41
Similar Concept .........................................................................................43
Resilience Scales ........................................................................................44
Relationship Between Culture and Resilience .......................................................45
Defining Success ....................................................................................................46

viii
Income and Educational Attainment ..........................................................46
Job value ....................................................................................................48
Remittances sent ....................................................................................... 48
Happiness/life satisfaction .........................................................................50
Relationship Between Resilience and Success ..................................................... 52
Conclusion .............................................................................................................54
CHAPTER THREE: RESEARCH DESIGN AND METHODOLOGY ...........................55
Participants .............................................................................................................55
Measures ................................................................................................................59
Procedures ..............................................................................................................62
Analysis..................................................................................................................66
CHAPTER FOUR: SURVEY FINDINGS AND ANALYSIS .........................................69
Descriptive Statistics ..............................................................................................74
Demographic Data .....................................................................................74
Cultural Variables ......................................................................................78
Success Variables.......................................................................................81
Reliabilities and Factor Analysis ..........................................................................92
Matched Samples ................................................................................................123
Religion matched sample ........................................................................123
Gender Matched Sample ..........................................................................126
U.S. to 14+ Matched Sample ...................................................................129
Less than 14 years to 14+ Matched Sample.............................................133
US to Lebanon Born Matched Sample ....................................................136

ix
Regressions ..........................................................................................................140
Cultural Factors on Resilience .................................................................140
Cultural Factors on Success .....................................................................142
Income static regression results ...................................................144
Remittances static regression result .............................................146
Job value static regressions ..........................................................148
Happiness static regressions ........................................................150
Education growth regressions ......................................................152
Income growth regressions ..........................................................155
Remittances growth regressions ..................................................157
Job value growth regressions .......................................................158
Cultural Variables on Cultural Variables Regressions Stepwise .........................160
Success Variables on Success Variables ..............................................................175
Definitions and Reasons for Success ...................................................................188
CHAPTER FIVE: DISCUSSION OF FINDINGS AND CONCLUSION .....................193
Summary of Results .............................................................................................195
Representativeness of Lebanese Culture .............................................................198
Personal Adversity ..................................................................................198
National Adversity ..................................................................................198
Family and Personal Education ..............................................................199
Assimilation ............................................................................................200
Competition/Masculinity ........................................................................200
Jealousy ...................................................................................................201

x
Comparing Oneself to Others .................................................................201
Superiority ..............................................................................................202
Insecurity ................................................................................................203
Uncertainty Acceptance ..........................................................................203
Impulse control .......................................................................................204
Resilience ................................................................................................205
Success and the Lebanese Diaspora .....................................................................207
The Association between Demographic Variables and culture ...........................210
Religion Matched Sample ........................................................................210
Gender Matched Sample ..........................................................................211
U.S. to 14+ Matched Sample ...................................................................212
Less than 14 years to 14+ Matched Sample.............................................213
US to Lebanon Born Matched Sample ....................................................214
The Association between Culture and the Success of the Lebanese Diaspora ...215
Cultural Variables on Success measures..................................................215
Cultural variables on resilience ....................................................215
Cultural variables on education static ..........................................217
Cultural variables on education growth .......................................217
Cultural variables on income .......................................................218
Cultural variables on income growth ...........................................218
Cultural variables on remittances static .......................................219
Cultural variables on remittances growth ....................................220
Cultural variables on job value static ...........................................220

xi
Cultural variables on job value growth ........................................221
Cultural variables on happiness ...................................................222
Cultural Variables on Cultural Variables Regressions Stepwise .............223
Cultural variables on personal adversity ......................................223
Cultural variables on national adversity ......................................224
Cultural variables on family education ........................................225
Cultural variables on personal education .....................................226
Cultural variables on assimilation ................................................228
Cultural variables on competition ................................................228
Cultural variables on jealousy ......................................................228
Cultural variables on comparing oneself to others ......................229
Cultural variables on superiority ..................................................229
Cultural variables on insecurity ...................................................230
Cultural variables on uncertainty acceptance ..............................230
Cultural variables on impulse control ..........................................231
Success Measures on Success Measures Regressions .............................232
Success measures on education static .........................................232
Success measures on education growth .......................................232
Success measures on happiness ...................................................233
Success measures on income static ..............................................234
Success measures on income growth ...........................................235
Success measures on remittances static .......................................235
Success measures on remittances growth ....................................235
xii
Success measures on job value static ...........................................235
Success measures on job value growth ........................................236
Definitions and Reasons for Success ...................................................................236
Definitions of Success..............................................................................236
Reasons for Success .................................................................................238
Limitations and Delimitations ..............................................................................240
Representativeness of the Sample and External Validity ....................................241
Conclusion, Significance and Future Research ...................................................245
REFERENCES ............................................................................................................... 250
APPENDIX A: Survey Instrument ..................................................................................254
xiii
LIST OF TABLES
Table 1. Cultural Variables ................................................................................................10
Table 2. Success Variables ................................................................................................11
Table 3. Pilot Study Findings.............................................................................................33
Table 4. Income and Educational Achievement Data ........................................................47
Table 5. Comparison between the Sample and the Population ..........................................56
Table 6. Survey Details ......................................................................................................60
Table 7. Summary of Methodology ...................................................................................63
Table 8. Gender ..................................................................................................................75
Table 9. Age Now ..............................................................................................................75
Table 10. Marital Status .....................................................................................................76
Table 11. Religion ..............................................................................................................76
Table 12. Age of Immigration .......................................................................................... 77
Table 13. Years in the United States ................................................................................. 78
Table 14. Independent Variables + Resilience ................................................................. 79
Table 15. Educational Attainment before Immigrating to the United States .....................81
Table 16. Educational Attainment Now .............................................................................82
Table 17. Income in the First Year After Immigration ......................................................83
Table 18. Income in the Year of 2016 .............................................................................. 84
Table 19. Remittances Sent in the First Year After Immigration ......................................85
Table 20. Remittances Sent in 2016 ..................................................................................86
Table 21. Job Value in the First Year After Immigration ..................................................87
Table 22. Present Job value ...............................................................................................88

xiv
Table 23. Happiness ...........................................................................................................90
Table 24. Reliabilities ........................................................................................................93
Table 25. Adversity Descriptive Statistics ........................................................................ 95
Table 26. Correlation among Adversity Questions...........................................................96
Table 27. Adversity Rotated Component matrix .............................................................. 97
Table 28. Education Descriptive Statistics ........................................................................98
Table 29. Correlation among Education Questions ...........................................................98
Table 30. Education Rotated Component matrix ...............................................................99
Table 31. Assimilation Descriptive Statistics ..................................................................100
Table 32. Correlation among Assimilation Questions .....................................................100
Table 33. Competition Descriptive Statistics...................................................................101
Table 34. Correlation among Competition Questions .....................................................102
Table 35. Jealousy Descriptive Statistics ........................................................................ 103
Table 36. Correlation among Jealousy Questions ........................................................... 104
Table 37. Compared to Others Descriptive Statistics ..................................................... 105
Table 38. Correlations among Compared to Other ..........................................................106
Table 39. Superiority Descriptive Statistics.....................................................................107
Table 40. Correlation among Superiority Questions .......................................................107
Table 41. Insecurity Descriptive Statistics.......................................................................109
Table 42. Correlation among Insecurity Questions .........................................................109
Table 43. Uncertainty Descriptive Statistics ....................................................................111
Table 44. Correlation among Uncertainty Questions ......................................................111
Table 45. Impulse Control Descriptive Statistics ............................................................112

xv
Table 46. Correlation among Impulse control Questions ............................................... 113
Table 47. Resilience Descriptive Statistics ......................................................................114
Table 48. Correlation among Resilience Questions .........................................................115
Table 49. Resilience Rotated Component matrix ............................................................117
Table 50. Happiness Descriptive Statistics ......................................................................119
Table 51. Correlation among Happiness Questions .........................................................120
Table 52. Happiness Rotated Component matrix ............................................................122
Table 53. Comparison of Christians and Muslims on Cultural Variables and Success
Outcomes .........................................................................................................................124
Table 54. Comparison of Males and Females on Cultural Variables and Success Outcomes
..........................................................................................................................................127
Table 55. Comparison of U.S. Born and 14+ in Lebanon on Cultural Variables and
Success Outcomes ............................................................................................................131
Table 56. Comparison of Less than 14 Years in Lebanon and 14+ Years in Lebanon on
Cultural Variables and Success Outcomes ......................................................................134
Table 57. Comparison of U.S. Born and Lebanese Born on Cultural Variables and Success
Outcomes .........................................................................................................................137
Table 58. Cultural Factors on Resilience .........................................................................141
Table 59. Correlations for Cultural Variables + Education static ....................................143
Table 60. Cultural Variables on Income Static – Stepwise .............................................145
Table 61. Cultural Variables + Resilience on Income Static – Stepwise ........................145
Table 62. Cultural Variables on Remittances Static – Stepwise ......................................146
Table 63. Cultural Variables + Resilience on Remittances Static – Stepwise .................147

xvi
Table 64. Cultural Variables on Job Value Static – Stepwise .........................................149
Table 65. Cultural Variables + Resilience on Job Value Static – Stepwise ....................149
Table 66. Cultural Variables on Happiness Static – Stepwise .........................................151
Table 67. Cultural Variables + Resilience on Happiness Static – Stepwise ................... 152
Table 68. Cultural Variables on Education Growth – Stepwise .....................................153
Table 69. Cultural Variables + Resilience on Education Growth – Stepwise .................154
Table 70. Correlations for Cultural Variables + Education Growth ................................154
Table 71. Cultural Variables on Income Growth – Stepwise ..........................................156
Table 72. Cultural Variables + Resilience on Income Growth – Stepwise .....................156
Table 73. Cultural Variables on Remittances Growth – Stepwise...................................157
Table 74. Cultural Variables + Resilience on Remittances Growth – Stepwise ............. 158
Table 75. Cultural Variables on Job Value Growth – Stepwise ..................................... 159
Table 76. Cultural Variables + Resilience on Job Values Growth – Stepwise ............... 159
Table 77. Cultural Variables on Personal Adversity ...................................................... 161
Table 78. Cultural Variables on National Adversity ...................................................... 162
Table 79. Cultural Variables on Family Education ........................................................ 163
Table 80. Cultural Variables on Personal Education .......................................................164
Table 81. Correlations for Independent Variables .......................................................... 165
Table 82. Cultural Variables on Assimilation..................................................................167
Table 83. Cultural Variables on Competition ..................................................................168
Table 84. Cultural Variables on Jealousy ........................................................................169
Table 85. Cultural Variables on Comparing to Others ....................................................170
Table 86. Cultural Variables on Superiority ....................................................................171
xvii
Table 87. Cultural Variables on Insecurity ......................................................................172
Table 88. Cultural Variables on Uncertainty Acceptance .............................................. 173
Table 89. Cultural Variables on Impulse Control ............................................................174
Table 90. Success Variables on Education Static ........................................................... 175
Table 91. Success Variables on Education Growth ........................................................ 177
Table 92. Correlations for Success Variables on Education Static and Education Growth
………………..............................................................................................................…178
Table 93. Success Variables on Happiness ......................................................................180
Table 94. Success Variables on Income Static ................................................................181
Table 95. Success Variables on Income Growth ............................................................ 182
Table 96. Success Variables on Remittances Static ........................................................ 184
Table 97. Success Variables on Remittances Growth .....................................................185
Table 98. Success Variables on Job Value Static ............................................................186
Table 99. Success Variables on Job Value Growth .........................................................187
Table 100. Definitions of Success ...................................................................................188
Table 101. Cultural Reasons for Success. ....................................................................... 190
Table A1: Demographic Questions ..................................................................................255
Table A2: Representativeness of Cultural Characteristics...............................................256
Table A3: Connor-Davidson Resilience Scale ................................................................259
Table A4: Success Indicators ...........................................................................................260

xviii
LIST OF FIGURES
Figure 1. Map of Lebanon ...................................................................................................2
Figure 2. A chronology of Key Events in Recent Lebanese history ....................................7
Figure 3. Theoretical Frame ...............................................................................................13

1
CHAPTER ONE
OVERVIEW OF THE STUDY
Background to the Study
Today, there are more Lebanese individuals living outside of Lebanon than in
Lebanon. The Lebanese diaspora is currently estimated to be around 14 million people,
which far exceeds the internal population of Lebanon of approximately four million
people (Abdelhady, 2011). The individuals inhabiting Lebanese immigrant communities
around the world constitute the largest group of Arab immigrants (Abdelhady, 2011). As
a diaspora, Lebanese immigrant communities have historical roots in almost every corner
of the world. A study on the Lebanese diaspora would not be complete without a brief
overview of key aspects of Lebanese society, culture and recent history.
Geographic Location and Spoken Languages
Lebanon is located on the eastern shore of the Mediterranean Sea. The country is
bordered by Syria to the north and east and by Israel to the South. Lebanon’s geographic
location and unique position between east and west make it very receptive to other
cultures and languages. While Arabic is the official language in Lebanon, almost all
government publications appear in French and in Arabic. In addition, all students in
Lebanon are required to learn second and third languages. According to Bacha and
Bahous (2011), more than half of the Lebanese people are bilingual.

2
Figure 1. Map of Lebanon. Lebanon is located on the eastern shore of the Mediterranean
Sea. The country is bordered by Syria to the north and east and by Israel to the South.
(retrieved from https://www.britannica.com/place/Lebanon)
Religions in Lebanon
The population of Lebanon is about four million and consists mainly of
Christians, Muslims and Druze. It is important to note that there is more religious
diversity in Lebanon than any other country in the Middle East (Faour, 2007). Today,
there are officially 18 recognized sects in Lebanon. Most of these sects belong to one of
the two large clusters: Muslims and Christians (Faour, 2007). It is estimated that the
Christian population in Lebanon makes up 41% of the total population. This is the largest
proportion of Christians of any Middle Eastern country. The Muslim population is
estimated at around 59% of the population and is evenly split between Shiites and Sunnis
(Faour, 2007). After Lebanon gained its political independence from the French in 1943,
official estimates of the size of religious groups served as the basis for the confessional
political system. This political system has to do with distributing public positions among
the major religious sects in accordance with their numerical size (Faour, 2007). For

3
instance, the three top positions were allocated along religious lines with the President
being a Maronite Christian, the Speaker of the Parliament a Shia Muslim and the Prime
Minister a Sunni Muslim.
Cultural values in Lebanon
Lebanon is considered a collectivistic society (Hofstede, n.d.). Hofstede states that
collectivism represents a preference for a tightly knit framework in society, which
individuals can expect their relatives or members of a particular in-group to look after
them in exchange for unquestioning loyalty (Hofstede & Minkov, 2010). In Lebanese
culture, loyalty is paramount and it overrides most other societal rules and regulations.
Lebanese society fosters strong relationships where everyone takes responsibility for
fellow members of their group. In addition, Lebanon is considered a masculine society,
which tend to be driven by competition, achievement and success (Hofstede, n.d.).
According to Hofstede, in Lebanon, people “live in order to work” and the emphasis is on
competition and performance.
Lebanese people have exceptional impulse control leading to a society that does
not act on impulsive urges (Chua & Rubenfeld, 2014). Chua, a professor at Yale Law
School, defines impulse control as the ability to resist temptation, especially the
temptation to give up in the face of hardship or quit. Chua claims that impulse control has
to do with discipline and is characterized by the unwavering capability to persevere at a
difficult task (Chua & Rubenfeld, 2014). The concept of impulse control is similar to
Hofstede’s dimension of indulgence versus restraint. Hofstede states that indulgence
stands for a society that allows relatively free gratification of basic and natural human
drives related to enjoying life and having fun. Conversely, restraint stands for a society

4
that suppresses gratification of needs and regulates it by means of strict social norms
(Hofstede & Minkov, 2010). Hofstede found that the culture of Lebanon is one of
restraint. According to the author, Lebanese society does not emphasize leisure time and
tends to control the gratification of desires. Hofstede’s findings appear to be in line with
Chua’s assertion that Lebanese-Americans tend to have considerable impulse control
(Chua & Rubenfeld, 2014).
Adversity and Instability in Lebanon
A discussion about Lebanon and Lebanese culture would be incomplete without
highlighting the adversity that the Lebanese have gone through as a result of decades of
instability and struggle. In his book, Antifragile, Taleb (2012), a Lebanese American
author, recounts an ancient legend about Phoenix, the bird with splendid colors. The
author contends that whenever this bird is destroyed, it is reborn from its own ashes. It
always returns to its initial state. Phoenix happens to be the ancient symbol of Beirut, the
capital of Lebanon. According to legend, Berytus (Beirut’s historical name) has been
destroyed seven times in its close to five-thousand-year history and has come back seven
times. Beirut was completely destroyed an eighth time during the brutal civil war in the
1970s. After the war, Beirut saw its eighth rebuilding. In Taleb’s opinion, Phoenix is a
metaphor for not only Beirut but also the Lebanese people (Taleb, 2012).
Lebanon’s Recent History
The Ottomans, through two main feudal families, ruled Lebanon until the middle
of the nineteenth century (“Lebanon Timeline”, 2017). During the Ottoman rule, the term
Syria was used to designate the area including present-day Lebanon, Syria, Jordan and
Israel. Following the collapse of the Ottoman Empire after World War I, the League of

5
Nations granted the mandate for Lebanon to France (“Lebanon Timeline”, 2017). In
1941, under various political pressures, General Charles de Gaulle decided to recognize
the independence of Lebanon. In the face of continued international pressure, France
agreed to transfer power to the Lebanese government in 1943. During the 1960s,
Lebanon enjoyed a period of relative stability and prosperity until the outbreak of the
civil war. According to British Broadcasting Company (2017), the Lebanese civil war
erupted in 1975 after Phalangist gunmen ambushed a bus in the Ayn-al-Rummanah
district of Beirut, killing 27 of its mainly Palestinian passengers. The Phalangists claimed
that members of this group had previously attacked a church in the same district. In 1989,
after over a decade of fighting, the Lebanese parliament met in Taif, Saudi Arabia, to
endorse a Charter of National Reconciliation and this marked the end of the civil war
(“Lebanon Timeline”, 2017). It is estimated that more than 100,000 people were killed
during this war (“Lebanon Civil War”, n.d.).
Nearly a decade after the Taif accords, in 2000, Israel withdrew its troops from
southern Lebanon. In 2005, Prime Minister Rafik Hariri was killed by a car bomb in
Beirut. This attack sparked anti-Syrian rallies and demands for Syria to withdraw its
troops intensified until its forces left in April of that year (“Lebanon Timeline”, 2017). In
2008, Lebanon established diplomatic relations with Syria for the first time since both
countries gained independence in the 1940s. Four years later, the Syrian conflict that
began in March 2011 spilled over into Lebanon in deadly clashes between Sunni
Muslims and Alawites in Tripoli and Beirut (“Lebanon Timeline”, 2017). In 2013,
dozens of people were killed in bomb attacks at two mosques in Tripoli. These attacks
were linked to tensions over the Syrian conflict and were the deadliest in Lebanon since

6
the end of the civil war in 1990. According to BBC (2017), in 2015, new restrictions on
Syrians entering Lebanon came into effect and Syria-related security concerns were cited
as the reason for these restrictions. Today, there are more than 1 million Syrian refugees
in Lebanon and ongoing incidents continue to further aggravate the already strained
relations between Lebanese people and the Syrian refugees (“Lebanon Timeline”, 2017).

7
Figure 2. A chronology of key events in Recent Lebanese history.
The Ottomans ruled Lebanon until the middle of the nineteenth century.
In 1943, France agreed to transfer power to the Lebanese government.
Since the end of the civil war in 1989, Lebanon continues to experience political instability.
(retrieved from http://www.bbc.com/news/world-middle-east-14649284).
1516-1918 1943 1920 1989 1982 1975 2000 2005 2012
Ottoman rule
Lebanon is part
of the Ottoman
Empire.
French
Mandate
The League of
Nations grants
the mandate for
Lebanon and
Syria to France.
Independence
France agrees
to transfer
power to the
Lebanese
government
and Lebanon
gains its
independence.
Civil War
Clashes in
Beirut killing
27 Palestinian
passengers start
the civil war.
Syrian
Conflict
The Syrian
conflict that
began in March
2011 spills over
into Lebanon in
deadly clashes
between Sunni
Muslims and
Alawites in
Tripoli and Beirut.
Hariri
Assassinated
Rafik Hariri is
killed by a car
bomb in Beirut.
The attack
sparks anti-
Syrian rallies
and calls for
Syria to
withdraw its
troops intensify
until its forces
leave in April.
Assassinations
of anti-Syrian
figures become
a feature of
political life.
Israeli
Withdrawal
Israel
withdraws its
troops from
southern
Lebanon.
Civil War
Ends The Lebanese
parliament met
in Taif, Saudi
Arabia, to
endorse a
Charter of
National
Reconciliation.
Israel Invades
Following the
attempted
assassination of
the Israeli
ambassador to
Britain by a
Palestinian
group, Israel
launches a full-
scale invasion
of Lebanon.
Lebanese
president-elect
Bachir
Gemayel is
assassinated.
U.S., French
and Italian
peacekeeping
forces arrive in
Beirut.
2015
Refugee Crisis
The United
Nations refugee
agency says
there are at
least 1 million
Syrian
refugees in
Lebanon.
New
restrictions on
Syrians
entering
Lebanon came
into effect,
further slowing
the flow of
people trying to
escape the war
in Syria.

8
Waves of Migration
As a result of all these years of instability, hundreds of thousands of Lebanese
people left Lebanon seeking a better life in a foreign country. In fact, starting in the mid-
nineteenth century, people from Lebanon began moving in large numbers to North and
South America, Africa and northern Europe (Hourani and Shehadi, 1992). A number of
factors contributed to the dispersion of the Lebanese over different parts of the world.
These push factors included economic desperation, religious discrimination and political
oppression. A number of historians identify two pivotal moments in Lebanese history and
point to two major waves of emigration (Khater, 2001, Tabar, 2010, Chua & Rubenfeld,
2014). The first flux of emigration ran from 1880 to 1920. During this period, the
Christians of Lebanon left because they were the victims of persecution by the Ottoman
authorities. Along with religious persecution, economic reasons played an instrumental
role in this migration. During that period, the Lebanese economy had become very
dependent on silk production. The crash in the silk market led to extreme poverty and
eventually drove people out of the country.
The next exodus came during Lebanon’s war, which began in 1975 (Khater, 2001,
Tabar, 2010). The outbreak of the civil war in 1975 significantly accelerated emigration.
A net number of 990,000 Lebanese individuals (40% of the Lebanese population) are
believed to have migrated during the seventeen-year civil war (Tabar, 2010). Although all
religious groups were negatively affected by the war in Lebanon, there were some
specific patterns. During the period from 1975 to 1982, the majority of emigrants were
Christians. Following the Israeli invasion of Beirut in 1982, the trend was reversed
toward a majority of Muslim and Druze migrants (Tabar, 2010).

9
It is important to underscore that Lebanese emigrants during the war came from
diverse economic and professional backgrounds that included both white and blue-collar
professions (Labaki, 1992). Lebanese people have emigrated during both periods of
relative stability and periods of extreme conflict (Tabar, 2010). Tabar states that those
who emigrated prior to the civil war left under relatively stable circumstances and were
essentially driven by economic factors. He asserts that this group was predominantly
unskilled and migrated as a result of limited job opportunities and income. However,
Tabar states that one major development in Lebanese migration since the late 1970s has
been an increase in skilled migration. This increase is partly attributed to the political
instability and strife that have been prevalent in Lebanon since the civil war.
The presumed end of the war with the signing of the Taif Accords in 1989 was
followed by an eruption in fighting among the various Christian groups and led to another
wave of large-scale migration. The failure of the peace accords led many Lebanese to
think of their presence outside Lebanon as permanent settlement, rather than a temporary
exile. Today, there is a nearly global distribution of the Lebanese diaspora, with a
significant presence in Brazil, Argentina, the United States, Canada, Australia and France
(Tabar, 2010).
Theoretical Frame
This study relied on a cultural values framework, theories of success and theories
of resilience. Cultural research informs us about the unique traits and values of Lebanese
people. As I mentioned earlier in this chapter, according to Hofstede (n.d), Lebanese
society is collectivistic, masculine and is one of restraint. This study’s theoretical
framework also relied on Chua and Rubenfeld’s (2014) triple package theory. The triple

10
package theory discusses three unlikely traits that explain the rise and fall of cultural
groups in America. These traits are superiority, insecurity and impulse control. Along
with Hofstede’s cultural dimensions and the triple package theory, this study draws from
the findings of a previously conducted pilot study. These theories are the basis of this
study and constitute the cultural variables.
Table 1
Cultural Variables
Origin
Variable Measured
Hofstede Cultural Values
Masculinity, Uncertainty Acceptance, Restraint
Triple Package Theory
Superiority, Insecurity, Impulse Control
Pilot Study
Adversity, Learning, Assimilation, Competition,
Jealousy, Comparing Yourself to Others, Superiority
Complex, Insecurity

11
Success outcomes are an important component of this study. Success is often
measured by job position, income and educational attainment. However, this study
expanded the definition of success to include theories of happiness/life satisfaction. Life
satisfaction is conceived as the degree to which an individual judges the overall quality of
his/her life as a whole favorably. According to Veenhoven (1991), the components of life
satisfaction are family life, social relationships, job satisfaction and leisure activities.
These theories are the foundation of this study’s success measures.
Table 2
Success Variables
Success Indicators
Variable Described
Variable
Measured
Happiness/Life satisfaction
Family life, social relationships, job
satisfaction and leisure activities
Static (current)
Remittances sent
Percentage of income sent to
Lebanon in 2016 and percentage
sent in the first year after
immigrating to the U.S.
Static and growth
Income
Current income and income in the
first year after immigration to the
Static and growth

12
U.S.
Education
Current education level and highest
education level prior to
immigration to the U.S.
Static and growth
Job value
Prestige, education, injury rates and
income
Static and growth
Furthermore, this study relied on theories of resilience. According to Campbell-
Skills and Stein (2007), resilience refers to positive adaptation in the face of stress and
trauma. The authors state that resilience is related to an individual’s ability to thrive
despite adversity. Research on resilience shows that resilience is related to cultural
values. Taleb (2012) states that the Lebanese gained antifragility as a result of the years
of political turmoil and economic adversity. Resilience was used as a mediator variable in
this study. The purpose was to see if the relationship between the cultural values and the
success outcomes could be explained by resilience.

13
Figure 3. Theoretical Framework. This study relied on a cultural values framework,
theories of success and theories of resilience. Resilience was used as a mediator variable
in this study. The purpose was to see if the relationship between the cultural values and
the success outcomes could be explained by resilience.
Statement of the Problem
Many Lebanese leaders, entrepreneurs and business people worldwide have
proven to be very successful in a variety of contexts and sectors. According to Chua and
Rubenfeld (2014), the famously entrepreneurial Lebanese have one of the most
successful diasporas in the world. Although small in numbers, Lebanese minorities are
disproportionally successful throughout Latin America, West Africa and the Caribbean.
Among ethnic groups in the United States, Lebanese are close to the top of the charts in
terms of household median income, percentage earning over $100,000 and percentage
earning over $200,000 (Chua & Rubenfeld, 2014). According to Khater (Freakonomics
radio, 2013), a professor of Middle Eastern history at North Carolina State, there are as

14
many as three Lebanese-Americans with doctorate degrees for every one American who
has a doctorate degree. The Masters degree rate is also higher and is approximately 2.4 to
1.
While there is evidence suggesting that the Lebanese diaspora has been incredibly
successful, the reasons for this success have not yet been systematically studied. There
remains a limited understanding in the research of this phenomenon. For these reasons,
there is a pressing need for studies that identify and examine the factors that have led to
the success of the diaspora.
Purpose of the Study
The purpose of this study was to respond to the need articulated at the conclusion
of the prior section. This study examined members of the Lebanese diaspora in the
United States account for their success. Specific aspects of Lebanese culture were derived
from existing literature and a previously conducted pilot study of members of the
Lebanese diaspora in the United States. These cultural aspects included but were not
limited to experiences of adversity, emphasis on education, high degrees of impulse
control and high levels of comfort with uncertainty. The first step in the study was to
ascertain the extent to which the respondents share the cultural values typically associated
with the Lebanese, more specifically, the Triple Package. The next step was to consider
whether these values predicted their own personal success. Finally, the role of resilience
and its relationship to the cultural values and the success measures was explored.
This study further considered the impact of various demographics on the
participants’ degree of representation of specific aspects of Lebanese culture and key
success outcomes. These demographics included gender, religious preference and number
15
of years spent in Lebanon. In addition, this study investigated the relationship among
Lebanese cultural values and the relationship among various success measures. Lastly,
the study examined the degree to which participants’ definitions of success matched what
they have achieved and considered the reasons to which study participants attributed their
success.
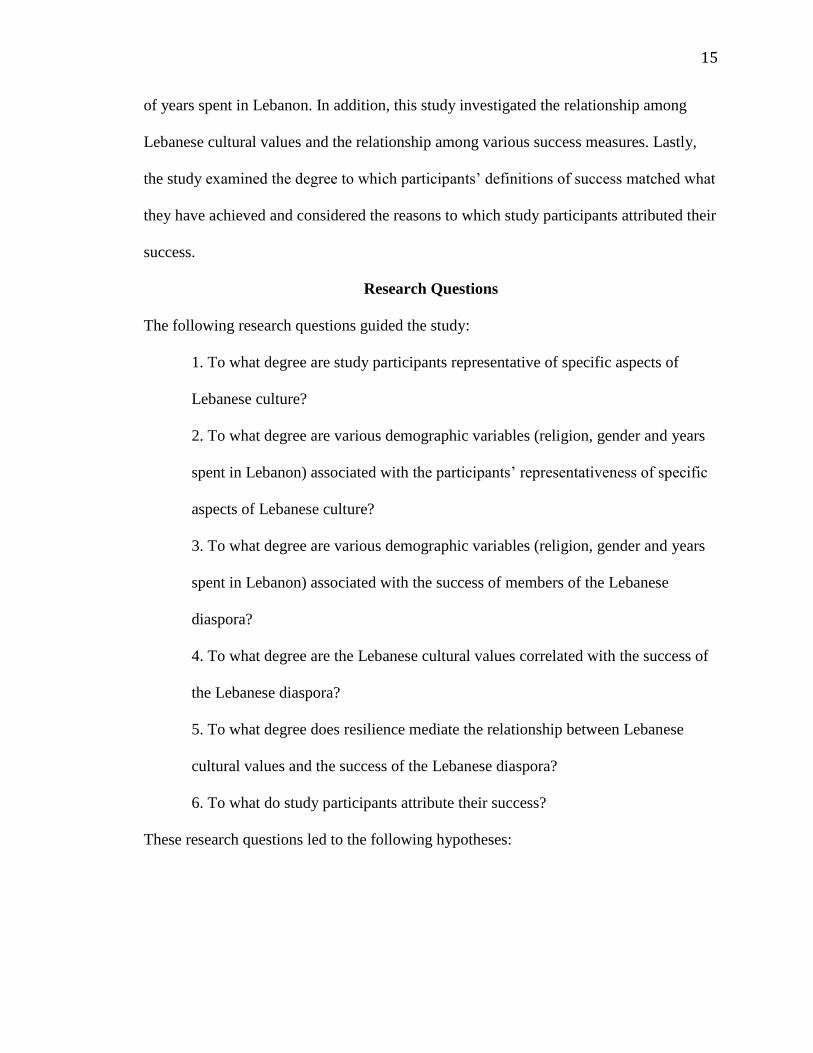
Research Questions
The following research questions guided the study:
1. To what degree are study participants representative of specific aspects of
Lebanese culture?
2. To what degree are various demographic variables (religion, gender and years
spent in Lebanon) associated with the participants’ representativeness of specific
aspects of Lebanese culture?
3. To what degree are various demographic variables (religion, gender and years
spent in Lebanon) associated with the success of members of the Lebanese
diaspora?
4. To what degree are the Lebanese cultural values correlated with the success of
the Lebanese diaspora?
5. To what degree does resilience mediate the relationship between Lebanese
cultural values and the success of the Lebanese diaspora?
6. To what do study participants attribute their success?
These research questions led to the following hypotheses:
16
1. The Lebanese Diaspora will not demonstrate the unique cultural values of
adversity, learning, assimilation, masculinity, jealousy, comparing oneself to
others, superiority, insecurity, uncertainty acceptance and impulse control.
2. Demographic variables (religion, gender, years spent in Lebanon) will not be
correlated with the participants’ representativeness of Lebanese cultural values.
3. Demographic variables (religion, gender, years spent in Lebanon) will not be
correlated with the success of members of the Lebanese diaspora.
4. The Lebanese cultural values will not be associated with the success indicators.
4.a. The unique Lebanese cultural values will not be associated with the
cultural values of adversity, learning, assimilation, masculinity, jealousy,
comparing oneself to others, superiority, insecurity, uncertainty
acceptance and impulse control.
4.b. Success measures will not be associated with the success indicators of
income, education level, job value, remittances sent and happiness as
measured by: current income, income growth, current education,
education growth, current remittances sent, remittances sent growth,
current job value, job value growth and current happiness.
5. The relationship between the independent variables of cultural values and the
dependent variables of success will not be either fully or partially explained by
resilience.
6. The participants’ identified reason for success will not match their lived
experience as measured by the cultural values of adversity, learning, assimilation,

17
masculinity, jealousy, comparing oneself to others, superiority, insecurity,
uncertainty acceptance and impulse control.

18
CHAPTER TWO
A REVIEW OF THE LITERATURE
Many Lebanese entrepreneurs and business people worldwide have proven to be
very successful in a variety of contexts and sectors. Cultural values and lived experiences
are likely to play a role in this success. However, the reasons for this success have not yet
been systematically studied. Therefore, there is a pressing need for studies that identify
the factors that may have led to the success of the diaspora. The results would not only
shed light on the Lebanese diaspora’s success, but also inform and predict how other
groups can succeed in new environments. Therefore, this study examined how a number
of individuals who make up the Lebanese diaspora in the United States and who migrated
to this country from Lebanon account for their success. This study relied on a cultural
values framework, theories of resilience and theories of success.
This chapter expands on this study’s theoretical framework. First, I will start by
examining key implications of national culture including values, cognitive schema,
demeanor and language. The following section describes the cultural values that are the
basis of this study. These cultural values originate from Hofstede’s cultural dimensions,
Chua and Rubenfeld’s (2014) triple package theory and the findings of a previously
conducted pilot study. Next, I will examine theories of resilience and investigate the
relationship between cultural values and resilience. Following that, various success
outcomes will be explored including job value, income, remittances sent, educational
attainment and happiness/life satisfaction. Finally, this chapter considers the relationship
between resilience and success.

19
Implications of Culture
Cultural research informs us about the unique traits and values of any given
society. Hambrick et al. (1998) affirm that nationality is a potent factor in explaining
individuals’ psychological attributes and behavior. The authors suggest that nationality
affects a person’s values, cognitive schema, demeanor and language. The influence of
national culture in shaping the values of individuals has been examined in several studies.
For instance, a study by England (1975), which compared managers from the United
States, japan, Australia, Korea and India, found that nationality accounted for 30 to 45
percent of variation in managers’ values. Moreover, studies conducted by Sutton,
Seymour, James (1956) and Chatov (1973) concluded that the values, which business
executives bring to their tasks, are predominantly due to national systems of beliefs.
Lord and Foti (1986) note that one’s cognitive schema is what one knows,
assumes or perceives about the world at hand. Studies suggest that national culture affects
a person’s cognitive schema (Hambrick et al., 1998). This can include knowledge of
facts, events and trends, knowledge or assumptions of future events and knowledge about
alternatives (Maruyama, 1980). To some extent, nationality-derived differences in
cognitive schema are due to differences in values. Furthermore, a substantial body of
research has dealt with the differences in demeanor or outward physical behavior, of
people of different nationalities. For example, differences in eye contact, punctuality,
conversational style, interruption patterns, physiological reactions to emotional stimuli
and other types of behavior have been associated with nationality by various researchers
(Gudykunst and Ting-Toomey 1988; LaFrance and Mayo 1978; Mesquita and Frijda
1992). Such superficial behavior may seem not as significant as values. However, often

20
times, small and seemingly trivial types of behavior may affect the assimilation or
isolation of members in a new culture. In addition, these behaviors can influence the
breakdown or cohesiveness in resulting in in communication (Hall, 1982).
One’s nationality not only determines what will be an individual’s primary
language, but it also affects the likelihood of knowing other languages and which specific
languages will be easily comprehended (Church, 1992). For example, the languages that
Europeans are most likely to know are those that use Western-style alphabetic characters,
not the characters of Middle Eastern or Asian scripts. Conversely, Japanese individuals
are more likely to gain fluency in Mandarin Chinese than with Spanish (Hambrick et al.
1998). Therefore, it can be inferred that one’s nationality affects one’s language
repertoire. The influence of language proficiencies after immigrating to a new country is
profound. For instance, an individual’s facility with the country’s language greatly
impacts one’s amount and type of participation in addition to one’s influence in the
society (Gudykunst, 1991). These attributes, in turn, not only shape the person’s behavior
in the new culture, but also how other members perceive the individual.
The Lebanese nationality affects people’s values, cognitive schema, demeanor
and language. In Lebanon, people value education, family and success. Additionally, the
Lebanese tend to maintain eye contact and favor a more informal conversational style. In
Lebanese culture, covert and implicit messages are prevalent. Furthermore, conversations
often include metaphors and reading between the lines. The Lebanese regard time as open
and flexible and punctuality is not highly valued. Lastly, while Arabic is the official
language in Lebanon, all students in Lebanon are required to learn second and third
languages. French and English are the two most commonly spoken languages in Lebanon

21
after Arabic. The following sections expand on this study’s cultural values framework.
Cultural Values Framework
This study’s theoretical framework encompasses Hofstede’s cultural dimensions,
Chua and Rubenfeld’s (2014) triple package theory and pilot study findings. The
following parts discuss Hofstede’s dimensions and seek convergence among various
models of national culture.
Hofstede’s Cultural Dimensions
Hofstede’s cultural model encompasses six dimensions including individualism
versus collectivism, power distance, indulgence versus restraint, uncertainty avoidance,
long term versus short term and masculinity versus femininity (Nardon and Steers, 2011).
This model of national culture represents independent preferences for one state of affairs
over another that distinguishes countries rather than individuals from each other. As I
mentioned earlier in chapter 1, according to Hofstede (n.d), Lebanese society has a large
power distance, is collectivistic, masculine and is a culture of restraint. Next, I will
examine the dimensions of power distance, individualism versus collectivism,
masculinity versus femininity, uncertainty acceptance versus uncertainty avoidance and
lastly indulgence versus restraint. The following sections also seek connections between
Hofstede’s dimensions and various other cultural models including Schwartz, GLOBE,
Kluckon and Strodtbeck and Trompenaars.
Power distance. The first common theme running through the various models
relates to how individuals within a society structure their power relationships. In other
words, is power in a society distributed based primarily on vertical or horizontal
relationships? Hofstede (1980) refers to this as power distance. According to Hofstede

22
(1980), power distance expresses the degree to which the less powerful members of a
society accept and expect that power will be distributed unequally. Embedded in this
dimension is the question of how a society handles inequalities among people. It is
important to point out that the power distance lies with the people at the bottom and not
the top. People in societies exhibiting a large degree of power distance accept a
hierarchical order in which everybody has a place and which needs no further
justification (Hofstede, 1980). Some cultures, particularly those in several Asian, Arab
and Latin American countries, believe that it is beneficial for some members of a group
or society to exert considerable control over their subordinates. Conversely, in societies
with low power distance, people strive to equalize the distribution of power and demand
justification for inequalities of power. In these cultures, inequality is perceived as wrong
and should be reduced if possible (Hofstede, 1980). Cultures with a small power distance
believe in a more egalitarian or participative approach to social or organizational
structure. In addition, they expect subordinates to be consulted on key issues that affect
them and will accept strong leaders to the extent that they support democratic principles
(Nardon and Steers, 2011).
Schwartz (1994) recognizes a similar cultural dimension, which he calls hierarchy
and egalitarianism. The unequal distribution of power, roles and resources is legitimate in
hierarchical societies. Moreover, individuals are socialized to comply with obligations
and roles according to their hierarchical position and are sanctioned if they do not.
Conversely, in egalitarian cultures, individuals are seen as moral equals and are
socialized to be committed to voluntary cooperation with others. According to Schwartz’
research, China, Thailand and Turkey are hierarchical cultures. On the other hand,

23
Denmark, Sweden and Norway are egalitarian cultures (Nardon and Steers, 2011). The
GLOBE study also includes a cultural dimension referring to the power distribution in
society. However, this model of national culture adds the issue of gender egalitarianism,
which refers to the degree to which gender differences are minimized.
Lebanon scores high on this dimension (score of 75), which means that people
accept a hierarchical order in which everybody has a place and which needs no further
justification (Hofstede, n.d.). This cultural dimension is vital to this study because of its
strong implications on the relationships among individuals. For example, an individual
from large power distance societies, such as Lebanon may crave centralization and have
hierarchical decision-making processes with limited one-way participation and
communication. Conversely, members from small power distance societies, such as the
United States may seek decentralization and expect to be consulted when it comes to their
work. The next section explores the individualism versus collectivism cultural dimension.
Individualism versus collectivism. Kluckon and Strodtbeck (1961) suggest that
there are important variations in how individuals relate to each other across cultures.
They classified cultures in three types: individualistic, collateral and lineal. According to
K&S (1961), in individualistic cultures, individual goals are considered more important
and people are encouraged to pursue their own personal interests at the expense of others.
In collateral cultures, individuals see themselves as part of a social group, formed by
laterally extended relationships. Finally, in lineal cultures, the group is equally important
but the nature of the group changes (Nardon and Steers, 2011).
Trompenaars differentiates between individualism, where people think of
themselves first and foremost as individuals and collectivism, where people think of

24
themselves as members of a group. In addition, GLOBE divided this dimension into
institutional and in-group individualism-collectivism. While institutional collectivism
refers to the extent to which society encourages collective distribution of resources and
collective action, in-group collectivism refers to the extent to which individuals express
pride, loyalty and cohesiveness in their particular organizations and families.
According to Hofstede (1980), individualistic cultures teach their people to be
responsible for themselves and that their job is to reap the rewards of their individual
endeavors. Moreover, individual achievement is admired and people should not be
emotionally dependent on organizations or groups. Conversely, in collectivistic cultures,
group interests are stressed over those of the individual. Moreover, personal relationships
and achieving harmony are an overriding societal objective (Hofstede, 1980). In
collectivistic cultures, one’s identity is difficult to separate from that of one’s group.
Group decision-making is preferred and groups protect their members in exchange for
unquestioned loyalty. Furthermore, collectivistic cultures believe that groups can only
attain their full potential as a member of a strong group. The United States and Western
European cultures tend to be individualistic, while Asian cultures tend to be mostly
collectivistic (Nardon and Steers, 2011). Lebanon, with a score of 40 is considered a
collectivistic society. This is manifested in the long-term commitment that people in a
Lebanon have towards their family and extended relationships (Hofstede, n.d.). In
addition, loyalty in a Lebanon is paramount and overrides most other societal rules and
regulations. Lebanese society fosters strong relationships where everyone takes
responsibility for fellow members of their group. The following section explores the
masculinity versus femininity cultural dimension.

25
Masculinity versus femininity. According to Hofstede (n.d.), a high score
(masculine) on this dimension indicates that the society will be driven by competition,
achievement and success. Success is defined here as the winner or the best at something.
This value system starts in school and continues throughout organizational life.
Conversely, a low score (feminine) on the dimension means that the dominant values in
society are caring for others and quality of life (Hofstede, n.d.). A feminine society is one
where quality of life is the sign of success and standing out from the crowd is not
admirable. The fundamental distinction between a masculine and a feminine society is
what motivates people. In a masculine society, wanting to be the best is what drives
people in life. Alternatively, in a feminine society, liking what you do is the main
motivator for people. In masculine countries, people “live in order to work” and
managers are expected to be assertive and decisive. Lebanon scores 65 on this dimension
and is thus a masculine society (Hofstede, n.d.). The next section explores the uncertainty
avoidance versus uncertainty acceptance cultural dimension.
Uncertainty avoidance versus uncertainty acceptance. Both Hofstede and
GLOBE call this dimension uncertainty avoidance. Hofstede focuses primarily on the
degree to which societies can tolerate uncertainty and use rules to control personal
behavior. However, GLOBE focuses on the degree to which societies attempt to reduce
uncertainty avoidance through rules and regulations (Nardon and Steers 2011). Hofstede
(n.d.) identifies uncertainty avoidance as the degree to which a society, organization or
group relies on social norms, values and procedures to alleviate unpredictability of future
events. According to Hofstede, the uncertainty avoidance dimension expresses the degree
to which the members of a society feel uncomfortable with uncertainty and ambiguity.

26
The fundamental issue here is how a society deals with the fact that the future can never
be known. Countries exhibiting strong uncertainty avoidance maintain rigid codes of
belief and behavior. Moreover, they are intolerant of unorthodox behavior and ideas.
Weak uncertainty avoidance societies or uncertainty accepting societies maintain a more
relaxed attitude in which practice counts more than principles (Hofstede, n.d.). While
uncertainty-avoiding societies crave formalization, uncertainty-accepting societies want
deregulation.
This cultural dimension has a big impact on immigration and assimilation. After
migrating to a new culture, often times, immigrants try to be fluid and adaptable to the
new environment. It is reasonable to think that individuals from uncertainty avoiding
cultures, such as Japan or France will experience more stress and anxiety than a group
consisting of uncertainty accepting cultures, such as India or China. Another important
implication of this cultural dimension on immigration is related to whether immigrants
stay in their host country or return to their country of origin. Members from uncertainty
accepting societies might be more likely to assimilate easier and stay in their host
country. Lebanon scores 50 on this dimension and therefore shows no clear preference
(Hofstede, n.d.). With that said, given the success of the Lebanese diaspora and their
ability to adapt and assimilate in new cultures, it is reasonable to think that Lebanese
society is more uncertainty accepting. Members of Lebanese society tend to feel
comfortable with uncertainty and ambiguity. Additionally, the Lebanese maintain flexible
codes of belief and behavior and are generally tolerant of unorthodox behavior and ideas.
The following section explores the indulgence versus restraint cultural dimension.
27
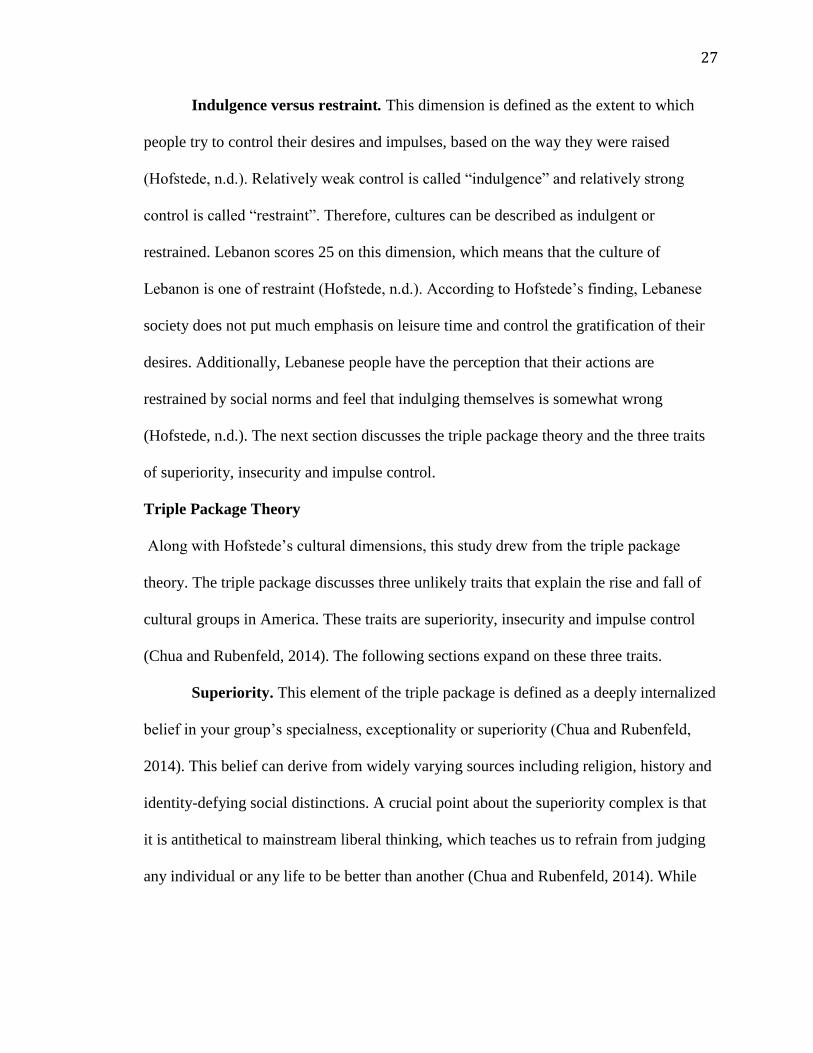
Indulgence versus restraint. This dimension is defined as the extent to which
people try to control their desires and impulses, based on the way they were raised
(Hofstede, n.d.). Relatively weak control is called “indulgence” and relatively strong
control is called “restraint”. Therefore, cultures can be described as indulgent or
restrained. Lebanon scores 25 on this dimension, which means that the culture of
Lebanon is one of restraint (Hofstede, n.d.). According to Hofstede’s finding, Lebanese
society does not put much emphasis on leisure time and control the gratification of their
desires. Additionally, Lebanese people have the perception that their actions are
restrained by social norms and feel that indulging themselves is somewhat wrong
(Hofstede, n.d.). The next section discusses the triple package theory and the three traits
of superiority, insecurity and impulse control.
Triple Package Theory
Along with Hofstede’s cultural dimensions, this study drew from the triple package
theory. The triple package discusses three unlikely traits that explain the rise and fall of
cultural groups in America. These traits are superiority, insecurity and impulse control
(Chua and Rubenfeld, 2014). The following sections expand on these three traits.
Superiority. This element of the triple package is defined as a deeply internalized
belief in your group’s specialness, exceptionality or superiority (Chua and Rubenfeld,
2014). This belief can derive from widely varying sources including religion, history and
identity-defying social distinctions. A crucial point about the superiority complex is that
it is antithetical to mainstream liberal thinking, which teaches us to refrain from judging
any individual or any life to be better than another (Chua and Rubenfeld, 2014). While

28
group superiority judgments are anathema, the authors state that every one of America’s
extremely successful groups fosters a belief in its own superiority.
Belonging to a group that you believe is superior at something, whether academic
work or sports, psychologically primes you to perform better at that activity. Moreover,
sociologists specializing in immigrant communities have found that certain groups turn a
sense of cultural pride and distinctive heritage into an “ethnic armor” directly
contributing to higher levels of educational achievement (Chua and Rubenfeld, 2014).
Beginning with the “stereotype threat” studies conducted by Claude Steele and Joshua
Aronson, hundreds of controlled experiments have shown that people’s performance on
various measures is dramatically affected by their belief that they are doing something
that their group is stereotypically good or bad at (Chua and Rubenfeld, 2014). Merely
reminding people of a negative group stereotype can worsen their performance. Thus,
black students score lower on standardized test questions when their test instructions
remind them about stereotypes concerning differential racial performance on tests. In
addition, white male Stanford students selected for their high math ability scored worse
on a difficult math test when told that the researchers were trying to understand “the
phenomenal math achievement of Asians.” Also, women chess players lost more online
games when reminded that men dominate chess rankings (Chua and Rubenfeld, 2014).
Researchers have also established the opposite effect, which is known as
stereotype boost. Asian undergraduates scored significantly better on math questions
when their instructions stated that “these types of tests measure individuals’ true
intellectual ability, which historically have shown differences based on ethnic heritage.”
In-depth studies of Asian and Hispanic American high school students in Southern

29
California found that Asian students were benefiting from a stereotype lift (Chua and
Rubenfeld, 2014). In a study including Vietnamese as well as Chinese American
students, sociologists Min Zhou and Jennifer Lee found that, even after controlling for
socioeconomic status, positive stereotypes and ingrained expectations about superior
Asian academic achievement significantly contributed to the exceptional academic
outcomes of the children of Asian American immigrants (Chua and Rubenfeld, 2014).
The most astonishing finding in these studies is the susceptibility of individuals to
even a one-sentence and subtle suggestion of a group stereotype. With that in mind,
imagine the boost you might derive if beliefs in your group’s superiority were part of the
culture you grew up in and were instilled by your parents and community from the day
you were born. According to Chua, the Lebanese are bolstered by the belief that, as
descendants of Phoenicians, that they are superior (Chua & Rubenfeld, 2014). When
speaking about their heritage, some Lebanese insist that they are Phoenician rather than
Arabs. This belief that the Lebanese are not Arabs and that they have their own culture
that is separate from that of the surrounding Middle Eastern countries may be
contributing to a stereotype boost. It is important to note that the authors of “The Triple
Package” insist that superiority alone is merely complacent. Furthermore, they assert that
only when superiority comes together with the other elements of the triple package, does
it generate drive, grit and success (Chua and Rubenfeld’s, 2014).
Insecurity. Insecurity is an anxious uncertainty about your worth or place in
society (Chua and Rubenfeld, 2014). Moreover, it is a feeling or worry that you or what
you have done or what you have is in some fundamental way not good enough. Insecurity
can manifest in the form of a sense of being looked down on, a perception of peril,

30
feelings of inadequacy or a fear of losing what one has (Chua and Rubenfeld, 2014).
Chua and Rubenfeld (2014) note that there is a deep tension between insecurity and a
superiority complex. It is odd to think of people being simultaneously insecure but also
convinced of their divine election or superiority. However, the authors believe that this
tense and unstable combination of insecurity and a superiority complex is precisely what
gives the triple package its potency (Chua and Rubenfeld, 2014).
In “The Triple Package”, Chua and Rubenfeld recount the story of Jacob J.
Jacobs. Jacobs, born in Brooklyn in 1916 to poor Lebanese immigrant parents, founded
one of the largest engineering and construction companies in the world. In his
autobiography, Jacobs describes how he and his fellow Lebanese Americans always felt
looked down on by America’s elite, which was especially stinging for Lebanese people
who were intensely proud of their heritage (Chua and Rubenfeld, 2014). The Lebanese,
he writes, are “descendants of the ancient Phoenicians,” who like the modern-day
Lebanese, were famous for being commercially successful wherever they went. Both
Greeks and Romans singled out the Phoenicians for their superior intelligence and
commercial acumen. The Phoenicians were also credited with inventing the alphabet,
arithmetic and glass (Chua and Rubenfeld, 2014). All this gave Jacobs, though a
peddler’s son, a superiority complex, which, combined with what he perceived as white
elite superciliousness, pushed him and other Lebanese Americans to succeed. Jacob’s
insecurity and drive also stemmed from his mother. Growing up, he recalls that there was
no escaping his mother’s “driving ambition” for her children. Jacobs recounts that his
mother was not unique in the Lebanese American community and that his Lebanese

31
American friends “were doubly driven to succeed” to show our parents and to show the
world (Chua and Rubenfeld, 2014).
The idea that insecurity can spur accomplishment is corroborated by numerous
studies showing that a personal feeling of not being good enough or not having done well
enough is associated with better outcomes. Howard Gardner found that insecurity,
particularly stemming from childhood, is a common driver of success (Chua and
Rubenfeld’s, 2014).
Impulse control. Impulse control refers to the ability to resist temptation,
especially the temptation to give up in the face of hardship or quit instead of persevering
at a difficult task (Chua and Rubenfeld’s, 2014). Impulse control runs powerfully against
the grain of contemporary culture. The term “impulse control” conjures up negative
connotations including people who are “too controlled”, “too controlling” and people
who cannot be “impulsive” and enjoy life. According to Chua and Rubenfeld (2014), we
believe that people who control their impulses do not live in the present and living in the
present is an imperative in modern society. We romanticize childhood and imagine it as a
time of what ought to be unfettered happiness. Furthermore, we grow fearful of spoiling
that happiness through excessive restraints, demands, hardships and discipline. The
authors assert that, by contrast, every one of America’s most successful groups takes a
very different view of childhood and of impulse control in general. The authors state that
America’s most successful groups tend to inculcate habits of discipline from an early age
(Chua and Rubenfeld, 2014).
Today, an entire subfield of experimental psychology is devoted to phenomena
variously called “effortful control”, “self-regulation”, “time discounting”, “ego strength”

32
and “willpower”. The results of these studies including the well known “marshmallow
test” are conclusive and bracing. Children with more impulse control go on to get better
grades, spend less time in prison, have fewer teenage pregnancies, get better jobs and
have higher incomes. In several studies, willpower and grit proved better predictors of
grades and future success than did IQ or SAT scores (Chua and Rubenfeld, 2014).
According to Chua and Rubenfeld’s (2014), superiority plus insecurity is a
formula for drive. In addition, the authors argue that superiority plus impulse control is a
formula for hardship endurance. Chua and Rubenfeld (2014) claim that when the triple
package brings all three elements together in a group’s culture, members of that group
become disproportionately willing and able to do or accept whatever it takes today in
order to make it tomorrow. The Lebanese’s belief that they are superior because of their
Phoenician ancestry plus their anxiety about their worth in society generated drive.
Additionally, their stereotype boost plus their ability to resist temptation created hardship
endurance.
Pilot Study
Along with Hofstede’s cultural dimensions and the triple package theory, this
study drew from the findings of a previously conducted pilot study.
Participants and data collection procedures. The pilot study examined how a
purposefully selected small number of individuals who make up the Lebanese diaspora in
the United States account for their success. This study employed a case study/cross-case
analysis design. The focus of the pilot study was on five members of the Lebanese
diaspora who now reside in Southern California. Qualitative one-on-one interviews were
the primary data collection procedure employed in this pilot study.

33
Data analysis and findings. The pilot study enlisted both narrative analysis and
analysis of narrative. The five individual case studies were constructed through a
narrative analysis approach. After the five cases were constructed, an analysis of
narrative was used to compare and contrast the cases. Table 3 summarizes the thematic
findings of this pilot study.
Table 3
Pilot Study Findings
Themes
Subthemes
Direct Quotes
Learning
1. Languages
2. Education
3. Will to Learn
“I only spoke Arabic when I moved to the U.S.”
“My parents emphasized the value of education”
“At 62, I would love to go back to school today.”
Personal
Adversity
1. Working at a young
age
2. Modest upbringings
3. Lack of
opportunities
3. Emigrating alone
“I worked at a young age to help pay for
school”
“My family was very poor”
“I had to beg people for a job”
“I did not know anyone when I moved here”
Assimilation
1. Appreciation for the
“I am grateful for the opportunities that I was

34
United States
2. Open-mindedness
provided in the U.S.”
“I was willing to the American culture and
way of life”
A sense of
being
worthy
1. Competition
2. Jealousy
3. Comparing oneself
to others
4. A superiority
complex
“I was very competitive with my friends and
even my cousins”
“Jealousy is common in Lebanese society…It
is not the ill-intentioned type. It drove us to
be better and more successful”
“If they have something then I should have it
too”
“I am just as capable as everyone else”
A deep fear
of failure
1. A sense of
insecurity
2. Feelings of shame
“Every time I thought about going back
home, I feared that I would be perceived as a
failure”
“When I went back to Lebanon, my friends
were now ahead if me and I was deeply
ashamed”

35
Discussion.
Learning. Lebanon’s unique position between East and West makes it very
receptive to other cultures and languages. Bacha and Bahous (2011) stated that the
teaching of languages in pre-university education in Lebanon has been influenced by the
presence of foreign influences. While Arabic is the native language of most of the
Lebanese, French is referred to as the second language and is taught in most schools.
Moreover, English is the third language that students study in Lebanon. Although Arabic
is the native language of most Lebanese, it is very common for people to use a mixture of
all three languages during daily conversation.
All five participants talked about the education system in Lebanon and regarded it
as superior to education systems in other countries. Another prevalent theme in our
conversations was the importance that their families placed on education. The
interviewees talked about the emphasis that their parents put on learning, obtaining high
grades and pursuing college after High School. While this value is certainly not unique to
the Lebanese people, it is not shared among all cultures and societies. It is relevant to
note that all the participants have children of their own and they all shared how important
it was for their children to pursue higher education. The value of education was deeply
entrenched in them by their parents and today; they continue to replicate this behavior
and expectation with their own children.
Adversity. Personal adversity was a common thread in the participants’ lives. All
five interviewees shared stories of hardship and talked about a number of stressors. They
talked about having to work at a young age to support their parents. One of the
participants described his childhood years as the hardest years of his life. The

36
interviewees also talked about the scarcity of job opportunities in Lebanon. They
emphasized that the lack of job prospects was a significant stressor for them. In his book,
Taleb claimed that adversity causes a switch from what Daniel Kahneman calls System I
to System II thinking (Taleb, 2012). Kahneman argued that System I operates
automatically and quickly, with little or no effort and no sense of voluntary control.
Conversely, System II allocates attention to the effortful mental activities that demand it,
including complex computations. Kahneman stated that individuals actively utilize
System I in an effort to not have to engage the effortful (and lazy) System II (Kahneman,
2011). It is important to note that System I is biased to believe and confirm, focuses on
existing evidence while ignoring absent evidence and generates a limited set of basic
assessments. Moreover, ineffective and inefficient solutions to problems also occur due
to System I’s inability to understand logic.
Taleb asserted that when individuals are exposed to a stressor they are forced to
switch from a passive to an effortful way of thinking. In Taleb’s opinion, Lebanese
people have developed an inner stability and inner drive to succeed because of the
continued fear of chaos. After analyzing the interviews, it became clear that all five
interviewees experienced disorder throughout their lives. The types of stressors varied
between the participants but the presence of instability was the common theme across
their life stories.
Assimilation. When asked about their assimilation into the American culture, all
five interviewees used the word open-minded to describe their approach to this new
culture. They wanted to learn the English language as quickly as possible. They were
willing to shed some of their Lebanese habits in order to adapt to the American way of

37
living. In many ways, their open-mindedness and their ability to fit in helped them
develop a sense of belonging rather than feel like outsiders. In the same vein, this ability
to adapt quickly allowed them to be viewed as in-group prototypes.
A strong sense of being deserving and worthy of the best. All five participants
described themselves as competitive and they stated that competing with friends and
close family members was prevalent throughout their childhood. This finding is in line
with Hofstede’s masculinity dimension. In addition, the participants stated that Lebanese
people feel superior to others. When asked about the reasons for these feelings of
superiority, the interviewees provided a variety of answers to explain this trait. One
participant said that Lebanese people feel superior because they are generally highly
educated. Another person claimed that it is related to the pride that Lebanese people feel
towards their country and heritage. A third interviewee asserted that these feelings of
superiority stem from how hard-working Lebanese people are. Chua, the author discussed
earlier in this chapter, stated that any group that collectively believes they are inherently
better than any other has an advantage and this is what she describes as “a superiority
complex”.
A deep fear of failure. Feeling insecure was another theme that emerged during
the interviews. It is important to note that insecurity is the antithesis of entitlement.
Insecure individuals would feel that they have not done enough yet and that they still
need to prove themselves. This deep sense of insecurity could be compared to the
“Imposter syndrome” which is a term used to describe highly successful individuals who
believe they are frauds. In this study, all five participants shared their intention to move
back to Lebanon. Initially, their plan was to stay in the United States long enough to save

38
money and move back to their home country at some point in the near future. However, it
is this feeling of insecurity and the belief that they have not done enough yet that kept
them from going back. All five interviewees still feel like they have to prove themselves
even though from an outsider’s perspective they already have. In addition to cultural
values, and given the particularly tumultuous history of Lebanon, the ability to bounce
back has been suggested as a factor in the success of the population. Next, I will examine
theories of resilience and investigate the relationship between cultural values and
resilience.
Theories of resilience
Concept Definitions
The word resilience originates from the Latin verb resilire, or “to leap back” and
is defined in the Oxford Dictionary of English as being “able to withstand or recover
quickly from difficult conditions” (Soanes & Stevenson, 2006, p. 1498). The term’s roots
lie in science and mathematics. For example, in physics, resilience is considered the
“ability of a strained body to recover its size and form following deformation” (Geller et
al., 2003, p. 458). Lazarus (1993) cited the example of elasticity in metals, with a resilient
metal bending and bouncing back (instead of breaking) when stressed.
When used in relation to humans, numerous definitions of resilience have been
proposed in the psychology research literature. Despite the construct being
operationalized in a variety of ways, most definitions are based around two core
concepts: adversity and positive adaptation. Most researchers concur that, for resilience
to be demonstrated, both adversity and positive adaptation must be evident. Regarding
the term adversity, Luthar and Cicchetti (2000) stated that adversity “typically

39
encompasses negative life circumstances that are known to be statistically associated with
adjustment difficulties” (p. 858). Positive adaptation has been defined as “behaviorally
manifested social competence or success at meeting stage-salient developmental tasks”
(Luthar and Cicchetti, 2000, p. 858). The main antecedent of resilience is deemed
adversity and the main consequence is considered positive adaptation. Lebanon’s
turbulent history and the success of the diaspora appear to fit the conditions and
consequences of resilience.
During the past three decades, researchers proposed a number of theories of
resilience. The majority of these theories incorporate the notion that resilience is a
dynamic process that changes over time. In addition, most researchers acknowledge that,
within the process itself, the interaction of a wide range of factors determines whether an
individual demonstrates resilience. With the majority of resilience theories being specific
to particular populations, there is a call for a generic theory that can be applied across
different groups of people (Richardson, 2002). One such theory, which is commonly
cited in the resilience literature, is the metatheory of resilience and resiliency. This
particular theory can potentially be applied to different types of stressors and adversities
at various levels of analysis.
Defining Attributes
Six defining attributes were identified in the literature to be associated with the
concept of resilience (Walker & Avant, 2005). These attributes include
rebounding/reintegration, high expectancy/self-determination, positive
relationships/social support, flexibility and sense of humor. A quality of bouncing back
and moving on in life after adversity is present in resilience. The term “rebounding” is

40
found consistently in all aspects of resilience literature and it insinuates a positive
direction or response. In addition, “reintegration” is an expression found in contemporary
literature, which describes the process after disruption or adversity in which an individual
wants to return to a regular routine or “get back to normal.”
High expectancy and self-determination are also related to resilience. High
expectancy is a sense of purpose and achievement in life (Benard, 1991). This sense of
purpose may be internal or external. Moreover, self-determination is a feeling that
regardless of what the circumstances or barriers are in life, the individual will overcome
the barriers and excel. Positive relationships and social support are also defining
attributes. In studies with children, the presence of at least one healthy attachment to a
significant adult is omnipresent when resilience is identified (Anthony, 1974; Garmezy,
1991; Luthar et al., 2000; Masten, 1994; Rutter, 1987; Werner & Smith, 1992). For
adults, social support and meaningful relationships with at least one peer or family
member are consistent with resilient outcomes (Flach, 1997; Richardson, 2002; Tusaie &
Dyer, 2004). These relationships provide opportunities for communication and support
and are important not only in their existence, but within the context that the individual
perceives them as being healthy quality (Tusaie & Dyer, 2004). Chua and Rubenfeld
(2015) state that superiority and insecurity is a formula for drive. Similar to high
expectancy, drive is a sense of purpose and achievement in life. Additionally, the authors
argue that superiority plus impulse control is a formula for hardship endurance. Similar to
self-determination, hardship endurance is the ability to overcome barriers and excel in
life.

41
Lastly, flexibility and a sense of humor have also been found to be associated
with resilience. The term “flexibility” captures the essence of adaptability, being
cooperative and tolerant and having an easy temperament. Across all resilience studies,
variations of these qualities surface repeatedly (Blechman & Culhane, 1993; Garmezy,
1991; Luthar & Cicchetti, 2000; Masten, 1994; Richardson, 2002; Rutter, 1987; Wenner
& Smith, 1992). The quality of having a sense of humor about life situations and about
one’s self is consistent across all resilience studies of all ages. Sense of humor plays an
important role in the ability to make light of adversity, to enhance coping mechanisms
and to moderate the intensity of emotional reactions (Anthony 1974; Bernard, 1991;
Garmezy, 1991; Masten, 1994; Richardson, 2002; Rutter, 1987; Werner & Smith, 1992;
Wolin & Wolin, 1993). Furthermore, the literature on self-esteem and self-efficacy in
relation to resilience is vast. Self-esteem and self-efficacy are often credited with the
answer to “why some people snap and others snap back.” Self-esteem and self-efficacy
are present in children and adults both innately and from mastery of previous
experiences. Self-esteem and self-efficacy are also related to Chua and Rubenfeld’s
(2015) claim for hardship endurance. As mentioned above, the authors argue that the
combination of superiority and impulse control is a formula for hardship endurance.
Antecedents and Consequences
According to Walker and Avant (2005), defining the antecedents and
consequences in a concept analysis is often ignored or taken lightly, but may serve as a
considerable tool in understanding the social contexts and how the concept is generally
applied. Antecedents are the events or incidents that must occur prior to the occurrence of

42
the concept and consequences are those events that occur as a result of the occurrence of
the concept (Walker & Avant).
The main antecedent to resilience is adversity. Challenge, change and disruption
are all aspects of adversity that occur before the process of resilience can happen. In their
Resiliency Model, Richardson, Nieger, Jensen and Kumpfer (1990) propose that
individuals, reacting to disruptive events, choose consciously or unconsciously to
reintegrate. It is the disruption that allows an individual to learn or tap into resilient
qualities and achieve resilient reintegration (Richardson, 2002).
In her article on fostering resilience in children, Bernard (1995) identifies
characteristics of families, schools and community environments that enable individuals
to circumvent life stressors and manifest resilience despite risk. The author groups these
characteristics or “protective factors” into three main categories including caring and
supportive relationships, positive and high expectations and opportunities for meaningful
participation. The presence of at least one caring person provides support for healthy
development and learning. Werner and Smith’s (1989) study, covering more than 40
years, found that, among the most frequently encountered positive role models in the
lives of resilient children, outside of the family circle, was a favorite teacher who was a
confidant and positive model for personal identification. In addition, research has
indicated that schools that establish high expectations have high rates of academic
success. The author states that through relationships that convey high expectations,
students learn to believe in themselves and in their futures, developing the critical
resilience traits of self-esteem, self-efficacy, autonomy and optimism. Lastly, the article

43
asserts that opportunities for participation and giving back foster all the traits of
resilience.
The significant outcomes or consequences of resilience are effective coping,
mastery and positive adaptation. Regardless of the degree of these consequences, their
presence is a consistent outcome of the concept of resilience. Effective coping is best
described as effectively managing the adversity one is faced with in order to function at
an optimal level. Mastery is defined as possessing great skill or knowledge and the term
“mastery” is found frequently in self-efficacy literature. Lastly, positive adaptation occurs
when an individual is rebounding or recovering from a disruptive or adverse event and
the recovery is beneficial or effective.
Similar Concepts
The concept of “hardiness” is similar to resilience. “Hardiness” is defined as
“robust or able to withstand adverse conditions.” Hardiness is the term that most closely
connotes resilience to many people. Unlike resilience, hardiness is a personality trait
(Bonanno, 2004). Evidence suggests that hardiness may help buffer exposure to extreme
stress (Kobasa, Maddi & Kahn, 1982), but the central difference between resilience and
hardiness is that resilience results in an improved or enhanced adaptive outcome, whereas
hardiness allows individuals to endure significant adversity but there is not necessarily a
positive change in outcome. These concepts are connected to Lebanon’s tumultuous
history and experiences of adversity. Taleb (2012) asserted that the Lebanese people have
gained from disorder. In the author’s opinion, Lebanese people have developed an inner
stability and inner drive to succeed because of the continued fear of chaos.

44
Resilience Scales
While several scales have been developed, they have not gained wide acceptance
and no one scale has established primacy. With this in mind, the Connor-Davidson
Resilience Scale was developed as a brief self-rated assessment to help quantify
resilience and as a clinical measure to assess treatment response. The content of the scale
was drawn from a number of sources including Kobasa (1979), Rutter (1985), Lyons
(1991) and Shackleton. In particular, the construct of hardiness was drawn from Kobasa’s
(1979) work. In addition, action orientation, strong self-esteem/confidence, adaptability
when coping with change, humor in the face of stress and secure/stable bonds were
drawn from Rutter’s (1985) work. Moreover, items assessing patience and the ability to
endure stress or pain were pulled from Lyons (1991) and the role of faith and belief in
benevolent intervention were drawn from Shackleton’s experiences. With the above
considerations, the CD-RISC was constructed in order to develop a valid and reliable
measure to quantify resilience and to establish reference values for resilience in the
general population and in clinical samples.
The Connor-Davidson Resilience scale (CD-RISC) comprises of 25 items, all of
which carry a 5-point range of responses, as follows: not true at all (0), rarely true (1),
sometimes true (2), often true (3) and true nearly all the time (4). The scale is rated based
on how the subject has felt over the past month. The total score ranges from 0-100, with
higher scores reflecting greater resilience. The CD-RISC has been tested in the general
population as well as in clinical samples. This measure demonstrates sound psychometric
properties with good internal consistency and test-retest reliability. In 2007, a study at the
University of California San Diego, examined the psychometric properties of the CD-

45
RISC. The explanatory factor analysis showed that the CD-RISC had an unstable factor
structure and as a result a series of empirically driven modifications were made, resulting
in a 10-item unidimensional scale that demonstrated good internal consistency and
construct validity. The next section explores the relationship between culture and
resilience.
Relationship between Culture and Resilience
Another critical component in understanding processes in resilience is the role of
culture. Similar to the way biological evolution has equipped humans with many adaptive
systems, cultural evolution has produced a host of protective systems. Cultural traditions,
religious rituals and community support provide a wide variety of protective functions.
Specific healing, blessing and purification found in many cultures and religions around
the world may serve to counteract or ameliorate the impact of devastating experiences
among people in a particular culture Crawford, Wright & Masten, 2006). Similarly,
among minority groups in society, factors such as strength of ethnic identity, competence
and comfort in relating to members of different groups are particularly important in
dealing with challenges that arise due to experiences of oppression and discrimination
within the context in which they live (Szalacha et al., 2003; Wright & Littleford, 2002).
The movement away from an individually based conceptualization of resilience
and towards a contextually situated framework has been a welcome one from the
perspective of various cross-cultural researchers (Aponte, 1994; Boyd-Franklin & Bry,
2000; Hill, 1999). While some of the factors that have been identified as fostering
resilience focus on individual functioning, the function of these factors may be culturally
influenced or may interact with cultural demands and expectations. The authors state that

46
for various cultural/ethnic groups, there can be a great deal of difference in the relative
importance placed on individualism and collectivism and these dimensions might mediate
resilience in different ways for different groups (Gaines et al., 1997; Kim et al., 1994).
For example, it is possible that the collectivistic or masculine nature of Lebanese society
is mediating resilience for the Lebanese. Cultural values, particularly the triple package,
in combination with resilience may be the best predictors of the Lebanese diaspora’s
success.
Defining Success
This study’s primary goal is to explain the success of the Lebanese diaspora. It is
therefore essential to consider various definitions of success. The following sections
explore five measures of success including earned income, educational attainment, job
value, remittances sent and happiness.
Income and Educational Attainment
Earned income and educational achievement are two of the most common
measures of success. Chua & Rubenfeld (2014) relied primarily on income data to
determine who the most successful cultural groups in America are. Based on the table
below, it is clear that Lebanese in the United States earn on average significantly more
than the overall population in the U.S. Also, the percentage of Lebanese with Bachelor’s,
graduate or professional degrees is higher than the percentage for the overall population
in the United States.

47
Table 4
Income and Educational Achievement Data
Subject
United States
Lebanese in
U.S.
Total Population 321,418,821 508,054
Educational Attainment
Population 25 years and over 216,447,163 337,504
Less than high school diploma 12.9% 6.5%
High school graduate 27.6% 16.1%
Some college or associates degree 29.0% 26.0%
Bachelor’s degree 19.0% 29.6%
Graduate or professional degree 11.6% 21.8%
Income in the past 12 months
Households 118,208,250 194,278
Median household income (dollars) $55,775 $74,757
Mean earnings (dollars) $79,909 $107,047
Families 77,530,756 123,557
Median family income (dollars) $68,260 $90,456
Individuals 321,418,821 508,054
Per capita income (dollars) $29,979 $40,972
Median earnings (dollars) full-time, year-round workers:
Male $49,938 $68,957
Female $39,940 $50,404
Note. Source: 2015 American Community Survey 1- Year Estimates
48
Job Value
Along with income and education, job value is also an important measure of
success. Having a particular occupation is associated with levels of financial earnings,
stress, social prestige, physical exertion, autonomy, non-monetary benefits, intellectual
engagement, exposure to hazardous materials and scheduling flexibility. There are vast
differences in how occupation has been measured and operationalized. Many researchers
classify subjects’ occupations as belonging to one of several nominal categories, such as
“white-collar” or “blue collar”. Warren and Kuo (2000), insist that while the “white
collar” versus “blue collar” seems to be based on simplicity and convenience, the authors
argue that categorical schemes for expressing occupations adequately capture the full
impact of what people do for a living if workers within a particular category are
homogeneous with respect to job-related circumstances such as pay, occupational hazards
and levels of autonomy and authority.
Some social scientists use more refined systems to classify subjects’ occupations
into one of several hundred categories that can be ranked hierarchically in terms of some
objective criteria and treated as a continuous variable. For instance, subjects’ occupations
might be classified as belonging to one of the 501 categories of the 1990 U.S. Census
Occupational Classification. Several distinct characteristics of these 501 occupations
including earnings, prestige, education and injury rates have been gathered from various
sources and can be matched to the Census classification.
Remittances Sent
Remittances can also be a key measure for success. Remittances are the portion of
migrant income sent back to the country of origin to support families and friends on the

49
micro level and the country as a whole on the macro level. According to Tabar (2010),
remittances can be loosely defined as monetary flows that include a portion of the
migrant income earned in the host country that is sent back to the country of origin in
either the tangible form of money or through goods (Hertlein & Vadean, 2006). In
migration literature, the term “remittances” generally refers to monetary transfers in cash
or goods. However, both the United Nations (UN) and the International Monetary Fund
(IMF) have defined the term "remittances" more broadly.
The IMF has stated that remittances include three categories of data. The first is
workers’ remittances and it encompasses transfers in cash or goods from migrants to
friends and family in the country of origin (Kapur, 2004). The second consists of
compensation to employees, which include the salaries and wages of individuals living
abroad, often seasonal or short-term workers, as well as those working in diplomatic,
foreign, and international missions. The third encompasses migrants’ transfers, which
includes capital transfers of financial assets by migrants as they move from one country
to another. The UN has defined remittances more formally, claiming that they consist of
any “financial resource flows arising from the cross-border movement of nationals of a
country” (Kapur, 2004). Remittances have been shown to be the most stable source of
financial inflow for some countries, especially those undergoing times of crisis (Kapur,
2004). In particular, remittances have proven to be a survival line for countries
undergoing times of cyclical violence, war or instability.
The Lebanese diaspora plays a large role in influencing economic growth and
development in Lebanon. Not only do remittances significantly enhance the economic
status of many Lebanese who have family members in the diaspora, but they also play a

50
key role in promoting and maintaining stability in the Lebanese economy. In Lebanon,
remittances are the top source of foreign exchange earnings in Lebanon. According to the
World Bank, Lebanon’s remittances have been increasing yearly. Lebanon’s estimated
remittance flow in 2008 reached US $6 billion, an increase of four percent since 2007
(Project Middle East, 2010). Lebanon ranked 18th on the list of countries with the largest
amounts of remittances received in 2008. The World Bank estimated remittances to
Lebanon in 2007 were equal to 24.4 percent of the GDP in 2007, the fifth highest ratio in
the world behind Honduras, Lesotho, Moldova, and Tajikistan, and the highest in the
MENA region. This financial contribution is vital in maintaining the economic stability
of the country, especially during times of war, civil strife, and political insecurity. It is
reasonable to believe that there is a connection between the amount of remittances sent
back to the country of origin and the individual’s success in the host country.
Happiness/Life Satisfaction
Along with income, educational achievement, job value and remittances,
happiness can be a measure of success. The term happiness carries many different
meanings and a consensus of the use of the word has never emerged. In the last few
decades, social scientists have expanded the definition of happiness to include both
objective and subjective wellbeing. Objective wellbeing includes concepts such as
stability, hardiness, stability, economic prosperity and progress. Subjective wellbeing
encompasses concepts such as job satisfaction, self-esteem, contentment, and life
satisfaction (Veenhoven, 1980). While there are various concepts that can capture the
meaning of happiness, this study focused on happiness in the sense of life satisfaction.

51
Life satisfaction is conceived as the degree to which an individual judges the
overall quality of his/her life as a whole favorably. Research on the conditions that
promote happiness shows that happy individuals are more likely to be found in
economically prosperous countries, where freedom and democracy are valued and the
political state is stable (Veenhoven, 1984a and 1984b). The happy are more likely to be
found in the majority groups than among minorities. In addition, they are more often at
the top of the social ladder rather than at the bottom. Research also shows that happy
individuals are typically married and have good relationships with family and friends.
Campbell et al. (1976) found that certain domains of satisfaction were very
important for satisfaction with life-as-a-whole. The most important domains were family
life, marriage and friendship. According to Veroff et al. (1981), the spouse is the greatest
source of satisfaction followed by close relatives and friends. In a number of studies
(Cochrane 1988 & England 1981), it has been found that simply being married puts
people at a lower risk of mental illness. In addition, according to Brown and Harris
(1978), the quality of the relationship also counts. They found that women who had
experienced stressful life events were less likely to be depressed if they had a supportive
spouse.
Work is also a major component of life satisfaction. A great deal has been written
about the meaning and function of work. Fineman (1987) claims that work is a key
source of identity, self-respect and social status. The author asserts that it is the most
central life activity, is intrinsically valuable and is difficult to separate from other aspects
of life. There are various theories of job satisfaction including Herzberg’s (1957) two-
factor theory, Maslow’s (1970) need theory, Locke’s (1976) comparison theory and

52
Adams’ (1965) equity theory. Lastly, leisure is defined as what people do in their free
time because they want to, for its own sake, and not for material gain. Leisure activities
include sport, hobbies, clubs, volunteer work and home based leisure. Leisure activities
are often positively associated with happiness and life satisfaction. The following section
examines the relationship between resilience and success.
Relationship between resilience and success
Various bodies of literature explore the connection between resilience and
important success outcomes. Literature regarding entrepreneurship suggests that the
resilience of the entrepreneur can help explain entrepreneurial success. In a study testing
the connection between resilience dimensions and the success of established
entrepreneurs in the Spanish tourism sector, the findings of this study provide supporting
evidence that within the framework of small companies, there is a positive association
between the resilience of entrepreneurs and the growth of their companies (Ayala and
Manzano, 2014). Furthermore, the results show that the three dimensions of resilience
(hardiness, resourcefulness and optimism) help to predict entrepreneurial success. In
particular, findings show that the key factor in predicting the success of the entrepreneur
is resourcefulness. Ayala and Manzano’s (2014) study adds to the empirical evidence that
entrepreneurs’ resilience has a positive influence on the explanation of entrepreneurial
growth and they back up the findings of previous studies such as those by Bhidé (2000),
Envick (2005), or Hayward et al. (2010).
A number of studies examined the relationship between resilience and wellbeing.
For example, Souri and Hasanirad (2011) examined the relationships between resilience,
optimism and psychological wellbeing. The results revealed that resilience is able to

53
predict psychological wellbeing. In addition, optimism played a minor mediation role in
the relationship between resilience and psychological wellbeing. The results indicated
that psychological wellbeing is influenced by personal characteristics such as resilience,
and the individual’s optimism regardless of his/her degree of resilience can to some
extent provide for psychological wellbeing. These results are consistent with the results
of Carver, Scheier, and Segerstrom (2010) and with Miller et al. (1996) as well.
Moreover, the results showed that people’s resilience might be rooted in their
cultural and religious values. In some societies, religion, faith and cultural values appear
to be the key elements in optimism. In addition, this optimism provides a great capacity
to adjust quickly to big changes. This result is consistent with the studies of Werner and
Smith (2001), Masten and Wright (2010), Pargament and Cummings (2010), and
Schumann (2002). There also seems to be an interactive relationship between these two
variables. In other words, studies found that resilience results in optimism and optimism
leads to resilience. These results are consistent with the studies of Carver, Scheier, and
Segerstrom (2010), Tusaie-Mumford (2001), and Bonanno (2005). Yu and Zhang (2007)
argue that optimism reflects individuals’ positive attitude towards adverse situations and
therefore considers optimism as an important aspect of resilience.
In line with this research, the previous studies have indicated that there appears to
be a positive relationship between optimism and wellbeing (Scheier and Carver, 1985).
Results of various studies show that resilience plays a key role in psychological
wellbeing (Tusaie-Mumford, 2001; Yu and Zhang, 2007; Yee Ho, Cheung and Cheung,
2010; Carver, Scheier, and Segerstrom, 2010; Karademas, 2006).
Lastly, in a study looking at the relationship between resilience and academic

54
success in undergraduate and graduate nursing students, researchers found that resilience
was strongly related to academic success in nursing students. The significant relationship
between resilience and academic success in this study supports the statements in the
literature that these concepts play an important role in persistence through the challenges
of education. Although to date there has been little research evidence on the relationship
between resilience and success in the workplace, Luthans et al. (2005) did find a
significant relationship between the resilience of the Chinese workers who were
undergoing significant change and transformation and their rated performance. In
addition, Maddi (1987) found that resilient employees in a firm undergoing a massive
downsizing maintained their health, happiness, and performance; Larson and Luthans
(2006) found the factory workers’ resiliency related to their job satisfaction; and Youssef
and Luthans (in press) found that employees’ level of resilience related to their
satisfaction, commitment, and happiness. It is clear that there is a strong connection
between resilience and key success outcomes.
Conclusion
This chapter presented the theoretical framework that frames this research.
Various cultural values originating from Hofstede’s cultural dimensions, Chua and
Rubenfeld’s (2015) triple package theory and the findings of a previously conducted pilot
study were explored. Next, theories of resilience and the relationship between cultural
values and resilience were examined. Following that, various success outcomes were
investigated and the relationship between resilience and success was considered.
Moreover, this chapter provided the foundation for this study and the rationale behind the
survey questions and the chosen variables.

55
CHAPTER THREE
RESEARCH DESIGN AND METHODOLOGY
This study examined how a number of individuals who make up the Lebanese
diaspora in the United States account for their success. In this chapter, the study
participants are described and the procedures for obtaining access to these participants
outlined. In addition, the survey instrument is explained and discussed in detail.
Participants
Along with a description of this study, the link to the survey was posted on
various Facebook groups and members of the Lebanese diaspora who belonged to these
groups were invited to participate in this study. The criteria for participation in this study
included:
1. Lebanese citizen.
2. Currently living in the U.S.
The majority of the Facebook groups chosen for data collection are private and
targeted specifically for Lebanese-Americans. These Facebook pages included “Lebanese
in America”, “Lebanese American Community Florida”, “Lebanese in New York”,
“Lebanese in Houston”, “Lebanese in Southern California”, “Lebanese in Washington
D.C.”, “Lebanese in Seattle”, “Chicago Lebanese Club”, “Bay Area Lebanese” and
“National Apostolate of Maronites Group”. I also posted the survey on a number of
university social clubs including UCSD, UCSB, UCLA and USC. The survey was also
posted on the social media pages of the Moise Khayrallah Center for Lebanese Diaspora
Studies and the Lebanese Emigration Research Center at Notre Dame University in
Beirut, Lebanon. After posting the survey on these pages, I asked group members to

56
share the link on their personal pages as well, in an effort to increase the participation
rate. Along with social media, snowball sampling was used. I reached out to family and
friends and asked them to share my study and survey with Lebanese-Americans in their
personal and professional networks.
Three hundred and ninety eight respondents completed the quantitative survey.
The table below compares the Lebanese population in the United States to this study’s
participants in an attempt to see how representative the sample was of the entire
population. The sample and the total Lebanese population are compared on a number of
important demographic data including gender, age, marital status, educational attainment
and income.
Table 5
Comparison between the Sample and the Population
Subject
Sample
Lebanese in U.S.
Total Population 398 508,054
Sex
Male 52.0% 50.1%
Female 48.0% 49.9%
Age
Under 5 years 0.0% 6.6%
5 to 17 years 0.0% 16.8%
18-24 years 10.0% 10.2%
25 to 34 years 26.0% 15.1%

57
35 to 44 years 23.0% 12.8%
45 to 54 years 20.0% 13.3%
55 to 64 years 15.5% 12.2%
65 to 74 years 4.0% 7.8%
75 years and over 1.0% 5.2%
Marital Status
Now Married 60.0% 50.6%
Widowed 1.0% 4.7%
Divorced 7.0% 8.6%
Separated 1.0% 1.0%
Never Married 31.0% 35.1%
Educational Attainment
Less than high school diploma 18.0% 6.5%
High school graduate 4.0% 16.1%
Some college or associates degree 6.0% 26.0%
Bachelor’s degree 23.0% 29.6%
Graduate or professional degree 49.0% 21.8%
Income in the past 12 months
Mean earnings (dollars) 145,787 107,047
Note. Source: 2015 American Community Survey 1- Year Estimates
In terms of gender, the sample is representative of the Lebanese population in the
United States. Males were slightly overrepresented in my sample compared to the
population in the U.S. The survey participants were slightly older than the Lebanese

58
population in the United States. In terms of marital status, the sample appears to be
representative of the Lebanese population in the United States. With respect to
educational attainment, there are some differences between both groups. The majority of
the Lebanese population in the U.S. falls in the Associate, Bachelor’s or graduate degree
categories. Conversely, almost 50% of the sample in this study has a graduate or
professional degree. In addition, 18% of the sample has less than a high school diploma
compared to only 6.5% of the Lebanese population in the U.S. The educational
attainment for the survey respondents was on the fringe rather than staggered across the
various levels. It appears that the majority of those who attended college and managed to
complete at least a Bachelor’s and in most cases a graduate or professional degree in
addition to their Bachelor’s degree. The mean earnings for this study’s participants were
$145,787 compared to $107,047 for the Lebanese population in the United States.
Data on religious preference was also collected from this study’s participants.
While there are no exact figures regarding the religious breakdown of Lebanese
Americans in the United States, multiple sources indicate that the majority are Christians.
Furthermore, various sources state that the vast majority of Lebanese Christians in the
United States belong to the Maronite denomination. Christians constituted the majority of
the sample with Maronite Christians being the largest denomination. With that said, the
survey captured a number of other religious groups including Sunnis, Shi’as and Druze.
In terms of age of immigration, the demographic data showed that approximately 73% or
278 participants spent at least the first 14 years of their life in Lebanon. In addition, the
study collected data on the number of years that the participants have spent in the United
States. According to the data presented later in chapter 4, 52% of the participants have

59
been living in the United States for more than 21 years, 77% of participants have been
living in the United States for more than 10 years and 87% of participants have been
living in the United States for more than 5 years.
Measures
To answer my research questions, a quantitative survey of members of the
Lebanese diaspora in the United States was conducted (see Appendix A). The purpose of
this survey was to test the participants’ representativeness of specific aspects of Lebanese
culture and correlate the degree of representativeness to personal success. Specific
aspects of Lebanese culture were derived from existing literature and a previously
conducted pilot study of members of the Lebanese diaspora in the United States. These
cultural aspects included but were not limited to experiences of adversity, emphasis on
education, high degrees of impulse control and high levels of comfort with uncertainty.
After determining the degree to which members of the Lebanese diaspora in the United
States are representative of each of these specific cultural aspects, their individual results
were correlated with their own personal success. Furthermore, the degree to which
resilience explains the relationship between the cultural values and the success measures
was explored.
This study also considered the impact of various demographics on the
participants’ degree of representation of specific aspects of Lebanese culture and key
success outcomes. These demographics included gender, religious preference and number
of years spent in Lebanon. In addition, this study investigated the relationship among
Lebanese cultural values and the relationship among various success measures. Lastly,
the study examined the degree to which participants’ definitions of success matched what

60
they have achieved and considered the reasons to which study participants attributed their
success (see Appendix A).
Table 6
Survey Details
Segment Characteristics Measured Type of Questions
1. Demographics
Gender, Age, Marital Status,
Immigration, Religion
Multiple choice,
Drop-down menu,
check boxes, short-
answer
2. Representativeness of
Cultural Characteristics
Adversity, Learning, Assimilation,
Competition/Masculinity,
Jealousy, Comparing Yourself to
Others, Superiority, Insecurity,
Uncertainty Acceptance, Impulse
Control
6-point Likert scale
(Strongly Agree -
Strongly Disagree)
3. Resilience
Connor-Davidson Resilience Scale
5-point Likert scale
(Not true at all - True
nearly all the time)

61
4. Success Indicators
Happiness/Life satisfaction
(Family life, social relationships,
job satisfaction and leisure
activities), Remittances sent,
Income, Education and Job value
(prestige, education, injury rates,
income)
6-point Likert scale
(Strongly Agree -
Strongly Disagree),
Drop-down menu
5. Perceptions of Success
Perceived reasons for own success
and personal definition of success
Multiple choice
The survey contained questions in five main segments. The first segment included
demographic questions. The second segment used 6-point Likert-scale questions to
explore the participants’ representativeness of ten specific aspects of Lebanese culture
and society. The third segment of the survey included a shorter and validated version of
the Connor-Davidson Resilience scale (CD-RISC). While the original scale contains 25
items, I used a refined version of CD-RISC that includes a 10-item measure of resilience.
All ten questions carried a five-point range of responses, as follows: not true at all, rarely
true, sometimes true, often true and true nearly all the time.
The fourth segment included a number of questions that measure personal
success. It is relevant to note that while income is the most common indicator for
personal success, this survey employed multiple indicators to measure this outcome

62
variable. These indicators included income, educational attainment, job value,
remittances sent and a happiness metric. Moreover, it is important to emphasize that this
survey also measured growth across these various success indicators. For instance,
participants were asked to disclose their current individual income in addition to their
earned income in the first year after immigration. Growth was also measured across the
educational attainment indicator, by asking participants to disclose the highest degree
they received prior to immigrating to the United States as well as the highest degree they
received since coming to the United States. Moreover, growth in remittances sent was
measured by asking participants to disclose the percentage of their income that they sent
to Lebanon in their first year after immigration and in the year of 2016. Lastly, growth
was measured across job title indicators by asking respondents to rate both their first job
after immigrating to the United States and their current job on four measures. These
indicators are earned income, education required for the job position, job prestige and
injury rate on the job. Combined, these four measures constituted the job value variable.
Along with income, education, job value and remittances sent, this survey focused on
happiness in the sense of life satisfaction. The fifth segment of this survey encompassed
questions that asked participants to choose their perceived reasons for success. In
addition, respondents were asked to indicate their personal definition of success.
Procedures
The survey was administered online through the Qualtrics platform. As discussed
earlier in this chapter, I posted the link of the survey on various Facebook groups. In
addition, using the snowball method, I sent the online link of the survey by email to

63
family members and friends and requested that they share the survey with other
Lebanese-Americans in their professional and personal networks.
In this study, I followed a two-contact strategy in an effort to increase the
response rate. The first invitation was posted on Facebook and clearly stated what is
being asked of the respondents, why they were selected, what the survey was about, who
was conducting it and how participants could contact someone to get any questions they
have answered. Moreover, the initial post explicitly stated that the data would be kept
confidential and information was provided about how to access the survey. A reminder
was posted on the same Facebook groups as the initial request to complete this survey. In
the second contact, I thanked those who participated in the survey and encouraged those
who had not yet filled out the survey to do so. I highlighted the fact that the study was
drawing to a close and emphasized the importance of their response. In addition, I
reiterated my previous request and asked them to share this study and survey with their
families and friends.
Table 7
Summary of Methodology
Phase
Procedure
End Product
Survey
development
Review literature and data
from previously
conducted pilot study
Thematic findings used to identify aspects
of Lebanese culture and develop a survey to
assess representativeness of these specific
cultural aspects

64
Quantitative
data
collection
Electronic based survey of
members of the Lebanese
diaspora
Test the hypothesis stating that the
participants will demonstrate unique aspects
of Lebanese culture.
Consider the impact of various
demographics on the participants’ degree of
representation of specific aspects of
Lebanese culture and key success outcomes.
Investigate the relationship among Lebanese
cultural values and the relationship among
various success measures.
Examine the degree to which participants’
definitions of success matched what they
have achieved and consider the reasons to
which study participants attributed their
success.
Quantitative
Descriptive statistics
Demographic data

65
data analysis
Factor analysis
Matched samples
Multiple Regression
Analysis
Independent Samples t-
Test
Descriptive statistics for all 10 cultural
variables and resilience. Descriptive
statistics for all five success variables
Factor analysis for all 10 cultural variables,
resilience and the happiness metric.
Reliabilities for the cultural variables in
addition to resilience
Demonstrate the impact of various
demographics on the participants’ degree of
representation of specific aspects of
Lebanese culture and key success outcomes.
Show the relationship between the cultural
values and the success indicators
Present the relationship among the cultural
values
Present the relationship among the success
indicators
Examine the degree to which participants’
definitions of success matched what they

66
have achieved
Consider the reasons to which study
participants attributed their success
Analysis
The survey analysis consists of five main parts. The first part encompasses
descriptive statistics for all the variables included in the analysis. This section attempts to
answer this study’s first research question and test the hypothesis stating that the
Lebanese Diaspora will not demonstrate the unique cultural values of adversity, learning,
assimilation, competition/masculinity, jealousy, comparing oneself to others, superiority,
insecurity, uncertainty acceptance and impulse control.
The second part of the analysis presents the results of the factor analysis for all 10
independent variables including adversity, education, assimilation, competition, jealousy,
comparing to others, superiority, insecurity, uncertainty acceptance and impulse control.
This includes descriptive statistics for each question within the individual constructs,
correlation tables and the results of the rotated component matrix for each construct. In
addition, descriptive statistics, correlation tables and rotated component matrices are
presented for both the resilience and happiness metrics. Finally, the reliabilities for each
of the independent variables in addition to resilience are illustrated.
The third part of the survey analysis offers the results of five matched samples
and the differences in means for both the cultural variables and success outcomes for
each matched sample. This analysis attempts to answer the second and third research
questions. The matched samples tests the hypothesis that various demographic factors

67
will have no impact on the participants’ representativeness of Lebanese cultural values
and no impact on the success of members of the Lebanese diaspora.
The fourth and most significant part of this analysis presents the results of
regression analyses divided into three main sections. In the first section, the 10 cultural
variables are the explanatory variables and the five success measures are the outcome
variables. This section tests the hypothesis indicating that the Lebanese cultural values
will not be related to the success indicators of income, education level, job value,
remittances sent and happiness/life satisfaction. Adding resilience to these models tests
the hypothesis that the relationship between the independent variables of cultural values
and the dependent variables of success will not be either fully or partially explained by
resilience. The second section considers a different set of regressions. After looking at the
relationship between the cultural variables and the outcome variables in the first set of
regressions, the second section examines the relationship among the cultural variables
themselves. These regressions test the hypothesis that the unique Lebanese cultural
values will not be related to the cultural values of adversity, learning, assimilation,
competition/masculinity, jealousy, comparing oneself to others, superiority, insecurity,
uncertainty acceptance and impulse control. The third and last section considers the
relationships between the outcome variables. In this case, the success measures that were
initially treated as outcome variables are now acting as independent or dependent
variables depending on the specific regression. These regressions test the hypothesis that
the success measures will not be related to the success indicators of income, education
level, job value, remittances sent and happiness/life satisfaction as measured by: current
income, income growth, current education, education growth, current remittances sent,

68
remittances sent growth, current job value, job value growth and current happiness/life
satisfaction.
Lastly, the fifth segment of the analysis focuses on the final research question and
tests the hypothesis that the participants’ identified reason for success will match their
lived experience as measured by the cultural values of adversity, learning, assimilation,
masculinity, jealousy, comparing oneself to others, superiority, insecurity, uncertainty
acceptance and impulse control. In addition, this section tests the hypothesis that
members of the Lebanese diaspora will choose the definition of success that matches
what they have rather than what they hope to achieve.

69
CHAPTER FOUR
SURVEY FINDINGS AND ANALYSIS
This chapter presents the results of the quantitative survey described in chapter 3
and consists of five main parts. The first part encompasses descriptive statistics for all the
variables included in the analysis. This section attempts to answer this study’s first
research question and test the hypothesis stating that the Lebanese Diaspora will not
demonstrate the unique cultural values of adversity, learning, assimilation,
competition/masculinity, jealousy, comparing oneself to others, superiority, insecurity,
uncertainty acceptance and impulse control. First, various demographic data including
gender, current age, marital status, religion, age of immigration to the United States and
the number of years that the participants have lived in the United States are presented.
Next, descriptive statistics for all 10 cultural variables and resilience are offered. Lastly,
descriptive statistics for all five outcome variables including educational attainment,
income, remittances sent, happiness and job value are illustrated in a number of tables.
The second part of this chapter presents reliabilities for each of the cultural
variables and resilience. In addition, the results of the factor analysis for all 10 cultural
variables including adversity, education, assimilation, competition, jealousy, comparing
to others, superiority, insecurity, uncertainty acceptance and impulse control are
presented. This includes descriptive statistics for each question within the individual
constructs, correlation tables and the results of the rotated component matrix for each
construct. Furthermore, this segment captures descriptive statistics, correlation tables and
rotated component matrices for both resilience and the happiness metric.
70
The third part of this chapter offers the results of five matched samples and the
differences in means for both the independent and dependent variables for each matched
sample. The first matched sample contrasts Christians and Muslims. The matched sample
tests the hypothesis that religious preference will have no impact on the participants’
representativeness of the cultural values of adversity, learning, assimilation,
competition/masculinity, jealousy, comparing oneself to others, superiority, insecurity,
uncertainty acceptance and impulse control. It also tests the hypothesis that religious
preference will have no impact on the success of members of the Lebanese diaspora as
measured by: current income, income growth, current education, education growth,
current remittances sent, remittances sent growth, current job value, job value growth and
current happiness/life satisfaction.
The second sample matches males to females. The matched sample tests the
hypothesis that gender will have no impact on the participants’ representativeness of
Lebanese cultural values. In addition, it tests the hypothesis that gender will have no
impact on the success of members of the Lebanese diaspora. The third, fourth and fifth
matched samples look at differences between groups based on the number of years they
lived in Lebanon. Stated more specifically, the third matched sample matches those who
were born in the United States to those who lived more than the first 14 years of their life
in Lebanon. The fourth matched sample matches those who lived less than the first 14
years of their life in Lebanon to those who lived more than the first 14 years in Lebanon.
The fifth and last matched sample matches those who were born in the United States to
those who were born in Lebanon (irrespective of the length of their stay in Lebanon).
Moreover, these analyses test the hypothesis that the number of years spent in Lebanon

71
will have no impact on the participants’ representativeness specific aspects of Lebanese
culture. In addition, they test the hypothesis that the number of years spent in Lebanon
will have no impact on the success of members of the Lebanese diaspora.
The fourth and most significant part of this chapter presents the results of
regression analyses divided into three main sections. In the first section, the 10 cultural
variables are the explanatory variables and the five success measures are the outcome
variables. This section tests the hypothesis indicating that the Lebanese cultural values
will not be related to the success indicators of income, education level, job value,
remittances sent and happiness/life satisfaction as measured by: current income, income
growth, current education, education growth, current remittances sent, remittances sent
growth, current job value, job value growth and current happiness/life satisfaction.
The purpose of these regressions is to examine if any of the cultural variables
have an effect on any of the outcome variables. An example of a regression would be
considering the effect of adversity, education, uncertainty acceptance, jealousy, impulse
control, insecurity, superiority, comparing to others, competition and assimilation on
current income. It is important to emphasize that four of the five outcome variables
(excluding happiness) are treated as both static and growth measures. Furthermore,
resilience is added to the regressions. Adding resilience to these models tests the
hypothesis that the relationship between the independent variables of cultural values and
the dependent variables of success will be either fully or partially explained by resilience.
The second section considers a different set of regressions. After looking at the
relationship between the cultural variables and the outcome variables in the first set of
regressions, the second section examines the relationship among the cultural variables

72
themselves. In this segment, the cultural variables are treated as independent variables or
dependent variables depending on the specific regression. These regressions test the
hypothesis that the unique Lebanese cultural values will not be related to the cultural
values of adversity, learning, assimilation, competition/masculinity, jealousy, comparing
oneself to others, superiority, insecurity, uncertainty acceptance and impulse control. An
example of a regression like this would be considering the effect of adversity, education,
uncertainty acceptance, jealousy, impulse control, insecurity, superiority, comparing to
others and competition on assimilation.
The third and last section considers the relationships between the outcome
variables. In this case, the success measures that were initially treated as outcome
variables are now acting as independent or dependent variables depending on the specific
regression. These regressions test the hypothesis stating that the success measures will
not be related to the success indicators of income, education level, job value, remittances
sent and happiness/life satisfaction as measured by: current income, income growth,
current education, education growth, current remittances sent, remittances sent growth,
current job value, job value growth and current happiness/life satisfaction. An example of
such a regression would be considering the effect of income, job value, educational
attainment and remittances sent on happiness.
Lastly, the fifth part of this chapter focuses on the last research question and
attempts to address the degree to which the participants’ definitions of success match
what they have achieved. The hypothesis states that members of the Lebanese diaspora
will choose the definition of success that matches what they have rather than what they
hope to achieve. Participants were also asked to choose their definition of success and

73
were provided five options including happiness, high income, impressive job title, high
educational attainment and financially supporting family in Lebanon. It is important to
note that each of these constructs was measured earlier in the survey. This analysis
compares the respondents’ definition of success to their score on that same construct. For
instance, the happiness score for all those respondents who identified happiness as their
definition of success was calculated. Then, their mean score was compared to the mean
score of all those respondents who identified any response other than happiness. The
purpose of this analysis is to examine whether the respondents’ definition of success
matched their score for the same construct. An example of this analysis would be whether
the respondents who chose high income as their definition of success are earning more
money than those who identified happiness or educational attainment as their definition
of success.
The second part of this analysis tests the hypothesis stating that the participants’
identified reason for success will match their lived experience as measured by the cultural
values of adversity, learning, assimilation, competition/masculinity, jealousy, comparing
oneself to others, superiority, insecurity, uncertainty acceptance and impulse control.
Participants were asked to select the statement that resonates the most with the reason for
their success after immigration. They were provided 10 distinct statements with each of
those statements corresponding to one of the cultural variables. The constructs for these
cultural variables were measured earlier in the survey. This analysis compares the
respondents’ chosen reason for success to their score on that same construct. For
instance, the adversity score for all those respondents who identified experiences of
adversity as their reason for success was calculated. Then, their mean score was

74
compared to the mean score of all those respondents who identified any response other
than adversity. The purpose of this analysis is to examine whether the respondents’
chosen reason for success matched their score for the same construct. An example of this
analysis is considering whether the respondents who chose assimilation as their reason
for success after immigration had higher scores for assimilation than those who chose
emphasis on education or competition as their reason for success. The next section
expands on the descriptive statistics for all the variables included in the analysis.
Descriptive statistics
Tables 1 through 6 present key demographic data to describe the sample. This
includes gender, current age, marital status, religion, age of immigration to the United
States and the number of years that the participants have lived in the United States. It is
important to note that the descriptive statistics presented in this section capture the entire
sample including those individuals were born in the United States.
Demographic data
Table 8 captures the gender breakdown of this study’s participants. There is close
to an even split between males and females. Table 9 presents the current age of the
survey respondents. Table 9 shows that 61% of survey participants are currently above
the age of 35 and 48% (approximately half) of the participants are currently above the
age of 40. Table 10 presents the marital status of the survey respondents. The five
possible options included now married, never married, divorced, separated and widowed.
The majority of the participants are currently married.

75
Table 8
Gender
Gender n Percentage
Male 206 52%
Female 190 48%
N 396 100%
Table 9
Age Now
Age n Percentage
17-24 39 10%
25-30 57 14%
31-35 56 14%
36-40 50 13%
41-50 77 19%
51-60 78 20%
61-82 36 9%
N 393 100%

76
Table 10
Marital Status
Marital Status n Percentage
Now Married 238 60%
Never Married 122 31%
Divorced 27 7%
Separated 4 1%
Widowed 5 1%
N 396 100%
Table 11 presents the religious preference of the survey participants. Table 11
shows that 64% are Christian, 19% are Muslim, 5% are Druze, 10% have no religion and
2% have another religion.
Table 11
Religion
Religion n Percentage
Maronite 139 35%
Greek Orthodox 53 14%
Sunni 38 10%
No religion 39 10%
Greek Catholic 37 9%
Shi’a 35 9%

77
Other Christians 25 6%
Druze 19 5%
Other Religion 7 2%
N 392 100%
Table 12 presents data on how old the survey participants were when they
immigrated to the U.S. The data below indicates that approximately 89% were born in
Lebanon and 12% were born in the U.S. In addition, approximately 73% spent at least the
first 14 years of their life in Lebanon.
Table 12
Age of Immigration
Age Immigrated n Percentage
Born in U.S. 45 12%
Younger than 14 61 16%
14-18 83 22%
19-22 64 17%
23-25 43 11%
26-30 50 13%
31-60 38 10%
N 384 101%

78
Table 13 presents the number of years that the participants have spent in the
United States. According to the table below, 77% of participants have been living in the
United States for more than 10 years and 87% of participants have been living in the U.S
for more than 5 years.
Table 13
Years in the United States
Years in U.S. n Percentage
0-2 20 5%
3-5 31 8%
6-10 40 10%
11-15 44 12%
16-20 50 13%
21-29 58 15%
30-40 91 24%
41-76 48 13%
N 382 100%
The next section presents descriptive statistics for all 10 independent variables
and resilience.
Cultural Variables
Table 14 shows average scores, standard deviations and ranges for all 10 cultural
variables in addition to resilience. This table attempts to answer this study’s first research
question and test the hypothesis stating that the Lebanese Diaspora will not demonstrate

79
the unique cultural values of adversity, learning, assimilation, competition/masculinity,
jealousy, comparing oneself to others, superiority, insecurity, uncertainty acceptance and
impulse control. The average score for each of the variables was obtained by adding the
individual scores for each question to give us a total score for each construct. The
participants’ added scores were then averaged to give us the total average score for each
of the constructs. Mean imputation was used to fill in the missing values for the
independent variables. The standard deviations and actual ranges for each construct are
captured in columns 3 and 4 respectively. It is important to note that adversity is
presented as overall adversity in addition to its breakdown into personal adversity and
national adversity. Education is also presented as overall education in addition to its
breakdown into family education and personal education. The decision to split the
constructs of adversity and education was informed by the results of the factor analyses
that will be presented later in this chapter.
The participants’ score for national adversity was moderate. The survey questions
inquired about adversity related to the political conflict and instability in Lebanon. Given
Lebanon’s recent history, I was expecting the national adversity score to be significantly
higher. The participants’ scores for family education and personal education were
extremely high. Given that jealousy was a prevalent theme in the pilot study findings, it
was included in this survey. However, participants’ score for jealousy was low.
Table 14
Independent Variables + Resilience
Cultural Values M SD Range
Actual Range Potential Range

80
Adversity Overall 9.1 4.7 0-20 0-20
Personal
Adversity
3.4 2.9 0-10 0-10
National
Adversity
5.7 3.1 0-10 0-10
Education Overall 18.3 2.3 8-20 0-20
Family Education 9.4 1.4 1-10 0-10
Personal
Education
8.9 1.5 2-10 0-10
Assimilation 12.8 2.2 3-15 0-15
Competition 13.2 2.0 4-15 0-15
Jealousy 6.2 5.8 0-25 0-25
Compare to
Others
5.8 4.0 0-15 0-15
Superiority 13.4 5.6 0-25 0-25
Insecurity 11.1 6.6 0-25 0-25
Uncertainty 9.0 3.3 0-15 0-15
Impulse Control 11.3 2.8 0-15 0-15
Resilience 31.7 5.4 11-40 0-40
Note. * n=397 for all variables
The following section presents descriptive statistics for the success variables
including educational attainment, income, remittances sent, happiness and job value.

81
Success Variables
Tables 15 and 16 present the educational attainment before immigrating to the
United States and their current educational achievement. In the year before immigrating
to the U.S., 24% of the respondents had less than a High School diploma, 27% had a
Bachelor’s Degree and 19% of the respondents had a Master’s Degree, a professional
degree or a Doctorate Degree. This question had a mean of 2.8 and a standard deviation
of 1.9. Given that the range was 0-8, a mean of 2.8 is roughly an Associate Degree. In the
year of 2016, 18% of the respondents have less than a High School Diploma or the
equivalent (GED), 23% have a Bachelor’s Degree and 49% of the respondents have a
Master’s Degree, a professional degree or a Doctorate Degree. This question had a mean
of 3.9 and a standard deviation of 2.1. Given that the range was 0-8, a mean of 3.9 is
roughly a Bachelor’s Degree. The mean increased by approximately one degree from the
educational attainment before immigrating to the educational attainment now (Associate
Degree to Bachelor’s Degree.)
Table 15
Educational Attainment before Immigrating to the United States (Range 0-8; 𝑥=2.8;
n=319; sd=1.9)
Educational Attainment Before U.S. n Percentage
None 34 11%
Elementary School Diploma 42 13%
High School Diploma or the Equivalent (GED) 79 25%
Associate Degree 19 6%
Bachelor’s Degree 86 27%

82
Master’s Degree 34 11%
Professional Degree (MD, DDS, DVM, LLB, JD,
DD)
19 6%
Doctorate Degree (Ph.D. or Ed.D.) 6 2%
N 319 101%
Table 16
Educational Attainment Now (Range 0-8; 𝑥=3.9; n=357; sd=2.1)
Educational Attainment Now n Percentage
None 59 17%
Elementary School Diploma 4 1%
High School Diploma or the Equivalent (GED) 14 4%
Associate Degree 23 6%
Bachelor’s Degree 83 23%
Master’s Degree 107 30%
Professional Degree (MD, DDS, DVM, LLB, JD,
DD)
31 9%
Doctorate Degree (Ph.D. or Ed.D.) 36 10%
N 357 100%
Tables 17 and 18 present the midpoint income in the first year after immigration
and in 2016 respectively. The mean for the first year income was $43,490.9 (n=328, sd=
$84,190.1) and the mean for 2016 income is $145,786.8 (n=340, sd=172,362.7). The

83
standard deviations for both first year income and income for 2016 are very high. This
could be due to outliers pulling this number up. For example, in 2016, 20 respondents
earned somewhere between $500,000 and $1,000,000. These outliers could be skewing
the standard deviation. The mean increased by approximately $102,296 between the
income in the first year of immigration and income now.
Table 17
Income in the First Year After Immigration (𝑥=$43,4901; n=328; sd=$84,190.1)
Income After Immigration (Midpoints Used) n Percentage
7,500 157 48%
22,500 43 13%
37,500 33 10%
52,500 30 9%
67,500 16 5%
82,500 19 6%
105,000 10 3%
135,000 7 2%
165,000 4 1%
195,000 1 0%
240,000 1 0%
300,000 3 1%
420,000 1 0%
750,000 3 1%
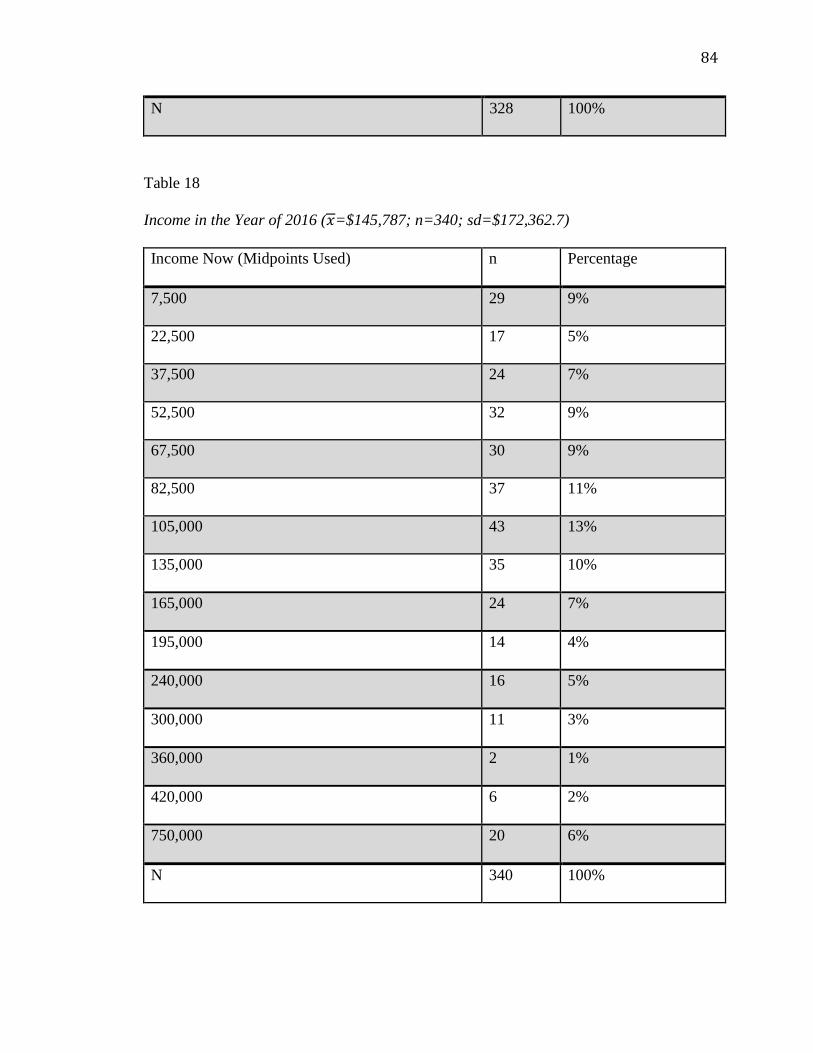
84
N 328 100%
Table 18
Income in the Year of 2016 (𝑥=$145,787; n=340; sd=$172,362.7)
Income Now (Midpoints Used) n Percentage
7,500 29 9%
22,500 17 5%
37,500 24 7%
52,500 32 9%
67,500 30 9%
82,500 37 11%
105,000 43 13%
135,000 35 10%
165,000 24 7%
195,000 14 4%
240,000 16 5%
300,000 11 3%
360,000 2 1%
420,000 6 2%
750,000 20 6%
N 340 100%

85
Tables 19 and 20 present the midpoint remittances sent in the first year after
immigration and in 2016 respectively. The mean for the first year remittances was 3.4
(n=330, sd=8.1) and 3.8 (n=330, sd=7.4) for the year of 2016. A mean of 3.4 falls
approximately between 13% and 18% of the total income earned in the first year after
immigration. A mean of 3.8 is close to 18% of the total income earned in 2016. The mean
increased by 0.4 between the remittances sent in the first year after immigration and
remittances sent now. This means that the study’s respondents sent approximately 2%
more of their income as remittances to Lebanon in the year of 2016 than they did in the
first year after immigration.
Table 19
Remittances Sent in the First Year After Immigration (𝑥=3.4; n=330; sd=8.1)
Remittances First (Midpoints Used) n Percentage
0% of income 236 72%
3% of income 37 11%
8% of income 23 7%
13% of income 5 2%
18% of income 12 4%
23% of income 4 1%
28% of income 5 2%
40% of income 8 2%
N 330 100%

86
Table 20
Remittances Sent in 2016 (𝑥=3.8; n=330; sd=7.4)
Remittances Now (Midpoints Used) n Percentage
0% of income 190 57%
3% of income 72 22%
8% of income 34 10%
13% of income 14 4%
18% of income 8 2%
23% of income 4 1%
28% of income 2 1%
40% of income 7 2%
N 330 100%
Tables 21 and 22 present job value in the first year after immigration and in the
year of 2016 respectively. Survey participants were asked about their current job’s
prestige, the education required for their position, the likelihood of injury on the job and
lastly their income. These questions combined formed the job value metric. It is
important to note that job value scores had a possible range from 0-31. Given this range,
an average job value would be around 15.5. A value above 15.5 would be considered
moderate to high or high, and a value lower than 15.5 would be considered moderate to
low or low. This metric encompasses various measures including prestige, risk of injury,
income and education. Therefore, a low number could be the result of all four measures
being relatively low. However, it could also be the result of only one measure being very

87
low and the rest being average. For instance, it is possible to see a job that is prestigious,
has a low risk of injury, requires a high educational attainment but offers a relatively low
income. The average value participants placed on their job was 9.6 (n=303; sd=5.5) in the
first year after immigration and 21 (n=303; sd=5.6) for present job value. The average
value that participants placed on their job in the first year after immigration was moderate
to low. However, the average value that survey respondents placed on their current job is
moderate to high. The mean for job value increased from 9.6 to 21 between the job value
in the first year after immigration and the present job value.
Table 21
Job Value in the First Year After Immigration (𝑥=9.6; n= 303; sd=5.5)
Job Value First (0-31 range) n Percentage
0 10 3%
1 11 4%
2 10 3%
3 13 4%
4 16 5%
5 27 9%
6 11 4%
7 17 6%
8 17 6%
9 21 7%
10 20 7%

88
11 17 6%
12 18 6%
13 13 4%
14 14 5%
15 17 6%
16 18 6%
17 5 2%
18 9 3%
19 11 4%
20 3 1%
21 4 1%
28 1 0%
N 303 102%
Table 22
Present Job value (𝑥=21.0; n= 303; sd=5.6)
Job Value First (0-31 range) n Percentage
0 1 0%
2 3 1%
5 3 1%
6 1 0%
7 1 0%

89
8 7 2%
9 5 2%
10 6 2%
11 11 3%
12 11 3%
13 15 5%
14 12 4%
15 18 6%
16 25 8%
17 24 8%
18 22 7%
19 22 7%
20 28 9%
21 25 8%
22 14 4%
23 15 5%
24 11 3%
25 5 2%
26 6 2%
27 5 2%
28 9 3%
29 6 2%
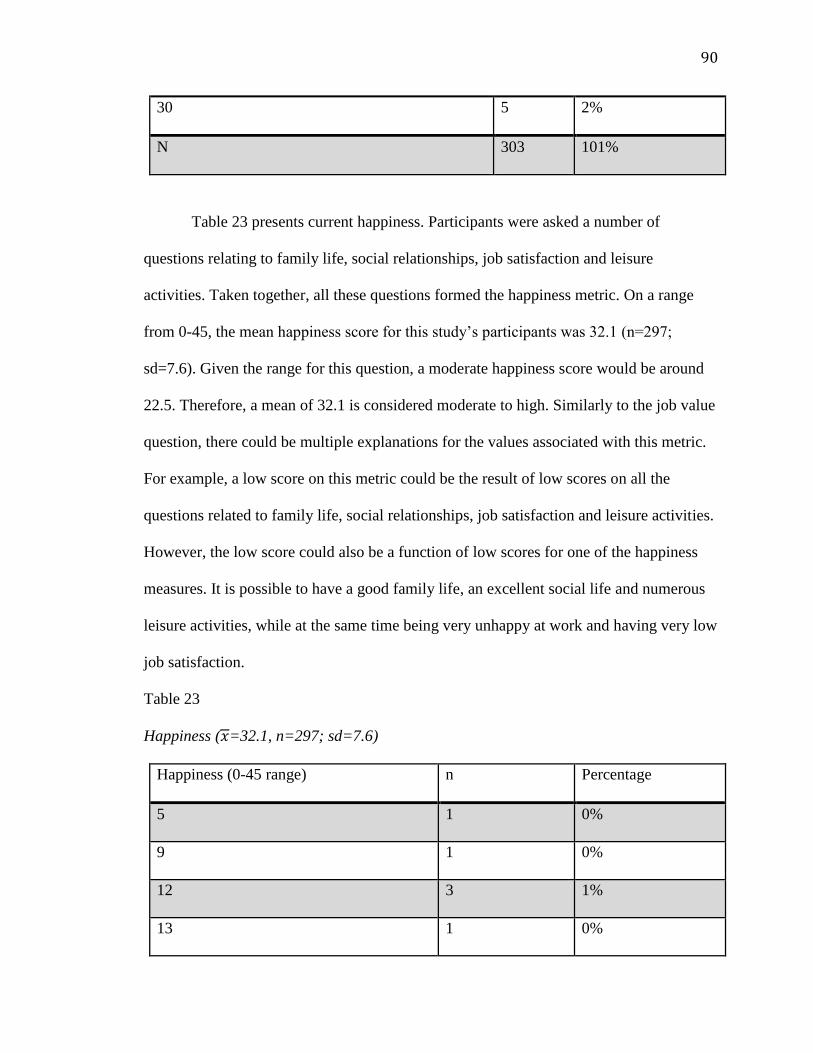
90
30 5 2%
N 303 101%
Table 23 presents current happiness. Participants were asked a number of
questions relating to family life, social relationships, job satisfaction and leisure
activities. Taken together, all these questions formed the happiness metric. On a range
from 0-45, the mean happiness score for this study’s participants was 32.1 (n=297;
sd=7.6). Given the range for this question, a moderate happiness score would be around
22.5. Therefore, a mean of 32.1 is considered moderate to high. Similarly to the job value
question, there could be multiple explanations for the values associated with this metric.
For example, a low score on this metric could be the result of low scores on all the
questions related to family life, social relationships, job satisfaction and leisure activities.
However, the low score could also be a function of low scores for one of the happiness
measures. It is possible to have a good family life, an excellent social life and numerous
leisure activities, while at the same time being very unhappy at work and having very low
job satisfaction.
Table 23
Happiness (𝑥=32.1, n=297; sd=7.6)
Happiness (0-45 range) n Percentage
5 1 0%
9 1 0%
12 3 1%
13 1 0%

91
15 4 1%
16 3 1%
18 2 1%
19 1 0%
20 4 1%
21 2 1%
22 5 2%
23 3 1%
24 13 4%
25 10 3%
26 9 3%
27 11 4%
28 12 4%
29 16 5%
30 17 6%
31 16 5%
32 15 5%
33 14 5%
34 21 7%
35 12 4%
36 15 5%
37 12 4%

92
38 16 5%
39 7 2%
40 5 2%
41 9 3%
42 10 3%
43 11 4%
44 3 1%
45 13 4%
N 297 100%
Next, this chapter presents reliabilities for each of the cultural variables and
resilience. In addition, the results of the factor analysis for all 10 cultural variables
including adversity, education, assimilation, competition, jealousy, comparing to others,
superiority, insecurity, uncertainty acceptance and impulse control are presented. This
includes descriptive statistics for each question within the individual constructs,
correlation tables and the results of the rotated component matrix for each construct.
Furthermore, this segment captures descriptive statistics, correlation tables and rotated
component matrices for both resilience and the happiness metric.
Reliabilities and Factor Analysis
Table 24 shows the reliability coefficients for the cultural variables and resilience.
A reliability coefficient of .70 or higher is considered acceptable in most social science
research. The constructs of competition, jealousy, comparing to others, superiority,
insecurity, impulse control and resilience exceed the .70 reliability benchmark. The

93
education, adversity, assimilation and uncertainty acceptance constructs fall below the
recommended reliability threshold. There are two important considerations that are
related to Chronbach alpha scores and are applicable to this study. First, a low value for
alpha may mean that there are not enough questions measuring this construct. All of the
dimensions that were measured with five or more questions on the survey had high
alphas. The adversity and education constructs only had two questions per dimension.
This might explain the low alphas for the constructs listed above. Second, Cronbach’s
alpha is a measure of internal consistency. Consistency has to do with how closely related
a set of items are as a group. However, it is important to note that a high value for alpha
does not imply that the measure is necessarily one-dimensional and additional analyses
should be performed. Exploratory factor analysis is one method of checking
dimensionality. For this reason, the following sections present the results of the factor
analysis for all 10 cultural variables, resilience and the happiness metric.
Table 24
Reliabilities
Cultural Values Cronbach’s Alpha Number of Questions on
Survey
Adversity Overall 0.60 4
Personal Adversity 0.60 2
National Adversity 0.60 2
Education Overall 0.45 4
Family Education 0.65 2
Personal Education 0.22 2

94
Assimilation 0.51 3
Competition 0.70 3
Jealousy 0.85 5
Compare to Others 0.71 3
Superiority 0.77 5
Insecurity 0.84 5
Uncertainty 0.65 3
Impulse Control 0.70 3
Resilience 0.87 10
Table 25 presents the adversity descriptive statistics. The data indicates that
political conflict in Lebanon was the factor that contributed to adversity to a higher extent
than other factors (𝑥=3.6; sd=1.65; n=394). Table 26 presents the correlations among the
adversity factors. As seen from the results, there is a significant correlation between
question 1 and questions 2 and 3, but not for question 1 and question 4. However, there is
a significant correlation between questions 2 and 3 and question 4.
Exploratory factor analysis (EFA) was the technique used within factor analysis.
Exploratory factor analysis identifies the underlying relationships between measured
variables and should be used when the researcher has no theoretical patterns of measured
variables. In addition, Principal Component Analysis (PCA) was the extraction method
used in this factor analysis. Principal Component Analysis is most commonly used as a
tool in exploratory data analysis. This statistical procedure converts a set of observations
of possible correlated variables into a set of uncorrelated variables called principal

95
components. The cutoff used is generally dependent on the sample size. According to
Hair, Tatham, Anderson and Black (1998), the appropriate size for a sample of 350 or
more is .03. Therefore, in this study, the cutoff used for factor analysis was .03.
The results of the rotated factor analysis are presented in Table 27 showing two
factors. The first factor includes two personal adversity questions “I started working
before the age of 14 to help support my family” and “When I was growing up, my family
had little money.” The second factor addresses national adversity and encompasses two
questions of “When I was living in Lebanon, I was worried about finding a job” and “The
political conflict in Lebanon affected my life negatively.” Accordingly, the two factors
were used as cultural variables in subsequent analyses.
Table 25
Adversity Descriptive Statistics
Survey Question Range M SD N
1. I started working before the age of 14 to
help support my family
0-5 0.90 1.62 398
2. When I was growing up, my family had little
money
0-5 2.50 1.80 398
3. When I was living in Lebanon, I was worried
about finding a job
0-5 2.30 1.98 396
4. The political conflict in Lebanon affected my 0-5 3.60 1.65 394

96
life negatively
Table 26
Correlation among Adversity Questions
Adversity1
Adversity2 Adversity3 Adversity4
Adversity1 Pearson Correlation
N
1
398
0.43**
398
0.19**
386
0.04
394
Adversity2 Pearson Correlation
N
0.43**
398
1
398
0.27**
396
0.19**
394
Adversity3 Pearson Correlation
N
0.19**
386
0.27**
386
1
386
0.44**
386
Adversity4 Pearson Correlation
N
0.04
394
0.19**
394
0.44**
386
1
394
Note. ** p < .01
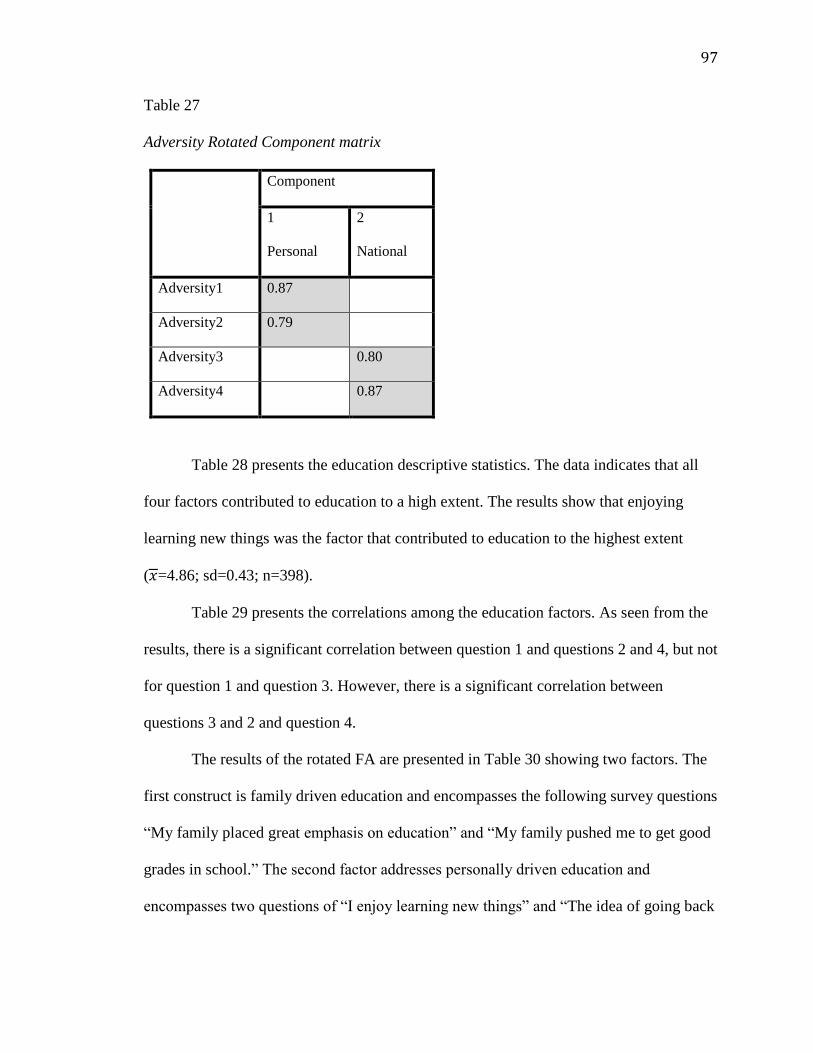
97
Table 27
Adversity Rotated Component matrix
Component
1
Personal
2
National
Adversity1 0.87
Adversity2 0.79
Adversity3 0.80
Adversity4 0.87
Table 28 presents the education descriptive statistics. The data indicates that all
four factors contributed to education to a high extent. The results show that enjoying
learning new things was the factor that contributed to education to the highest extent
(𝑥=4.86; sd=0.43; n=398).
Table 29 presents the correlations among the education factors. As seen from the
results, there is a significant correlation between question 1 and questions 2 and 4, but not
for question 1 and question 3. However, there is a significant correlation between
questions 3 and 2 and question 4.
The results of the rotated FA are presented in Table 30 showing two factors. The
first construct is family driven education and encompasses the following survey questions
“My family placed great emphasis on education” and “My family pushed me to get good
grades in school.” The second factor addresses personally driven education and
encompasses two questions of “I enjoy learning new things” and “The idea of going back

98
to school for more education is appealing to me.” Accordingly, the two factors were used
as cultural variables in subsequent analyses.
Table 28
Education Descriptive Statistics
Survey Question Range M SD N
1. My family placed great emphasis on
education
0-5 4.76 0.74 398
2. My family pushed me to get good grades in
school
0-5 4.63 0.86 398
3. I enjoy learning new things
0-5 4.86 0.43 398
4. The idea of going back to school for more
education is appealing to me
0-5 4.08 1.38 398
Table 29
Correlation among Education Questions
Education1
Education2 Education3 Education4
Education1 Pearson Correlation
1
0.49**
-0.09
0.11*

99
N
398 398 398 398
Education2 Pearson Correlation
N
0.49**
398
1
398
-0.11*
398
0.24**
398
Education3 Pearson Correlation
N
-0.01
398
0.11*
398
1
398
0.22**
398
Education4 Pearson Correlation
N
0.11*
398
0.24**
398
0.22**
398
1
398
Note. * p < .05
Note. ** p < .01
Table 30
Education Rotated Component matrix
Component
1
Family
2
Personal
Education1 0.87
Education2 0.83
Education3 0.82
Education4 0.72

100
Table 31 presents the summary descriptive statistics for the assimilation
questions. The data indicates that adjusting to living with people who have different
beliefs (𝑥=4.55; sd=0.76; n=398) and adjusting to life in America (𝑥=4.52; sd=0.77;
n=395) were the factors that contributed to assimilation to a higher extent than other
factor. As seen from the results in Table 32, there is a significant correlation between all
three questions. The factor analysis of the three variables yielded one factor; accordingly,
the three questions were combined in subsequent analyses.
Table 31
Assimilation Descriptive Statistics
Survey Question Range M SD N
1. I can adjust to living with people who have
different beliefs than me
0-5 4.55 0.76 398
2. I am open to changing my behaviors to fit the
culture I am in
0-5 3.76 1.34 398
3. I have adjusted to life in America
0-5 4.52 0.77 395
Table 32
Correlation among Assimilation Questions
Assimilation1
Assimilation2 Assimilation3

101
Assimilation1 Pearson Correlation
N
1
398
0.33**
398
0.24**
395
Assimilation2 Pearson Correlation
N
0.33**
398
1
398
0.27*
395
Assimilation3 Pearson Correlation
N
0.24**
395
0.27**
395
1
395
Note. ** p < .01
Table 33 presents the competition descriptive statistics. The data indicates that
being successful at work is very important to me was the factor that contributed to
competition to the highest extent (𝑥=4.75; sd=0.52; n=398). As seen from the results in
Table 34, there is a significant correlation between all three questions. The factor analysis
of the three variables yielded one factor; accordingly, the three questions were combined
in subsequent analyses.
Table 33
Competition Descriptive Statistics
Survey Question Range M SD N
1. I am very competitive 0-5 4.10 0.98 398

102
2. I value being the best in everything I do
0-5 4.35 0.90 398
3. Being successful at work is very important to me
0-5 4.75 0.52 398
Table 34
Correlation among Competition Questions
Competition1
Competition2 Competition3
Competition1 Pearson Correlation
N
1
398
0.60**
398
0.30**
398
Competition2 Pearson Correlation
N
0.60**
398
1
398
0.44**
398
Competition3 Pearson Correlation
N
0.30**
398
0.44**
398
1
398
Note. ** p < .01

103
Table 35 presents the jealousy descriptive statistics. The data shows that I feel
badly about others making more money than I do” was the factor that contributed to
jealousy to the highest extent (𝑥=1.92; sd=1.61; n=398). As seen from the results in Table
36, there is a significant correlation between all five questions. The factor analysis of the
five variables yielded one factor; accordingly, the five questions were combined in
subsequent analyses.
Table 35
Jealousy Descriptive Statistics
Survey Question Range M SD N
1. I feel badly about others making more money
than I do
0-5 1.92 1.61 398
2. Meeting others who are more talented than me
upsets me
0-5 1.17 1.43 398
3. I get uneasy when I think others are happier
than me
0-5 1.15 1.41 398
4. I am resentful of those who are better
educated than me
0-5 0.84 1.39 398
5. I am envious of those who appear to have better
families than me
0-5 1.13 1.47 398

104
Table 36
Correlation among Jealousy Questions
Jealousy1
Jealousy2 Jealousy3 Jealousy4 Jealousy5
Jealousy1 Pearson Correlation
N
1
398
0.61**
398
0.62**
398
0.43**
398
0.39**
398
Jealousy2 Pearson Correlation
N
0.61**
398
1
398
0.68**
398
0.59**
398
0.39**
398
Jealousy3 Pearson Correlation
N
0.62**
398
0.68**
398
1
398
0.51**
398
0.56**
398
Jealousy4 Pearson Correlation
N
0.43**
398
0.59**
398
0.52**
398
1
398
0.48**
398
Jealousy5 Pearson Correlation
0.39**
0.39**
0.56**
0.48**
1
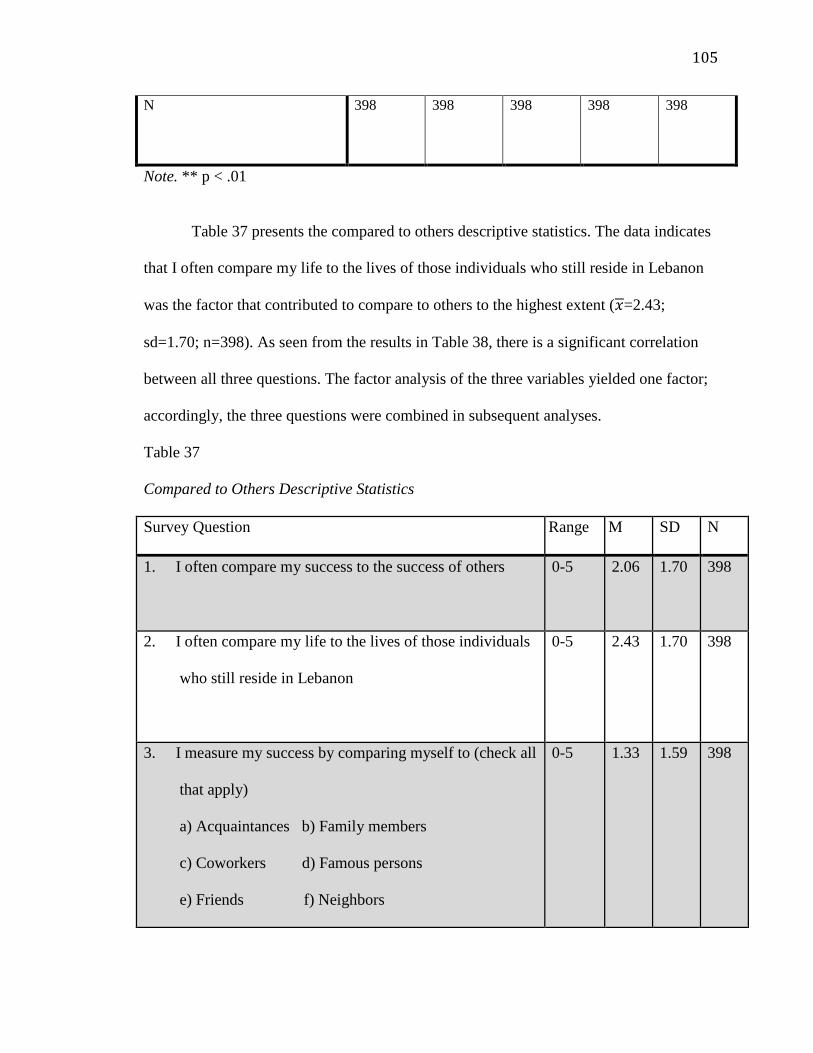
105
N
398 398 398 398 398
Note. ** p < .01
Table 37 presents the compared to others descriptive statistics. The data indicates
that I often compare my life to the lives of those individuals who still reside in Lebanon
was the factor that contributed to compare to others to the highest extent (𝑥=2.43;
sd=1.70; n=398). As seen from the results in Table 38, there is a significant correlation
between all three questions. The factor analysis of the three variables yielded one factor;
accordingly, the three questions were combined in subsequent analyses.
Table 37
Compared to Others Descriptive Statistics
Survey Question Range M SD N
1. I often compare my success to the success of others
0-5 2.06 1.70 398
2. I often compare my life to the lives of those individuals
who still reside in Lebanon
0-5 2.43 1.70 398
3. I measure my success by comparing myself to (check all
that apply)
a) Acquaintances b) Family members
c) Coworkers d) Famous persons
e) Friends f) Neighbors
0-5 1.33 1.59 398

106
Table 38
Correlations Among Compared to Others
Compare1
Compare2 Compare3
Compare1 Pearson Correlation
N
1
398
0.41**
398
0.54**
398
Compare2 Pearson
Correlation
N
0.41**
398
1
398
0.40**
398
Compare3 Pearson
Correlation
N
0.54**
398
0.40**
398
1
398
Note. ** p < .01
Table 39 presents the superiority descriptive statistics. The data shows that “I
overcame more challenges than most people” was the factor that contributed to
superiority to the highest extent (𝑥=3.26; sd=1.46; n=398). As seen from the correlation
results in Table 40, there is a significant correlation between all five questions. The factor

107
analysis of the five variables yielded one factor; accordingly, the five questions were
combined in subsequent analyses.
Table 39
Superiority Descriptive Statistics
Survey Question Range M SD N
1. I feel superior to others around me
0-5 1.75 1.55 398
2. I believe I am more intelligent than most
people
0-5 2.32 1.63 398
3. I believe I am more hardworking than most
people
0-5 3.16 1.47 398
4. I overcame more challenges than most
people
0-5 3.26 1.46 398
5. I believe I am special
0-5 2.96 1.64 398
Table 40
Correlation among Superiority Questions
Superior
1
Superior
2
Superior
3
Superior
4
Superior
5

108
Superior1 Pearson Correlation
N
1
398
0.58**
398
0.32**
398
0.21**
398
0.36**
398
Superior2 Pearson Correlation
N
0.58**
398
1
398
0.48**
398
0.37**
398
0.41**
398
Superior3 Pearson Correlation
N
0.32**
398
0.48**
398
1
398
0.54**
398
0.38**
398
Superior4 Pearson Correlation
N
0.21**
398
0.37**
398
0.54**
398
1
398
0.39**
398
Superior5 Pearson Correlation
N
0.36**
398
0.41**
398
0.38**
398
0.39**
398
1
398
Note. ** p < .01
Table 41 presents the insecurity descriptive statistics. The data indicates that I feel
like I still need to prove myself was the factor that contributed to insecurity to the highest
extent (𝑥=2.99; sd=1.79; n=398). As seen from the results in Table 42, there is a

109
significant correlation between all five questions. The factor analysis of the five variables
yielded one factor; accordingly, the five questions were combined in subsequent
analyses.
Table 41
Insecurity Descriptive Statistics
Survey Question Range M SD N
1. I am insecure about my worth in society
0-5 1.22 1.49 398
2. I worry that what I have done is not good
enough
0-5 2.31 1.77 398
3. I worry that I do not have enough
0-5 1.88 1.65 398
4. I fear losing what I have
0-5 2.66 1.67 398
5. I feel like I still need to prove myself
0-5 2.99 1.79 398
Table 42
Correlation among Insecurity Questions
Insecure1
Insecure2 Insecure3 Insecure4 Insecure5
Insecure1 Pearson Correlation 1 0.53** 0.57** 0.38** 0.41**

110
N
398
398
398
398
398
Insecure2 Pearson Correlation
N
0.53**
398
1
398
0.67**
398
0.48**
398
0.52**
398
Insecure3 Pearson Correlation
N
0.57**
398
0.67**
398
1
398
0.55**
398
0.50**
398
Insecure4 Pearson Correlation
N
0.38**
398
0.48**
398
0.55**
398
1
398
0.51**
398
Insecure5 Pearson Correlation
N
0.41**
398
0.52**
398
0.50**
398
0.51**
398
1
398
Note. ** p < .01
Table 43 presents the uncertainty acceptance descriptive statistics. The data
indicates that “I have a preference for a few rules” was the factor that contributed to
uncertainty acceptance to the highest extent (𝑥=3.10; sd=1.42; n=398). As seen from the
results in Table 44, there is a significant correlation between all three questions. The

111
factor analysis of the three variables yielded one factor; accordingly, the three questions
were combined in subsequent analyses.
Table 43
Uncertainty Descriptive Statistics
Survey Question Range M SD N
1. I am comfortable with future events being
unpredictable
0-5 2.95 1.48 398
2. I am comfortable in unknown situations
0-5 2.93 1.47 398
3. I have a preference for few rules
0-5 3.10 1.42 398
Table 44
Correlation among Uncertainty Questions
Uncertainty1
Uncertainty2 Uncertainty3
Uncertainty1 Pearson Correlation
N
1
398
0.69**
398
0.26**
398
Uncertainty2 Pearson Correlation
0.69**
1
0.17**

112
N
398 398 398
Uncertainty3 Pearson Correlation
N
0.26**
398
0.17**
398
1
398
Note. ** p < .01
Table 45 presents the impulse control descriptive statistics. The data indicates that
“I can put off short-term gains for long-term success” was the factor that contributed to
impulse control to the highest extent (𝑥=3.95; sd=1.13; n=398). As seen from the results
in Table 46, there is a significant correlation between all three questions. The factor
analysis of the three variables yielded one factor; accordingly, the three questions were
combined in subsequent analyses.
Table 45
Impulse Control Descriptive Statistics
Survey Question Range M SD N
1. I am able to resist temptation
0-5 3.60 1.27 398
2. I tend to be very disciplined
0-5 3.76 1.20 398
3. I can put off short-term gains for long-term
success
0-5 3.95 1.13 398

113
Table 46:
Correlation among Impulse control Questions
Impulse1
Impulse2 Impulse3
Impulse1 Pearson Correlation
N
1
398
0.46**
398
0.40**
398
Impulse2 Pearson Correlation
N
0.46**
398
1
398
0.46**
398
Impulse3 Pearson Correlation
N
0.40**
398
0.46**
398
1
398
Note. ** p < .01
Table 47 presents the resilience descriptive statistics. The data indicates that “I
think of myself as a strong person” (𝑥=3.38; sd=0.72; n=398), “I am able to adapt to
change” (𝑥=3.33; sd=0.70; n=398) and “I can achieve goals despite obstacles” (𝑥=3.33;
sd=0.64; n=398) were the factors that contributed to resilience to the highest extent. As
can be seen from the results in Table 48, there is a significant correlation between all the
resilience questions.

114
The results of the rotated factor analysis are presented in Table 49 revealing two
factors. The first component encompasses the following survey questions “I can achieve
goals despite obstacles”, “I can stay focused under pressure”, “I am not easily
discouraged by failure”, “I think of myself as a strong person” and “I can handle
unpleasant feelings.” The second factor encompasses the questions of “I am able to adapt
to change”, “I can deal with whatever comes”, “I try to see humorous side of problems”,
“Coping with stress can strengthen me”, and “I tend to bounce back after illness or
hardship.”
Table 47
Resilience Descriptive Statistics
Survey Question Range M SD N
1. I am able to adapt to change
0-4 3.33 0.70 398
2. I can deal with whatever comes
0-4 3.23 0.71 398
3. I try to see humorous side of problems
0-4 2.96 0.94 398
4. Coping with stress can strengthen me
0-4 2.94 0.88 398
5. I tend to bounce back after illness or hardship
0-4 3.29 0.77 398
6. I can achieve goals despite obstacles
0-4 3.33 0.64 398

115
7. I can stay focused under pressure
0-4 3.21 0.80 398
8. I am not easily discouraged by failure
0-4 2.98 0.90 398
9. I think of myself as a strong person
0-4 3.38 0.72 398
10. I can handle unpleasant feelings 0-4 3.04 0.84 398
Table 48
Correlation among Resilience Questions
Res0
Res1 Res2 Res3 Res4 Res5 Res6 Res7 Res8 Res9
Res1 Pearson
Correlation
N
1
398
0.60**
398
0.37**
398
0.42**
398
0.41**
398
0.34**
398
0.34**
398
0.23**
398
0.25**
398
0.35**
398
Res2 Pearson
Correlation
N
0.60**
398
1
398
0.38**
398
0.47**
398
0.43**
398
0.45**
398
0.39**
398
0.37**
398
0.40**
398
0.48**
398
Res3 Pearson
Correlation
0.37**
398
0.38**
398
1
398
0.50**
398
0.44**
398
0.36**
398
0.25**
398
0.22**
398
0.20**
398
0.36**
398

116
N
Res4 Pearson
Correlation
N
0.42**
398
0.47**
398
0.50**
398
1
398
0.54**
398
0.42**
398
0.34**
398
0.33**
398
0.41**
398
0.39**
398
Res5 Pearson
Correlation
N
0.41**
398
0.43**
398
0.44**
398
0.54**
398
1
398
0.57**
398
0.46**
398
0.39**
398
0.41**
398
0.40**
398
Res6 Pearson
Correlation
N
0.34**
398
0.45**
398
0.36**
398
0.42**
398
0.57**
398
1
398
0.54**
398
0.42**
398
0.45**
398
0.34**
398
Res7 Pearson
Correlation
N
0.34**
398
0.39**
398
0.25**
398
0.34**
398
0.46**
398
0.54**
398
1
398
0.42**
398
0.43**
398
0.42**
398
Res8 Pearson
Correlation
N
0.23**
398
0.37**
398
0.22**
398
0.33**
398
0.39**
398
0.42**
398
0.42**
398
1
398
0.51**
398
0.41**
398
Res9 Pearson
Correlation
N
0.25**
398
0.40**
398
0.20**
398
0.41**
398
0.41**
398
0.45**
398
0.43**
398
0.51**
398
1
398
0.55**
398

117
Res10 Pearson
Correlation
N
0.35**
398
0.48**
398
0.36**
398
0.39**
398
0.40**
398
0.34**
398
0.42**
398
0.41**
398
0.55**
398
1
398
Note. ** p < .01
Table 49
Resilience Rotated Component matrix
Component
1 2
Resilience1 0.75
Resilience2 0.66
Resilience3 0.77
Resilience4 0.69
Resilience5 0.59
Resilience6 0.60
Resilience7 0.68
Resilience8 0.77
Resilience9 0.81
Resilience10 0.61
Table 50 presents the happiness descriptive statistics. The data indicates that “I
love my job” (𝑥=4.09; sd=1.12; n=331) and “I have a supportive group of friends”

118
(𝑥=4.02; sd=1.24; n=332) were the factors that contributed to happiness to the highest
extent.
Table 51 presents the correlations among the happiness factors. As seen from the
results, there is a significant correlation between question 1 and all the other questions
except for question 5. Question 2 is correlated with all the questions with the exception of
question 7. There is a significant correlation between question 3 and all the other
questions except for question 5. Question 4 is correlated with all the questions with the
exception of question 5. Question 5 is only significantly correlated with questions 6, 7, 8
and 9. Finally, questions 6, 8 and 9 are significantly correlated with all the other
happiness questions.
The results of the rotated FA are presented in Table 52 showing two factors. The
first component encompasses the following survey questions “I frequently engage in
leisure activities
with my friends”, “My spouse is a great source of support for me”, “I have a supportive
group of friends”, “ I pursue hobbies regularly, “I belong to clubs” and “I volunteer on a
regular basis.” The second factor encompasses the questions of “I love my job”, “I would
continue working at my job even if it were not financially necessary” and “I enjoy
spending time with the people I work with.”
The happiness questions used in the survey related to family life, social
relationships, job satisfaction and leisure activities. When reading the happiness
questions, it becomes clear that the three questions that loaded on component 2 pertain to
job satisfaction. The remaining six questions are related to family life, social relationships
and leisure activities.

119
Table 50
Happiness Descriptive Statistics
Survey Question Range M SD N
1. I love my job
0-5 4.09 1.12 331
2. I would continue to work at my job even if it
were not financially necessary
0-5 3.42 1.62 330
3. I enjoy spending time with the people I work
with
0-5 3.95 1.06 325
4. I frequently engage in leisure activities
(eating, drinking, playing games etc.) with my
friends
0-5 3.97 1.27 331
5. My spouse is a great source of support for me
0-5 3.89 1.65 305
6. I have a supportive group of friends
0-5 4.02 1.24 332
7. I pursue hobbies regularly
0-5 3.56 1.37 328
8. I belong to clubs (religious, political etc.)
0-5 2.64 1.91 330

120
9. I volunteer on a regular basis
0-5 2.64 1.74 331
Table 51
Correlation among Happiness Questions
Happy1
Happy2 Happy3 Happy4 Happy5 Happy6 Happy7 Happy8 Happy9
Happy1 Pearson
Correlation
N
1
331
0.65**
330
0.46**
325
0.35**
329
0.07
303
0.32**
329
0.13*
326
0.14*
328
0.14*
329
Happy2 Pearson
Correlation
N
0.65**
330
1
330
0.48**
325
0.23**
329
0.13*
303
0.18**
329
0.10
326
0.17**
328
0.17**
329
Happy3 Pearson
Correlation
N
0.46**
398
0.48**
398
1
398
0.33**
398
0.09
398
0.34**
398
0.22**
398
0.14*
398
0.19**
398
Happy4 Pearson
Correlation
N
0.35**
398
0.23**
398
0.33**
398
1
398
0.08
398
0.55**
398
0.42**
398
0.26**
398
0.23**
398
Happy5 Pearson
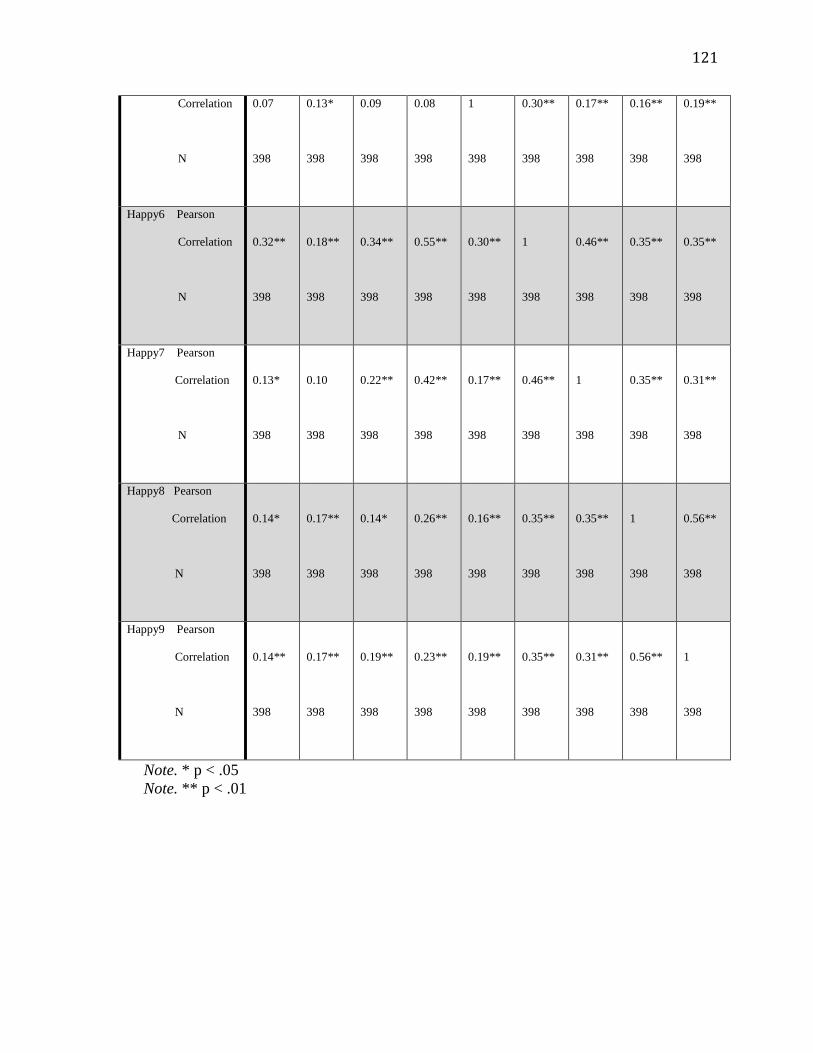
121
Correlation
N
0.07
398
0.13*
398
0.09
398
0.08
398
1
398
0.30**
398
0.17**
398
0.16**
398
0.19**
398
Happy6 Pearson
Correlation
N
0.32**
398
0.18**
398
0.34**
398
0.55**
398
0.30**
398
1
398
0.46**
398
0.35**
398
0.35**
398
Happy7 Pearson
Correlation
N
0.13*
398
0.10
398
0.22**
398
0.42**
398
0.17**
398
0.46**
398
1
398
0.35**
398
0.31**
398
Happy8 Pearson
Correlation
N
0.14*
398
0.17**
398
0.14*
398
0.26**
398
0.16**
398
0.35**
398
0.35**
398
1
398
0.56**
398
Happy9 Pearson
Correlation
N
0.14**
398
0.17**
398
0.19**
398
0.23**
398
0.19**
398
0.35**
398
0.31**
398
0.56**
398
1
398
Note. * p < .05
Note. ** p < .01

122
Table 52
Happiness Rotated Component matrix
Component
1
Family life, Social
relationships and
Leisure Activities
2
Job Satisfaction
Happiness1 0.86
Happiness2 0.84
Happiness3 0.73
Happiness4 0.54
Happiness5 0.40
Happiness6 0.71
Happiness7 0.70
Happiness8 0.73
Happiness9 0.71
Next, this chapter offers the results of five matched samples. This analysis tests
the hypotheses that key demographic differences such as religion and gender will have no
impact on the participants’ representation of Lebanese cultural values and no impact on
the success of members of the Lebanese diaspora. After matching respondents on key
variables such as age and gender, independent samples t-tests were conducted to compare
the means between each of the two groups. The purpose of this test is to determine
whether there is statistical evidence that the mean difference between paired observations

123
on a particular outcome is significantly different from zero. The first matched sample
matches Christians and Muslims and the second sample matches males to females. The
third, fourth and fifth matched samples look at differences between groups based on the
number of years they lived in Lebanon.
Matched Samples
Religion Matched Sample
The first matched sample tests two hypotheses. The first hypothesis states that
religious preference will have no impact on the participants’ representativeness of the
cultural values of adversity, learning, assimilation, competition/masculinity, jealousy,
comparing oneself to others, superiority, insecurity, uncertainty acceptance and impulse
control. The second hypothesis states that religious preference will have no impact on the
success of members of the Lebanese diaspora as measured by: current income, income
growth, current education, education growth, current remittances sent, remittances sent
growth, current job value, job value growth and current happiness/life satisfaction.
Maronite Christians, Greek Orthodox Christians, Greek Catholic Christians and
other Christians were aggregated into the category of Christians. In addition, Shi’a
Muslims and Sunni Muslims were aggregated into the category of Muslims. The criteria
of this matched sample included an exact match on marital status, gender and whether
the respondents were born in the United States or in Lebanon. It is important to note
that the marital status criterion was binary and only encompassed the two categories of
married and unmarried. The “now married” survey option constituted the married
category. In addition, the “never married”, “divorced”, “separated” and “widowed”
categories were collapsed into one and formed the unmarried category. The criteria of

124
this matched sample also included a fuzzy match on age. Instead of an exact age, the
groups were matched on an age range of five years. The matched sample yielded 69
total matches. Of those 69 matches, 4 were exact matches and 65 were fuzzy matches.
Table 53 presents the results of a comparison of means between Christians and
Muslims on the cultural variables and the success measures. As seen from the results,
there were no significant differences between the two groups on any of the variables.
Table 53
Comparison of Christians and Muslims on Cultural Variables and Success Outcomes
Muslims Mean Christians Mean Mean Difference
Personal Adversity
2.74 (n=69) 2.71 (n=69) 0.03
National Adversity
6.19 (n=69) 5.40 (n=69) 0.79
Family Education
9.36 (n=69) 9.44 (n=69) -0.08
Personal Education
9.36 (n=69) 8.97 (n=69) 0.39
Assimilation
12.77 (n=69) 12.8 (n=69) -0.07
Competition
13.10 (n=69) 13.68 (n=69) -0.58

125
Jealousy
6.39 (n=69) 5.86 (n=69) 0.54
Compare to Others
5.94 (n=69) 5.83 (n=69) 0.12
Superiority
13.52 (n=69) 13.48 (n=69) 0.04
Insecurity
11.35 (n=69) 11.45 (n=69) -0.10
Uncertainty
8.97 (n=69) 9.77 (n=69) -0.79
Impulse Control
11.22 (n=69) 11.68 (n=69) -0.46
Resilience
31.76 (n=69) 32.30 (n=69) -0.54
Education Static
4.33 (n=60) 4.03 (n=65) 0.30
Income Static
137,410.71 (n=56) 139,795.08 (n=61) -2,384.37
Remittances Static
4.42 (n=57) 4.59 (n=59) -0.17
Job Value Static
21.22 (n=51) 20.77 (n=57) 0.44

126
Happy Static
32.14 (n=50) 32.86 (n=58) -0.72
Education Growth
1.65 (n=20) 2.39 (n=31) -0.74
Income Growth
115,528.85 (n=52) 111,830.36 (n=56) 3,698.49
Remittances Growth
0.30 (n=57) -0.37 (n=57) 0.67
Job Value Growth
9.51 (n=51) 7.80 (n=55) 1.71
Note. * p < .05
Note. ** p < .01
Gender Matched Sample
The gender matched sample tests two hypotheses. The first hypothesis states that gender
will have no impact on the participants’ representativeness of the cultural values of adversity,
learning, assimilation, competition/masculinity, jealousy, comparing oneself to others,
superiority, insecurity, uncertainty acceptance and impulse control. The second hypothesis
states that gender will have no impact on the success of members of the Lebanese diaspora as
measured by: current income, income growth, current education, education growth, current
remittances sent, remittances sent growth, current job value, job value growth and current
happiness/life satisfaction.
The criteria of this matched sample included an exact match on marital status, religion
group and whether the respondents were born in the United States or in Lebanon. Similarly to

127
the religion matched sample discussed previously, the marital status and religion group
criteria were both binary and only encompassed two categories each. The same aggregation
rules were used for this matched sample. The criteria of this matched sample also included a
fuzzy match on age now and age of immigration. Instead of an exact age, the groups were
matched on an age range of five years for both age now and age of immigration. The matched
sample yielded 111 total matches. Of those 111 matches, 3 were exact matches and 108 were
fuzzy matches.
Table 54 presents the comparison of males and females on the cultural variables and
success measures. Results indicate that males scored significantly higher than females on the
following measures: personal adversity, national adversity, assimilation, competition,
uncertainty acceptance and resilience. Results indicate that males scored significantly higher
than females for current income, job value now, income growth and job value growth.
Table 54
Comparison of Males and Females on Cultural Variables and Success Outcomes
Male Mean Female Mean Mean
Difference
Personal Adversity
3.75 (n=111) 2.91 (n=111) 0.85*
National Adversity
6.52 (n=111) 5.61 (n=111) 0.91*
Family Education
9.42 (n=111) 9.43 (n=111) -0.00
Personal Education 8.93 (n=111) 9.06 (n=111) -0.14

128
Assimilation
13.04 (n=111) 12.43 (n=111) 0.60*
Competition
13.60 (n=111) 12.96 (n=111) 0.63**
Jealousy
6.14 (n=111) 6.89 (n=111) -0.76
Compare to Others
6.15 (n=111) 5.81 (n=111) 0.34
Superiority
14.24 (n=111) 13.02 (n=111) 1.23
Insecurity
12.16 (n=111) 10.69 (n=111) 1.47
Uncertainty
9.66 (n=111) 8.61 (n=111) 1.05*
Impulse Control
11.45 (n=111) 11.14 (n=111) 0.31
Resilience
32.98 (n=111) 30.85 (n=111) 2.13**
Education Static
4.10 (n=105) 3.97 (n=100) 0.14
Income Static 185,025.00 (n=100) 109,787.23 (n=94) 75,237.77***

129
Remittances Static
4.24 (n=96) 3.41 (n=92) 0.83
Job Value Static
22.19 (n=97) 20.35 (n=84) 1.84*
Happy Static
32.66 (n=93) 32.35 (n=77) 0.31
Education Growth
2.23 (n=53) 2.43 (n=30) -0.21
Income Growth
151,083.33 (n=90) 74,029.41 (n=85) 77,053.92***
Remittances Growth
1.22 (n=94) -0.38 (n=91) 1.61
Job Value Growth
10.33 (n=92) 6.65 (n=80) 3.68***
Note. * p < .05
Note. ** p < .01
Note. ***p < .00
US to 14+ Matched Sample
The third, fourth and fifth matched samples look at differences between groups
based on the number of years they lived in Lebanon. Stated more specifically, the third
matched sample matches those who were born in the United States to those who lived
more than the first 14 years of their life in Lebanon. The fourth matched sample matches
those who lived less than the first 14 years of their life in Lebanon to those who lived

130
more than the first 14 years in Lebanon. The fifth and last matched sample matches those
who were born in the United States to those who were born in Lebanon (irrespective of
the length of their stay in Lebanon). Moreover, these analyses test the hypothesis that the
number of years spent in Lebanon will have no impact on the participants’
representativeness specific aspects of Lebanese culture of adversity, learning,
assimilation, competition/masculinity, jealousy, comparing oneself to others, superiority,
insecurity, uncertainty acceptance and impulse control. In addition, they test the
hypothesis stating that the number of years spent in Lebanon will have no impact on the
success of members of the Lebanese diaspora as measured by: current income, income
growth, current education, education growth, current remittances sent, remittances sent
growth, current job value, job value growth and current happiness/life satisfaction.
This matched sample matched those who were born in the United States to those
who lived more than 14 years in Lebanon. The criteria of this matched sample included
an exact match on gender, marital status and religion group. Similarly to the religion and
gender matched samples discussed previously, the marital status and religion group
criteria were both binary and only encompassed two categories each. The matched
sample yielded 39 total matches. Of those 39 matches, 4 were exact matches and 35 were
fuzzy matches.
Table 55 presents a comparison of U.S. born and those who lived in Lebanon for
14 or more years. As expected, those who lived more than the first 14 years of their life in
Lebanon indicated a higher impact of national adversity and uncertainty acceptance,
whereas those born in the U.S. experienced greater educational growth.

131
Table 55
Comparison of U.S. Born and 14+ in Lebanon on Cultural Variables and Success
Outcomes
U.S. Born Mean 14+ in Lebanon Mean Mean
Difference
Personal Adversity
3.33 (n=39) 2.39 (n=39) 0.95
National Adversity
2.93 (n=39) 5.69 (n=39) -2.76***
Family Education
9.51 (n=39) 9.36 (n=39) 0.15
Personal Education
9.20 (n=39) 8.87 (n=39) 0.33
Assimilation
12.40 (n=39) 13.21 (n=39) -0.82
Competition
13.28 (n=39) 13.10 (n=39) 0.18
Jealousy
7.13 (n=39) 6.15 (n=39) 0.98
Compare to Others
6.10 (n=39) 6.41 (n=39) -0.31
Superiority
14.49 (n=39) 14.00 (n=39) 0.49

132
Insecurity
13.23 (n=39) 10.20 (n=39) 3.03
Uncertainty
7.44 (n=39) 9.64 (n=39) -2.20*
Impulse Control
10.92 (n=39) 10.59 (n=39) 0.33
Resilience
31.86 (n=39) 32.51 (n=39) -0.65
Education Static
4.48 (n=29) 4.00 (n=35) 0.48
Income Static
161,413.04 (n=23) 93,636.36 (n=33) 67,776.68
Remittances Static
1.26 (n=19) 3.90 (n=31) -2.64
Job Value Static
20.85 (n=20) 21.39 (n=31) -0.54
Happy Static
34.24 (n=17) 33.12 (n=26) 1.12
Education Growth
5.50 (n=6) 1.31 (n=16) 4.19*
Income Growth
27,272.73 (n=11) 62,578.13 (n=32) -35,305.40

133
Remittances Growth
0.36 (n=14) -2.06 (n=31) 2.42
Job Value Growth
6.91 (n=11) 6.94 (n=31) -0.03
Note. *p < .00
Less than 14 years to 14+ Matched Sample
This matched sample matched those who lived less than the first 14 years of their life in
Lebanon to those who lived more than 14 years in Lebanon. The criteria of this matched
sample included an exact match on gender, marital status and religion group. Similarly to the
previous matched samples, the marital status and religion group criteria were both binary and
only encompassed two categories each. The criteria of this matched sample also included a
fuzzy match on age now. Instead of an exact age, the groups were matched on an age range of
five years for age now. The matched sample yielded 49 total matches. Of those 49 matches, 5
were exact matches and 44 were fuzzy matches. Less than 14 years is 0 and lived 14+ years in
Lebanon is 1.
Table 56 presents a comparison of those who lived in Lebanon for 14 or more years
and those who loved in Lebanon for less than 14 years. Those who spent less than 14 years in
Lebanon have higher personal adversity than those who spent more than 14 years in Lebanon.
However, those who spent more than the first 14 years of their life in Lebanon have higher
national adversity than those who spent less than the first 14 years of their life in Lebanon. In
addition, those who spent less than 14 years in Lebanon have greater educational growth than
those who spent more than 14 years in Lebanon. However, those who spent more than the

134
first 14 years of their life in Lebanon have a higher job value than those who spent less than
the first 14 years of their life in Lebanon.
Table 56
Comparison of Less than 14 Years in Lebanon and 14+ Years in Lebanon on Cultural
Variables and Success Outcomes
Less than 14 years in
Lebanon Mean
14+ years in Lebanon
Mean
Mean
Difference
Personal Adversity
4.04 (n=49) 2.735 (n=49) 1.304*
National Adversity
4.28 (n=49) 6.469 (n=49) -2.194**
Family Education
9.31 (n=49) 9.367 (n=49) -0.061
Personal Education
8.81 (n=49) 9.06 (n=49) -0.25
Assimilation
12.58 (n=49) 12.78 (n=49) -0.20
Competition
12.97 (n=49) 12.92 (n=49) 0.09
Jealousy
6.33 (n=49) 6.67 (n=49) -0.35
Compare to Others
6.00 (n=49) 5.96 (n=49) 0.04

135
Superiority
13.27 (n=49) 13.04 (n=49) 0.23
Insecurity
12.11 (n=49) 11.71 (n=49) 0.40
Uncertainty
9.08 (n=49) 9.35 (n=49) -0.27
Impulse Control
10.73 (n=49) 10.82 (n=49) -0.08
Resilience
30.61 (n=49) 31.60 (n=49) -1.00
Education Static
4.49 (n=45) 3.77 (n=47) 0.72
Income Static
125,714.29 (n=42) 147,500.00 (n=45) -21,785.71
Remittances Static
3.17 (n=41) 5.71 (n=44) -2.53
Job Value Static
20.17 (n=41) 22.70 (n=40) -2.53*
Happy Static
31.78 (n=36) 31.24 (n=38) 0.54
Education Growth
4.09 (n=22) 1.57 (n=23) 2.53**
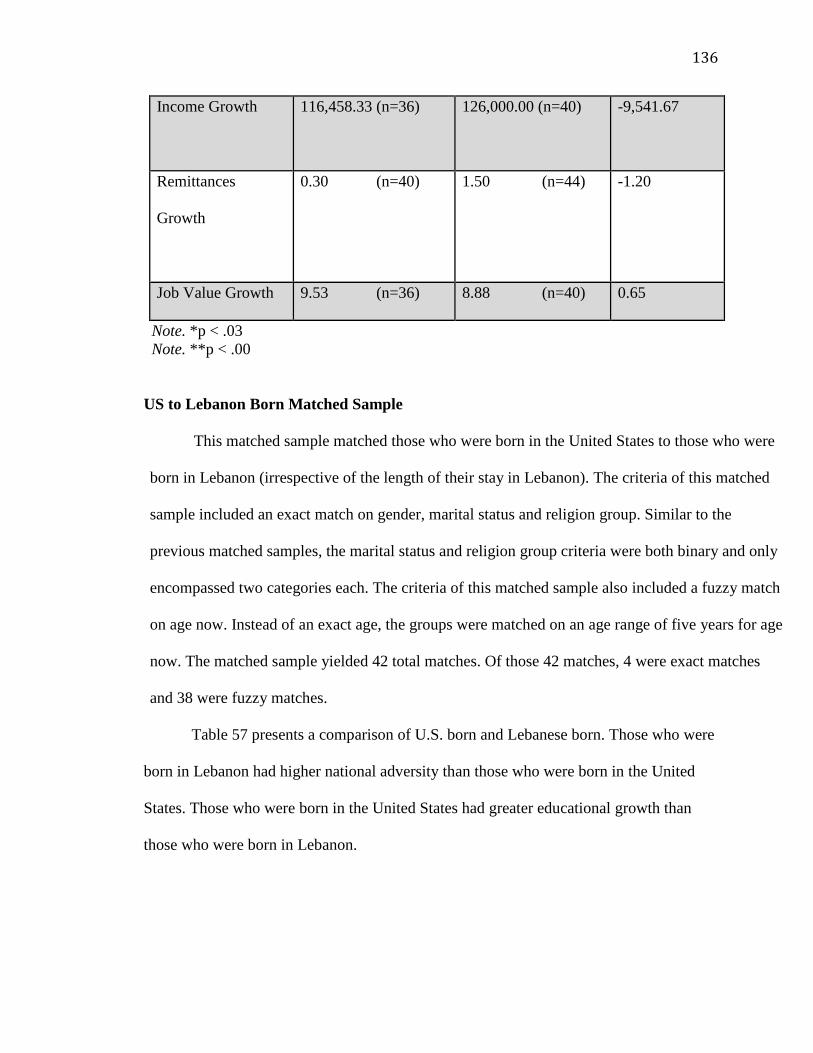
136
Income Growth
116,458.33 (n=36) 126,000.00 (n=40) -9,541.67
Remittances
Growth
0.30 (n=40) 1.50 (n=44) -1.20
Job Value Growth 9.53 (n=36) 8.88 (n=40) 0.65
Note. *p < .03
Note. **p < .00
US to Lebanon Born Matched Sample
This matched sample matched those who were born in the United States to those who were
born in Lebanon (irrespective of the length of their stay in Lebanon). The criteria of this matched
sample included an exact match on gender, marital status and religion group. Similar to the
previous matched samples, the marital status and religion group criteria were both binary and only
encompassed two categories each. The criteria of this matched sample also included a fuzzy match
on age now. Instead of an exact age, the groups were matched on an age range of five years for age
now. The matched sample yielded 42 total matches. Of those 42 matches, 4 were exact matches
and 38 were fuzzy matches.
Table 57 presents a comparison of U.S. born and Lebanese born. Those who were
born in Lebanon had higher national adversity than those who were born in the United
States. Those who were born in the United States had greater educational growth than
those who were born in Lebanon.

137
Table 57
Comparison of U.S. Born and Lebanese Born on Cultural Variables and Success
Outcomes
U.S. Born Mean Lebanese Born
Mean
Mean
Difference
Personal Adversity
3.38 (n=42) 3.048 (N=42) 0.331
National Adversity
2.96 (n=42) 5.079 (n=42) -2.121**
Family Education
9.55 (n=42) 9.262 (n=42) 0.286
Personal Education
9.19 (n=42) 9.307 (n=42) -0.119
Assimilation
12.12 (n=42) 12.690 (n=42) -0.571
Competition
13.14 (n=42) 12.857 (n=42) 0.286
Jealousy
7.08 (n=42) 7.119 (n=42) -0.043
Compare to Others
6.24 (n=42) 6.55 (n=42) -0.31
Superiority
14.60 (n=42) 13.19 (n=42) 1.41

138
Insecurity
13.50 (n=42) 12.64 (n=42) 0.86
Uncertainty
7.57 (n=42) 9.05 (n=42) -1.47
Impulse Control
10.95 (n=42) 11.16 (n=42) -0.21
Resilience
31.51 (n=42) 32.13 (n=42) -0.62
Education Static
4.40 (n=30) 4.15 (n=40) 0.25
Income Static
156,875.00 (n=24) 85,625.00 (n=36) 71,250.00
Remittances Static
1.35 (n=20) 3.83 (n=36) -2.48
Job Value Static
20.62 (n=21) 19.50 (n=34) 1.12
Happy Static
33.22 (n=18) 32.06 (n=32) 1.16
Education Growth
5.00 (n=7) 2.61 (n=18) 2.39*
Income Growth
27,500.00 (n=12) 62,272.73 (n=33) -34,772.73

139
Remittances Growth
0.533 (n=15) -0.31 (n=36) 0.84
Job Value Growth
6.58 (n=12) 7.09 (n=33) -0.51
Note. *p < .01
Note. **p < .00
In summary, while there were no significant differences between Christians and
Muslims on any of the variables, results indicate that there were a number of significant
differences between males and females. Specifically, males score significantly higher
than females on personal adversity, national adversity, assimilation, competition,
uncertainty acceptance and resilience, current income, job value now, income growth and
job value growth. Furthermore, as expected, those who were born in Lebanon had higher
national adversity than those who were born in the United States. In addition, those who
lived longer in Lebanon indicated a higher impact of national adversity and uncertainty
acceptance than those who lived a shorter period in Lebanon. Furthermore, those who
spent more than the first 14 years of their life in Lebanon have higher job value than
those who spent less than the first 14 years of their life in Lebanon. However, those who
spent less than 14 years in Lebanon have higher personal adversity and higher education
growth than those who spent more than 14 years in Lebanon.
Next, this chapter reports the results of a number of regressions. First, the 10
cultural variables are the explanatory variables and the five success measures are the
outcome variables. In addition, resilience is treated as the mediator in these stepwise
regressions. The purpose of these regressions is to examine if any of the cultural variables
have an effect on any of the outcome variables. It is important to emphasize that four of

140
the five outcome variables (excluding happiness) are treated as both static and growth
measures. Furthermore, resilience is added to the regressions to test whether the
relationship between the cultural variables and success outcomes can be fully or partially
explained by resilience.
Regressions
In the first section, the 10 cultural variables are the explanatory variables and the
five success measures are the outcome variables. This section tests the hypothesis that the
Lebanese cultural values will not be related to the success indicators of income, education
level, job value, remittances sent and happiness/life satisfaction as measured by: current
income, income growth, current education, education growth, current remittances sent,
remittances sent growth, current job value, job value growth and current happiness/life
satisfaction.
Cultural Factors on Resilience
The first regression examines the relationship between the cultural values and
resilience. The data in the table below shows that 36% of the variance in resilience can be
explained by the 12 cultural values listed in table 58. Results are significant for
assimilation, competition, superiority, insecurity, uncertainty acceptance and impulse
control. Assimilation, competition, superiority, uncertainty acceptance and impulse
control are positively correlated with resilience. Conversely, insecurity is negatively
correlated with resilience. This finding further supports this study’s theoretical
framework. Resilience was included in this study as a mediator in order to see if the
relationship between the cultural values and the success outcomes can be explained by
resilience. The regression results show that there is a relationship between six of the

141
cultural variables and resilience. These results are also in line with other research and
bodies of literature indicating that resilience is related to cultural values.
Table 58
Cultural Factors on Resilience
Unstandardized
Coefficients
Significance
Adjusted R-
square
N B Std. Error
Constant
5.86 2.76 0.03 0.36 339
Personal
Adversity
0.11 0.09 0.22
National
Adversity
-0.76 0.08 0.36
Family
Education
0.29 0.18 0.11
Personal
Education
0.30 0.16 0.06

142
Assimilation
0.49 0.12 0.00
Competition
0.46 0.14 0.00
Jealousy
-0.96 0.05 0.08
Compare to
Others
0.01 0.07 0.86
Superiority
0.20 0.05 0.00
Insecurity
-0.17 0.05 0.00
Uncertainty
0.36 0.08 0.00
Impulse
Control
0.39 0.09 0.00
Cultural Factors on Success
Current educational attainment is a success measure of interest in this study. The
second regression tested the hypothesis that Lebanese cultural values will not be related
to current educational achievement. This regression showed that no significant variables
were related to the outcome variable of current education. Moreover, adding resilience to
the regression did not change the results of this stepwise regression.

143
The lack of significance could be because educational attainment can only
increase. Stated alternatively, once someone achieves a given degree, they will always
have it, and as such, their educational attainment cannot go down. Regression analysis
helps us understand how the value of the dependent variable changes when any of the
independent variables are varied, while the other independent variables are held fixed.
Therefore, it is reasonable to think that it is less likely to see significance in a dependent
variable when its ability to change is restricted to only increasing, like in the case of
educational attainment. For this reason, in addition to the stepwise regression,
correlations were calculated in order to examine the relationship between the cultural
variables and current education. Interestingly, education static was not correlated with
any of the 10 cultural variables.
Table 59
Correlations for Cultural Variables + Education static
Personal
Adversity
National
Adversity
Family
Educ
Personal
Educ
Assimilation Competition
Education
Static
N
-0.09
317
-0.31
317
0.05
317
-0.06
317
-0.03
317
0.11
317
Note. * p < .05
Note. ** p < .01

144
Table 59
Correlations for Cultural Variables + Education static
Jealousy Compare
to Others
Superiority
Insecurity
Uncertainty Impulse
control
Education
Static
N
-0.06
317
-0.03
317
0.04
317
-0.09
317
0.04
317
-0.03
317
Note. * p < .05
Note. ** p < .01
Income static regression results. The following stepwise regression examines
the relationship between the cultural values and current income and tests the hypothesis
that the Lebanese cultural values will not be related to the success indicator of income.
The data in the table below shows that 3% of the variance in current income can be
explained by assimilation and personal education. Assimilation is positively correlated
with income static, while personal education is negatively correlated with income static.
Adding resilience to this model did not change the results of this stepwise regression.
This means that resilience does not help explain the relationship between the cultural
variables and current income.

145
Table 60
Cultural Variables on Income Static – Stepwise
Unstandardized
Coefficients
Significance
Adjusted R-
square
N B Std. Error
Constant
117,028.77 79,482.58 0.14 0.03 308
Assimilation
11,460.52 4,794.73 0.02
Personal
Education
-13,643.92 6,104.14 0.03
Table 61
Cultural Variables + Resilience on Income Static – Stepwise
Unstandardized
Coefficients
Significance
Adjusted R-
square
N B Std. Error
Constant 117,028.77 79,482.58 0.14 0.03 308

146
Assimilation
11,460.52 4,794.73 0.02
Personal
Education
-13,643.92 6,104.14 0.03
Remittances static regression result. The following stepwise regression
examines the relationship between the cultural values and current remittances sent and
tests the hypothesis that the Lebanese cultural values will not be related to the success
indicator of remittances sent. The data above shows that 4% of the variance in
remittances static can be explained by competition, comparing to others and national
adversity. Competition and national adversity are positively correlated with remittances
static. Conversely, comparing to others is negatively correlated with remittances static.
Furthermore, adding resilience to this model did not change the results of this stepwise
regression. This means that resilience does not help explain the relationship between the
cultural variables and remittances static.
Table 62
Cultural Variables on Remittances Static – Stepwise
Unstandardized
Coefficients
Significance
Adjusted R-
N B Std. Error

147
square
Constant
-3.60 2.99 0.23 0.04 304
Competition
0.53 0.22 0.02
Compare to
Others
-0.24 0.11 0.03
National
Adversity
0.30 0.15 0.04
Table 63
Cultural Variables + Resilience on Remittances Static – Stepwise
Unstandardized
Coefficients
Significance
Adjusted R-
square
N B Std. Error
Constant
-3.60 2.99 0.23 0.04 304
Competition
0.53 0.22 0.02

148
Compare to
Others
-0.24 0.11 0.03
National
Adversity
0.30 0.15 0.04
Job value static regressions. The relationship between cultural variables and job
value static was also explored. The following stepwise regression tested the hypothesis
that the Lebanese cultural values will not be related to the success indicator of present job
value. The results show that 6% of the variance in job value static can be explained by
jealousy, family education and personal adversity. Jealousy and personal adversity are
negatively correlated with job value static, while family education is positively correlated
with job value static.
When resilience was added to this model, the results indicated that 6% of the
variance in job value static could be explained by jealousy, family education, personal
adversity and resilience. Adding resilience to this model, changed the results of the
regression. With resilience included, jealousy and personal adversity remain negatively
correlated with job value static. In addition, family education continues to be positively
correlated with job value static. However, when resilience is added, it also becomes
significant. The positive relationship between resilience and current job value makes
sense and is in line with the literature on the consequences of resilience.

149
Table 64
Cultural Variables on Job Value Static – Stepwise
Unstandardized
Coefficients
Significance
Adjusted R-
square
N B Std. Error
Constant
18.04 2.42 0.00 0.06 288
Jealousy
-0.16 0.06 0.00
Family
Education
0.52 0.24 0.03
Personal
Adversity
-0.24 0.12 0.04
Table 65
Cultural Variables + Resilience on Job Value Static – Stepwise
Unstandardized
Coefficients

150
B Std. Error Significance Adjusted R-
square
N
Constant
14.43 2.92 0.00 0.06 288
Jealousy
-0.13 0.06 0.02
Family
Education
0.46 0.24 0.06
Personal
Adversity
-0.27 0.12 0.02
Resilience 0.13
0.06 0.03
Happiness static regressions. The relationship between cultural variables and
happiness was also explored. The following stepwise regression tested the hypothesis that
the Lebanese cultural values will not be related to the success indicator of happiness. The
data above shows that 18% of the variance in happiness static can be explained by
insecurity, competition, uncertainty acceptance, impulse control and family education.
Competition, uncertainty acceptance, impulse control and family education are positively
correlated with happiness static. Conversely, insecurity is negatively correlated with
happiness static. Adding resilience to the model modified the results of this stepwise
regression. The data shows that 19% of the variance in happiness static can be explained

151
by resilience and insecurity. According to the table below, resilience partially explains
the relationship between the cultural variables and happiness. Therefore, this regression
indicates that competition, uncertainty acceptance, impulse and family education are
affecting resilience and resilience is in turn affecting happiness. Similarly to the first
regression that excluded resilience, insecurity is negatively correlated with happiness
static.
Table 66
Cultural Variables on Happiness Static – Stepwise
Unstandardized
Coefficients
Significance
Adjusted R-
square
N B Std. Error
Constant
14.03 4.00 0.00 0.18 273
Insecurity
-0.31 0.07 0.00
Competition
0.52 0.23 0.03
Uncertainty
0.41 0.14 0.00
Impulse Control
0.42 0.16 0.01

152
Family
Education
0.65 0.30 0.03
Table 67
Cultural Variables + Resilience on Happiness Static – Stepwise
Unstandardized
Coefficients
Significance
Adjusted R-
square
N B Std. Error
Constant
19.25 2.84 0.00 0.19 273
Resilience
0.48 0.08 0.00
Insecurity
-0.22 0.07 0.00
Education growth regressions. After considering the relationship between the
cultural variables and various current success outcomes, the following regressions
investigate the relationship between the cultural variables and the growth of these success
measures. The stepwise regression below tested the hypothesis that Lebanese cultural
values will not be related to the growth in educational achievement. The data below

153
shows that 10% of the variance in education growth can be explained by national
adversity. National adversity is negatively correlated with education growth. Moreover,
adding resilience to the model did not change the results of this regression.
Similar to education static, correlations were examined to understand the
relationship between the cultural variables and education growth. Education growth is
positively correlated with competition and negatively correlated with national adversity.
It is reasonable to think that a competitive person who values being the best will achieve
more education growth than someone who does not hold this value.
Table 68
Cultural Variables on Education Growth – Stepwise
Unstandardized
Coefficients
Significance
Adjusted R-
square
N B Std. Error
Constant
3.22 0.34 0.00 0.10 122
National
Adversity
-0.20 0.05 0.00

154
Table 69
Cultural Variables + Resilience on Education Growth – Stepwise
Unstandardized Coefficients
Significance
Adjusted R-
square
N
B Std. Error
Constant
3.22 0.34 0.00 0.10 122
National Adversity
-0.20 0.05 0.00
Table 70
Correlations for Cultural Variables + Education Growth
Personal
Adversity
National
Adversity
Family
Educ
Personal
Educ
Assimilation Competition
Education
Growth
N
0.59
122
-0.33**
122
-0.15
122
-0.06
122
-0.08
122
0.15**
122
Note. * p < .05
Note. ** p < .01
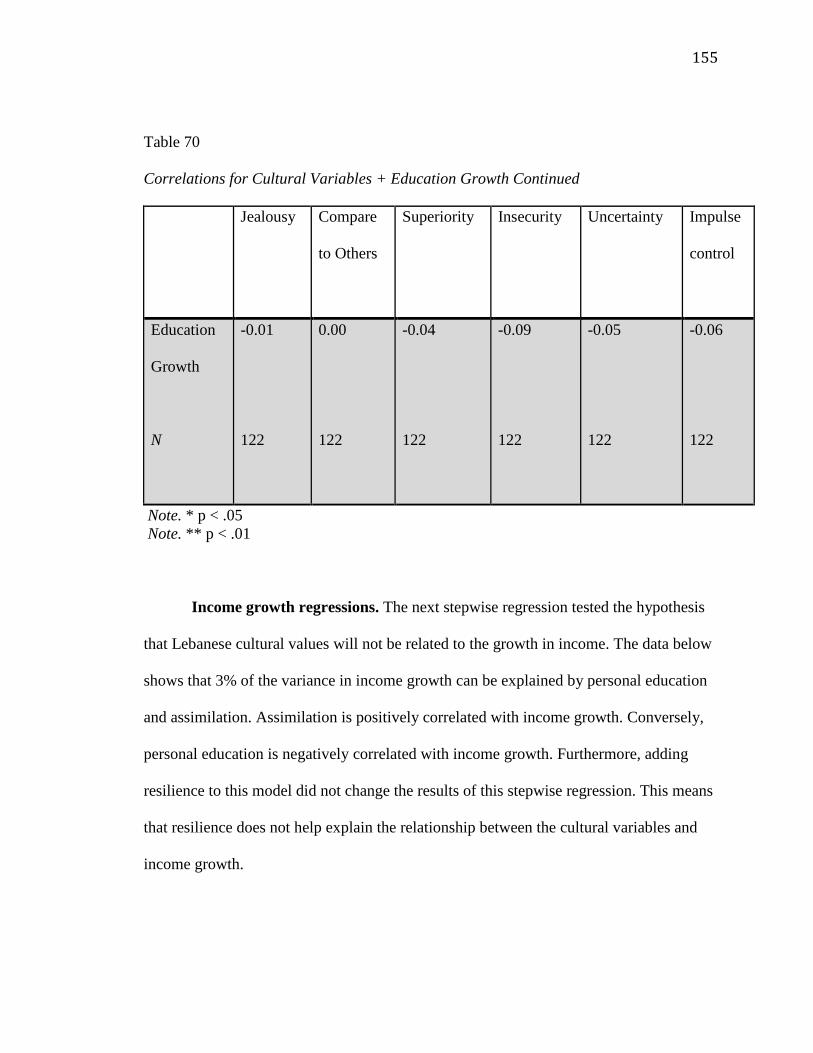
155
Table 70
Correlations for Cultural Variables + Education Growth Continued
Jealousy Compare
to Others
Superiority
Insecurity
Uncertainty Impulse
control
Education
Growth
N
-0.01
122
0.00
122
-0.04
122
-0.09
122
-0.05
122
-0.06
122
Note. * p < .05
Note. ** p < .01
Income growth regressions. The next stepwise regression tested the hypothesis
that Lebanese cultural values will not be related to the growth in income. The data below
shows that 3% of the variance in income growth can be explained by personal education
and assimilation. Assimilation is positively correlated with income growth. Conversely,
personal education is negatively correlated with income growth. Furthermore, adding
resilience to this model did not change the results of this stepwise regression. This means
that resilience does not help explain the relationship between the cultural variables and
income growth.

156
Table 71
Cultural Variables on Income Growth – Stepwise
Unstandardized
Coefficients
Significance
Adjusted R-
square
N B Std. Error
Constant
107,865.55 81,512.43 0.19 0.03 290
Personal
Education
-14,961.47 6,309.11 0.02
Assimilation
10,992.17 4,883.66 0.03
Table 72
Cultural Variables + Resilience on Income Growth – Stepwise
Unstandardized
Coefficients
Significance
Adjusted R-
square
N B Std. Error

157
Constant
107,865.55 81,512.43 0.19 0.03 290
Personal
Education
-14,961.47 6,309.11 0.02
Assimilation
10,992.17 4,883.66 0.03
Remittances growth regressions. This stepwise regression tested the hypothesis
that Lebanese cultural values will not be related to the growth in remittances sent. The
data below shows that 1% of the variance in remittances growth can be explained by
family education, which is positively correlated with remittances growth. Furthermore,
adding resilience to this model did not change the results of this stepwise regression. This
means that resilience does not help explain the relationship between the cultural variables
and remittances static.
Table 73
Cultural Variables on Remittances Growth – Stepwise
Unstandardized
Coefficients
Significance
Adjusted R-
square
N B Std. Error
Constant -6.56 3.09 0.04 0.01 302

158
Family
Education
0.75 0.33 0.02
Table 74
Cultural Variables + Resilience on Remittances Growth – Stepwise
Unstandardized
Coefficients
Significance
Adjusted R-
square
N B Std. Error
Constant
-6.56 3.09 0.04 0.01 302
Family
Education
0.75 0.33 0.02
Job value growth regressions. This stepwise regression tested the hypothesis
that Lebanese cultural values will not be related to the growth job value. The data below
shows that 5% of the variance in job value growth can be explained by personal adversity
and jealousy. Personal adversity is positively correlated with job value growth.
Conversely, jealousy is negatively correlated with job value growth. In addition, adding

159
resilience to this model did not change the results of this stepwise regression. This means
that resilience does not help explain the relationship between the cultural variables and
job value growth.
Table 75
Cultural Variables on Job Value Growth – Stepwise
Unstandardized
Coefficients
Significance
Adjusted R-
square
N B Std. Error
Constant
8.87 0.79 0.00 0.05 282
Jealousy
-0.24 0.07 0.00
Personal
Adversity
0.36 0.15 0.02
Table 76
Cultural Variables + Resilience on Job Values Growth – Stepwise
Unstandardized
Coefficients
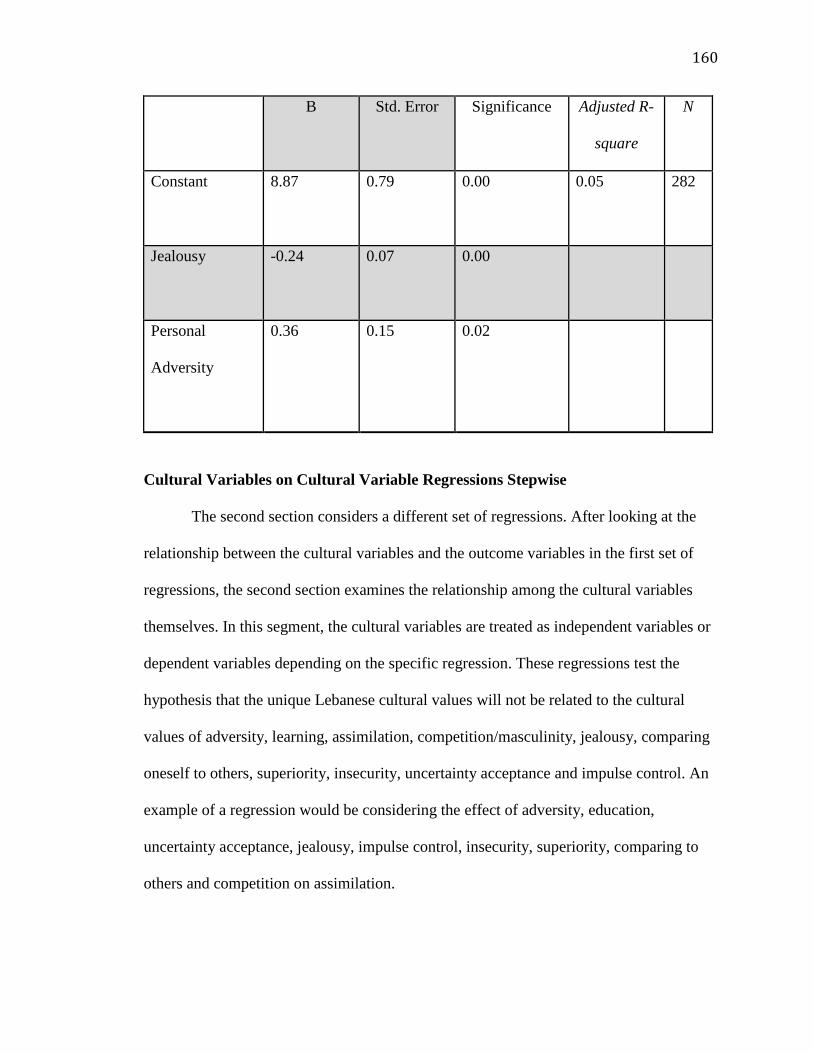
160
B Std. Error Significance Adjusted R-
square
N
Constant
8.87 0.79 0.00 0.05 282
Jealousy
-0.24 0.07 0.00
Personal
Adversity
0.36 0.15 0.02
Cultural Variables on Cultural Variable Regressions Stepwise
The second section considers a different set of regressions. After looking at the
relationship between the cultural variables and the outcome variables in the first set of
regressions, the second section examines the relationship among the cultural variables
themselves. In this segment, the cultural variables are treated as independent variables or
dependent variables depending on the specific regression. These regressions test the
hypothesis that the unique Lebanese cultural values will not be related to the cultural
values of adversity, learning, assimilation, competition/masculinity, jealousy, comparing
oneself to others, superiority, insecurity, uncertainty acceptance and impulse control. An
example of a regression would be considering the effect of adversity, education,
uncertainty acceptance, jealousy, impulse control, insecurity, superiority, comparing to
others and competition on assimilation.

161
The first stepwise regression looks at the relationship between the cultural
variables and personal adversity. The data below shows that 8% of the variance in
personal adversity can be explained by national adversity, family education and
superiority. National adversity is positively correlated with personal adversity.
Superiority is also positively correlated with personal adversity. Conversely, family
education is negatively correlated with personal adversity.
Table 77
Cultural Variables on Personal Adversity
Unstandardized
Coefficients
Significance
Adjusted R-
square
N B Std. Error
Constant
3.54 1.10 0.00 0.08 339
National
Adversity
0.23 0.05 0.00
Family
Education
-0.24 0.11 0.02
Superiority
0.05 0.03 0.05

162
Next, the relationship between the cultural variables and national adversity was
considered. The data below shows that 9% of the variance in national adversity can be
explained by personal adversity, insecurity and impulse control. Personal adversity,
insecurity and impulse control are positively correlated with national adversity.
Table 78
Cultural Variables on National Adversity
Unstandardized
Coefficients
Significance
Adjusted R-
square
N B Std. Error
Constant
2.92 0.74 0.00 0.09 339
Personal
Adversity
0.23 0.06 0.00
Insecurity
0.07 0.02 0.00
Impulse
0.15 0.06 0.01
The relationship between the cultural variables and family education was
examined. The data below shows that 5% of the variance in family education can be

163
explained by personal education, competition and personal adversity. Personal education
is positively correlated with family education. Competition is also positively correlated
with family education. Conversely, personal adversity is negatively correlated with
family education.
Table 79
Cultural Variables on Family Education
Unstandardized Coefficients
Significance
Adjusted R-
square
N
B Std. Error
Constant
7.17 0.60 0.00 0.05 339
Personal
Education
0.13 0.05 0.01
Competition
0.10 0.04 0.01
Personal
Adversity
-0.06 0.03 0.02

164
Next, I tested the relationship between the cultural variables and personal
education. The data below shows that 6% of the variance in personal education can be
explained by competition, family education and insecurity. Competition, family
education and insecurity are positively correlated with personal education.
Table 80
Cultural Variables on Personal Education
Unstandardized
Coefficients
Significance
Adjusted R-
square
N B Std. Error
Constant
5.57 0.74 0.00 0.06 339
Competition
0.11 0.04 0.01
Family
Education
0.16 0.06 0.01
Insecurity
0.03 0.01 0.02
Given that a number of the relationships in the regressions dealing with adversity
and education as outcome variables were not reasonable, along with the regressions

165
described above, I conducted correlations for personal adversity, national adversity,
family education and personal education. According to the correlation results, personal
adversity is positively correlated with national adversity and superiority. National
adversity is positively correlated with competition, insecurity and impulse control.
Family education is positively correlated with personal education and competition. In
addition, the correlation results indicated that personal education is positively correlated
with competition, jealousy, comparing yourself to others and insecurity.
Table 81
Correlations for Independent Variables (N=339)
Personal
Adversity
National
Adversity
Family
Educ
Personal
Educ
Assimilation Competition
Personal
Adversity
1 0.24** -0.11* -0.01 -0.01 0.11
National
Adversity
0.24** 1 0.04 0.07 0.03 0.15**
Family
Education
-0.11* 0.04 1 0.17** 0.04 0.16**
Personal
Education
-0.01 0.07 0.17** 1 0.05 0.18**

166
Note. * p < .05
Note. ** p < .01
Table 81
Correlations for Independent Variables Continued (N=339)
Jealousy Compare
to Others
Superiority
Insecurity
Uncertainty Impulse
control
Personal
Adversity
0.04 -0.05 0.12* 0.10 0.05 0.06
National
Adversity
0.10 0.06 0.07 0.16** 0.06 0.13*
Family
Education
-0.03 0.03 -0.02 0.06 0.07 -0.06
Personal
Education
0.12* 0.12* 0.03 0.15** 0.06 0.07
Note. * p < .05
Note. ** p < .01
Next, the relationship between the cultural variables and assimilation was
explored. The data above below that 6% of the variance in assimilation can be explained

167
by uncertainty, competition and superiority. Uncertainty acceptance is positively
correlated with assimilation. Competition is also positively correlated with assimilation.
Lastly, superiority is negatively correlated with assimilation.
Table 82
Cultural Variables on Assimilation
Unstandardized
Coefficients
Significance
Adjusted R-
square
N B Std. Error
Constant
10.09 0.76 0.00 0.06 339
Uncertainty
0.11 0.03 0.00
Competition
0.18 0.06 0.00
Superiority
-0.04 0.02 0.04
The relationship between the cultural variables and competition was examined.
The data below shows that 20% of the variance in competition can be explained by
superiority, impulse control, assimilation, family education and personal education.
Superiority is positively correlated with competition. Impulse control is also positively

168
correlated with competition. Assimilation is positively correlated with competition.
Family education is positively correlated with competition. Lastly, personal education is
positively correlated with competition.
Table 83
Cultural Variables on Competition
Unstandardized
Coefficients
Significance
Adjusted R-
square
N B Std. Error
Constant
4.66 1.08 0.00 0.20 339
Superiority
0.11 0.02 0.00
Impulse Control
0.15 0.03 0.00
Assimilation
0.16 0.05 0.00
Family Education
0.21 0.07 0.00
Personal Education
0.16 0.06 0.01

169
Next, the relationship between the cultural variables and jealousy was explored.
The data below shows that 41% of the variance in jealousy can be explained by insecurity
and comparing yourself to others. Insecurity and comparing yourself to others are
positively correlated with jealousy.
Table 84
Cultural Variables on Jealousy
Unstandardized
Coefficients
Significance
Adjusted R-
square
N B Std. Error
Constant
-0.70 0.50 0.16 0.41 339
Insecurity
0.41 0.04 0.00
Compare to Others
0.41 0.07 0.00
The relationship between the cultural variables and comparing oneself to others
was examined. The data below shows that 31% of the variance in comparing yourself to
others can be explained by jealousy, insecurity, superiority, impulse control and

170
uncertainty acceptance. Jealousy is positively correlated with comparing to others.
Insecurity and superiority are positively correlated with comparing to others. Conversely,
impulse control and uncertainty acceptance are negatively correlated with compare to
others.
Table 85
Cultural Variables on Comparing to Others
Unstandardized
Coefficients
Significance
Adjusted R-
square
N B Std. Error
Constant
4.45 1.01 0.00 0.31 339
Jealousy
0.20 0.04 0.00
Insecurity
0.12 0.03 0.00
Superiority
0.12 0.03 0.00
Impulse Control
-0.14 0.06 0.03
Uncertainty
-0.12 0.06 0.03
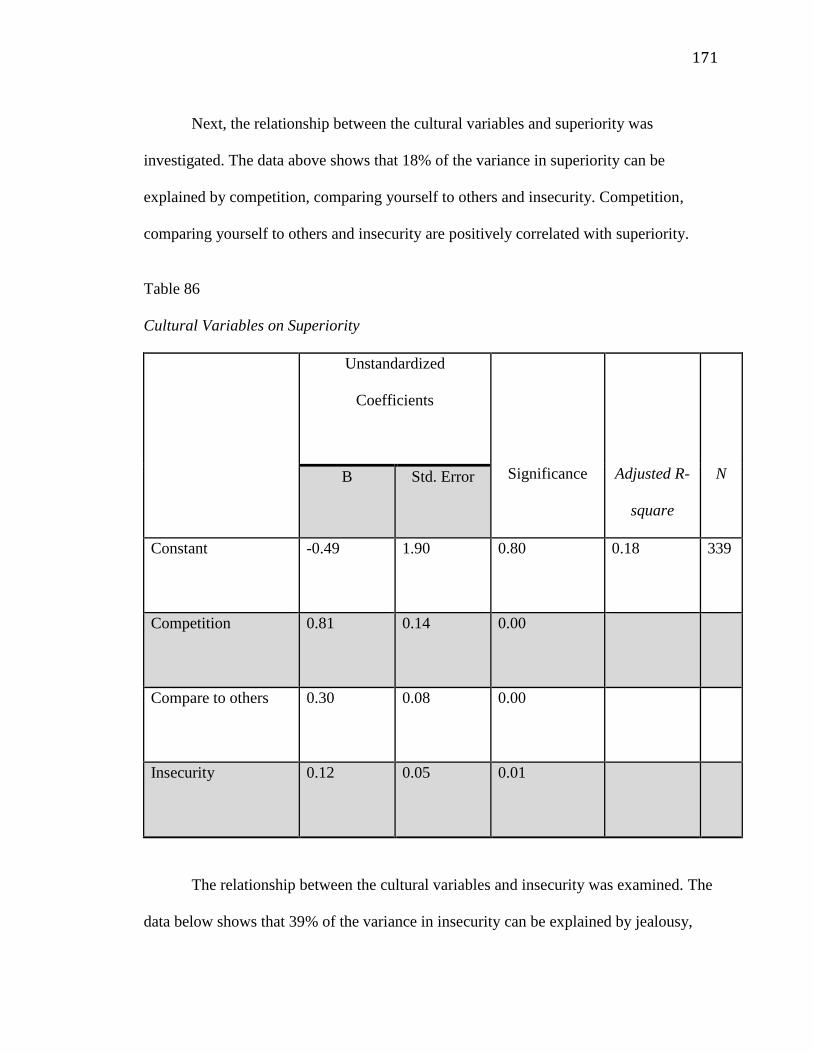
171
Next, the relationship between the cultural variables and superiority was
investigated. The data above shows that 18% of the variance in superiority can be
explained by competition, comparing yourself to others and insecurity. Competition,
comparing yourself to others and insecurity are positively correlated with superiority.
Table 86
Cultural Variables on Superiority
Unstandardized
Coefficients
Significance
Adjusted R-
square
N B Std. Error
Constant
-0.49 1.90 0.80 0.18 339
Competition
0.81 0.14 0.00
Compare to others
0.30 0.08 0.00
Insecurity
0.12 0.05 0.01
The relationship between the cultural variables and insecurity was examined. The
data below shows that 39% of the variance in insecurity can be explained by jealousy,

172
comparing yourself to others, national adversity and assimilation. Jealousy, comparing
yourself to others and national adversity are positively correlated with insecurity. Lastly,
assimilation is negatively correlated with insecurity.
Table 87
Cultural Variables on Insecurity
Unstandardized
Coefficients
Significance
Adjusted R-
square
N B Std. Error
Constant
8.28 1.91 0.00 0.39 339
Jealousy
0.55 0.06 0.00
Compare to others 0.34 0.08 0.00
National Adversity
0.23 0.09 0.01
Assimilation
-0.32 0.14 0.02
Next, the relationship between the cultural variables and uncertainty acceptance
was investigated. The data below shows that 9% of the variance in uncertainty acceptance

173
can be explained by comparing yourself to others, assimilation, jealousy, superiority.
Compare yourself to others and jealousy are negatively correlated with uncertainty
acceptance. Conversely, assimilation and superiority are positively correlated with
uncertainty acceptance.
Table 88
Cultural Variables on Uncertainty Acceptance
Unstandardized
Coefficients
Significance
Adjusted R-
square
N B Std. Error
Constant
5.66 1.20 0.00 0.09 339
Compare to Others
-0.13 0.05 0.01
Assimilation 0.30 0.08 0.00
Jealousy
-0.09 0.03 0.01
Superiority
0.07 0.03 0.03

174
The relationship between the cultural variables and impulse control was
considered. The data below shows that 10% of the variance in impulse control can be
explained by competition, comparing yourself to others, national adversity and insecurity.
Competition and national adversity are positively correlated with impulse control.
Conversely, comparing yourself to others and insecurity are negatively correlated with
impulse control.
Table 89
Cultural Variables on Impulse Control
Unstandardized
Coefficients
Significance
Adjusted R-
square
N B Std. Error
Constant
7.52 1.00 0.00 0.10 339
Competition
0.33 0.07 0.00
Compare to others -0.11 0.04 0.01
National Adversity
0.12 0.05 0.02
Insecurity -0.06 0.03 0.03

175
Success Variables on Success Variables
The third and last section considers the relationships between the outcome
variables. In this case, the success measures that were initially treated as outcome
variables are now acting as independent or dependent variables depending on the specific
regression. These regressions test the hypothesis stating that the success measures will
not be related to the success indicators of income, education level, job value, remittances
sent and happiness/life satisfaction as measured by: current income, income growth,
current education, education growth, current remittances sent, remittances sent growth,
current job value, job value growth and current happiness/life satisfaction. An example of
a regression would be considering the effect of income, job value, educational attainment
and remittances sent on happiness.
First, I looked at the relationship between the success measures and education
static. The data below shows that 24% of the variance in education static can be
explained by this model. Job value static and job value growth are positively correlated
with education static. Job value growth is also positively correlated with education static.
Lastly, income static is negatively correlated with education static.
Table 90
Success Variables on Education Static
Unstandardized
Coefficients

176
Significance
Adjusted R-
square
N B Std. Error
Constant
0.03 0.76 0.97 0.24 244
Remittances Static
-0.02 0.02 0.39
Job Value Static 0.19 0.04 0.00
Happiness Static
-0.00 0.02 0.84
Income growth
6.03E-6 0.00 0.10
Remittances Growth
-0.00 0.02 0.94
Job Value Growth
0.06 0.03 0.03
Income Static
-8.99E-6 0.00 0.01
I also considered the relationship between the success variables and education
growth. The data below shows that 15% of the variance in education growth can be
explained by this model. Job value growth is positively correlated with education growth.

177
Table 91
Success Variables on Education Growth
Unstandardized
Coefficients
Significance
Adjusted R-
square
N B Std. Error
Constant
1.28 1.04 0.22 0.15 97
Remittances Static
0.01 0.02 0.83
Job Value Static -0.02 0.05 0.68
Happiness Static
0.01 0.02 0.69
Income growth
3.74E-6 0.00 0.31
Remittances Growth
-0.02 0.03 0.49
Job Value Growth
0.11 0.03 0.00
Income Static
-4.03E-6 0.00 0.26

178
As it was stated previously in this chapter, educational attainment can only
increase. Therefore, it is reasonable to think that it is less likely to see significance in the
dependent variable when its ability to change is restricted to only increasing like in the
case of educational attainment. For this reason, correlations were conducted in order to
display the relationship between the success indicators and education. Education static is
positively correlated with education growth, income static, job value static, income
growth and job value growth. Education growth is positively correlated with job value
static, income growth and job value growth.
Table 92
Correlations for Success Variables on Education Static and Education Growth
Education
Static
Education
Growth
Income
Static
Remittances
Static
Job Value
Static
Education
Static
N
1
317
0.55**
122
0.16*
304
0.02
301
0.43**
284

179
Education
Growth
N
0.55**
122
1
122
0.11
118
0.09
115
0.22*
115
Note. * p < .05
Note. ** p < .01
Table 92
Correlations for Outcome Variables on Education Static and Growth Continued
Note. * p < .05
Note. ** p < .01
Happiness Income
Growth
Remittances
Growth
Job Value
Growth
Education
Static
N
0.05
269
0.20**
287
0.01
299
0.38**
279
Education
Growth
N
0.01
113
0.19*
111
0.12
114
0.32**
112

180
Next, I examined the relationship between the outcome variables and happiness.
The data below shows that this model can explain 9% of the variance in happiness.
Education static and income growth are negatively correlated with happiness. Lastly, job
value static is positively correlated with happiness.
Table 93
Success Variables on Happiness
Unstandardized
Coefficients
Significance
Adjusted R-
square
N B Std. Error
Constant
24.15 4.11 0.00 0.09 97
Income Static
3.07E-5 0.00 0.06
Remittances
Static
-0.11 0.10 0.30
Education Static
-0.99 0.44 0.03
Job Value Static
0.50 0.24 0.04

181
Education
Growth
0.87 0.57 0.13
Income Growth
-3.38E-5 0.00 0.05
Remittances
Growth
-0.05 0.12 0.70
Job Value Growth
0.02 0.16 0.92
The relationship between the success variables and income static was also
investigated. The data below shows that 9% of the variance in income static can be
explained by this model. Education static, remittances static and happiness static are
positively correlated with income static.
Table 94
Success Variables on Income Static
Unstandardized Coefficients
Significance
Adjusted R-
square
N B Std. Error
Constant
-109,552.63 90,675.60 0.23 0.09 107

182
Education Static
25,391.30 9,983.74 0.01
Remittances
Static
5,491.88 2,491.01 0.03
Happiness Static
5,249.52 2,381.90 0.03
Education
Growth
-8,048.99 12,600.10 0.52
Remittances
Growth
-4,497.47 2,711.90 0.10
Next, I examined the relationship between the success variables and income
growth. The data below shows that this model can explain 7% of the variance in income
growth. Education static is positively correlated with income growth.
Table 95
Success Variables on Income Growth
Unstandardized Coefficients
Significance
Adjusted R-
square
N B Std. Error

183
Constant
-84,492.64 93,945.13 0.37 0.07 101
Education
Static
22,448.34 10,163.55 0.03
Remittances
Static
4,655.88 2,509.24 0.07
Happiness
Static
3,336.59 2,469.93 0.18
Education
Growth
2,718.97 13,315.93 0.84
Remittances
Growth
-2,350.15 2,752.34 0.40
The relationship between the success variables and remittances static was
investigated. The data below shows that this model explains 6% of the variance in
remittances static. Job value growth is positively correlated with remittances static.

184
Table 96
Success Variables on Remittances Static
Unstandardized Coefficients
Significance
Adjusted R-
square
N B Std. Error
Constant
11.88 5.87 0.05 0.06 97
Education Static
-1.01 0.56 0.07
Income Static 1.62E-5 0.00 0.42
Job Value Static
-0.09 0.30 0.78
Happiness Static
-0.20 0.13 0.12
Education
Growth
0.56 0.72 0.44
Income Growth
-1.48E-5 0.00 0.48
Job Value
Growth
0.45 0.19 0.02

185
In addition, the relationship between the success variables and remittances growth
was explored. The data below shows that this model explains 7% of the variance in
remittances growth. Job value growth is positively correlated with remittances growth.
Table 97
Success Variables on Remittances Growth
Unstandardized Coefficients
Significance
Adjusted R-
square
N B Std. Error
Constant
4.99 5.25 0.35 0.07 97
Education Static
-0.60 0.50 0.23
Income Static -2.24E-5 0.00 0.21
Job Value Static
0.10 0.27 0.71
Happiness Static
-0.14 0.12 0.23
Education
Growth
0.04 0.64 0.96
Income Growth 1.52E-5 0.00 0.42

186
Job Value
Growth
0.35 0.17 0.04
I examined the relationship between the success variables and job value static.
The data below shows that this model explains 24% of the variance in job value static.
Education static and happiness are positively correlated with job value static.
Table 98
Success Variables on Job Value Static
Unstandardized Coefficients
Significance
Adjusted R-
square
N B Std. Error
Constant
10.76 2.30 0.00 0.24 105
Education Static
1.21 0.25 0.00
Remittances
Static
0.08 0.06 0.22
Happiness Static
0.20 0.06 0.00
Education
Growth
-0.35 0.32 0.28
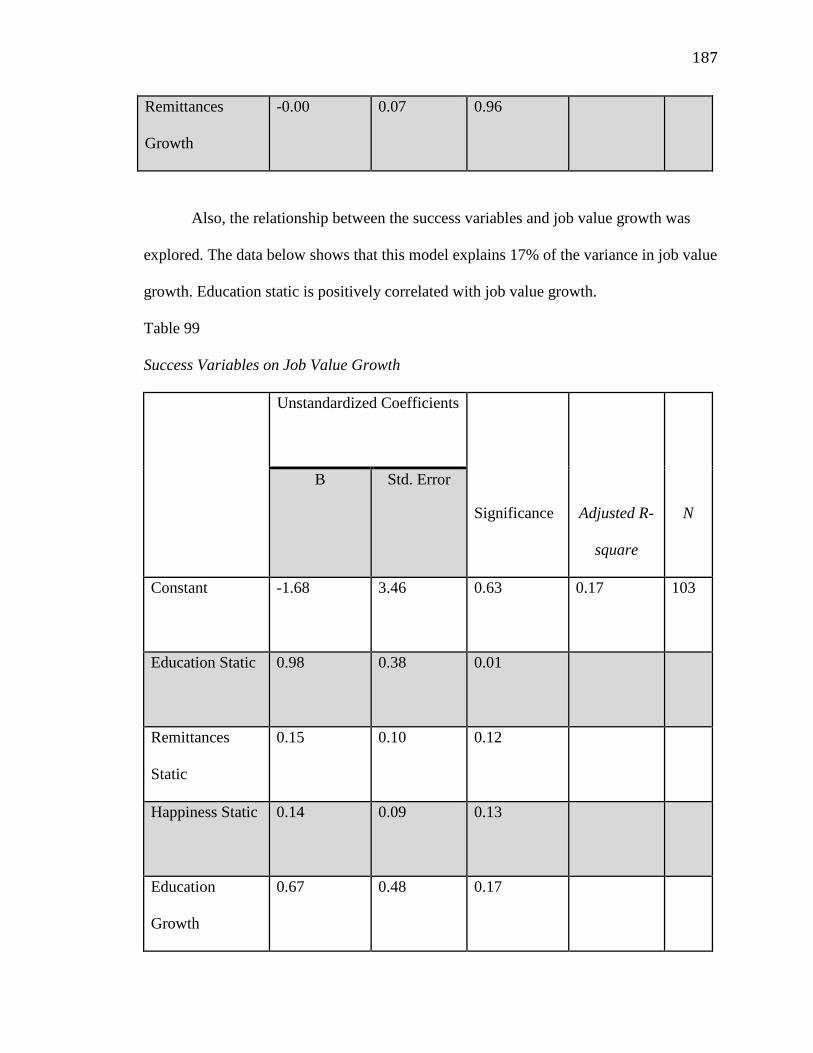
187
Remittances
Growth
-0.00 0.07 0.96
Also, the relationship between the success variables and job value growth was
explored. The data below shows that this model explains 17% of the variance in job value
growth. Education static is positively correlated with job value growth.
Table 99
Success Variables on Job Value Growth
Unstandardized Coefficients
Significance
Adjusted R-
square
N
B Std. Error
Constant
-1.68 3.46 0.63 0.17 103
Education Static
0.98 0.38 0.01
Remittances
Static
0.15 0.10 0.12
Happiness Static
0.14 0.09 0.13
Education
Growth
0.67 0.48 0.17

188
Remittances
Growth
0.06 0.10 0.60
Definitions and Reasons for Success
Lastly, the fifth segment of this chapter focuses on the last research question and
attempts to address the degree to which the participants’ definitions of success match
what they have achieved. The hypothesis is that members of the Lebanese diaspora will
choose the definition of success that matches what they have rather than what they hope
to achieve. Participants were asked to choose their definition of success among five
options including happiness, high income, impressive job title, high educational
attainment and financially supporting family in Lebanon. Table 100 presents their
ranking of these items. It is important to note that each of these constructs was measured
earlier in the survey. This analysis compares the respondents’ definition of success to
their score on that same construct.
Table 100
Definitions of Success
Definition of Success n
Happiness 174
High Income 43
Impressive Job Title and Position 39
High Educational Attainment 27
Financially Supporting Family in Lebanon 7
N 290

189
An independent Samples t-Test was conducted to see if there were any significant
differences in the means between those who picked happiness as their definition of
success and those who picked any answer other than happiness as their definition of
success. Results showed no significant differences between the two groups. Therefore,
the mean happiness score for the respondents who picked happiness as their definition of
success was not significantly different from the mean happiness score for the respondents
who picked any answer other than happiness as their definition of success.
In addition, an independent Samples t-Test was conducted to see if there were any
significant differences in the means between those who picked income as their definition
of success and those who picked any answer other than income as their definition of
success. Results showed no significant differences between the two groups. Therefore,
the mean income for the respondents who picked income as their definition of success
was not significantly different from the mean income for the respondents who picked any
answer other than income as their definition of success.
The second part of this analysis tests the hypothesis stating that the participants’
identified reason for success will match their lived experience as measured by the cultural
values of adversity, learning, assimilation, competition/masculinity, jealousy, comparing
oneself to others, superiority, insecurity, uncertainty acceptance and impulse control.
Participants were asked to select the statement that resonates the most with the reason for
their success after immigration. They were provided 10 distinct statements with each of
those statements corresponding to one of the cultural variables. The constructs for these
cultural variables were measured earlier in the survey.

190
This analysis compares the respondents’ chosen reason for success to their score
on that same construct. For instance, the adversity score for all those respondents who
identified experiences of adversity as their reason for success was calculated. Then, their
mean score was compared to the mean score of all those respondents who identified any
response other than adversity. The purpose of this analysis is to examine whether the
respondents’ chosen reason for success matched their score for the same construct. An
example of this analysis is considering whether the respondents who chose assimilation
as their reason for success after immigration had significantly higher scores for
assimilation than those who chose emphasis on education or competition as their reason
for success. The next section expands on the descriptive statistics for all the variables
included in the analysis.
Table 101
Cultural Reasons for Success
Cultural Reasons for Success Count
I developed an inner drive to succeed as a result of the challenges that I faced
when I was younger
100
My family’s emphasis on learning helped me become more successful
80
My competitiveness contributed to my success in life
38
My ability to seamlessly assimilate in the United States’ culture greatly
influenced my success
38

191
My comfort with the unknown helped me be more successful
10
Feelings of insecurity regarding my personal worth pushed me to be more
successful
9
Constantly comparing myself to others pushed me to be more successful
5
Feelings of being superior to others contributed to my success
4
My ability to resist temptation contributed to my success
4
Grand Total 288
Experiences of adversity (35%), emphasis on education (28%), competitiveness
(13%) and assimilation (13%) were the most chosen reasons for success. An independent
Samples t-Test was conducted to see if there were any significant differences in the
means between those who picked adversity as their reason for success and those who
picked any answer other than adversity as their reason for success. Results showed no
significant differences between the two groups. Therefore, the mean adversity score for
the respondents who picked experiences of adversity as their reason for success was not
significantly different from the mean adversity score for the respondents who picked any
answer other than adversity as their reason for success.

192
In addition, an independent Samples t-Test was conducted to see if there were any
significant differences in the means between those who picked education as their reason
for success and those who picked any answer other than education as their reason for
success. Results showed significant differences between the two groups. The mean
education score for the respondents who picked education as their reason for success was
significantly higher than the mean education score for the respondents who picked any
answer other than education as their reason for success. Furthermore, the respondents
who chose education as their definition of success had a significantly higher educational
attainment than those who picked any other reason for success.
An independent Samples t-Test was conducted to see if there were any significant
differences in the means between those who picked competition as their reason for
success and those who picked any answer other than competition as their reason for
success. Results showed significant differences between the two groups. The mean
competition score for the respondents who picked competition as their reason for success
was significantly higher than the mean competition score for the respondents who picked
any answer other than competition as their reason for success.
Lastly, an independent Samples t-Test was conducted to see if there were any
significant differences in the means between those who picked assimilation as their
reason for success and those who picked any answer other than assimilation as their
reason for success. Results showed no significant differences between the two groups.
The mean assimilation score for the respondents who picked assimilation as their reason
for success was not significantly different from the mean assimilation score for the
respondents who picked any answer other than assimilation as their reason for success.

193
CHAPTER FIVE
DISCUSSION OF FINDINGS AND CONCLUSION
While there is evidence suggesting that the Lebanese diaspora has been incredibly
successful, the reasons for this success have not yet been systematically studied. There
remains a limited understanding in the research of this phenomenon. For this reason, the
goal of this study was to identify and examine the factors that have led to the success of
this diaspora. This study examined members of the Lebanese diaspora in the United
States account for their success. Specific aspects of Lebanese culture were derived from
existing literature and a previously conducted pilot study. These cultural aspects included
but were not limited to experiences of adversity, emphasis on education, high degrees of
impulse control and high levels of comfort with uncertainty. The first step in the study
was to ascertain the extent to which the respondents share the cultural values typically
associated with the Lebanese, more specifically, the Triple Package. The next step was to
consider whether these values predicted their own personal success. Finally, the role of
resilience and its relationship to the cultural values and the success measures was
explored.
This study further considered the impact of various demographics on the
participants’ degree of representation of specific aspects of Lebanese culture and key
success outcomes. These demographics included gender, religious preference and number
of years spent in Lebanon. In addition, this study investigated the relationship among
Lebanese cultural values and the relationship among various success measures. Lastly,
the study examined the degree to which participants’ definitions of success matched what

194
they have achieved and considered the reasons to which study participants attributed their
success.
The following research questions guided the study:
1. To what degree are study participants representative of specific aspects of
Lebanese culture?
2. To what degree are various demographic variables (religion, gender and years
spent in Lebanon) associated with the participants’ representativeness of specific
aspects of Lebanese culture?
3. To what degree are various demographic variables (religion, gender and years
spent in Lebanon) associated with the success of members of the Lebanese
diaspora?
4. To what degree are the Lebanese cultural values correlated with the success of
the Lebanese diaspora?
5. To what degree does resilience mediate the relationship between Lebanese
cultural values and the success of the Lebanese diaspora?
6. To what do study participants attribute their success?
Overall, the findings support existing research on cultural values including
Hofstede’s dimensions and the Triple Package. This study found that members of the
diaspora demonstrated the unique cultural values of national adversity, personal
education, family education, assimilation, competition/masculinity, superiority,
insecurity, uncertainty acceptance, impulse control and resilience. Another finding was
that religion does not influence the participants’ representativeness of specific aspects of
Lebanese culture and does not affect the success of members of the Lebanese diaspora.

195
However, the results indicated that gender and years spent in Lebanon do influence
cultural values and success. When considering the degree to which Lebanese cultural
values impact the success of the Lebanese diaspora, I was not surprised to find that
assimilation is positively correlated with income static and income growth. This chapter
summarizes the findings and discusses the implications, limitations and contributions of
the research study.
Summary of Results
When considering the degree to which study participants are representative of
specific aspects of Lebanese culture, this study found that members of the diaspora
demonstrated the unique cultural values of national adversity, personal education, family
education, assimilation, competition/masculinity, superiority, insecurity, uncertainty
acceptance, impulse control and resilience. However, participants did not demonstrate the
cultural aspects of comparing oneself to others, personal adversity and jealousy. When
investigating this study’s second and third research questions and considering the degree
to which various demographic variables impact the participants’ representativeness of
aspects of Lebanese culture and the success of members of the Lebanese diaspora, this
study found that religion does not influence the participants’ representation of specific
aspects of Lebanese culture and does not affect the success of members of the Lebanese
diaspora. However, the results indicated that gender affects cultural values and success.
For example, males displayed higher levels of personal adversity, national adversity,
assimilation, competition, uncertainty acceptance and resilience. In addition, males had
higher current income, current job value and job value growth.

196
Results showed that the number of years spent in Lebanon impact the participants’
representation of aspects of Lebanese culture. For instance, those who lived more than
the first 14 years of their life in Lebanon have greater national adversity and uncertainty
acceptance than those who were born in the United States. Also, those who spent less
than the first 14 years of their life in Lebanon have higher personal adversity than those
who spent more than the first 14 years of their life in Lebanon. However, those who spent
more than the first 14 years of their life in Lebanon have higher national adversity than
those who spent less than the first 14 years of their life in Lebanon.
Another finding was that assimilation, competition, superiority, uncertainty
acceptance and impulse control are positively correlated with resilience. Conversely,
insecurity is negatively correlated with resilience. When considering the degree to which
Lebanese cultural values impact the success of the Lebanese diaspora, I was not surprised
to find that assimilation is positively correlated with income static and income growth.
However, personal education is negatively correlated with income static and income
growth. While competition and national adversity are positively correlated with
remittances static, comparing oneself to others is negatively correlated with remittances
static. Another finding was that jealousy is negatively correlated with job value static and
job value growth. In addition, competition, uncertainty acceptance, impulse control and
family education were positively correlated with happiness. However, insecurity was
negatively correlated with happiness.
Another finding was that competition, family education and insecurity were
positively correlated with personal education. Additionally, this study found that while
uncertainty acceptance and competition were positively correlated with assimilation,

197
superiority was negatively correlated with assimilation. Also, superiority, impulse
control, assimilation and personal education were positively correlated with competition.
Results indicated that insecurity and comparing yourself to others were positively
correlated with jealousy. Furthermore, while jealousy and superiority are positively
correlated with comparing oneself to others, impulse control and uncertainty acceptance
were negatively correlated with comparing oneself to others.
Another finding was that competition, comparing oneself to others and insecurity were
positively correlated with superiority. Also, while comparing to others and jealousy were
negatively correlated with uncertainty acceptance, assimilation and superiority were
positively correlated with uncertainty acceptance. Lastly, competition and national
adversity were positively correlated with impulse control. However, comparing to others
and insecurity were negatively correlated with impulse control.
Additionally, this study found that while current educational attainment and
income growth were negatively correlated with happiness, job value static was positively
correlated with happiness. Also, current education and happiness were positively
correlated with current income. Results indicated that happiness was positively correlated
with current job value. Another finding was that adding resilience to the regression
models did not change the results of most of the stepwise regressions. Resilience partially
explained the relationship between the cultural variables and happiness.
This study found that the majority of participants chose happiness as their
definition of success. Another finding was that experiences of adversity and emphasis on
education were the top two reasons for success chosen by the survey respondents. This

198
chapter discusses the findings of the quantitative survey described in chapter 4 and
addresses the limitations and significance of this study.
Representativeness of Lebanese Culture
This section addresses the first research question and the degree to which study
participants are representative of specific aspects of Lebanese culture. As previously
stated in this chapter, this study found that members of the diaspora demonstrated the
unique cultural values of national adversity, personal education, family education,
assimilation, competition, superiority, insecurity, uncertainty acceptance, impulse control
and resilience. However, participants did not demonstrate the cultural aspects of
comparing oneself to others, personal adversity and jealousy.
Personal Adversity
With an average score of 3.4 on a range from 0-10, the participants’ score for
personal adversity was moderate to low. The survey questions addressing personal
adversity asked specifically about the financial situation of the respondents’ families
when they were young. This survey did not capture other aspects of personal adversity
that could include challenges such as illness or the death of a parent. Based on these
results and while keeping in mind the limited scope of the survey questions, it appears
that on average the survey respondents belonged to the middle class and did not grow up
with a great deal of financial hardship. Research suggests that there is a positive
relationship between experiences of adversity and success. Therefore, this moderate to
low score can have an impact on the success of this study’s participants.
National Adversity
199
With an average score of 5.7 on a range from 0-10, the participants’ score for
national adversity was moderate. The survey questions inquired about adversity related to
the political conflict and instability in Lebanon. Given Lebanon’s tumultuous history, I
was expecting the national adversity score to be significantly higher. An explanation
could be that more than half of the respondents’ left Lebanon before the age of 22, which
is typically when individuals graduate college, enter the workforce and start thinking
about starting a family. The matched samples that will be presented later in this chapter
will interpret any differences that may exist between groups based on the number of years
that they lived in Lebanon. Constructs of personal and national adversity are relevant to
this study’s purpose because of the relationship between stressors and performance. Taleb
(2012) asserts that when individuals are exposed to a stressor they are forced to switch
from a passive to an effortful way of thinking. In Taleb’s opinion, Lebanese people have
developed an inner stability and inner drive to succeed because of the continued fear of
chaos. The relationship between stressors and the performance of this study’s participants
will be interpreted later in this chapter.
Family and Personal Education
With an average score of 9.4 on a range from 0-10, the participants’ score for
family education was extremely high. Survey participants were asked about their family’s
emphasis on education and the degree to which their families pushed them to get good
grades in school. In addition, with an average score of 8.9 on a range from 0-10, the
participants’ score for personal education was extremely high. Participants were asked
about their interest in learning new things and in going back to school for more

200
education. This finding is strongly related to the goal of this study and the ability to
identify the factors that may have led to the success of the Lebanese diaspora.
Assimilation
With an average score of 12.8 on a range from 0-15, the participants’ score for
assimilation was high. The assimilation questions may relate to levels of open-
mindedness, flexibility and ability to change. Similar to the education scores, the
assimilation values were not surprising and were in line with the pilot study findings.
Assimilation is important because it can play a key role in a person’s ability to fit in and
adapt to a new culture. According to Gudykunst (1991), an individual’s facility with the
country’s language greatly affects one’s amount and type of participation in addition to
one’s influence in the society. These attributes, in turn, not only shape the person’s
behavior in the new culture, but also how other members perceive the individual. As it
was previously mentioned, while Arabic is the official language in Lebanon, all students
in Lebanon are required to learn second and third languages. French and English are the
two most commonly spoken languages in Lebanon after Arabic. Therefore, it is possible
that the study participants’ language repertoire influenced the high assimilation scores.
Additionally, it is reasonable to think that the ability to assimilate is an antecedent for
success. Therefore, this cultural value is crucial to the purpose of this study and to
uncovering the reasons for the success of the Lebanese diaspora.
Competition/Masculinity
With an average score of 13.2 on a range from 0-15, the participants’ score for
competition was high. This finding is in line with and further supports Hofstede’s
masculinity dimension. In a masculine society, wanting to be the best is what drives

201
people in life. In addition, in masculine societies, the emphasis is on equity, competition
and performance. Masculinity and the drive to be the best are related to success and
accomplishments. Competition and the emphasis on performance serve as an impetus for
success. Therefore, this cultural dimension plays a key role in informing my research
questions and shedding light on the cultural factors that may have contributed to the
success of this diaspora.
Jealousy
With an average score of 6.2 on a range from 0-25, the participants’ score for
jealousy was low. It is possible that social desirability contributed to the low scores for
this cultural dimension. Despite paying particular attention to the wording of the survey
questions, overcoming the social desirability aspect was a challenge. It is difficult for
people to admit to jealousy and agree with statements that reflect those seemingly
negative feelings. This issue could have been addressed by wording the questions slightly
differently. For instance, changing the statement from “I feel badly about others making
more money than I do” to “others feel badly about me making more money than them.”
This change will still reflect a cultural behavior without requiring participants to admit to
them carrying out the specific behavior.
Comparing Oneself to Others
With an average score of 5.8 on a range from 0-15, the participants’ score for
comparing to others was moderate to low. Similarly to jealousy, social desirability
seemed to also be a factor in the questions related to comparing oneself to others. This
issue could be addressed by wording the questions slightly differently. For instance,
changing the statement from “I often compare my success to the success of others around

202
me” to “People in Lebanon compare their success to the success of others around them.”
Capturing the behavior of the collective rather than the individual might make it easier
for the respondents to agree with these less than desirable statements and behaviors. The
low scores for jealousy and comparing oneself to others could impact this study’s
research questions and skew the results. Specifically, there could be a relationship
between these cultural values and success. However, this relationship might be skewed
due to the inaccurate representation of these scores as a result of social desirability.
Superiority
With an average score of 13.4 on a range from 0-25, the participants’ score for
superiority was moderate. It is important to note that the questions on the survey asked
whether you individually believe that you are inherently better. Another way to address
superiority could have been inquiring whether as a group you collectively believe that
you are better. For example, instead of asking if you believe that you are more intelligent
than most people are, I could have asked if you believe that Lebanese people are more
intelligent than most people are. This change might have yielded different results as one’s
belief in his/her individual superiority might be different from his/her belief in the
collective superiority that stems from ethnic and cultural heritage. I believe that inquiring
about the group’s collective superiority would have been more in line with Chua and
Rubenfeld’s (2014) research on superiority.
According to Chua, the Lebanese are bolstered by the belief that, as descendants
of Phoenicians, that they are superior (Chua & Rubenfeld, 2014). When speaking about
their heritage, some Lebanese insist that they are Phoenician rather than Arabs. This
belief that the Lebanese are not Arabs and that they have their own culture that is separate

203
from that of the surrounding Middle Eastern countries may be contributing to a
stereotype boost. Superiority is a key measure in this research because positive
stereotypes and ingrained expectations about superiority significantly contribute to
achievement and success in various contexts.
Insecurity
With an average score of 11.1 on a range from 0-25, the participants’ score for
insecurity was moderate. Participants were asked about their insecurities regarding their
worth in society and their accomplishments. In addition, they were asked about fearing
losing what they have and worrying about not having enough. Similar to superiority and
comparing oneself to others, questions regarding personal insecurity could be affected by
social desirability. While feelings of insecurity do not contradict feelings of superiority,
admitting to being insecure is in some ways the antithesis of feeling superior to others.
Chua’s research suggests that the Lebanese display high levels of insecurity and insist
that this trait is an essential component of their theory and a prerequisite for success.
While the respondents’ scores for insecurity were not low, they were not as high as
expected given Chua’s research on insecurity. Insecurity is relevant to this study because
the idea that insecurity can spur accomplishment is corroborated by numerous studies
showing that a personal feeling of not being good enough or not having done well enough
is associated with better outcomes. Howard Gardner found that insecurity, particularly
stemming from childhood, is a common driver of success (Chua and Rubenfeld’s, 2014).
Uncertainty acceptance
With an average score of 9 on a range from 0-15, the participants’ score for
uncertainty acceptance was moderate to high. Participants were asked about their level of

204
comfort with future events being unpredictable and about their preference for few rules.
This finding was interesting given the fact that according to Hofstede, Lebanon scores 50
on this dimension and therefore shows no clear preference. Based on the participants’
score on this dimension, it appears that Lebanese society is more uncertainty accepting.
Members of Lebanese society tend to feel comfortable with uncertainty and ambiguity.
Additionally, the Lebanese maintain flexible codes of belief and behavior and are
generally tolerant of unorthodox behavior and ideas. Given that the assimilation score
was high, it is not surprising that uncertainty acceptance is also relatively high. It is
reasonable to think that uncertainty acceptance is an antecedent for assimilation and that
both uncertainty acceptance and assimilation have a positive effect on success after
migration.
Impulse Control
With an average score of 11.3 on a range of 0-15, the participants’ score for
impulse control was high. This finding is in line with the triple package theory. Today, an
entire subfield of experimental psychology is devoted to phenomena variously called
“effortful control”, “self-regulation”, “time discounting”, “ego strength” and
“willpower”. The results of these studies including the well known “marshmallow test”
are conclusive and bracing. Children with more impulse control go on to get better
grades, spend less time in prison, have fewer teenage pregnancies, get better jobs and
have higher incomes. In several studies, willpower and grit proved better predictors of
grades and future success than did IQ or SAT scores (Chua and Rubenfeld, 2015). This
result is also in line with Hofstede’s indulgence versus restraint dimension. Lebanon
scores 25 on this dimension, which means that the culture of Lebanon is one of restraint

205
(Hofstede, n.d.). According to Hofstede’s finding, Lebanese society does not put much
emphasis on leisure time and control the gratification of their desires. Additionally,
Lebanese people have the perception that their actions are restrained by social norms and
feel that indulging themselves is somewhat wrong (Hofstede, n.d.).
Resilience
With an average score of 31.7 on a range of 0-40, the participants’ score for
resilience was high. As stated above, this survey employed a shorter and validated
version of the Connor-Davidson Resilience scale (CD-RISC). Participants were asked
about their ability to adapt to change, dealing with the unknown, seeing the humorous
side of problems and coping with stress. In addition, they were asked about their ability
to bounce back after hardship, achieving goals despite obstacles, staying focused under
pressure and not being easily discouraged by failure. Finally, the survey respondents were
asked about the degree to which they think of themselves as strong people and the extent
to which they can handle unpleasant feelings.
It is clear that there is some overlap between some of the cultural variables
measured in this survey and the resilience questions. For instance, the ability to adapt to
change and the capacity to deal with whatever comes are part of the ability to assimilate.
In addition, staying focused under pressure is similar to impulse control. Lastly, thinking
of oneself as a strong person could be similar to some of the superiority statements. This
overlap is not surprising given that the defining attributes of resilience often stem from
cultural values.
In summary, while personal adversity scores were not very high, study
participants had relatively high scores for national adversity. Studies on resilience,

206
hardiness and antifragility indicate that adversity is an antecedent for performance and
success. This relationship will be explored in the regression analysis discussed later in the
chapter. Chua and Rubenfeld (2014) assert that superiority, insecurity and impulse
control are the three cultural communalities that propel groups to success. The authors
identified Lebanese Americans as one of the groups who have these three traits, known as
the Triple Package. According the data presented so far, the study participants displayed
moderate to high scores for insecurity, superiority and impulse control. This finding is in
line with the Triple Package theory and Hoftsede’s indulgence versus restraint dimension.
Participants scored high on masculinity, which is also congruent with Hofstede’s finding.
However, while Hofstede asserts that Lebanon shows no clear preference in terms of
uncertainty acceptance, study respondents scored high on this cultural value.
Additionally, participants scored high on education, assimilation and resilience.
These constructs are associated with performance and success and are therefore, crucial
for this research study. While members of the diaspora demonstrated most of the unique
cultural values associated with Lebanese culture, participants did not demonstrate the
constructs of comparing oneself to others, personal adversity and jealousy. The low
scores for jealousy and comparing oneself to others could affect this study’s research
questions and skew the results. Specifically, there could be a relationship between these
cultural values and success. However, this relationship might be skewed due to the
inaccurate representation of these scores as a result of social desirability. Next, this
chapter discusses the success measures used in this study.

207
Success and the Lebanese Diaspora
Along with the cultural variables and resilience, this study also encompassed a
number of success measures including income, income growth, education, education
growth, job value, job value growth, remittances sent, remittances sent growth and
happiness. According to the data presented in chapter 4, a large percentage of the sample
had a high educational attainment. This finding is in line with Khater (Freakonomics
radio, 2013) assertions. Khater stated that there are as many as three Lebanese-Americans
with doctorate degrees for every one American who has a doctorate degree. The Master’s
degree rate is also higher and is approximately 2.4 to 1.
In addition, it is clear that most participants achieved significant growth in
educational achievement since immigrating to the United States. The mean increased by
approximately one degree from the educational attainment before immigrating to the
educational attainment now. A possible reason for this high educational achievement
could be related to the focus that Lebanese society and Lebanese families place on
education. As was mentioned previously in this chapter, the participants’ score for family
education and personal education were extremely high. It is reasonable to assume that
there is a positive correlation between your family’s emphasis on education, your interest
in learning new things and your educational attainment.
Participants in this study had average earnings of approximately $145,786 in
2016. This finding supports Chua & Rubenfeld’s (2014) results discussed in both chapter
1 and 2. The authors stated that among ethnic groups in the United States, Lebanese are
close to the top of the charts in terms of household median income, percentage earning
over $100,000 and percentage earning over $200,000 (Chua & Rubenfeld, 2014).

208
Additionally, based on the data provided in chapter 4, it is clear that most participants
achieved significant growth in income since immigrating to the United States. The mean
increased by approximately $102,296 between the income in the first year of immigration
and their income now. It is possible that the significant income growth is related to the
Lebanese’s ability to assimilate in a new culture or perhaps it is a function of their
competitive nature. The regressions that tested the relationship between the cultural
variables and the various success outcomes will further address this relationship.
According to the data presented in chapter 4, the majority of this study’s
participants (72%) did not send any remittances in the first year after immigration. This
high percentage is not surprising given that it is likely that the majority of the participants
did not have disposable income in their first year after immigration. In the year of 2016,
the number of participants who did not send any remittances dropped from 72% to 57%.
However, even in 2016, the percentage of participants’ who did not send remittances to
Lebanon remains high and constitutes more than half the sample. This is surprising given
the fact that according to data, the Lebanese diaspora plays a large role in influencing
economic growth and development in Lebanon. In Lebanon, remittances are the top
source of foreign exchange earnings in Lebanon. According to the World Bank,
Lebanon’s remittances have been increasing yearly. Lebanon’s estimated remittance flow
in 2008 reached US $6 billion, an increase of four percent since 2007 (Project Middle
East, 2010). Furthermore, Lebanon ranked 18th
on the list of countries with the largest
amounts of remittances received in 2008.
Three possible factors could be contributing to this high number. There is a nearly
global distribution of the Lebanese diaspora, with a significant presence in Brazil,
209
Argentina, the United States, Canada, Australia and France (Tabar, 2010). Therefore, it is
possible that the remittances are originating from Lebanese immigrants residing outside
of the United States. Second, it is possible that over the years, older family members
residing in Lebanon passed away leaving the Lebanese immigrant with no immediate
family in Lebanon. The third reason could be that study participants helped their families
emigrate from Lebanon to the United States. The assumption with both explanations is
that study respondents are sending remittances to family members. It is also possible that
remittances are sent to various organizations and not necessarily to family members.
Further studies are needed to look at the motivations behind sending remittances to
Lebanon and how that is changing over the years.
Job value was another measure of success in this study. Participants were also
asked about their current job’s prestige, the education required for their position, the
likelihood of injury on the job and lastly their income. These questions combined formed
the job value metric. The mean for job value increased from 9.6 to 21 between the job
value in the first year after immigration and the present job value. Current happiness was
also measured in the survey. Participants were asked a number of questions relating to
family life, social relationships, job satisfaction and leisure activities. All these questions
combined formed the happiness metric. On a range from 0-45, the mean happiness score
for this study’s participants was 32.1. This is considered to be a relatively high score.
To summarize, a large percentage of the sample had a high educational
attainment, high average earnings and a high job value. Moreover, most participants
achieved considerable growth in their educational achievement, earnings and job value.
These findings are in line with research on the success of this diaspora. However, it was

210
surprising that the percentage of participants’ who did not send remittances to Lebanon
was high. Lastly, this study found that participants are happy. Next, this chapter considers
the degree to which various demographic variables affect the participants’
representativeness of specific aspects of Lebanese culture and the success of members of
the Lebanese diaspora.
The Association between Demographic Variables and Culture
This section addresses the second and third research questions and considers the
degree to which various demographic variables (religion, gender and years spent in
Lebanon) affect the participants’ representativeness of specific aspects of Lebanese
culture and the success of members of the Lebanese diaspora. Next, the results of five
matched samples are presented and interpreted.
Religion Matched Sample
The first matched sample looked at differences between Muslims and Christians.
As was mentioned in chapter 4, there were no significant differences between Muslims
and Christians in terms of cultural values, resilience and the success measures. A possible
reason for the lack of significant differences between these two religious groups could be
that the Lebanese culture and identity is more powerful than the specific religious
affiliation. It could be that members of the Lebanese diaspora are representative of
specific aspects of Lebanese culture regardless of religious preference. Both Christians
and Muslims demonstrated the unique cultural values associated with Lebanese society
and culture.

211
Gender Matched Sample
The second matched sample looked at differences between Males and females.
According to the results discussed in chapter 4, differences in the cultural values between
males and females are significant for personal adversity, national adversity, assimilation,
competition, uncertainty acceptance and resilience. Males have higher personal adversity,
national adversity, assimilation, competition, uncertainty acceptance and resilience.
These results could be attributed to the fact that Lebanese society is patriarchal. In
Lebanon, males have central roles of political leadership, religious authority and
economical power. In addition, males and females are often socialized differently in
Lebanon. The gender differences in upbringing and exposure to various experiences
might partially explain the differences in some of these cultural values between males
and females. Another possible explanation could be that the gender gap in cultural values
is not specific to Lebanese members of the diaspora. For instance, some research suggests
that males tend to be more competitive than females.
In addition, differences in the success measures between males and females are
significant for income now (static), job value now (static), income growth and job value
growth. Males have higher current income, job value now, income growth and job value
growth. Given that the study participants currently reside in the United States, these
results are also a function of the gender gap that continues to be prevalent in most
industries in the U.S. Furthermore, the differences in success measures between males
and females might be narrower or wider depending on the country. As mentioned in
chapter 1, today there is a nearly global distribution of the Lebanese diaspora, with a
significant presence in Brazil, Argentina, the United States, Canada, Australia and France
212
(Tabar, 2010). The differences in the success measures between males and females could
be different in France for instance than they are in the United States. Additional studies
including members of the Lebanese diaspora who reside outside of the United States are
necessary to further explore these differences.
U.S. to 14+ Matched Sample
This sample matched those who were born in the United States to those who lived
more than the first 14 years of their life in Lebanon. As it was stated in chapter 4,
differences in cultural values between those who were born in the United States and those
who lived more than the first 14 years of their life in Lebanon are significant for national
adversity and uncertainty acceptance. Those who lived more than the first 14 years of
their life in Lebanon have greater national adversity and uncertainty acceptance. Given
Lebanon’s years of instability and political turmoil, it is not surprising that those
participants who lived more than 14 years in Lebanon experienced greater adversity than
those who lived their entire lives in the United States. It is reasonable to assume that there
is a positive correlation between the number of years spent in Lebanon and the amount of
national adversity that a person experiences. Along with higher national adversity scores,
those who lived more than the first 14 years of their life in Lebanon also had higher
uncertainty acceptance scores. A possible explanation for this could be that the two
constructs are related. The greater uncertainty acceptance could be a result of the
experiences of adversity. This hypothesis and the relationship between these two cultural
variables will be discussed later in this chapter.

213
Less than 14 years to 14+ Matched Sample
This sample matched those who lived less than the first 14 years of their life in
Lebanon to those who lived more than 14 years in Lebanon. According to the results in
chapter 4, differences in cultural values between those who spent less than the first 14
years of their life in Lebanon and those who spent more than the first 14 years of their life
in Lebanon are significant for personal adversity and national adversity. Those who spent
less than the first 14 years of their life in Lebanon have higher personal adversity than
those who spent more than the first 14 years of their life in Lebanon. A possible
explanation for this finding is that those who immigrated at a younger age were living
under less favorable circumstances than those who immigrated later in life. It is possible
that the financial struggle experienced by their families was the driving force behind their
immigration. Perhaps those who immigrated later in life managed to complete college in
Lebanon and immigrated due to the lack of job opportunities or maybe they were
escaping the war.
However, those who spent more than the first 14 years of their life in Lebanon
have higher national adversity than those who spent less than the first 14 years of their
life in Lebanon. The same rationale used above to explain the significant difference in
national adversity between those who lived greater than the first 14 years of their life in
Lebanon and those who were born in the United States could also be used here. It is
reasonable to assume a positive correlation between the number of years spent in
Lebanon and the amount of national adversity that a person experienced. Therefore, it
would make sense that those who lived in Lebanon for a greater period have higher
scores for national adversity.

214
In addition, differences in outcome variables between those who spent less than
the first 14 years of their life in Lebanon and those who spent more than the first 14 years
of their life in Lebanon are significant for job value static. Those who spent more than the
first 14 years of their life in Lebanon have higher job value static than those who spent
less than the first 14 years of their life in Lebanon. It is possible that the current job value
metric is related to personal adversity. It was previously stated that those who spent less
than 14 years in Lebanon have higher personal adversity than those who spent more than
14 years in Lebanon. Perhaps personal adversity is negatively correlated with current job
value. Another possible explanation could be that those who spent more time in Lebanon
gained certain skills and abilities that helped them earn better jobs in the future.
US to Lebanon Born Matched Sample
This matched sample matched those who were born in the United States to those who
were born in Lebanon (irrespective of the length of their stay in Lebanon). Differences in
cultural values between those who were born in the United States and those who were
born in Lebanon are significant for national adversity. Those who were born in Lebanon
had higher national adversity than those who were born in the United States. Similar to
all the other matched samples outlined above, this finding continues to hold true. The
more time that the survey respondents spent in Lebanon the greater is their national
adversity score.
In summary, religion does not affect the participants’ representation of specific
aspects of Lebanese culture and does not affect the success of members of the Lebanese
diaspora. However, the results indicated that gender affects cultural values and success.
Results also showed that the number of years spent in Lebanon impact the participants’
215
representation of aspects of Lebanese culture. Next, this chapter discusses a number of
regression results.
The Association between Culture and the Success of the Lebanese Diaspora
This section addresses the fourth and fifth research questions and considers the
degree to which Lebanese cultural values impact the success of the Lebanese diaspora. In
addition, it investigates the extent to which resilience mediates the relationship between
Lebanese cultural values and the success of the Lebanese diaspora. Furthermore, this
section examines the relationship among the cultural values and the relationship among
the success measures.
Cultural Variables on Success measures
Cultural variables on resilience. First, I looked at the relationship between the
cultural variables and resilience. The role of culture is a critical component in
understanding processes in resilience. Similar to the way biological evolution has
equipped humans with many adaptive systems, cultural evolution has produced a host of
protective systems. This study found that assimilation, competition, superiority,
uncertainty acceptance and impulse control are positively correlated with resilience.
Conversely, insecurity is negatively correlated with resilience. In the Oxford Dictionary
of English, resilience is defined as being “able to withstand or recover quickly from
difficult conditions” (Soanes & Stevenson, 2006, p. 1498). According to the literature,
the main antecedent of resilience is deemed to be adversity. Therefore, it was surprising
to see that adversity was not a significant variable in this regression.
As mentioned in chapter 2, six defining attributes of resilience were identified in
the literature. These attributes include rebounding/reintegration, high expectancy/self-

216
determination, positive relationships/social support, flexibility and sense of humor. The
term “reintegration” describes the process after disruption or adversity in which an
individual wants to return to a regular routine or “get back to normal.” The concept of
reintegration is similar to the cultural value of assimilation. Therefore, the finding that
assimilation is positively related to resilience is in line with the literature. In addition,
high expectancy is a sense of purpose and achievement in life (Benard, 1991). This sense
of purpose may be internal or external. Self-determination is a feeling that regardless of
what the circumstances or barriers are in life, the individual will overcome the barriers
and excel (Benard, 1991). The concepts of high expectancy and self-determination could
be related to both competition and impulse control. The sense of purpose and
achievement in life are prevalent in masculine societies and therefore could come hand in
glove with a highly competitive nature. Impulse control can also be related to self-
determination and high expectancy.
The term “flexibility” captures the essence of adaptability, being cooperative and
tolerant and having an easy temperament (Benard, 1991). Adaptability, flexibility and
tolerance are closely tied to the concept of uncertainty acceptance. It is reasonable to
believe that the more adaptable, flexible, tolerant and uncertainty accepting an individual
is, the more resilient he/she will be. The literature on self-esteem and self-efficacy in
relation to resilience is vast. Self-esteem and self-efficacy are often credited with the
answer to “why some people snap and others snap back (Benard, 1991)”. While feelings
of superiority are not exactly synonymous to self-efficacy and self-esteem, a connection
between all three terms can be made. If self- esteem and self-efficacy are antecedents for
resilience, feelings of superiority can also be predictors for resilience. Lastly, insecurity is

217
negatively correlated with resilience. This makes sense given that insecurity can be
thought of as the antithesis of self-esteem and self-efficacy.
Cultural variables on education static. Next, I tested the relationship between
the cultural variables and education static. There were no significant variables in this
stepwise regression. Furthermore, adding resilience to the model did not change the
results of this regression. The lack of significance could be due to the fact that
educational attainment can only increase. Stated alternatively, once someone achieves a
given degree they will always have it and their educational attainment cannot go down.
Regression analysis helps us understand how the value of the dependent variable changes
when any of the independent variables changes by one unit, while the other independent
variables are held fixed. Therefore, it is reasonable to think that it is less likely to see
significance in the dependent variable when its ability to change is restricted to only
increasing like in the case of educational attainment.
For this reason, in addition to the stepwise regression, correlations were
conducted in order to display the relationship between the cultural variables and
education. Education static was not correlated with any of the 10 cultural variables.
Cultural variables on education growth. The relationship between the cultural
variables and education growth was also explored in a stepwise regression. According to
the data in chapter 4, national adversity is negatively correlated with education growth. A
possible explanation for why national adversity is negatively correlated with education
growth is related to priorities. Perhaps educational growth is not as important as finding a
job or earning high income to someone who struggled in Lebanon to find a job and

218
maintain a stable income. Moreover, adding resilience to the model did not change the
results of this regression.
Similar to education static, correlations were measured in order to understand the
relationship between the cultural variables and education growth. Education growth is
positively correlated with competition and negatively correlated with national adversity.
It is reasonable to think that a competitive person who values being the best will achieve
more education growth than someone who does not hold this value.
Cultural variables on income. Next, I looked at the relationship between the
cultural variables and income. According to the results outlined in chapter 4, assimilation
is positively correlated with income static. The positive relationship between assimilation
and income is not surprising. An immigrant’s ability to assimilate in a new society and
culture is likely to have a positive effect on his/her income and success. Conversely,
personal education is negatively correlated with income static. The personal education
questions asked about the respondents’ willingness to go back to school and pursue more
education. Often times, returning to school for additional degrees negatively affects
current income due to the opportunity cost inherent in this choice. Adding resilience to
this model did not change the results of this stepwise regression. This means that
resilience does not help explain the relationship between the cultural variables and
current income.
Cultural variables on income growth. The relationship between the cultural
variables and income growth was also explored. Similarly to the income static regression,
assimilation is positively correlated with income growth. In addition, personal education
is negatively correlated with income growth. The same rationale presented in the income
219
static regression can be offered here. Furthermore, adding resilience to this model did not
change the results of this stepwise regression. This means that resilience does not help
explain the relationship between the cultural variables and income growth.
Cultural variables on remittances static. Next, I looked at the relationship
between the cultural variables and remittances static. While competition and national
adversity are positively correlated with remittances static, comparing oneself to others is
negatively correlated with remittances static. Greater experiences of national adversity
yield a higher percentage of remittances sent back to Lebanon. A possible explanation for
this relationship is that the greater the challenges related to Lebanon’s political and
economic instability, the more invested someone becomes in helping others who remain
in this unfortunate situation. A possible reason behind the positive relationship between
competition and remittances sent is that individuals are competitive when it comes to the
amount of money they send back in the form of remittances.
Typically, one would expect competition and comparing oneself to others to move
in the same direction. However, in this case comparing oneself to others is negatively
correlated with the percentage of income someone sends in the form of remittances. A
possible explanation for this relationship is that while respondents are competitive when
it comes to the amount of remittances they are sending to Lebanon, they use a different
barometer when comparing themselves to others. These benchmarks might not include
remittances and in fact may inhibit respondents from sending more remittances. This can
include things like material belongings or expensive experiences such as travel.
Furthermore, adding resilience to this model did not change the results of this stepwise
220
regression. This means that resilience does not help explain the relationship between the
cultural variables and remittances static.
Cultural variables on remittances growth. Next, I tested the relationship
between the cultural variables and remittances growth. According to the findings in
chapter 4, family education is positively correlated with remittances growth. A possible
explanation for this relationship is that if your family places a great deal of emphasis on
education and you still have family members residing in Lebanon, it is possible that you
are sending money in the form of remittances to help your family members complete
their education. This finding might be related to the collectivistic nature of Lebanese
society. In collectivistic cultures, group interests are stressed and individuals display a
long-term commitment towards their family and extended relationships (Hofstede, n.d.).
It is important to note that adding resilience to this model did not change the results of
this stepwise regression. This means that resilience does not help explain the relationship
between the cultural variables and remittances growth.
Cultural variables on job value static. The relationship between cultural
variables and job value static was also explored. The data in chapter 4 showed that
jealousy and personal adversity are negatively correlated with job value static. It is
possible that those respondents who experienced a greater deal of personal adversity
started out at a disadvantage compared to those who grew up under better circumstances.
This might explain why personal adversity and current job value are negatively
correlated. Based on the regression results, jealousy appears to hinder the respondents’
current job value. In addition, family education is positively correlated with job value

221
static. It is reasonable to think that your family’s emphasis on education when you were
younger had a positive effect on the job you have years later.
When resilience was added to this model, the results of the regression changed.
With resilience included, jealousy and personal adversity remain negatively correlated
with job value static. In addition, family education continues to be positively correlated
with job value static. However, when resilience is added, it also becomes significant. The
positive relationship between resilience and current job value makes sense and is in line
with the literature on the consequences of resilience.
Cultural variables on job value growth. Next, the relationship between cultural
variables and job value growth was investigated. Based on the results in chapter 4,
personal adversity is positively correlated with job value growth. This is a shift from the
findings in the current job value regression. While personal adversity is negatively
correlated with current job value, it is positively correlated with job value growth. As I
mentioned previously, it is possible that those who experienced greater personal adversity
during their childhood start out with a disadvantage. However, the job value growth
regression reveals that personal adversity is positively related to job value growth.
Therefore, despite the fact that those who experienced greater personal adversity have
lower current job values, they have grown more than those who experienced lesser
personal adversity. It is possible that over a period, those who experienced greater
adversity can continue to grow and eclipse those who currently have a better job value.
Conversely, jealousy is negatively correlated with job value growth. Similar to its
effect on current job value, based on the regression results, jealousy appears to hinder the
respondents’ job value growth. Furthermore, adding resilience to this model did not

222
change the results of this stepwise regression. This means that resilience does not help
explain the relationship between the cultural variables and job value growth.
Cultural variables on happiness. I also explored the relationship between the
cultural variables and current happiness. According to the data presented in chapter 4,
competition, uncertainty acceptance, impulse control and family education are positively
correlated with happiness static. Conversely, insecurity is negatively correlated with
happiness static. It is reasonable to think that feelings of insecurity inhibit happiness.
Adding resilience to the model modified the results of this stepwise regression.
According to the results, resilience partially explains the relationship between the cultural
variables and happiness. Therefore, this regression indicates that competition, uncertainty
acceptance, impulse and family education are affecting resilience and resilience is in turn
affecting happiness. Similar to the first regression that excluded resilience, insecurity is
negatively correlated with happiness static.
To summarize, assimilation, competition, superiority, uncertainty acceptance and
impulse control are positively correlated with resilience. Conversely, insecurity is
negatively correlated with resilience. This finding is in line with the literature on the
antecedents and defining attributes of resilience. When considering the degree to which
Lebanese cultural values impact the success of the Lebanese diaspora, I was not surprised
to find that assimilation is positively correlated with income static and income growth.
An immigrant’s ability to assimilate in a new society and culture is likely to have a
positive effect on his/her income and success. However, personal education is negatively
correlated with both income static and income growth. Often times, returning to school
for additional degrees negatively affects current income due to the opportunity cost

223
inherent in this choice. Another finding was that jealousy is negatively correlated with
job value static and job value growth. In addition, competition, uncertainty acceptance,
impulse control and family education were positively correlated with happiness.
However, insecurity was negatively correlated with happiness. Another finding was that
adding resilience to the regression models did not change the results of most of the
stepwise regressions. Resilience partially explained the relationship between the cultural
variables and happiness. Next, this chapter considers a different set of regressions.
Cultural Variables on Cultural Variable Regressions Stepwise
After discussing the relationship between the cultural variables and the success
variables in the first set of regressions, the relationship among the cultural variables
themselves was examined. In this segment, the cultural variables are treated as either
independent variables or dependent variables depending on the specific regression. The
purpose of these regressions is to investigate if any of the cultural characteristics have an
effect on any of the other cultural variables measured in this survey.
Cultural variables on personal adversity. First, I looked at the effect of cultural
variables on personal adversity. According to the results illustrated in the previous
chapter, national adversity is positively correlated with personal adversity. It is
reasonable to think that growing up in a politically and economically unstable country
will have an effect on your personal adversity. People’s financial circumstances and their
ability to support their families are often influenced by the stability of the country they
live in. Superiority is also positively correlated with personal adversity. The relationship
between superiority is not very meaningful in this case given the fact that the survey
measured the respondents’ personal adversity specifically as it related to their childhood.

224
On the other hand, the survey tested their current feelings of superiority. Therefore, it is
not reasonable to say that an increase in superiority leads to an increase in personal
adversity. According to the regression results, family education is negatively correlated
with personal adversity. Similar to superiority, the relationship between family education
and personal adversity is not meaningful in this case. It is not reasonable to think that an
increase in your family’s emphasis on education decreases the amount of adversity that
you experienced growing up.
Cultural variables on national adversity. Next, the relationship between the
cultural variables and national adversity was considered. Personal adversity is positively
correlated with national adversity. While it is difficult to make the argument that an
increase in personal adversity leads to an increase in national adversity given the fact that
national adversity transcends the individual experiences of adversity, there is a possible
explanation for this relationship. It is possible that experiences of personal adversity
influence the person’s interpretation of national adversity. In other words, the greater
personal adversity a given person experiences, the more negative is his/her interpretation
of the political conflict and instability in Lebanon. Another explanation is that national
adversity has a greater negative effect on those who are less financially stable. Stated
alternatively, those who had little money growing up were more negatively affected by
the national conflict and struggled more to find jobs.
Insecurity is also positively correlated with national adversity. While it might
seem impossible to think that an individual’s feelings of insecurity can affect the national
adversity construct, there is a potential explanation for this relationship. It is plausible
that feelings of insecurity affect a person’s response to national adversity. The national

225
adversity questions asked about feeling worried about finding a job and the degree to
which the conflict in Lebanon affected one’s life negatively. Perhaps the more insecure
someone is, the worse is the impact of national adversity. This explanation assumes that
one’s feelings of insecurity today are similar to what this person experienced when they
were younger. Lastly, impulse control is positively correlated with national adversity.
The relationship between impulse control and national adversity is not meaningful in this
case. It is not reasonable to think that an increase in your current degree of impulse
control can influence the extent to which the political conflict in Lebanon affected your
life growing up.
Cultural variables on family education. The relationship between the cultural
variables and family education was examined. Personal education is positively correlated
with family education. This specific relationship between personal education and family
education is not reasonable. While the argument can be made that your family’s emphasis
on education can affect the value that you currently place on education, it is difficult to
say that your personal interest in education and learning affects how much emphasis your
family placed on education when you were growing up.
Competition is also positively correlated with family education. The same
argument can be made here. While it is reasonable to think that your family’s focus on
education affected how competitive you are today, it is difficult to say that your
competitiveness today affects how much emphasis your family put on education during
your childhood years. The results of this regression also indicated that personal adversity
is negatively correlated with family education. As I previously mentioned, the personal
adversity questions focused primarily on the financial circumstances of the respondents’

226
families. Therefore, it is reasonable to think that those who are struggling financially may
have priorities that supersede pushing the children to get good grades and pursue
additional degrees.
Cultural variables on personal education. Next, I tested the relationship
between the cultural variables and personal education. Competition is positively
correlated with personal education. It is reasonable to think that the more competitive
someone is, the greater the emphasis on learning will be. Family education is also
positively correlated with personal education. As stated previously in this section, the
direction of this relationship is reasonable. It is not surprising that your family’s emphasis
on education positively affects the value that you currently place on learning and
education. Lastly, insecurity is positively correlated with personal education. The
insecurity questions asked participants about how confident they are in what they have
done and what they have. It is reasonable to think that an increase in feelings of
insecurity has a positive effect on someone’s willingness to go back to school for more
education.
Given that a number of the relationships in the regressions dealing with adversity
and education as outcome variables were not reasonable, along with the regressions
described above, I conducted correlations for personal adversity, national adversity,
family education and personal education. According to the correlation results, personal
adversity is positively correlated with national adversity and superiority. In terms of the
direction of this relationship, it is reasonable to suggest that an increase in national
adversity is associated with an increase in personal adversity. In addition, it is reasonable
to say that an increase in personal adversity is associated with an increase in superiority.

227
In the triple package (2014), the authors indicate that superiority could be the result of
overcoming personal struggle and hardship.
The correlations also indicate that personal adversity is negatively correlated with
family education. In terms of the direction of this relationship, it is reasonable to
speculate that an increase in personal adversity leads to a decrease in the family’s
emphasis on education. The rationale for the direction of this relationship was presented
earlier in this section. National adversity is positively correlated with competition,
insecurity and impulse control. As far as the direction of this relationship, it is reasonable
to think that an increase in national adversity can lead to an increase in competition,
feelings of insecurity and impulse control. However, one can also suggest that an increase
in feelings of insecurity can affect someone’s interpretation and reaction to national
adversity.
Family education is positively correlated with personal education and
competition. In terms of the direction of this relationship, it is reasonable to say that an
increase in family education can lead to an increase in one’s personal emphasis on
education and level of competitiveness. In addition, the correlation results indicated that
personal education is positively correlated with competition, jealousy, comparing
yourself to others and insecurity. As far as the direction of this relationship, it is
reasonable to think that an increase in personal education is associated with an increase in
competition, jealousy, comparing oneself to others and insecurity. However, one can also
suggest that an increase in feelings of insecurity can be associated with someone’s
emphasis on learning and interest in pursuing further education.

228
Cultural variables on assimilation. Next, the relationship between the cultural
variables and assimilation was explored. Uncertainty acceptance is positively correlated
with assimilation. It is realistic to think that being comfortable with future events being
unpredictable and being comfortable in unknown situations is positively related to
someone’s ability to assimilate in a new environment. Competition is also positively
correlated with assimilation. One can reasonably say that if someone values being
successful and being the best, he or she is likely to be open to changing their behaviors to
fit the culture they are in. Lastly, superiority is negatively correlated with assimilation.
Feeling superior to others might hinder someone’s ability to adjust to living with people
who have different beliefs than them.
Cultural variables on competition. The relationship between the cultural
variables and competition was examined. Superiority is positively correlated with
competition. Feelings of superiority can affect how competitive someone is and how
much they value being the best at everything they do. Impulse control is also positively
correlated with competition. An increase in the ability to resist temptation and being very
disciplined can lead to an increase in valuing success and being the best. In addition,
assimilation is positively correlated with competition. The easier someone is able to
assimilate in a new culture the more competitive they often are. Family education is
positively correlated with competition. Lastly, personal education is positively correlated
with competition. It is reasonable to think that an increase in family education or personal
education can lead to an increase in valuing being the best and being competitive.
Cultural variables on jealousy. Next, the relationship between the cultural
variables and jealousy was explored. Insecurity is positively correlated with jealousy. It is
229
reasonable to say that an increase in feelings of insecurity regarding someone’s worth and
accomplishments can lead to an increase in feelings of jealousy. Comparing yourself to
others is also positively correlated with jealousy. It is also possible to say that an increase
in someone’s tendency to compare themselves to others can lead to an increase in
feelings of jealousy.
Cultural variables on comparing oneself to others. The relationship between
the cultural variables and comparing oneself to others was examined. Jealousy is
positively correlated with comparing to others. The more jealous someone is the more
likely they are to compare themselves to others. Insecurity is positively correlated with
comparing to others. The more insecure someone is, the more likely they are to compare
themselves to others. Superiority is also positively correlated with comparing to others. It
also is reasonable to say that the more superior someone feels, the more likely they are to
compare themselves and their accomplishments to others. Conversely, impulse control is
negatively correlated with compare to others. It is reasonable to say that the more impulse
control someone has, the less likely they are to compare themselves to others. In addition,
uncertainty acceptance is negatively correlated with compare to others. In addition, the
more uncertainty accepting someone is, the less likely they are to compare themselves to
others.
Cultural variables on superiority. Next, the relationship between the cultural
variables and superiority was investigated. Competition is positively correlated with
superiority. It is plausible to think that an increase in competitiveness can lead to an
increase in feelings of superiority. Comparing yourself to others is positively correlated
with superiority. It is realistic to suspect that an increase in the tendency to compare

230
oneself to others may lead to an increase in feelings of superiority. Lastly, insecurity is
positively correlated with superiority. This finding is line with the triple package theory.
The authors argue that these traits are not contradictory and that they are both essential
traits for success.
Cultural variables on insecurity. The relationship between the cultural variables
and insecurity was examined. Jealousy is positively correlated with insecurity.
Comparing yourself to others is positively correlated with insecurity. It is not surprising
that feelings of jealousy and the tendency to compare oneself to others can lead to an
increase in feelings of insecurity. National adversity is positively correlated with
insecurity. It is reasonable to think that experiencing political and economic conflict can
lead to greater insecurity. Lastly, assimilation is negatively correlated with insecurity. It
is not surprising to see that challenges in regards to assimilating in a new culture can lead
to an increase in feelings of insecurity.
Cultural variables on uncertainty acceptance. Next, the relationship between
the cultural variables and uncertainty acceptance was investigated. Compare yourself to
others is negatively correlated with uncertainty acceptance. It is plausible to suggest that
someone who has the tendency to compare themselves to others has a harder time
accepting uncertainty. In addition, jealousy is negatively correlated with uncertainty
acceptance. It is reasonable to suspect that someone who feels jealous towards others has
a harder time accepting uncertainty. Conversely, assimilation is positively correlated with
uncertainty acceptance. Given that the constructs of assimilation and uncertainty
acceptance are similar, it is not surprising to see that an increase in the ability to
assimilate can lead to a greater comfort with the unknown. Finally, superiority is

231
positively correlated with uncertainty acceptance. Feelings of superiority can positively
affect someone’s ability to being comfortable in unknown situations.
Cultural variables on impulse control. The relationship between the cultural
variables and impulse control was considered. Competition is positively correlated with
impulse control. Being competitive and valuing being the best can enable the ability to be
highly disciplined and to resist temptation. National adversity is also positively correlated
with impulse control. Experiences of national conflict can help someone put off short-
term gains for long-term success and can enhance their ability to resist temptation.
Conversely, comparing yourself to others is negatively correlated with impulse control.
Lastly, insecurity is also negatively correlated with impulse control. Feelings of
insecurity and tendencies to compare yourself to others can hinder your ability to be
disciplined and to resist temptation.
In summary, this study found that while uncertainty acceptance and competition
were positively correlated with assimilation, superiority was negatively correlated with
assimilation. Results indicated that insecurity and comparing yourself to others were
positively correlated with jealousy. Furthermore, while jealousy and superiority were
positively correlated with comparing oneself to others, impulse control and uncertainty
acceptance were negatively correlated with comparing oneself to others. Also, while
comparing to others and jealousy were negatively correlated with uncertainty acceptance,
assimilation and superiority were positively correlated with uncertainty acceptance.
Lastly, competition and national adversity were positively correlated with impulse
control. However, comparing to others and insecurity were negatively correlated with

232
impulse control. Next, this chapter considers the relationships between the outcome
variables.
Success Measures on Success Measures Regressions
In these regressions, the success measures that were initially treated as outcome
variables are now acting as independent or dependent variables depending on the specific
regression. The purpose of this final set of models is to examine if any of the success
indicators have an effect on any of the other measures of success.
Success measures on education static. First, I looked at the relationship between
the success measures and education static. Job value static is positively correlated with
education static. An increase in the value of someone’s current job might encourage them
to pursue further education. Job value growth is also positively correlated with education
static. Similarly to current job value, an increase in the growth of the value of someone’s
job might encourage them to pursue further education. Lastly, income static is negatively
correlated with education static. It is reasonable to think that an increase in someone’s
earnings might discourage someone from pursuing further education, as they might not
see value in doing so.
Success measures on education growth. I also considered the relationship
between the success variables and education growth. Job value growth is positively
correlated with education growth. An increase in the growth of the value of someone’s
job might lead to an increase in someone’s education growth.
As it was stated previously in this chapter, educational attainment can only
increase. Therefore, it is reasonable to think that it is less likely to see significance in the
dependent variable when its ability to change is restricted to only increasing like in the

233
case of educational attainment. For this reason, correlations were conducted in order to
display the relationship between the success indicators and education. Education static is
positively correlated with education growth, income static, job value static, income
growth and job value growth. In terms of the direction of these relationships, it is
plausible to suggest that an increase in education can lead to an increase in current
income, current job value, income growth and job value growth. However, one can also
propose that an increase in income or job value can provide someone with the funds
necessary to pursue further education. In terms of the direction of these relationships, it is
plausible to suggest that an increase in education growth can lead to an increase in
current job value, income growth and job value growth. However, similarly to the
education static correlations, one can also suspect that an increase in income growth or
job value can provide someone with the funds necessary to pursue further education.
Success measures on happiness. Next, I examined the relationship between the
outcome variables and happiness. The term happiness carries many different meanings
and a consensus of the use of the word has never emerged. In the last few decades, social
scientists have expanded the definition of happiness to include objective wellbeing and
subjective wellbeing. Objective wellbeing includes concepts such as stability, hardiness,
stability, economic prosperity and progress. Subjective wellbeing encompasses concepts
such as job satisfaction, self-esteem, contentment, and life satisfaction (Veenhoven,
1980). This study found that education static is negatively correlated with happiness. An
increase in educational attainment is associated with a lower happiness score. A possible
explanation for this relationship could be related to the financial burden that is often
associated with pursuing an education. Another explanation could be that those who are

234
pursuing an education are also employed and having to balance both commitments is
chipping away at their happiness.
Income growth was also negatively correlated with happiness. A plausible
explanation for this negative relationship is that the added stress that often time
accompanies and increase in earnings may be taking away from someone’s happiness. It
is possible that the increase in income comes with longer work hours and less leisure
time. Lastly, job value static is positively correlated with happiness. This finding is in
line with the literature provided in chapter 2. Fineman (1987) claims that work is a key
source of identity, self-respect and social status. The author asserts that it is the most
central life activity, is intrinsically valuable and is difficult to separate from other aspects
of life. Therefore, it is reasonable to predict that a better job yields greater happiness.
Success measures on income static. The relationship between the success
variables and income static was investigated. Education static is positively correlated
with income static. While this is not always the case, in most instances a higher
educational attainment yields a higher income. Remittances static is positively correlated
with income static. When the relationship between income and remittances is being
considered, one would typically assume that an increase in income leads to an increase in
remittances sent. However, the relationship illustrated in this regression is the opposite
direction. In this case, an increase in remittances sent is associated with an increase in
income. One possible explanation is that the ability to financially support people in
Lebanon serves as a motivator and a driving force to earn more money. Happiness static
is also positively correlated with income static. It is believable to think the happier
someone is the more successful and the higher income they earn.

235
Success measures on income growth. Next, I examined the relationship between
the success variables and income growth. Education static is positively correlated with
income growth. It is not surprising that an increase in education can yield an increase in
income growth.
Success measures on remittances static. The relationship between the success
variables and remittances static was investigated. Job value growth is positively
correlated with remittances static. It is realistic to think that an increase in job value
growth may lead to an increase in the amount of remittances that someone is sending
back to Lebanon.
Success measures on remittances growth. In addition, the relationship between
the success variables and remittances growth was explored. Job value growth is
positively correlated with remittances growth. Similar to the relationship between job
value growth and remittances static, it is reasonable to think that an increase in job value
growth may lead to an increase in the growth of the remittances that someone is sending
back to Lebanon.
Success measures on job value static. I examined the relationship between the
success variables and job value static. Education static is positively correlated with job
value static. The relationship stating that an increase in education can lead to a better job
value is reasonable. Happiness static is positively correlated with job value static. Having
a particular occupation is associated with levels of financial earnings, stress, social
prestige, physical exertion, autonomy, non-monetary benefits, intellectual engagement,
exposure to hazardous materials and scheduling flexibility. Therefore, it is realistic to
think that happier people have better jobs. An explanation for this relationship could be

236
that happier people are able to put in greater effort into their jobs and are able to produce
better outcomes than those who are not as happy.
Success measures on job value growth. In addition, the relationship between the
success variables and job value growth was explored. Education static is positively
correlated with job value growth. It is not surprising that an increase in education can
lead to an increase in the growth of someone’s job value.
To summarize, this study found that while current educational attainment and
income growth were negatively correlated with happiness, job value static was positively
correlated with happiness. Also, current education and happiness were positively
correlated with current income. Results indicated that happiness was positively correlated
with current job value. It is believable to think the happier someone is the more
successful and the higher income they are going to earn. Next, this chapter examines the
degree to which participants’ definitions of success matched what they have achieved and
considers the reasons to which study participants attributed their success.
Definitions and Reasons for Success
It is important to reiterate that as was the case with the regressions, only those
individuals who were born in Lebanon were included in this part of the analysis. This
section of the chapter focuses on the last research question.
Definitions of Success
Study participants were asked to choose their definition of success. They were
provided five options including happiness, high income, impressive job title, high
educational attainment and financially supporting family in Lebanon. I was surprised by
the large number of respondents (60%) who chose happiness as their definition of

237
success. I was also surprised that only seven respondents identified the ability to
financially support family in Lebanon as their definition of success. With that said, this
finding is in line with previously discussed data suggesting that the majority of the
respondents did not send any remittances in the year of 2016.
These findings led me to the question of whether people’s definition of success
represents what they have or what they hope to achieve. In other words, am I likely to
pick happiness as my definition of success if I am happy or if I am unhappy? Do I
identify high income as my definition of success if I currently earn a lot of money or if I
hope to earn high wages in the future? Do I choose impressive job title and position
because that is what I have today or is it because I do not currently have a great job? Am
I likely to pick educational attainment as my definition of success because that is what I
have achieved or because I have yet to do so? Lastly, does my definition of success
encompass financially supporting family in Lebanon because this is what I am already
doing or because my hope is to be able to do so?
To answer these questions, independent samples t-Tests were conducted to
compare the mean scores for those who picked this success variable as their definition of
success and those who picked anything other than this variable. The purpose was to see if
those who picked a specific success variable had a significantly higher mean for the same
construct than those who picked anything else. Independent samples t-Tests were
conducted for the top two definitions of success, which were happiness and high income.
Based on the results displayed in chapter 4, the mean happiness score for the
respondents who picked happiness as their definition of success was not significantly
different from the mean happiness score for the respondents who picked any answer other

238
than happiness as their definition of success. In addition, the mean income for the
respondents who picked income as their definition of success was not significantly
different from the mean income for the respondents who picked any answer other than
income as their definition of success.
Reasons for Success
Study participants were also asked to select the statement that resonates the most
with the reason for their success after immigration. They were provided 10 distinct
statements with each of those statements corresponding to one of the cultural variables.
Almost 34% of the respondents chose experiences of adversity as their reason for
success. This result was surprising given that the mean scores for both adversity
constructs were relatively low as compared to the other cultural variables measured in
this survey. I was not surprised to see that emphasis on education was the second most
popular reason for success given the fact that the mean scores for both education
constructs were extremely high. Of the 10 statements that were provided, nine were
selected. The statement that was not chosen was related to feelings of jealousy.
These findings led me to the question of whether people’s reason for success
matches what they have experienced or what they are currently experiencing. In other
words, did the respondents who chose adversity as their reason for success have higher
adversity scores than those who chose emphasis on education, competitiveness,
assimilation, uncertainty acceptance, insecurity, comparing oneself to others, superiority
or impulse control? Did the respondents who chose emphasis on education as their reason
for success have higher personal and family education scores than those who chose any
of the other variables? Did the respondents who chose competitiveness as their reason for

239
success have higher competition scores than those who chose any of the other variables?
Did the respondents who chose the ability to assimilate as their reason for success have
higher assimilation scores than those who chose any of the other variables?
To answer these questions, independent samples t-Tests were conducted. Results
showed that the mean adversity score for the respondents who picked experiences of
adversity as their reason for success was not significantly different from the mean
adversity score for the respondents who picked any answer other than adversity as their
reason for success. In addition, the mean assimilation score for the respondents who
picked assimilation as their reason for success was not significantly different from the
mean assimilation score for the respondents who picked any answer other than
assimilation as their reason for success.
Conversely, the mean education score for the respondents who picked education
as their reason for success was significantly higher than the mean education score for the
respondents who picked any answer other than education as their reason for success.
Furthermore, the respondents who chose education as their definition of success had a
significantly higher educational attainment than those who picked any other reason for
success. In addition, the mean competition score for the respondents who picked
competition as their reason for success was significantly higher than the mean
competition score for the respondents who picked any answer other than competition as
their reason for success.
In summary, this study found that the majority of participants chose happiness as
their definition of success. Another finding was that experiences of adversity and
emphasis on education were the top two reasons for success chosen by the survey

240
respondents. Next, this chapter discusses limitations, representativeness of the sample,
contributions, significance and future research.
Limitations and Delimitations
Researcher subjectivity was an important consideration in this study. I emigrated
from Lebanon to the United States eleven years ago and I am a member of the diaspora I
am studying. Therefore, it was important to be aware of my subjectivity as I conducted
this research. While my bias could have entered into the construction of the survey, it
also informed it. My perspective is unique and cannot be had by someone who is not part
of the culture I am studying. Therefore, even though my positionality may have led to
possible bias, it also added significant insight to this study.
Given that I was the one who constructed the survey instrument, there are a
number of considerations regarding the psychometric properties of this instrument
including reliability and validity. Internal reliability measures whether the items in a scale
are consistent in what they measuring. In other words, are all the items measuring the
same construct? Given that reliability is partly a function of the number of items, I used
longer scales for most of the constructs in an attempt to increase reliability. The
reliability scores presented in chapter 4 indicate that overall, the survey instrument used
in this study is reliable. Given the survey length constraints, a number of the constructs
were measured using shorter scales, thus leading to lower reliability values for these
specific constructs.
Another consideration is content validity, which measures the degree to which an
instrument covers the range of meanings for that concept. I mitigated this issue by asking
members of the Lebanese diaspora to evaluate the questions and provide feedback prior

241
to launching the survey. Pretesting the survey helped identify problems with the survey
that could not have been otherwise anticipated.
Finally, generalizability is an important consideration for this study. Given that
closed Facebook groups were my primary method for data collection, I was able to reach
a representative sample. The sample used in this study was representative of the larger
population in terms of gender, religious preference, marital status, income and
educational attainment. In addition, by using social media to recruit participants, I was
able to obtain a geographically diverse sample. This study’s participants reside in
numerous states and are not located in a singular geographic location. With that said, a
delimitation is that this study only included Lebanese-Americans and excluded members
of the diaspora who reside outside the United States. Therefore, generalizing the findings
of this study to other members of the Lebanese diaspora living outside of the United
States is challenging. Next, this chapter considers the sample’s external validity.
Representativeness of the Sample and External Validity
It is important to consider whether the sample of respondents was representative
of the Lebanese diaspora and whether based on the characteristics of the sample, the
findings can be generalized. While the sample had some unique characteristics, overall, it
appears to be representative of the Lebanese diaspora in the United States. In terms of
gender, the sample is representative of the Lebanese population in the United States.
Males were slightly overrepresented in my sample compared to the population in the
United States. Additionally, the sample appears to be representative of the Lebanese
population in the United States. Over 50% of both the Lebanese population in the United

242
States and the sample in this study are currently married. In addition, never married is the
second largest category for both groups.
The survey participants were slightly older than the Lebanese population in the
United States. This could be a result of the survey and data collection procedures.
Facebook was the primary platform for data collection in this study. As of January 2017,
52% of Facebook users in the United States were above the age of 34. In 2011, only 38%
of Facebook users were above the age of 34. Research shows that younger adults are
turning to other social media platforms such as Instagram and Twitter. The fact that
Facebook’s users tend to be older than they used to be and older than other social media
platform users might have affected the age of the sample in this study.
Another possible explanation could be related to the self-selection process that
was inherent in this survey. It is possible that this study and the topic of research
appealed to an older group of Lebanese Americans. As mentioned in chapter 1, a number
of historians identify two pivotal moments in Lebanese history and point to two major
waves of emigration (Khater, 2001, Tabar, 2010, Chua & Rubenfeld, 2014). The first flux
of emigration ran from 1880 to 1920. The next exodus came during Lebanon’s war,
which began in 1975 (Khater, 2001, Tabar, 2010). The oldest person to participate in this
study is 82 years old indicating that none of this study’s respondents immigrated during
the first flux of immigration. However, given the large numbers of Lebanese people who
migrated during the civil war, it is very likely that a number of the survey respondents
left Lebanon during the civil war. Given that the civil war erupted over 42 years ago and
ended over 27 years ago, it is reasonable to assume that the majority of the survey

243
respondents who immigrated during this period are going to be in their 40’s, 50’s, and
60’s today.
With respect to educational attainment, there are some differences between both
groups. The majority of the Lebanese population in the U.S. falls in the Associate,
Bachelor’s or graduate degree categories. Moreover, all three levels of educational
attainment are approximately equal. Conversely, the educational attainment for the
survey respondents was on the fringe rather than staggered across the various levels. It
appears that the majority of the participants who attended college managed to complete at
least a Bachelor’s and in most cases a graduate or professional degree in addition to their
Bachelor’s degree. In addition, 18% of the sample did not complete a high school
diploma.
A potential explanation for the large percentage of the sample that did not
complete a high school diploma could be related to the nature of jobs that Lebanese
people chose to do when they migrated to the United States. According to Chua and
Rubenfeld (2014), the Lebanese diaspora is famously entrepreneurial and many Lebanese
entrepreneurs and business people worldwide have proven to be very successful. A
college degree is not a prerequisite for starting your own business. Therefore, it is
possible that a number of this study’s participants chose the entrepreneurial route rather
than attending college and completing a degree.
The mean earnings for this study’s participants were $145,787 compared to
$107,047 for the Lebanese population. The fact that the mean earnings of the survey
respondents is approximately $40,000 higher than the mean earnings of the Lebanese
population in the United States could be attributed to the topic of this research. A study

244
about the success of members of the diaspora is likely to attract those who have higher
earnings especially given that income is the most prevalent conceptualization of success.
Data on religious preference was also collected from this study’s participants. While
there are no exact figures regarding the religious breakdown of Lebanese Americans,
multiple sources indicate that the majority are Christians. Furthermore, various sources
state that the vast majority of Lebanese Christians in the United States belong to the
Maronite denomination. According to the demographic data presented in chapter 4, the
sample is representative of the larger population. Christians constituted the majority of
the sample with Maronite Christians being the largest denomination. With that said, the
survey captured a number of other religious groups including Sunnis, Shi’as and Druze.
Chapter 4 also presented data on both age of immigration and the number of years
that the participants have been living in the United States. While it was explicitly stated
that this study was seeking participants who were born in Lebanon and who resided there
for a period of time, 12% or 45 participants were born in the U.S. A number of these
participants indicated in their surveys that while they were not born in Lebanon, they
continue to maintain strong ties and visit Lebanon frequently. Rather than excluding this
group from this study, I chose to include them in a matched sample to compare them to
those who were born in Lebanon. The purpose of the matched sample is to see if there are
any differences between these groups. However, they were excluded from the regressions
that will be presented later in this chapter. The demographic data shows that
approximately 73% or 278 participants spent at least the first 14 years of their life in
Lebanon. Given the fact that the majority of the sample emigrated from Lebanon after the

245
age of 14 indicates that most of this study’s participants’ were exposed to valuable
experiences and important milestones that are unique to Lebanese culture.
Conclusion, Significance and Future Research
This study shed light on the degree to which members of the Lebanese diaspora
are representative of specific aspects of Lebanese culture. The results demonstrated that
the Lebanese diaspora holds and displays most of the unique cultural values associated
with Lebanese culture. This finding is in line with the Triple Package theory and
Hoftsede’s dimensions. However, participants did not demonstrate the constructs of
comparing oneself to others, personal adversity and jealousy. Issues of social desirability
might have contributed to the low scores for these constructs. Additionally, a large
percentage of the sample had a high educational attainment, high average earnings and a
high job value. Moreover, most participants achieved considerable growth in their
educational achievement, earnings and job value. These findings are in line with research
on the success of this diaspora. However, it was surprising that the percentage of
participants’ who did not send remittances to Lebanon was high. Lastly, this study found
that participants are happy.
This study showed that members of the Lebanese diaspora are representative of
specific aspects of Lebanese culture regardless of religious preference. Results indicated
that both Christians and Muslims demonstrate the unique cultural values that are
associated with Lebanese society and culture. However, the results indicated that gender
affects cultural values and success. Results also showed that the number of years spent in
Lebanon impact the participants’ representation of aspects of Lebanese culture.

246
This study also explored the degree to which Lebanese cultural values relate to
the success of the Lebanese diaspora in the United States and then investigated the role of
resilience in mediating this relationship. This study found that assimilation, competition,
superiority, uncertainty acceptance and impulse control are positively correlated with
resilience. Conversely, insecurity is negatively correlated with resilience. This finding is
in line with the literature on the antecedents and defining attributes of resilience. When
considering the degree to which Lebanese cultural values impact the success of the
Lebanese diaspora, I was not surprised to find that assimilation is positively correlated
with income static and income growth. An immigrant’s ability to assimilate in a new
society and culture is likely to have a positive effect on his/her income and success.
However, personal education is negatively correlated with both income static and income
growth. Often times, returning to school for additional degrees negatively affects current
income due to the opportunity cost inherent in this choice. Another finding was that
jealousy is negatively correlated with job value static and job value growth. In addition,
competition, uncertainty acceptance, impulse control and family education were
positively correlated with happiness. However, insecurity was negatively correlated with
happiness.
The relationship among the cultural variables themselves was also examined. This
study found that while uncertainty acceptance and competition were positively correlated
with assimilation, superiority was negatively correlated with assimilation. Results
indicated that insecurity and comparing yourself to others were positively correlated with
jealousy. Furthermore, while jealousy and superiority are positively correlated with
comparing oneself to others, impulse control and uncertainty acceptance were negatively

247
correlated with comparing oneself to others. Lastly, competition and national adversity
were positively correlated with impulse control. However, comparing to others and
insecurity were negatively correlated with impulse control.
This research also examined if any of the success indicators have an effect on any
of the other measures of success. This study found that while current educational
attainment and income growth were negatively correlated with happiness, job value static
was positively correlated with happiness. Also, current education and happiness were
positively correlated with current income. Results indicated that happiness was positively
correlated with current job value.
This research contributes to literature in that it helped us understand important
aspects of Lebanese culture. It confirmed other cultural research including the Triple
package Theory and Hofstede’s cultural dimensions. This study helped us ascertain the
demographic variables that affect individuals’ representativeness of specific aspects of
Lebanese culture and success. Findings indicated that gender and time spent in Lebanon
affect cultural values and success. This study further validated the research on the cultural
antecedents of resilience. Findings showed that assimilation, competition, superiority,
uncertainty acceptance and impulse control are positively correlated with resilience.
Additionally, it shed light on the degree to which Lebanese cultural values impact the
success of the Lebanese diaspora. I found that the ability to assimilate has a positive
effect on both current income and income growth. In addition, results showed that
feelings of jealousy have a negative impact on both current job value and job value
growth. In terms of happiness, this study found that a competitive nature, being
uncertainty accepting, impulse control and your family’s emphasis on education have a

248
positive effect on how happy you are. However, feelings of insecurity chip away at
happiness.
This study also contributed to the existing literature on cultural research in that it
investigated the relationship among various cultural variables. I found that uncertainty
acceptance has a positive effect on the ability to assimilate. Another finding was that
masculinity has a positive impact on impulse control. Another contribution to the
literature is related to the relationship among various success outcomes. This study
confirms existing research on happiness and job satisfaction. Results indicate that current
job value has a positive effect on happiness. Findings add to the literature in that they
indicate that educational achievement and income growth take away from how happy you
are. This study also found that happiness in turn contributes to income and job value.
While the literature encompasses various definitions of success, this study found that
happiness was the number definition of success. Additionally, an interesting finding was
that those who identified happiness as their number one definition of success are not as
happy as those who picked another definition. When asked about the reason for their
success, experiences of adversity and emphasis on education were the top two reasons for
success chosen by the survey respondents. Finally, it is important to note that the
contributions of this study are not limited to Lebanese culture. Lessons learned from
Lebanon and Lebanese people can be applicable to other cultures. In addition, this
study’s findings can help inform the success and experiences of other immigrant groups
and can add significant knowledge to the field of migration studies.
Future research can look into the cultural aspects of jealousy and comparing
oneself to others. In this study, participants did not demonstrate these traits and a possible

249
explanation could be social desirability. Therefore, future studies might want to use
different wording for these questions to make them less susceptible to social desirability.
In addition, results indicated that adding resilience to the regression models did not
change the results of most of the stepwise regressions. Future research can consider other
mediating and moderating variables that could be affecting the relationship between
culture and success. This study was limited to members of the diaspora residing in the
United States. Future research can include members of the diaspora living outside of the
United States and can consider differences between groups based on their host country.
Finally, if I were asked to use the findings of this study to help determine the
factors that will increase the chances of having a successful child, my answer will
encompass the following narrative. Based on my results, in order to raise a child to be
successful, parents and societies should instill in them three key values. These values
include competitiveness, uncertainty acceptance and impulse control. Despite the
negative connotation that is often times associated with raising competitive children, this
study’s findings suggest that there is a great deal of value in competition. Results
suggested that competitiveness is positively associated with resilience, happiness,
impulse control and the ability to assimilate. Furthermore, assimilation was positively
correlated with both current income and income growth. The second antecedent for
successful children is the ability to accept uncertainty. Results suggested that uncertainty
acceptance is positively associated with happiness, resilience and assimilation. Lastly,
this study found that impulse control is a key predictor of resilience and happiness. In
summary, the factors that will increase the chances of having a successful child are the
values of competitiveness, uncertainty acceptance and impulse control.

250
REFERENCES
Abdelhady, D. (2011). Immigrant identities, communities and forms of cultural
expression: The Lebanese diaspora in New York, Montreal, and Paris.
Ayala, J. C., & Manzano, G. (2014). The resilience of the entrepreneur. Influence on the
success of the business. A longitudinal analysis. Journal of Economic Psychology,
42, 126-135.
Bacha, N. N., & Bahous, R. (2011). Foreign language education in Lebanon: A context of
cultural and curricular complexities. Journal of Language Teaching and
Research, 2(6), 1320-1328.
Beauvais, A. M., Stewart, J. G., DeNisco, S., & Beauvais, J. E. (2014). Factors related to
academic success among nursing students: A descriptive correlational research
study. Nurse Education Today, 34(6), 918-923.
Bernard, B. (1995). Fostering Resilience in Children. ERIC Digest.
Campbell‐Sills, L., & Stein, M. B. (2007). Psychometric analysis and refinement of the
connor–davidson resilience scale (CD‐RISC): Validation of a 10‐item measure of
resilience. Journal of traumatic stress, 20(6), 1019-1028.
Childs, A., & Klimoski, R. J. (1986). Successfully predicting career success: An
application of the biographical inventory. Journal of Applied Psychology, 71(1),
3.
Chua, A., & Rubenfeld, J. (2014). The triple package: How three unlikely traits explain
the rise and fall of cultural groups in America. Penguin Press.
Connor, K. M., & Davidson, J. R. (2003). Development of a new resilience scale: The
Connor‐Davidson resilience scale (CD‐RISC). Depression and anxiety, 18(2), 76-
82.
Earvolino‐Ramirez, M. (2007, April). Resilience: A concept analysis. In Nursing forum
(Vol. 42, No. 2, pp. 73-82). Blackwell Publishing Inc.
England, G., 1975. The manager and his values. Cambridge, MA: Ballinger.
Faour, M. A. (2007). Religion, demography, and politics in Lebanon. Middle Eastern
Studies, 43(6), 909-921.
Fletcher, D., & Sarkar, M. (2013). Psychological resilience. European
Psychologist.
Gudykunst, W., & Ting-Toomey, S.1988. Culture and interpersonal commiunication.

251
Newbury Park, CA: Sage.
Gudykunst, W. 1991. Bridging differences: Effective intergroup communication.
Newbury Park, CA: Sage.
Hall, Richard H. Organizations: Structure and Process. Prentice Hall, Englewood Cliffs,
NJ, 1982.
Hambrick, D. C., Davidson, S. C., Snell, S. A., & Snow, C. C. 1998. When Groups
Consist of Multiple Nationalities: Towards a New Understanding of the
Implications. Organization Studies (Walter De Gruyter Gmbh & Co. KG.), 19(2),
181-205.
Hauser, R. M., & Warren, J. R. (1997). 4. Socioeconomic indexes for occupations: A
review, update, and critique. Sociological methodology, 27(1), 177-298.
Hofstede, G. H., Hofstede, G. J., & Minkov, M. (2010). Cultures and organizations.
Software of the mind: Intercultural cooperation and its importance for survival.
Hofstede, G. (n.d.). Retrieved August 21, 2017, from https://geert-
hofstede.com/lebanon.html
Hofstede, G. 1980. Culture's consequences: International differences in work-related
values. Beverly Hills, CA and London: Sage.
Hourani, A., & Shehadi, N. (1992). The Lebanese in the world: a century of emigration.
Kahneman, D. (2011). Thinking, fast and slow. Macmillan.
Khater, A. F. (2001). Inventing home: Emigration, gender, and the middle class in
Lebanon, 1870-1920. Univ of California Press.
Kluckholn, F., and Strodbeck, F. 1961. Variations in value orientations. San Francisco,
CA: Row Peterson.
La France, M., & Mayo C. 1978. 'Cultural aspects of nonverbal communication'.
International Journal of Intercultural Relations 2:71-89.
Lebanon Civil War. (n.d.). Retrieved August 21, 2017, from
http://www.globalsecurity.org/military/world/war/lebanon.htm
Lebanon profile - Timeline. (2017, August 7). Retrieved August 21, 2017, from
http://www.bbc.com/news/world-middle-east-14649284
Lord, R., & Foti, R.1986. Schema theories, information processing, and organizational
behavior' in The thinking organization. H.P. Sims, Jr. and D.A. Gioia (eds.), 20-

252
48. San Francisco: Jossey-Bass.
Luthans, F., Avolio, B. J., Avey, J. B., & Norman, S. M. (2007). Positive psychological
capital: Measurement and relationship with performance and satisfaction.
Personnel psychology, 60(3), 541-572.
Luthar, S. S., Cicchetti, D., & Becker, B. (2000). The construct of resilience: A critical
evaluation and guidelines for future work. Child Development, 71, 543–562.
Maruyama, M.1980. Mindscapes and science theories. Current Anthropology 21: 589-
599.
Mesquita, B., & Frijda, N.1992. Cultural variations in emotions: A review. Psychological
Bulletin 112:179-204.
Nakao, K., & Treas, J. (1994). Updating occupational prestige and socioeconomic scores:
How the new measures measure up. Sociological methodology, 1-72.
Richardson GE, Neiger B, Jensen S, Kumpfer K. 1990. The resiliency model. Health
Education 21:33–39.
Souri, H., & Hasanirad, T. (2011). Relationship between resilience, optimism and
psychological well-being in students of medicine. Procedia-Social and
Behavioral Sciences, 30, 1541-1544.
Strack, F. E., Argyle, M. E., & Schwarz, N. E. (1991). Subjective well-being: An
interdisciplinary perspective. Pergamon press.
Tabar, P. (2010). Lebanon: A country of Emigration and Immigration. Institute for
Migration Studies, 7.
Tait, M. (2008). Resilience as a contributor to novice teacher success, commitment, and
retention. Teacher Education Quarterly, 35(4), 57-75.
Taleb, N. N. (2012). Antifragile: Things that gain from disorder (Vol. 3). Random House.
Trompenaars, F., & Hampden-Turner, C. (2012). Riding the waves of culture:
Understanding cultural diversity in business. London, England: Brealey in top-
management groups. Administrative Science Quarterly, 29: 74-92.
Veenhoven, R. (1991). Questions on happiness: Classical topics, modern answers, blind
spots. Subjective well-being: An interdisciplinary perspective, 2, 7-26.
Warren, J. R., & Kuo, H. H. (2000). How to Measure “What People Do For a
Living” in Research on the Socioeconomic Correlates of Health.

253
Wright, M. O. D., Masten, A. S., & Narayan, A. J. (2013). Resilience processes in
development: Four waves of research on positive adaptation in the context of
adversity. In Handbook of resilience in children (pp. 15-37). Springer, Boston,
MA.

254
APPENDIX A
Survey Instrument

255
Table A1
Demographic Questions
1. What is your sex?
2. In what year were you born?
3. What is your marital status?
4. Do you currently live in the United States?
5. Did you spend at least the first 14 years of your life in Lebanon?
6. How old were you when you immigrated to the United States?
7. What is your religious preference?

256
Table A2
Representativeness of Cultural Characteristics
Characteristics Measured Survey Question
Adversity
1. I started working before the age of 14 to help support
my family
2. When I was growing up, my family had little money
3. When I was living in Lebanon, I was worried about
finding a job
4. The political conflict in Lebanon affected my life
negatively
Learning 1. My family placed great emphasis on education
2. My family pushed me to get good grades in school
3. I enjoy learning new things
4. The idea of going back to school for more education is
appealing to me
Assimilation 1. I can adjust to living with people who have different
beliefs than me
2. I am open to changing my behavior to fit the culture I
am in
3. I have adjusted to life in America

257
Competition/Masculinity
1. I am very competitive
2. I value being the best in everything I do
3. Being successful at work is very important to me
Jealousy 1. I feel badly about others making more money than I do
2. Meeting others who are more talented than me upsets
me
3. I get uneasy when I think others are happier than me
4. I am resentful of those who are better educated than me
5. I am envious of those who appear to have better
families than me
Comparing yourself to
others
1. I often compare my success to the success of others
2. I often compare my life to the lives of those individuals
who still reside in Lebanon
3. I measure my success by comparing myself to (check
all that apply)
a) Acquaintances b) Family members g) None of the
above
c) Coworkers d) Famous persons
e) Friends f) Neighbors
Superiority Complex 1. I believe I am more intelligent than most people

258
2. I overcame more challenges than most people
3. I believe I am more hardworking than most people
4. I feel superior to others around me
5. I believe I am special
Sense of insecurity
1. I worry that what I have done is not good enough
2. I worry that I do not have enough
3. I feel like I still need to prove myself
4. I am insecure about my worth in society
5. I fear losing what I have
Uncertainty Acceptance 1. I am comfortable with future events being
unpredictable
2. I am comfortable in unknown situations
3. I have a preference for few rules
Impulse Control
1. I am able to resist temptation
2. I tend to be very disciplined
3. I can put off short-term gains for long-term success

259
Table A3
Connor-Davidson Resilience Scale
Survey Question
1. I am able to adapt to change
2. I can deal with whatever comes
3. I try to see humorous side of problems
4. Coping with stress can strengthen me
5. I tend to bounce back after illness or hardship
6. I can achieve goals despite obstacles
7. I can stay focused under pressure
8. I am not easily discouraged by failure
9. I think of myself as a strong person
10. I can handle unpleasant feelings

260
Table A4
Success Indicators
Characteristics Measured Survey Question
Happiness/Life satisfaction
(Family life, social
relationships, job
satisfaction and leisure
activities)
1. My spouse is a great source of support for me
2. I have a supportive group of friends
3. I would continue to work at my job even if it were not
financially necessary
4. I love my job
5. I enjoy spending time with the people I work with
6. I pursue hobbies regularly
7. I frequently engage in leisure activities (eating, drinking,
playing games etc.) with my friends
8. I belong to clubs (religious, political etc.)
9. I volunteer on a regular basis
Job value (prestige,
education, injury rates,
income)
1. My current job is prestigious
2. My first job after immigrating to the United States was
prestigious.
3. What level of education does your current job require
4. What level of education did your first job in the U.S.
require?

261
5. The risk of injury is low at my current job
6. The risk of injury was low at my first job
7. Would you please tell me the option that best represents
your individual income in 2016 before taxes
8. Would you please tell me the option that best represents
your individual income before taxes in the first year after
immigrating to the United States?
Education
1. What was the highest degree you received prior to
immigrating to the United States?
2. What is the highest degree you received since coming to
the United States?
Remittances sent
1. What percentage of your income did you send to
Lebanon in the first year after immigrating to the United
States?
2. What percentage of your income did you send to
Lebanon in the year of 2016?
Income 1. Would you please tell me the option that best represents
your individual income before taxes in the first year after
immigrating to the United States?

262
2. Would you please tell me the option that best represents
your individual income in 2016 before taxes?
Perceptions of Success- Fifth Segment
From the list below, please choose the statement that you believe resonate the most with
your success after immigrating to the United States
▪ I developed an inner drive to succeed as a result of the challenges that I faced when I was
younger
▪ My family’s emphasis on learning helped me become more successful
▪ My ability to assimilate in the United States’ culture greatly influenced my success
▪ My competitiveness contributed to my success in life
▪ Feeling envious of others drove me to be successful
▪ Constantly comparing myself to others pushed me to be more successful
▪ Feelings of being superior to others contributed to my success
▪ Feelings of insecurity regarding my personal worth pushed me to be more successful
▪ My comfort with the unknown helped me be more successful
▪ My ability to resist temptation contributed to my success
From the list below, please rank your top three definitions of success ▪ High income
▪ High educational attainment
▪ Impressive job title and position
▪ Financially supporting family in Lebanon
▪ Happiness
