the limits of public debt habib_rochet_howcangovernmentsborrowsomuch
TRANSCRIPT
How Can Governments Borrow so Much?
Fabrice Collard∗ Michel A. Habib† Jean-Charles Rochet‡§
August 26, 2013
∗University of Bern. email: fabrice.collard @vwi.unibe.ch†UZH, SFI, and CEPR. email: [email protected]‡UZH, SFI, and TSE. email: [email protected].§We would like to thank Barry Adler, Hans Gerbach, Gita Gopinath, Gérard Hertig, Howell Jackson,
Leonardo Martinez, Geoffrey Miller, Enrico Perotti, Mark Roe, Roberta Romano, and seminar participants
at the IMF, the universities of Konstanz, Marseilles, and Sydney, and the Third ETH-NYU Law and Bank-
ing/Finance Conference for very helpful comments and suggestions. Claire Myriam Célérier and especially
Ethem Ibrahim Guney provided superb research assistance. We are responsible for all errors.

Abstract
We analyze the determinants of government debt under the twin assumptions that governments have
limited horizons and default only when government income falls short of debt service requirements.
We derive a government’s maximum sustainable debt ratio, that is, the debt ratio chosen by a
myopic government whose horizon does not extend beyond its current term in office. Maximum
sustainable debt varies across countries, consistent with Reinhart, Rogoff, and Sevastano’s (2003)
evidence of different countries’ differing debt (in)tolerance. Actual debt ratios are below their
maximum sustainable levels, as governments seeking further terms in office fear debt-induced default
that may jeopardize their prospects for reelection. The difference between actual and maximum
sustainable debt ratios creates a ‘margin of safety’ that allows governments to increase debt if
necessary with little corresponding increase in default risk. The probability of default climbs
precipitously once the margin of safety has been exhausted.

1 Introduction
Perhaps the defining characteristic of sovereign debt is its near total absence of enforcement mech-
anism: unlike the case for corporate debt, it is very difficult if not impossible for a creditor to seize
the assets of a defaulting sovereign. Rogoff (1999, p. 31) consequently has deemed the question
“why, exactly, are debtor countries willing to make repayments of any kind” to be “the crux of
understanding international debt markets.” Two answers to this question have been provided: the
threat to deny a defaulting country further access to debt markets (Eaton and Gersovitz, 1981) and
that to impose direct sanctions on the country (Bulow and Rogoff, 1989a, 1989b).1 Building on
these two answers, a number of papers have calibrated country debt-to-GDP ratios.2 It is probably
fair to say that they have fallen short of reproducing prevailing country debt levels.3
In the present paper, we revisit the issue of sovereign debt with a view to obtaining debt levels
that are perhaps closer to the cross-sectional evidence than may so far have been obtained. For
that purpose, we dispense with the two assumptions made by most existing papers, specifically
a government with infinite horizon that defaults strategically, to replace these with the opposite
assumptions of a government with horizon limited to its expected term in office that defaults only
when unable to service its debt.4
We show that our alternative assumptions more naturally result in government debt levels in the
vicinity of those observed in practice. A government whose horizon is limited to its expected term in
office naturally neglects possibly negative consequences of government borrowing that occur beyond
that term. A limited horizon government therefore can be expected to borrow more than its infinite
horizon counterpart. High government demand for funds is met by high investor supply of funds,
as investors who do not fear strategic default recognize that the limit to lending stems from the
government’s ability rather than willingness to service the debt: default occurs when government
income falls short of debt service requirements. Investors further recognize that a government’s
ability to service existing debt depends on its ability to raise new debt. Investors base their lending
decisions on government disposable income, that is, that part of government income that could if
1Possible sanctions have ranged from trade sanctions to outright occupation in the age of gunboat diplomacy.2See the literature review in Section 2.3Cohen and Villemot (2013) report debt-to-GDP ratios ranging from 1.5% to 30%, which their own work extends
to 47%. Table 1 shows prevailing debt levels to be markedly higher for the vast majority of countries considered.4These assumptions are justified below.
1

necessary be directed towards debt servicing: not all spending can be so directed, as the government
must maintain some minimum level of services and investment. Government disposable income is
a fraction of government income, itself a fraction of GDP. Thus, high ratios of debt to government
income do not necessarily translate into high debt to GDP ratios.
We initially consider the case of a myopic government whose concern extends only to its current
term in office. We characterize the government’s maximum sustainable debt level and its associated
default probability as functions of the mean and variance of growth in government disposable
income, the ratio of government disposable income to government income and that of government
income to GDP, and the risk-free rate. Maximum sustainable debt varies across countries; it
can be viewed as a measure of a country’s debt tolerance: countries that have lower maximum
sustainable debt and/or higher associated default probability are, in the words of Reinhart, Rogoff,
and Savastano (2003), more debt intolerant. We then consider the case where the government’s
concern extends beyond the current term, perhaps because the government may be reelected to
office. We show that the prospect of further terms in office induces the government to decrease
borrowing below its maximum sustainable value, in order not to jeopardize through default the
benefits of being in office during these further terms. The default probability correspondingly
decreases.
We calibrate our model using IMF data over the period 1980-2011. Maximum sustainable debt
levels can be surprisingly large, attaining 224% of GDP for Austria, 222% for France, and 216%
for Sweden for example, under the admittedly arbitrary assumption that the ratio of government
disposable income to government income is 40%.5 These results may be due to relatively high mean
growth rates (2.1% for Austria and 2.2% for Sweden, but 1.4% for France), relatively low growth
volatilities (1.5% for Austria and 1.4% for France, but 2.2% for Sweden), and, last but not least, high
ratios of government income to GDP (49% for Austria and for France, 56% for Sweden): perhaps
not surprisingly governments that command a higher fraction of their countries’ GDP can borrow
more. These high maximum sustainable debt ratios are associated with relatively low maximum
default probabilities (0.58% for Austria, 0.53% for France, and 0.91% for Sweden). These reflect the
assumption of growth lognormality, analytically tractable as well as empirically warranted to some
5Note that even a halved disposable income to income ratio of 20% would still result in maximum debt ratios
of 112% for Austria, 111% for France, and 108% for Sweden, well above was is generally considered sustainable.
Importantly, sustainability is not the same as desirability; we return to that distinction in the Conclusion.
2

extent. Not all countries have high maximum sustainable debt levels and low default probabilities:
Argentina’s maximum sustainable debt level is 61% of GDP, reflecting the country’s high growth
volatility (6%) and low ratio of government income to GDP (28%); its mean growth rate over the
period 1980-2011 was 2.5%. Argentina’s maximum default probability is 3.01%, indicating that
(relatively) low maximum sustainable debt levels may nonetheless be associated with (relatively)
high maximum default probabilities.
Actual debt ratios are generally lower than maximum sustainable debt levels, reflecting the
importance of the prospect of reelection. Thus, Austria, France, and Sweden had average debt
ratios 64%, 50%, and 55% of GDP, respectively, over the period 1980-2011, ending with 72%, 86%,
and 38% of GDP, respectively, in 2011. Associated default probabilities are essentially negligible.
We interpret our findings as implying that a country whose actual debt ratio falls short of its
maximum sustainable debt ratio enjoys a ‘margin of safety’ that affords the country the discretion
to increase its debt to GDP ratio with little corresponding increase in its probability of default.
This may explain why France, as well as the UK (2011 debt ratio 82%, maximum debt ratio 148%)
and the US (2011 debt ratio 103%, maximum debt ratio 135%) have seen little if any increase in
their costs of borrowing despite rather dramatic recent increases in their debt ratios. Things are
very different once the margin of safety has been exhausted: Argentina had average debt ratio of
73% over the period 1980-2011, a mere 12% over its maximum sustainable level, yet the associated
default probability was 82%. The same is true of Japan for example, whose maximum sustainable
debt level is 106% of GDP with associated default probability 1.06%, but whose average debt ratio
was 117% of GDP, with associated default probability 96%. The marked asymmetry between the
probability of default’s very slow increase below the maximum sustainable debt level and very
fast increase above is a natural consequence of the trade-off involved in computing the maximum
sustainable debt level under the assumption of lognormality: lenders equate the (infra)marginal
benefit of increased repayment absent default with the marginal cost of an increased probability of
default; where default is lognormally distributed, cost equals benefit around the point at which the
probability of default starts its dramatic increase; debt levels that exceed the maximum sustainable
level are therefore on or beyond that part of distribution where the probability of default increases
very quickly.6 The contrasting experiences of Argentina, which has defaulted on its debt, and Japan,
6To understand the intuition, it is helpful to represent the lognormal distribution by the succession of a very
3

which has not despite increasing its debt to 229% of GDP in 2011 (associated default probability
100%), suggest that our model captures only part of the debt phenomena at work.
As already noted, we replace the two assumptions of infinite government horizon and strategic
default by the opposite assumptions of limited government horizon and default that occurs when
government income falls short of debt service requirements–what Grossman and Van Huyck (1988)
call ‘excusable default.’ We justify our decision on two grounds. First, we believe our assumptions
are, on some dimensions at least, more realistic than the alternative assumptions. Regarding the
length of the government’s horizon, a theory of government debt predicated on the government’s
concern with developments that occur beyond the government’s term of office clearly is at odds
with the self-interest that Public Choice Theory for example attributes to government motives and
behavior. Less rigorously but perhaps no less tellingly, conventional wisdom often holds that a
government’s horizon rarely extends beyond the next election: Acharya and Rajan (2012) elegantly
note that the well-worn maxim Après moi le déluge is widely considered accurately to reflect the at-
titude of the vast majority of governments in power.7 Regarding default, a theory of default based
on strategic considerations is not consistent with Levy Yeyati and Panizza’s (2011) evidence of
governments’ reluctance to default: governments default when they have no realistic option of ser-
vicing their debt, not when they deem the option to default to have a higher payoff than the option
to service the debt. Levy Yeyati and Panizza (2011) attribute governments’ reluctance to default
to (i) governments’ desire to be seen as engaging only in excusable default and (ii) governments’
fear of losing office upon default. Tomz (2007) presents strong evidence that it is governments
that engage in inexcusable default–default despite having income sufficient for debt service–that
suffer the costs of default. Borensztein and Panizza (2008) and Malone (2011) find that govern-
ments that default see a marked decline in their prospects for reelection: domestic bondholders are
also voters; even the bonds sold initially to foreign bondholders may ultimately accrue to domestic
bondholders through trading in secondary markets (Broner, Martin, and Ventura, 2010).8 Bolton
moderately sloped ray ending some distance before the mean, a very steeply sloped line segment ending some distance
after the mean, and another very moderately sloped ray. The maximum sustainable debt level should be around the
intersection of the first ray and the line segment, with higher debt levels being on the line segment or the second ray.7The literal translation of Après moi le déluge is After me the flood. Our work follows Acharya and Rajan (2012)
in analyzing the implications for government borrowing of very short government horizons. For an early attempt at
doing so, see Rochet (2006).8Foley-Fischer (2012) provides contrary evidence. He argues that an incoming government may signal its compe-
tence though default.
4
and Jeanne (2011) provide another, important reason for governments’ reluctance to default: gov-
ernment bonds provide the collateral for interbank loans; government default jeopardizes the value
of that collateral, thereby impeding the functioning of the banking system and its ability to finance
investment.
Second, our assumptions make for simpler modeling than the alternative assumptions. Parsi-
mony therefore should favor our assumptions over the alternative, in case the former should make
possible the derivation of results no less satisfactory than those derived under the latter, at least
in so far as concerns our primary variable of interest, specifically the level of government debt. Be-
sides simplicity, our assumptions may in fact facilitate obtaining the desired result. Surely, lenders
should be willing to lend more when default is excusable rather than strategic. Equilibrium levels
of debt under excusable default therefore should be higher than under strategic default, thereby
serving to attain the high levels of debt observed in practice. Our calibration results show this to
be indeed the case.
The paper proceeds as follows. Section 2 briefly reviews the related literature. Section 3 presents
the model. Section 4 considers the case of a myopic government to obtain a country’s maximum
sustainable debt ratio. Section 5 extends the analysis to the case of a government whose concern
extends beyond the current term in office. Section 6 presents the data. Section 7 discusses the
results of the calibration. Finally, Section 8 concludes.
2 Literature review
It is probably fair to say much of the literature on sovereign debt can be viewed as constituting a
very rich tapestry weaved on the loom of Eaton and Gersovitz’s (EG, 1981) seminal work.9 Later
work has quantified, refined, and extended EG’s predictions, and endogenized some of what had
been exogenous in EG. Thus Aguiar and Gopinath (2006) and Arellano (2008) have embedded the
basic EG framework into the setting of a small open economy to study the interactions of default
risk with output, consumption, the trade balance, interest rates, and foreign debt. Arellano (2008)
ascribes the countercyclicality of interest rates and the current account to incomplete financial
contracts. As interest and principal payments cannot be made to depend on output, the incentive
9The present literature review is by necessity rather limited in scope. For extensive literature reviews, see Panizza,
Sturzenegger, and Zettelmeyer (2009), Reinhart and Rogoff (2009), and Sturzenegger and Zettelmeyer (2006).
5

to default is higher in recessions than in expansions. Interest rates consequently are lower in
expansions, thereby inducing countries to borrow more when output is high. Borrowing finances
imports, which deteriorate the current account. Aguiar and Gopinath (2006) incorporate a trend
into the output process. They distinguish between the two cases of stable and volatile trends and
show that only in the latter case can observed default frequencies be replicated in calibration.
Where the trend in output is stable, there is little value to the insurance provided by access to
international debt markets. A borrower in recession therefore has a strong incentive to default.
The interest rate schedule consequently is extremely steep and borrowing does not extend to the
range where default occurs. Where in contrast the trend in output is volatile, insurance is valuable
and the incentive to default is weakened. The interest rate schedule is less steep and borrowing
extends to the range where default occurs.
Mendoza and Yue (2012) have endogenized output and the collapse in output that accompanies
default. Theirs is a general equilibrium model in which domestic firms borrow internationally to
finance their purchase of foreign inputs. A sovereign default jeopardizes firms’ access to foreign
working capital loans, thereby forcing the firms to substitute domestic inputs for the previously
purchased foreign inputs. As the former are imperfect substitutes for the latter, TFP declines and
the effects of the negative output shock that triggered default are amplified. Cuadra and Sapriza
(2008) have considered the role of political risk.10 They show that political instability (one party
may lose power to another party) and political polarization (different parties represent different
constituents with differing interests) combine to increase borrowing by decreasing the importance
a party in power attaches to the future. The negative consequences of borrowing are lessened when
shared with another party that has other constituents. A positive consequence of borrowing is to
‘tie the other party’s hands,’ thereby preventing that party from lavishing its constituents with
debt-financed favors should the party come to power.11
Yue (2009) and Benjamin and Wright (2009) have considered the role of renegotiation in default.
Yue (2009) considers Nash bargaining under symmetric information. Disagreement payoffs are zero
for creditors and the autarkic payoff for the defaulting country. Yue (2009) shows that the parties
bargain to a reduced level of debt that does not depend on the defaulting country’s original debt:
10See also Hatchondo, Martinez, and Saprizia (2009).11Our analysis in Section 5 shares much with that of Cuadra and Sapriza (2008), but not the assumptions of
strategic default or infinite government horizon.
6

the parties ‘let bygones be bygones.’ Haircuts therefore are increasing in the defaulting country’s
debt. They are decreasing in the country’s output: countercyclical interest rates increase the payoff
for the country to rejoining international debt markets; they increase the bargaining surplus that
is shared by the parties. Benjamin and Wright (2009) note that the period to the resolution of
default extends over many years. They attribute the delay in default resolution to the requirement
that the defaulting country’s commitment to servicing post-resolution debt be credible. As the
incentive to default generally decreases in output, credibility requires that the defaulting country’s
output recovers from the low level that likely prompted default in the first place. This is often
a protracted process. That the country emerges from default only after output has recovered
provides an explanation for the otherwise puzzling observation that default resolution often results
in post-resolution debt that is no lower than the original, pre-default debt.
Hatchondo and Martinez (2009) and Chatterjee and Eyigungor (2012) have considered the role
of debt maturity: when not all debt is retired every period, the issuance of new debt serves to dilute
the value of existing debt; lack of commitment creates a ‘prisoner’s dilemma’ that results in increased
government borrowing at higher interest rates. While short-term debt therefore should dominate
long-term debt, this need not be true where self-fulfilling rollover crises may occur (Chatterjee and
Eyigungor, 2012). Fink and Scholl (2011) have considered the role of conditionality. They show
that international financial institution (IFI) involvement may increase rather than decrease interest
rates, by inducing additional borrowing on the part of a government that expects to benefit from
IFI support.
Cohen and Villemot (2013) have noted the difficulty of existing models simultaneously to match
the first moments of debt and default probabilities: high default costs that make possible the
matching of debt ratios preclude that of default probabilities; low default costs have the opposite
effect.12 Building on Levy Yeyati and Panizza’s (2011) finding that output contractions generally
precede rather than follow default, Cohen and Villemot (2013) have developed a model in which the
cost of default is borne ‘in advance.’ Governments in such case do not have the incentive to stave
off a default whose cost they have already borne. As already noted, our work departs from the EG
assumptions: there is neither strategic default nor infinite government horizon in our model.13
12See in particular Table 1 in Cohen and Villemot (2013).13Some previous work has maintained one but not the other EG assumption. For example, Catão and Kapur
(2004) maintain the assumption of strategic default but dispense with that of infinite horizon. They focus on the
7

As noted in the Introduction, our work shares the assumption of short government horizon
with Acharya and Rajan (2012). Our work differs from theirs in assuming excusable default where
they assume strategic default, and in focusing on calibration issues (e.g., what is a country’s debt
tolerance expressed as a percentage of GDP?) where they focus on the determinants and the impli-
cations of strategic default (e.g., why do myopic governments purposely exacerbate their country’s
financial fragility? Why are haircuts in default so moderate?).
We conclude the present section by noting that, unlike the assumption of strategic default, the
assumption of excusable default is not subject to the well-known Bulow-Rogoff critique (Bulow and
Rogoff, 1989a, 1989b), whereby exclusion from debt markets alone fails to deter default because a
defaulting government can use the amount otherwise to be reimbursed to purchase an insurance
contract that provides the same risk sharing as does government borrowing. A government that
has excusably defaulted has no income with which to purchase the insurance contract. It further
stands to lose office.
3 The model
Assume for simplicity a government’s term in office lasts a single year and consider a government
that is in office in year . Let denote the government’s disposable income in year ; denote the
proceeds from issuing debt in year , expressed as a fraction of government disposable income ;
denote the face value of that debt, again expressed as a fraction of government disposable income
but payable in year + 1; denote the gross rate of growth in government disposable income,
from to +1, distributed ln () ∼ ¡ 2
¢ ≡ (), () ≡ 0 (); and denote the risk-free
interest rate.14 The maximum amount the government can borrow is
=Pr [(1 + +1) +1 ] +
R (1++1)0
+1 (+1)
1 + (1)
effect of macroeconomic volatility on government debt. Conversely, Bi and Leeper (2012) maintain the assumption
of infinite horizon but dispense with that of strategic default. They characterize the fiscal limit that arises from the
dynamic Laffer curve.14We distinguish between government (total) income and government disposable income and express debt as a
fraction of the latter because even the most creditor-harried governments are unlikely to allocate all income to debt
servicing. While a government can and generally will cut non-debt servicing spending to avoid defaulting on its debt,
it is difficult to envision a government reducing all spending on defense, education, health, and law and order to zero.
8

Default occurs in year + 1 when the sum of government disposable income in year + 1 (+1)
and the amount the new government can borrow in that year (+1+1) is not sufficient to service
the debt raised in year (). We assume lenders can appropriate the entirety of government
disposable income in default, but that no new borrowing is possible in such case: lenders do not
‘throw good money after bad;’ there is a ‘sudden stop.’15 This is unlike the case of no-default, in
which proceeds from new borrowing can be used to service existing debt. Note that the debt the
government can raise in year , , depends on the debt the government can raise in year + 1,
+1+1.
Rearranging (1), we have
=1
1 +
"Pr
∙+1
1 + +1
¸ +
Z (1++1)
0
+1
(+1)
#
=1
1 +
"Pr
∙
1 + +1
¸ +
Z (1++1)
0
()
#
=1
1 +
"∙1−
µ
1 + +1
¶¸ +
Z (1++1)
0
()
#(2)
Using the lognormality of () and defining
≡ln³
1++1
´−
(3)
we can rewrite (2) as16
=
1 +
∙ (1 + +1) [1−Φ ()] +
2
2 Φ ( − )
¸(4)
where Φ () denotes the standard normal cdf.
We have thus far assumed that the funds at the government’s disposal in year , +, suffice
to service the debt −1−1 that the government has ‘inherited’ from the government that was in
15We assume without loss of generality that default lasts only a single period.16To transform (2) into (4), rewrite (1 + +1) as exp (+ ), ( (1 + +1)) as
Φ ((ln ( (1 + +1))− ) ) = Φ (), and 0
() as (1++1)
0
Φ
ln ()−
=
−∞exp (+ ) Φ () =
+2
2 Φ ( − )
where ≡ (ln ()− ) .
9

office in year − 1 (recall that a government remains in office only a single term, that is, only asingle year): + > −1−1. If that should not be the case, and if + −1−1, then
the government defaults during its term of office in year We assume that the government loses
office upon default. This assumption plays no role in Section 4, but will play an important role in
Section 5.
4 Myopic government and maximum sustainable debt
Consider a myopic government whose horizon does not extend beyond its current term in office,
perhaps because it is all but certain to lose power at the next election. The government naturally
raises all the debt it can: the government need not concern itself with default–except insofar
as default affects the amount the government can borrow–because it will not be in office to be
confronted with the consequences of default.17 We define maximum sustainable borrowing to be
the maximum amount the government can borrow on a sustained basis, and maximum sustainable
debt the corresponding amount owed by the government.
A myopic government maximizes present borrowing given lenders’ expectation of future bor-
rowing +118
= max
1 +
∙ (1 + +1) [1−Φ ()] +
2
2 Φ ( − )
¸≡ (+1) (5)
A Rational Expectations Equilibrium (REE) is a sequence of ’s that satisfies = (+1). All
REE are unbounded, except maximum sustainable borrowing = +1 = with = ().19
We therefore seek the fixed point
= max
( ) (6)
where
( ) ≡
1 +
∙ (1 + ) [1−Φ ()] +
2
2 Φ ( − )
¸(7)
17Recall from Section 3 that debt has maturity one period.18For simplicity, we refer to as ‘borrowing’ rather than ‘borrowing as a fraction of government disposable income,’
more exact but also longer. We likewise refer to as debt.19We use the subscript for maximum. The condition = +1 = precludes the formation of a bubble that
would see debt progressively grow to ever larger multiples of government disposable income.
10

We show20
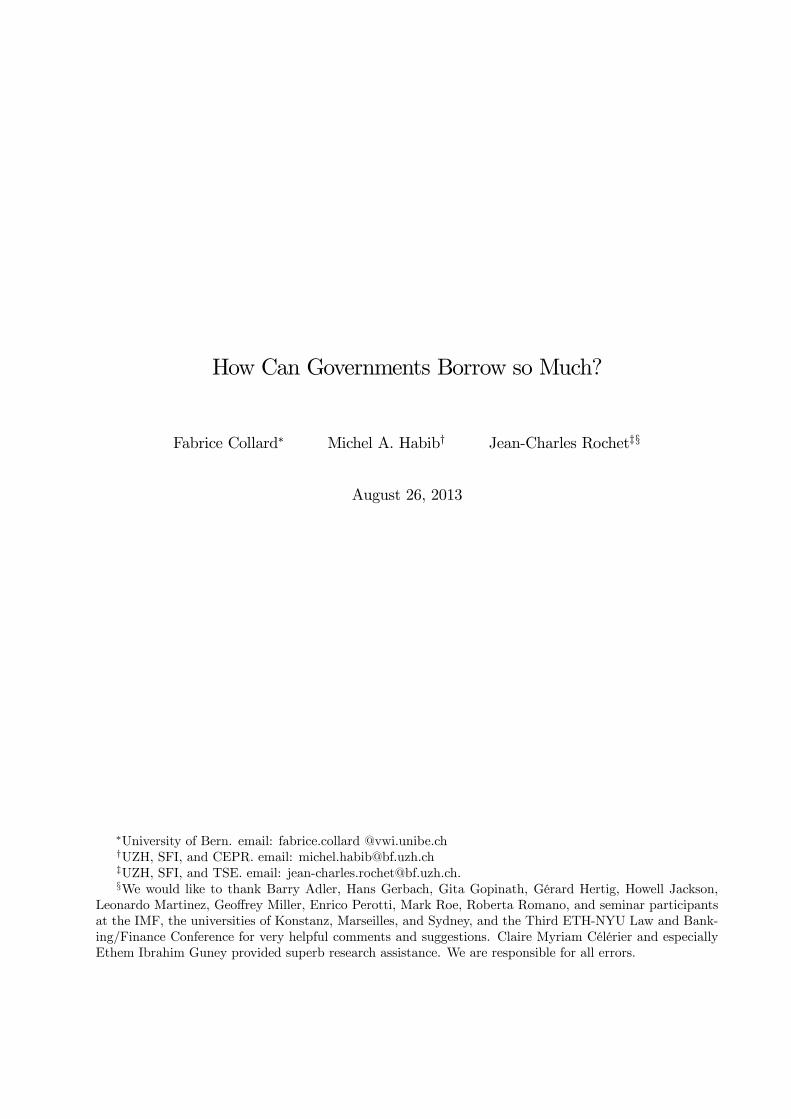
Proposition 1 If [] 1 + , () = max ( ) is a contraction mapping and (6) has a
unique fixed point, .
The result recalls the condition for the convergence of a growing dividend stream: only a
sufficiently high interest rate precludes the mortgaging of all future disposable income. Figure 1
shows the determination of graphically. The condition [] 1 + ensures that the slope of
() remains below unity; there is no intersection between the curve and the line beyond .
We denote ≡ argmax ( ) and show
Proposition 2 Maximum sustainable government borrowing is increasing in the mean growth
rate , decreasing in growth rate volatility for 0, and decreasing in the risk-free interest
rate . The corresponding probability of default Φ () is decreasing in the mean growth rate ,
increasing in growth rate volatility for 0, and decreasing in the risk-free interest rate .
The results are intuitive. A government that is expected to see its disposable income grow
faster can borrow more, for it is expected to have more income with which to service its debt. In
contrast, a government whose disposable income growth is more volatile can borrow less, for the
greater likelihood of low income realizations increases the probability of default, thereby decreasing
lenders’ willingness to lend to the government.21 A government can borrow less when the risk-free
interest rate is high, for a high risk-free rate raises lenders’ opportunity cost of lending to the risky
government, thereby decreasing lenders’ willingness to lend to the government. The higher risk-
free rate increases the interest rate the government must pay on its debt (see Proposition 4 below),
thereby increasing the probability of default.
What is true of the probability of default at maximum sustainable borrowing extends to the
probability of default at any level of borrowing. Consider a government that will owe in period
+ 1 as a result of having borrowed in period . Denote Φ () the corresponding probability of
default. We have
20All proofs are in the Appendix.21More volatile disposable income growth also results in a greater likelihood of high income realizations. The
condition 0 ensures that the detrimental effect of volatility on debt dominates. It amounts to the reasonable
condition that the probability of default be less than 12.
11

Proposition 3 The probability of default Φ () is decreasing in the mean growth rate , increasing
in growth rate volatility for 0, and increasing in the risk-free interest rate .
By analogy to maximum sustainable borrowing , we define maximum sustainable debt .
Denoting = argmax ( ), we have from (1 + +1) = exp (+ ) in footnote 16
= exp (+ ) (1 + ) (8)
We further define the interest rate ≡ and the expected loss given default .
These are22
≡
=exp (+ ) (1 + )
=exp (+ ) ()
[1−Φ ()] (9)
and23
≡ −
R (1+ )
0+1
(+1)
((1+ ))
= 1− [exp () | ]
exp () (1 + )(10)
We show
Proposition 4 Maximum sustainable debt is increasing in the mean growth rate and decreas-
ing in the risk-free interest rate for 0. The interest rate is increasing in the risk-free
interest rate for 0.
Not all comparative statics can be determined because the direct effects of , , and on
, , and often are often counteracted by their indirect effects through or .
Consider for example maximum sustainable debt , which intuition and the result 0
in Proposition 2 suggest should be decreasing in growth rate volatility . That such is not the
case is due to the offsetting role of the probability of default Φ (), the increase in which requires
an increase in debt to be repaid absent default as compensation for the larger probability of
default in which partial payment only is received. Similar considerations apply to the interest rate
and the expected loss given default .
22The last equality in (9) uses (1 + ) = ( ) { [1−Φ ( )]} from (21) in the Proof of Proposition 2.23The equality in (10) is derived in the Appendix.
12

An alternative characterization of will prove useful in interpreting our calibration results
below. Use (2) and (9) to define
() ≡ 1
1 +
"∙1−
µ
1 +
¶¸+
Z (1+ )
0
()
#(11)
and
() ≡
()(12)
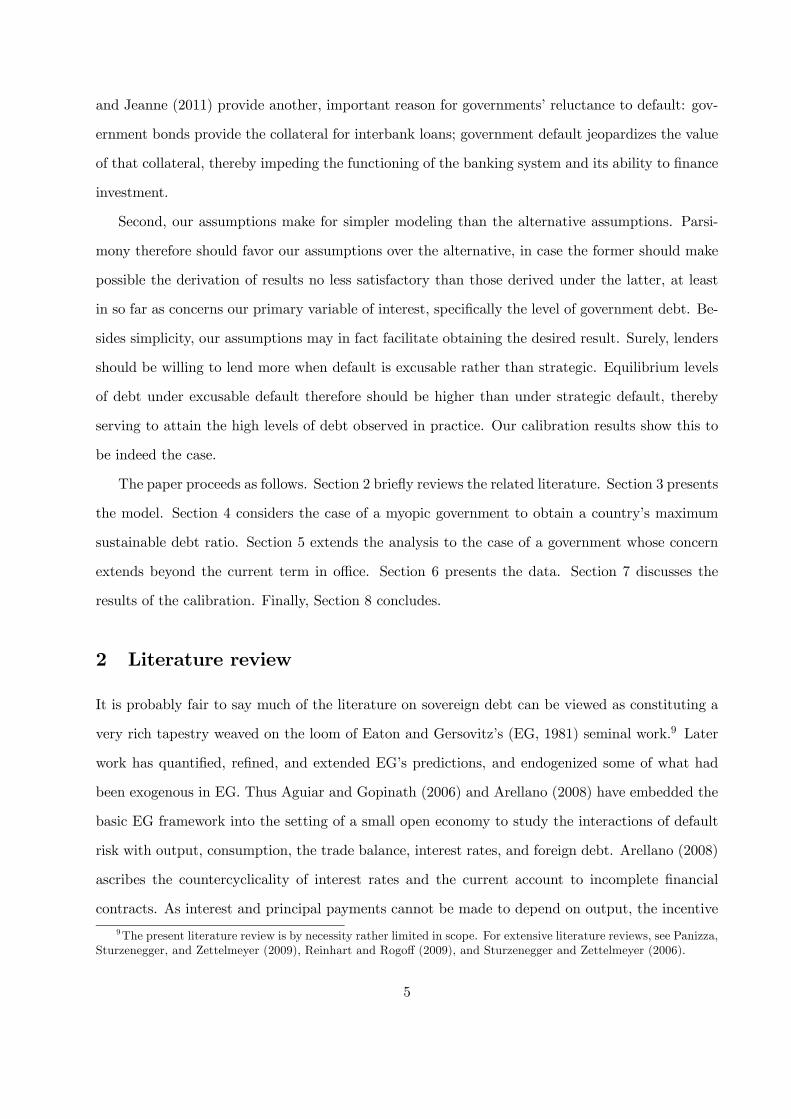
respectively. By analogy to = argmax ( ), we have = argmax (). Using
0 () = 0, we can write
0 () = ()
In words, maximum sustainable debt equates the marginal and average interest rates. The average
interest rate therefore reaches its minimum at maximum sustainable debt . This is shown in
Figure 2.
5 Beyond the current term
We now consider the case where a government serving its first term in office has, in the absence of
default, an exogenous probability of winning the next election. Should it win that election, the
government will serve another term in office, at the end of which it will again have an exogenous
probability of winning the next election, again in the absence of default. The government loses
office upon default. Our purpose in the present section is to examine how the prospect of reelection
and the likelihood of further terms in office alters the government’s borrowing as compared to the
case of a myopic government that serves a single term only.
Consider a government that has inherited debt −1−1 and has disposable income in year
. The government has value function () such that
(−1−1 ) = max
( + − −1−1) +
1 + [ ( +1)] (13)
where () denotes the government’s utility function.24 The government recognizes that its choice
24Note that there was no need to introduce the government’s utility function in Section 5, because the single term
13

of borrowing in year , , determines the debt it owes in year +1, . The expectation is over
as +1 = .
In order to make our problem tractable, we assume that the government has CRRA utility with
RRA coefficient
() =1−
1− (14)
This makes the value function similarly CRRA with RRA coefficient
(−1−1 ) =
µ−1
−1
1
¶1− ≡
¡0−1
¢1− (15)
where 0−1 ≡ −1 (−1) represents the debt the government owes in year , expressed as a
fraction not of disposable income in year − 1 in which the debt was raised, but as a fraction ofdisposable income in year in which the debt is to be repaid. Put differently, 0−1 = −1−1 is
the debt owed in year as repayment for the amount −1−1 borrowed in year − 1.Problem (13) can be rewritten25
¡0−1
¢= max
¡1 + − 0−1
¢+
1 +
∙1−
µ
¶¸(16)
By analogy to (1) in Section 4, note that the relation between (fraction borrowed) and (fraction
owed) is given by
=Pr [(1 + ) +1 ] +
R (1+ )0
+1 (+1)
1 + (17)
Equation (17) differs from (1) in replacing +1 by : the assumption of excusable default implies
that the government will borrow as much as it can in order to stave off default.26 The stationary
REE satisfies
¡0¢= max
¡1 + ()− 0
¢+
1 +
∙1−
µ
¶¸(18)
with () defined in (11). Note that the similarity between (2) in Section 4 and (11) implies that
of office implied that the government would maximize borrowing regardless of its specific utility function.25Divide (13) by 1− and use (14) and (15). The condition for the existence and uniqueness of the value function
() can be shown to be 1−
1 + .
26Corollary 1 below shows that maximum sustainable borrowing remains at .
14

the solutions ∗ ≡ (∗) and ∗ reduce to , and for = 0.
Further insights into (18) may be gained by examining the relation between 0 (debt to be repaid
in the current period as a fraction of current period government disposable income, ‘old’ debt) and
(debt to be repaid in the next period as a fraction of current period government disposable
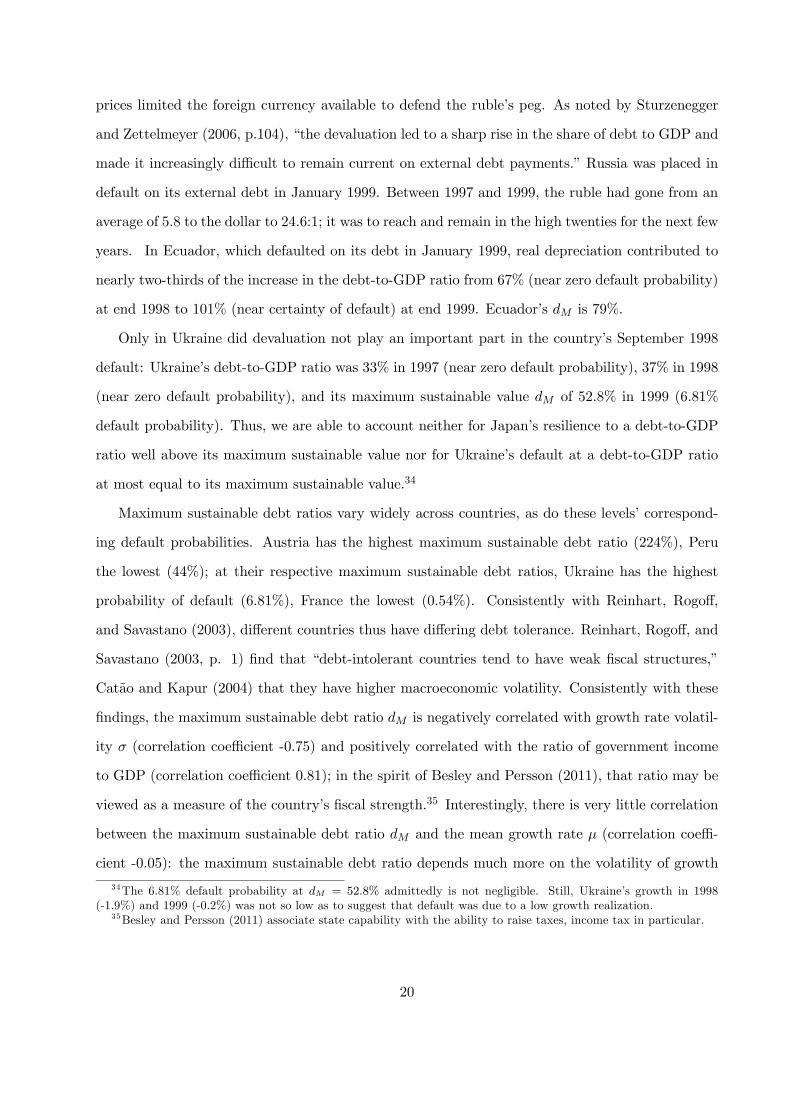
income, ‘new’ debt), shown in Figures 3 and 4, for the two cases of risk-neutral government ( = 0)
and risk-averse government ( 0), respectively. Under risk-neutrality (Figure 3), the government
maximizes the present value of a stream of disposable income that ends either with default or
with the failure to be reelected. A government that expects to be reelected with certainty absent
default ( = 1) finds it beneficial to decrease the probability of default to zero, thereby receiving the
entire stream with certainty. Where debt owed in the current period is less than current disposable
income (0 1), the government repays that old debt in its entirety and raises no new debt ( = 0),
thereby achieving the desired decrease of the default probability to zero. As debt owed increases
beyond current disposable income (0 1), the government is forced to borrow anew ( 0) in
order to service the debt it owes. The probability of default is as low as can be given debt owed.
Maximum debt ( = ) is attained where debt owed equals the sum of current disposable income
and maximum amount that can be borrowed (0 = 1 + ). The government defaults beyond.
Where there is some non-zero probability that the government loses the next election ( 1), the
government is now willing to borrow in the present period ( = ∗): it enjoys the benefits of such
borrowing with probability one, yet will be confronted with its costs with probability less than one,
for it will be voted out of office with probability greater than zero. Again, there are circumstances
(0 0∗) where the government borrows more than it otherwise deems desirable ( ∗), just for
the purpose of staving off default.
Under risk-aversion (Figure 4), the government wishes to equalize the marginal utility of income
across periods, net of debt proceeds and repayments. The expectation of growing disposable income
( 0) implies that there is always some borrowing ( 0), in order to bring forward in time some
of that disposable income growth. As in the case of risk-neutrality, borrowing is lowest where the
probability of reelection is highest at unity ( = 1), for there no opportunity for the government to
‘escape’ being confronted with default through electoral defeat in such case. New debt () increases
in old debt (0), as the government seeks to make up through new debt for old debt’s higher claim
on current disposable income. Again, there is default where old debt is larger than the sum of
15

current disposable income and maximum amount that can be borrowed (0 = 1 + ).
We show
Proposition 5 Government borrowing ∗ ≡ (∗), debt owed ∗, and the probability of default
(∗ (1 + )) decrease in the probability of reelection .
Corollary 1 ∗ 6 , ∗ 6 , and (∗ (1 + )) 6 ( (1 + )) for > 0 with equality
at = 0.
The intuition is simple: the government values further terms in office, which it would forego in
case it were to default; the government therefore decreases the probability of default by decreasing
the amount it borrows. The higher the probability of reelection, the higher the expected value of
further terms in office, and the greater therefore the incentive to decrease the probability of default
by decreasing borrowing.
6 Data
We use country GDP data from IMF statistics to compute mean growth in GDP and volatility
over the period 1980-2011. There are 186 countries and 32 years, but countries that came into
existence during that period naturally have data for fewer years. South Sudan for example has
GDP data for the single year 2011 in which it became independent. Other countries have missing
data because of wars (Afghanistan, Iraq) or other, much less tragic but also less obvious reasons
(Malta for example has GDP data for 12 years). The same issues arise for the values of the debt-
to-GDP and government income-to-GDP ratios, also obtained from IMF statistics. There are no
estimates of the probability of reelection , nor of the ratio of government disposable income to
government income. We keep our analysis of the former on a qualitative level and, in a rough and
ready way, conjecture the former to be around 0.4. In other words, we conjecture that a maximum
of 60% of government income is allocated to essential spending that cannot be cut, at least not on
a sustainable basis; government debt is therefore serviced out of the remaining 40% of government
income.27 We use the mean US 30-year bond yield over the period for the risk-free interest rate .
In view of Proposition 1, we exclude those countries for which [] 1 + .
27As noted in the Introduction, the overall gist of our results remains where the 0.4 ratio is halved.
16

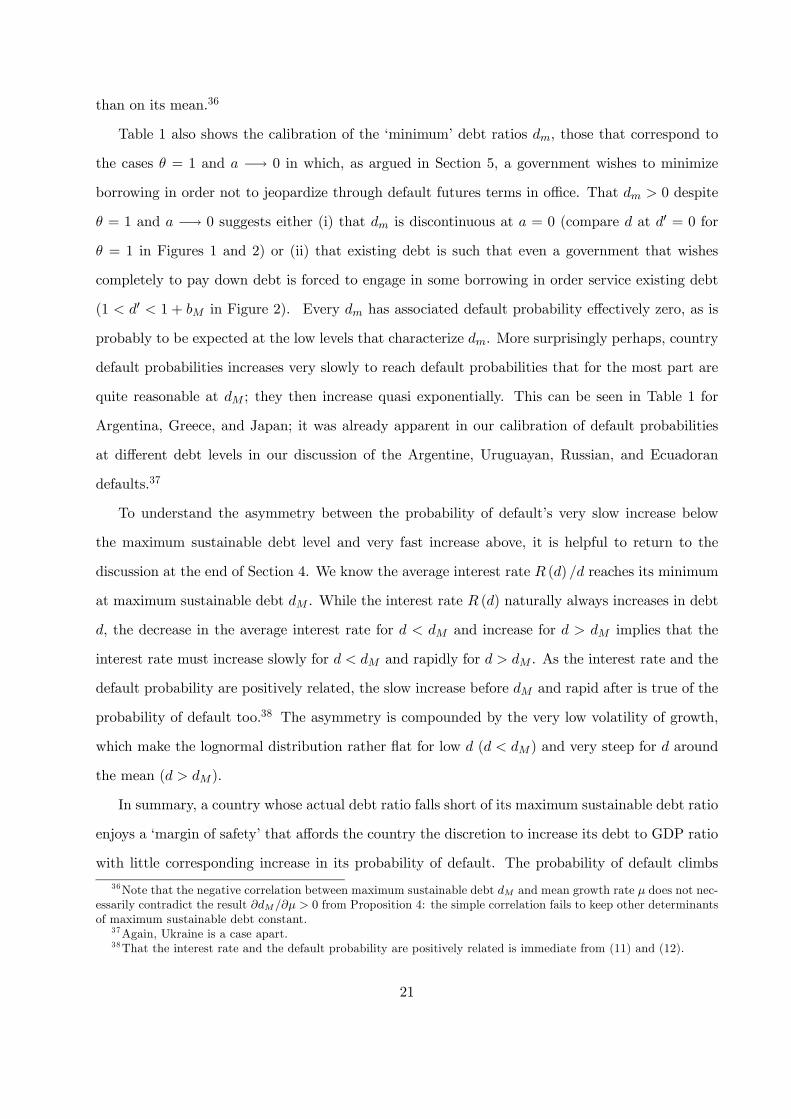
The data for selected countries is shown in Table 1. There is a wide range of debt ratios, as
well as mean growth rates and volatilities. The country with the lowest average debt ratio over the
period 1980-2011 was Chile at 11%, followed by Australia at 20%. Chile retains its first place in
2011, whilst Australia cedes its second place to Russia, which will be recalled to have defaulted on its
debt in 1998 and 1999. Other countries in our list that defaulted on or restructured their debt over
the period 1980-2011 are Argentina, Brazil, Ecuador, Egypt, Greece, Iceland, Indonesia, Mexico,
Peru, Romania, Turkey, Ukraine, Uruguay, and Venezuela, consistent with Reinhart and Rogoff’s
(2009) observation that sovereign defaults are a common occurrence. Default often results in a 2011
debt ratio that is lower than its 1980-2011 average. This is most clearly the case for Argentina,
whose debt ratio declined from a 1980-2011 average of 73% to 45% in 2011, and Indonesia, where
the decline was from 49% to 24%. It is not only defaulting countries that saw their debt ratios
decline: Belgium saw its debt to GDP ratio decline from a 1980-2001 average of 109% to 97%,
Sweden from 55% to 38%; Denmark, Israel, New Zealand, and Switzerland saw somewhat smaller
declines. Most industrialized countries saw their debt ratios increase, though, most notably Greece
(from 85% to 165%), Japan (from 118% to 229%), and, on a smaller yet still sizeable scale, Iceland
(from 45% to 99%), the United Kingdom (from 46% to 82%), and the United States (from 65% to
103%).
In line with Catão and Kapur’s (2004) argument and findings, countries with more volatile
growth rates tend to have lower debt ratios. The countries with volatility equal to or greater
than 6% are Argentina (6.00%), Peru (6.10%), Russia (6.84%), Ukraine (10.59%), and Venezuela
(6.77%). Argentina’s 1980-2011 average excluded, these countries have had low debt ratios, ranging
from Russia’s 12% to Venezuela’s 47%, both in 2011. There are many countries with equally low
debt ratios, though, despite having markedly less volatile growth rates. South Africa for example
has volatility 2.41% yet debt ratio 39% in 2011, only slightly above Ukraine’s 36% in that same
year. This may reflect the ambiguous effect of volatility on debt, as well as the influence of other
factors.28
Not least among these other factors is the ratio of government income to GDP. By and large,
countries for which that ratio is higher tend to have higher debt ratios. Returning to our comparison
28That volatility has an ambiguous effect on debt is suggested by our failure to sign in Section 4. This
(non-)result is only suggestive as it pertains to maximum sustainable debt rather than actual debt considered in
the present section.
17

of South Africa and Ukraine, note that the former has government income to GDP ratio of 27%, the
latter of 39%: Ukraine’s government can command more of its country’s GDP than can its South
African counterpart; it correspondingly can borrow more. Another factor is the mean growth rate.
The result 0 from Proposition 4 notwithstanding, slower growing countries tend to have
higher debt ratios.29 Still, the slowest growing country, the Ukraine at -0.8%, has a relatively low
debt ratio of 36% in 2011; the fastest growing country, Vietnam at 6.3%, has a moderate debt ratio
of 50% in 2011. Yet another factor affecting debt ratios is the probability of reelection. Whilst
little quantitative can be said, note that democracies, whose governments presumably have shorter
expected terms in office, tend to have higher debt ratios; this is rather consistent with Proposition
5.
7 Calibration results
Table 1 shows the calibration of maximum sustainable debt . Note that two countries, Greece
and Japan, have actual debt levels that are well in excess of their respective . Such discrepancy
may at least partially account for Greece’s 2011 default; it suggests that further debt writedowns
may be in order. That there have been no similar developments in Japan is, to us at least, a matter
of some surprise.30 An obvious question is how a country can borrow well above its maximum
sustainable debt level. One does not have to agree with our exact calculation of to believe
that a country must have some maximum sustainable debt ratio; any mistake in our calculation
of would have to be very large indeed for that sustainable ratio to be in the range of Greece
and Japan’s actual debt ratios. One possible answer is deceptive statistics: Greece is said to have
falsified its debt numbers for the better part of a decade.31 This answer does not apply to Japan.
Another is a large currency devaluation that inflates foreign debt in local currency terms, or a large
negative shock to GDP. Again, this does not apply to Japan. It does, however, apply to many of
the countries that defaulted over the 1980-2011 period we consider.
Sturzenegger and Zettelmeyer (2006) provide detailed case studies of the defaults of Argentina,
29As for our failure to sign , the result 0 is only suggestive, for it too pertains to maximum
sustainable debt rather than actual debt.30We realize Japan is on many counts a special case, not least because its large private savings are invested
overwhelmingly if indirectly in Japan Government Bonds. It is nonetheless difficult to view Japan’s current debt
levels and policies as sustainable (Hoshi, 2011; Hoshi and Ito, 2012).31See for example Story, Thomas, and Schwartz (2010).
18

Ecuador, Russia, Ukraine, and Uruguay, The effect of is local currency devaluation is most clearly
seen in Uruguay. In June 2002, in no small part in response to Argentina’s 2001 default and the
Argentine peso’s ensuing devaluation, Uruguay floated the Uruguayan peso. A 50% devaluation
followed, which, by Sturzenegger and Zettelmeyer’s (2006) calculation, accounted for more than
half the increase in Uruguay’s debt-to-GDP ratio from 54% at end 2001 to 94% at end 2002.32
With Uruguay’s at 80%, what had been a very comfortable debt ratio (near zero probability of
default at 54% debt ratio) became a very heavy burden (rather coincidentally, 94% probability of
default at 94% debt ratio). Uruguay defaulted in May 2003.
Uruguay’s default occurred after it had devalued. In contrast, Argentina’s default occurred
before it abandoned its peg to the US dollar, suggesting that not only the reality but also the
expectation of a devaluation that would increase the debt ratio beyond its sustainable level may
suffice to trigger default. At least since the devaluation of the Brazilian real in 1999, Argentina’s
peso had been under pressure, with several analysts questioning the viability of its peg to the US
dollar. When Argentina defaulted on December 24, 2001, its debt-to-GDP ratio was 53%, well
below its at 61%. Yet, within slightly more than a month, the peso was devalued; it was to go
from parity with the dollar to a ratio of 3.7:1 in the space of six months, before settling down at
around 3:1. This decline was reflected in Argentina’s debt-to-GDP ratio, which was to increase to
150% at end 2002; Sturzenegger and Zettelmeyer (2006) attribute the bulk of this increase, 60%,
to the peso’s devaluation. At 113% debt-to-GDP ratio, Argentina’s default probability was 100%;
investors were not mistaken in fearing that devaluation would result in near-certain default.33
Much the same phenomenon appears to be at work in the cases of Russia and Ecuador. In
Russia, whose is 72%, successive devaluations helped transform a debt-to-GDP ratio of 54%
(near zero default probability) at end 1997 into 68% (0.92% default probability) at end 1998 and
90% (92% default probability) at end 1999. The sharp fall in oil prices in the wake of the 1997 Asian
crisis decreased government revenues and may have prompted Russia’s default on its domestic debt
in August 1998. Russia concurrently conducted a first devaluation, presumably because falling oil
32There was a concurrent 11% decline in GDP.33We obtain 113% by adding to the initial debt-to-GDP ratio (53%) the increase that is attributable to devaluation
(60%) . We realize that causality runs in both directions, from default to devaluation as well as from devaluation
to default. Yet, it would be difficult to argue that devaluation would have been avoided had default not occured:
Argentina had a large trade deficit which it was having difficulty financing; the peso’s peg to the dollar was increasingly
being questioned.
19
prices limited the foreign currency available to defend the ruble’s peg. As noted by Sturzenegger
and Zettelmeyer (2006, p.104), “the devaluation led to a sharp rise in the share of debt to GDP and
made it increasingly difficult to remain current on external debt payments.” Russia was placed in
default on its external debt in January 1999. Between 1997 and 1999, the ruble had gone from an
average of 5.8 to the dollar to 24.6:1; it was to reach and remain in the high twenties for the next few
years. In Ecuador, which defaulted on its debt in January 1999, real depreciation contributed to
nearly two-thirds of the increase in the debt-to-GDP ratio from 67% (near zero default probability)
at end 1998 to 101% (near certainty of default) at end 1999. Ecuador’s is 79%.
Only in Ukraine did devaluation not play an important part in the country’s September 1998
default: Ukraine’s debt-to-GDP ratio was 33% in 1997 (near zero default probability), 37% in 1998
(near zero default probability), and its maximum sustainable value of 52.8% in 1999 (6.81%
default probability). Thus, we are able to account neither for Japan’s resilience to a debt-to-GDP
ratio well above its maximum sustainable value nor for Ukraine’s default at a debt-to-GDP ratio
at most equal to its maximum sustainable value.34
Maximum sustainable debt ratios vary widely across countries, as do these levels’ correspond-
ing default probabilities. Austria has the highest maximum sustainable debt ratio (224%), Peru
the lowest (44%); at their respective maximum sustainable debt ratios, Ukraine has the highest
probability of default (6.81%), France the lowest (0.54%). Consistently with Reinhart, Rogoff,
and Savastano (2003), different countries thus have differing debt tolerance. Reinhart, Rogoff, and
Savastano (2003, p. 1) find that “debt-intolerant countries tend to have weak fiscal structures,”
Catão and Kapur (2004) that they have higher macroeconomic volatility. Consistently with these
findings, the maximum sustainable debt ratio is negatively correlated with growth rate volatil-
ity (correlation coefficient -0.75) and positively correlated with the ratio of government income
to GDP (correlation coefficient 0.81); in the spirit of Besley and Persson (2011), that ratio may be
viewed as a measure of the country’s fiscal strength.35 Interestingly, there is very little correlation
between the maximum sustainable debt ratio and the mean growth rate (correlation coeffi-
cient -0.05): the maximum sustainable debt ratio depends much more on the volatility of growth
34The 6.81% default probability at = 528% admittedly is not negligible. Still, Ukraine’s growth in 1998
(-1.9%) and 1999 (-0.2%) was not so low as to suggest that default was due to a low growth realization.35Besley and Persson (2011) associate state capability with the ability to raise taxes, income tax in particular.
20
than on its mean.36
Table 1 also shows the calibration of the ‘minimum’ debt ratios , those that correspond to
the cases = 1 and −→ 0 in which, as argued in Section 5, a government wishes to minimize
borrowing in order not to jeopardize through default futures terms in office. That 0 despite
= 1 and −→ 0 suggests either (i) that is discontinuous at = 0 (compare at 0 = 0 for
= 1 in Figures 1 and 2) or (ii) that existing debt is such that even a government that wishes
completely to pay down debt is forced to engage in some borrowing in order service existing debt
(1 0 1 + in Figure 2). Every has associated default probability effectively zero, as is
probably to be expected at the low levels that characterize . More surprisingly perhaps, country
default probabilities increases very slowly to reach default probabilities that for the most part are
quite reasonable at ; they then increase quasi exponentially. This can be seen in Table 1 for
Argentina, Greece, and Japan; it was already apparent in our calibration of default probabilities
at different debt levels in our discussion of the Argentine, Uruguayan, Russian, and Ecuadoran
defaults.37
To understand the asymmetry between the probability of default’s very slow increase below
the maximum sustainable debt level and very fast increase above, it is helpful to return to the
discussion at the end of Section 4. We know the average interest rate () reaches its minimum
at maximum sustainable debt . While the interest rate () naturally always increases in debt
, the decrease in the average interest rate for and increase for implies that the
interest rate must increase slowly for and rapidly for . As the interest rate and the
default probability are positively related, the slow increase before and rapid after is true of the
probability of default too.38 The asymmetry is compounded by the very low volatility of growth,
which make the lognormal distribution rather flat for low ( ) and very steep for around
the mean ( ).
In summary, a country whose actual debt ratio falls short of its maximum sustainable debt ratio
enjoys a ‘margin of safety’ that affords the country the discretion to increase its debt to GDP ratio
with little corresponding increase in its probability of default. The probability of default climbs
36Note that the negative correlation between maximum sustainable debt and mean growth rate does not nec-
essarily contradict the result 0 from Proposition 4: the simple correlation fails to keep other determinants
of maximum sustainable debt constant.37Again, Ukraine is a case apart.38That the interest rate and the default probability are positively related is immediate from (11) and (12).
21

precipitously once the margin of safety has been exhausted.
8 Conclusion
We have shown that a reversal of the prevailing assumptions on government behavior regarding
sovereign debt can deliver valuable new insights. Specifically, the assumptions that governments
have limited horizons and default only when unable to service their debt has made it possible
to calibrate debt ratios that are markedly closer to prevailing levels than may thus far has been
the case. The assumption that a government is myopic–concerned only with its current term in
office–has served to introduced the concept of maximum sustainable debt, which can be viewed as
a measure of Reinhart, Rogoff, and Savastano’s (2003) debt (in)tolerance. Different countries have
differing debt tolerances, which depend on these countries’ output volatilities (Catão and Kapur,
2004) and these countries’ governments’ tax raising abilities (Reinhart, Rogoff, and Savastano,
2003). The recognition that governments’ horizons may be extended beyond the current term by
the prospect of reelection has provided a rationale for actual debt ratios below their maximum
sustainable levels. This creates a margin of safety that allows a government if necessary to increase
the debt level to the maximum sustainable ratio with little corresponding increase in the probability
of default.
Our positive paper has normative implications. In particular, it implies that, for those countries
that have recently experienced dramatic increases in their debt ratios yet have experienced little to
no increase in their borrowing costs (France, UK, US), the present benign situation may not last,
if the increase in these countries’ debt ratios were to continue beyond their maximum sustainable
levels. Our estimates of these levels are of course subject to considerable uncertainty, as they
rely on assumptions that by necessity can be justified only partially, but the marked asymmetry
in the relation between the debt ratio and the default probability before and after the maximum
sustainable debt ratio does not depend on these assumptions. There is thus a point beyond which
even a small increase in the debt ratio will have a large effect on the default probability, thus on
the country’s cost of debt.39
Conversely, our paper implies that, for those countries that have seen a dramatic increase in
39A more sanguine view may of course be suggested by the Japanese experience.
22

their cost of debt despite having debt ratios well short of their maximum sustainable levels (Italy,
Spain), it is at least conceivable that financial markets may have overreacted. Absent any dramatic
increase in these countries’ growth volatility or decrease in their governments’ tax raising abilities,
it is not entirely clear why these countries should have experienced such large increases in borrowing
costs as they did. Whilst Spain’s future growth rate in all likelihood will be lower than its past
rate, recall from Section 7 that the effect of the expected growth rate on the maximum sustainable
debt ratio is weak in calibration.40 In view of present borrowing’s dependence on the expectation
of future borrowing, perhaps the answer lies in the coordination problems analyzed by Morris and
Shin (2004), Rochet and Vives (2004), and, closer to the present analysis, Chatterjee and Eyigungor
(2012) and Hatchondo and Martinez (2013).
40The experience of Spain nonetheless suggests the desirability of extending our analysis to less simple growth
processes. We leave this for further work.
23

Appendix
Derivation of (10) To obtain the equality in (10), observe that
≡ −
R (1+ )
0+1
(+1)
((1+ ))
= 1−R (1+ )
0+1
(+1)
((1+ ))
= 1−R (1+ )
0
()
((1+ ))
= 1−
R (1+ )
0
Φln()−
Φ
(ln((1+ ))−)
= 1−R −∞ exp (+ )
Φ()
Φ( )
exp (+ ) (1 + )
= 1− [exp () | ]
exp () (1 + )
where, as in footnote 16, ≡ (ln ()− ) .¥
Proof of Proposition 1 We proceed in two steps. In the first step, we show that ( ) has a
unique maximum over . In the second step, we show that () is a contraction mapping.
Step 1 Differentiate ( ) in (7) with respect to to obtain
( )
=
1 +
∙ (1 + ) [ [1−Φ ()]− ()] +
2
2 ( − )
¸(19)
Now use
2
2 ( − ) =1√2exp
µ−122 +
¶= ()
to conclude that ( ) has the same sign as (1 + )− (), where () ≡ () [1−Φ ()]denotes the likelihood ratio of the standard normal distribution. As () increases monoton-
ically from (−∞) = 0 to (+∞) = +∞, it is clear that ( ) = 0 at the point
= −1 ( (1 + 1)), which constitutes the unique maximand of ( ).
Step 2 Consider 1 2. Noting from (7) that () ≡ max ( ) is increasing in , we have
24

(1) 6 (2). Moreover,
(2) = max (2 )
=
1 + max
∙ (1 + 2) [1−Φ ()] +
2
2 Φ ( − )
¸=
1 + max
∙ [(1 + 1) + (2 − 1)] [1−Φ ()] +
2
2 Φ ( − )
¸6
1 + max
∙ (1 + 1) [1−Φ ()] +
2
2 Φ ( − )
¸+
1 + max (2 − 1) [1−Φ ()]
= (1) +
1 + max (2 − 1) [1−Φ ()]
where the inequality is due to the general inequalitymax { () + ()} 6 max { ()}+max { ()}.We therefore have
0 6 (2)− (1) 6
1 + max (2 − 1) [1−Φ ()]
Lemma 1
max + [1−Φ ()] 6 [] = exp
µ+
2
2
¶Proof of Lemma 1
+ [1−Φ ()] =
Z
−∞+Φ ()
6Z
−∞+Φ ()
=
Z
−∞ ()
6 []
where we have used the same transformation as in footnote (16) with = exp (+ ). The result
is true for all ; it is therefore true for the that maximizes + [1−Φ ()].¥From Lemma 1 and the assumption [] 1 + , there exists 1 such that for all 1 2
0 6 (2)− (1) 6 (2 − 1) . (20)
25
The function () is therefore a contraction and has a unique fixed point. We denote that point
.¥
Proof of Proposition 2 Differentiate = () with respect to Ξ ∈ { } to obtain
Ξ= 0 ()
Ξ+
()
Ξ
⇔ £1− 0 ()
¤ Ξ
= ()
Ξ
Use 0 () 1 ( () being a contraction mapping) to conclude that {Ξ} = { () Ξ}.From (7) and () ≡ max ( ), it is immediate that () 0 and () 0; it is
therefore the case that 0 and 0. From (7) and footnote (16), we have
( )
=
1 +
∙ (1 + ) [1−Φ ()] +
Z
−∞ exp () Φ ()
¸
A sufficient condition for ( ) 0 is 0. At = and = , 0 amounts to the
reasonable assumption that countries have probability of default Φ () 12 at their maximum
sustainable debt ratio. The intuitive result 0 follows.
The FOC for is
( )
¯̄̄̄=
= (1 + ) [1−Φ ()]− () = 0 (21)
It can be rewritten as
() =
µ1 +
1
¶(22)
where () ≡ () [1−Φ ()] denotes the hazard rate; 0 () 0 as the normal distribution hasmonotone hazard rate.41 Differentiate (22) with respect to , , and to obtain
0 ()
= −
2
0 (23)
0 ()
=
()
−
2
0 (24)
41A cdf () with associated pdf () has monotone hazard rate when () [1− ()] increases in .
26

and
0 ()
= −
2
0¥ (25)
Proof of Proposition 3 Consider debt due in period + 1. A government that engages only
in excusable default exhausts all + 1 borrowing possibilities, specifically +1, before declaring
default. Default therefore occurs with probability
Pr [+1 + +1 ] = Pr
∙
1 +
¸= Φ
µln ()− ln (1 + )−
¶≡ Φ ()
where is defined analogously to (3)
≡ ln ()− ln (1 + )−
Use 0, 0 for 0, and 0, to conclude that 0, 0
for 0, and 0, respectively.¥
Proof of Proposition 4 Use (8) and (23) to write
ln ()
=
1 + + 1 +
=
∙1
1 + − 2
0 () 2
¸+ 1 (26)
Now use the definition of () and (22) to write
0 () = − () + 2 ()
= 1 +
∙1 +
−
¸
⇔ 0 () 22
= (1 + )
∙1 + −
¸The assumption 0 implies that 0 () 22 1 + , in turn implying that the term in
square brackets on the RHS of (26) is positive; ln () 0 is then an immediate consequence
27

of 0 established in Proposition 2; 0 follows.
Use (8) and (25) to write
ln ()
=
1 + +
=
∙1
1 + − 2
0 () 2
¸(27)
The term in square brackets on the RHS of (27) is identical to that in (26), which we have just shown
to be positive; ln () 0 is then an immediate consequence of 0 established in
Proposition 2; 0 follows.
Finally, use (9) to write
ln ()
=
+
0 () ()
0
where we have used 0 from Proposition 2 and 0 () 0; 0 follows.¥
Proof of Proposition 5 Differentiate (18) with respect to and 0, recall that ∗ denotes the
optimal , and use the Envelope Theorem to write
0¡1 + (∗)− 0
¢0 (∗) +
1 +
∙−0
µ∗
¶¸= 0 (28)
and
0¡0¢= −0 ¡1 + (∗)− 0
¢ 0 (29)
Note that (28) and (29) together imply 0 (∗) 0. Now use the Implicit Function Theorem to
conclude
½∗
¾=
½1
1 +
∙−0
µ∗
¶¸¾= −1
The remaining results follow from 0 (∗) 0 and 0 () 0.¥
28

References
Acharya, Viral V. and Raghuram G. Rajan, 2012, Sovereign debt, government myopia, and the
financial sector,working paper, NYU and U. Chicago.
Aguiar, Mark and Gita Gopinath, 2006, Defaultable debt, interest rates and the current account,
Journal of International Economics 69, 64-83.
Arellano, Cristina, 2008, Default risk and income fluctuations in emerging economies, American
Economic Review 98, 690-712.
Benjamin, David and Mark L.J. Wright, 2009, Recovery before redemption: A theory of delays in
sovereign debt renegotiations, CAMAWorking Paper 15/2009, The Australian National University.
Besley, Timothy and Torsten Persson, 2011, Pillars of Prosperity, Princeton University Press,
Princeton.
Bi, Huixin and Eric M. Leeper, 2012, Analyzing fiscal sustainability, working paper, Bank of
Canada.
Bolton, Patrick and Olivier Jeanne, 2011, Sovereign default risk and bank fragility in financially
integrated economies, IMF Economic Review 59, 162-194.
Borensztein, Eduardo and Ugo Panizza, 2008, The costs of sovereign default, IMF Working Paper
WP/08/238.
Broner, Fernando, Alberto Martin, and Jaume Ventura, 2010, Sovereign risk and secondary mar-
kets, American Economic Review 100, 1523-1555.
Bulow, Jeremy and Kenneth S. Rogoff, 1989a, Sovereign debt: is to forgive to forget?, American
Economic Review 79, 43-50.
Bulow, Jeremy and Kenneth S. Rogoff, 1989b, A constant recontracting model of sovereign debt,
Journal of Political Economy 97, 155-178.
Catão, Luis and Sandeep Kapur, 2004, Missing link: Volatility and the debt intolerance paradox,
IMF Working Paper WP/04/51.
Chatterjee, Satyajit and Burcu Eyigungor, 2012, Maturity, indebtness, and default risk, American
Economic Review 102, 2674-2699.
Cohen, Daniel and Sebastien Villemot, 2013, The sovereign default puzzle: A new approach to debt
sustainability analyses, mimeo, Paris School of Economics.
29

Cruces, Juan J. and Christoph Trebesch, 2011, Sovereign defaults: The price of haircuts, American
Economic Journal: Macroeconomics, forthcoming.
Cuadra, Gabriel and Horacio Sapriza, 2008, Sovereign default, interest rates and political uncer-
tainty in emerging markets, Journal of International Economics 76, 78-88.
Eaton, Jonathan and Mark Gersovitz, 1981, Debt with potential repudiation: Theoretical and
empirical analysis, Review of Economic Studies 48, 289-309.
Fink, Fabian and Almuth Scholl, 2011, A quantitative model of sovereign debt, bailouts and con-
ditionality, Working Paper 2011-46, University of Konstanz.
Foley-Fischer, Nathan, 2012, The timing of sovereign default over electoral terms, working paper,
Federal Reserve Board.
Grossman, Herschel I. and John B. Van Huyck, 1988, Sovereign debt as a contingent claim: excus-
able default, repudiation, and reputation, American Economic Review 78, 1088-1097.
Hatchondo, Juan Carlos and Leonardo Martinez, 2009, Long-duration bonds and sovereign defaults,
Journal of International Economics 79, 117-125.
Hatchondo, Juan Carlos and Leonardo Martinez, 2013, Sudden stops, time inconsistency, and the
duration of sovereign debt, International Economics Journal, forthcoming.
Hatchondo, Juan Carlos, Leonardo Martinez, and Horacio Sapriza, 2009, Heterogeneous borrowers
in quantitative models of sovereign default, International Economic Review 50, 1129-1151.
Hoshi, Takeo and Takahashi Ito, 2012, Defying gravity: How long will Japanese government bond
prices remain high, NBER Working Paper 18287.
Ito, Takahashi, 2011, Sustainability of Japanese sovereign debt, in Ito, Takahashi and Friska Paru-
lian (eds.), Assessment on the Impact of Stimulus, Fiscal Transparency, and Fiscal Risk, ERIA
Research Project Report 2010-01, 29-76.
Levy Yeyati, Eduardo and Ugo Panizza, 2011, The elusive costs of sovereign defaults, Journal of
Development Economics 94, 95-105.
Malone, Samuel M., 2011, Sovereign indebtness, default, and gambling for redemption, Oxford
Economic Papers 63, 331-354.
Mendoza, Enrique and Vivian Z. Yue, 2012, A general equilibrium model of sovereign default and
business cycles, Quarterly Journal of Economics 127, 889-946.
Morris, Stephen and Hyung Song Shin, 2004, Coordination risk and the price of debt, European
30
Economic Review 48, 133-153.
Panizza, Ugo, Frederico Sturzenegger, and Jeremin Zettelmeyer, 2009, The economics and law of
sovereign debt and default, Journal of Economic Literature 47, 651-698.
Reinhart, Carmen M. and Kenneth S. Rogoff, 2009, This Time is Different: Eight Centuries of
Financial Folly, Princeton University Press, Princeton and Oxford.
Reinhart, Carmen M. Kenneth S. Rogoff, and Miguel A. Savastano, 2003, Debt intolerance, Brook-
ings Papers on Economic Activity Spring, 1-74.
Rochet, Jean-Charles, 2006, Optimal sovereign debt: An analytical approach, Interamerican De-
velopment Bank Working Paper 573.
Rochet, Jean-Charles and Xavier Vives, 2004, Coordination failures and the lender of last resort:
was Bagehot right after all? Journal of the European Economic Association 2, 1116-1147.
Story, Louise, Landon Thomas Jr., and Nelson D. Schwartz, 2010, Wall St. helped to mask debt
fueling Europe’s crisis, New York Times, February 3.
Sturzenegger, Frederico and Jeremin Zettelmeyer, 2006, Debt Defaults and Lessons from a Decade
of Crises, MIT Press, Cambridge MA.
Yue, Vivian Z., 2010, Sovereign default and debt renegotiation, Journal of International Economics
80, 176-187.
31

b
b,τ(b) b
τ(b)
bM
Maximum Sustainable Borrowing bM
Figure 1

debt
InterestRates
R(d)d
R’(d) (Marginal)
(Average)
dM
Maximum Sustainable Debt dM Figure 2

'd
Md
d
0a
1
Mb11
1
Debt Dynamics under Risk Neutrality
*d
'*d
Figure 3

'd
Md
Mb1
d
0a
1
1
Debt Dynamics under Risk Aversion
Figure 4

Table 1 (%)
COUNTRY Μ σ Gvt.Inc./GDP md mPD D, 80‐11 PD, 80‐11 D, 11 PD, 11 Md MPDArgentina 2.5 6.0 28 7 0 73 82 45 0 61 3.09 Australia 3.1 1.6 33 21 0 20 0 24 0 166 0.62 Austria 2.1 1.5 49 44 0 64 0 72 0 224 0.59 Belgium 1.9 1.6 48 33 0 109 0 97 0 213 0.59 Brazil 2.7 3.3 34 16 0 69 0 65 0 111 1.46 Canada 2.5 2.1 42 24 0 77 0 85 0 168 0.86 Chile 4.5 4.7 23 10 0 10 0 11 0 71 2.18
Czech Republic 2.8 2.9 39 35 0 25 0 40 0 138 1.26 Denmark 1.6 2.2 58 36 0 51 0 44 0 216 0.88 Ecuador 3.1 3.4 24 12 0 34 0 18 0 79 1.50 Egypt 4.6 2.0 26 45 0 86 0 76 0 141 0.77 Finland 2.4 3.3 53 25 0 34 0 49 0 169 1.45 France 1.8 1.4 49 61 0 50 0 86 0 222 0.54 Germany 1.7 2.0 45 24 0 61 0 80 0 173 0.82 Greece 1.4 2.9 34 15 0 85 0 165 100 107 1.29 Hungary 1.1 3.6 45 19 0 65 0 80 0 122 1.65 Iceland 2.6 3.5 42 26 0 45 0 99 0 128 1.59
Indonesia 5.0 3.9 18 16 0 49 0 24 0 62 1.75 Israel 4.1 2.3 44 32 0 86 0 74 0 202 0.95 Italy 1.3 1.8 44 24 0 108 0 120 0 172 0.73 Japan 2.1 2.5 30 20 0 118 96 229 100 106 1.06
Malaysia 5.7 3.8 26 24 0 47 0 53 0 103 1.66 Mexico 2.6 3.7 20 9 0 43 0 44 0 61 1.65
Netherlands 2.2 1.8 46 36 0 59 0 65 0 194 0.71 New Zealand 2.2 2.1 34 19 0 42 0 38 0 135 0.85

Norway 2.6 1.8 53 36 0 42 0 50 0 236 0.70 Peru 3.1 6.1 19 7 0 35 0 21 0 44 3.13
Romania 1.1 5.5 31 7 0 23 0 33 0 67 2.77 Russia 1.7 6.8 37 7 0 29 0 12 0 72 3.69
South Africa 2.4 2.4 27 17 0 35 0 39 0 101 1.00 Spain 2.5 2.1 37 27 0 47 0 69 0 150 0.84 Sweden 2.3 2.2 56 52 0 55 0 38 0 216 0.91
Switzerland 1.8 1.7 34 26 0 50 0 47 0 141 0.67 Turkey 4.1 4.4 32 14 0 53 0 39 0 97 2.04 Ukraine ‐0.8 10.6 39 7 0 32 0 36 0 53 6.81
United Kingdom 2.3 2.2 38 21 0 46 0 82 0 149 0.89 United States 2.6 2.0 32 25 0 65 0 103 0 135 0.81
Uruguay 2.5 4.6 30 14 0 73 0 55 0 80 2.18 Venezuela 1.7 6.8 31 6 0 42 0 47 0 61 3.64 Vietnam 6.3 2.4 25 23 0 43 0 50 0 152 0.95