the local economic impacts of decommissioning the diablo ... · diablo canyon power plant (dcpp) is...
TRANSCRIPT

The Local Economic Impacts of Decommissioning the Diablo Canyon Power Plant
Prepared for:California Public Utilities CommissionPacific Gas and Electric Company
Prepared by:Professor Kenneth D. RienerOrfalea College of BusinessCalifornia Polytechnic State UniversitySan Luis Obispo, CA 93407
and
Patrick MayedaProductive Impact LLCSan Luis Obispo, CA 93401
March 2010

Executive Summary
The purpose of this study is to determine the economic impacts on the local economy if the Diablo Canyon Power Plant (DCPP) were decommissioned. In 2009, the California Public Utility Commission (CPUC) directed Pacific Gas and Electric Company (PG&E) to perform this task as part of DCPP’s license renewal feasibility studies. Presently, there are two nuclear reactors in operation at DCPP licensed to operate until 2024 and 2025, after which they would have to be decommissioned if the Nuclear Regulatory Commission (NRC) does not extend the licenses for an additional 20 years (2044 and 2045), as requested by PG&E.
This report utilizes the industry-standard IMPLAN® software Version 3.0 to estimate the direct, indirect and induced economic impacts on San Luis Obispo and northern Santa Barbara counties that would result from the decommissioning of DCPP. With 14 and 15 years remaining on the current licenses, it is expected that PG&E would continue to operate DCPP for the duration of those licenses and that the plant would continue to generate economic benefits similar to those that exist today.
To get a true representation of the economic impacts resulting from shutting down the plant, the year 2027 was used as the point in time when either full operation would continue with license extension or the plant would be idle during the decommissioning and removal process due to no license extension. In either case, the Independent Spent Fuel Storage Installation (ISFSI), known as the “Dry Cask Storage Facility,” would continue to operate and therefore, the economic benefits associated with the ISFSI have been included in both scenarios.
The CPUC also directed PG&E to compare the local economic impacts from plant closure to those from alternative uses of the DCPP site. Rather than analyze an extensive list of alternative uses that are not be suitable for the site, this report considers the economic impacts from the most practical use of the site – cattle grazing – which was the primary economic activity on the property for several decades prior to the establishment of the DCPP facility. This alternative use was found to be the most reasonable given the site’s physical conditions, the continued operation of ISFSI on the property, the San Luis Obispo County General Plan and Land Use Ordinances, Coastal Commission regulations and the landowner’s plans.
Economic impacts were identified using several factors including the value of electricity produced by DCPP, staffing levels, payroll (wages), expenditures of goods and services from local businesses, and taxes paid out. A summary of the economic impacts is shown in Table A on page 3. Details of each economic impact are fully discussed in the report.
2

ASSumIng DCPP LICEnSES ArE ExTEnDED
Total Employment (number of Jobs)
Total Output(millions of Dollars)
Direct1,578
Total3,202
Direct$1,261.99
Total$1,645.92
ASSumIng DCPP LICEnSES ArE nOT ExTEnDED
Total Employment (number of Jobs)
Total Output(millions of Dollars)
Direct Total Direct TotalISFSI (Dry Cask) 41 65.1 $8.17 $13.68
Cattle Ranch 3 6 $0.78 $1.53Total 44 71.1 $8.95 $15.21
Table A – Summary of Economic Impacts (Year 2027)
In Figure 1, the anticipated economic impact of DCPP with the license extensions is compared with a decommissioned DCPP, combining benefits from direct and indirect/induced impacts.
Figure 1 – Total Economic Impact (Year 2027)
0
$500,000,000
$1,000,000,000
$1,500,000,000
$2,000,000,000
$1.6 billion
$15.2 million
Extensions No Extensions
Indirect/InducedDirect
3

Figure 2 – Local Impacts (Year 2027)
ExtensionsNo Extensions
Indirect/Induced Impacts Property Taxes Sales Tax Expenditures
Extensions $383,930,000 $40,405,364 $65,205,781 $29,057,955
No Extensions $6,258,715 $1,074,351 $178,653 $203,142
$383.9m
$6.3m
$40.4m
$1.1m
$65.2m
$0.18m
$29.1m
$0.2m
Figure 2 compares the total local economic impacts of both license renewal conditions, specifying benefits from indirect/induced impacts, property taxes, sales taxes and local expenditures.
4

With license renewal: (year 2027 economic impacts)
$1.6 billion annually: total economic impact to San Luis Obispo and northern Santa •Barbara counties
$383.9 million annually: indirect and induced impacts •
$42.5 billion: total economic impact over the 20-year extension period•
3,202 jobs annually: total employment, including indirect and induced jobs•
$40.4 million annually: Unitary Property Taxes paid to San Luis Obispo County •
$65.2 million annually: sales taxes generated in the community •
$29.1 million annually: local expenditures of goods and services•
Without license renewal: (year 2027 economic impacts)
For economic rather than operational purposes, the following results assume that there will be no plant operations after 2024 and 2025 without license renewal. However, it is possible for the decommissioning process to take longer than the anticipated two to three years or have a later start date due to permitting requirements. Independent of decommissioning activities, the staffing levels of a non-operational facility would be fundamentally different and negative.
$15.2 million (a 99.1 percent decline): total economic impact to San Luis Obispo and •northern Santa Barbara counties
includes the impact of the ISFSI operation and the most reasonable •economic usage of the property (cattle grazing)
71 jobs (a 97.8 percent decline): total employment related to the ISFSI operation, •security and cattle grazing
$1.1 million (a 97.3 percent decline): Unitary Property Taxes paid to San Luis Obispo •County, based on the assessed value of the land
$0.18 million (a 99.7 percent decline): sales taxes generated in the community•
$0.2 million per year (a 99.3 percent decline): local expenditures of goods and services. •The operation of the ISFSI facility would not require significant local expenditures.
San Luis Obispo County Office of Emergency Services (OES) would lose approximately •$2.9 million or 84.6 percent of its operational budget which comes from PG&E due to the operation of DCPP.
5

6
Based on County data and PG&E financial information, the loss of DCPP as an employer and key contributor to the economy of San Luis Obispo and northern Santa Barbara counties would have a major impact on the local economy. Although PG&E pays its share of property taxes and a majority of the cost for the County’s OES, DCPP and its employees (while on site) use limited County-funded services, which are supported by PG&E’s annual taxes. DCPP provides its own security, fire protection, water treatment and distribution and wastewater treatment. The plant’s primary access road is privately maintained rather than County maintained. PG&E employees also have excellent medical care insurance and therefore in general do not utilize public health services. Based on this information, DCPP operations could be considered a net “resource generator.”
The primary purpose of this study was to determine DCPP’s economic impacts on the local economy. In cooperation with the Nuclear Energy Institute (NEI), this study will be expanded in the next 120 days to include the economic impacts of DCPP at a state and national level.

Introduction
In 2009, the California Public Utilities Commission (CPUC) directed Pacific Gas and Electric Company (PG&E) to conduct a detailed study of the local economic impacts that would result from the decommissioning and removal of Diablo Canyon Power Plant (DCPP), and to compare those impacts to the potential economic impacts created by alternative uses of the DCPP site. This report defines the local area as all of San Luis Obispo County and portions of northern Santa Barbara County, including the cities of Santa Maria, Guadalupe and Lompoc.
For the past 25 years, DCPP has been generating electricity for the local area as well central and northern California. Presently, DCPP operates two nuclear reactors that are licensed until 2024 and 2025, respectively, after which they will be decommissioned if the Nuclear Regulatory Commission (NRC) does not extend their licenses for an additional 20 years (2044 and 2045), as requested by PG&E. At present, DCPP generates approximately 20 percent of the power PG&E provides to the 48 counties in its service territory.
Since operations began, DCPP has been a major employer in San Luis Obispo and northern Santa Barbara counties. DCPP currently employs 1,610 people (1,578 residing in San Luis Obispo County) and contributes significant revenues to the local economy. Over 1,200 PG&E employees and 200 contractors work exclusively on the DCPP site, and the remainder work in the local community. This analysis quantifies the economic benefits of DCPP and the direct local economic impacts that would result if DCPP were shut down for an extended period of time or permanently. Direct economic impacts were determined using several factors including staffing levels, payroll (wages), expenditures on goods and services from local businesses, and tax revenues (property and sales). By utilizing the industry-standard IMPLAN® Version 3.0 software, indirect and induced impacts of these cash flows have been estimated, as have income tax and sales tax revenues generated by PG&E and its employees as a result of their activities at DCPP.
An additional economic impact addressed in the report is the effect on electricity cost if DCPP is decommissioned. Alternative methods of electricity generation and the economics behind each particular method are examined to identify the most likely scenario for replacing the power generated by DCPP and to determine if the cost of electricity to Central Coast consumers will increase or decrease as a result. If the cost of electricity increases, the removal of discretionary funds from the local economy would occur, reducing economic activity accordingly. This study does not estimate the actual electricity cost, but rather provides a rationale for a potential increase or decrease.
7
Diablo Canyon during Decommissioning
If the NRC does not extend the two licenses for DCPP, PG&E will decommission and remove the facility. A fully decommissioned DCPP means that a majority of the structures would be demolished and removed with the exception of the ISFSI facility, the breakwater construct and limited security operations. A majority of the DCPP site would be used for cattle grazing. Decommissioning would begin about a year after closure in 2024 (without a license extension) or 2044 (with a license extension). Based on PG&E’s experience with the ongoing decommissioning of the Humboldt Nuclear Facility, decommissioning and removal of DCPP is anticipated to require an average of 340 employees for two to three years. Based on this timeframe and staffing level, the economic impact of DCPP during decommissioning will be less than 25 percent of the plant’s impact when it is in full operation.
For the purposes of this study, the economic impacts of decommissioning the facility (i.e. short-term construction jobs) were not analyzed since this activity would take place whether or not DCPP’s licenses are extended by the NRC. Rather, this report compares the economic impact of DCPP in full operation to an alternative use of the site after decommissioning is complete.
8

Diablo Canyon after Decommissioning
Overall Economic Impact:
Diablo Canyon Power Plant (DCPP) is a mainstay of the economies of San Luis Obispo and northern Santa Barbara counties. It was estimated that in 2009, DCPP produced $653.6 million of electricity1. Add to that the $87.7 million of output produced by non-power generating employees and the economic team’s analysis finds that DCPP contributed $966.8 million of economic impact (direct, indirect and induced) to the local economy in 2009. DCPP’s direct output of $741.3 million created an additional $87 million in indirect impacts and $138.5 million in induced impacts on the local economy. By 2027, the total economic impact is expected to grow to $1.65 billion per year, assuming a 3-percent-per-year growth rate and no change in employment.
The economic impact of DCPP is significant to various industry sectors including administrative services, hospitals, nursing, retail, wholesale and religious organizations. In 2009, PG&E contributed at least $1 million to 45 different sectors of the local economy; see Table B on page 11.
DCPP also provides a stabilizing effect on the local economy. Unlike the other mainstays of the local economy – tourism, government and agriculture – DCPP has only a slight amount of cyclicality and seasonality. The seasonality of DCPP operations complements the tourism industry. Refueling takes place every 18 to 24 months for each reactor and occurs during the tourism industry’s off-season. Refueling brings in several hundred workers from outside the local area who stay in motels, hotels or short-term rentals and often eat at local restaurants. Each reactor alternates its refueling schedule, usually resulting in at least one refueling or significant equipment installation per year, typically during a slack part of the tourist season.
After the decommissioning of DCPP, there will be limited activity on the site. The Independent Spent Fuel Storage Installation (ISFSI) and guard station will continue to operate until all the spent fuel has been picked up by the Department of Energy. Since there is no specific date for this to occur, this report assumes operations of the ISFSI will continue well after the decommissioning of DCPP has been completed. According to PG&E, the operation of the ISFSI facility requires 41 employees with a combined payroll of $6.7 million. Because these employees will live in the local communities, they will contribute to the local economic impact. Besides employee expenditures, it is estimated that only about $203,142 local expenditures (a 99.7 percent decline) will result from ISFSI continued operations. Based on these figures, the total economic activity from the ISFSI operations after DCPP
1 According to the US Energy Information Administration, DCPP produced 17,091mKWH in 2008 and the California weighted average wholesale price for 2009 was $38.24 per mKWH. It was assumed that DCPP produced approximately the same amount of energy in 2009 as in 2008. 9

decommissioning is estimated to be $13.68 million in 2027. Additionally, assuming the best alternate usage of the nearly 10,000 acre property after decommissioning would be cattle grazing, the direct economic impact created by this activity would be $457,230, translating to a total economic impact after decommissioning of $1.5 million in 2027. Details of the cattle ranching analysis can be found in the Alternative Uses of Diablo Canyon Plant Site section of this report.
Therefore, the closure of DCPP would result in a net loss of $1.63 billion (a 99.1 percent decline) in the year 2027 alone. Assuming a 3 percent annual increase, the total economic impact over the 20-year extension period of the license renewal will be over $42.5 billion. DCPP’s economic impact is not only large and positive in size, but it has a stabilizing effect on the local economy. The loss of this stimulus would result in the elimination of more than 3,130 jobs from virtually every sector of the economy.
10
Figure 1 – Total Economic Impact (Year 2027)
0
$500,000,000
$1,000,000,000
$1,500,000,000
$2,000,000,000
$1.6 billion
$15.2 million
Extensions No Extensions
Indirect/InducedDirect
ASSumIng DCPP LICEnSES ArE ExTEnDED
Total Employment (number of Jobs)
Total Output(millions of Dollars)
Direct1,578
Total3,202
Direct$1,261.99
Total$1,645.92
ASSumIng DCPP LICEnSES ArE nOT ExTEnDED
Total Employment (number of Jobs)
Total Output(millions of Dollars)
Direct Total Direct TotalISFSI (Dry Cask) 41 65.1 $8.17 $13.68
Cattle Ranch 3 6 $0.78 $1.53Total 44 71.1 $8.95 $15.21
Table A – Summary of Economic Impacts (Year 2027)
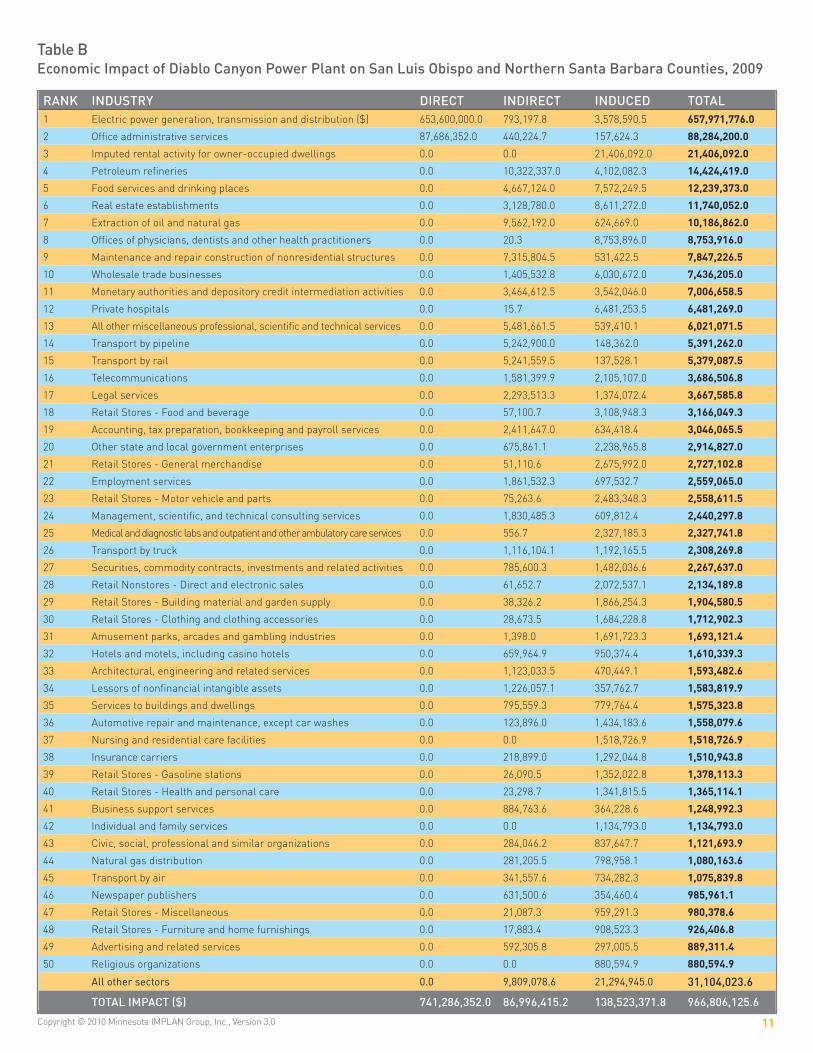
rAnk InDuSTrY DIrECT InDIrECT InDuCED TOTAL1 Electric power generation, transmission and distribution ($) 653,600,000.0 793,197.8 3,578,590.5 657,971,776.0
2 Office administrative services 87,686,352.0 440,224.7 157,624.3 88,284,200.0
3 Imputed rental activity for owner-occupied dwellings 0.0 0.0 21,406,092.0 21,406,092.0
4 Petroleum refineries 0.0 10,322,337.0 4,102,082.3 14,424,419.0
5 Food services and drinking places 0.0 4,667,124.0 7,572,249.5 12,239,373.0
6 Real estate establishments 0.0 3,128,780.0 8,611,272.0 11,740,052.0
7 Extraction of oil and natural gas 0.0 9,562,192.0 624,669.0 10,186,862.0
8 Offices of physicians, dentists and other health practitioners 0.0 20.3 8,753,896.0 8,753,916.0
9 Maintenance and repair construction of nonresidential structures 0.0 7,315,804.5 531,422.5 7,847,226.5
10 Wholesale trade businesses 0.0 1,405,532.8 6,030,672.0 7,436,205.0
11 Monetary authorities and depository credit intermediation activities 0.0 3,464,612.5 3,542,046.0 7,006,658.5
12 Private hospitals 0.0 15.7 6,481,253.5 6,481,269.0
13 All other miscellaneous professional, scientific and technical services 0.0 5,481,661.5 539,410.1 6,021,071.5
14 Transport by pipeline 0.0 5,242,900.0 148,362.0 5,391,262.0
15 Transport by rail 0.0 5,241,559.5 137,528.1 5,379,087.5
16 Telecommunications 0.0 1,581,399.9 2,105,107.0 3,686,506.8
17 Legal services 0.0 2,293,513.3 1,374,072.4 3,667,585.8
18 Retail Stores - Food and beverage 0.0 57,100.7 3,108,948.3 3,166,049.3
19 Accounting, tax preparation, bookkeeping and payroll services 0.0 2,411,647.0 634,418.4 3,046,065.5
20 Other state and local government enterprises 0.0 675,861.1 2,238,965.8 2,914,827.0
21 Retail Stores - General merchandise 0.0 51,110.6 2,675,992.0 2,727,102.8
22 Employment services 0.0 1,861,532.3 697,532.7 2,559,065.0
23 Retail Stores - Motor vehicle and parts 0.0 75,263.6 2,483,348.3 2,558,611.5
24 Management, scientific, and technical consulting services 0.0 1,830,485.3 609,812.4 2,440,297.8
25 Medical and diagnostic labs and outpatient and other ambulatory care services 0.0 556.7 2,327,185.3 2,327,741.8
26 Transport by truck 0.0 1,116,104.1 1,192,165.5 2,308,269.8
27 Securities, commodity contracts, investments and related activities 0.0 785,600.3 1,482,036.6 2,267,637.0
28 Retail Nonstores - Direct and electronic sales 0.0 61,652.7 2,072,537.1 2,134,189.8
29 Retail Stores - Building material and garden supply 0.0 38,326.2 1,866,254.3 1,904,580.5
30 Retail Stores - Clothing and clothing accessories 0.0 28,673.5 1,684,228.8 1,712,902.3
31 Amusement parks, arcades and gambling industries 0.0 1,398.0 1,691,723.3 1,693,121.4
32 Hotels and motels, including casino hotels 0.0 659,964.9 950,374.4 1,610,339.3
33 Architectural, engineering and related services 0.0 1,123,033.5 470,449.1 1,593,482.6
34 Lessors of nonfinancial intangible assets 0.0 1,226,057.1 357,762.7 1,583,819.9
35 Services to buildings and dwellings 0.0 795,559.3 779,764.4 1,575,323.8
36 Automotive repair and maintenance, except car washes 0.0 123,896.0 1,434,183.6 1,558,079.6
37 Nursing and residential care facilities 0.0 0.0 1,518,726.9 1,518,726.9
38 Insurance carriers 0.0 218,899.0 1,292,044.8 1,510,943.8
39 Retail Stores - Gasoline stations 0.0 26,090.5 1,352,022.8 1,378,113.3
40 Retail Stores - Health and personal care 0.0 23,298.7 1,341,815.5 1,365,114.1
41 Business support services 0.0 884,763.6 364,228.6 1,248,992.3
42 Individual and family services 0.0 0.0 1,134,793.0 1,134,793.0
43 Civic, social, professional and similar organizations 0.0 284,046.2 837,647.7 1,121,693.9
44 Natural gas distribution 0.0 281,205.5 798,958.1 1,080,163.6
45 Transport by air 0.0 341,557.6 734,282.3 1,075,839.8
46 Newspaper publishers 0.0 631,500.6 354,460.4 985,961.1
47 Retail Stores - Miscellaneous 0.0 21,087.3 959,291.3 980,378.6
48 Retail Stores - Furniture and home furnishings 0.0 17,883.4 908,523.3 926,406.8
49 Advertising and related services 0.0 592,305.8 297,005.5 889,311.4
50 Religious organizations 0.0 0.0 880,594.9 880,594.9
All other sectors 0.0 9,809,078.6 21,294,945.0 31,104,023.6
TOTAL ImPACT ($) 741,286,352.0 86,996,415.2 138,523,371.8 966,806,125.6
Table B Economic Impact of Diablo Canyon Power Plant on San Luis Obispo and northern Santa Barbara Counties, 2009
Copyright © 2010 Minnesota IMPLAN Group, Inc., Version 3.0 11

Other Local Economic Impacts:
This section of the report includes an analysis of the local economic impacts beyond the IMPLAN® economic model previously presented. Five major categories were analyzed to help clarify the economic effects felt by the local community if DCPP is decommissioned. Those categories are:
Employment•Local expenditures of goods and services•Taxes paid•Office of Emergency Services funding•Alternate uses of the DCPP site•
Employment:
Presently, DCPP employs 1,610 people. 1,578 live in San Luis Obispo or northern Santa Barbara County. Over 1,200 PG&E employees and 200 contractors work exclusively on the DCPP site, and the remainder work in the local community. As reported by PG&E, the payroll of the residents from these two counties in 2009 totaled $151.8 million2. Assuming a 3-percent annual wage increase and the license renewal, total payroll is expected to grow to $258.4 million by year 2027.
Because of the engineering and science training and skills required of most of the staff, average salary of DCPP employees is $96,569 (see Table C, page 13). DCPP and PG&E employees are compensated well above the county median household income, which was $60,534 in 2008. Based on these figures, DCPP is considered to be one of the highest-paying and most highly educated large enterprises in the Central Coast region.
DCPP also indirectly impacts the surrounding communities. According to the IMPLAN® analysis, for every job at DCPP there are approximately 1.03 additional jobs created in the local economy. Those jobs cover a wide variety of businesses (see Table D, page 14). Approximately 3,202 total jobs — including direct and indirect employments — are created by DCPP. Total employment will not change over time, but payroll will continue to increase by the rate of inflation. PG&E provides incentives to its employees to participate in community events and contributes approximately $300,000 annually to local charities and organizations through grants. As a result, PG&E employees frequently volunteer for community service, participate in educational activities, serve on boards or attend many of the area’s cultural events, providing additional economic activity to the local community.
2 According to the IMPLAN analysis, a total of $178.8 million of total compensation was calculated. This discrepancy is about 18 percent more than the $151.8 million reported by PG&E. It was assumed that IMPLAN captures the “benefit load” which is typically around 20 percent of payroll.
12

HOmE CITY HOmE COunTY EmPLOYEES AvErAgE SALArY
San Luis Obispo San Luis Obispo 239 $103,090
Arroyo Grande San Luis Obispo 237 $98,331
Atascadero San Luis Obispo 235 $94,683
Paso Robles San Luis Obispo 165 $92,336
Nipomo San Luis Obispo 110 $95,248
Grover Beach San Luis Obispo 106 $93,850
Templeton San Luis Obispo 74 $94,688
Pismo Beach San Luis Obispo 66 $101,018
Los Osos San Luis Obispo 57 $96,117
Oceano San Luis Obispo 35 $93,352
Avila Beach San Luis Obispo 34 $99,266
Morro Bay San Luis Obispo 23 $93,761
Shell Beach San Luis Obispo 22 $88,031
Santa Margarita San Luis Obispo 21 $91,103
San Miguel San Luis Obispo 8 $90,154
Creston San Luis Obispo 7 $83,414
Cambria San Luis Obispo 6 $89,526
Cayucos San Luis Obispo 4 $83,832
Santa Maria3 Santa Barbara 129 $92,867
grAnD TOTAL / AvErAgE 1578 $96,569
Table C - DCPP Employees 2009
If the license extension for an additional 20 years is not granted, the decommissioning process for DCPP would be completed in 2027 and these direct and indirect economic benefits would be significantly reduced. Employment would drop to about 71 people, the estimated number of employees needed to operate the remaining ISFSI facility and participate in cattle grazing. Assuming that the average wage would be the same, the payroll for the ISFSI workers would be $6.7 million per year compared to $258.4 million when DCPP is at full operation – a payroll deduction of more than $250 million.
13
3 Santa Maria includes the cities of Santa Maria, Orcutt, Lompoc and Guadalupe.

rAnk InDuSTrY DIrECT InDIrECT InDuCED TOTAL1 Office administrative services 853.0 4.3 1.5 858.8
2 Electric power generation, transmission and distribution 725.0 0.9 4.0 729.9
3 Food services and drinking places 0.0 80.0 129.8 209.9
4 Real estate establishments 0.0 21.3 58.5 79.8
5 Offices of physicians, dentists and other health practitioners 0.0 0.0 73.0 73.0
6 Employment services 0.0 51.5 19.3 70.8
7 Maintenance and repair construction of nonresidential structures 0.0 62.5 4.5 67.1
8 Private hospitals 0.0 0.0 49.0 49.0
9 Retail Stores - General merchandise 0.0 0.9 46.9 47.8
10 Wholesale trade businesses 0.0 8.0 34.5 42.6
11 Retail Stores - Food and beverage 0.0 0.7 39.9 40.6
12 Accounting, tax preparation, bookkeeping and payroll services 0.0 28.5 7.5 36.0
13 Nursing and residential care facilities 0.0 0.0 34.5 34.5
14 Retail Stores - Motor vehicle and parts 0.0 0.9 28.9 29.8
15 Monetary authorities and depository credit intermediation activities 0.0 14.3 14.6 28.8
16 Private household operations 0.0 0.0 28.7 28.7
17 Retail Nonstores - Direct and electronic sales 0.0 0.8 26.8 27.6
18 Legal services 0.0 16.6 9.9 26.6
19 Services to buildings and dwellings 0.0 13.2 12.9 26.1
20 Individual and family services 0.0 0.0 25.2 25.2
21 Retail Stores - Miscellaneous 0.0 0.5 23.9 24.5
22 Civic, social, professional and similar organizations 0.0 6.0 17.7 23.6
23 Retail Stores - Clothing and clothing accessories 0.0 0.4 22.1 22.5
24 Retail Stores - Building material and garden supply 0.0 0.4 20.0 20.4
25 Extraction of oil and natural gas 0.0 18.9 1.2 20.1
26 Management, scientific and technical consulting services 0.0 13.7 4.6 18.2
27 Hotels and motels, including casino hotels 0.0 7.3 10.5 17.8
28 Transport by truck 0.0 8.4 9.0 17.5
29 Private elementary and secondary schools 0.0 0.0 17.4 17.4
30 Automotive repair and maintenance, except car washes 0.0 1.3 14.5 15.8
31 Retail Stores - Health and personal care 0.0 0.3 15.4 15.7
32 Performing arts companies 0.0 8.5 6.9 15.4
33 Other private educational services 0.0 0.1 15.2 15.3
34 Transport by rail 0.0 14.1 0.4 14.5
35 Medical and diagnostic labs and outpatient and other ambulatory care services 0.0 0.0 13.8 13.8
36 Business support services 0.0 9.6 4.0 13.6
37 Securities, commodity contracts, investments and related activities 0.0 4.6 8.8 13.4
38 Personal care services 0.0 0.0 13.2 13.2
39 Architectural, engineering and related services 0.0 9.0 3.8 12.8
40 Amusement parks, arcades and gambling industries 0.0 0.0 11.9 11.9
41 Community food, housing, and other relief services, including rehabilitation services
0.0 0.0 11.7 11.7
42 Home health care services 0.0 0.0 11.6 11.6
43 Retail Stores - Sporting goods, hobby, book and music 0.0 0.2 10.9 11.2
44 Other state and local government enterprises 0.0 2.3 7.7 10.0
45 Child day care services 0.0 0.0 9.7 9.7
46 Grantmaking, giving, and social advocacy organizations 0.0 0.0 9.6 9.6
47 Retail Stores - Furniture and home furnishings 0.0 0.2 9.2 9.4
48 Transit and ground passenger transportation 0.0 5.1 3.9 9.1
49 Fitness and recreational sports centers 0.0 1.5 7.3 8.8
50 Newspaper publishers 0.0 5.1 2.9 8.0
All other sectors 0.0 88.2 145.7 234.0
TOTAL EmPLOYmEnT CrEATED 1,578.0 510.2 1,114.4 3,202.6
Table DTotal Employment Created by Diablo Canyon Power Plant in San Luis Obispo and northern Santa Barbara Counties, 2009
Copyright © 2010 Minnesota IMPLAN Group, Inc., Version 3.0 14

Local Expenditures of goods and Services:
As shown below in Table E, DCPP is a major purchaser of goods and services from the local economy. Those purchases include the procurement of parts, tools and services from a wide variety of local businesses. In 2009, PG&E’s direct expenditures in the local area totaled more than $17 million. The company’s expenditures exceeded $73.5 million over the last four years from 2006 to 2009. Since 2006, DCPP local expenditures have averaged $18.4 million per year. This trend is expected to continue over the life of the plant.
ExPEnDITurES BY CITY 2006 2007 2008 2009 grAnD TOTAL
Arroyo Grande $148,336.57 $113,937.82 $59,424.44 $1,092,812.61 $1,414,511.44Atascadero $1,913,577.22 $410,645.25 $620,439.40 $810,930.46 $3,755,592.33Buellton $27,480.00 $29,720.00 $57,200.00Cambria $24,480.00 $20,500.00 $45,100.00Cayucos $83,232.50 $127,320.44 $210,552.94Grover Beach $112,850.30 $137,352.79 $95,493.74 $106,701.47 $452,407.30Lompoc $500.00 $10,382.98 $800.00 $11,682.98Los Osos $21,182.11 $76,939.40 $34,582.50 $132,704.01Morro Bay $197,534.43 $137,642.47 $34,606.00 $42,565.98 $412,348.88 Nipomo $1,035,064.50 $203,781.22 $3,795,905.00 $2,292,562.23 $7,327,312.95 Oceano $57,820.00 $57,820.00 Paso Robles $495,468.51 $197,324.05 $112,666.73 $280,909.45 $1,086,368.74 Pismo Beach $43,015.07 $43,125.00 $120,558.09 $33,190.00 $239,888.16 San Luis Obispo $13,907,114.51 $13,677,283.00 $6,702,708.62 $6,275,722.85 $40,562,828.98 Santa Margarita $20,188.98 $20,188.98 Santa Maria $1,243,928.06 $2,152,573.93 $3,670,512.89 $2,706,744.90 $9,773,759.78 Solvang $360.00 $360.00 Templeton $6,800.00 $972,290.68 $3,852,759.14 $3,362,035.00 $8,193,884.82
grAnD TOTAL $19,228,792.76 $18,293,559.63 $19,163,673.45 $17,068,486.45 $73,754,512.29
Table E - Local Expenditures by City
Businesses within the city of San Luis Obispo received $40.6 million (54.9 percent) in DCPP expenditures. Businesses in the city of Santa Maria received $9.8 million (13.3 percent). Businesses in Templeton received $8.2 million (11.1 percent) and businesses in Nipomo received $7.3 million (9.9 percent). Figure 3 on page 16 illustrates how each city on the Central Coast has been affected by DCPP expenditures over the last four years.
15

Santa Margarita0.03%
Pismo Beach0.33%
Paso Robles1.47%
Oceano0.08%
Santa maria13.25%
Solvang0.00%
Arroyo Grande1.92% Atascadero
5.09%
Buellton 0.08%
Cambria 0.06%Cayucos 0.29%Grover Beach 0.61%
Lompoc 0.02%
Los Osos 0.18%Morro Bay 0.56%
Templeton11.11%
nipomo9.93%
San Luis Obispo55.00%
Figure 3 - Local Expenditures by City
16

Taxes Paid (revenues):
PG&E’s tax payments resulting from the operation of DCPP are significant. Unitary Property Tax revenue for 2009/2010 is $24,455,910. As shown in Figure 4, 2009/2010 unitary tax distributions have a significant effect on numerous local entities, especially schools and other County and City operations.
17
* There are 63 governmental entities that receive between $1 to $24,999** There are 17 governmental entities that receive between $25,000 to $249,999
San Luis Coastal Unified$8,907,476
San Luis Coastal Unified$8,907,476
Total $1 – $24.9K*238,812
Total $25K – $249K**1,264,772
Roads $284,476
Paso Robles Unified $343,175
Port San Luis Harbor $368,428Atascadero Unified $375,122
Lucia Mar Unified $525,205
County Library $472,261
County School Service$1,095,872
Cuesta College$1,847,353
Education Revenue Augmentation Fund
$2,194,013
General Fund$6,538,945
General Fund$6,538,945
Figure 4 - 2009/2010 unitary Tax revenue
In addition to property taxes paid, Diablo Canyon activities generate state- or federal-level taxes including income taxes, social security taxes and vehicle license fees. Utilizing the IMPLAN® model, it is estimated that the sales taxes generated by activities of the DCPP, its employees and the secondary suppliers totaled $38.3 million annually– providing a significant source of revenue for municipal and county governments. By 2027, this number is expected to grow to $65.2 million.
To help understand the effect the annual DCPP unitary tax payments have on the Central Coast, the report outlines three separate jurisdictions and how allotted unitary property taxes are used: San Luis Obispo County General Fund, San Luis Coastal Unified School District and the Port San Luis Harbor District.
San Luis Obispo County general Fund:
For 2009/2010, the total budget for San Luis Obispo County is $467,715,648, with a General Fund budget of $380,758,608. As allocated, the General Fund receives 26.7 percent of DCPP unitary tax payment each year. In 2009/2010, the County of San Luis Obispo will receive $6,538,945 from PG&E’s tax payment, which makes up 1.7 percent of the County’s General Fund. These monies help fund budget items such as public works, probation and sheriff offices, health and other vital services.
For example, this $6.5 million could fund, in their entirety, the County’s Drinking Driver Program ($1.78 million), County Medical Services Program ($3.3 million) and the Indigent Program ($1.2 million). Diablo Canyon pays more property taxes than any other entity in the County because of the method of assessment and lack of Proposition 13 protection. As long as Diablo Canyon is allowed to operate, those payments will continue.
San Luis Coastal unified School District:
In the 2010/2011 tax year, San Luis Coastal Unified School District (SLCUSD) will receive $8,907,476, or 36.4 percent of the unitary taxes paid by PG&E. The overall SLCUSD budget for 2009/2010 is estimated at $74 million4. The allotment from PG&E’s unitary tax payment is approximately 12 percent of the school district’s entire budget.
SLCUSD has become a “basic aid” district or “community funded” district because of this annual influx of property tax money paid by PG&E. Basic aid districts do not receive funding based on enrollment. Rather, they are reliant on a large, steady property tax base that creates a stable revenue source for the districts, making them less affected by the State of California’s budget crisis.
18
4 Cornejo, Ann Marie, “Reasons for San Luis Coastal school district’s $9 million deficit are plenty,” SLO County Tribune, March 25, 2010.

Port San Luis Harbor District:
In 1954, the citizens of southern San Luis Obispo County voted to create and fund a Harbor District for the Port San Luis area. Its charter is to refurbish and maintain the Harbor District’s old facilities and increase commerce for the south county. Five Harbor Commissioners were elected and, in 1955, the State Legislature granted the Harbor District the area’s tidelands in trust. California (State) owns and manages the waters out to three miles. The Harbor District owns the Harford Pier and surrounding property.
In 2009/2010, the Harbor District’s budget of $3,999,354 was used to repair the District facilities and tend to environmental responsibilities, while maintaining a balance to serve the boating and general public. PG&E’s unitary tax payment allotment to the Harbor District for 2009/2010 is $368,428, which is 13.6 percent of the $2.7 million of tax proceeds the Harbor District will receive as income this year. In 2008/2009, the Harbor District budgeted $168,500 for Special Projects/Equipment. Without the tax dollars paid by PG&E, many of those special projects would likely go un-funded. Typical special projects include Harbor Patrol boat replacements, fire line repairs and lift station repairs.
After decommissioning, the 2027 unitary property taxes paid by PG&E are estimated to drop from about $40.4 million per year to about $1.1 million per year, representing a 97.3 percent decline. Since DCPP’s assessed value is based on energy production capability rather than plant assets, it is assumed that their property tax will follow the rate of inflation as well. Additionally, if DCPP is decommissioned in 2027, overall sales tax revenues are estimated to drop from $65.2 million at full operation to $0.18 million, a 99.7 percent decline.
The economic team predicts that the plant and equipment at the DCPP site will be written off rapidly, since their economic productivity will be zero and most of the plant and equipment will not be salvageable for use elsewhere. So-called Business Personal Property, such as motorized vehicles, furniture and tools, would be removed or written off. Only the value of the land will remain, which is currently assessed at $65 million. Therefore, the new assessed value is less than 2.7 percent of the total $2.45 billion of the current assessment of DCPP. DCPP assessed value is based on energy production capability rather than plant assets. PG&E is not subject to Proposition 13 protections.
19

Revisiting the three separate jurisdictions examples noted previously, the team has speculated that the effects of the license non-renewal would include the following:
A loss of $6.5 million of allotted tax dollars to the County of San Luis Obispo, reducing •the agency’s current General Fund budget by 1.7 percent
A dramatic reduction of revenue to the SLCUSD (from over $8.9 million to $236,750), •most likely shifting this basic aid district to a revenue limit district that is more susceptible to State budget fluctuations
A reduction of at least 10 percent to the Port San Luis Harbor District budget, resulting •in the elimination or postponement of many special projects and repairs
Office of Emergency Services funding:
The budget of the Office of Emergency Services of San Luis Obispo County (OES) for 2010 is $2,047,000. PG&E is required to pay for a majority of that budget due to Assembly Bill 292 (AB292) which was extended and signed into law in 2007. AB292 will need to be extended again in 2019. AB292 requires PG&E to pay $1,732,000 annually to the OES, beginning in 2010, to help cover costs associated with emergency planning and response for Diablo Canyon. This funding ensures that San Luis Obispo County has the resources necessary to discharge its critical public safety responsibilities in case of a nuclear incident. The OES also provides emergency services for flood, fire, earthquake and hazardous materials accidents.
Many benefits that were originally intended for DCPP safety are now jointly used for all emergency events. For example, emergency sirens and testing procedures were put in place for nuclear leakage warning. These sirens are now used for flood, fire and earthquake warnings as well. If DCPP is decommissioned, PG&E’s requirement to pay for these services will disappear, cutting the current OES budget by $2.9 million5 or 84.6 percent.
Alternative uses of Diablo Canyon Power Plant site:
Once decommissioned and restored to its natural condition, the DCPP site is unlikely to produce much economic activity. Large-scale development of the site is highly unlikely since much of the land is already subject to conservation easements agreed to by PG&E. In addition, since much of the coastal area has been classified as an important Chumash cultural site, recreational use is not likely to be permitted along much of the coastal bluffs.
Most of the land is hilly, undeveloped and endowed with spectacular ocean views. A likely scenario would be similar to the Hearst San Simeon Ranch agreement, where PG&E would
20
5 This assumes the OES budget and PG&E’s AB292 requirement will continue to grow at the rate of inflation to $2,948,614 by 2027.

offer to sell whatever development rights the company retains to a land conservation organization. Hiking and bicycle paths would likely be constructed on the property as an extension to Montaña de Oro State Park, adjacent to Los Osos. If some portion of the property surrounding Diablo Canyon is opened for recreational use, new hiking, biking and surfing venues could be provided to visitors. As this would not be considered a new type of recreational opportunity, it is not likely to attract new visitors to the Central Coast and would not, therefore, add significant new tourist dollars to the local economy.
Since little, if any, of the PG&E land is prime agricultural land, its highest and best use (other than the development discussed above) might be to run cattle or sheep, as is currently being done on much of the property. Cattle grazing would be difficult in many areas due to the hilly landscape overgrown with brush. The land’s ability to sustain cattle will vary widely, depending upon rainfall, which makes it difficult to accurately predict the potential rental value of the property.
Based upon other land rental estimates, however, it seems likely that the average income from running cattle would be between $50/acre/year and $100/acre/year. Assuming half of the nearly 10,000-acre property would be suitable for cattle, this would produce a rental income of $250,000 to $500,000 per year. This revenue would go into PG&E’s corporate accounts and not into the local economy.
Employment created by cattle grazing would be small — perhaps two or three workers to manage the cattle operation. Presumably the cattle would be trucked in, allowed to graze until they had consumed all the suitable grass within a few weeks or months, and then trucked to a feedlot in the Central Valley. An IMPLAN® analysis of a cattle ranch run by 3 persons produced a Direct Economic Impact of $457,230, translating to a Total Economic Impact of $1,527,559 in the year 2027. The 3 direct jobs would generate an additional 3 indirect and induced jobs in the local area.
The site of the actual power plant, which is flat, accessible and covers about 550 acres, might be suitable for cultivation. The site’s relative isolation, however, would be an inconvenience for potential sharecroppers and the land might be “stigmatized” because of its nuclear past, making it difficult to rent out to a reliable tenant. In addition, crop land typically generates a relatively small amount of income, only about $100-$200 per acre. Thus, the local economic impact of any agriculture-related activity would be negligible.
Given recent successes by conservationist groups in raising the capital necessary to compete with developers, PG&E might find it in its economic interest to sell the development rights and keep the land undeveloped. If PG&E were to sell the development rights or put the land into Williamson Act, the site’s property taxes might be reduced well below the normal tax liability of 1 percent of the acquisition cost of the property.
21

Loss of DCPP Electric generating Capacity
Most scenarios proposed for replacing DCPP power are likely to have an upward impact on price and/or local hydrocarbon emissions. Instead of electricity being generated locally and exported across the State, the local market would become purchasers of electricity generated elsewhere. This increase in electricity cost will reduce local expendable income.
Since DCPP produces about 20 percent of the power PG&E supplies to its customers, and California’s current peak needs already stretch its generation capacity, it will not be easy or inexpensive to replace the lost capacity. It will likely require a combination of conservation, additional sources of fossil fuel generation, nuclear generation capacity elsewhere and alternative energy sources such as wind, solar and wave/tidal energy.
Although the “all-in” cost of new nuclear-powered electric plants is expensive due to the large up-front capital cost, the continued operation of existing plants is significantly less expensive than any fossil-fueled source of power, with the possible exception of coal6. And since the marginal cost of power generated by a nuclear plant is small, it makes economic sense to operate a nuclear plant at full capacity at all times, responding to daily and seasonal variations in demand by adjusting the output of fossil-fuel plants.
Nuclear reactors require large upfront investments in capital assets, but the operating costs are relatively small. This characteristic is shared by the most promising non-fossil-fuel sources of electricity, such as solar-electric power plants, wind generation, wave and tide energy electricity generation and geothermal energy. That said, a cost-effective electricity-generation strategy that must deal with hourly, daily and seasonal variations in demand will rely on non-fossil-fuel resources for as much of its base demand as possible, utilizing fossil-fuel plants to meet the peak electricity demand.
Unlike the alternative-energy sources cited above, nuclear energy is available 24 hours a day, seven days a week, year round and is not susceptible to the vagaries of weather. Thus, it is more suitable as a basic source of energy supply, along with various fossil-fuel technologies and small quantities of hydroelectric and geothermal generation.
If DCPP’s licenses were not extended past 2024 and 2025, 17,091mKWH of the base load energy would be removed from California’s electricity-generation capacity. This energy supply would need to be replaced by a mixture of conservation measures as well as gas,
6 A recent (2009) study by MIT faculty found that combined cost of electricity for fuel plus operating cost, including provision for decommissioning, for nuclear plants were less than 63 percent of the cost of coal, and less than 50 percent of the price of natural gas.
22

coal and oil. Whether conservation can completely offset the loss of DCPP capacity is highly uncertain. The State’s loading order, which includes energy efficiency as its cornerstone, has had a noticeable effect on the growth rate of electricity consumption. The California Energy Commission reports per capita electricity sales have been flat since 1973. However, California’s population has nearly doubled in that same period of time.
Alternative sources of energy such as solar, hydroelectric plants, biomass, wind and geothermal will provide a relatively small percentage of the State’s needs. The bulk of those needs will be provided by fossil fuel (mostly gas), supplemented by nuclear energy. Nuclear energy capacity supplies approximately 20 percent of California’s total generating capacity, from the San Onofre and Diablo Canyon plants. If nuclear energy is eliminated from the equation, it will likely have to be replaced with fossil-fuel generation.
Based upon current economics, coal is the only fossil fuel that can compete with nuclear energy in terms of the marginal cost of production. Given the heavy environmental impact of coal-powered electric plants, it seems unlikely that there will be an increase in coal-powered electric plants in California. In theory, there could be an increase in this type of plant in neighboring states, but California’s neighbors are increasingly resistant to building electric plants in their territory only to have the electricity (and economy-building potential) exported to California while leaving the pollution behind in Nevada, Arizona, Oregon or Mexico.
The most likely scenario will be an increase in California-sited fossil-fuel electricity production. It is difficult to predict whether this takes the form of new facilities, increased capacity in existing power plants or resuscitation of currently-unused facilities, such as Morro Bay. DCPP closure would likely result in higher electricity costs, reducing local spendable income. Resuscitation of the Morro Bay generating facility would have a positive economic impact on Morro Bay and the county, but any such proposal is likely to be met with local resistance, significant regulatory challenges, and would take many years to become reality.
23
Prepared for:California Public Utilities Commission
Pacific Gas and Electric Company
Prepared by:Professor Kenneth D. RienerOrfalea College of Business
California Polytechnic State UniversitySan Luis Obispo, CA 93407
Patrick MayedaProductive Impact LLC
San Luis Obispo, CA 93401
March 2010