the long-run characteristics of the us film...
TRANSCRIPT

THE LONG-RUN CHARACTERISTICS OF THE US FILM INDUSTRY
Michael Pokorny and John Sedgwick
London Metropolitan University
London, England
Correspondence Address: Mr Michael Pokorny Department of Accounting, Banking and Financial Systems London Metropolitan University 277-281 Holloway Road London N7 8HN England Fax: 020 7753 5051 e-mail: [email protected]

2
THE LONG-RUN CHARACTERISTICS OF THE US FILM INDUSTRY
Abstract
This paper presents a broad overview of the development of the US film industry from 1930
to the present day. The analysis is derived from three unique US data sources – a data set
reflecting the profitability of film production in the 1930s, a second data set reflecting the
demand for film in the 1950s and 1960s, and a final data set reflecting demand and cost
characteristics of film production in the 1990s. The paper traces the industry from its heyday
in the 1930s through to its rapid decline in the immediate post-war period, and its recovery
from the 1970s onward, and attempts to provide explanations for these secular movements. It
presents a picture of an industry that operates in a relatively volatile environment, in terms of
annual rate of return and market share variability, and yet an industry that is remarkably
stable in terms of its structure and its broad characteristics. Although the industry has always
been structured as an oligopoly, it is an industry that is also characterised by high levels of
competition. While the steep decline in movie going in the post-war period could have
proved catastrophic, the industry responded vigorously and successfully. The main
mechanisms for the survival of the industry were first, the refinement of high budget movie
production as the focus for profitability and second, the development of increasingly
sophisticated distribution and exhibition networks that have been able to respond speedily
and effectively to meet consumer demand.

3
THE LONG-RUN CHARACTERISTICS OF THE US FILM INDUSTRY 1 Introduction While the development of the film industry had its origins in Europe at the end of the 19th and
beginning of the 20th centuries, the industry very rapidly became to be dominated by the US,
and Hollywood in particular. This dominance set in at about the end of the 1914-1918 World
War,1 and has continued to intensify to the present day, to the point at which the stranglehold
that Hollywood has over the market is generally accepted to be unbreakable. This has been
the case in spite of (or perhaps because of) a wide range of innovations that have occurred on
both the production and exhibition sides of the industry.
This paper seeks to provide a broad overview of the development of the film industry from
1930 to 1999, with a particular emphasis on the development of Hollywood. The paper will
attempt to identify the main characteristics of the industry, describe how these characteristics
have evolved over time, and explain the manner in which they have contributed to the
dominance of Hollywood.
The analysis that follows is derived from three unique data sets. The first consists of all the
films produced by MGM, RKO and Warner Bros. over the period 1930 to 1942. This data set
consists of 1,796 films, with data being available on the distributor rentals that each of these
films generated, their production (negative) costs, and in the case of MGM and RKO the
profits generated by each of these films.2 The second data set covers the period 1946 to
1965, and is derived from the trade journal Variety. Each year the journal published an
annual list of the most popular films released onto the US market, together with the rental
incomes they generated for their distributors. This data set consists of 1,820 films, which

4
includes between 61 and 130 top-ranking films for each year. A more detailed description of
this data set can be found in Sedgwick (2002). The final data set covers the period 1988 and
1999, and has been supplied by AC Neilsen/EDI Inc. This data set includes the box-office
revenues of all films released onto the US market between 1988 and 1999 and the distributors
of each of these films. The data set also includes estimates of the production costs for just
over half of these films.
This paper is structured as follows. The next section provides a summary of the
macroeconomic environment within which Hollywood developed, together with summary
statistics describing the development of the industry. This is followed by a description of the
unique characteristics of film as a commodity, and the manner in which these characteristics
impacted upon the microeconomic development of the industry. There then follows an
exposition of the competitive environment of the industry, the role that risk plays in the
strategic planning process, and the implications that this has had for market structure. A final
section draws a number of conclusions.
2 The Evolution of the US Film Industry
Figure 1 shows real consumers’ expenditure on movie going (1958 prices), from 1929 to
1999.3 The notable features of these data are the rapid growth of the industry throughout the
1930s and 1940s, after the relatively short- lived impact of the depression, a similarly rapid
decline in the immediate post-war period, and then recovery and slow, although somewhat
inconsistent, growth from the early-1970s. A similar picture is reflected in the number of
films released onto the US market, which is shown in Figure 2 from 1929 to 1999.4 Thus in
terms of both total releases and US-produced releases, the 1930s represented the ‘golden
5
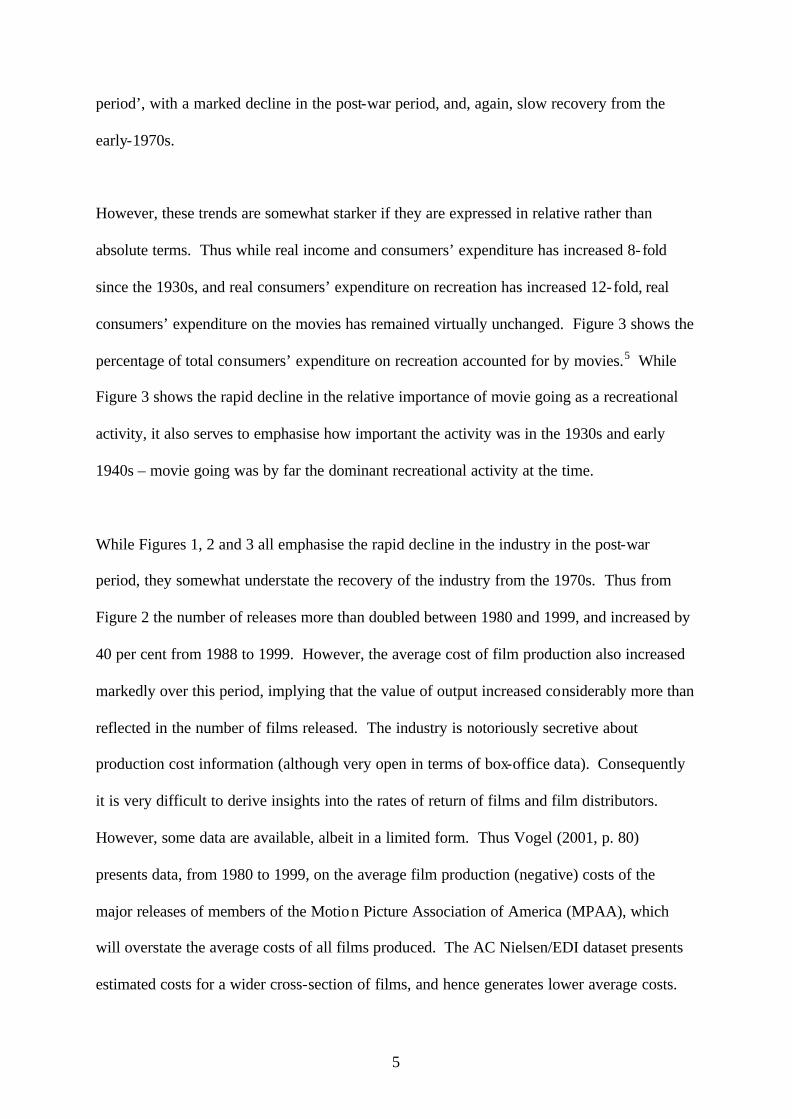
period’, with a marked decline in the post-war period, and, again, slow recovery from the
early-1970s.
However, these trends are somewhat starker if they are expressed in relative rather than
absolute terms. Thus while real income and consumers’ expenditure has increased 8-fold
since the 1930s, and real consumers’ expenditure on recreation has increased 12-fold, real
consumers’ expenditure on the movies has remained virtually unchanged. Figure 3 shows the
percentage of total consumers’ expenditure on recreation accounted for by movies.5 While
Figure 3 shows the rapid decline in the relative importance of movie going as a recreational
activity, it also serves to emphasise how important the activity was in the 1930s and early
1940s – movie going was by far the dominant recreational activity at the time.
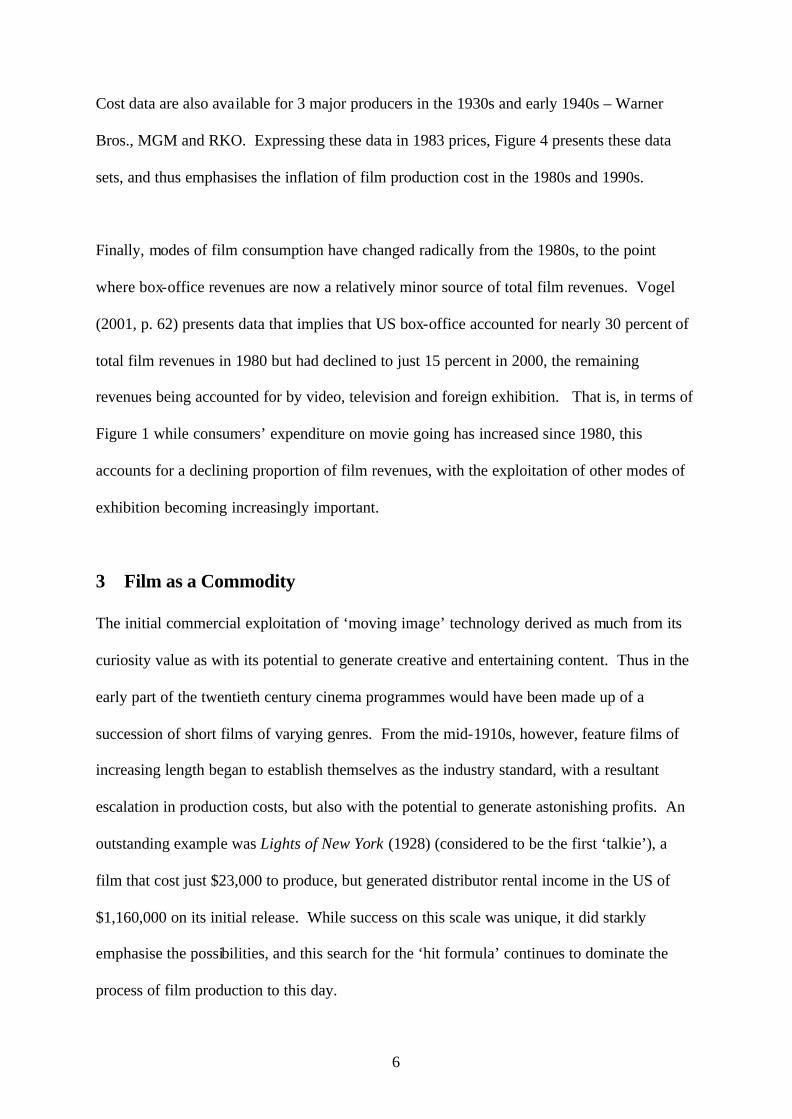
While Figures 1, 2 and 3 all emphasise the rapid decline in the industry in the post-war
period, they somewhat understate the recovery of the industry from the 1970s. Thus from
Figure 2 the number of releases more than doubled between 1980 and 1999, and increased by
40 per cent from 1988 to 1999. However, the average cost of film production also increased
markedly over this period, implying that the value of output increased considerably more than
reflected in the number of films released. The industry is notoriously secretive about
production cost information (although very open in terms of box-office data). Consequently
it is very difficult to derive insights into the rates of return of films and film distributors.
However, some data are available, albeit in a limited form. Thus Vogel (2001, p. 80)
presents data, from 1980 to 1999, on the average film production (negative) costs of the
major releases of members of the Motion Picture Association of America (MPAA), which
will overstate the average costs of all films produced. The AC Nielsen/EDI dataset presents
estimated costs for a wider cross-section of films, and hence generates lower average costs.
6
Cost data are also available for 3 major producers in the 1930s and early 1940s – Warner
Bros., MGM and RKO. Expressing these data in 1983 prices, Figure 4 presents these data
sets, and thus emphasises the inflation of film production cost in the 1980s and 1990s.
Finally, modes of film consumption have changed radically from the 1980s, to the point
where box-office revenues are now a relatively minor source of total film revenues. Vogel
(2001, p. 62) presents data that implies that US box-office accounted for nearly 30 percent of
total film revenues in 1980 but had declined to just 15 percent in 2000, the remaining
revenues being accounted for by video, television and foreign exhibition. That is, in terms of
Figure 1 while consumers’ expenditure on movie going has increased since 1980, this
accounts for a declining proportion of film revenues, with the exploitation of other modes of
exhibition becoming increasingly important.
3 Film as a Commodity
The initial commercial exploitation of ‘moving image’ technology derived as much from its
curiosity value as with its potential to generate creative and entertaining content. Thus in the
early part of the twentieth century cinema programmes would have been made up of a
succession of short films of varying genres. From the mid-1910s, however, feature films of
increasing length began to establish themselves as the industry standard, with a resultant
escalation in production costs, but also with the potential to generate astonishing profits. An
outstanding example was Lights of New York (1928) (considered to be the first ‘talkie’), a
film that cost just $23,000 to produce, but generated distributor rental income in the US of
$1,160,000 on its initial release. While success on this scale was unique, it did starkly
emphasise the possibilities, and this search for the ‘hit formula’ continues to dominate the
process of film production to this day.

7
Hollywood in the 1930s
The evolution of the film industry reached its zenith in the 1930s, with the technological
refinements of sound and colour, the consolidation of the ‘star system’, and cinema going, in
effect, becoming a staple consumption activity rather than a luxury one. This is apparent
from Figures 1 to 3. Indeed it is difficult to underestimate the hold that the cinema had over
the public imagination during this period, which is commonly described as Hollywood’s
‘Golden Period’.
However this very rapid diffusion also developed a consuming public that became
increasingly sophisticated in its tastes, and demanded continual innovation on the part of
producers. The problem was that consumers could not articulate the nature of innovations
that they were seeking – they sought ‘surprises’, and ‘would know it when they saw it’, but in
effect they had to be entirely producer- led. While the success of a film such as Lights of New
York illustrated the staggering profits that could be generated from a very modest investment,
this example was misleading, and was the exception rather than the rule. High box-office
revenues tended to be generated by high-budget films, as film producers sought to surprise
and innovate with films with ever-increasing production values. However, there was
certainly no direct or reliable link between the magnitude of production budgets and financial
success. Thus films such as Gone with the Wind (1939) (produced at a cost of $4.8m in 1929
prices), Marie Antoinette (1938) ($3.6m), The Wizard of Oz (1939) ($3.4m), The Good Earth
(1937) ($3.4m), Northwest Passage (1940) ($3.3m) and Conquest (1937) ($3.3m) all made
substantial losses at their initial release, although all were critically acclaimed, and even
though some went on to generate substantial returns upon re-release. The largest profit-
generating films of the period were films of relatively modest budgets. Thus the largest profit

8
generator was Mrs Miniver (1942) (produced at a cost of $1.4m but generating $5m in
profits). Other notable films were Snow White and the Seven Dwarfs (1937) (cost: $1.8m;
profits: $4.6m) The Singing Fool (1928) ($0.4m; $3.6m), Sergeant York (1941) ($2.1m;
$2.8m), San Francisco (1936) ($1.6m; $2.7m), Boys Town (1938) ($1m; $2.6m), and The
Broadway Melody (1929) ($0.4m; $1.6m).
Identifying a ‘winning formula’ and exploiting that formula was certainly one strategy that
was (and continues to be) employed by film producers, in order to exercise some control over
the unpredictability of audience tastes. A notable example was Warner Bros.’ development
of the high-budget musical in the early to mid-1930s. So successful were these films –
generating an aggregate rate of return of over 100 percent in the 1932/33 season and nearly
50 percent in the following season – that Warners was committing almost 25 percent of its
total production budgets to the production of musicals by the mid-1930s. The average
production budget of these films was $0.7m, with the most expensive film costing $1.4m.
However, audience enthusiasm soon waned. Thus while musicals accounted for 30 percent
of Warners annual profits in 1932/33 and 40 percent in the following season, this contribution
more than halved in 1934/35, was further reduced to 12 percent in 1935/36, and thereafter
musicals, in aggregate, made losses. Nonetheless, over the decade, the $23.9m in production
budgets that was invested in musicals generated aggregate profits of $7.6m, accounting for 14
percent of Warners’ total profits over the period.
The outstanding example of a successful ‘formula’ during this period was MGM’s production
of the Andy Hardy films. Ten of these films were produced from 1937/38 to 1941/42, at an
average cost of just $0.4m, with the most expensive costing $0.5m. In aggregate the films

9
generated profits of $14.1m, from a total production budget of just $3.7m, resulting in an
aggregate rate of return of 122 percent (taking account of distribution costs).
At the other extreme were the 6 Marx Brothers films produced between 1935/36 and
1940/41, 5 of which were produced by MGM and the other by RKO. These were all high
budget films, produced at an average cost of £1.5m, but generating aggregate losses of
$1.7m. Only 2 of the films generated very modest profits. Thus while these films all
received critical acclaim, their appeal was relatively limited, and certainly so in relation to
their costs of production.
Figure 5 shows the aggregate performance of all 3 studios during the 1930s and early 1940s.
The picture is one of increasing investment in movie production throughout the 1930s, with a
cutback in the early 1940s. This increasing investment derived from increases in the average
costs of movie production, rather than an increase in the number of films released – the
average real cost of a movie more than doubled between 1929/30 and 1939/40, followed by
both a reduction in the number of movies produced and the average cost of production in the
early 1940s. However, rates of return on movie production were somewhat more volatile –
the mid-1930s generated very high rates of return, following the understandably low rates of
the early 1930s. However there was a decline in returns in the second half of the decade,
presumably resulting in the budget cuts in the early 1940s, which was then associated with a
recovery in returns. What Figure 5 does emphasise is the sensitivity of rates of return to
average production budgets – cinema admissions peaked in the mid-1930s, and stabilised
thereafter (see Figure 1), with average production costs continuing to rise but without the
requisite increase in audiences to cover these increasing costs.

10
Hollywood in the Post-War Period
The post-war period was characterised by a rapid decline in movie going – real expenditure
on movie going fell by almost 60 percent between 1946 and 1960 (see Figure 1). There were
a number of reasons for this decline.6 Increasing real incomes opened up a range of
alternative recreation activities. The rapid increase in urbanisation and home ownership
resulted in marked life-style changes, and together with the explosion in the birth rate, what
was up to that point the core cinema going public was now engaged in a range alternative
pursuits and responsibilities. The rapid diffusion of television – from less than 9 percent of
American households possessing a television in 1950 to 64 percent just 5 years later,7 also
had a marked impact on movie going. Indeed, it has been argued that the diffusion of
television accounted for more than 70 per cent of the drop in motion picture revenues in 1950
and 1951, falling to 60 per cent in 1952, 58 per cent in 1953 and 55.8 per cent in 1954.8
The response of movie producers to these changes was to cut back on movie production and
to focus much more intensively on the production of a relatively small number of hits, films
that could be considered likely to generate wide audience appeal and hence large revenues.
Comprehensive data on movie performance in the immediate post war period are much less
readily available compared to the pre war period and the 1980s and 1990s, but the trade
magazine Variety published, in January of each year, estimates of the distributor rental
incomes earned by each of the top ranking films in the preceding year (rental incomes are
generally assumed to be about half of total box-office revenue). Figure 6 shows the estimated
real rental incomes of the top 10 of these films, annually, from 1946 to 1965, together with
real consumers’ expenditure on movies. Thus within the context of an overall decline in
consumers’ expenditure the rental incomes of the top 10 films, while declining in the 1940s,
recovered and grew in the 1950s and 1960s, albeit in a somewha t volatile manner. This is in

11
contrast to the more ordered environment of the 1930s, where increasing consumers’
expenditure was matched by increases in total domestic revenues and the revenues of the top
10 films distributed by MGM, RKO and Warner Bros.
Hollywood in the 1990s
The 1990s once again saw Hollywood as a confident and dominant force in movie
production. The recovery of the industry from its post-war decline had been a slow one, but
starting with the development of multi-screen cinemas in the 1960s in the newly
suburbanised areas through to a variety of technical innovations (cable, satellite, video,
computers on the exhibition side, and on the manufacturing side, the development of
technologies that allowed for the production of movies of ever-increasing sophistication)
Hollywood has once again developed a hold on the public imagination that is out of all
proportion to its relatively modest size as an industry.
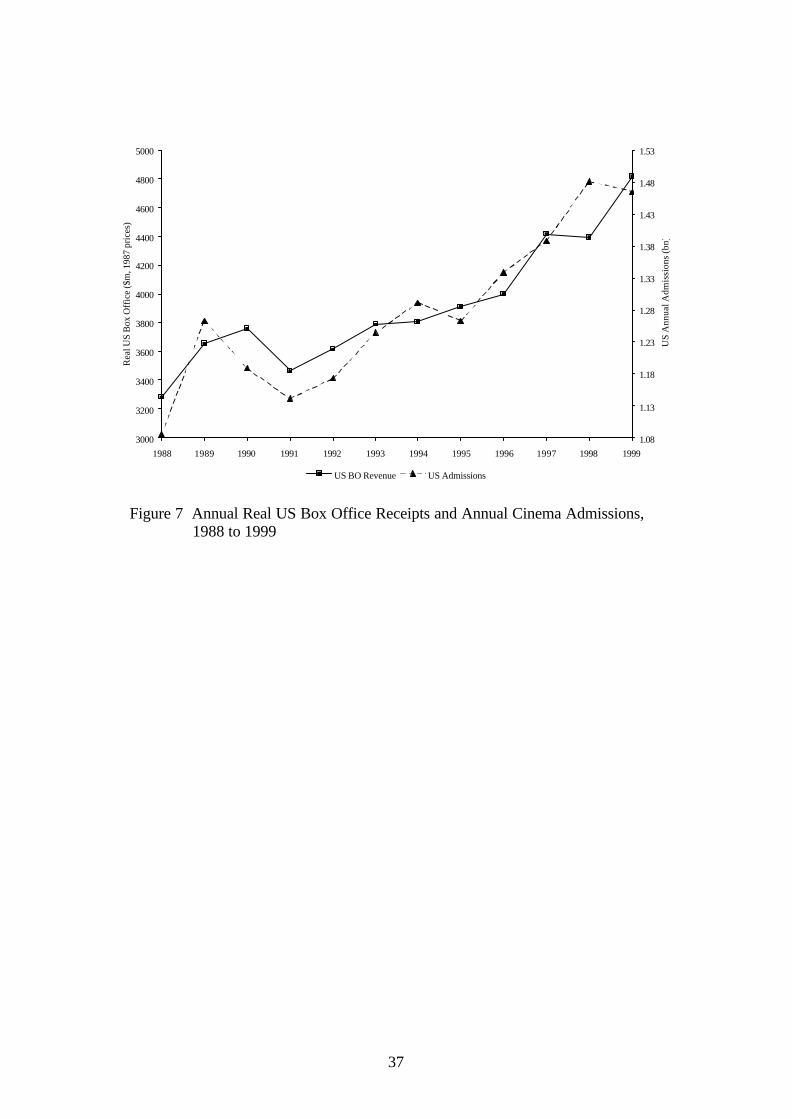
Figure 7 shows the basic demand characteristics of the late 1980s and 1990s, where it can be
seen that in terms of both cinema admissions and box office revenues the industry in the US
has shown impressive growth (a 35 percent increase in admissions and a 47 percent increase
in box office). However box office revenues now account for a relatively minor component
of all film revenues – Vogel estimates that US box office revenues accounted for only 15
percent of all film revenues in 2000, down from 30 percent in 1980, with home video now
accounting for 38 percent of revenues, up from just 7 percent in 1980.9 Thus Figure 7
significantly understates the growth of the industry. However, while box office revenues
now account for a relatively small proportion of aggregate film earnings, initial box office
performance is a crucial determinant of earnings in ancillary markets and thus highly
correlated with these.
12
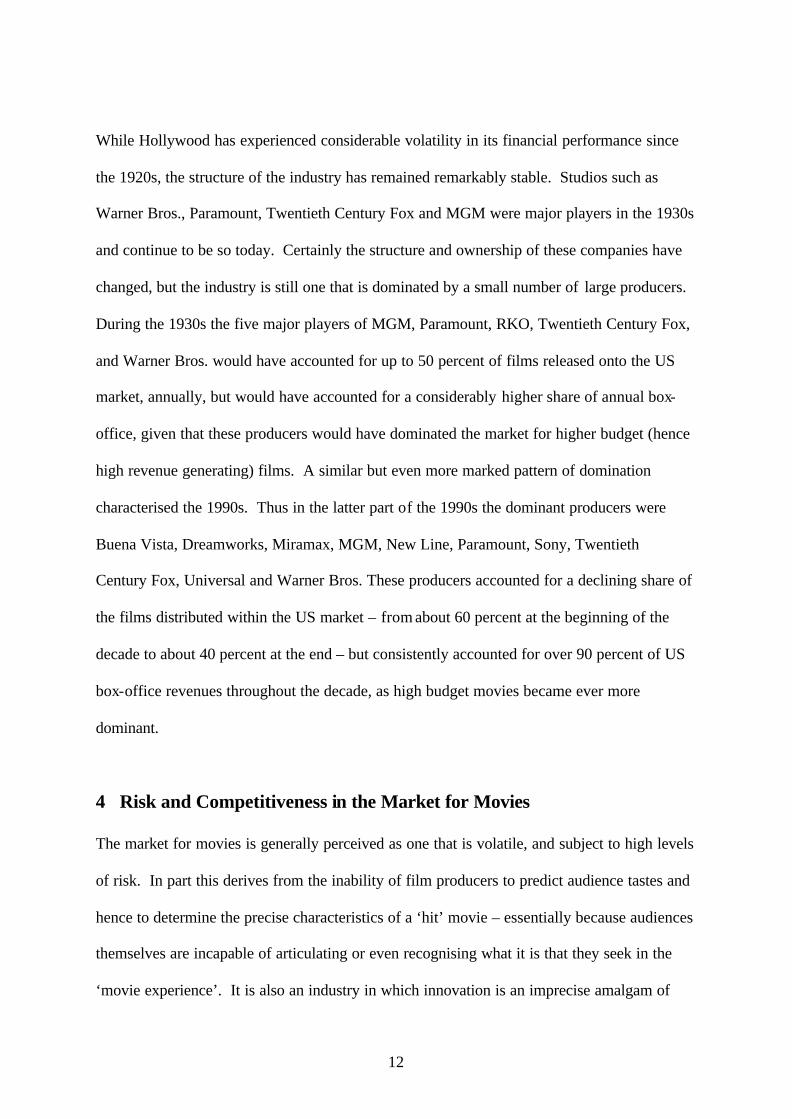
While Hollywood has experienced considerable volatility in its financial performance since
the 1920s, the structure of the industry has remained remarkably stable. Studios such as
Warner Bros., Paramount, Twentieth Century Fox and MGM were major players in the 1930s
and continue to be so today. Certainly the structure and ownership of these companies have
changed, but the industry is still one that is dominated by a small number of large producers.
During the 1930s the five major players of MGM, Paramount, RKO, Twentieth Century Fox,
and Warner Bros. would have accounted for up to 50 percent of films released onto the US
market, annually, but would have accounted for a considerably higher share of annual box-
office, given that these producers would have dominated the market for higher budget (hence
high revenue generating) films. A similar but even more marked pattern of domination
characterised the 1990s. Thus in the latter part of the 1990s the dominant producers were
Buena Vista, Dreamworks, Miramax, MGM, New Line, Paramount, Sony, Twentieth
Century Fox, Universal and Warner Bros. These producers accounted for a declining share of
the films distributed within the US market – from about 60 percent at the beginning of the
decade to about 40 percent at the end – but consistently accounted for over 90 percent of US
box-office revenues throughout the decade, as high budget movies became ever more
dominant.
4 Risk and Competitiveness in the Market for Movies
The market for movies is generally perceived as one that is volatile, and subject to high levels
of risk. In part this derives from the inability of film producers to predict audience tastes and
hence to determine the precise characteristics of a ‘hit’ movie – essentially because audiences
themselves are incapable of articulating or even recognising what it is that they seek in the
‘movie experience’. It is also an industry in which innovation is an imprecise amalgam of

13
creativity and technology. However movie production is an industry that offers the
possibility of spectacular profits from just a single unit of, often modestly costed, output, and
hence attracts a wide range of producers, from small independents to large conglomerates. It
is an industry that is attractive to the ‘risk lover’, and an industry that is therefore challenging
for economic analysis.
One manifestation of the risk and competitiveness of filmmaking is the extent to which the
market shares of studios/distributors are subject to wide fluctuations from year to year. A
simple, albeit somewhat extreme, illustration is that of Paramount and the film Titanic,
released in 1997.10 In 1997 Paramount achieved a market share of 18.3 percent (of total US
box-office receipts). If Titanic had not been produced, Paramount’s market share would have
been just 9.9 percent. Figure 8 shows the annual market shares of three studios/distributors,
MGM, Warner Bros. and Paramount, for the 3 data periods 1930 to 1942, 1946 to 1965 and
1988 to 1999.11 The marked annual variability of these market shares, and rapid changes in
market position are clear, characteristics reflected in the market shares of all
studios/distributors. Thus while it is often argued that the oligopolistic market structure of
Hollywood presents an almost insurmountable barrier to entry, the environment is
nonetheless a highly competitive one.
Figures 9 and 10 illustrate a further dimension of the risk environment of filmmaking. Both
graphs present simple scatters of film revenues against production costs, in constant prices,
for the two data periods for which extensive cost data are available – 1930 to 1942 and 1988
to 1999. In the case of the earlier data period the revenue data are the US rental incomes
received by the studios, MGM, RKO and Warner Bros. This data set covers 1,796 films. In
the case of the 1988 to 1999 data period the revenue data are total US box-office revenues,
14
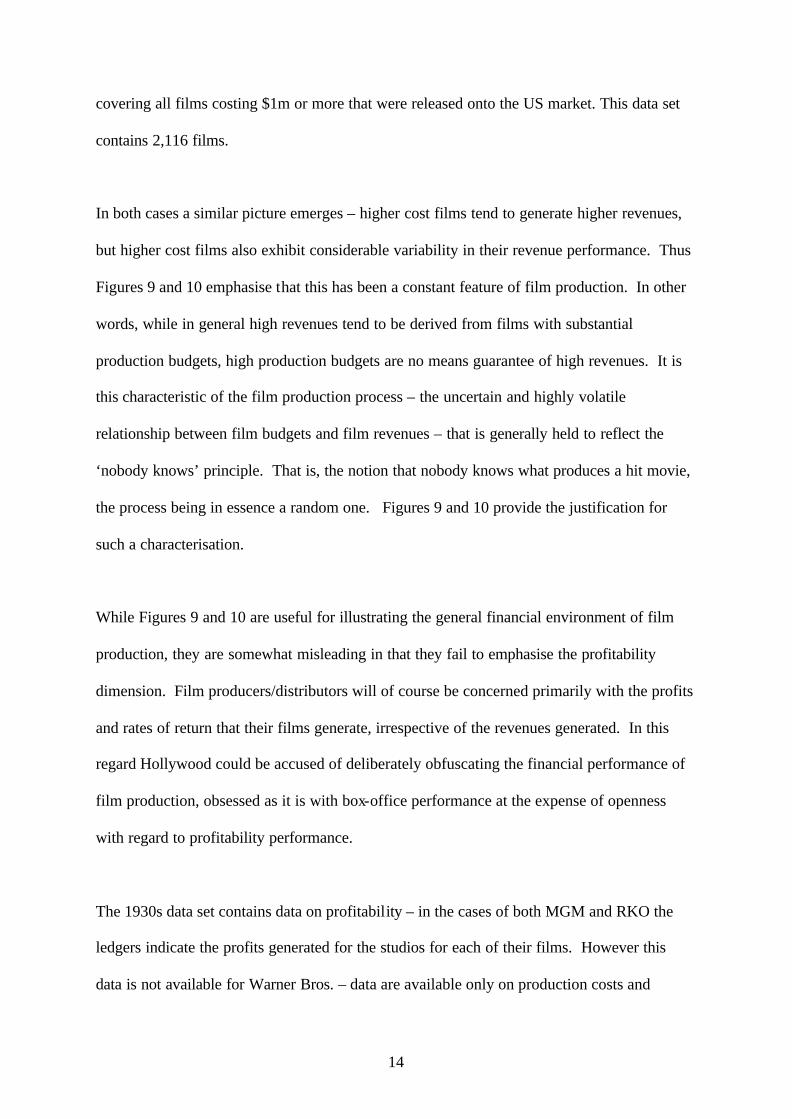
covering all films costing $1m or more that were released onto the US market. This data set
contains 2,116 films.
In both cases a similar picture emerges – higher cost films tend to generate higher revenues,
but higher cost films also exhibit considerable variability in their revenue performance. Thus
Figures 9 and 10 emphasise that this has been a constant feature of film production. In other
words, while in general high revenues tend to be derived from films with substantial
production budgets, high production budgets are no means guarantee of high revenues. It is
this characteristic of the film production process – the uncertain and highly volatile
relationship between film budgets and film revenues – that is generally held to reflect the
‘nobody knows’ principle. That is, the notion that nobody knows what produces a hit movie,
the process being in essence a random one. Figures 9 and 10 provide the justification for
such a characterisation.
While Figures 9 and 10 are useful for illustrating the general financial environment of film
production, they are somewhat misleading in that they fail to emphasise the profitability
dimension. Film producers/distributors will of course be concerned primarily with the profits
and rates of return that their films generate, irrespective of the revenues generated. In this
regard Hollywood could be accused of deliberately obfuscating the financial performance of
film production, obsessed as it is with box-office performance at the expense of openness
with regard to profitability performance.
The 1930s data set contains data on profitability – in the cases of both MGM and RKO the
ledgers indicate the profits generated for the studios for each of their films. However this
data is not available for Warner Bros. – data are available only on production costs and

15
distributor rentals generated by each film. However it is possible to estimate the profits
generated by each of the Warners’ films by first estimating the distribution costs of the films.
Now, the distribution costs of a film are presumably directly related to the revenues generated
by the film – the broader is the reach of the film the higher are the distribution costs. It is
presumably also the case that initial promotional expenditures will be determined as some
(relatively small) proportion of production costs. Thus the distribution costs, D, of a film can
be interpreted as being directly related to production costs, C, and the revenues, R, generated
by the film, or:
RCD βα += (1)
The rate of return generated by a film can be expressed as:
DC
DCRRoR
++−
=)(
(2)
Substituting Equation (1) into Equation (2), and re-expressing produces:
( ) βα ++=+ −
RC
RoR )1(1 1 (3)
Thus regressing ( ) 11 −+RoR on RC will generate estimates of )1( α+ and β , thereby
allowing for the estimation of the distribution costs and rates of return of Warners’ films via
Equations (1) and (2).
Using the 1,130 MGM and RKO films to estimate Equation (3), produced a 2R value of
0.968 and estimates of 0.05 and 0.35 forα and β , respectively. However, the objective here
is to derive rates of return just for the US market, so that a direct comparison can be made
between film profitability in the 1930s and the 1990s, given that the 1990s data set provides
information on US revenues only.

16
Now, for the 1930s data, information is available for each film on the revenues generated in
both the US and foreign markets. Thus for each film we can calculate the proportion of total
revenue that was generated in the US market. Denote this proportion by USπ . Thus
assuming that a proportion USπ of initial promotional expenditures were made in the US then
theα value for generating US distribution costs could be interpreted as 0.05* USπ , and
therefore distribution costs in the US market could be estimated via:
USUSUS RCD 35.0)*05.0( +=∧
π (4)
where USR are the distributor rentals generated in the US market. Similarly, for rate of return
purposes, USπ of production costs could also be interpreted as being apportioned to the US
market, and therefore the rate of return generated in the US market could be estimated by:
∧
∧
+
+−=
USUS
USUSUSUS
DC
DCRRoR
*
)*(
π
π (5)
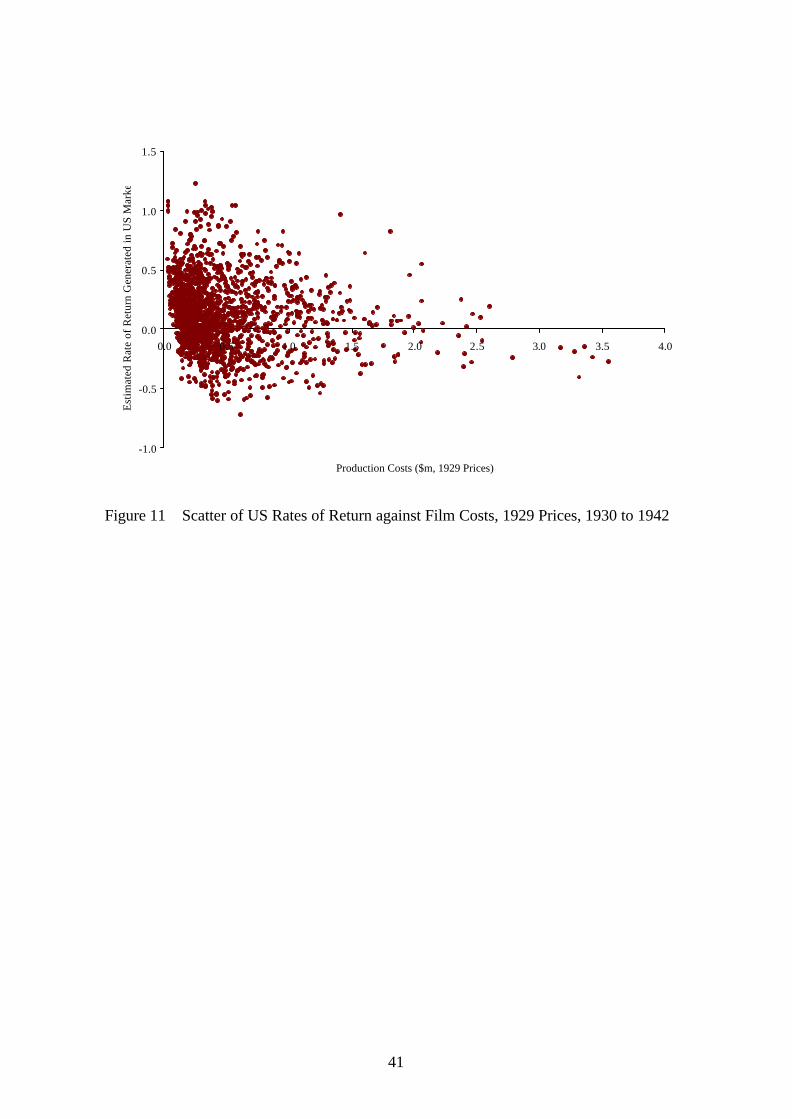
A scattergraph of film rates of return estimated by Equation (5) against production costs is
shown in Figure 11. One of the marked features of this graph is the tendency for rates of
return to decline as production budgets increase. Indeed of the 25 films that cost in excess of
$2 million, just 10 generated profits in the US market. A further characteristic of Figure 11 is
the tendency for the variability in the rates of return to decline as budgets increase. Thus
Figure 11 emphasises the nature of risk associated with film production in the 1930s. Clearly
there was considerable variability in film rate of return performance. But high budget
production also generated additional risks, not so much in terms of the variability of the rates
of return of high budget films (this variability tended to be relatively low), but in terms of the
higher probability of high budget films generating substantial losses. Thus if we consider all
films produced over the period, 66 percent of these generated profits in the US market.
However, if we consider films costing less than $0.5 million (1,242 films), then 70 percent of

17
these made profits, whereas just 58 percent of the 554 films costing $0.5 million or more
generated profits. This can be seen more directly in Figure 12, which shows a scatter of film
profits generated in the US market against costs. Thus what Figure 12 emphasises is the
substantial losses that high budget production can generate, and the rapidly increasing
variability in profit performance as budgets increased.
In deriving comparable analyses for the 1990s a number of approximations have to be made.
First, the Nielsen revenue data are total US and Canadian box office revenues, rather than
distributor rental incomes. However, Vogel (2001)12 provides annual estimates of the
percentage of total box office that reverts to distributors as rental income. Thus applying
these percentages to box office revenues of each of the films in the data set produces
estimates of the rental incomes generated by these films. Second, we require estimates of
film distribution costs. The approach taken here is to assume that, as in the 1930s,
distribution costs are related to the production budget (initially) and thereafter evolve
proportionately to revenues. However, data are not available for each film on revenues
earned in the North American and foreign markets – only North American revenues are
available. In aggregate, foreign revenues accounted for about 50 percent of total revenues
during the 1990s (Vogel:2001, Table 2.4) and thus estimated distribution costs could be
generated using this fixed percentage via:
USUS RCD 35.0025.0 +=∧
(6)
where USR is calculated as 50 percent of a film’s estimated distributor rental.
Finally, in deriving film rates of return, the major difference between the 1930s and the 1990s
is the role played by ancillary markets in the latter period (home video, television). Vogel
(2001: Table 2.8) estimates that US theatrical revenues accounted for about 30 percent of

18
total revenues in 1980, but had declined to about 15 percent by 2000, with home video
revenues increasing from 7 to 38 percent. Assuming that US theatrical revenues accounted
for an average of 20 percent of total revenues during the 1990s, then US film rates of return
could be estimated via:
∧
∧
+
+−=
US
USUSUS
DC
DCRRoR
*2.0
)*2.0( (7)
The application of Equation (7) implies that 45 percent of the 2,116 films that cost $1 million
or more and for which cost and revenue data are available, broke even or better. This
percentage is somewhat higher than the 30 to 40 percent that ‘industry wisdom’ would
suggest (Vogel: 2001, p.35), but the measure does take explicit account of the revenues
generated in ancillary markets, via just 20 percent of production budgets being apportioned to
US theatrical release. However, it has been argued that a feature of the contemporary film
industry is the increasing importance of marketing and distribution costs (Vogel: 2001, p. 96),
which would imply that Equation (6) might underestimate these costs. Amending Equation
(6) to:
USUS RCD 40.0025.02 +=∧
(8)
and then substituting this second estimate of distribution costs into Equation (7), results in 42
percent of films breaking even or better. Further Vogel (2001)13 has suggested that
distribution costs were equivalent to about 45 percent of negative costs throughout the 1990s.
The application of Equation (8) implies that, on average, these estimated distribution costs
were equivalent to 46 percent of negative costs, for successful films (those films which break
even or better). Consequently the rate of return measure used here for the 1990s will be that
derived from Equation (8) combined with Equation (7), given the consistency between the
implications of this measure and ‘industry wisdom’. However, the extent to which this
measure incorporates a number of approximations must be recognised, and that the measure

19
can at best only provide a broad approximation to the profitability of the industry during the
1990s. Nonetheless, within an industry in which profitability data is very hard to come by,
such an approximation at least provides a starting point for an evaluation of economic
performance.
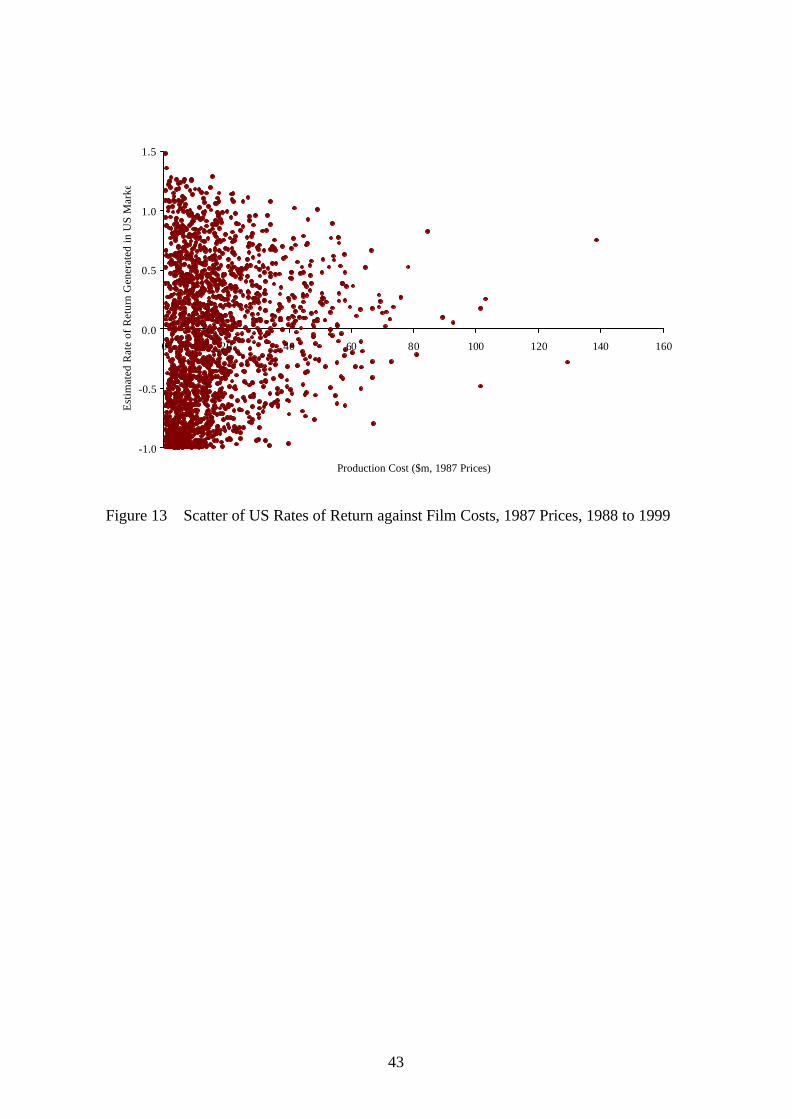
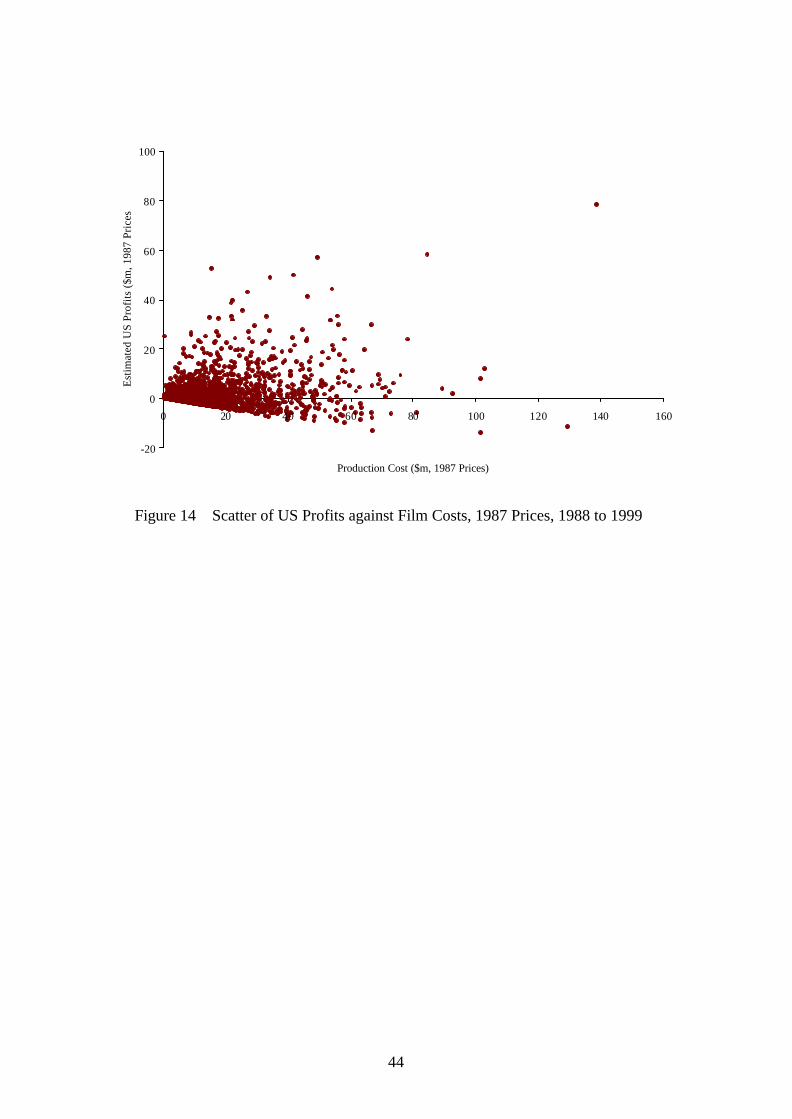
Figures 13 and 14 present scatters of US rates of return and US profits, respectively, for the
1990s, generated by the 2,116 films in the data set. Broadly, these graphs reproduce the
features of the 1930s – declining variability of rates of return as production costs increase
(Figure 13) and increasing variability of profits as costs increase (Figure 14). However, a
notable difference is the proportion of profit-generating films. In the 1930s 66 percent of
films were profitable, but during the 1990s just 42 percent were profitable (if we consider just
the major producers, then 49 percent of the 1,458 films produced by the majors were
profitable over the period). But a further difference is the much higher incidence of loss
making lower budget films in the 1990s as compared to the 1930s. Thus considering the
films costing less than $20 million in the 1990s (1,582 films), just 38 percent of these
generated profits (47 percent in the case of the majors), in contrast to the 70 percent of lower
budget films in the 1930s. In terms of high budget production, the proportions were broadly
comparable between the two periods – 56 percent of films costing $20 million or more (534
films) generated profits in the 1990s (the vast majority of which were produced by the
majors), and 58 percent of high budget films (the 554 films costing $0.5 million or more)
generated profits in the 1930s.
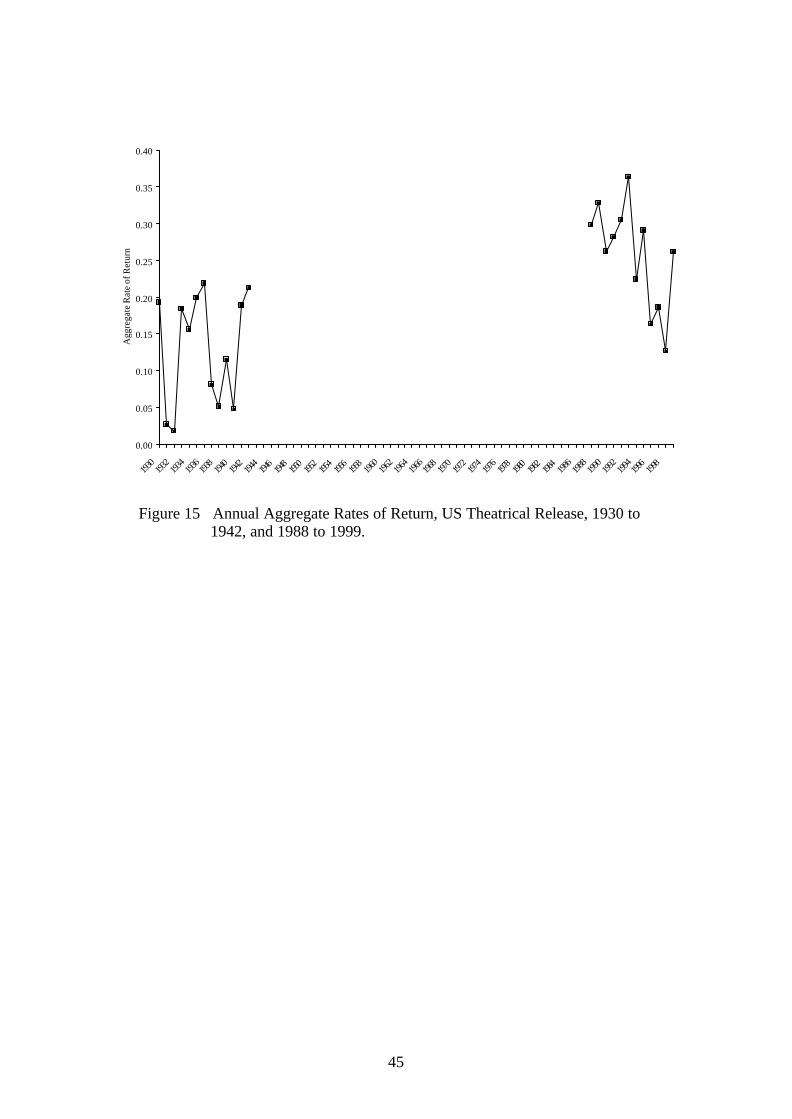
It also is instructive to compare aggregate annual rate of return performance between the
1930s and the 1990s. Figure 15 shows these annual rates of return (on US theatrical release)
– for the 1990s these aggregate rates of return refer to the major distributors only, so as to be

20
directly comparable to the 1930s data which are derived from 3 of the 5 major studios. The
marked characteristic of these rates of return is their volatility, further emphasising the risk
characteristics of the industry. Additionally, and in a broad sense, there has been a secular
increase in returns, although returns declined during the 1990s, to the point at which the
returns at the end of the decade were broadly comparable to the successful years in the 1930s.
Overall, the aggregate rate of return of all films in the 1930s was 13 percent, compared to an
aggregate rate of return in the 1990s of 22 percent (25 percent in the case of the majors). So
in terms of broad rate of return performance the contemporary industry can be seen to have
outperformed the industry in the 1930s, the period that is generally considered to have been
the industry’s heyday.
However, as already suggested, there were pronounced differences in the performance of
different cost categories of films as between the two periods. Thus low budget production
was relatively less profitable in the 1990s as compared to the 1930s, whereas superficially,
the performance of high budget films was broadly comparable between the two periods.
Thus if we consider films costing in excess of $0.5 million in the 1930s and films costing
more than $20 million in the 1990s, then this accounts for 30 percent of films produced in the
1930s and 25 percent of the films produced in the 1990s. In the case of the 1930s these high
budget films generated an aggregate return of just 10 percent, compared to a return of 17
percent for the lower budget films. In the case of the 1990s the reverse occurred –higher
budget films generated a return of 24 percent, exceeding the 20 percent rate generated by the
lower budget films. If we consider very high budget films, these differences are starker still.
Thus films costing in excess of $1.4 million in the 1930s and $50 million in the 1990s
accounted for about 4 percent of all films produced in both periods. In the case of the 1930s
these films generated a return of just 5 percent, whereas the very high budget films in the

21
1990s generated a return of 23 percent, comparable to the rate of return on all films. In terms
of total profits generated, the high budget films of the 1930s generated only 5 percent of total
profits, whereas in the 1990s these films generated 16 percent of profits. In both cases these
high budget films absorbed about 16 percent of total production budgets. Although there was
considerable variability in the performance of these high budget films from year to year, there
were a number of years during the 1990s where these films generated in excess of 50 percent
of total annual profits (in 1996 when these films absorbed just 18 percent of total production
budgets, and in 1997 when they absorbed 39 percent of total budgets). There were of course
other years in which these films were relatively unsuccessful – they generated losses in
aggregate in 1993 and 1995, but in all other years, apart from 1998, the percentage
contribution to aggregate profits of these very high budget films exceeded the proportion of
production budgets that they absorbed.
By contrast, high budget production in the 1930s was largely unsuccessful. Very high budget
films generated losses in 4 of the 10 years in which high budget production took place, and in
only 2 of the remaining years did the percentage contribution to aggregate annual profits of
high budget films exceed the proportion of production budgets that they absorbed (1936 and
1942). That is, financial success in the 1930s derived from medium to lower budget
production, whereas in the 1990s it was higher budget production that made the major
contribution to financial success.
As was suggested above, the focus on hit films as a primary source of industry profits began
in the immediate post-war period in response to the range of demographic changes that took
place during that time. Thus the conclusions drawn above about the nature of film production
in the 1990s are best interpreted as the continuation of a process that was set in motion in the

22
1950s. The studio system of the 1930s was ideally suited to generating a mixed portfolio of
films, but where financial success derived from tightly budgeted films with wide audience
appeal and modest artistic aspirations. High budget films in the 1930s are perhaps best
interpreted as having been experimental in nature, a focus for developing the art form, even
to the point of having elements of what today might be interpreted as vanity projects.
However, these high budget films were ultimately heavily subsidised by lower budget
production. The relative lack of success of high budget production in the 1930s might also be
explained in terms of there having been insufficient understanding of the dynamics of
revenue generation – that is, the manner and rate at which box-office revenues are generated,
and how revenues might be maximised, during the relatively short theatrical release life of a
film.
In the post-war period, however, high profile/high budget production began to be seen as a
necessity rather than a luxury, upon which the continued success of the industry depended.
An increasingly discriminating consumer, with a rapidly growing range of choices for
recreational expenditure, needed to be attracted back to movie-going, and this could only be
achieved by the product differentiating itself from the standardised form of entertainment
now being offered by television, a form of entertainment so effectively provided by the film
industry in the pre-war period.
The manifestation of such a development would be reflected in the characteristics of the size
distribution of the top revenue generating films in each year. That is, an increasing emphasis
on hit production would be reflected in an increasingly unequal revenue distribution amongst
the top ranking films. One method of measuring this inequa lity is via a Gini coefficient,
applied to the revenues generated by the top n films of each year. We will here consider the

23
top 60 films in each year of the 3 data periods.14 Thus the coefficient will approach 1 if the
revenue distribution is dominated by a single film, with minimal contributions from the
remaining 59 films, and it will be 0 if all 60 films generate identical revenues.
Figure 16 presents these annual Gini coefficients for the film revenues for the top 60 films for
each year of the 3 data periods. Gini coefficients are also presented for the cost distributions
– that is, for the top 60 highest budget films each year, for 1930 to 1942 and 1988 to 1999.
These Gini coefficients broadly reflect what was expected. Thus in terms of revenue
distributions, the values of these coefficients were relatively low during the 1930s, although
they increased during the decade, as an increasing number of ‘hits’ began to emerge.
However, it was in the immediate post-war period that the increasing trend in the revenue
coefficients was most marked. Thus the coefficients in the late 1940s and early 1950s were
relatively low and comparable to those in the early 1930s – in both cases reflecting low
demand and hence ‘flat’ revenue distributions. But from the 1950s onwards there is strong
secular growth as film producers became increasingly successful in producing a small
number of high revenue generating films, which provided the focus for the recovery of the
industry. In terms of the 1990s, the coefficients can be interpreted within the context of a
consolidation of the process that was completed by the mid-1960s – the coefficients during
the 1990s are relatively stable, and comparable to the levels achieved during the 1960s.
The coefficients relating to the cost distributions offer further insights into this process. Thus
during the 1930s the inequality of the revenue distributions closely followed the inequality of
the cost distributions – the mechanism that generated increasingly concentrated revenue
distributions was increasingly concentrated cost distributions (although this did not in general
result in increased profits). By contrast, the concentration of the cost distributions was

24
remarkable stable during the 1990s – in only 2 of the 12 years was there a marked divergence
from this stability, 1995 and 1997, which in turn resulted in the main from just 2 over-budget
films, Waterworld in 1995 and Titanic in 1997. But the main differences between the 1930s
and the 1990s is that in the 1990s the concentration of the cost distributions were markedly
lower than the corresponding revenue distributions, and that the cost coefficients were
considerably less volatile than the revenue coefficients. The implication is that production
budgets in the 1990s, although much higher in real terms than in the 1930s, were much more
tightly controlled, and that the revenue distributions that they generated consistently produced
hit films, in a profit generating sense.
5 Conclusion
This paper has provided an overview of the evolution of the market for film in the US over
the past 70 years. One notable aspect of this evolution is how stable the structure and broad
characteristics of the market have remained, notwithstanding considerable volatility in
demand conditions. The industry has demonstrated itself to be remarkably robust in the face
of this volatility.
The 1930s and 1940s represented the high point for the industry in terms of cinema
attendances, cinema going being the dominant recreation activity at the time. However, the
post-war period saw a steep decline in cinema attendances, via a combination of the rapid
diffusion of television, the demographic changes reflected in the intensive urbanisation that
occurred and the range of competing recreation activities that emerged in response to the
post-war spending boom. The industry responded by attempting to differentiate its output
from that produced by television, and in particular, placed a much greater emphasis on
producing hit movies, films with high production values and wide audience appeal.

25
Distribution networks evolved that placed an emphasis on distributing these films as widely
and rapidly as possible, beginning with the development of suburban multiplex cinemas.
This approach to distribution contrasted with the price discrimination mechanisms employed
in the 1930s, in which films were first exhibited at relatively highly priced first run cinemas
before being shown at lower priced second and third run cinemas. This hierarchical approach
to distribution may well have worked against maximising the revenues of high cost films, and
may go some way to explaining the relative lack of financial success of high budget
production in the 1930s.
These structural changes that were fully evolved by about the mid-1960s and early 1970s,
remain broadly unchanged today. Relatively large budget hit production remains the focus
for profit generation, via increasingly sophisticated distribution networks. However, box-
office revenue is now a relatively minor source of profitability, with home video being of
greater importance, and the internet beginning to be exploited as a means of distribution. But
success at the point of initial cinema release still remains crucial for success in all ancillary
markets.
Film studios today are also now parts of larger vertically integrated entertainment- leisure-
media conglomerates. This provides a further mechanism for controlling the risks involved
in movie production, with the outputs of the studios being inputs into the other divisions of
these conglomerates, allowing for the synergies between the various elements of film
production, distribution and exhibition to be fully exploited. In some respects this market
structure mirrors that of the industry in the 1930s, where the studios then were also vertically
integrated, with their own exhibition arms, and tight contractual control over stars via the
studio system. While the studio system collapsed in the post-war period and the studios were

26
forced to divest themselves of their exhibition subsidiaries, in many respects Hollywood has
now crept back to a comparable pre-war structure, with the one exception (and frustratingly
for the studios) of the free market that still exists for star inputs.
27
References
Aksoy, A., and Robins, K. (1992) ‘Hollywood for the 21st Century: Global Competition for
Critical Mass in Image Markets’ Cambridge Journal of Economics, 16 (1992) pp.1-22.
Bakker, G. (2002) ‘The Decline and Fall of the European Film Industry: Sunk Costs, Market
Size and Market Structure, 1890-1927.’ Working Paper.
Bordwell, D., Staiger, J. and Thompson, K. (1985) The Classical Hollywood Cinema: Film
Style and Mode of Production to 1960, London, 1985.
Caves, R. (2000) Creative Industries: Contacts between Art and Commerce, Cambridge,
Mass.
Conant, M. (1960) Antitrust in the motion picture industry, Berkeley.
De Vany, A., and Walls, W. (1996) ‘Bose-Einstein Dynamics and Adaptive Contracting in
the Motion Picture Industry,’ Economic Journal 106, pp.1493-1514.
De Vany, A., and Walls, W. (1997) ‘The Market for Motion Pictures: Rank, Revenue, and
Survival’, Economic Inquiry, 35, pp.783-797.
De Vany, A., and Walls, W.D. (1999) ‘Uncertainty and the Movie Industry: Does Star Power
Reduce the Terror of the Box Office?’ Journal of Cultural Economics 23, pp. 285-318.

28
De Vany, A. and Walls, W.D. (2002) ‘ Does Hollywood Make Too Many R-rated Movies?
Risk, Stochastic Dominance, and the Illusion of Expectation.’ Journal of Business, 75, pp.
425-451.
Glancy, H.M. (1992) ‘MGM film grosses, 1924-1948: the Eddie Mannix ledger,’ Historical
Journal of Film, Radio and Television, 12, pp.127-144.
Glancy, H.M. (1995) ‘Warner Bros. film grosses, 1921-1951: the William Schaefer ledger’,
Historical Journal of Film, Radio and Television, 15, pp.55-74.
Gomery, D. (1996) ‘Towards a New Media Economics’ in Bordwell, D.and Caroll, N. Post-
Theory: Reconstructing Film Studies, Madison.
Gomery, D. (1998) ‘Hollywood Corporate Business Practice and Periodizing Contemporary
Film History’, in Neale, S. and Smith, M., Contemporary Hollywood Cinema, London.
Hoskins, C., McFadyen, S., and Finn, (1997) A. Global Television and Film, Oxford.
Jewell, R. (1994) ‘RKO film grosses, 1929-1951: the C.J. Trevlin ledger’, Historical Journal
of Film, Radio and Television, 14, pp.37-51.
Litman, B. (2001) ‘Motion Picture Entertainment’ in Adams, W. and Brock, J. (10th edition)
The Structure of American Industry, Upper Saddle River, N.J.

29
Maltby, R., (1998) ‘Nobody Knows Everything’, in Neale, S., and Smith, M., Contemporary
Hollywood Cinema, London.
Miller, D. and Shamsie, J. (1996) ‘The Resource-Based View of the Firm in Two
Environments: The Hollywood Film Studios From 1936 to 1965’, Academy of Management
Journal, 39, pp.519 –543.
Pokorny, M. and Sedgwick, J. (2001) ‘Stardom and the Profitability of Filmmaking: Warner
Bros. in the 1930s’, Journal of Cultural Economics, 25, pp.157-184.
Ravid, S. A. (1999), “Information, Blockbusters and Stars: A Study of the Film Industry.”
Journal of Business, 72, pp. 463-492.
Sedgwick, J. (2000), Filmgoing in 1930s Britain: a Choice of Pleasures, Exeter.
Sedgwick, J. (2002) ‘Product Differentiation at the Movies: Hollywood, 1946-65’, Journal of
Economic History’, 62, pp. 676-704.
Sedgwick, J., and Pokorny, M., (1998) ‘The Risk Environment of Film-Making: Warners in
the Inter-War Period’, Explorations in Economic History, 35, pp.196-220.
Storper, M. (1993) ‘Flexible Specialisation in Hollywood: a response to Aksoy and Robins’,
Cambridge Journal of Economics, 17, pp. 479-84.

30
Storper, M. (1994) ‘The transition to flexible specialisation in the US film industry: external
economies, the division of labour, and the crossing of industrial divides’, in Amin A. (ed.),
Post-Fordism: a Reader, Oxford.
US Department of Commerce, Bureau of the Census (1975) Historical Statistics of the US:
Colonial Times to 1970, Washington DC.
Vogel, H. (2001) Entertainment Industry Economics, 5th Edition, Cambridge, UK.
Weinstein, M. (1998) ‘Profit-Sharing Contracts in Hollywood: Evolution and Analysis’,
Journal of Legal Studies 27, pp. 67-112.

31
Figure 1 Real Consumers’ Expenditure, Movies ($m, 1958 Prices), 1929 to 1999
0.70
0.90
1.10
1.30
1.50
1.70
1.90
2.10
2.30
2.50
1929
1931
1933
1935
1937
1939
1941
1943
1945
1947
1949
1951
1953
1955
1957
1959
1961
1963
1965
1967
1969
1971
1973
1975
1977
1979
1981
1983
1985
1987
1989
1991
1993
1995
1997
1999
Rea
l Con
s E
xp M
ovie
s ($
bn, 1
958
pric
es)

32
0
100
200
300
400
500
600
700
800
900
1929
1931
1933
1935
1937
1939
1941
1943
1945
1947
1949
1951
1953
1955
1957
1959
1961
1963
1965
1967
1969
1971
1973
1975
1977
1979
1981
1983
1985
1987
1989
1991
1993
1995
1997
1999
Num
ber o
f Film
s Rel
ease
d
Total Releases Total US Produced
Figure 2 Films Released onto the US Market, 1929 to 1999

33
0
5
10
15
20
25
30
1929
1931
1933
1935
1937
1939
1941
1943
1945
1947
1949
1951
1953
1955
1957
1959
1961
1963
1965
1967
1969
1971
1973
1975
1977
1979
1981
1983
1985
1987
1989
1991
1993
1995
1997
1999
Perc
ent o
f Tot
al R
ecre
atio
n E
xpen
ditu
re
Figure 3 Expenditure on Movies as a Percentage of Total Recreation Expenditure, 1929 to 1999

34
Figure 4 Real Average Film Production Costs, $million, 1983 Prices
0
5
10
15
20
25
30
35
40
1929
1931
1933
1935
1937
1939
1941
1943
1945
1947
1949
1951
1953
1955
1957
1959
1961
1963
1965
1967
1969
1971
1973
1975
1977
1979
1981
1983
1985
1987
1989
1991
1993
1995
1997
1999
Ave
ral R
eal C
ost (
$mill
ion)
Av Real Cost WB, MGM, RKO Av Real Cost Vogel Av Real Cost Nielsen

35
45
50
55
60
65
70
75
80
85
90
95
1929/30 1930/31 1931/32 1932/33 1933/34 1934/35 1935/36 1936/37 1937/38 1938/39 1939/40 1940/41 1941/42
Agg
rega
te P
rodu
ctio
n B
udge
ts ($
m)
0
5
10
15
20
25
30
Rat
e of
Ret
urn
(%)
Production Budget Rate of Return
Figure 5 Annual Aggregate Production Budgets (1929 prices) and Annual Rate of Return

36
Figure 6 Rental Incomes of Top 10 Films and Consumers’ Expenditure on Movies, 1946 to 1965.
30
50
70
90
110
130
150
170
190
1946 1947 1948 1949 1950 1951 1952 1953 1954 1955 1956 1957 1958 1959 1960 1961 1962 1963 1964 1965
Ren
al In
com
e T
op 1
0 ($
m, 1
958
pric
es)
0.9
1.1
1.3
1.5
1.7
1.9
2.1
2.3
2.5
Con
sum
ers'
Exp
endi
ture
on
Mov
ies
($bn
, 195
8 Pr
ices
)
Rentals of Top 10 Cons Exp
37
Figure 7 Annual Real US Box Office Receipts and Annual Cinema Admissions, 1988 to 1999
3000
3200
3400
3600
3800
4000
4200
4400
4600
4800
5000
1988 1989 1990 1991 1992 1993 1994 1995 1996 1997 1998 1999
Rea
l US
Box
Off
ice
($m
, 198
7 pr
ices
)
1.08
1.13
1.18
1.23
1.28
1.33
1.38
1.43
1.48
1.53
US
Ann
ual A
dmis
sion
s (b
n)
US BO Revenue US Admissions

38
0
5
10
15
20
25
30
1930
1932
1934
1936
1938
1940
1942
1944
1946
1948
1950
1952
1954
1956
1958
1960
1962
1964
1966
1968
1970
1972
1974
1976
1978
1980
1982
1984
1986
1988
1990
1992
1994
1996
1998
Perc
enta
ge S
hare
s of R
enta
ls/B
ox O
ffic
e
MGM WB Paramount
Figure 8 Market Shares of MGM, Warner Bros., and Paramount, 1930 to 1999

39
Figure 9 Scatter of Distributor Rental against Film Costs, 1929 Prices, 1930 to 1942
0.0
1.0
2.0
3.0
4.0
5.0
6.0
7.0
0.0 0.5 1.0 1.5 2.0 2.5 3.0 3.5 4.0
Negative Cost ($m, 1929 Prices)
US
Dis
trib
utor
Ren
tals
($m
, 192
9 Pr
ices
)

40
Figure 10 Scatter of Box Office Revenues against Film Costs, 1987 Prices, 1988 to 1999
0
50
100
150
200
250
300
350
400
450
0 20 40 60 80 100 120 140
Negative Cost ($m, 1929 Prices)
US
Box
Off
ice
Rev
enue
($m
, 198
7 Pr
ices
)
41
Figure 11 Scatter of US Rates of Return against Film Costs, 1929 Prices, 1930 to 1942
-1.0
-0.5
0.0
0.5
1.0
1.5
0.0 0.5 1.0 1.5 2.0 2.5 3.0 3.5 4.0
Production Costs ($m, 1929 Prices)
Est
imat
ed R
ate
of R
etur
n G
ener
ated
in U
S M
arke
t

42
-1.0
-0.5
0.0
0.5
1.0
1.5
2.0
2.5
3.0
0.0 0.5 1.0 1.5 2.0 2.5 3.0 3.5 4.0
Production Costs ($m, 1929 Prices)
Est
imat
ed U
S Pr
ofits
($m
, 192
9 Pr
ices
)
Figure 12 Scatter of US Profits against Film Costs, 1929 Prices, 1930 to 1942
43
-1.0
-0.5
0.0
0.5
1.0
1.5
0 20 40 60 80 100 120 140 160
Production Cost ($m, 1987 Prices)
Est
imat
ed R
ate
of R
etur
n G
ener
ated
in U
S M
arke
t
Figure 13 Scatter of US Rates of Return against Film Costs, 1987 Prices, 1988 to 1999
44
-20
0
20
40
60
80
100
0 20 40 60 80 100 120 140 160
Production Cost ($m, 1987 Prices)
Est
imat
ed U
S Pr
ofits
($m
, 198
7 Pr
ices
)
Figure 14 Scatter of US Profits against Film Costs, 1987 Prices, 1988 to 1999
45
0.00
0.05
0.10
0.15
0.20
0.25
0.30
0.35
0.40
1930
1932
1934
1936
1938
1940
1942
1944
1946
1948
1950
1952
1954
1956
1958
1960
1962
1964
1966
1968
1970
1972
1974
1976
1978
1980
1982
1984
1986
1988
1990
1992
1994
1996
1998
Agg
rega
te R
ate
of R
etur
n
Figure 15 Annual Aggregate Rates of Return, US Theatrical Release, 1930 to 1942, and 1988 to 1999.

46
0.00
0.05
0.10
0.15
0.20
0.25
0.30
0.35
0.40
0.45
0.50
1930
1932
1934
1936
1938
1940
1942
1944
1946
1948
1950
1952
1954
1956
1958
1960
1962
1964
1966
1968
1970
1972
1974
1976
1978
1980
1982
1984
1986
1988
1990
1992
1994
1996
1998
Gin
i Coe
ffic
ient
Revenue Cost
Figure 16 Annual Gini Coefficients, Top 60 Revenue Generating Films and Top 60 Highest Budget Films, 1930 to 1942, 1946 to 1965, 1988 to 1999.

47
Endnotes
1 See Bakker (2002).
2 These data are derived from the complete Eddie Mannix (MGM), C.J. Trevlin (RKO) and William Schaefer
(Warner Bros.) ledgers. The ledgers are partially reported and analysed in Glancy (1992); Glancy (1995); and
Jewell (1994). We are g rateful to Mark Glancy and Richard Jewell for making the complete ledgers available.
3 Source: Vogel (2001).
4 Source: Vogel (2001) and A C Nielsen/EDI Inc. Data unavailable for 1986 and 1987.
5 Source: Vogel (2001).
6 See Sedgwick (2002) for a much more comprehensive discussion.
7 See Conant (1960, Table 1).
8 ibid: 14.
9 Vogel (2001), Table 2.8.
10 Paramount was not in fact entirely responsible for the financing of Titanic – it only took a part interest in
financing the film, after Fox sold a stake in the film to Paramount, feeling that it needed to divest itself of some
of the risk as the production budget began to run out of control. But Paramount is credited as the distributor of
the film.
11 The three sets of market shares are not directly comparable. For the 1930 to 1942 period the shares are
shares of estimated total US rentals accruing to distributors. Estimated US rentals are derived as one third of
annual total box office over the period. For the 1946 to 1965 period, the shares are shares of distributor US
rentals of the annual top grossing films. For the 1988 to 1999 period, the shares are the shares of annual US box
office.
12 Table 2.4, p. 52.
13 Table 3.2, p. 80.
14 The formula used here for the Gini coefficient is ∑∑==
−−=n
ii
ii xnxniG
1
60
1
)12( , where ix is the revenue
generated by film i, these revenues having been ordered from smallest to largest, and i is the rank of ix , taking
on the value 1 for the smallest value and n for the largest value. We use the top 60 films as this represents the
minimum number of films for which revenue data is available during the sample period (in 1946).