the long term effects of non-parental care on children · care at any point had higher scores of...
TRANSCRIPT

The long Term effecTs of non-parenTal care on children
April 2010

This report was prepared by Healthy Child Manitoba, South Eastman Health and Division scolaire franco-manitobaine (DSFM). It is an abridged version of the technical report: A Look at the Long Term Effect of Non-parental Care on Developmental Outcomes of Children: Results from the 1997 Manitoba Birth Cohort Study. A copy of the technical report can be requested by email: [email protected] or by calling (204) 945-2266.
The Manitoba Birth Cohort Study was funded and authored by Human Resources and Skills Development Canada and Healthy Child Manitoba.

The Long Term Effects of Non-Parental Care on Children 3
introduction: Understanding the influences of non-parental care on early childhood development is an important public policy concern across the country. It is especially important because of Canada’s growing population of children who spend significant amounts of time in non-parental care. Shonkoff & Philips (2000) suggests a growing acceptance of non-parental care as supplementing parental care rather than competing with it. However, concerns about the effects of non-parental care on child development still exist.
Depending on the duration and quality, non-parental care can improve cognitive outcomes, protect children from disadvantaged homes or pose risks to children (McCartney, 2004)*. The 1997 Manitoba Birth Cohort Study was done by South Eastman Regional Health Authority, the Division scolaire franco-manitobaine (DSFM), the Féderation provinciale des comités de parents (FPCP), Healthy Child Manitoba (HCM) and Human Resources and Skills Development Canada (HRSDC) to gain a greater understanding of non-parental care in Manitoba. The study focused specifically on non-parental care arrangements change over time and the relationship between non-parental care, child and family factors and children’s development.
method: Non-parental care in this study is defined as “care of a child by an adult other than a parent for half a day or more per week on a regular basis.” It included centre-based child care, nursery schools, licensed and unlicensed family based child care and care provided in the child’s home. Data was collected on 478 children and their parents from the South Eastman Health region and the francophone community when the children were in preschool, Kindergarten and Grade Three. The study included two samples collected by distinct groups for whom the study was given two different names:
• TheTotsStudywasheadedbySouthEastmanHealth/Santé Sud-Est
• L’ÉtudeParlonsPetiteEnfancewasheadedbyFPCPand DSFM and represented Manitoba’s francophone community.
(*See reference section for details on all sources used in this report.)
The results found in this study are descriptive and analytical. An important feature of our analytical method is that in examining the association between non-parental care and child development, we took into account other child and family factors that may also influence child development.
results:• Approximatelyhalfthechildren(48.3%)inthestudy
were in non-parental care during their preschool years withthispercentagedecreasingovertime.ByGrade3,30%ofchildrenwereinnon-parentalcare.
• Patternsofnon-parentalcaredifferedbetweenSouthEastmanfamilies(36%)andfrancophonefamilies(71%)living in South Eastman and elsewhere in Manitoba.
• Almost65%ofthechildrenhadnon-parentalcareinatleast one phase of the study (between ages three and eight).Therewere13.7%innon-parentalcareinallthree phases.
• Themostimportantindicationofwhetherafamilyusednon-parental care was if mothers were employed. Other indicators were single parents, families with preschool children (rather than school-age), higher maternal education, higher household income, speaking English or French (rather than another language) and being in the francophone sample.
• Inpreschool,familybasedchildcarewasthemostcommontypeofcareusedbyfamilies(23.5%),followedbycentrebasedcare(17.0%)andcareinthechild’shome(4.4%).InGrade3,themostcommontypewascare in the child’s home, followed by family based child care and then centre based.
• Inpreschool,21%ofchildrenspent30hoursormoreperweek in non-parental care.
• Factorsassociatedwithmorehoursinnon-parentalcareinclude: being in preschool (compared to Kindergarten or Grade3),mothersbeingemployed,beingasingleparent,and living in South Eastman (compared to francophone families outside South Eastman ).
• Differencesinliteracyskillsofchildrenwerefoundbetween the different types of non-parental care arrangements.
o higher for family based child care than parental care (for middle and high income families only)
executive summary

The Long Term Effects of Non-Parental Care on Children4
o higher for centre based child care than parental care (forGrade3only)
o higher for parental care than care by others in the child’s home
• Otherfactorsassociatedwithhigherliteracyskillsinchildren were higher maternal education, being a girl and living in an urban area (Winnipeg or Steinbach).
• Academicskillswerehigherforchildren,livinginurbanareas, in centre based care (compared to parental care), whose parents engaged them in activities, from families withanannualincomehigherthan$30,000andwhospend fewer hours per week in non-parental care.
• Morehealthchallengesinchildrenwerefoundamongboys, two-parent families, centre based child care (compared to parental care)1 and families where mothers had lower education (less than Grade 12).
• Loweraggressivebehaviourscoreswerefoundamonggirls,Grade3(comparedtopreschoolorKindergarten),among children who were never in non-parental care and among families where mothers had more education (Grade 12 or more).
• Higherprosocialbehaviourscoreswerefoundamonggirls,Grade3(comparedtopreschoolorKindergarten)and in families where parents do activities with their children.
conclusionsThe number of working mothers is rising in Canada and families are requiring non-parental care for their children. This study essentially found that centre based and family based child care are associated with better literacy and academic skills. It also showed that children who were in non-parental care at any point had higher scores of aggressive behaviour than those in parental care. It is widely recognized that child care quality plays an important role in determining whether non-parental care is associated with positive or negative child outcomes. Parents, caregivers and all levels of government should support the highest quality child care to ensure the best possible outcomes for children.
Parents must pay attention to how their children are adjusting to non-parental care and understand that their sensitive parenting and supportive family environment have a strong, positive influence on the development of their children, beyond the influence of the non-parental care they may be choosing. Involvement in this study stimulated interest and discussion among the partners and their respective communities about early child development (ECD). The provincial government has recently launched its five year plan to increase child care spaces and to devote more resources to ensuring high quality child care. The research has increased public awareness about the importance of ECD, early childhood education and care (ECEC) and the needs of families in the community.
1 Centre-based care in Manitoba has staff and equipment to care for children with special needs.

The Long Term Effects of Non-Parental Care on Children 5
introduction: Child care can be defined as a program to encourage healthy child development and to support families. The best child care combines care, nurturance and early education (Shonkoff & Philips, 2000). Understanding the influences of non-parental care on early childhood development is an important public policy concern across the country. It is especially important because of Canada’s growing population of children who spend significant amounts of time in non-parental care.
Canadian research indicates that the number of working womenhasincreaseddramaticallyovertime(Roy,2006)as have the number of single parent families (Bushnik, 2006).Agrowingpublicacceptanceofnon-parentalcareas supplementing rather than competing with parental care is observed (Shonkoff & Phillips, 2000). However, concerns about the effects of non-parental care on child development continue. Studies done in the United States have shown mixed effects of non-parental care on child development. Weaknesses in available child care research limit the definitive conclusions that can be made about the effects of childcareondevelopingchildren(Belsky,2003).Fewchildcare studies have simultaneously taken into account the many factors that influence child development. Depending on the quality of care and its duration, non-parental care may improve cognitive outcomes, protect children from disadvantaged homes or may pose a risk to children (McCartney, 2004).
In November 2000, Human Resources and Development Canada (HRDC) and Healthy Child Manitoba (HCM) wanted to learn more about the impact of non-parental care on children’s readiness to learn at school entry. This can be measured only through a longitudinal research initiative. This specialized research was to build on HRDC’s national Understanding the Early Years (UEY) initiative. UEY focused on the readiness to learn of young children in specific communities across Canada. Manitoba was chosen for this research because of its knowledge infrastructure and the expertise and involvement of HCM. Other strengths were the willingness, interest and capacity of the South Eastman Regional Health Authority and the francophone community across Manitoba. It was believed that this research would inform policy decision on the best combination of family, child care and community factors to support healthy early childhood developments.
figure 1 – Timeline of sTudy
1997 2001 2003 2005
BirTh year phase i phase ii phase iii (of children in study)
Preschool3-4yearsold
Kindergarten5-6yearsold
Grade37-8 years old
The 1997 Manitoba Birth Cohort Study was carried out by SouthEastmanHealth/SantéSud-Est,theDivisionscolairefranco-manitobaine (DSFM), the Féderation provinciale des comités de parents (FPCP), Healthy Child Manitoba (HCM) and Human Resources and Skills Development Canada (HRSDC) to gain a greater understanding of non-parental care in Manitoba. It was done to see how non-parental care changes over time and to examine the relationship between non-parental care, child and family factors and children’s development. Children and their parents living in South Eastman and in the province-wide francophone community were surveyed when the children were in preschool, KindergartenandinGrade3.
introduction
Children are the rock on which our
future will be built – the leaders of
our country for good or ill: which is
why the rich potential in each child
must be developed into the skills
and knowledge that our society
needs to enable it to prosper.
Nelson Mandela at the dedication of Qunu and Nkalane Schools on June 3, 1995
“
”

The Long Term Effects of Non-Parental Care on Children6
figure 2 – map of souTh easTman healTh region and francophone communiTy
meThods
sample descriptionThe 1997 Manitoba Birth Cohort Study provided data on non-parental care and related factors including child and family demographics, community factors and child development outcomes. Data was collected on 478 children from the parents (usually the mother). It was also collected by assessing children directly with standard instruments. Table 1 describes these instruments. Figure 1 illustrates that children were assessedatthreeyears(2001,Phase1),fiveyears(2003,Phase2)andsevenyears(2005,Phase3).Thestudyincludedtwo samples collected by distinct groups for whom the study was given two different names. As the map shows (Figure 2), TheTotsStudywasheadedbySouthEastmanHealth/SantéSud-Est.L’ÉtudeParlonsPetiteEnfancewasheadedbyFPCPandDSFM representing Manitoba’s francophone community.
Children attending DSFM schools represent approximately half the francophone population whose parents have chosen the françaisprogram.AsillustratedinFigure3,thetwosamplesoverlap with some of the children in the francophone school division also living in south eastern Manitoba.
figure 3 – children who parTicipaTed in all Three phases of sTudy
response rateIt is important to be aware of the study’s response rate to determine how representative this study is of the South Eastman Health region and of the francophone community. Inpreschool,635of1,024families(62%)oftheavailablegroup of families were recruited. Some did not participate because: they were not aware of the study, declined participation or could not be reached. Most participants in preschool (2001) were interviewed again in Kindergarten (2003)andGrade3(2005).However,manyofthemdidnot,for a variety of reasons. The result was that 478 families (47%)participatedatallthreephases.Itwasnotpossibleto know whether the other families who were not part of this study would have responded in a similar manner.
measuresThe definition of non-parental care for this study was “care of a child by an adult other than a parent for half a day or more per week on a regular or scheduled basis. This is care where the parent does not stay with the child and could include centre based care, care by a relative or other caregiver, babysitting or nursery school. It includes paid and unpaid care.”
Non-parental care may be provided by centre based care, licensed or unlicensed family based child care (by relatives or non-relatives of the child) and in the child’s home (by relatives or non-relatives). Table 2 shows the different types of non-parental care for children living in the South Eastman and the francophone communities.
Children’s outcomes examined in this study were collected through direct assessments with the child and by interviewingtheparentsandteachers.Table3showshowthe outcomes were defined.
south eastman health
The Tots study285children
(excluding DSFM)
dsfml Étude parlonspetite enfance131children
(excluding SEH)
Both62
children

The Long Term Effects of Non-Parental Care on Children 7
TaBle 1. child assessmenT Tools
assessmenT Tools descripTion
ages & stages Questionnaire
(asQ)
Administered by parents (2001)
Assesses five areas of child development (communication, gross motor, fine motor movement, problem solving and personal-social)
who am i?Assesseschildreninpreschool(2001)andonentrytoschool(2003)
Measures a young child’s underlying skills associated with subsequent learning and achievement at school
early development instrument (edi)
CompletedbyKindergartenteachersin2003
Measures five domains of child development on a population level
The five domains include: physical, social, emotional, literacy and language development
grade 3 assessment
(reading & math)
AssessedbyteacheratthebeginningofGrade3(2005)
Summarizes reading and math skills acquired in Grade 2
Reading has three components: reflection, oral reading and reading comprehension
Math has nine components; shapes and sizes, subtraction, addition, graphs, represents and compares numbers, place values, patterns, solve problems, estimates and measures
TaBle 2 - Types of non-parenTal care arrangemenTs
Type of child care descripTion
parental care Children are cared for by their parents.
non-parental care
centre based child care
It includes child care centres, preschool programs, nursery schools and after-school child care.
Most centres are licensed, meaning that they follow The Community Child Care Standards Act and its regulations, which protect the health, safety and well-being of children.
Regulations require a proportion of staff to have approved training in early childhood education.
family based child care
It is delivered in the provider’s home.
It can be licensed or unlicensed. Unlicensed care for up to four children (or less than two infants under two years of age) is not monitored by the province and not subject to the regulations.
Unlicensed care can be by a relative, friend or neighbour and may not necessarily conform to formal provincial standards.
care in child’s home
It is delivered in the child’s home.
It is not licensed or monitored by the provincial government.
Providers may or may not have early childhood education (ECE) training.

The Long Term Effects of Non-Parental Care on Children8
statistical analysisThe results found in this study are descriptive and analytical:The descriptive data shows the percentages or scores reported by parents or measured by the developmental instruments. These are shown by graphs and give information about the frequency of the factors of interest.
The analytical findings are a result of statistical testing to examine if the relationship between factors were because of a true association, or chance. The type of statistical testusediscalledTimeVaryingFixedEffectLongitudinalRegression Modelling.
These regression methods are complex and powerful – a detailed explanation is in the technical report called “The Long Term Effect of Non-parental Care on Developmental Outcomes of Children: Results from the 1997 Manitoba Birth Cohort Study” and is available upon request at [email protected]. The strength of these models is that they allow observations of differences in average outcomes of children across the three phases and the changing or constant influences of non-parental care variables on these outcomes over time. Factors that are statistically significant will be reported – there was only a small (5%)chancethattheassociationmayhavebeenreportedby chance. Results of borderline significance are sometimes reported,meaningthattherewasachance(10%)thattheassociation may have been reported by chance.
Child and family factors that influence child development, as well characteristics of non-parental care, were taken into account. The factors were: child gender, maternal education, household income, parental engagement, languages other than English or French and where a child lives. These analyses could not account for child care quality (not measured), but could account for types of non-parental care whether it was used in all three phases, the number of changes in non-parental care and hours per week in non-parental care.
resulTs
non-parental care use over TimeOther than the National Longitudinal Study of Children and Youth (NLSCY),therewerefewCanadianstudiesthatshowedthe extent of the use of non-parental care. The Child Care Resource and Research Unit (2007) reports that there were substantial increases in Manitoba in regulated child care spaces between1992and2004(18,977to25,634).Alargepercentageof non-parental care used in Canada is not regulated and difficult to identify and describe. To better understand the child care situation in Manitoba, the first research questions asked were: “What are the types of non-parental care arrangements that children experience? Are there changes in the distribution of different types of arrangements over time?”
TaBle 3. children ouTcome VariaBles
ouTcomes descripTion
literacy skills
Measured by different instruments
2001:AgesandStagesQuestionnaire2003:EarlyDevelopmentInstrument
2005:Grade3Assessments(ReadingSkills)
academic skillsMeasured by different instruments
2001&2003:WhoAmI?2005:Grade3Assessments(ReadingandMathSkills)
health challengesDisabilities or limitations that affect daily activities
Challenges developed at birth, or those developing gradually over time.
aggressive Behaviour
Parents were asked the following questions about their children:•bulliesorismeantoothers•kicks,bites,hitsotherchildren•getsintophysicalfights
pro-social Behaviours
Parents were asked the following questions about their children:•playsco-operativelywithotherchildren•triestohelpsomeonewhohasbeenhurt•comfortsanotherchildwhoiscryingorupset
The Long Term Effects of Non-Parental Care on Children 9
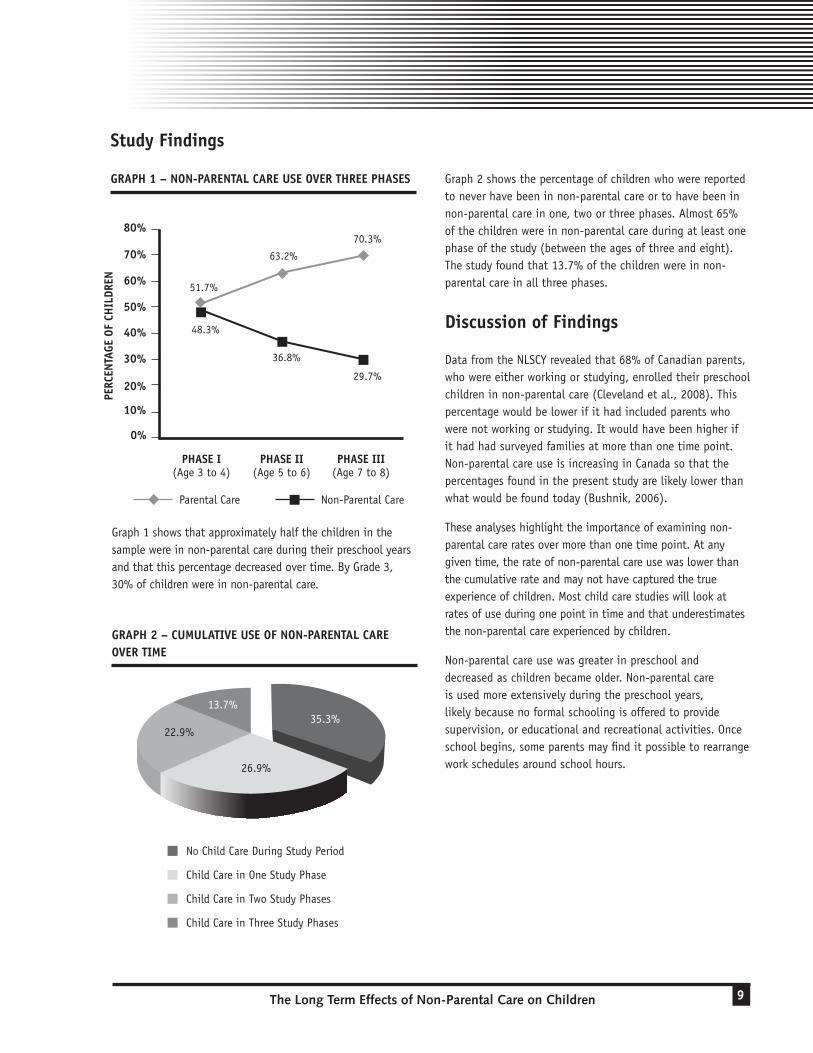
Graph 2 shows the percentage of children who were reported to never have been in non-parental care or to have been in non-parentalcareinone,twoorthreephases.Almost65%of the children were in non-parental care during at least one phase of the study (between the ages of three and eight). Thestudyfoundthat13.7%ofthechildrenwereinnon-parental care in all three phases.
discussion of findings
DatafromtheNLSCYrevealedthat68%ofCanadianparents,who were either working or studying, enrolled their preschool children in non-parental care (Cleveland et al., 2008). This percentage would be lower if it had included parents who were not working or studying. It would have been higher if it had had surveyed families at more than one time point. Non-parental care use is increasing in Canada so that the percentages found in the present study are likely lower than whatwouldbefoundtoday(Bushnik,2006).
These analyses highlight the importance of examining non-parental care rates over more than one time point. At any given time, the rate of non-parental care use was lower than the cumulative rate and may not have captured the true experience of children. Most child care studies will look at rates of use during one point in time and that underestimates the non-parental care experienced by children.
Non-parental care use was greater in preschool and decreased as children became older. Non-parental care is used more extensively during the preschool years, likely because no formal schooling is offered to provide supervision, or educational and recreational activities. Once school begins, some parents may find it possible to rearrange work schedules around school hours.
80%
70%
60%
50%
40%
perc
enTa
ge o
f ch
ildr
en
30%
20%
10%
48.3%
36.8%
29.7%
51.7%
63.2%
70.3%
phase i (Age3to4)
phase ii (Age5to6)
phase iii (Age 7 to 8)
Parental Care Non-Parental Care
0%
study findings
graph 1 – non-parenTal care use oVer Three phases
Graph 1 shows that approximately half the children in the sample were in non-parental care during their preschool years andthatthispercentagedecreasedovertime.ByGrade3,30%ofchildrenwereinnon-parentalcare.
13.7%35.3%
26.9%
22.9%
No Child Care During Study Period
Child Care in One Study Phase
Child Care in Two Study Phases
Child Care in Three Study Phases
graph 2 – cumulaTiVe use of non-parenTal care oVer Time

The Long Term Effects of Non-Parental Care on Children10
study findingsgraph 3 – disTriBuTion of children By Various non-parenTal care
Graph3showsthatthepercentageofchildrenwhowere cared for in their homes increases over time, but children in family based care and centre based care steadily decrease over time. In preschool (Phase1, 2001), family based child care is the most commontypeofcareusedbyfamilies(23.5%),followedbycentre-basedcare(17.0%)andbycareinthechild’shome(4.4%).InGrade3(Phase3,2005),the most common type of care was care in the child’s home, followed by family based care and then centre based care.
discussion of findings
Anecdotal evidence suggests that low attendance in child care centres is at least partly due to lack of availability of spaces for preschool and school aged children. It is important to note that school age children require and use non-parental care. Canadian reports suggest that there are too few child care centres for the number of families where both parents are employed (Childcare Resource and Research Unit, 2007). The concern with family based child care is that a large percentage of this care is unlicensed and of unknown quality. A recent Manitoba study reported that children in centre based care and nursery schools were in more activities that encouraged child development compared to other types of non-parental care (Healthy Child Manitoba, 2006).Childcareofhigherqualityisassociatedwithbetterdevelopmentaloutcomesforchildren(NICHD,2005;Shonkoff& Phillips, 2000).
non-parental care in the south eastman health and francophone communities
study findingsgraph 4 – non-parenTal care in souTh easTman healTh region (seh)
Parental Care Care in Child’s Home
Family Based Care
Centre Based Care
80%
90%
70%
60%
50%
40%
30%
20%
10%
0%
4%8%
15%
64% 63%
79%
15%
23%
5%
16%
6%1%
SEH 2001 SEH2003 SEH2005
perc
enTa
ge o
f ch
ildr
en
51.7%
63.2%
23.5% 21.4%
13.7%17.0%
8.5% 11.0%
4.4% 6.7% 5.0%
70.3%
phase i (Age3to4)
phase ii (Age5to6)
phase iii (Age 7 to 8)
80%
70%
60%
50%
40%
30%
20%
10%
0%
Parental Care
Centre Based Care
Family Based Care
Care in Child’s Home
Note: The numbers for children using various types of care in 2001 and 2003 do not add up to the total number of children using non-parental care for the respective years because of missing responses.

The Long Term Effects of Non-Parental Care on Children 11
graph 5 – non-parenTal care in The francophone communiTy (fc)
Graph4andGraph5suggestthatpatternsofnon-parentalcare use differed considerably between families in South Eastman and families in the francophone community. In thepreschoolyearsandinGrade3,francophonefamilieswere more likely to use non-parental care than non-francophone families living in South Eastman. In 2001 (preschool),familiesinSouthEastman(36%)wereusingnon-parental care less than other families in Canada (68%).Inthesameperiod,francophonefamilies(71%)weremorecomparabletootherCanadianfamilies(68%).Both groups relied heavily on family based child care.
discussion of findingsChildren in South Eastman seldom used centre based childcareinGrade3,comparedtothefrancophonecommunity. A possible explanation may be that school based child care centres are more readily available in the francophone community than in South Eastman. Also, families in the francophone sample were more likely to be educated, employed and consequently have higher household incomes – all factors highly prevalent in families that used non-parental care. There may also be cultural factors influencing these patterns of use (larger populations of new Canadians, religious beliefs, or attitudes towards non-parental care and the role of women). Results show that in Kindergarten, the use of
non-parental care was similar for both groups. It should benotedthatin2003,almostallfrancophoneschoolsoffered full-time Kindergarten which would reduce the need for non-parental care.
length of Time in non-parental care
The length of time that children spend in care is an important factor in studying the influence of non-parental care. The NICHDEarlyChildCareResearchNetwork(2003)foundthatmore time in care predicted higher levels of aggression among Kindergarten children. These effects were modest and were not clinical levels, but were evident, even after controlling for child care quality, type and instability as well as mothers’ sensitivity to their children and other family background factors. The NICHD Early Childcare Research Network recommended that length of time in care should be considered in future analyses. The second research questions asked were: “How much time do children spend in these non-parental care arrangements? Do the average hours spent in non-parental care arrangements change over time as children age? What factors are associated with the length of time that children spend in non-parental care?”
study findingsgraph 6 – children in full Time care
The majority of parents reported that their children spend lessthan30hoursaweekinnon-parentalcare.Forexample,21%ofchildrenspent30hoursormoreinthenon-parentalcare in 2001. As expected, there was a declining trend for non-parental care use over time.
0%
5%
10%
15%
20%
25%21%
5%
3%
2001 2003YEAR
2005
percenTage of children in full Time care(atleast30hoursofcareuseperweek)
perc
enTa
ge o
f ch
ildr
enParental Care Care in Child’s
HomeFamily Base
CareCentre Based
Care
80%
90%
70%
60%
50%
40%
30%
20%
10%
0%
5% 5%11%
29%
68%
59%
37%
12%16%
18%15% 15%
FC 2001 FC2003 FC2005

The Long Term Effects of Non-Parental Care on Children12
A greater number of hours per week were spent in non-parental care when parents were employed full time (Table 4). An interesting finding is that the children whose parents were not gainfully employed were in non-parental care, but used it less frequently than employed parents. The non-parental care used by not gainfully employed parents may have been nursery or preschool programs. No striking differences were apparent between families in the urban and rural areas.
Analyses were done on which factors were associated with children spending more hours per week in non-parental care. Multiple regression analyses were used to account for child and family factors. The results in Box 1 showed that four factors were associated with more frequent use of non-parental care.
Box 1 - study findings*
factors that influence the number of hours per week children spend in child care:
• preschoolyears(comparedtoschool-ageyears)
• mothers’employment
• singleparents
• allchildrenlivinginSouthEastman(includingfrancophone children) spend more time in child care than all other francophone children
* Findings are statistically significant meaning that we are confident (19 times out of 20) that they are correct.
discussion of findings
The factors associated with spending more hours in non-parental care included: children in preschool (compared to older children), gainfully employed mothers, single parents or those living in South Eastman. Previous research suggests that long hours in non-parental care are associated with poorer child outcomes. However, given the relatively short length of time children in this study are in non-parental care, it is not likely to be detrimental to child development.
While the study showed that children in South Eastman were less likely to be in non-parental care than francophone children(Graph4andGraph5),thosewhowere,spentlonger periods of time in care (Box 1). The travel required for parents in rural regions, (ex: South Eastman) to get from their work places to non-parental care may partly explain these findings. This underscores the need to have child care close to the communities where families live and work.
Some other factors were not included in this study and are relevant in determining use of non-parental care. These include: availability of non-parental care, personal preferences and cultural beliefs. Previous research demonstrates that the number of families, in which both parentsareworking,isincreasing(Roy,2006)andthereforechild care is a necessity for parents. Earlier analyses with the Manitoba Birth Cohort data (Human Resources and Social DevelopmentCanadaandHealthyChildManitoba,2005)revealed that families will pay for child care even if they apparently cannot afford it and that this may be contributing to financial stress in some families. Canadian families are reportedtospendanaverageof20%ofthemother’ssalaryon child care (Cleveland and colleagues, 2008). Canadian families appear to be spending only what they can afford on
TaBle 4 – hours per week spenT in non-parenTal care
facTors associaTed wiTh Time spenT in non-parenTal care aVerage hours per week By year 2001 2003 2005
Mothers Employed on Full-time Basis 21.8 15.5 8.2
Mothers Employed on part-time Basis 10.9 10.2 4.4Mothers Not Gainfully Employed 9.3 11.5 7.5Urban Families (Winnipeg or Steinbach) 15.9 11.3 9.7Rural Families 15.6 13.8 6.6
Non-Parental Care (Total Sample) 15.7 12.9 7.1

The Long Term Effects of Non-Parental Care on Children 13
child care and consequently many children may not be receiving quality child care. To address this issue, Manitoba maintains the lowest child care fees in the country (after Quebec) and provides targeted subsidies to make child care more affordable for lower income families (Government of Manitoba, 2008).
Family friendly policies, including
improved access to affordable and
quality child care, access to parental
leave, greater flexibility in work
arrangements and training opportunities
can provide the key to better employment
opportunities for families with young
children, especially lone parents.
Organisation for Economic Co-operation and Development (OECD) Employment, Labour and Social Affairs Committee
characteristics of families who use non-parental care
Understanding the characteristics of families using non-parental care is valuable in planning child care services. The question was asked “What factors (ex: parental employment, parental education, income, family structure, residential status) are associated with each type of non-parental care arrangement?” In Graphs 7 to 10, use of non-parental care is related to maternal employment, maternal education, family structure and household income. These analyses provide insight into which families are most likely to use non-parental care and why they might be choosing it.
study findingsgraph 7 – maTernal employmenT and non-parenTal care
Parental Care
Parental Care
Care in Child’s Home
Care in Child’s Home
Family Based Care
Family Based Care
Centre Based Care
Centre Based Care
80%
90%
100%
70%
60%
50%
40%
30%
20%
10%
0%
33%
52%
64%
7% 8%
16%
37%
29%
13%
21%
11%
82%89%
96%
1% 3%2% 2% 4% 1%
11%
3% 0%6%
employed not employed
2001
2003
2005
TheleftsideofGraph7showsthatwheremothersweregainfullyemployed,65%offamilieswereusingnon-parentalcareinpreschool(2001),whileonly33%ofthesechildrenwereinparentalcare.Familybasedchildcarewasusedextensivelybyfamilies where the mothers were gainfully employed, particularly in 2001. The graph on the right side shows that, in families where mothers were not gainfully employed, the majority of children were with their parents and those in non-parental care were more likely to be in centre based child care.

The Long Term Effects of Non-Parental Care on Children14
graph 8 – family sTrucTure and non-parenTal care
Graph 8 indicates that children in single-parent families were more likely to be in non-parental care than children from two-parent families.
graph 9 – maTernal educaTion and non-parenTal care
Graph 9 shows that maternal education is associated with use of non-parental care. Children of mothers with more education (at least Grade 12) were more likely to be in non-parental care than those of mothers with less education. Family based child care was the most common type of non-parental care, particularly among families where the mother has more education.
Parental Care
Parental Care
Care in Child’s Home
Care in Child’s Home
Family Based Care
Family Based Care
Centre Based Care
Centre Based Care
80%
90%
100%
70%
60%
50%
40%
30%
20%
10%
0%
29%30% 32%27%
33%37%
22%
13%19%
53%
64%
73%
4%
13%
6%
23%20%
10%
17%
8%4%
19%
single-parent Two-parent
2001
2003
2005
17% 15%
Parental Care
Parental Care
Care in Child’s Home
Care in Child’s Home
Family Based Care
Family Based Care
Centre Based Care
Centre Based Care
80%
90%
100%
70%
60%
50%
40%
30%
20%
10%
0%
31%
50%
65%
11%
39%
28%
15% 13% 13%
59%
68%71%
15%
6%3%
19%19%
10%
18%
7% 4%9%
high education low education
2001
2003
2005
9% 8%

The Long Term Effects of Non-Parental Care on Children 15
graph 10 – household income and non-parenTal care
Graph10showsthatchildrenfromhighertomiddleincomefamilies(over$30,000)aremorelikelytobeinnon-parentalcarethan those from lower income families. Centre based child care is more common among low income families.
Analyses were done on factors associated with use of non-parental care, after other child and family factors were taken into account. The results in Box 2 show that seven factors were associated with being in non-parental care.
Parental Care
Parental Care
Care in Child’s Home
Care in Child’s Home
Family Based Care
Family Based Care
Centre Based Care
Centre Based Care
80%
90%
100%
70%
60%
50%
40%
30%
20%
10%
0%
50%
60%
69%
14%
27%24%
12%16%
9%
58%
71%76%
12%
3%4%10%
16%
6%
21%
10%6%5%
high and middle income low income
2001
2003
2005
5%8%
Box 2 - study findings*
factors that influenced child care use:
• mothers’employment
• singleparents
• preschoolyears(comparedtoschool-ageyears)
• highmaternaleducation
• middleorhighfamilyincome(over$30,000)
• EnglishorFrenchspeaking(comparedtoother languages)
• francophonechildren(includingfrancophonechildren in south eastman) more likely than all other south eastman children.
* Findings are statistically significant meaning that we are confident (19 times out of 20) that they are correct.
discussion of finding
Many characteristics can predict whether or not families will use child care services. The most important indicators for use of non-parental care were: maternal employment, followed by single parent families, having preschool children, higher maternal education, higher household income, speaking an official language and being in the francophone sample. As noted earlier, maternal employment is rising in Canada and families are requiring non-parental care for their children (Roy,2006).TheUSandCanada,incontrastwithEuropeancountries, have no national policies supporting early childhood education and care (ECEC) because of continued ambivalence about where the responsibility for child rearing should lie (Kamerman, 2000). From 1999 to 2007, the Manitoba government increased investments in early learning and child care and has prepared a five-year plan to improve aspects of child care. The plan includes quality and affordability (Manitoba Child Care, 2008). The provincial government offers subsidies to low-income families using centre based child care, which partially explains higher use among these families.
The Long Term Effects of Non-Parental Care on Children16
child development and non-parental care use
Parents and policy makers are interested in child care and early childhood education to ensure that children develop physically, socially, cognitively and emotionally. Previous research has shown that non-parental care can influence children’s developmental outcomes (McCarthy, 2004;ShonkoffandPhillips,2000;NICHDECCRN,2005).Research questions included: “How do the various types of non-parental care arrangements and hours spent in these arrangements affect children’s developmental outcomes over time? How does the stability in a non-parental care arrangement affect these outcomes?”
The association between non-parental care and children’s literacy skills, academic skills, health limitations, aggressive behaviour and prosocial behaviour was examined and tested by accounting statistically for other child and family influences. The raw unadjusted scores are shown in the graphs and the results of the statistical analyses are summarized in the boxes. The description of the child developmentoutcomesweredescribedearlierinTable3.
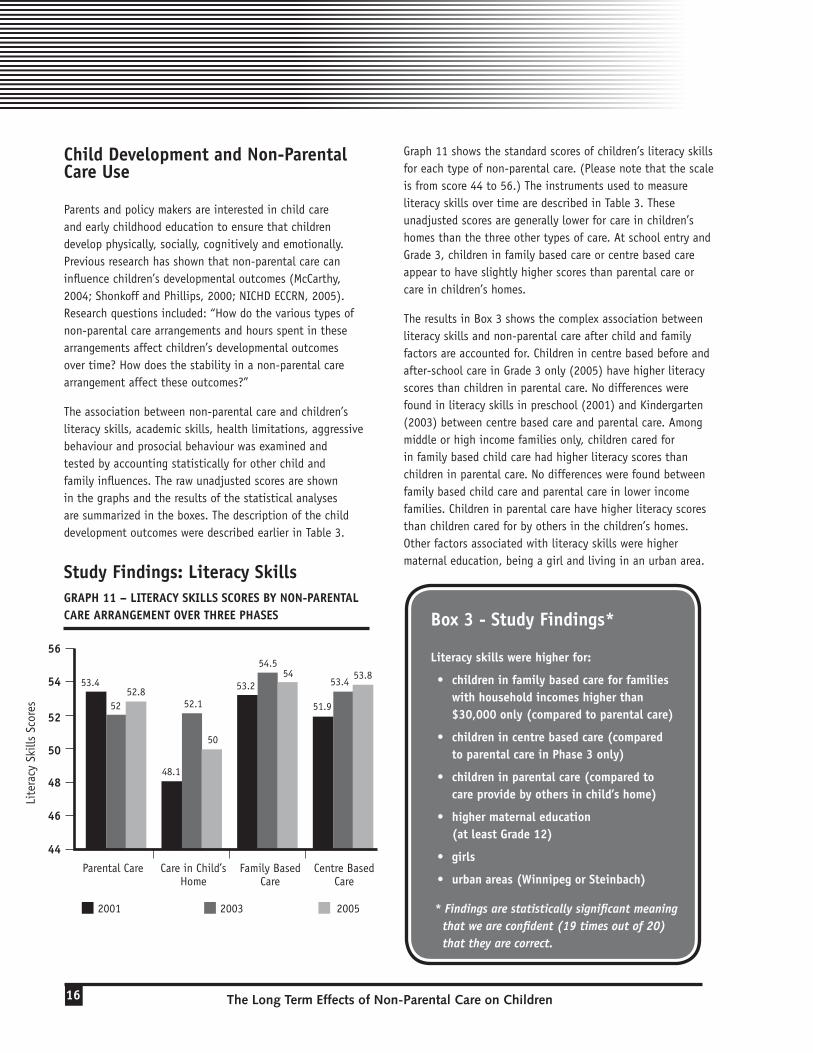
study findings: literacy skillsgraph 11 – liTeracy skills scores By non-parenTal care arrangemenT oVer Three phases
Graph 11 shows the standard scores of children’s literacy skills for each type of non-parental care. (Please note that the scale isfromscore44to56.)TheinstrumentsusedtomeasureliteracyskillsovertimearedescribedinTable3.Theseunadjusted scores are generally lower for care in children’s homes than the three other types of care. At school entry and Grade3,childreninfamilybasedcareorcentrebasedcareappear to have slightly higher scores than parental care or care in children’s homes.
TheresultsinBox3showsthecomplexassociationbetweenliteracy skills and non-parental care after child and family factors are accounted for. Children in centre based before and after-schoolcareinGrade3only(2005)havehigherliteracyscores than children in parental care. No differences were found in literacy skills in preschool (2001) and Kindergarten (2003)betweencentrebasedcareandparentalcare.Amongmiddle or high income families only, children cared for in family based child care had higher literacy scores than children in parental care. No differences were found between family based child care and parental care in lower income families. Children in parental care have higher literacy scores than children cared for by others in the children’s homes. Other factors associated with literacy skills were higher maternal education, being a girl and living in an urban area.
Box 3 - study findings*
literacy skills were higher for:
• childreninfamilybasedcareforfamilieswith household incomes higher than $30,000only(comparedtoparentalcare)
• childrenincentrebasedcare(comparedto parental care in phase 3 only)
• childreninparentalcare(comparedtocare provide by others in child’s home)
• highermaternaleducation (at least grade 12)
• girls
• urbanareas(WinnipegorSteinbach)
* Findings are statistically significant meaning that we are confident (19 times out of 20) that they are correct.
Parental Care Care in Child’s Home
Family Based Care
Centre Based Care
56
44
46
48
50
52
54 53.452.8
48.1
52.1
50
53.2
54.554
51.9
53.453.8
2001 2003 2005
52
Lite
racy
Ski
llsS
core
s

The Long Term Effects of Non-Parental Care on Children 17
Box 4 - study findings*
academic skills were higher for:
• urbanareas(WinnipegorSteinbach)
• childrenincentrebasedcare(comparedto parental care with strongest effect in preschool)
• parentalengagement(doingactivitieswith children)
• householdincomehigherthan$30,000
• fewerhoursperweekinchildcare†
* Findings are statistically significant meaning that we are confident (19 times out of 20) that they are correct.
†For this finding, our confidence is slightly less (18 times out of 20)
study findings: academic skills
graph 12 – academic skills By non-parenTal care oVer Three phases
Parental Care Care in Child’s Home
Family Based Care
Centre Based Care
15.413.8
15.616.615.8
14.3
16.1
14
15.7
13.7
16.3 15.9
2001 2003 2005
0
2
4
6
8
10
12
14
16
18
20
Acad
emic
Ski
lls
Graph 12 shows that the unadjusted academic skills appear to be generally lower for care in children’s homes than the threeothertypesofcare.(SeeTable3forinstrumentsusedto measure academic skills.) In preschool (2001), children in centre based care had the highest scores. In Kindergarten (2003)andGrade3(2005),thoseinfamilybasedchildcare had the highest scores. The results in Box 4 show the association between academic skills and non-parental care, after accounting for child and family factors. Factors associated with higher academic skills include: living in an urban area (compared to a rural area), being in centre-based child care (compared to parental care), parents reporting doing activities with children, middle or high household income(>$30,000)andspendingfewerhoursperweekinnon-parental care.
discussion of findings
AsshowninBox3andBox4,somepositiveassociationswerefound between non-parental care and cognitive outcomes (literacy and academic skills). This is consistent with previous research(Barnett,2004;McCarthy,2004;NICHD,2005).Generally, centre based care is associated with higher quality because it is regulated by provincial governments. Caregivers in centre based child care have educational backgrounds in child development and are more likely to be sensitive to children’s cognitive and social-emotional development. Children in these centres are more likely to be engaged in activities that support their development.
In this study, family based care was associated with higher literacy skills than parental care – for middle or high income families only. No differences were found between parental care and family based care for lower income families. There may be less opportunity for lower-income families to find higher quality child care for their children than for middle or high income families. A Québec study found that low-income neighbourhoods tended to have lower quality child care than middle or high income neighbourhoods (Jaeger & Funk,

The Long Term Effects of Non-Parental Care on Children18
2001). The quality of family based care is unknown in this study and may have ranged from high quality to poor quality. High quality child care in a family based setting is likely to be associated with higher cognitive skills.
Another observation from this study is that fewer hours in non-parental care were associated with higher academic skills. It should be noted that this finding is of borderline statistical significance meaning that this finding is less certain. An association with poorer cognitive skills and parental employment and use of non-parental care was recently found in a sample of families with a single child (Bernal, 2008). On the other hand, inanotherstudyusingtheNLSCY,nodetrimentaleffectsrelated to length of time in non-parental care were found(Gagné,2003).Theseconflictingfindingsmightbeinfluenced by quality of non-parental care which was not taken into account. Another explanation might be that long hours in non-parental care tend to limit the amount oftimethatparentscanspendwiththeirchildren.Littleenergy and patience may be left to spend time with their young children after both parents have worked all day. These results may be pointing to improved working conditions for parents with young children such as flexible or part-time hours.
study findings: health challengesgraph 13 – healTh challenges By non-parenTal care oVer Three phases
What transpires in the family appears
to be more important in explaining
children’s early social and emotional
development than whether children
are cared for by someone other than
their mothers on a routine basis.
NICHD Early Child Care Research Network (2005) p.280
“
”
Parental Care Care in Child’s Home
Family Based Care
Centre Based Care
7%
10%
8%
12%
9% 9%
13%
10%
17%
11%
8%
2001 2003 2005
0%
2%
4%
6%
8%
10%
12%
14%
16%
18%
20%
9%
Box 5 - study findings*
health challenges are associated with:
• two-parentfamilies
• centrebasedcare†
• lowermaternaleducation(lessthanGrade12)
• boys
* Findings are statistically significant meaning that we are confident (19 times out of 20) that they are correct.
† Centre based care in Manitoba has staff and equipment to care for children with special needs.
Graph13indicatesthatpercentagesofchildrenwithhealthchallenges were generally higher in child care centres or in care providedinchildren’shomes.TheresultsinBox5showtheassociation between health challenges and non-parental care after child and family factors are accounted for. Being in a two-parent family, being in centre based child care, lower maternal education or being a boy are all associated with having a health challenge.

The Long Term Effects of Non-Parental Care on Children 19
discussion of findings
The results showed that child care centres were associated with higher numbers of children with health challenges. A possible explanation is that families with children with disabilities are offered centre based child care to help care for their children. The provincial government recognizes that families with children with disabilities require additional support in caring for their children (Participation and Activity Limitation Survey: Families of Children with Disabilities in Canada; Statistics Canada, 2008 ).
study findings: aggressive Behaviorgraph 14 – aggressiVe BehaVior By non-parenTal care arrangemenT oVer Three phases
Parental Care Care in Child’s Home
Family Based Care
Centre Based Care
18%
33%
18%17%
16%
26% 25%
8%
19%
11%
4%
2001 2003 2005
0%
5%
10%
15%
20%
25%
30%
35%
19%
Graph 14 shows that in general the percentage of children displaying aggressive behaviour is decreasing over time. Aggressive behaviour appears to be higher among children in non-parental care compared to children cared for by their parents.TheresultsinBox6indicatethatchildrenweremore likely to show aggressive behaviour if they have been in non-parental care at one or more phases of the study than if they reported never being in non-parental care. The aggressive behaviour was not associated with one type of non-parental care or being in non-parental care at one particular point.
discussion of findings
Consistent with other studies, the analyses showed that aggressive behaviour in children generally decreased as they grew older (Tremblay, Nagin, Seguin, Zoccolillo, Zelazo, Boivin,2005).Thisstudyfoundthatbeinginnon-parentalcare at any point was associated with more aggressive behaviour in children. It should be noted that a wide range of non-parental care was examined in this study with varying degrees of quality.
Previous studies have found conflicting results for the relationship between child care and children’s behaviour (McCarthy, 2004). In certain high quality programs, children receiving more hours of child care had fewer behaviour problems(Loveetal.,2003).Somechildren(boysandcertain temperaments) may be particularly prone to negative effectsfrombeinginchildcare(Crockenberg,2003;NICHD,2005).Ithasbeensuggestedthathighqualitychildcarecould buffer the effects of child care on child behaviour (Loveetal.,2003.)Thissuggeststhatparentsandcaregiversshould provide the highest quality child care and must pay attention to how children are adjusting to non-parental care.
Box 6 - study findings*
aggression is lower for:
• childreninGrade3versusyoungerchildren
• ifchildcarewasnotusedatall(versus used one or more phases)
• highermaternaleducation (at least grade 12)
• girls
* Findings are statistically significant meaning that we are confident (19 times out of 20) that they are correct.

The Long Term Effects of Non-Parental Care on Children20
study findings: prosocial Behavior
graph 15 – low pro-social BehaViour By non-parenTal care oVer Three phases
“
”
Early childhood investments of
high quality have lasting effects…
We cannot afford to postpone
investing in children until they
become adults, nor can we wait
until they reach school age – a
time when it may be too late to
intervene. Learning is a dynamic
process and is most effective
when it begins at a young age
and continues through adulthood.
The role of the family is crucial
to the formation of learning skills,
and government interventions at
an early age that mend the harm
done by dysfunctional families
have proven to be highly effective.
Nobel Prize-winning economist James Heckman – University of Chicago
Parental Care Care in Child’s Home
Family Based Care
Centre Based Care
26%
14%
26% 27%
17%15%
13%14%
6%4%
8%
2001 2003 2005
0%
5%
10%
15%
20%
25%
30%
3%
Graph15showsthatlowprosocialbehaviourisdecreasingover time as children develop. No differences in prosocial behaviour between children in non-parental care and those in parental care were noted in Box 7 or in the statistical testing. Older children, being a girl and having engaged parents were associated with better prosocial skills.
Box 7 - study findings*
prosocial is higher for:
• Grade3childrenandtoalesserextentkindergarten children (versus preschoolers)
• girls
• parentalengagement (doing activities with children)
* Findings are statistically significant meaning that we are confident (19 times out of 20) that they are correct.

The Long Term Effects of Non-Parental Care on Children 21
discussion of findings
The findings of older children and girls having better prosocial skills are consistent with previous research (Romano,Tremblay,BoulericeandSwisher,2005).Itisalsoimportant to note the crucial role of parental engagement in prosocial skills. Canadian research found that parenting styles do influence the development of prosocial skills (Romanoetal.,2005).Non-parentalcareinthisstudyhasno significant effect on children’s prosocial skills.
study strengths and limitations
As with all research, this study has strengths and limitations that should be considered in interpreting the results. An important strength is the longitudinal design of the study which permits observation of non-parental care, early childhood influences and child development over time. The sophisticated statistical method used to analyze the data could account for child outcomes and child and family characteristics over time. For example, a child’s development in preschool was accounted for in examining development in KindergartenandGrade3.
One of the challenges of following child development over time is that the instruments used in measuring development do change as children develop. For this reason, the measures used in this study were different at each time period. The scores were standardized to allow comparisons over time. The cognitive skills (academic and literacy) variables and the aggressive and prosocial behaviour variables were based on instruments and questions known to be valid and reliable.
Some of the results found in this study may not be applicable to other parts of Manitoba or Canada. The study provides a good description of non-parental care in two communities in Manitoba, but cannot describe patterns of non-parental care elsewhere. Significant differences were found in rates of non-parental care between South Eastman and the francophone community. However, associations between non-parental care and child development found in the present study, might be generally applied to other Manitoba and Canadian children. Earlier analyses of these two communities which examined the associations between non-parental care and child development found similar results in both communities and wasconsistentwithpreviousresearch(HRSDC,2005).
A limitation of almost all child care research is that of selection biases. The design of this study determines associations between non-parental care and child development, but does not determine that non-parental care directly affects child development. Finding an association signifies that non-parental care and child development are occurring together but not necessarily that one is directly influencing the other. Parents in this study made choices for their children and were not asked to randomly designate a certain type of non-parental care. Some of the characteristics that influence families in choosing non-parental care may be the same as those influencing child development. Families who enrol their children in non-parental care and in certain types of care are likely different from those who do not.
conclusions
Non-parental care for this study was defined as “care of a child by an adult other than a parent for half a day or more per week on a regular basis” and included centre based child care, nursery schools, licensed and unlicensed family based child care and care provided in children’s homes. It indicated that65%ofchildrenwereinnon-parentalcareatsomepointduring the study period and that the most common type was family based. The concern with family based care is that a large percentage of this care is unlicensed and of unknown quality. Most of the children in this study attended non-parental care on a part-time basis.
There are increasingly more working mothers in Canada and therefore, families that require non-parental care. The most important indications of whether a family used non-parental care were: mothers being employed, followed by being a single parent, having preschool children (rather than school-age children), higher maternal education, higher household income, speaking English or French (rather than another language) and being in the francophone sample.
This study essentially found that centre based and family based child care are associated with better literacy and academic skills. It also found that children who were in non-parental care at any point had higher scores of aggressive behaviour than those in parental care. It is widely recognized that child care quality plays an important role in determining whether child care is associated with positive or negative child outcomes. Parents, caregivers and all levels of government should provide the highest quality child care to

The Long Term Effects of Non-Parental Care on Children22
ensure the best possible outcomes for children. Parents must pay attention to how their children are adjusting to non-parental care.
The analyses also showed that many factors, other than non parental care influenced children’s health, literacy and academic skills, and aggressive and prosocial behavioural outcomes. There were strong associations between these outcomes and the activities parents engage in with their children, where children live, parent’s education and income, and childrens’ age and gender. The effects of these child and family characteristics were strong and are consistent with previous research. It is important for parents to be aware that sensitive parenting and supportive family environments haves a strong and positive influence on the development of their children beyond the influence of the non-parental care they may be choosing.
Through this study, Manitoba has learned a great deal about the non-parental care in South Eastman and the francophone community and about important issues related to child care. Valid and reliable measures of child care quality are currently being used to monitor quality in Manitoba’s child care centres. From 1999 to 2007, Manitoba has doubled its commitment to early learning and child care.
The provincial government has recently released its new five-year plan outlining improvements to early learning and care by2013(GovernmentofManitoba,2008).Fundingwillbeallocatedto6,500spaces,nurseryschoolenrolmentwillbeincreased; capital funds will be invested to convert surplus school space into child care centres; services of high quality will be supported by using an internationally recognized approach; services will be more responsive to diverse cultures (Francophones,Aboriginals,newimmigrants);anda20%increase in funding for wages and benefits will be provided.
A unique feature of this study was the partnership between the francophone school division, South Eastman Health and the provincial and federal governments. Partners were involved in all aspects of the study from planning and implementing, to analyzing and reporting the results. The research findings were distributed regularly because the francophone school division and South Eastman Health are closely linked to their communities. All partners increased their understanding about the influences of non-parental care, by being directly involved with the research process and immersing themselves in the research relevant to child
care. The partnership also went a long way in breaking down silos dividing health authorities, school divisions and government departments.
Families who participated in the study, also benefited by reflecting on early child development (ECD) and their parental roles. The research process and findings have increased public awareness about the importance of early childhood development, early childhood education and care and the needs of families in the community.
[If] we’re serious – if we’re
really serious – about making
Canadians the healthiest people in
the world, we have to be serious
about investing in the early years
education and child care.
Roy Romanow, receiving The International Foundations Public Service Award, Ottawa, May 8, 2003
“
”

references Belsky,J.(2003).ChildCareandItsImpactonYoungChildren(0–2).RetreivedonSeptember18,2009at
http://www.enfant-encyclopedie.com/pages/PDF/BelskyANGxp_rev-Child_care.pdf
Barnett,S.W.ChildCareandItsImpactonChildren2–5YearsofAge.RetreivedonSeptember18,2009at http://www.enfant-encyclopedie.com/Pages/PDF/BarnettANGxp.pdf
Bushnik,T.(2006)Child Care in Canada. Children and Youth Research Paper Series,Catologue,89-588-MIE2006003.StatisticsCanada: Ottawa.
Childcare Resource and Research Unit (2007). Child Care Space Statistics 2007 Toronto: Childcare Resource and Research Unit.
Cleveland, G., Forer, B., Hyatt, D., Japel, C., & Krashinsky, M. (2008). New evidence about child care in Canada: Use Patterns, affordability and quality. IRPP Choices 14[12].
Crockenberg,S.C.(2003).Rescuingthebabyfromthebathwater:howgenderandtemperament(may)influencehowchildcareaffects child development. Child Development,74,1034-1038.
Gagne,L.G.(2003).Parental work, child care use and young children’s cognitive outcomes(Rep.No.89-594-XIE).Ottawa,Canada: Minister responsible for Statistics Canada.
GovernmentofManitoba(2008)FamilyChoices:Manitoba’sFive-YearAgendaforEarlyLearningandChildCare.AccessedonAugust 4, 2009 at http://www.gov.mb.ca/asset_library/en/familychoices_newsletter.pdf”
HealthyChildManitoba(2006)2002ManitobaChildCareStudy.AccessedonAugust4,2009at http://www.gov.mb.ca/healthychild/ecd/child_care_study_2002.pdf
HumanResourcesandSocialDevelopmentCanada(2005)EarlyChildCareInfluencesonChildOutcomes: Part II: Analytic Results form the 1997 Manitoba Birth Cohort Study. Available by request at Healthy Child Manitoba Office, [email protected]
Jaeger, E. & Funk, S. (2001). The Philadelphia Child Care Study: An examination of qualtiy in selected early education and care settings. A technical report submitted to the improving School Readiness Project of the United Way of Southeastern P.A. Philadelphia, PA: Saint Joseph’s University, Department of Psychology.
Kamerman, S. B. (2000). Early childhood education and care: an overview of developments in the OECD countries. International Journal of Educational Research,33,7-29.
Love,J.M.,Harrison,L.,Safi-Schwartz,A.,vanIJzenoorn,M.H.,Ross,C.,Ungerer,J.A.etal.(2003).Childcarequalitymatters: How conclusions may vary with context. Child Development,74,1021-1033.
McCartney, K. (2004) Current Research on Child Care Effects. Retreived August 17, 2009 at http://www.child-encyclopedia.com/Pages/PDF/McCartneyANGxp.pdf
NICHDEarlyChildCareResearchNetwork(2003).Doesamountoftimespentinchildcarepredictsocioemotionaladjustmentduring the transition to Kindergarten? Child Development, 74,976-1005.
NICHDEarlyChildCareResearchNetwork.(2005).NonmaternalCareandFamilyFactorsinEarlyDevelopment:AnOverviewofthe NICHD Study of Early Childcare. Child Care and Child Development: The Guilford Press.
Roy,R.(2006).From she to she: changing patterns of woment in the Canadian labour force (Rep. No. 11-010). Ottawa: Statistics Canada.
Shonkoff, J. & Phillips, D. (2000) From Neurons to Neighborhoods: The Science of Early Childhood Development. District of Columbia: National Academy Press.
StatisticsCanada(2008)ParticipationandActivityLimitationSurvey:FamiliesofChildrenwithDisabilitiesinCanada.Accessedon August 4th, 2009 at http://www.statcan.gc.ca/pub/89-628-x/89-628-x2008009-eng.pdf
Tremblay,R.E.,Nagin,D.S.,Seguin,J.R.,Zoccolillo,M.,Zelazo,P.D.,Boivin,M.,Perusse,D.&Japel,C.(2005)Physicalaggressionduringearlychildhood:trajectoriesandpredictors.CanChildAdolescPsychiatrRev,14(1),3-9

CM2401-4/10