the loyalty model of private university student … volume/6 leonard.pdf · campus a is located on...
TRANSCRIPT

International Journal of Information Technology and Business Management 29
th December 2013. Vol.20 No.1
© 2012-2013 JITBM & ARF. All rights reserved
ISSN 2304-0777 www.jitbm.com
70
THE LOYALTY MODEL OF PRIVATE UNIVERSITY STUDENT
Study Case: STIKOM London School of Public Relation
Leonnard, MComm (Usyd), Heny K.S Daryanto, Ph.D, Dadang Sukandar, Prof, Ph.D,
Eva. Z. Yusuf, Ph.D 1,2,4
Graduate School of Management, Bogor Agricultural University 3Departement of Community Nutrition, Faculty of Human Ecology
Bogor Agricultural University
Email: [email protected], [email protected], [email protected], eva.yusuf@myriad-
research.com
Abstract
This study will investigate Loyalty Model of Private University Student by using STIKOM
London School of Public Relation as a study case. This study will examine the model from service
quality, college image, tuition fee, trust and satisfaction perspective. Thus, the objective of this study is
to examine and analyze the effect of service quality, college image, tuition fee, trust and satisfaction
towards students’ loyalty; the effect of service quality, college image, tuition fee and satisfaction
towards trust; and the effect of service quality, college image and tuition fee towards satisfaction. This
study will use survey methodology with causal design. The samples of the study are 320 college student.
The gathering of data will be conducted by using questionnaire in likert scale. The analysis of the data
will use a Structural Equation Modelling (SEM) approach.
Keywords: loyalty model, service quality, college image, tuition fee, trust, satisfaction, structural
equation modelling
FOREWORD
Research Background
The fast development of globalization
causes a more massive and competitive
competition among individuals, groups,
organizations and nations. The intensity of the
competition is not only happening in business
sector, but also in non business sector like non-
profit organizations. This includes the
education sector as well. As an illustration,
there is a very fierce competition among
privete education institutions in Indonesia. The
trigger of this phenomena is the fast growth of
private universities. Based on Pengurus Pusat
Asosiasi Perguruan Tinggi Swasta Indonesia
(Aptisi) data, up to 2013, there are 3.135
private education institutions which organize
10.680 programs in Indonesia. Out of those
3.135 private education institutions, around
20% (627) of them is university, 50% (1.568)
is non-university (institute and college) and
30% (940) of them is academy/polytechnic.
This growth is very rapid, remembering in
1997, there were only 1.293 private education
institutions in Indonesia. It means, within less
than two decades, the growth of Indonesia’s
private education institutions is around
142.5%. Ironically, the total number of student
in Indonesia is only 1.706.800 which means
there are only 544 students of private education
institutions students in average. The total of
private education institutions in DKI Jakarta is
317 institutions, which consists of: 45 (14%)
universities, 139 (44%) non-university
(institutes and college) and 133 (42%)
academy/polytechnic. this condition makes the
private education institutions face a very hard
challenge in getting students. It can be seen on
the declining percentage of students in each
year. It is estimated that around 30%-40%
private education institutions in Indonesia are
prone to bankruptcy
(www.pts.co.id/kondisi.asp/Kondisi).
The condition is getting worse by the
emerging existence of foreign university in
Indonesia which is formally and legally
permitted. Based on Undang-Undang Republik
Indonesia Nomor 20 tahun 2003 tentang
Sistem Pendidikan Nasional, khususnya Pasal
65, the foreign education insitute which is
already accredited in its country can operate its
business in Indonesian. This regulation makes

International Journal of Information Technology and Business Management 29
th December 2013. Vol.20 No.1
© 2012-2013 JITBM & ARF. All rights reserved
ISSN 2304-0777 www.jitbm.com
71
it possible for foreign institutes to compete in
Indonesia. If those foreign institutes are
financially supported, then this becomes a
serious threat for private institutions in
Indonesia. This condition portrays a very fierce
competition that private education institutions
in Indonesia have to face. This makes some of
them try to build a loyalty amongst the student
by several ways, for example no entrance exam
policy for post graduate students, discount or
free building fee and other ways that is
considered effective to ensure that the alumni
will continue their study in the same
institutions. The similar approach is also taken
by Communication Institutions – London
School of Public Relation (STIKOM-LSPR)
Jakarta, which is the object for this study.
STIKOM LPR was founded on 1992 by
Yayasan Pesona Pribadi Sejahtera. Since 1993,
this institution has already accredited by
LCCIEB (The London Chamber of Commerce
and Industry Examination Board) United
Kingdom, the oldest examination organization
in London, United Kingdom. In 1997, the
institution got a Perhumas award as The Most
Preffered in Public Relation School category.
In 1998, STIKOM-LSPR was accredited by
City and Guilds of London Institute, London
United Kingdom. In 2004, it was given an A
accreditation by BAN PT (Badan Akreditasi
Nasional-PerguruanTinggi). In 2003, it was
accredited as one of International Associate of
The University of Cambridge International
Examination, UK. In 2004, STIKOM-LSPR
got an ISO 9001 2001 certification for higher
education management, which means that all
of its procedures has already met the
International standar.
The vision of STIKOM-LSPR is to be
a role model of communication institutions and
the development in Indonesia as well as to be
highly respected nationally and internationally.
The mission of STIKOM-LSPR is to run a
high-quality education; to prepare qualified
graduates that are capable to compete in
national and International scope; to prepare
graduates that possess good communication
skills and competency to be able to fulfill the
needs of the industry. In 2012, STIKOM-LSPR
received several awards from media industry,
such as: The Best Communication School in
Buku Panduan Memilih PerguruanTinggi 2012
based on the survey from Pusat Data dan
Analisa Tempo, Indonesia Best Graduate
School of Communication 2012 based on the
survey form MIX magazine, an award from
SINDO media as the Distinctive Contribution
in education development in Indonesia
STIKOM-LSPR runs an
undergraduate program of Communication for
Public Relation, Mass Communication,
Marketing, Communication and Advertising
Visual Design, Performing Arts
Communication, and International Relation
concentration. As for the post graduate
program of Communication, the concentrations
are the following: Corporate Communication,
Marketing Communication and International
Relation. To support the learning activity,
STIKOM-LSPR has 3 campuses in 2 locations.
Campus A is located on Wisma Dharmala
Gedung Annex Jl. Jend. Sudirman, while
Campus B and Campus C are located on
kompleks Sudirman Park, Jl. KH Mas Mansyur
Jakarta Pusat. STIKOM-LSPR provides
several facilities that can be accessed easily by
the students such as Career center which gives
services related to job placement services,
career guidance workshop, career counseling,
alumni mentorship program, intership
program, professional courses; and then
Research Center which can be accessed only
by student and teaching staffs; Internasional
Workshop and Seminar; Conseling Services;
Media Center, including Mini TV Studio,
Editing Room, and Campus Radio Station;
Reading Room; Computer Laboratory; English
Division; LSPR Club Activitiest; and Cafetaria
and Refreshment Area. Since 1992, STIKOM-
LSPR has successfully produced 14.312
graduates from undergraduate and
postgraduate program which spread nationally
and internationally. Since 2011, STIKOM-
LSPR has held LSPR Alumni Award which is
given to the alumni that gives meaningful
contributions to society as well as to alumni
who conducts a significant communication to
the community. The award includes these
sectors: Public Relation, Marketing, Mass
Communicatin, Advertising and Performing
Arts (Source: STIKOM-LSPR, 2013).
Like other private education institutions,
STIKOM-LSPR also does some efforts to
build student loyalty in order to ensure that the
undergraduate students will continue their

International Journal of Information Technology and Business Management 29
th December 2013. Vol.20 No.1
© 2012-2013 JITBM & ARF. All rights reserved
ISSN 2304-0777 www.jitbm.com
72
postgraduate study in STIKOM –LSPR.
However, the factual calculation shows that
there are many undergraduate alumni who are
not loyal to STIKOM-LSPR, in other words,
continue their study in other institutions other
than STIKOM-LSPR. Moreover, the number
of postgraduate students keeps on declining.
The total of postgraduate students in batch 6 =
102, batch 7 = 98, and batch 8 = 70. This
condition is very unbeneficial for the
development of STIKOM-LSPR, especially in
facing a massive and fierce competition among
private education Institutions.
There are at least five potential
factors/variables contributing to this
phenomenon; they are education service
quality, university image, tuition fee,
satisfaction and trust. In reality, these five
contributing factors/variables can influence
students’ loyalty in continuing their study in
STIKOM-LSPR. When the students have a
positive perception towards education service
quality, university image, tuition fee, feel
satisfied and have a trust towards the school,
then the students tend to be loyal and willing to
continue their study on that particular school.
On the contrary, when the students have a
negative perception towards education service
quality, university image, and tuition fee, feel
dissatisfied and distrust the school, then the
students tend to be not loyal and unwilling to
continue their study on that particular school
and prefer to continue their study on other
school. The preceding description shows that
there is a disloyalty phenomenon among
private education institution graduates towards
their school. This phenomenon can be
examined causally from education service
quality, university image, tuition fee, and
satisfaction and trust perspective. On the other
hand, there is still a gap research related to
those variables. The first gap is there is no
research that simultaneously investigates the
effect of service quality, image and tuition fee
towards trust and satisfaction, as well as its
impact on students’ loyalty. The existing
researches only investigate them partially so
that they cannot give a more comprehensive
explanation regarding the factors that influence
students’ loyalty. The second gap is the fact
that the past researches still show a different
and varied result for the study, as can be seen
on Table 1 below:
Table 1: Past Research Result
No Variables Researcher Study Object Result
1 The effect of
Service
Quality on
Loyalty
Bloemer, de Ruyter
and Peeters (1998)
Service company
which includes
train, restaurant,
travel agency and
entertainment
company.
Service quality has an
effect towards loyalty
Yaacob, Ismail and
Ismail (2008)
Wu (2011)
Telecommunication
Industry
Hospital
Service quality does not
have any correlation
with loyalty
2 The effect of
Image towards
Loyalty
Helgesenand Nesset
(2007)
Brunner, Stocklin and
Opwis (2008)
Cengiz, Ayyildiz and
Bunyamin (2007)
Higher Education
Institution
Train
Bank
Image has an effect
towards loyalty
Ball, Coelho and
Vilares (2006)
Bank Image does not have
any effect towards
loyalty and has a
negative effect
coefficient.

International Journal of Information Technology and Business Management 29
th December 2013. Vol.20 No.1
© 2012-2013 JITBM & ARF. All rights reserved
ISSN 2304-0777 www.jitbm.com
73
No Variables Researcher Study Object Result
Aydin and Ozer (2004) Cellular
Telecommunication
Company
Image does not have
any effect towards
loyalty
Rojas-Mendez (2009) Higher Education
Company
Image does not have
any effect towards
loyalty
3 The effect of
Trust towards
Loyalty
Flavian and Guinaliu
(2006)
Dagger and O’Brien
(2010)
Ndubisi (2009)
Hennig-Thurau,
Langer, and Hansen
(2001)
Information
Technology
Service Company
Bank
Higher Education
Institutions
Trust has an effect
towards loyalty
Mäntymäki and Salo
(2010)
Social Virtual
Worlds
Integrity as the
dimension of trust does
not have any effect
towards one of trust
dimension, which is the
intention to use product
continously
4
The Effect of
Price/Fee
towards
Loyalty
Garbarino and Lee
(2003) Internet User
Price has a positive
effect towards loyalty
Yieh et al. (2007) Car Owner Price does not have any
effect toward loyalty
Regarding the phenomena and the
preceding gap research, this study tries to give
a confirmation in order to ensure the effect of
each variable toward loyalty in higher
education institution. The objective is to be
able to create a model that can accurately
explain factors influencing students’ loyalty.
Based in this urgency, this study is titled THE
LOYALTY MODEL OF PRIVATE
UNIVERSITY STUDENT (Study Case:
STIKOM London School of Public Relation)
Jakarta.
Research Problem
Based on the research background,
several research problems are proposed:
a. How is the effect of service quality,
image, tuition fee, satisfaction and trust
towards students’ loyalty?
b. How is the effect of service quality, image
and tuition fee towards students’ trust?
c. How is the effect of service quality, image
and tuition fee towards students’
satisfaction?
Research Objective
Based on the proposed research
problems, the objectives of this study are to
discover and analyze:
a. The effect of service quality, image,
tuition fee, satisfaction and trust towards
student loyalty
b. The effect of service quality, image and
tuition fee towards student trust.
c. The effect of service quality, image and
tuition fee towards student satisfaction.
Research Limitation
The scope of this research is limited on
2 aspects, research object and research
variable. The object is limited on STIKOM
London School of Public Relation, Jakarta.
While the variable used in this variable are
only up to service quality, higher education

International Journal of Information Technology and Business Management 29
th December 2013. Vol.20 No.1
© 2012-2013 JITBM & ARF. All rights reserved
ISSN 2304-0777 www.jitbm.com
74
institution image, tution fee, satidfaction, trust
and loyalty.
Novelty
The superior novelty of this study is
the formation of whole empiritical model about
the effect of service quality, higher education
institution image and tuition fee towards
satisfaction and trust and also its implication
towards loyalty by using Structural Equation
Modeling(SEM) as a tool analysis. This study
uses a higher education institution, specifically
STIKOM London School of Public Relation,
Jakarta as the study object.
LITERATURE REVIEW
Service Quality
Wyckoff (in Williams and Bueswell, 2003:47)
defined service quality as the the degree of
excellence intended that meets customer
requirements. Other definition about service
quality was stated by Parasuraman et al, as
quoted by Shahin (2007:2) which implies that
service quality is the difference between
expected service with actual service. If the
expectation is higher than the actual
performace, then the experienced quality will
be lower compared to the satisfaction, because
the satisfaction cannot be triggered.
The service quality approach that is
widely used on marketing research is the one
developed by Zeithaml, Parasuraman and
Berry (1990:2), known as SERVQUAL
(service quality model). This approach is
developed based on the comparison of two
main factors, perceived perception and
expected service. This model has 5
dimensions, as following:
a. Tangibles, which is the appearance or
physical facility, equipment,
employee and telecommunication
tools.
b. Reliability, which is the ability to give
a promised service accurately
c. Responsiveness, which is the
willingness to help the consumers and
the ability to give a fast service.
d. Assurance, which is knowledge,
politeness and employees’ ability to
deliver trust and confidentiality.
e. Emphaty, which is the degree of care
and attention given to the consumers
by the employee.
Based on above description, it can be
concluded that service quality is the degree of
excellence of organizational activities in
fulfilling and meeting consumers needs and
requirements. The indicators of service quality
are tangibles, reliability, responsiveness,
assurance and emphaty.
Image
Image can be variedly defined, depends on the
context and the emphasizing. Kotler
(2000:553) proposed that image is the set of
beliefs, ideas and impressions held by a person
regarding certain object. Therefore, according
to Kotler, image is not only an impression
towards object, but also the belief and idea. As
for Newsom et al (2010:280), image is an
impression of a person or society towards
person, corporate or institution.
Related to organization image,
whether it is a business, social and education
organization, it can use the same definition as
the corporate image. Based on Picton and
Broderick (2001:25), company image is an
impression created by company’s identity,
which is actually a perception about company
owned by the society. Corporate image is a
representation of what is in society mind that
involves a perception and feeling towards the
corporation. Chattananon et al (2007:232)
stated that corporate image has two main
components, function and emotion. Function
component related to intangible characteristic
that can be easily measured, while emotion
component related to psychology dimensions
that can be manifested by evaluation, feeling,
and attitude towards the corporation.
Lopez et al (2011: 1603) summarize
the definition of image based on several
science disciplines, such as organizational
behavior, psychology, sociology, strategic and
marketing. Based on organizational behavior
discipline, image is defined as individual
perspective in contemplating his/her
organization. While form psychology
discipline, image is a symbolic relationship
between organization and related parties. As
for sociology discipline, image is a
representation from inner mind (feeling) and
fabrication (communicated illustration). In

International Journal of Information Technology and Business Management 29
th December 2013. Vol.20 No.1
© 2012-2013 JITBM & ARF. All rights reserved
ISSN 2304-0777 www.jitbm.com
75
strategy discipline, image relates to the
creation of external corporate image. In
marketing discipline, image is a perception,
mental illustration or impression from the
society towards certain organization.
To measure corporate image, several
ways can be taken, one of them is by viewing
its configuration element. Image element is
aspects that become an object of corporate
image. This image can also be the reference to
measure corporate image. Based on Šmaižieno
and Oržekauskas (2006: 91), image has three
main components:
a. Visual element; this element relates to
tangible organizational aspect. It
includes organization style, lay out,
employee’s appearance, brand,
exterior, interior, cleanness, lighting
and so on
b. Verbal element; this element relates to
verbal information that can be
exposed to consumer or shareholder,
the examples are advertisement,
public discussion, and so on
c. Behavioral element; this element
relates to management and output of
certain organization. The examples
are financial report, strategic position,
product quality and management,
corporate social responsibility and so
on.
Based on description above, it can be
concluded that image is a set of belief, idea,
impression or illustration formed on person’s
mind about certain objects, which originated
from his/her knowledge and experience,
measured by several indicators: visual, verbal
and behavior.
Cost/Fee
In this study, cost theory refers to price as it
has the same essence. The term of price relates
to money as the value representation of product
or service. Price is one of the factors that have
a major role in consumer decision-making
process, especially in price allocation and
information. The role of price allocation is the
price function in helping consumers to decide
how to get a maximum expected utility based
their purchasing power. The most common
perception related to price is that the expensive
price reflects a high quality (Tjiptono, 2005;
12).
Kotler (2003, 470) stated that price is
a marketing mix elements that generates
revenue and in the other hand consumes cost.
Price is the easiest to be adjusted marketing
mix. Price also communicates the value
positioning of certain product or service from
company to the market. According to these
definitions, price has a wide scope because it is
related to revenue, cost and value
communication tools. For Buttle (1995: 235),
price is the sum of all consumers’ sacrifice in
getting benefit of certain product. As for
Gregorius (2002: 152), price is a visible aspect
for the consumers. For the consumers who do
not really understand about technical aspect,
such as in electronic or automotive product,
price is the only determining factor that they
understand. Price also often be considered as
the indicator of quality
Lovelock and Wirtz (2007: 630)
define price as the use of money, time and
effort that spent by consumers in buying and
using service. On the other hand, Gitosudarmo
(2008: 228) stated that price is a sum of money
needed to acquire certain product, service or
combination of those two.
In measuring consumers’ perception
towards fee or price that set by the producers,
the price satisfaction dimensions developed by
Matzler et al. (2006: 222) can be used. It
includes 5 dimensions, as following:
a. Price transparancy, which states that the
company should be clear, comprehensive
and relevant in setting the price. This
dimension includes several aspects like
price transparancy, service that gives
information relted to price, completenss,
accuracy, direct information about price
and explicit information about price..
b. Price quality ratio, which is the
comparation between service quality and
monetary cost. This dimension is
generated from comparing the product or
service quality with the fee.
c. Price relative, which is the offered price
from the competitor. This comes from
comparing company’s price with
competitor’s price.
d. Price confidence, which is the assurance
that the price is satisfying for the

International Journal of Information Technology and Business Management 29
th December 2013. Vol.20 No.1
© 2012-2013 JITBM & ARF. All rights reserved
ISSN 2304-0777 www.jitbm.com
76
consumers. In other words, price is
transparant and constanlty low.
e. Price reliability, which is the fulfillment of
the expected or perceived price and the
prevention of negative price shock. This
relates to price stability, no hidden price
and a precise price change.
f. Price fairness, which relates to consumers’
perception whether the price difference
betwen market price and competitor’s
price makes sense, acceptable and fair.
This dimension relates to the correlation
between price and social price, no abuse in
price setting and no price discrimination.
From preceeding desription, it can be
summarized that fee is the sum of sacrifice in
form of money to get certain product or service
which measured by several indicators:
transparancy, quality ration, relative price,
confidence, reliability and fairness.
Consumer satisfaction
Experts define consumer satisfaction
from many different perspectives. Morgan and
Hunt (1994) categorize consumer satisfaction
definition into several perspectives: normative
deficit definition, equity definition, normative
standard definition, procedural fairness
definition and attributional definition. Based
on normative deficit definition, consumer
satisfaction is the comparison between actual
outcome and culturally accepted outcome.
Based on equity perspective, consumer
satisfaction is the comparison of benefit
acquired from social exchange. If the benefit is
not same as the expected, then the consumers
will feel dissatisfied. Normative standard
perspective defines consumer satisfaction as
the comparison between actual outcome and
consumers’ standard expectation (the one
formed form experience and belief regarding
the outcome that they should get from certain
brand). Procedural fairness perspective states
that consumer satisfaction is the
belief/perspective of the consumers that they
have been treated fairly. While attributional
perspective states that satisfaction is not only
determined by the existence of expectation
disconfirmation, but also by the source of
disconfirmation.
Chan et al, (2003) also classified
consumer satisfaction definition into three
perspectives: product attribute perspective,
seller perspective and consumer experience
perspective. Product perspective definitions of
consumer satisfaction are proposed by
Parasuraman et al. (1990) and Tse and Wilton
(1988). They defined consumer satisfaction as
the respond towards evaluation of the
difference experienced in comparison between
expectation and actual performance of the
product. Seller perspective definitions are
proposed by Andreassen (2000), Boulding et
al., (1993), Holbrook and Corfman (1985), and
Johnson et al. (1995) which defined consumer
satisfaction as the evaluative assessment after
consumption or transaction. Consumer
perspective definition, as stated by Fornell
(1992) and Johnson and Fornell (1991),
defined consumer satisfaction as the overall
evaluation, which based on overall transaction
and consumption experience of certain product
on a particular period.
For Swan and Bowers (1993),
satisfaction is a post-purchased behavior.
Consumer satisfaction involves cognitive and
affective aspect in pre-purchased, purchased
and post-purchased phase. The evaluation of
consumer satisfaction is very heterogenetic. It
is different among the customers, point of
contact and companies, in that case, the
comprehension about consumer satisfaction
need to be explored and strengthened in all
kind of companies and industries.
Oliver and Zeithaml et al. (in Jun et
al., 2004: 822) defined consumer satisfaction
as the customer’s post-purchase comparison
between pre-purchase expectation and
performance received. While Gaspersz (2002)
defined consumer satisfaction as a condition
where consumers needs and expectation could
be fulfilled by the product consumed. Gasperz
then formulate consumer satisfaction
mathematically, where consumer satisfaction
(Z) is the ratio between the actual performance
quality experienced by the consumer (X) and
the needs, wants and expectations of the
consumers (Y). Meanwhile, Chun and Davis
stated consumer satisfaction could be defined
as the pleasant surprise experienced by the
consumers when getting the unexpected value
and satisfaction from the product. Olsen et al. (in Espejel et al., 2008:
867) defined consumer satisfaction as the
overall evaluation of feeling towards a product
or service. Then Giese and Cote (in Espejel et
International Journal of Information Technology and Business Management 29
th December 2013. Vol.20 No.1
© 2012-2013 JITBM & ARF. All rights reserved
ISSN 2304-0777 www.jitbm.com
77
al., 2008: 867) defined three basic components
of satisfaction concept: (1) an emotional or
cognitive response (2) a response related to
particular focus, like expectation, product or
consumption experience, and (3) response in
certain occasion. Besides that, Bleuel (2007:1)
defined consumer satisfaction as the conviction
that the product and service performance has
already met consumer expectation. It is further
explained that consumer satisfaction happened
when the perception of the value form
purchasing certain product or service exceeds
the sacrifice spent for getting the product. On
the other hand\, Kotler and Keller (2012: 127)
defined consumer satisfaction as a person’s
feelings of pleasure or disappointment
resulting from comparing a product’s
perceived performance (or outcome) in relation
to his or her expectations.
Vinagre and Neves (2008) used three
dimensions to measure consumer satisfaction.
The first dimension is expectation. Expectation
is the focus of satisfaction literature
investigation. In this case, satisfaction happens
when product or service performance exceeds
or at least same with consumer expectation.
The second dimension is emotion, which is the
set of response commonly happens during
consumer experience. Consumer satisfaction in
a higher extent involves positive and negative
emotion. The third dimension is involvement.
In consumer psychology, involvement is a
motivational construct that influences the set of
consumer behavior. Although involvement is a
complex construct, it is predicted that this can
be seen when the service is congruent with
service characteristic and consumer needs.
Referring to preceding explanation, then to
measure consumer satisfaction, this study will
use expectation, emotion and involvement
indicators.
Based on the description above, it can
be concluded that consumer satisfaction is a
person’s pleasant or disappointing feeling upon
comparing product/service performance in
relation of his/her expectation where this
feeling is measured by following indicators:
expectation, emotion and involvement.
Trust
Trust often involves two or more
parties who have interaction or interest. In the
context of producer and consumer relation,
based on Ganesan (1994: 3), trust is the
credibility which shows how far the consumer
believe that the producer has an ability to
conduct certain activity effectively and
reliably. Trust relates to company’s intention to
rely on its business partner. Besides that, trust
is also benevolence because it is based on how
far the company believes that its partner has a
beneficial intentions and motives.
Besides that, Rousseau et al (in Mollering,
2006: 7) gave a widely accepted definition of
trust, which is a psychological condition where
a person is willing to accept an unpleasant
condition because he/she expects a positive
expectation of others’ willingness or behavior.
The similar view is stated by Mayer et al (in
Molleting, 2006: 8) which defined trust as the
willingness of a party to accept unpleasant
behavior from other party where this
willingness is based on the expectation that the
other party will do an important thing for the
trust giver. For Robbins and Judge (2—7: 392),
trust is a positive expectation that other party-
whether by words, action or decision- would
not take any chance to hurt him/her. Then
according to McShane and Von Glinow (2008:
120), trust referred to a positive expectation
towards someone in a risky condition. Trust
can also be defined as rely the fate onto
someone or other party. Meanwhile, Colquitt et
al. (2009: 219) defined trust as the willingness
to rely himself/herself onto the authority,
which based on the positive expectation of the
action and attention of that authority. Trust in the context of producer and consumer
relation is very important to be developed and
organized in order to retain a long-term
commitment. Building a trust is not easy
because the process tends to be slow. This
happens because at first consumer and
producer need to have a satisfying experience
as the base of the trust. From consumers’
perspective, a big company would trust and
develop a long-term commitment with the
supplier if the supplier is dedicated (Mullins
and Walker Jr., 2010: 140). Related to this
term, Kotler (2003:156) stated that trust is a
cognitive component of psychological factor.
Trust relates to a conviction that something is
right or wrong based on proof, belief,
authority, experience and intuition. Then Sitkin
et al. (Sirdeshmusk, 2010: 150), proposed a
basic definition of trust which defined trust as

International Journal of Information Technology and Business Management 29
th December 2013. Vol.20 No.1
© 2012-2013 JITBM & ARF. All rights reserved
ISSN 2304-0777 www.jitbm.com
78
the psychological condition in form of
intention to accept the uncertain positive
expectation regarding someone’s intention or
behavior. Thus, trust has two main definitions.
The first is the positive expectation of
consumer related to exchange intention and
behavior which focusing the attention to the
belief that the exchanging partner will be
responsible, show an integrity and harmless.
Second is a behavior where the trust related to
one’s intention to rely onto exchange partner to
accept contextual uncertainty, which focusing
on behavior tendency of one person to
exchange partner.
Robbins and Judge (2007: 392-393)
mentioned four key dimensions of trust
concept, as following:
a. Integrity, which refers to honesty and
righteousness
b. Competency, which relates to knowledge,
technical and interpersonal skill possessed
by an individual
c. Consistency, relates to reliability,
predicting ability and individual
evaluation in handling certain situation
d. Openness, according to DeVito (2001:
138), openness refers to three
interpersonal communication aspects,
which are: willingness to revelation of
self, as long as that revelation is adequate;
willingness to be honest towards
someone’s opinion; having feelings and
thoughts
Meanwhile, Mayer et al. (1995) and
Rindings et al. (2002) (in Casalo et al., 2007:
779) proposed that trust consist of three
aspects, which are competence, honesty and
benevolence. Competence relates to consumer
perception regarding others’ ability and
knowledge in fulfilling their relation and needs
(Coulter dan Coulter, in Casalo et al., 2007:
779). Honesty is a conviction that two related
parties will stick to each words, fulfill each
promise and sincere. (Gundlach and Murphy in
Casalo et al., 2007: 779). Benevolence is the
belief that someone is interested in others’
well-being. Specifically, benevolence is a
condition where other party is willing to make
an effort in order to reach collective goals.
Based on explanation above, we can
conclude that trust is a positive expectation in
form of inner conviction that other party can
fulfill the expectation. Trust can be measured
by following indicators: integrity, competency,
consistency, openness and benevolence.
Loyalty
Javalgi and Moberg (1997: 167) stated that
loyalty can be viewed from two perspectives.
The first one is from behavioral term
perspective, it is based on the quantity bought
and measured by monitoring buying frequency
and switching cost. The second one is from
attitudinal perspective, which is the merger of
consumer preference and tendency towards
certain product to determine loyalty level.
Caruana (2002: 820) updated the
loyalty concept by including cognitive
component. In this case, loyalty includes the
conscious alternative evaluation process in
purchase decision making. Loyalty based on
cognitive component is reflected on the first
product or service crossed on consumers mind
and the first product or service chosen of all
available alternatives. The current loyalty
concept has developed into loyalty of
intangible product (service). According to
Hurriyati (2006), loyalty is consumer
commitment to keep on repurchasing certain
product consistently in the future, even though
exposed to other company marketing effort,
which has a possibility to alter consumer
behavior. According to Oliver (1997: 392),
loyalty is a deeply held commitment to rebuy
or re-patronize a preferred product or service
consistently in the future. Meanwhile, East,
Hammund, Harris and Comad (2000: 72)
defined loyalty as a positive behavior towards
particular store or brand. Gremler (1999: 273)
explained that consumer loyalty is an extent
shown by the customer in repurchases
behavior, a positive attitude towards service
provider and a tendency to use service from the
same company when there is an urgency to
fulfill certain needs. For Gremler and Brown
(in Kotler, 2000: 74), customer loyalty is a
feeling of attachment to or affection for a
company’s people, products or service.
Fay (in Kendrick, 1998: 314) stated that
consumer loyalty is a condition where the
consumers consistently spend their allocated
budget to buy a product or service form the
same producer. A similar definition is also
proposed by Newman and Werbel, and by

International Journal of Information Technology and Business Management 29
th December 2013. Vol.20 No.1
© 2012-2013 JITBM & ARF. All rights reserved
ISSN 2304-0777 www.jitbm.com
79
Bellenger and Dwyer (in Bloemer and de
Ruyter, 1999: 1086). They stated that in
reality, consumer loyalty is a situation where
certain products crossed in consumers’ mind
when they have to make a decision regarding a
purchase. Meanwhile, Sheth and Mittal (2004:
126) said that consumer loyalty is a consumer
commitment towards particular brand, store or
retailer, shown by a very positive attitude and
reflected by a consistent purchase behavior. In
a service marketing context, Bendaputi and
Berry (in Tjiptono, 2005: 42) defined
consumer loyalty as a response related to a
pact or promise to stick to the commitment of
continuing relation, and it is usually reflected
by a continuing purchase behavior towards the
same service provider, whether the motif is
because dedication, or pragmatic constraint.
According to Zeithaml (in Yu and
Dean, 2001: 243), there are four aspects can be
used to measure loyalty. The first one is
positive word of mouth. This positive
communication can be in form of
recommending to friends, telling positive
things about the product and encouraging
others to use the product. The second is
complaint behavior. This is shown by
complaining about the problem in using the
product to the employee or the supervisor. The
third one is switching behavior. This is shown
by the effort to switch to other company’s
product, tempted by other company’s offer and
accepting other company’s offer. The fourth
one is willingness to pay more. This aspect is
related to consumer willingness to keep on
buying and paying for the product although
there is an increase in the product’s price.
Based on description above, it can be
concluded that loyalty is a consumers’
intensity portrayed by repurchase behavior,
positive attitude towards the company as a
service provider and a tendency to use the
same service when the needs arise. This is
measured by following indicators: positive
word of mouth, no switching behavior, no
complaint behavior and willingness to pay
more.
Relevant Research
A research form Bloemer and de
Ruyter (1999) proved that service quality has
an effect towards loyalty. It is also proven by a
research from Yu, Chang and Yuang (2006)
which shows that service quality has a positive
relation with loyalty. This finding is also
supported by a research from Roostika (2011)
which proved that service quality has an effect
towards loyalty
A research form Cengiz, Ayyidiz and
Bunyamin (2007) concluded that company
image has an effect towards loyalty. Brunner,
Stocklin and Opwis (2008) who conducted a
research about satisfaction, company image
and loyalty, found out that company image
have a significant effect towards loyalty. In the
context of education environment, a research
from Helgesenand Nesset (2007) can be used
as a reference. It showed that image has an
impact towards loyalty.
A research in service industry
(sanatorium) from Virvilaite, Saladiene and
Skindaras (2009) which used 112 respondents
and analyzed by OLS regression showed that
price has an effect towards loyalty.
A research from Beerli, Martin and
Quintana (2004) which investigated about the
loyalty in banking industry showed that
consumer satisfaction is a significant factor in
influencing the consumer loyalty. This
research is also supported by a research from
Martin-Consuerga, Molina and Esteban (2007)
which showed that consumer satisfaction is
significantly influencing loyalty. Espejel,
Fandos and Flavian (2008) conducted a
research about consumer satisfaction’s key role
in food industry and then analyzed this
research using SEM showed that satisfaction
has a significant effect towards loyalty.
Ndubisi (2009) proved that trust is a significant
variabel in influencing loyalty. This is also
supported by Dagger and O’Brien (2010)
which shown that trust has a significant impact
towards loyalty. In the education institution
context, a research conducted by Hennig-
Thurau, Langer and Hansen (2001) also proved
that trust has an effect towards loyalty.
A research from Chen (2006) shown
that service quality is significantly influencing
trust. Specifically, in the education
environment context, a research conducted by
Rojas-Mendez et al (2009) showed that service
quality has an impact towards trust. A research
from Ball, Coelho and Vilares (2006) showed
that image has a significant impact to trust.
This is also supported by a research by Lin and
Lu (2010) which portrayed that image has an

International Journal of Information Technology and Business Management 29
th December 2013. Vol.20 No.1
© 2012-2013 JITBM & ARF. All rights reserved
ISSN 2304-0777 www.jitbm.com
80
effect towards trust. A research from Garbarino
and Lee (2003) showed that dynamic pricing
has an effect towards trust. A research from
Ranaweera and Parabhu (2003) showed that
consumer satisfaction has a significant relation
with trust. This result is also supported by a
finding in Akbar and Parvez (2009) research,
which discovered that consumer satisfaction,
has a significant effect towards trust.
A research form Bei and Chiao (2001)
showed that consumer perception towards
service quality has an effect on consumer
satisfaction. A research conducted by Amin
and Isa (2008) also showed that service
quality, which projected by physical evidence,
responsiveness, reliability, assurance, empathy,
and compliance has a significant impact on
consumer satisfaction. A research from Padma,
Rajendran and Lokachari (2010) which had a
hospital in Indina as object and 204 patients
and also nurse as a subject and analyzed by
regression, showed that service quality has a
significant effect on satisfaction. A research
from Alves and Raposo (2010) proved that
image has an impact on student satisfaction.
Palacio, Meneses and Perez (2002) also
conducted a research about an effect of image
towards student satisfaction in one of Spain
University. The result of this research is that an
image has an effect towards satisfaction. A
research from Hermann et al. (2007) showed
that price fairness has a direct relation with
consumer satisfaction. The relevance of all this
researches with this study is the purpose of the
study that is testing the effect of price towards
consumer satisfaction
International Journal of Information Technology and Business Management 29
th December 2013. Vol.20 No.1
© 2012-2013 JITBM & ARF. All rights reserved
ISSN 2304-0777 www.jitbm.com
81
Research Framework
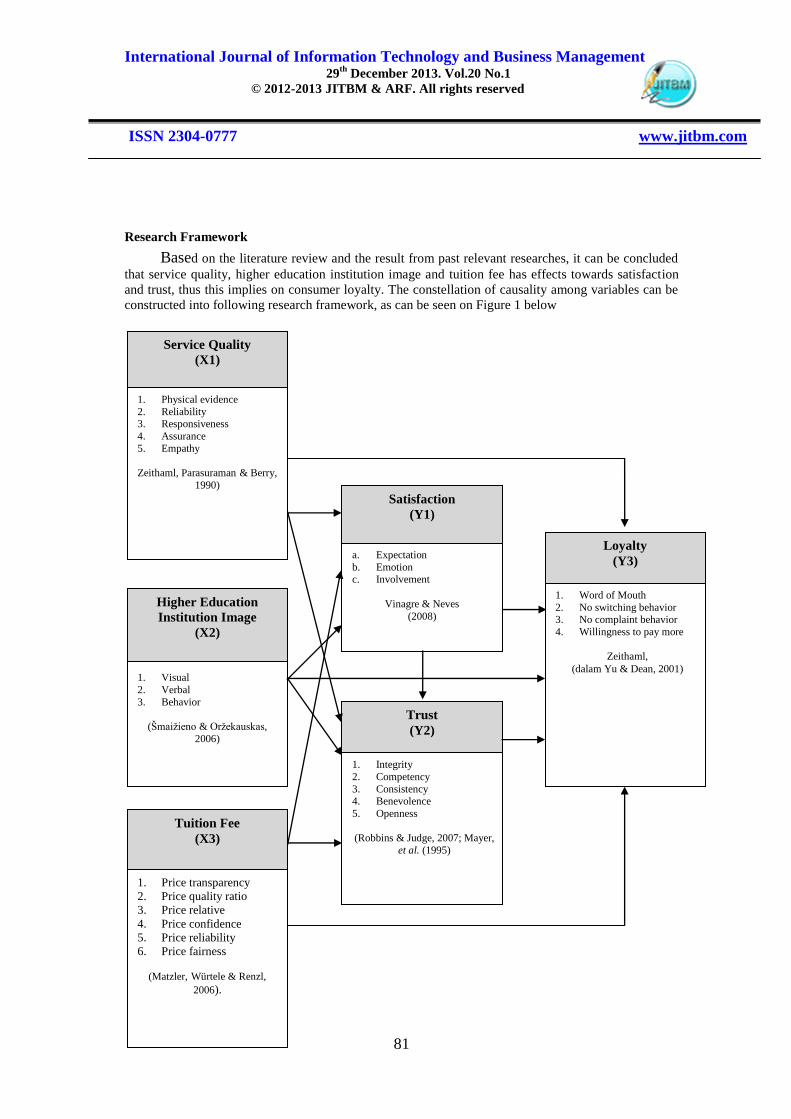
Based on the literature review and the result from past relevant researches, it can be concluded
that service quality, higher education institution image and tuition fee has effects towards satisfaction
and trust, thus this implies on consumer loyalty. The constellation of causality among variables can be
constructed into following research framework, as can be seen on Figure 1 below
Service Quality
(X1)
1. Physical evidence
2. Reliability 3. Responsiveness
4. Assurance
5. Empathy
Zeithaml, Parasuraman & Berry,
1990)
Higher Education
Institution Image
(X2)
1. Visual
2. Verbal
3. Behavior
(Šmaižieno & Oržekauskas,
2006)
Tuition Fee
(X3)
1. Price transparency
2. Price quality ratio
3. Price relative
4. Price confidence
5. Price reliability
6. Price fairness
(Matzler, Würtele & Renzl,
2006).
Trust
(Y2)
1. Integrity
2. Competency
3. Consistency 4. Benevolence
5. Openness
(Robbins & Judge, 2007; Mayer,
et al. (1995)
Loyalty
(Y3)
1. Word of Mouth
2. No switching behavior 3. No complaint behavior
4. Willingness to pay more
Zeithaml,
(dalam Yu & Dean, 2001)
Satisfaction
(Y1)
a. Expectation
b. Emotion
c. Involvement
Vinagre & Neves
(2008)

International Journal of Information Technology and Business Management 29
th December 2013. Vol.20 No.1
© 2012-2013 JITBM & ARF. All rights reserved
ISSN 2304-0777 www.jitbm.com
82
Figure 1: Research Framework
Research Model
This study uses Structural Equation Modeling analysis, with a research model shown in Figure
2 below:
Figure 2: Research Modell
Notes:
1 = Exogenous Latent Variabel Service
Quality (X1)
2 = Exogenous Latent Variabel Higher
Education Institution Image (X2)
3 = Exogenous Latent Variabel Tuition Fee
(X3)
1 = Endogenous Latent Variabel
Satisfaction (Y1)
2 = Endogenous Latent Variabel Trust (Y2)
3 = Endogenous Latent Variabel Loyalty
(Y3)
γ = The effect of exogenous latent variabel
on endogenous latent variable
= The effect of endogenous latent variabel
on endogenous latent variable
= Relation between exogenous and
endogenous latent variable with their
indicators
= Measurement error of exogeneous
variable indicator
= Measurement error of endogenous
variable indicator
= Error in equation, which is between
exogenous variable and endogenous
variable or between endogenous
variable and endogenous variable

International Journal of Information Technology and Business Management 29
th December 2013. Vol.20 No.1
© 2012-2013 JITBM & ARF. All rights reserved
ISSN 2304-0777 www.jitbm.com
83
Research Hypothesis
Based on the result of relevant
researches and research framework, these
following hypotheses are proposed:
H1: There is a positive effect of service
quality on student loyalty
H2: There is a positive effect of higher
education institution image on student loyalty
H3: There is a positive effect of tuition fee
on student loyalty
H4: There is a positive effect of
satisfaction on student loyalty
H5: There is a positive effect of trust on
student loyalty
H6: There is a positive effect of service
quality on student trust
H7: There is a positive effect of higher
education institution image on student trust
H8: There is a positive effect of tuition fee
on student trust
H9: There is a positive effect of
satisfaction on student trust
H10: There is a positive effect of service
quality on student satisfaction
H10: There is a positive effect of higher
education institution image on student
satisfaction
H10: There is a positive effect of tuition fee
on student satisfaction
RESEARCH METHODOLOGY
Research Design
The method used in this research is
survey method with causal design
Population and Sampel
Research population is 1088 students of
STIKOM London School of Public Relation
Jakarta, with this specification: 920 students
from sixth and seventh semester undergraduate
program (S1) and 168 students from graduate
program (S2). The number of samples used in
this research is 260 students (10 x 26 research
indicators). The method of sample collection is
proportional random sampling, based on study
level and concentration determined by random
table.
Operational Definition of Research Variable
Variables in this research are service
quality, image, tuition fee, satisfaction, trust
and loyalty. In order to be able to measure all
variables, we need to operationalize the
variables into the operational definition as
following:
Table 1: Operationalization of Variables
No Definition of Variable Indicator Source Scale
1.
Service quality is the degree of
excellence of organizational activities
in fulfilling and meeting consumers
needs and requirements.
a. Physical Evidence
b. Reliability
c. Responsiveness
d. Assurance
e. Empathy (Zeithaml, Parasuraman &
Berry, 1990.)
Questionnaire
with 1-5 Likert
Scale
Ordinal
2
Image is a set of belief, idea,
impression or illustration formed on
person’s mind about certain objects,
which originated from his/her
knowledge and experience
1. Visual
2. Verbal
3. Behavior
(Šmaižieno & Oržekauskas,
2006)
Questionnaire
with 1-5 Likert
Scale
Ordinal

International Journal of Information Technology and Business Management 29
th December 2013. Vol.20 No.1
© 2012-2013 JITBM & ARF. All rights reserved
ISSN 2304-0777 www.jitbm.com
84
No Definition of Variable Indicator Source Scale
3
Fee is the sum of sacrifice in form of
money to get certain product or
service
a. Price Transparency
b. Price Quality Ratio
c. Price Relative
d. Price Confidence
e. Price Reliability
f. Price Fairness
(Matzler, Würtele &
Renzl, 2006).
Questionnaire
with 1-5 Likert
Scale
Ordinal
4
Consumer satisfaction is a person’s
pleasant or disappointing feeling
upon comparing product/service
performance in relation of his/her
expectation
a. Expectation
b. Emotion
c. Involvement
(Vinagre & Neves, 2008)
Questionnaire
with 1-5 Likert
Scale
Ordinal
5
Trust is a positive expectation in form
of inner conviction that other party
can fulfill the expectation
a. Integrity
b. Competence
c. Consistency
d. Benevolence
e. Openness
(Robbins & Judge, 2007;
Mayer, et al., 1995)
Questionnaire
with 1-5 Likert
Scale
Ordinal
6
Loyalty is a consumers’ intensity
portrayed by repurchase behavior,
positive attitude towards the company
as a service provider and a tendency
to use the same service when the
needs arise
a. Word of Mouth
b. No Switching Behavior
c. No Complaint Behavior
d. Willingness to Pay More
(Zeithaml, in Yu & Dean, 2001)
Questionnaire
with 1-5 Likert
Scale
Ordinal
Data Collection Technique and Instrument
Testing
This study uses questionnaire to
collect the data. The questionnaire uses likert
scale with following answering alternatives:
Very Agree/Always (5), Agree/Often (4),
Slightly Disagree/Sometimes (3),
Disagree/Seldom (2), Very Disagree/Never (1).
Before using this questionnaire to gather the
research data, we will firstly test the validity
and reliability of the questionnaire. Validity
test will be conducted by using Product
Moment Pearson Correlation, while the
reliability test will be conducted by using
Alpha Cronbach formula (Azwar, 2003: 43)
Data Analysis Technique
The hypothesis testing is conducted by
Structural Equation Modelling approach.
According to Hair, et al (1995), SEM is often
used in various context of research like in
education, marketing, psychology, sociology,
management, testing and measurement, health,
demography, organizational behavior and
biology. The basic formulation of Structural
Equation Modeling can be summarized as
following:
mnmmmm
n
n
XXXXY
XXXXY
XXXXY
....
....
....
321
223222112
11312111
To ensure that the result of data
analysis in not bias, the data used in SEM
analysis should meet several assumptions, or
BLUE test (Best Linear Unbiased Estimator).
According to Ghozali and Fuad (2005: 36),
there are at least two tests that must be

International Journal of Information Technology and Business Management 29
th December 2013. Vol.20 No.1
© 2012-2013 JITBM & ARF. All rights reserved
ISSN 2304-0777 www.jitbm.com
85
conducted in using the LISREL: normality test
and multicollinearity test. According to
Ferdinand (2002), the collecting and analyzing
procedure when using SEM must meet these
assumptions:
a. Sample size: the requirement of sample
size in SEM is at least 100, or has to use
ratio of 5 observed variable for every
estimated variable
b. Normality and linearity: The distribution
of the data should meet the normality
assumption in order to be qualified to be
used in the study
c. Outliers: Outliers is a data that has a
unique characteristic and different with
any other data. It appears as an extreme,
whether in a single or combined variable.
d. The scale of independent and dependent
variable of the study must be at least in
interval form
According to Ghozali and Fuad (2005:
157), there are several steps in structural
equation modeling:
a. Model conceptualization. This step relates
to hypothesis development (based on
relevant theory) as a basis of combining
the latent variable with other variable
latent, and with the indicators. In other
words, a formulated model is a perception
of how latent variable related to each other
based on theory and proof from our study
discipline. The model conceptualization
also has to reflect the measurement of
latent variable through various measurable
indicators
b. Path diagram construction. This step will
facilitate us in visualize the proposed
hypothesis in model conceptualization
step. Although Lisrel can be operated by
using equation, the path diagram usage is
much recommended. Model visualization
will reduce error degree in model
conceptualization. The benefit of path
diagram construction will be much cleared
when we discuss another steps in SEM
c. Model specification and illustration of the
number of estimated parameter: the
analysis of data could not be conducted as
long as this step has been finalized.
LISREL program has two kinds of
language: LISREL programming language
and SIMPLIS. In LISREL programming
language, an extra caution is needed in
ensuring that the constructed model
already be represented on mathematical
model. As in SIMPLIS command, a
complex mathematical model is not
needed, and it is possible to write down
variable name and determine its
relationship by using transcription, as well
as basic mathematical symbol like equal to
(=) and arrow sign ()
d. Model Identification. The information
acquired from the data is tested to
determine whether this information has
already estimated the parameter in the
model. Here, a unique value for all
parameters must be acquired. If the unique
value cannot be acquired, then a model
modification may be conducted on order
to be able to do the identification before
doing the parameter estimation
e. Parameter estimation. After the structural
model can be identified, then the
parameter estimation can be discovered. In
this step, parameter estimation of the
model is acquired because LISREL as well
as AMOS program try to create a model-
based covariance matrix which congruent
with the observed covariance matrix.
Significance testing is conducted to
determine whether the parameter created
is significantly different with zero
f. Model fitness evaluation. A model is
considered to be fit of model-based
covariance is the same with observed
covariance matrix. Model fitness can be
measured based on several index fit (for
example RMSEA, RMR, GFI, CFI, TLI,
NFI, etc). Model fitness and its criteria
will be determined on the next chapter.
After conducting the model fitness
evaluation, then the research model is
tested to determine whether model
modification is needed or not. This
modification, however, should be based on
the relevant theory. g. The last step of this process is the cross-
validation of the model, which is testing
the fitness of the model to new data (or
validation of sub-sample acquired from
splitting-sample procedure). This cross-
validation is important if there is a
substantial modification conducted in the
original model.
International Journal of Information Technology and Business Management 29
th December 2013. Vol.20 No.1
© 2012-2013 JITBM & ARF. All rights reserved
ISSN 2304-0777 www.jitbm.com
86
SEM analyses used in this study are multi
sample analysis; because LISREL program can
be used to analyze data from various source
simultaneously (Ghozali and Fuad, 2005: 217).
In this study, the grouping of sample is based
on student loyalty level, which is the student
who are already loyal, and those who wants to
be loyal. Graduate students (S2) represent the
loyal category, while the under graduate
students (S1) represent the intend-to-be-loyal
category.
REFERENCE
1. Akbar, Mohammad Muzahid dan
Noorjahan Parvez. 2009. “Impact of
service quality, trust, and customer
satisfaction on customer loyalty.”, ABAC
Journal, Vol. 29, No. 1, 24-38.
2. Alves, Helena, Mário Raposo. 2010. “The
influence of university image on student
behaviour”, Internet Research, Vol. 15
Iss: 4, 447 – 470.
3. Amin, Muslim and Zaidi Isa. 2008. “An
examination of the relationship between
service quality perception and customer
satisfaction: A SEM approach towards
Malaysian Islamic banking, International
Journal of Islamic and Middle Eastern
Finance and Management, Vol. 1 No. 3,
2008.
4. Aydin, Serkan dan Gokhan Ozer, 2005.
“The analysis of antecedents of customer
loyalty in the Turkish mobile
telecommunication market,” European
Journal of Marketing, Vol. 39 No. 7/8.
5. Azwar, Saifuddin. 2003. Reliabilitas dan
Validitas. Yogyakarta: Pustaka Pelajar.
6. Ball, D., Pedro S. Coelho and M. J.
Vilares. 2006. Service personalization and
loyalty, Journal of Services Marketing,
20/6, 391–403.
7. Beerli, Asuncion, Josefa D. Martı´n dan
Agustı´n Quintana. 2004. “A model of
customer loyalty in the retail banking
market.” European Journal of Marketing,
Vol. 38 No. 1/2, 253-275.
8. Bei, Lien-Ti & Yu- Ching Chiao. 2001.
“An Integrated Model for The Effects of
Perseived Product, Perseived Service
Quality, Perseived Price Fairness on
Consumer Statisfaction and Loyalty,”
Journal of Consumer Statisfaction,
Dissatisfaction and Complaining
Behaviour, Volume 14, pp. 125-140
9. Bleuel, William. 2007. Customer
Satisfaction. http://www.scantron.com/
cd_5.aspx.
10. Bloemer J.M.M. and de Ruyter K. 1999.
Customer loyalty in high and low
involvement settings: the moderating
impact of positive emotions. Journal of
Marketing Management, p. 315-330.
11. Brunner, Thomas A., Markus Stocklin dan
Klaus Opwis. 2008. “Satisfaction, image
and loyalty: new versus experienced
customers,” European Journal of
Marketing, Vol. 42 No. 9/10, 1095-1105.
12. Buttle, F. 1995. Hotel and Food Service
Marketing: A Managerial Approach,
London: Cassell.
13. Caruana, Albert. 2002. Service Loyalty:
The Effects of Service Quality and The
Mediating Role of Customer Satisfaction.
European Journal of Marketing Vol 36.
No.7/8, 818-828. MCP UP Limited.
14. Casalo, Luis, Carlos Flavian and Miguel
Guinalıu. 2007. “The impact of
participation in virtual brand communities
on consumer trust and loyalty: The case of
free software,” Online Information
Review, Vol. 31 No. 6, 775-792.
15. Cengiz, Ekrem, Hasan Ayyildiz, dan
Bünyamin Er. 2007. ”Effects of image and
advertising efficiency on customer loyalty
and antecedents of loyalty: turkish banks
sample,” Banks and Bank Systems,
Volume 2, Issue 1.
16. Chan, Lai K., Yer V. Hui, Hing P. Lo, Siu
K. Tse, Geoffrey K.F. Tso and Ming L.
Wu. 2003. “Consumer satisfaction index:
new practice and findings”. European
Journal of Marketing, Vol. 37 No. 5/6,
872-909.
17. Chattananon, Apisit, Meredith Lawley
Jirasek Trimetsoontorn Numchai
Supparerkchaisakul Lackana
Leelayouthayothin. 2007. “Building
corporate image through societal
marketing programs,” Society and
Business Review, Vol. 2 No. 3, 230-253.
18. Chen, Changfeng. 2006. “Identifying
Significant Factors Influencing Consumer
Trust In An Online Travel Site.”
Information Technology & Tourism, Vol.
8, 197–214
International Journal of Information Technology and Business Management 29
th December 2013. Vol.20 No.1
© 2012-2013 JITBM & ARF. All rights reserved
ISSN 2304-0777 www.jitbm.com
87
19. Chun, R., and G. Davis. 2006. “The
Influence of Corporate Characteron
Customers and Employees: Exploring
Similarities and Differences”, Academy of
Marketing Science journal, 34.
20. Colquitt, Jason A., Jeffery A. LePine &
Michael J. Wesson. 2009. Organizational
Behavior: Improving Performance and
Commitment in the Workplace. New
York: McGraw-Hill.
21. Dagger, Tracey S. and Timothy K.
O’Brien. 2010. “Does experience matter?
Differences in relationship benefits,
satisfaction, trust, commitment and loyalty
for novice and experienced service
users.”, European Journal of Marketing,
Vol. 44 No. 9/10, 1528-1552.
22. DeVito, Joseph A. 2001. Komunikasi
Antarmanusia. Jakarta: Professional
Books.
23. East, Robert, Kathy Hammond, Patricia
Harris, dan Wendy Lomax. 2000. First-
store loyalty and retention. Journal of
Marketing Management, 16 (4. 307-325.
24. Espejel, Joel, Carmina Fandos and Carlos
Flavian. 2008. “Consumer satisfaction: A
key factor of consumer loyalty and buying
intention of a PDO food product.” British
Food Journal, Vol. 110, No. 9, 865-881.
25. Ferdinand, Augusty. 2002. Struktural
Equation Modeling dalam Penelitian
Manajemen. Semarang: Fakultas Ekonomi
UNDIP.
26. Flavian, Carlos, Miguel Guinalıu and
Eduardo Torres, 2006. “Consumer trust,
perceived security and privacy policy
Three basic elements of loyalty to a web
site.” Industrial Management and Data
Systems, Vol. 106 No. 5, 601-620.
27. Ganesan, S. 1994. “Determinats of long-
term orientation in buyer-seller
relationship,” Journal of Marketing, Vol.
58, No. 2, 1-19.
28. Garbarino, Ellen and Olivia F. Lee. 2003.
“Dynamic pricing in internet retail: effects
on consumer trust,” Journal of Psychology
and Marketing, Vol. 20, Issue 6, 495-513.
29. Gaspersz, Vincent. 2002. Total Quality
Management. Jakarta: PT. Gramedia
Pustaka Utama.
30. Ghozali, I., dan Fuad. 2005. Structural
Equation Modeling: Teori, Konsep, dan
Aplikasi dengan Program LISREL 8.54.
Semarang: Badan Penerbit UNDIP.
31. Gregorius, Chandra. 2002. Strategi dan
Program Pemasaran. Yogyakarta: Andi.
32. Gremler, Dwayne D.. 1999. “The loyalty
ripple effect: appreciating the full value of
customers,” International Journal of
Service Industry Management. co-
authored).
33. Hair Jr, J.F., Anderson, R.E., Latham,
R.E., dan Black, W.C. 1995. Multivariate
Data Analysis with Readings. New Jersey:
Prentice Hall, Inc.
34. Helgesen, Oyvind and Erik Nesset. 2007.
“Images, Satisfaction and Antecedents:
Drivers of Student Loyalty? A Case Study
of a Norwegian University College,”
Corporate Reputation Review, Vol. 10, 38
– 59.
35. Hennig-Thurau, Thorsten, Markus F.
Langer, and Ursula Hansen. 2001.
“Modeling and Managing Student
Loyalty: An Approach Based on the
Concept of Relationship Quality”, Journal
of Service Research, Vol. 3, No. 4, 331-
344.
36. Herrmann, Andreas, Lan Xia, Kent B.
Monroe and Frank Huber. 2007. “The
influence of price fairness on customer
satisfaction: an empirical test in the
context of automobile purchases,” Journal
of Product & Brand Management, 16/1,
2007, 49–58.
37. H
urriyati, Ratih. 2005. Bauran Pemasaran
dan Loyalitas Konsumen. Bandung: CV.
Alfabeta.
38. Javalgi, RG and CR Moberg.1997.
“Service loyalty: implications for service
providers,” The Journal of Services
Marketing 11 (3): 165-179.
39. Jun, Minjoon, Zhilin Yang and DaeSoo
Kim. 2004. “Customers’ perceptions of
online retailing service quality and their
satisfaction,” International Journal of
Quality & Reliability Management. Vol.
21 No, 2004.
40. Kendrick. 1998. “Promotional products vs
price promotion in fostering customer
loyalty: a report of two controlled field
experiments,” The Journal of Services
Marketing, Vol. 12 No. 4, 312-326.
41. Kotler, Philip dan Kevin Lane Keller.
2012. Marketting Management, Essex:
Pearson Education Inc.

International Journal of Information Technology and Business Management 29
th December 2013. Vol.20 No.1
© 2012-2013 JITBM & ARF. All rights reserved
ISSN 2304-0777 www.jitbm.com
88
42. _______. 2000. Marketing Management.
International Edition. New Jersey:
Prentice Hall.
43. _______. 2003. Marketing Management.
New Jersey: Prentice Hall.
44. Lin, Long-Yi, Ching-Yuh Lu. 2010. “The
influence of corporate image, relationship
marketing, and trust on purchase
intention: the moderating effects of word-
of-mouth”, Tourism Review, Vol. 65 Iss:
3, 16 – 34.
45. Lopez, Carmen, Manto Gotsi and
Constantine Andriopoulos. 2011.
“Conceptualising the influence of
corporate image on country image,”
European Journal of Marketing, Vol. 45
No. 11/12, 1601-1641.
46. Mäntymäki, Matti and Jari Salo. 2010.
”Trust, Social Presence and Customer
Loyalty in Social Virtual Worlds, 23rd
Bled eConference eTrust: Implications for
the Individual,” Enterprises and Society,
June 20 - 23, Bled, Slovenia.
47. Martın-Consuegra, David, Arturo Molina
dan Agueda Esteban. 2007. “An integrated
model of price, satisfaction and loyalty: an
empirical analysis in the service sector.”
Journal of Product & Brand Management,
16/7, 459–468.
48. Matzler, K., Andreas Wurtele & Birgit
Renzl. 2006. “Dimensions of price
satisfaction: a study in the retail banking
industry,” International Journal of Bank
Marketing, Vol. 24 no. 4 pp 216-231,
Emerald group publishing limited.
49. McShane, Steven L. and Mary Ann Von
Glinow, (2008), Organizational Behavior.
New York: McGraw Hill.
50. M
ollering, Guido. 2006. Trust: Reason,
Routine, Reflexivity. Oxford: Elsevier.
51. Morgan, R. M. and Hunt. 1994.
“Relationship marketing in the era of
network competition”. Journal of
Marketing Management. Vol. 5.
52. Mullins, John W. and Orville C. Walker,
Jr. 2010. Marketing Management: A
Strategic Decision-Making Approach.
New York: McGraw-Hill.
53. Ndubisi, Nelson Oly. 2009. “Relationship
marketing and customer loyalty,”
Marketing Intelligence & Planning, Vol.
25 No. 1, 98-106.
54. Newsom, Doug, Judy VanSlyke Turk, and
Dean Kruckeberg. 2010. This Is PR: The
Realities of Public Relations. Boston:
Wadsworth Cengage Learning.
55. Oliver, R. L.. 1997. Satisfaction: A
Behavioral Perspective on the Customer,
New York: McGraw-Hill.
56. Padma, Panchapakesan, Chandrasekharan
Rajendran and Prakash Sai Lokachari.
2010. “Service quality and its impact on
customer satisfaction in Indian hospitals:
Perspectives of patients and their
attendants,” Benchmarking: An
International Journal, Emerald Group
Publishing Limite, Vol. 17 No. 6, pp. 807-
841.
57. Palacio, Asunción Beerli, Gonzalo Díaz
Meneses, Pedro J. Pérez Pérez. 2002.
“The configuration of the university image
and its relationship with the satisfaction of
students,” Journal of Educational
Administration, Vol. 40 Iss: 5, 486 – 505.
58. Picton, dan Broderick. 2001. Integrated
Marketing Communication. Principle &
Practice. International Thompson
Publications.
59. Ranaweera, Chatura dan Jaideep Prabhu.
2003. “On the relative importance of
customer satisfaction and trust as
determinants of customer retention and
positive word of mouth.” Journal of
Targeting, Measurement and Analysis for
Marketing; 12, 1; ABI/INFORM
Complete, pg. 82.
60. Robbins, Stephen P. & Timothy A. Judge.
2007. Organizational Behavior. New
York: Prentice-Hall Jersey.
61. Rojas-Mendez, Jose I., Arturo Z.
Vasquez-Parraga Ali Kara, and Arcadio
Cerda-Urrutia. 2009. “Determinants of
Student Loyalty in Higher Education: A
Tested Relationship Approach in Latin
America,” Latin American Business
Review, Vol. 10, 21-39.
62. Shahin, Arash. 2007. “SERVQUAL and
Model of Service Quality Gaps: A
Framework for Determining and
Prioritizing Critical Factors in Delivering
Quality Services.”
http://www.qmconf.com/ Docs/0077.pdf.
63. Sheth, J.N. and B. Mittal. 2004. Customer
Behavior: A Managerial Prospective.
Mason: South-Western.
64. Sirdeshmusk, J. Singh D. 2010. “Agency
and Trust Mechanism in Consumer
Satisfaction and Loyalty Judgment.”
Journal of the Academy of Marketing
Science, 28.
International Journal of Information Technology and Business Management 29
th December 2013. Vol.20 No.1
© 2012-2013 JITBM & ARF. All rights reserved
ISSN 2304-0777 www.jitbm.com
89
65. Šmaižienơ, Ingrida and Petras
Oržekauskas. 2006. “Corporate image
audit,” Journal of Management, Vol. 1,
No. 10.
66. Swan, J. E. dan M. R. Bowers. 1993.
“Service Quality and Satisfaction: The
Process of People Doing Things
Together”, Journal of Service Marketing,
Vol. 12 No. 1.
67. T
jiptono, Fandi. 2005. Brand Management
& Strategy, Yogyakarta: Andi Yogyakarta
68. Undang-undang Republik Indonesia
Nomor 20 Tahun 2003 tentang Sistem
Pendidikan Nasional.
69. Vinagre, Maria Helena and Jose´ Neves.
2008. “The influence of service quality
and patients’ emotions on satisfaction,”
International Journal of Health Care
Quality Assurance, Vol. 21 No. 1, 87-103.
70. Virvilaite, R., V. Saladiene, dan D.
Skindaras. 2009. “The Relationship
between Price and Loyalty in Services
Industry,” Inzinerine Ekonomika-
Engineering Economics (3).
71. Williams, Christine dan John Bueswell.
2003. Service Quality in Leisure and
Tourism. Cambridge, MA: CABI
Publishing.
72. Wu, Chao-Chan. 2011. “The impact of
hospital brand image on service quality,
patient satisfaction and loyalty,” African
Journal of Business Management, Vol.
5(12), 4873-4882
73. Yaacob, Mohd Rafi, Nik Rozhan Nik
Ismail and Nur Safia Ismail. 2010.
“An Investigation of the determinants
of customers’ loyalty of the Maxis
Communications Berhad,”
http://www.internationalconference.c
om.my/
proceeding/icber2010_proceeding/PA
PER_271_DeterminantsOfCustomers
Loyalty.pdf, accessed 30 January
2012.
74. Yieh, Kaili, Yu-Ching Chiao, and
Ya-Kang Chiu. 2007. “Understanding
the Antecedents to Customer Loyalty
by Applying Structural Equation
Modeling,” Total Quality
Management , Vol. 18, No. 3, 267–
284.
75. Yu, Yi-Ting dan Alison Dean. 2001.
“The contribution of emotional
satisfaction to consumer loyalty,”
International Journal of Service
Industry Management, Vol. 12 No. 3,
234-250.
76. Zeithaml, Valarie A., A. Parasuraman,
dan Leonard L. Berry. 1990.
Delivering Quality Service: Balancing
Customer Perceptions and
Expectation. New York: The Free
Press.