the malnourished middle shiroor, senior policy advocacy officer (nutrition), results uk february...
TRANSCRIPT

WHO PAYS FOR PROGRESS? | 03
THE MALNOURISHED MIDDLEBREAKING THE CYCLE OF MALNUTRITION IN MIDDLE-INCOME COUNTRIES

02 | THE MALNOURISHED MIDDLE: BREAKING THE CYCLE OF MALNUTRITION IN MIDDLE-INCOME COUNTRIES THE MALNOURISHED MIDDLE: BREAKING THE CYCLE OF MALNUTRITION IN MIDDLE-INCOME COUNTRIES | 03
CONTENTS
ACKNOWLEDGEMENTS 02
EXECUTIVE SUMMARY 04
INTRODUCTION 06
THE REPORT 06
MALNUTRITION IN MIDDLE- INCOME COUNTRIES (MICS) 07 Impact of malnutrition on MICs 07 Individual impact 07 National impact 08 Global level impact 08 Nutrition and resilience 09
1 COUNTRY OWNERSHIP 10 Government leadership 10 Financing for nutrition 10 Box: African Leaders for Nutrition Initiative 11
2 ROBUST POLICY FRAMEWORK FOR NUTRITION 12
3 SUSTAINED AND COLLABORATIVE DONOR SUPPORT 14 Financial transition 14 Technical support and capacity building 14 Box: What is transition? 15
4 ADDRESSING NUTRITIONAL INEQUITIES 16 Box: The shadow behind Peru’s success in stunting reduction 17
5 INNOVATIVE SOLUTIONS FOR NUTRITION 18 Innovative financing 18 Improved crop systems 18 Box: Biofortification through conventional plant breeding for nutrition improvement 18 Box: The power of multiplied nutrition investments in MICs 19
6 DATA AND ACCOUNTABILITY 20 Role of civil society 20
CONCLUSION 22
ENDNOTES 23
The author would like to thank Callum Northcote (RESULTS UK), Amy Whalley (RESULTS UK), Jennifer Williams (RESULTS UK) and Kate Goertzen (Advocacy and Campaigns consultant) for their helpful and insightful comments on the previous drafts of the report. The author would also like to thank Rachael Hore (RESULTS UK) and Tom Maguire (RESULTS UK) for their assistance in editing and designing the report.
AUTHORAnushree Shiroor, Senior Policy Advocacy Officer (Nutrition), RESULTS UK
FEBRUARY 2018
ACKNOWLEDGEMENTS
Cover photo: Ferry Tan/ACTION

EXECUTIVE SUMMARY
04 | THE MALNOURISHED MIDDLE: BREAKING THE CYCLE OF MALNUTRITION IN MIDDLE-INCOME COUNTRIES THE MALNOURISHED MIDDLE: BREAKING THE CYCLE OF MALNUTRITION IN MIDDLE-INCOME COUNTRIES | 05
Every third person in the world is malnourished. Alarmingly, around eight out of ten malnourished children reside in middle-income countries (MICs) with lower middle-income countries (LMICs) shouldering the biggest share of this burden. This ‘silent emergency’ is dictating the survival and potential of these populations, and the future of these countries.
5 INNOVATIVE SOLUTIONS FOR NUTRITION These are needed to drive faster malnutrition reduction in MICs. There is an urgent need to explore innovative financing solutions for nutrition in MICs such as the Power of Nutrition which as of December 2017 included only two MICs in its portfolio of investments. Innovative crop systems through approaches such as biofortification also hold great potential to reduce malnutrition without drastically altering dietary and agricultural patterns.
6 DATA AND ACCOUNTABILITY These are critical in addressing malnutrition in these MICs. The lack of data on budget allocations to nutrition in 69 of the 89 MICs assessed, presence of only 1-3 SMART targets aligned with the global targets in most of the valid national plans, and missing data on nutritional inequities pose a barrier to understanding the true burden of malnutrition.
They also pose a barrier to understanding what works and what doesn’t in addressing the burden. On the other hand, accountability for nutrition is strengthened through measurable political commitments, SMART policies, trackable nutrition investments, and robust, timely, and disaggregated data to guide effective action on the ground. Civil society supports governments and other stakeholders on all these fronts and must be provided the space to work as constructive allies in the fight against malnutrition in these countries.
Strengthening efforts towards a more rapid and inclusive reduction in malnutrition in these MICs is necessary to boost survival, improve human potential, and further sustainable development. However, at the current rates of malnutrition and in the absence of more urgent efforts, progress in these countries and globally is at risk.
This report reviews the prevalence of malnutrition in 89 MICs, which excludes 20 MICs described as ‘fragile situations’ by the World Bank. These 89 countries are home to 122 million stunted, 47 million wasted, and 26 million overweight children, as well as over 500 million women of reproductive age (WRA) who are anaemic1. The report also assesses policy frameworks in these countries on nutrition and the nutritional inequities that exist within them. Based on the data analysed, it recommends actions that are imperative to address this issue.
The report highlights six key accelerators for malnutrition reduction in MICs.
1 COUNTRY OWNERSHIP This is essential to generate the necessary high-level momentum for nutrition in MICs. It is reflected through government leadership, sustainable financing, and policy and programme implementation. Firmly positioning nutrition within political manifestos and commitments, and establishing institutional structures for nutrition can drive sensible financial and implementation decisions for nutrition, whilst also strengthening accountability. This must be complemented with domestic cross-sectoral budgetary allocations. MICs are expected to mobilise USD 5.1 billion of the additional annual USD 7 billion (as estimated by the World Bank and its partners) required globally in order to reach the global nutrition targets2. However, assessing investment in nutrition in MICs is a significant challenge with budgetary tracking data available in only 20 MICs. Currently assessments of nutrition allocation vary from nearly zero in many MICs to as high as 27% in El-Salvador.
2 ROBUST POLICY FRAMEWORKS FOR NUTRITION Robust policy frameworks guide a more effective and efficient allocation of limited resources. A good nutrition policy must meet criteria such as being evidence based, setting Specific, Measurable, Achievable, Realistic and Time-bound (SMART) targets, engaging diverse stakeholders and expanding multi-sectoral interventions, and prioritising the most vulnerable and marginalised groups. Above all, it must be costed and should cater to timely monitoring and
evaluation. Of the MICs reviewed, 58% of the LMICs and 39% of upper middle-income countries (UMICs) were found to have a valid nutrition policy or a development policy that prioritised nutrition. While 70% of all valid plans included one or more specific and time-bound targets aligned with the global targets, there is definite room for more progress on this front. Countries such as Nigeria, Vietnam, and South Africa are good examples for target setting, but there is huge opportunity in working across the board with MICs in developing improved policies.
3 SUSTAINED AND COLLABORATIVE DONOR SUPPORT Technical assistance to build capacity on policy development, improved technical and governance structures, and design and delivery of impactful nutrition programmes are vital to sustain and further nutrition success. Donors are expected to mobilise an additional USD 2.6 billion (41%) to bridge the USD 7 billion annual additional global financing gap for nutrition3. However, less than 1% of current donor aid flows is presently being directed to basic nutrition4. This is insufficient to make substantial progress towards the SDGs and global targets. Moreover, changing or ‘transitioning’ donor relationships with MICs based on countries’ income statuses, and simultaneous transition by multiple donors, poses a threat to the progress achieved so far on nutrition and health, and hinders the potential for greater success.
4 ADDRESSING NUTRITIONAL INEQUALITIES This is crucial given the inequitable distribution of malnutrition based on wealth quintile, urban-rural location, and maternal education among other factors. In 32 MICs, children from the poorest wealth quintile were found to be 2-4 times more likely to be stunted than those from the richest. This ratio is nearly 7:1 in countries such as Vietnam and El-Salvador. Moreover, children of mothers with no education also report up to 5 times higher stunting rates than those whose mothers had completed secondary or higher schooling. Going beyond the obvious moral imperative, advancing nutrition for those groups who are often the most marginalised and vulnerable can help them seize opportunities to improve their lives as well as contribute to a country’s wider development progress.
Photo: Tom Maguire/RESULTS UK

INTRODUCTION
06 | THE MALNOURISHED MIDDLE: BREAKING THE CYCLE OF MALNUTRITION IN MIDDLE-INCOME COUNTRIES THE MALNOURISHED MIDDLE: BREAKING THE CYCLE OF MALNUTRITION IN MIDDLE-INCOME COUNTRIES | 07
Globally, every third person is malnourished. A significant proportion of malnourished people live in middle-income Countries (MICs). Despite these MICs representing a third of the global Gross Domestic Product (GDP), nearly 75% of the world’s poorest people also reside in them5. Economic growth in these countries has not acted as a guarantee for equitable improvements in nutrition, health, and the lives
of their populations. At the same time, the cyclical nature of malnutrition in these countries both drives, and results from, persistent poverty. This everyday emergency of malnutrition poses a huge threat to the ability of hundreds of millions of children and adults to survive and thrive. Ultimately, this stifles the human and economic potential in these growing economies.
THE REPORTGlobal development is unachievable until malnutrition is effectively reduced. This is especially true for MICs, where the numbers are staggering. This report examines the malnutrition in MICs, and attempts to identify steps that are vital to address the issue.
Data analysis was undertaken between June and December 2017 and is based on 89 MICs from the World Bank’s list of 109 MICs, following the exclusion of 20 countries identified by the Bank as ‘Fragile Situations’6. This exclusion does not seek to undermine malnutrition in conflict and fragile situations, but is recognition that such contexts present different complexities.
The research for this report particularly examines:
◆ The burden of malnutrition in 89 non-fragile MICs, based on available data sources such as the Global
Nutrition Report country profiles7 and the Inter-Agency Joint Malnutrition Estimates, and its potential impact in these countries8;
◆ The policy frameworks of these MICs through the World Health Organisation Global Database on the Implementation of Nutrition Action (GINA)9, the Scaling Up Nutrition (SUN) country profiles10, and desk-based research into national policies on nutrition, particularly where they were found to be invalid using the first two sources;
◆ The widespread inequities that exist in nutrition outcomes within these countries, based on available disaggregated data.
Taking the above into account, this report outlines some of the actions that can help address malnutrition in MICs, in turn promoting sustainable development in these countries and globally.
In 2016, around 75% of globally stunted, over 80% of wasted, and nearly 80% of overweight children lived in MICs (Fig.1). For lower middle-income countries (LMICs), the distribution is several times higher than in upper middle-income countries (UMICs). Further, it is also several times higher than even low income-countries (LICs) (Fig.2). Recognising MICs’ greater proportional contribution of the global population, with LMICs contributing the bigger share, the burden is nonetheless skewed. As a result, the physical and intellectual growth of 122 million children is irreversibly stunted, 47 million wasted children are on the brink of death, and over 500 million anaemic women are at risk of frequent illness and lowered work potential11.
MICs also face a rapidly expanding burden of overweight, obesity, and associated non-communicable diseases (NCDs), with around 26 million overweight children who are likely to suffer other morbidities. In 2015, a fifth of all mortality in the age group 30-70 years in MICs was reportedly due to cardiovascular disease (CVD), cancer, diabetes, or chronic respiratory disease (CRD)14; of which poor nutrition is an important risk factor. This has severe implications on the quality of life and healthcare costs for individuals, as well as national budgets.
MALNUTRITION IN MIDDLE-INCOME COUNTRIES (MICS)
FIGURE 1: POPULATION AND MALNUTRITION DISTRIBUTION ACROSS COUNTRY INCOME GROUPS12
1990
Under five mortality rate, per 1,000 live births3
Global Immunisation rate %
4
Low-incomeeconomies
(LICs)
Proportion of globalpopulation
MICs
Global burden ofunder-five stunting
Global burden ofunder-five wasting
Global anaemia burden in WRA
Lower-middleincome
economies(LMICs)
Upper-middleincome
economies(UMICs)
High-incomeeconomies
2000 2005 2010 2014
7370
7885 86
9085
75
62
51
43
63
31
54 53
38
5653
78Number of countries (2016)
75% 74% 83%
16%25%
1%
18%
10%
35%
37%
16%
9%
1%
LICs HICs Data Gap
The 89 non-fragile MICs considered for the analysis in this report are home to 114 million stunted children, 44 million children who are wasted and 480 million anaemic women. These are not just numbers but individuals whose lives will be shaped poorly by malnutrition, with consequences spanning generations (Fig.3).
IMPACT OF MALNUTRITION ON MICSMalnutrition in these countries bears grave human and economic consequences, with cascading consequences for global progress.
INDIVIDUAL IMPACTMalnutrition contributes to around half of all deaths of children under the age of five years. As per our analysis, this equals roughly 1.8 million child deaths annually in the 89 MICs as a result of conditions perpetuated by malnutrition15. The children who survive still suffer varying degrees of irreversible restricted growth and brain development that prevents them from achieving their true potential. Ill-health and lower intellectual attainment resulting from persistent malnourishment in the growing years correlate with lower economic potential and reduced annual earnings of around 10% in adulthood16. In addition, healthcare costs are increased substantially for families whose members are frequently falling ill. Therefore, malnutrition contributes to individuals being pushed into, or deeper into, poverty.

08 | THE MALNOURISHED MIDDLE: BREAKING THE CYCLE OF MALNUTRITION IN MIDDLE-INCOME COUNTRIES THE MALNOURISHED MIDDLE: BREAKING THE CYCLE OF MALNUTRITION IN MIDDLE-INCOME COUNTRIES | 09
the economic loss. Moreover, many countries, including MICs, are now reported to also spend around 2-7% of their health care budgets on the treatment of obesity and associated chronic diseases19. With more lives being lost, lower productivity, and higher healthcare costs, sustaining and advancing economic progress will be a challenge to MICs. Without action, there will be a high risk of stagnation or regression.
GLOBAL LEVEL IMPACTMalnourished nations cannot drive global progress. Every year millions of children, women, and adolescents are at risk of death, disease, and weakened potential from underlying malnutrition. This invariably has a knock-on effect on national and global sustainable development. Improving nutrition
is vital to ensure progress on 12 out of the 17 Sustainable Development Goals (SDGs)20. However, at the current level of effort, and in the absence of tackling malnutrition in MICs, not only will SDG 2 on ending malnutrition by 2030 be missed, but progress on the Goals on health, education, reduced inequalities, economic growth and poverty reduction will also be critically undermined.
NUTRITION AND RESILIENCEAdequate nutrition is both a driver, and a consequence of, improved resilience. Undernutrition weakens the ability of people to respond to crises and shocks, aggravating their vulnerability21. Conversely, good nutrition, through the pathways of improved health and economic potential, drives greater adaptive, transformative, and recovery
FIGURE 2: GLOBAL DISTRIBUTION OF CHILDHOOD MALNUTRITION AS PER COUNTRY INCOME GROUPS13 FIGURE 3: THE LIFE-CYCLE IMPACT OF MALNUTRITION15
4
Distribution of children <5 years
LMICs
Stunting
Wasting Overweight
LICs HICsUMICs
16%
47%
28%
10%
25%
16%
75%
10%
44%
35%
11%7%
66%
8% 1%
1%
4
No education60
50
40
30
20
10
0
UMICs (n=20)
LMICs
Wasting
Overweight
LICs HICsUMICs
16%
47%
28%
10%25%
10%
44%
35%
11%
7%
66%
8% 1% 1%
0 5 10 15 20 25 30
000.10.20.5
1.92.5
3.63.74.04.34.54.74.8
5.36.5
8.28.6
10.8
27.6
7.9%
19.6%
34.2%
24
2
68
6
4
2
3
1
11
2
41.2%
13.7%
25.5%
42.1%
All donor disbursements to Basic Nutrition (USD millions)
% Stunting in children under five years
Valid planswhich could
not be assessed
No targets1-2 globalnutritiontargets
3 targets4 targets5 targetsAll 6 globaltargets
LMICs
Plan not found/Inaccesible
Invalid nutritionpolicy, no develpmentpolicy prioritisingnutrition
Invalid nutritionpolicy, but valid develpmentpolicy with specificnutrition focus
Valid nutritionpolicy
HICsUMICs
2007 2010 2011 2012 2013 2014 2015 2016
2007 2010 2011 2012 2013 2014 2015 2016
856.303
0.47
0.50
0.56
0.560.49
0.30
0.20
0.30
866.784936.625
945.879730.104
468.709439.802
222.569
Ho
nd
ura
sP
eru
Bo
livi
aC
olu
mb
iaSu
rin
ame
Bel
ize
Cam
ero
on
Nig
eria
Pak
ista
nV
ietn
am Lao
Do
min
ican
Rep
ub
lic
Gh
ana
Mau
rita
nia
Bh
uta
nSw
azil
and
Jord
anIn
dia
Gu
yan
aM
ald
ives
Thai
lan
dC
on
goLe
soto
Zam
bia
Van
uat
uSa
o T
om
e an
d P
rin
cip
eG
abo
nEg
ypt
Nam
ibia
Mo
ngo
lia
Co
te d
’Ivo
ire
Primary school Secondary school
Societal and enviromental
factors
Elderly malnutrition
Higher mortality rate
Rapid growth
Inadequatecatch upgrowth
Inadequatefetalnutrition
Reduced capacityfor care
Low birth weight &compromised bodycomposition
Impaired mentaldevelopment
Inappropriate feeding practices
Inappropriate food,health & care
Inappropriate food,health & care
Inappropriate food,health & care
Higher maternalmortality
Frequent infections
Inappropriate foodhealth & care (includinguntimely/inappropriatecomplimentary feeding)
Reduced intellectualpotential & reducedschool performance
Reduced intellectualpotential & reducedschool performance
Adult malnutrition
Pregnancylow weight gain
Adolescent malnutrition
Fetal & infant malnutrition
ObesityAbdominal obesity,
diabetes, cardiovascular disease
Child malnutrition
Undernutrition in the early years also predisposes people to an early onset of NCDs17, thus laying the foundation for a life plagued by morbidities and untimely death. This is why actions to simultaneously address these two ends of the malnutrition spectrum are urgently needed.
NATIONAL IMPACTPhysically and intellectually weak human capital, and its resulting unproductivity severely undermines economic potential. It affects both labour and technology-intensive industry and contributes to annual economic losses of an estimated 11% GDP in Asia and Africa18. On this basis, a crude estimate of cumulative malnutrition-related GDP losses in the 89 MICs stands at an appalling USD 2.6 trillion every year. The bigger the malnutrition burden, the greater
capacities thus lowering susceptibility to impoverishment22. Improving nutrition security also complements the other components within wider resilience-strengthening efforts, by preventing them from falling further into the cycle of ill-health, vulnerability, and poverty. In light of the recent and more frequent occurrences of humanitarian disasters, many of which have affected MICs, such as the drought in parts of Kenya23, tackling food and nutrition security through both a humanitarian and development lens becomes more critical than ever.
In view of the massive burden of malnutrition and its devastating consequences, the forthcoming sections in this report attempt to suggest actionable areas as accelerators for malnutrition reduction in MICs.

10 | THE MALNOURISHED MIDDLE: BREAKING THE CYCLE OF MALNUTRITION IN MIDDLE-INCOME COUNTRIES THE MALNOURISHED MIDDLE: BREAKING THE CYCLE OF MALNUTRITION IN MIDDLE-INCOME COUNTRIES | 11
1 COUNTRY OWNERSHIP Country ownership of the problem of malnutrition is imperative to generate necessary high-level momentum for nutrition in these MICs. This ownership is best reflected in three ways 24
◆ Government leadership;◆ Sustainable financing; and ◆ Policy and programme implementation.
GOVERNMENT LEADERSHIPThis creates an enabling environment by driving financial investments, forging strong partnerships, implementing effective decisions and actions for nutrition, and ensuring accountability for the same25. Strong political will begins with positioning of nutrition firmly within political manifestos and national development plans, and establishing institutional and governance structures at national and sub-national levels to lead, coordinate, and monitor nutrition efforts; both vertically and horizontally.
Public political commitments to address malnutrition are also indicative of high level attention to the issue. For example, at the Association of South East Asian Nations (ASEAN) Summit in 2017, the Heads of States of the governments of Cambodia, Indonesia, Lao, Malaysia, Philippines, Thailand, and Vietnam amongst others, announced the ASEAN Leaders’ “Declaration on Ending All Forms of Malnutrition”26. In this they committed to expand and intensify efforts on coherent policies and multi-sectoral and coordinated interventions, increase public financing for nutrition, and strengthen human and institutional capacities to plan and deliver nutrition programmes. Commitments at such fora are a strong stepping stone to guiding nutrition efforts in-country, and improving accountability.
SUSTAINABLE FINANCING FOR NUTRITIONNutrition prioritisation is incomplete without adequate cross-sectoral budgetary allocations, as it renders the equitable expansion of actions on the ground impossible.
Since 2000, the rates of decline in childhood stunting in Africa has been slower than in Asia, Latin America, and the Caribbean. Over 30% children (59 million) under the age of five years suffer from irreversible physical and brain damage as a result.
In recognition of the immense loss of human and economic potential, and colossal economic losses on account of malnutrition in Africa, the African Leaders for Nutrition (ALN) initiative was founded. The initiative was officially launched by President Akinwumi Adesina of the African Development Bank (AfDB) at their annual meeting in Lusaka, Zambia in 2016. Led by the AfDB and the Global Panel for Agriculture and Food Systems for Nutrition, the initiative is supported by the Bill and Melinda Gates Foundation, the Dangote Foundation, and Big Win Philanthropy, and works closely with the SUN movement and the New Partnership for Africa’s Development (NEPAD).
ALN Champions providing overall guidance to the effort include high-level influencers such as John Kufour, Kofi Annan, Hery Rajaonarimampianina, Graca Machel, Aliko Dangote, José Graziano da Silva, and Jamie Cooper. This group aims to encourage African Heads of State, Finance Ministers, and business leaders to prioritise nutrition, strengthen political will, implement better policies, and catalyse greater investments for nutrition in the continent.
The ALN is helping raise nutrition further up the agenda in African countries, and contributing to the adoption and implementation of smarter actions for malnutrition reduction. It seeks to strengthen Africa-specific evidence on the economic impact of malnutrition, and the cost of meeting the global targets. Through the initiative a Nutrition Accountability Scorecard is also underway to monitor country-based and regional progress on nutrition commitments.
AFRICAN LEADERS FOR NUTRITION INITIATIVE
The World Bank and its partners estimate an additional annual need for USD 7 billion between 2015 and 2025 from all global stakeholders for nutrition. This is in addition to the current annual global investment of USD 3.9 billion. MICs are expected to mobilise 73% (USD 5.1 billion) of this requirement, alongside donor led Official Development Assistance (ODA) and other financing mechanisms to help bridge the rest of the financing gap27.
This financing is needed to scale-up known nutrition-specific solutions to meet four of the six global targets on stunting, wasting, low-birth weight, anaemia, exclusive breastfeeding, and childhood overweight by 2025. However, investments are also needed in nutrition-sensitive sectors such as agriculture, water, sanitation and hygiene (WASH), education, gender, and wider health sectors to drive exponential improvements in nutrition and health outcomes.
Data on nutrition relevant spending in all 89 MICs was unavailable and thus could not be analysed, but overall domestic budgetary allocations from LICs and MICs in 2015 totalled USD 2.9 billion, which is a fraction of the need. In 20 of the 89 MICs where budgetary tracking data was available, allocations for nutrition-specific and -sensitive programmes ranged between near zero (Lao, Lesotho, Vietnam and Zambia) to 27% (El Salvador), with an average of 5%28 (Fig.4).Given the vast health, intellectual, and economic gains that result from improved nutrition outcomes, and well-established returns on investment of 16:129, governments in MICs stand to benefit from making better and sustained investments in nutrition.
The Scaling Up Nutrition (SUN) movement is also a vital mechanism through which high-level political leadership and momentum on nutrition is being mobilised and nurtured. Through its efforts in bringing diverse stakeholders together into developing and delivering a common results framework, the SUN movement enables favourable domestic environments for nutrition. These in turn have facilitated and strengthened multi-sectoral and multi-stakeholder platforms, an improved policy framework, resource mobilisation, implementation, and accountability. Of the 89 MICs analysed, 25 countries and 3 Indian states are members of the SUN movement.
4
Vietnam
Lao
Lesotho
Nigeria
Zambia
Kyrgyz Republic
Indonesia
Botswana
Pakistan
Costa Rica
Kenya
Cameroon
Tajikistan
Ghana
Peru
Mauritania
Bangladesh
Philippines
Guatemala
El Salvador
0
0
0.1
0.2
0.5
1.9
2.5
3.6
3.7
4.0
4.3
4.5
4.7
4.8
5.3
6.5
8.2
8.6
10.8
27.6
FIGURE 4: DOMESTIC BUDGETARY ALLOCATION (%) TO NUTRITION IN 20 MICS
12 | THE MALNOURISHED MIDDLE: BREAKING THE CYCLE OF MALNUTRITION IN MIDDLE-INCOME COUNTRIES THE MALNOURISHED MIDDLE: BREAKING THE CYCLE OF MALNUTRITION IN MIDDLE-INCOME COUNTRIES | 13
2 ROBUST POLICY FRAMEWORK FOR NUTRITION
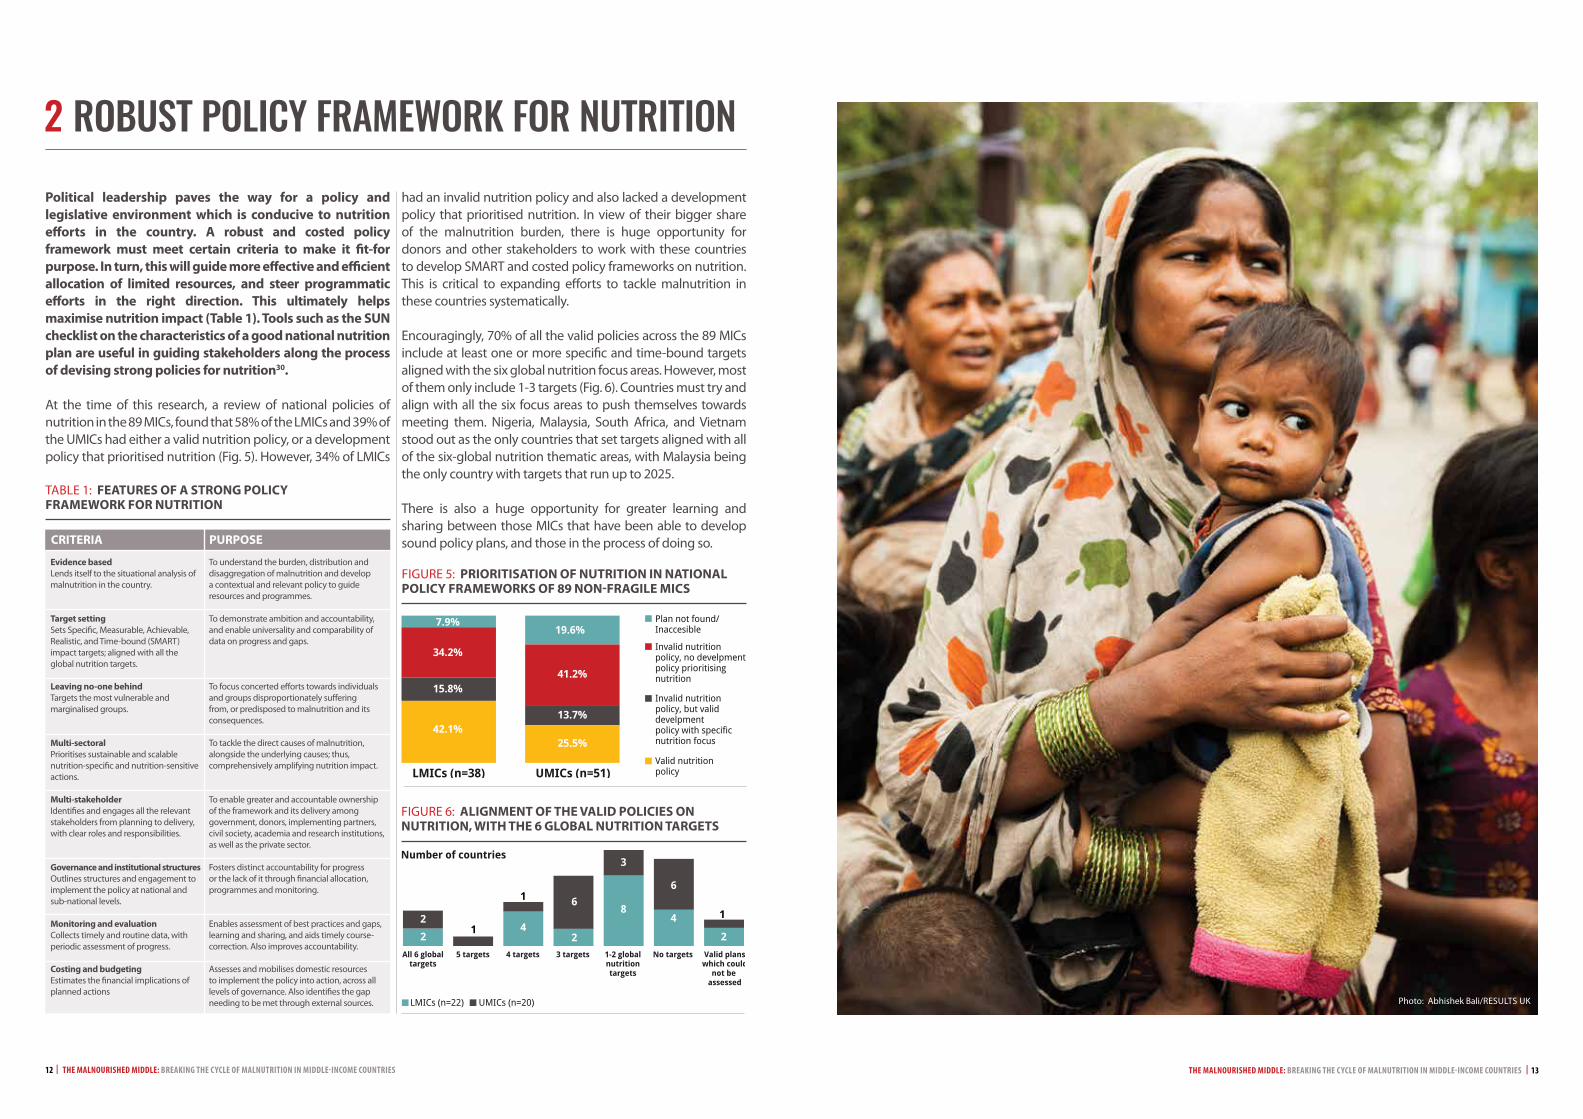
Political leadership paves the way for a policy and legislative environment which is conducive to nutrition efforts in the country. A robust and costed policy framework must meet certain criteria to make it fit-for purpose. In turn, this will guide more effective and efficient allocation of limited resources, and steer programmatic efforts in the right direction. This ultimately helps maximise nutrition impact (Table 1). Tools such as the SUN checklist on the characteristics of a good national nutrition plan are useful in guiding stakeholders along the process of devising strong policies for nutrition30.
At the time of this research, a review of national policies of nutrition in the 89 MICs, found that 58% of the LMICs and 39% of the UMICs had either a valid nutrition policy, or a development policy that prioritised nutrition (Fig. 5). However, 34% of LMICs
had an invalid nutrition policy and also lacked a development policy that prioritised nutrition. In view of their bigger share of the malnutrition burden, there is huge opportunity for donors and other stakeholders to work with these countries to develop SMART and costed policy frameworks on nutrition. This is critical to expanding efforts to tackle malnutrition in these countries systematically.
Encouragingly, 70% of all the valid policies across the 89 MICs include at least one or more specific and time-bound targets aligned with the six global nutrition focus areas. However, most of them only include 1-3 targets (Fig. 6). Countries must try and align with all the six focus areas to push themselves towards meeting them. Nigeria, Malaysia, South Africa, and Vietnam stood out as the only countries that set targets aligned with all of the six-global nutrition thematic areas, with Malaysia being the only country with targets that run up to 2025.
There is also a huge opportunity for greater learning and sharing between those MICs that have been able to develop sound policy plans, and those in the process of doing so.
FIGURE 5: PRIORITISATION OF NUTRITION IN NATIONAL POLICY FRAMEWORKS OF 89 NON-FRAGILE MICS
TABLE 1: FEATURES OF A STRONG POLICY FRAMEWORK FOR NUTRITION
FIGURE 6: ALIGNMENT OF THE VALID POLICIES ON NUTRITION, WITH THE 6 GLOBAL NUTRITION TARGETS
4
LMICs (n=38) UMICs (n=51)
LMICs
VietnamLao
LesothoNigeriaZambia
Kyrgtz RepublicIndonesiaBotswana
PakistanCosta Rica
KenyaCameroon
TajikstanGhana
PeruMauritaniaBangladeshPhilippinesGuatemalaEl Salvador
Wasting
Overweight
LICs HICsUMICs
16%
47%
28%
10%25%
10%
44%
35%
11%
7%
66%
8% 1% 1%
0 5 10 15 20 25 30
000.10.20.5
1.92.5
3.63.74.04.34.54.74.8
5.36.5
8.28.6
10.8
27.6
7.9%19.6%
34.2%
41.2%
13.7%
25.5%
15.8%
42.1%
Distribution of children<5 years
LMICs
Plan not found/Inaccesible
Invalid nutritionpolicy, no develpmentpolicy prioritisingnutrition
Invalid nutritionpolicy, but valid develpmentpolicy with specificnutrition focus
Valid nutritionpolicy
HICsUMICs
4
LMICs (n=22) UMICs (n=20)
LMICs
VietnamLao
LesothoNigeriaZambia
Kyrgtz RepublicIndonesiaBotswana
PakistanCosta Rica
KenyaCameroon
TajikstanGhana
PeruMauritaniaBangladeshPhilippinesGuatemalaEl Salvador
Wasting
Overweight
LICs HICsUMICs
16%
47%
28%
10%25%
10%
44%
35%
11%
7%
66%
8% 1% 1%
0 5 10 15 20 25 30
000.10.20.5
1.92.5
3.63.74.04.34.54.74.8
5.36.5
8.28.6
10.8
27.6
7.9%
19.6%
34.2%
24
2
68
6
4
2
3
1
11
2
41.2%
13.7%
25.5%
15.8%
42.1%
Number of countries
Valid planswhich could
not be assessed
No targets1-2 globalnutritiontargets
3 targets4 targets5 targetsAll 6 globaltargets
LMICs
Plan not found/Inaccesible
Invalid nutritionpolicy, no develpmentpolicy prioritisingnutrition
Invalid nutritionpolicy, but valid develpmentpolicy with specificnutrition focus
Valid nutritionpolicy
HICsUMICs
Evidence basedLends itself to the situational analysis of malnutrition in the country.
Target settingSets Specific, Measurable, Achievable, Realistic, and Time-bound (SMART) impact targets; aligned with all the global nutrition targets.
Leaving no-one behindTargets the most vulnerable and marginalised groups.
Multi-sectoralPrioritises sustainable and scalable nutrition-specific and nutrition-sensitive actions.
Multi-stakeholderIdentifies and engages all the relevant stakeholders from planning to delivery, with clear roles and responsibilities.
Governance and institutional structuresOutlines structures and engagement to implement the policy at national and sub-national levels.
Monitoring and evaluationCollects timely and routine data, with periodic assessment of progress.
Costing and budgetingEstimates the financial implications of planned actions
To understand the burden, distribution and disaggregation of malnutrition and develop a contextual and relevant policy to guide resources and programmes.
To demonstrate ambition and accountability, and enable universality and comparability of data on progress and gaps.
To focus concerted efforts towards individuals and groups disproportionately suffering from, or predisposed to malnutrition and its consequences.
To tackle the direct causes of malnutrition, alongside the underlying causes; thus, comprehensively amplifying nutrition impact.
To enable greater and accountable ownership of the framework and its delivery among government, donors, implementing partners, civil society, academia and research institutions, as well as the private sector.
Fosters distinct accountability for progress or the lack of it through financial allocation, programmes and monitoring.
Enables assessment of best practices and gaps, learning and sharing, and aids timely course-correction. Also improves accountability.
Assesses and mobilises domestic resources to implement the policy into action, across all levels of governance. Also identifies the gap needing to be met through external sources.
CRITERIA PURPOSE
Photo: Abhishek Bali/RESULTS UK

14 | THE MALNOURISHED MIDDLE: BREAKING THE CYCLE OF MALNUTRITION IN MIDDLE-INCOME COUNTRIES THE MALNOURISHED MIDDLE: BREAKING THE CYCLE OF MALNUTRITION IN MIDDLE-INCOME COUNTRIES | 15
3 SUSTAINED AND COLLABORATIVE DONOR SUPPORT Donors are expected to mobilise an additional USD 2.6 billion towards meeting the annual additional USD 7 billion global financing gap for nutrition31. However, despite a positively increasing trend between 2010 and 2013, in recent years donor aid flows for ‘Basic nutrition’ have decreased, both in absolute terms and as a proportion of total ODA. Disappointingly, it continues to be less than 1% (Fig. 7), despite the well-established huge returns on investment and the cross-sectoral benefits of improved nutrition.
FINANCIAL TRANSITIONWhile MICs unquestionably need to increase ownership and domestic financing for nutrition, the annual global nutrition-specific financing need for USD 7 billion cannot be fulfilled only through domestic resources. Donor financing will continue to play a role in the global nutrition financing architecture.
However, for many donors, Gross National Income (GNI) forms a basis of their financing decisions alongside World Bank income classifications. This could lead to a shift in less nutrition aid going to MICs, particularly LMICs. In the case of nutrition, this narrow economic measure is not a suitable test of eligibility in isolation – as we have seen above, economic growth has not led to corresponding improvements in nutrition outcomes. When donors decide where to allocate their nutrition support, or if they are going to change the nature of their support, they must include a mechanism which considers health, inequality and malnutrition indices alongside national economic figures. Failure to do this will exacerbate the burden of malnutrition in MICs as well as stunting a country’s capability to further develop economically. The SDGs will not be achieved if donors base their transition policies solely on economic progress.
Donor support can stop, decline, or change in nature. This new relationship may mean involvement from new actors such as different donor-country government departments, or a change in the focus of financial support towards different sectors. This process of a change in relationship is known as ‘transition’. There may be occasions when more than one donor enters into transition in the same recipient country at the same time. This is known as ‘simultaneous transition’
A sudden decline in donor support means MICs facing transition can face massive financial pressures just as they are attempting to scale up and take control of their own development programmes on nutrition and health. Further, transition in one donor relationship is likely to
trigger transition levels for other donors as well, and this simultaneous transition could have a potentially devastating impact on the progress achieved, or that which could be achieved against development challenges including malnutrition.
Donors must therefore ensure that any transition is a gradual approach which is openly communicated to all involved stakeholders, including national governments and, vitally, local civil society organisations. All donors must also communicate regularly amongst themselves to avoid the consequences of simultaneous transition, and to ensure the progress they have helped to generate is not jeopardised, and that human life is not placed at risk.
WHAT IS TRANSITION?
TECHNICAL SUPPORT AND CAPACITY BUILDINGInternational donors can continue to play an important role despite financial transitions. Years of programmatic and policy expertise can be lost if support in building capacity and technical approaches is not considered central to transition. This support should include guidance on the design and delivery of nutrition programmes, as well as securing national government support for taking over pre-existing donor programmes which are successful but are being phased out due to a donor changing its financing. Furthermore, the support donors can supply to macroeconomic processes can be transformative for fledgling economies. Donors have an important role in supporting the improvement of financial and governance structures, and supporting management processes in order for greater domestic funds to be raised.
Civil Society Organisations (CSOs) are important partners throughout this process. Donors must work with country governments in order to support the procurement of services by CSOs where national governments are unable to act. Further, strong CSOs act as key risk mitigation actors post-transition. They are able to hold governments to account, generating the required political will to keep nutrition programmes improved and scaled up.
In addition to financial support through ODA, donors can play an important role in improving nutrition impact by providing technical assistance to high burden countries in developing stronger policy frameworks, costed plans for nutrition, improving national budgetary allocation and defined budget lines for nutrition, and establishing multi-stakeholder platforms. Additionally, capacity building can be supported at national and sub-national levels to help sustain the efforts for nutrition even when donors begin to transition.
4
41.2%
13.7%
25.5%
All donor disbursements to Basic Nutrition (USD millions)
ODA allocation to Basic Nutrition as a % of total ODA (All donors)
2007 2010 2011 2012 2013 2014 2015 2016
41.2%
2007 2010 2011 2012 2013 2014 2015 2016
856.303
0.47
0.50
0.56
0.560.49
0.30
0.20
0.30
866.784936.625
945.879
730.104
468.709439.802
222.569
FIGURE 7: TOTAL AND PERCENTAGE DONOR DISBURSEMENTS TO ‘BASIC NUTRITION’, AS PER THE OECD34

16 | THE MALNOURISHED MIDDLE: BREAKING THE CYCLE OF MALNUTRITION IN MIDDLE-INCOME COUNTRIES THE MALNOURISHED MIDDLE: BREAKING THE CYCLE OF MALNUTRITION IN MIDDLE-INCOME COUNTRIES | 17
4 ADDRESSING NUTRITIONAL INEQUITIES The SDGs endorsed the principle of ‘leave no-one behind’, in that the targets should be met for all nations, people, and sections of society. This also applies to SDG 2 which seeks to ‘End malnutrition in all its forms by 2030’. Resources, programmes, and capacity building need to be scaled up overall and sustained, but there is also a need for a more targeted and concerted approach towards the groups most vulnerable to malnutrition and its devastating impact.
Not only do MICs disproportionately bear the majority of the global malnutrition burden, this burden is inequitably distributed within these countries. Our analysis based on disaggregated data available in 60 of the 89 MICs33 reinforces that children from the poorest wealth quintile are more likely to be stunted than those from the richest quintile34 (Fig. 8), but Tonga and Montenegro were noticeable exceptions. In Vietnam, Jordan, and El-Salvador this ratio was nearly 7:1, while Iranian children from the poorest groups were shockingly 17 times more likely to be stunted than those from the richest.
Stunting prevalence is also governed by a clear rural-urban divide, with 64 of the 70 MICs that had data disaggregated by location, reporting higher stunting rates in children from rural areas than those from urban areas35.
Maternal education is another critical factor determining nutritional outcomes for children. In 31 of the 89 MICs with data available on stunting disaggregated by maternal education, children of mothers with no education reported up to 5 times higher stunting rates than those whose mothers had completed secondary or higher levels of schooling (Fig. 9)36.
Even a success story like Peru demonstrates that, despite remarkable reductions in average national stunting rates, greater efforts are needed to tackle the socioeconomic inequities governing malnutrition.
Addressing malnutrition requires actions to be taken on the underlying socioeconomic factors. The hardest to reach populations are often the most marginalised, and
the most vulnerable to these factors, and malnutrition itself. This also applies to MICs, where the benefits of economic growth may not reach these groups. Moreover, malnutrition and ill-health entrench them further in a vicious intergenerational cycle. It is all the more essential that all planning and implementation for nutrition in MICs firmly embeds the ‘leave no-one behind’ principle at its core, reaching the poorest and most marginalised wherever they may be.
Improving nutrition among these groups may indeed be more challenging and require more investment and actions. However, reaching them makes a moral, development, and economic case for progress. Good nutrition will advance the ability of these individuals to seize opportunities and improve their quality of life and prosperity, thus reducing inequalities and dependence on the efforts of external stakeholders in the long run. Prioritising the most disadvantaged while designing and rolling-out nutrition relevant programmes could also increase the likelihood of non-marginalised malnourished groups being benefited along the way, thus reducing the need for separate and additional vertical efforts for the two.
Stunting was recognised as a huge threat to the people’s potential and economic progress in Peru; a country with one of the fastest rates of economic growth in Latin America. In 2005, it also had one of the highest rates of childhood stunting in the region, which had been largely stagnant for a decade. However, vigorous political and economic prioritisation to address stunting helped to more than halve national rates from 28% (2005) to 13% (2016). Stunting was reduced in both rural (47.1% to 26.5%) and urban areas (13.5% to 7.9%) over the same period37.
Ambitious targets, evidence-based and targeted policy setting, multi-sectoral and multi-stakeholder efforts and coordination, budgetary allocation, and results-based incentives were among some of the steps in creating an enabling environment for nutrition in Peru, which contributed to this stunting reduction. Advocacy led by civil society and international organisations bolstered the political ambition, while domestic as well as donor investments and technical support helped to accelerate improved nutrition outcomes.
While there are a number of positive lessons to be learnt from
the country’s experience in stunting reduction, the extent of malnutrition driven by socioeconomic inequalities cannot be missed. Despite the overall reductions, stunting in the rural areas is still over three times that in urban areas. Stunting in children from the poorest wealth quintile is also found to be nine-fold that in children from the wealthiest quintile38. Moreover, children of mothers who have had no education present four times higher stunting rates than those whose mothers have completed secondary school or higher education39. At the same time children from indigenous Quechua, Aymara and Amazonian communities exhibit 3-4 times higher stunting rates than those from non-indigenous communities40.
While Peru’s overall stunting reduction has been incredible, and sets an example for other MICs to follow, it still needs to tackle inequities in its malnutrition burden to ensure no Peruvian child suffers its devastating impact across their lifecycle. This will require continued, better, and integrated investments along with focused approaches to reach the most vulnerable groups with improved nutrition. Such efforts will sustain the downward trend in malnutrition rates.
THE SHADOW BEHIND PERU’S SUCCESS IN STUNTING REDUCTION
4
LMICs (n=22) UMICs (n=20)
LMICs
VietnamLao
LesothoNigeriaZambia
Kyrgtz RepublicIndonesiaBotswana
PakistanCosta Rica
KenyaCameroon
TajikstanGhana
PeruMauritaniaBangladeshPhilippinesGuatemalaEl Salvador
<1
1-2 times
2-3 times
3-4 times
4-6 times
6-10 times
>10 times
No data
Wasting
Overweight
LICs HICsUMICs
16%
47%
28%
10%25%
10%
44%
35%
11%
7%
66%
8% 1% 1%
0 5 10 15 20 25 30
000.10.20.5
1.92.5
3.63.74.04.34.54.74.8
5.36.5
8.28.6
10.8
27.6
30
4
6
13
19
15
2
301
19.6%
34.2%
24
2
68
6
4
2
3
1
11
2
41.2%
13.7%
25.5%
42.1%
Stunting in children from the poorest groups relative to the richest
Number of countries
Valid planswhich could
not be assessed
No targets1-2 globalnutritiontargets
3 targets4 targets5 targetsAll 6 globaltargets
LMICs
Plan not found/Inaccesible
Invalid nutritionpolicy, no develpmentpolicy prioritisingnutrition
Invalid nutritionpolicy, but valid develpmentpolicy with specificnutrition focus
Valid nutritionpolicy
HICsUMICs
2007 2010 2011 2012 2013 2014 2015 2016
856.303
866.784936.625
945.879730.104
468.709439.802
222.569
4
No education
60
50
40
30
20
10
0
41.2%
13.7%
25.5%
42.1%
% Stunting in children under five years
Ho
nd
ura
s
Per
u
Bo
livi
a
Co
lum
bia
Suri
nam
e
Bel
ize
Cam
ero
on
Nig
eria
Pak
ista
n
Vie
tnam La
o
Do
min
ican
Rep
ub
lic
Gh
ana
Mau
rita
nia
Bh
uta
n
Swaz
ilan
d
Jord
an
Ind
ia
Gu
yan
a
Mal
div
es
Thai
lan
d
Co
ngo
Leso
tho
Zam
bia
Van
uat
u
Sao
To
me
and
Pri
nci
pe
Gab
on
Egyp
t
Nam
ibia
Mo
ngo
lia
Co
te d
’Ivo
ire
Primary school Secondary school
FIGURE 8: STUNTING PREVALENCE IN CHILDREN FROM THE POOREST WEALTH QUINTILE, RELATIVE TO THOSE FROM THE RICHEST QUINTILE, IN 89 NON-FRAGILE MICS
FIGURE 9: STUNTING DISPARITIES (%) DISAGGREGATED BY MATERNAL EDUCATION, IN 31 NON-FRAGILE MICS WITH AVAILABLE DATA

18 | THE MALNOURISHED MIDDLE: BREAKING THE CYCLE OF MALNUTRITION IN MIDDLE-INCOME COUNTRIES THE MALNOURISHED MIDDLE: BREAKING THE CYCLE OF MALNUTRITION IN MIDDLE-INCOME COUNTRIES | 19
5 INNOVATIVE SOLUTIONS FOR NUTRITIONThe world is currently massively off-track to meet the global nutrition targets, and addressing malnutrition in MICs is vital to bring it back on-track. The above actionable areas for success require committed leadership, but also effective, efficient, and more innovative solutions alongside partnerships to amplify and fast-track nutrition improvement in MICs. Business as usual, especially amidst growing occurrences of humanitarian crises and climate change related impact on food systems, will push the SDGs further out of reach and exacerbate human suffering.
INNOVATIVE FINANCINGIt is clear that current levels of investments from all sources will be inadequate to meet the overall financing gap for nutrition, impeding progress towards the global goals. While countries are starting to recognise and mobilise more investments for nutrition, overall nutrition financing in MICs needs an exponential boost. This needs an increase in domestic spending on nutrition in MICs alongside continued and increased donor support. However, together these are still insufficient to reach the desirable scale of nutrition improvement. Innovative financing mechanisms and partnerships that leverage existing and new nutrition investments in MICs can greatly augment domestic spending, especially in a transitioning donor environment.
IMPROVED CROP SYSTEMSTackling the malnutrition epidemic in MICs necessitates innovative approaches to improve the availability, access-ibility, affordability, consumption and absorption of diverse and nutritious food, with actions to improve health and other social determinants that undermine positive nutrition outcomes. One among such innovative approaches is bio-fortification.
Biofortification through conventional cross-breeding of staple crops naturally rich in vitamins and minerals can yield nutritionally superior crops, alongside these varieties also presenting other desirable agronomic traits such as higher yields and climate smartness.
In MICs, this novel approach holds great potential, as it is a cost-effective way to improve nutrition41 without drastically changing eating patterns. Programmes such as Harvest Plus that work in partnership with governments, businesses, and civil society in many countries, including MICs Bangladesh, India, Nigeria, Pakistan, Zambia, Brazil, Colombia, El Salvador, Guatemala, Honduras, Nicaragua, and Panama, are developing and expanding biofortified varieties such as iron-rich pearl millet, zinc-rich wheat and rice, and vitamin-A rich cassava, maize, and orange sweet potato. Such crops can be transformational in tackling malnutrition in these countries.
Important components of such programmes include training and technical support to government agriculture extension programmes, seed production and distribution, educating farmers and supporting them, and public awareness campaigns to improve demand and consumption. While initial investments are high to enable research, development, and procurement, recurring costs are virtually negligible once crops are brought into cultivation cycles. Of course, government buy-in and ownership is crucial to ensure sustainability of these biofortification programmes.
The Power of Nutrition catalytic financing facility was launched at the Nutrition for Growth (2013) summit, with seed investment from the UK’s Department for International Development ( DFID), the UBS Optimus foundation, and the Children’s Investment Fund Foundation (CIFF). UNICEF and the World Bank are the leveraging and implementing partners. This mechanism seeks to incentivise and attract additional public, private, and philanthropic investments to address undernutrition in Asian and African high-burden countries.
Investments are quadrupled from the point of investment to its disbursement on the ground, thus enabling a bigger scale up of high-impact nutrition programmes in country. Countries are chosen based on the burden of malnutrition, the commitment
and potential for co-financing in country, and the capacity to deliver programmes at scale. They currently have an active portfolio of investments of USD 190 million in Ethiopia, Tanzania, Liberia, and Madagascar, with investments worth around USD 250 million in the pipeline in Benin, Cote d’Ivoire, India, and Rwanda. So far, only two of these are MICs, but there is a huge opportunity in expanding this further to the other MICs.
Investors stand to benefit from greater value-for their money alongside the advantages of pooled risk, multiplied investments, and effective partnerships. These ultimately lead to more improved nutrition outcomes than are achievable through siloed investments. Simultaneously, recipient countries secure higher benefits to costs through their domestic investments for nutrition.
THE POWER OF MULTIPLIED NUTRITION INVESTMENTS IN MICS
BIOFORTIFICATION THROUGH CONVENTIONAL PLANT BREEDING FOR NUTRITION IMPROVEMENT
Photo: Ferry Tan/ACTION

20 | THE MALNOURISHED MIDDLE: BREAKING THE CYCLE OF MALNUTRITION IN MIDDLE-INCOME COUNTRIES THE MALNOURISHED MIDDLE: BREAKING THE CYCLE OF MALNUTRITION IN MIDDLE-INCOME COUNTRIES | 21
PUBLIC AND MEASURABLE
POLITICAL COMMITMENT
TRANSPARENT AND TRACKABLE
NUTRITION INVESTMENTS
POLICY FRAMEWORKS WITH SMART
TARGETS
ROBUST, TIMELY, AND
DISAGGREGATED DATA
1 2 3 4
Gaps in timely, reliable, disaggregated, and readily accessible data pose a critical barrier to developing and implementing streamlined and targeted policies and programmes to address malnutrition in MICs. These also impede accountability by making monitoring and evaluation of nutrition actions a challenge. Addressing this is important for the enormous burden of malnutrition in these countries, and the urgent need to scale up evidence based SMART actions whose impact is measurable to assess what works and what does not.
Existing data gaps in nutrition budgetary allocations, such as in the 69 non-fragile MICs where this data was unavailable, and in costings of policy frameworks hinders effective guidance of nutrition efforts and tracking of their impact. Gaps in malnutrition data disaggregated by key socioeconomic indicators such as wealth quintiles and maternal education also impede the understanding of the true distribution of malnutrition and thus the targeted action required. In addition, for a number of countries, data on the malnutrition burden and its disaggregation was out of date. Huge data gaps prevent understanding the true picture of malnutrition in these countries, which is quite likely to be worse than it already seems.
Accountability for nutrition, which includes timely and robust data, is necessary to demonstrate ongoing commitment and guide nutrition efforts (Fig 10). The absence of accountability is indicative of the low prioritisation of nutrition.
ROLE OF CIVIL SOCIETYCivil society must be viewed as a constructive ally for governments and other stakeholders in MICs in the fight against malnutrition. It plays a role in the development of improved nutrition systems, starting with raising the profile for the issue, engaging governments to improve political will, bringing together various stakeholders, and shaping effective policy and programmes for nutrition. It is also instrumental for evidence building, monitoring and evaluation, and learning and sharing.
6 DATA AND ACCOUNTABILITY
Most importantly, civil society is crucial to strengthening accountability for nutrition efforts in-country and at regional and global levels.
Of the 25 SUN movement signee countries within the cohort of 89 MICs, alliances of civil society organisations have been established in 14 countries. They are working towards raising and ensuring the political momentum for nutrition, supporting governments with budgetary analyses, development and delivery of SMART policy and legal frameworks, and helping establishing multi-stakeholder platforms.
FIGURE 10: STEPS TOWARDS IMPROVING ACCOUNTABILITY FOR EFFORTS TO ADDRESS MALNUTRITION IN MICS
Photo: Abhishek Bali//RESULTS UK

THE MALNOURISHED MIDDLE: BREAKING THE CYCLE OF MALNUTRITION IN MIDDLE-INCOME COUNTRIES | 23
Based on the burden as a whole, and its disaggregation, this report has sought to outline steps that can effectively address and reduce malnutrition in MICs. The aim is to promote inclusive and sustainable development in these countries and globally. It sets out examples of country ownership and political will for malnutrition, robust policy development, target setting and scaling up of effective solutions. It also looks into innovative financing and better nutrition through innovative crop systems to address the scale of this issue.
In addition, it highlights the need for greater country ownership alongside continued support from the donor
community and other stakeholders, particularly given the threat to progress on account of donor transition.
Children who escape stunting in childhood, are 33% more likely to escape poverty as adults42. There is little doubt that, unless malnutrition in these countries is effectively and equitably reduced, furthering inclusive and sustainable development is unlikely. The future of these MICs relies heavily on the quality and potential of their human capital. However, in light of their burden of malnutrition, this future can only be as bright as that of the malnourished individuals who shape it.
22 | THE MALNOURISHED MIDDLE: BREAKING THE CYCLE OF MALNUTRITION IN MIDDLE-INCOME COUNTRIES
CONCLUSION1 Global Nutrition Report Country profiles (2017). [Accessed November 2017]. 2 Shekar, M., Jakub, K., Dayton Eberwein, J., Walters, D. (2017). An Investment Framework for Nutrition: Reaching the Global targets for Stunting, Anaemia, Breastfeeding, and Wasting. Directions in Development – Human Development. World Bank, Washington DC. 3 Ibid. 4 OECD Creditor Reporting System (2017). Official Development Assistance to Basic Nutrition. http://stats.oecd.org/# [Accessed December 2017]. 5 The World Bank http://www.worldbank.org/en/country/mic/overview [Accessed 06 Oct 2017]. 6 The World Bank Harmonised list of Fragile Situations FY18. http://pubdocs.worldbank.org/en/189701503418416651/FY18FCSLIST- ‐Final- ‐July- ‐2017.pdf [Accessed 06 Oct 2017]. 7 Global Nutrition Report Country profiles (2017) http://www.globalnutritionreport.org/the- ‐data/nutrition- ‐country- ‐ profiles/ [Accessed November- ‐December 2017]. 8 UNICEF, WHO, World Bank Group (2017). Levels and Trends in Child Malnutrition. Joint Child Malnutrition Estimates. Key findings of the 2017 edition. http://www.who.int/nutgrowthdb/jme_brochoure2017.pdf?ua=1 [Accessed 07 July 2017]. 9 The World Health Organisation Global Database on the Implementation of Nutrition Action (GINA) https://extranet.who.int/nutrition/gina/ [Accessed April- ‐ July 2017]. 10 Scaling Up Nutrition Country profiles http://scalingupnutrition.org/sun- ‐countries/about- ‐sun- ‐countries/ [Accessed July 2017]. 11 Global Nutrition Report Country profiles (2017). 12 UNICEF, WHO, World Bank Group (2017). 13 Ibid. 14 The World Bank Data (Mortality from CVD, cancer, diabetes, or CRD between exact ages 30 and 70 in 2015 (%). https://data.worldbank.org/indicator/SH.DYN.NCOM.ZS?locations=XP [Accessed 30 August 2017]. 15 The World Bank data (2017). Number of under- ‐five deaths, disaggregated by Middle- ‐Income countries [Accessed 17 Oct 2017]. 16 Global Panel (2016). The cost of malnutrition. Why policy action is urgent. Global Panel on Agriculture and Food systems on Nutrition. London, UK. https://www.glopan.org/sites/default/files/pictures/CostOfMalnutrition.pdf [Accessed 12 August 2017]. 17 Itoh, H., and Kanayama, N. (2015). Nutritional conditions in early life and risk of non- ‐communicable diseases (NCDs) from the perspective of preemptive medicine in perinatal care. Hypertens Res Pregnancy 2015; 3: 1- ‐12. 18 International Food Policy Research Institute (2016). Global Nutrition Report 2016: From promise to impact. Ending malnutrition by 2030. Washington, DC. 19 Shekar, M., Heaver, R., and Lee, Y.K. (2006). Why invest in nutrition? The World Bank. 20 International Food Policy Research Institute (2016). 21 Gostelow L., Desplats G., Shoham J., et al. (2015). Nutrition and Resilience. A scoping Study. http://files.ennonline.net/attachments/2450/Resilience- ‐report- ‐final.pdf [Accessed 12 November 2017]. 22 Dufour, C., Kauffmann, D., Marsland, Neil. (2014). Strengthening the links between resilience and nutrition: A proposed approach. International Food Policy Research Institute
(IFPRI). http://ebrary.ifpri.org/cdm/ref/collection/p15738coll2/id/128164 [Accessed 16 May 2017]. 23 Kenya: Humanitarian Dashboard as of 26 May 2017 (2017). United Nations OCHA https://reliefweb.int/sites/reliefweb.int/files/resources/KEN_Dashboard_26May2017.pdf [Accessed 21 December 2017]. 24 Laura Kerr (2017). Owning it. RESULTS UK, 2017. 25 Gillespie, S., Haddad, L., Mannar, V., et al. (2012). The Politics of Reducing Malnutrition: Building Commitment and Accelerating Progress. The Lancet, Vol. 382, Issue 9891, 552- ‐569. 26 ASEAN Leaders Declaration on Ending All Forms of Malnutrition (2017) at the 31st ASEAN Summit in Manila, Philippines. http://asean.org/storage/2017/11/2.- ‐ADOPTION_2017_ALD- ‐on- ‐Ending- ‐All- ‐Forms- ‐of- ‐ Malnutrition_Endorsed- ‐by- ‐the- ‐AHMM.pdf [Accessed 04 December 2017]. 27 Shekar, M., Jakub, K., Dayton Eberwein, J., Walters, D. (2017). 28 Development Initiatives (2017). Global Nutrition Report 2017: Nourishing the SDGs. Bristol, UK. 29 International Food Policy Research Institute (2016). 30 Scaling Up Nutrition (2016). Checklist on the Criteria and Characteristics of ‘Good’ National Nutrition Plans. http://docs.scalingupnutrition.org/wp- ‐content/uploads/2016/12/Scaling- ‐Up- ‐Nutrition- ‐Quality- ‐national- ‐plan- ‐ checklist.pdf [Accessed 24 October 2017].31 Shekar, M., Jakub, K., Dayton Eberwein, J., Walters, D. (2017). 32 OECD Creditor Reporting System (2017). 33 UNICEF (2016) The State of the World’s Children. A fair chance for every child. UNICEF. June 2016. [Accessed 20 October 2017]. 34 Ibid. 35 Ibid. 36 World Health Organisation (2015). Health Equity Monitor. Child Malnutrition (State of Inequality: RMNCH report). Stunting prevalence in children under five years disaggregated by mother’s education. http://apps.who.int/gho/data/view.wrapper.HE- ‐VIZ02?lang=en&menu=hide [Accessed 07 July 2017]. 37 Marini, A., Rokx, C., and Gallagher, P. (2017). Standing tall. Peru’s Success in Overcoming its Stunting Crisis. World Bank, Washington DC http://documents.worldbank.org/curated/en/815411500045862444/pdf/117053- ‐OUO- ‐FINAL- ‐ Peru- ‐book- ‐FA- ‐SINGLE- ‐PAGES- ‐with- ‐cover.pdf [Accessed 10 August 2017]. 38 UNICEF (2016). 39 Ibid. 40 Marini, A. Rokx, C., and Gallagher, P. (2017). 41 The Copenhagen Consensus results (2008). Expert Panel Ranking http://www.copenhagenconsensus.com/sites/default/files/cc08_results_final_0.pdf [Accessed 30 October 2017]. 42 International Food Policy Research Institute (2016).
ENDNOTES
ABOUT RESULTS UKRESULTS UK is a non-profit advocacy organisation that works to create the public and political will to end extreme poverty. RESULTS’ focus is on educating and empowering people - whether they are ordinary citizens or key decision-makers – to bring about policy changes that will improve the lives of the world’s poorest people. Our advocacy focuses on areas that have the most potential to make a difference. RESULTS UK has a track record of expertise in education, global health and economic opportunity.
RESULTS UK and RESULTS International are partners of ACTION, a global partnership of advocacy organisations working to influence policy and mobilise resources to fight disease of poverty and achieve equitable access to health. ACTION partners work across five continents in both donor and high burden countries.
Founded in 2004, ACTION began as a partnership of independent, locally-established civil society organisations working to mobilise new resources against tuberculosis (TB). Building off successes in fighting TB globally, ACTION expanded its efforts to include child survival, with a focus on expanding access to childhood vaccines and increasing the political will and investment needed to fight childhood undernutrition.
ABOUT ACTION
Photo: Tom Maguire//RESULTS UK

RESULTS UK, 31-33 Bondway, London, United Kingdom, SW8 1SJ+44 (0)207 793 3970 | www.results.org.uk | results.uk | @resultsuk