the marine terminal...
TRANSCRIPT
A View From The Perspective Of
THE MARINE TERMINAL OPERATOR/STEVEDORE
January 29, 2015 • Tampa, Florida
A Presentation By
Bruce E. Cashon
CCO & Senior Vice President
NYK PORTS LLC
• Shifting Trade Patterns: What’s Trending
• Infrastructure Needs & Investment Plans:
Who’s Spending What & Where
• National Freight Infrastructure Policies
OR Lack Thereof
• Takeaways
SHIFTING TRADE PATTERNS
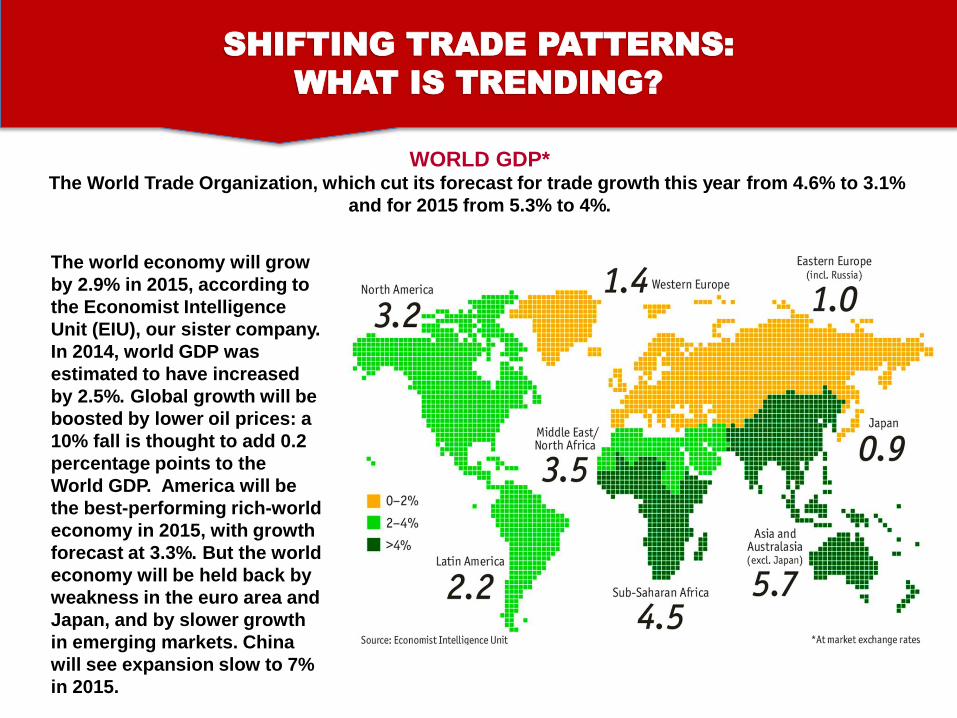
The world economy will grow
by 2.9% in 2015, according to
the Economist Intelligence
Unit (EIU), our sister company.
In 2014, world GDP was
estimated to have increased
by 2.5%. Global growth will be
boosted by lower oil prices: a
10% fall is thought to add 0.2
percentage points to the
World GDP. America will be
the best-performing rich-world
economy in 2015, with growth
forecast at 3.3%. But the world
economy will be held back by
weakness in the euro area and
Japan, and by slower growth
in emerging markets. China
will see expansion slow to 7%
in 2015.
SHIFTING TRADE PATTERNS:
WHAT IS TRENDING?
WORLD GDP*The World Trade Organization, which cut its forecast for trade growth this year from 4.6% to 3.1%
and for 2015 from 5.3% to 4%.
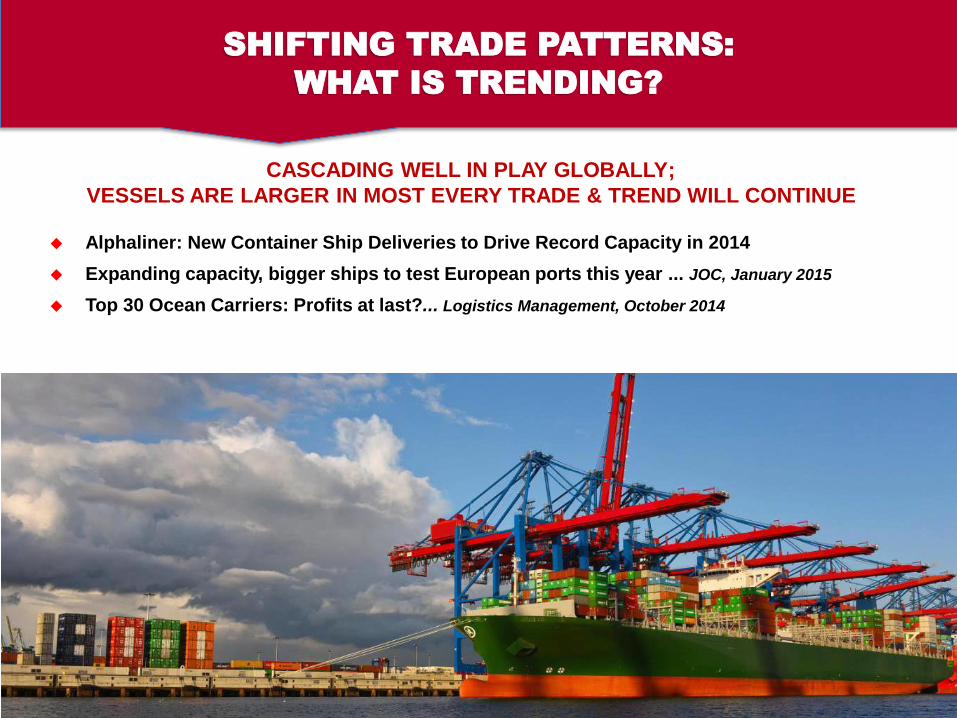
CASCADING WELL IN PLAY GLOBALLY;
VESSELS ARE LARGER IN MOST EVERY TRADE & TREND WILL CONTINUE
Alphaliner: New Container Ship Deliveries to Drive Record Capacity in 2014
Expanding capacity, bigger ships to test European ports this year ... JOC, January 2015
Top 30 Ocean Carriers: Profits at last?... Logistics Management, October 2014
SHIFTING TRADE PATTERNS:
WHAT IS TRENDING?
SHIFTING TRADE PATTERNS:
WHAT IS TRENDING?
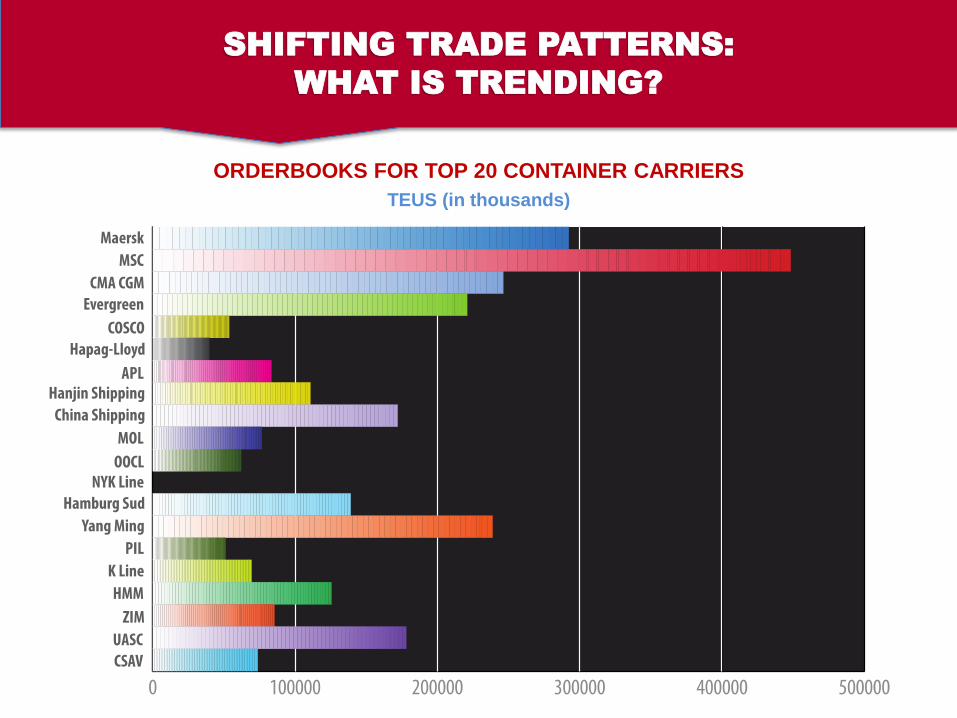
ORDERBOOKS FOR TOP 20 CONTAINER CARRIERS
TEUS (in thousands)

SHIFTING TRADE PATTERNS:
WHAT IS TRENDING?SHIFTING TRADE PATTERNS:
WHAT IS TRENDING?
Drewry warns that late ship deliveries will add to 2015 overcapacity ... Drewry, January 2015
A different recovery for box carriers; a continued reduction of unit costs, rather than the
matching of supply and demand at the individual trade route level ... Drewry, October 2014
Drewry forecasts that freight rates will decline in 2015 by as much as 3-4% year-on-year
... Drewry, October 2014
UBER ALLIANCES CONTINUE BUT CAPACITY VS DEMAND OVERAGE CONTINUES
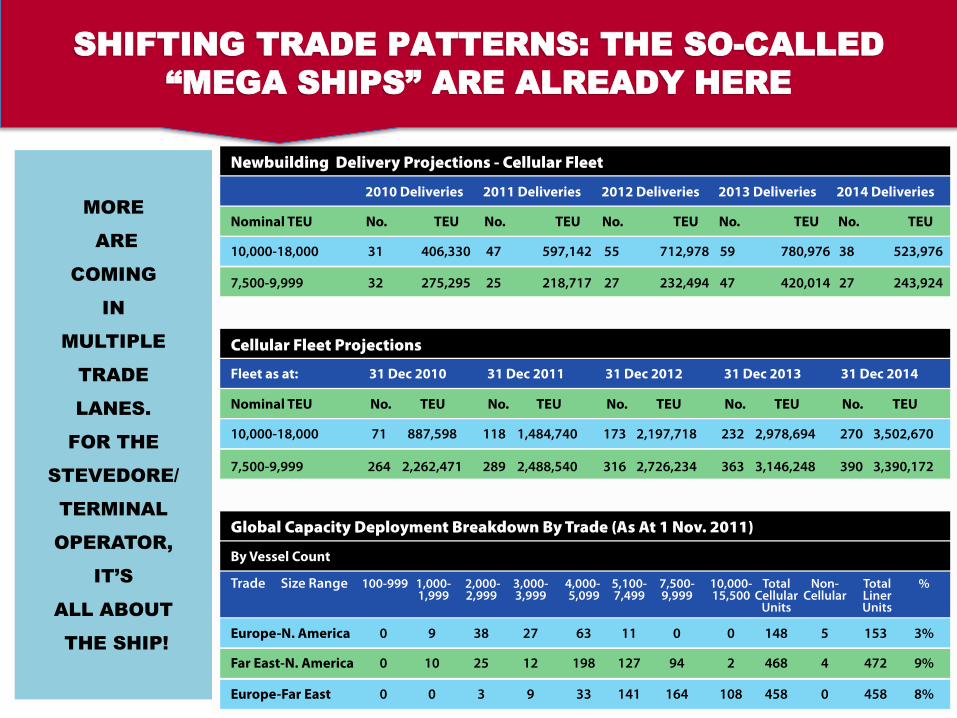
MORE
ARE
COMING
IN
MULTIPLE
TRADE
LANES.
FOR THE
STEVEDORE/
TERMINAL
OPERATOR,
IT’S
ALL ABOUT
THE SHIP!
SHIFTING TRADE PATTERNS: THE SO-CALLED
“MEGA SHIPS” ARE ALREADY HERE
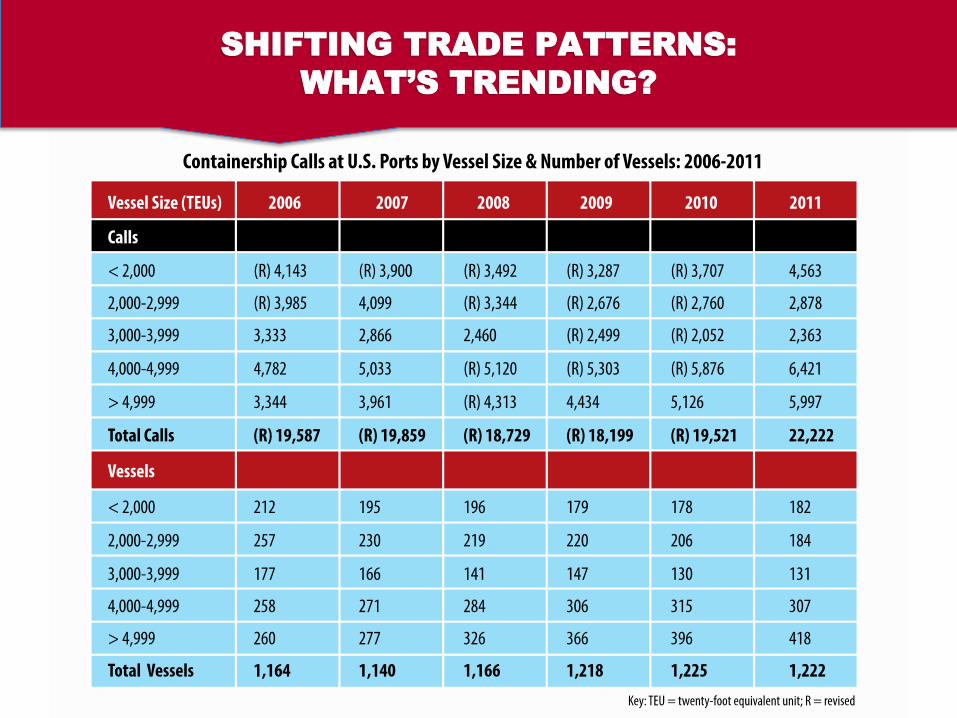
SHIFTING TRADE PATTERNS:
WHAT’S TRENDING?
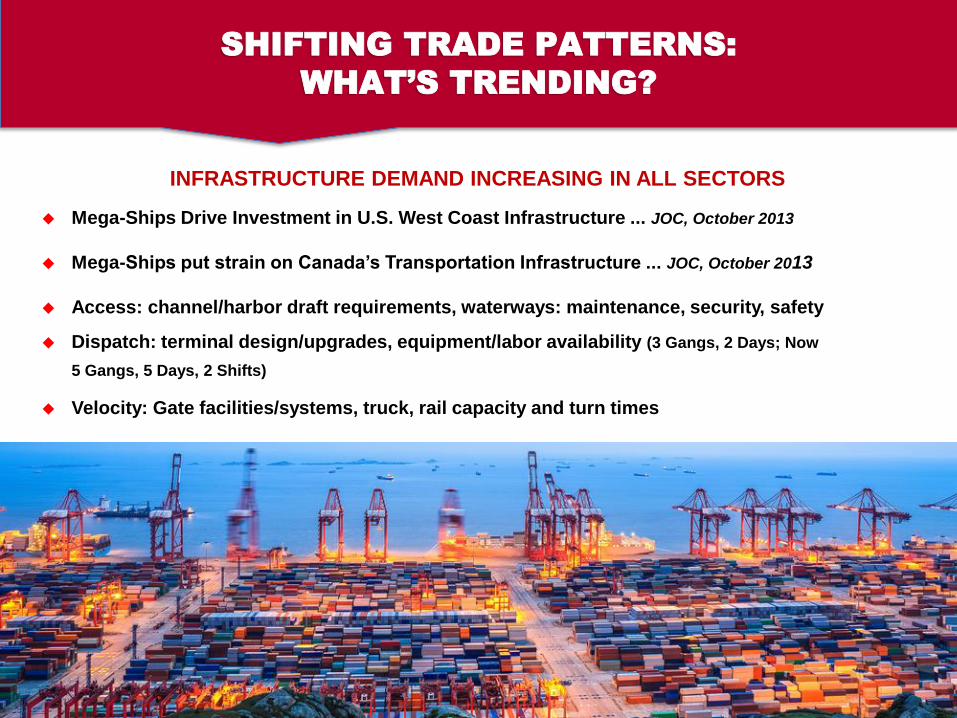
INFRASTRUCTURE DEMAND INCREASING IN ALL SECTORS
Mega-Ships Drive Investment in U.S. West Coast Infrastructure ... JOC, October 2013
Mega-Ships put strain on Canada’s Transportation Infrastructure ... JOC, October 2013
Access: channel/harbor draft requirements, waterways: maintenance, security, safety
Dispatch: terminal design/upgrades, equipment/labor availability (3 Gangs, 2 Days; Now
5 Gangs, 5 Days, 2 Shifts)
Velocity: Gate facilities/systems, truck, rail capacity and turn times
SHIFTING TRADE PATTERNS:
WHAT’S TRENDING?
SHIFTING TRADE PATTERNS:
WHAT IS TRENDING?
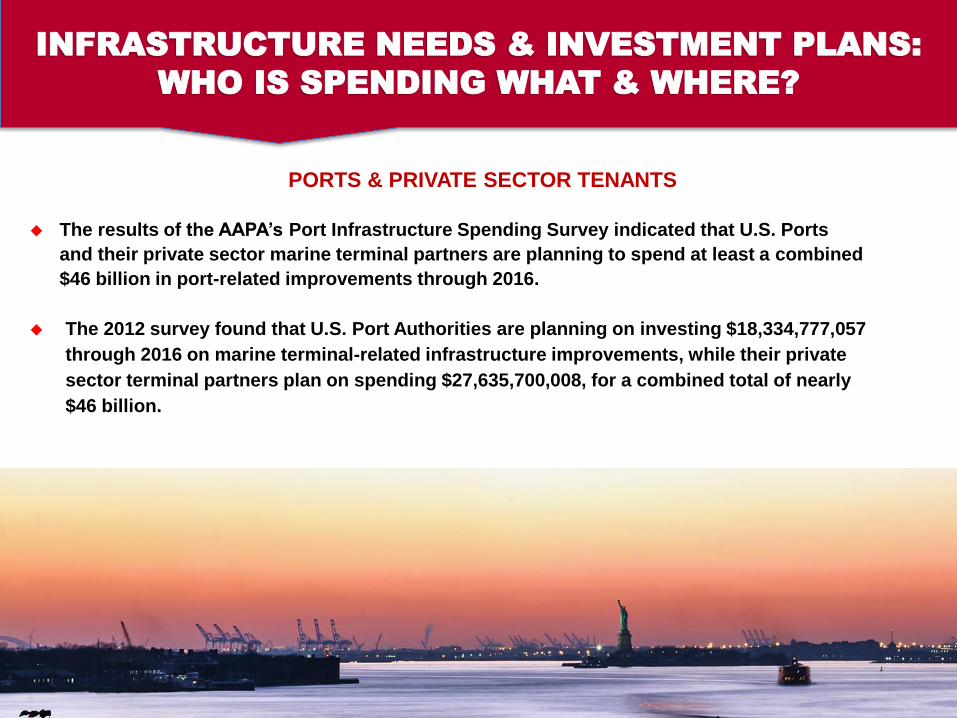
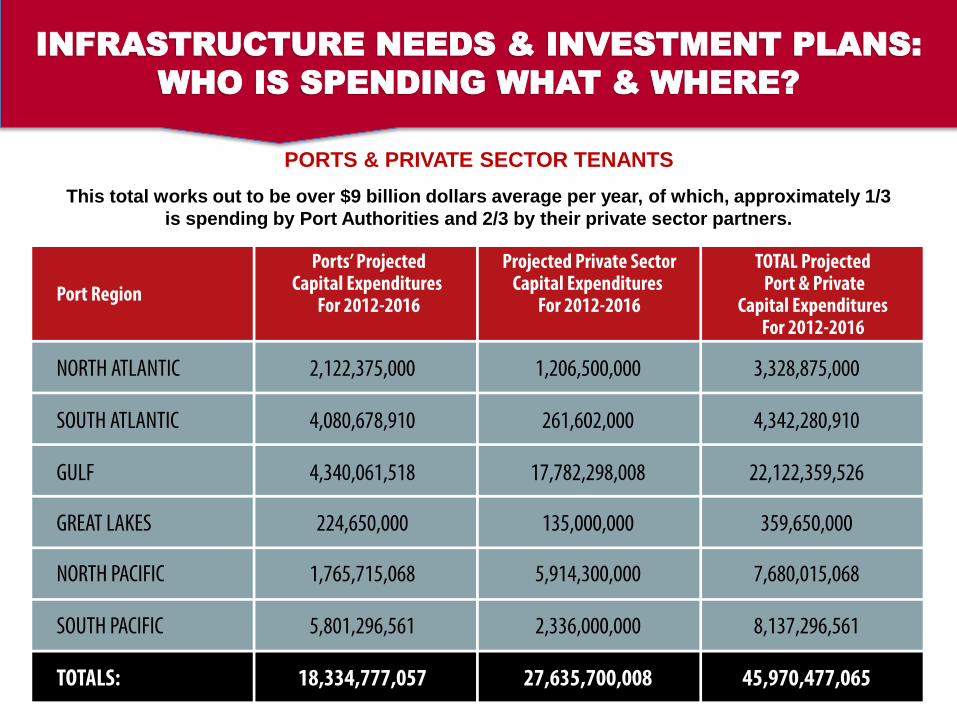
PORTS & PRIVATE SECTOR TENANTS
The results of the AAPA’s Port Infrastructure Spending Survey indicated that U.S. Ports
and their private sector marine terminal partners are planning to spend at least a combined
$46 billion in port-related improvements through 2016.
The 2012 survey found that U.S. Port Authorities are planning on investing $18,334,777,057
through 2016 on marine terminal-related infrastructure improvements, while their private
sector terminal partners plan on spending $27,635,700,008, for a combined total of nearly
$46 billion.
INFRASTRUCTURE NEEDS & INVESTMENT PLANS:
WHO IS SPENDING WHAT & WHERE?
SHIFTING TRADE PATTERNS:
WHAT IS TRENDING?
PORTS & PRIVATE SECTOR TENANTS
This total works out to be over $9 billion dollars average per year, of which, approximately 1/3
is spending by Port Authorities and 2/3 by their private sector partners.
INFRASTRUCTURE NEEDS & INVESTMENT PLANS:
WHO IS SPENDING WHAT & WHERE?
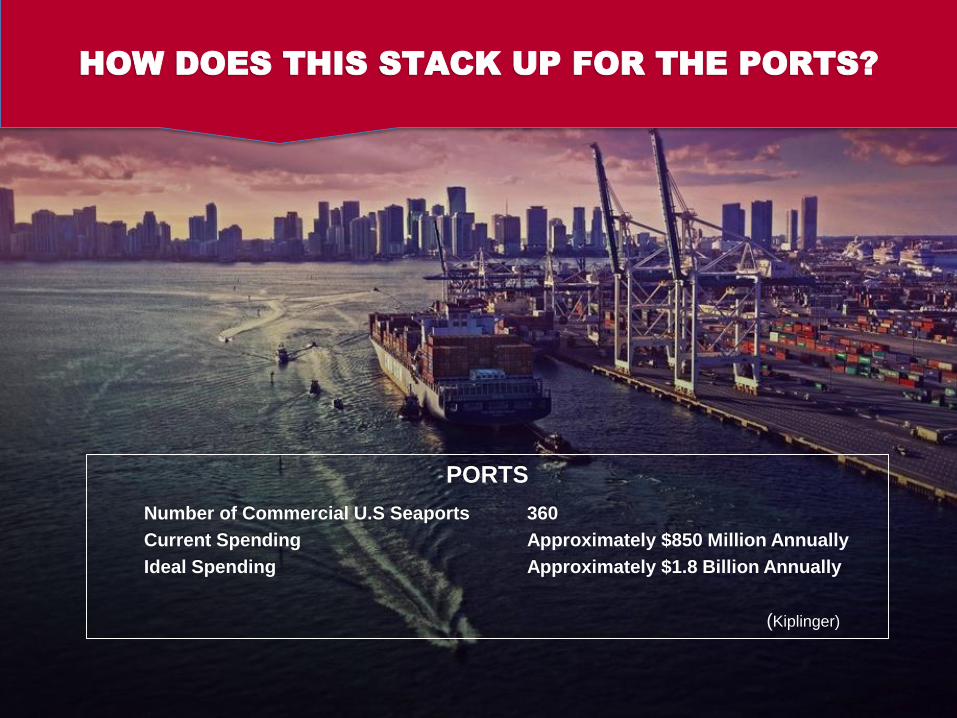
PORTS
Number of Commercial U.S Seaports 360
Current Spending Approximately $850 Million Annually
Ideal Spending Approximately $1.8 Billion Annually
(Kiplinger)
HOW DOES THIS STACK UP FOR THE PORTS?

INFRASTRUCTURE NEEDS & INVESTMENT PLANS
WHO IS SPENDING WHAT & WHERE?
The Port Commission of the Port of Houston Authority
has approved a significant new redevelopment plan
for turning basin properties
| AJOT | January 31, 2012
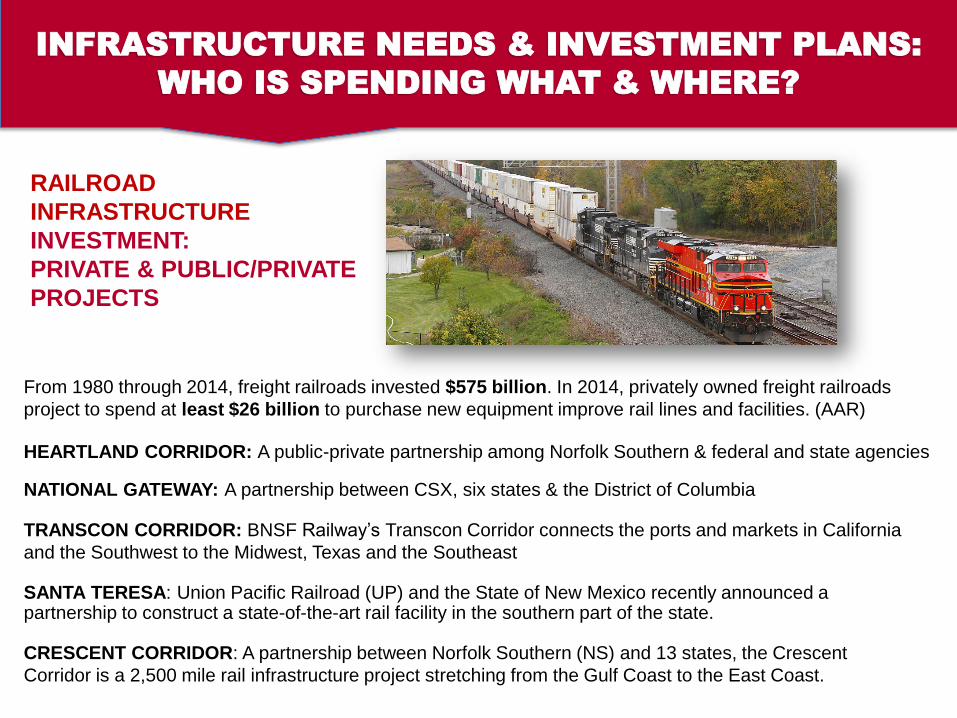
From 1980 through 2014, freight railroads invested $575 billion. In 2014, privately owned freight railroads
project to spend at least $26 billion to purchase new equipment improve rail lines and facilities. (AAR)
HEARTLAND CORRIDOR: A public-private partnership among Norfolk Southern & federal and state agencies
NATIONAL GATEWAY: A partnership between CSX, six states & the District of Columbia
TRANSCON CORRIDOR: BNSF Railway’s Transcon Corridor connects the ports and markets in California
and the Southwest to the Midwest, Texas and the Southeast
SANTA TERESA: Union Pacific Railroad (UP) and the State of New Mexico recently announced a partnership to construct a state-of-the-art rail facility in the southern part of the state.
CRESCENT CORRIDOR: A partnership between Norfolk Southern (NS) and 13 states, the Crescent
Corridor is a 2,500 mile rail infrastructure project stretching from the Gulf Coast to the East Coast.
INFRASTRUCTURE NEEDS & INVESTMENT PLANS:
WHO IS SPENDING WHAT & WHERE?
RAILROAD
INFRASTRUCTURE
INVESTMENT:
PRIVATE & PUBLIC/PRIVATE
PROJECTS
INFRASTRUCTURE NEEDS & INVESTMENT PLANS:
WHO IS SPENDING WHAT & WHERE?
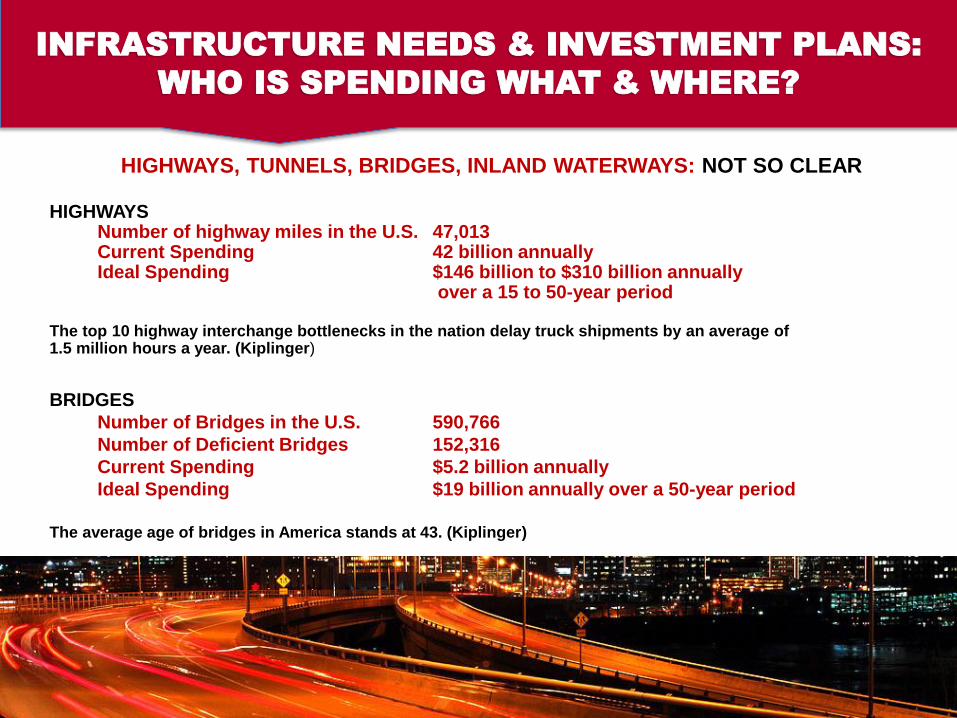
HIGHWAYS, TUNNELS, BRIDGES, INLAND WATERWAYS: NOT SO CLEAR
HIGHWAYSNumber of highway miles in the U.S. 47,013Current Spending 42 billion annuallyIdeal Spending $146 billion to $310 billion annually
over a 15 to 50-year period
The top 10 highway interchange bottlenecks in the nation delay truck shipments by an average of1.5 million hours a year. (Kiplinger)
BRIDGES
Number of Bridges in the U.S. 590,766
Number of Deficient Bridges 152,316
Current Spending $5.2 billion annually
Ideal Spending $19 billion annually over a 50-year period
The average age of bridges in America stands at 43. (Kiplinger)
MAP-21, the MOVING AHEAD FOR PROGRESS IN THE 21ST CENTURY ACT does
not include a stand-alone freight program or dedicated formula funding for freight
but introduces several new provisions to Federal Transportation Policy.
HTF short-term extension (May 2015) kicking the can down the road.
WRDA positive movement and real resource commitment defines needs on port
development. Better focus on HMT utilization and continued grants but there is still
WORK TO BE DONE.
The Freight Stakeholders Coalition Releases Surface Transportation Reauthorization
Platform: Long-term sustainable funding for freight mobility tops recommendations.
(American Trucking Associations National Customs Brokers and Forwarders Association
National Association of Waterfront Employers American Association of Port Authorities
Waterfront Coalition World Shipping Council)
But - still no commitment on funding source improvements
NATIONAL FREIGHT INFRASTRUCTURE
POLICY??
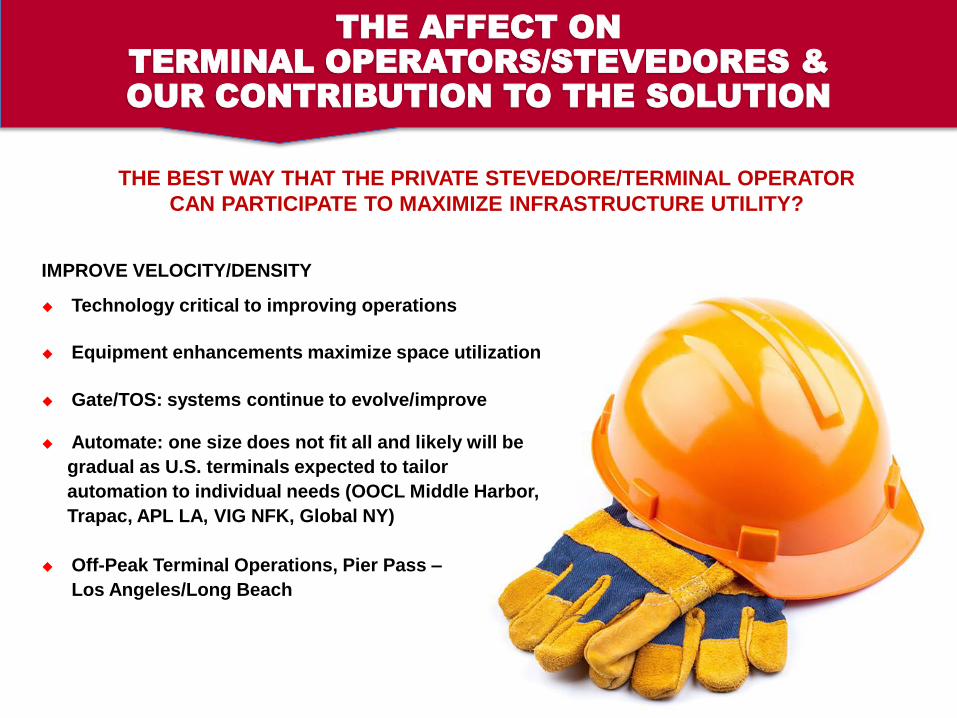
THE BEST WAY THAT THE PRIVATE STEVEDORE/TERMINAL OPERATOR
CAN PARTICIPATE TO MAXIMIZE INFRASTRUCTURE UTILITY?
IMPROVE VELOCITY/DENSITY
Technology critical to improving operations
Equipment enhancements maximize space utilization
Gate/TOS: systems continue to evolve/improve
Automate: one size does not fit all and likely will be
gradual as U.S. terminals expected to tailor
automation to individual needs (OOCL Middle Harbor,
Trapac, APL LA, VIG NFK, Global NY)
Off-Peak Terminal Operations, Pier Pass –
Los Angeles/Long Beach
THE AFFECT ON
TERMINAL OPERATORS/STEVEDORES &
OUR CONTRIBUTION TO THE SOLUTION
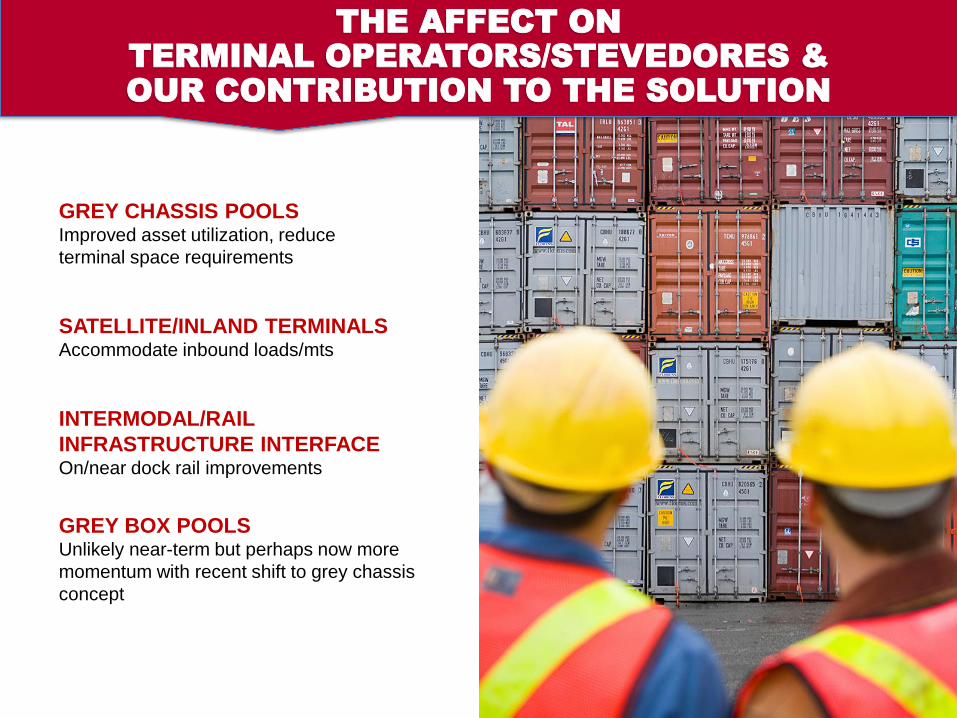
GREY CHASSIS POOLS Improved asset utilization, reduce
terminal space requirements
SATELLITE/INLAND TERMINALS Accommodate inbound loads/mts
INTERMODAL/RAIL
INFRASTRUCTURE INTERFACEOn/near dock rail improvements
GREY BOX POOLS Unlikely near-term but perhaps now more
momentum with recent shift to grey chassis
concept
THE AFFECT ON
TERMINAL OPERATORS/STEVEDORES &
OUR CONTRIBUTION TO THE SOLUTION
OPERATING PROFILE: THE MARKET
Mega Vessels Are Here to Stay
The future is here and will continue to test facility capabilities.
Uber Alliances will increasingly be the staple of major trade lanes. These Alliances
will financially and operationally challenge ports and terminal operators.
INFRASTRUCTURE & TERMINAL INVESTMENT
Substantial Private/Public investment in play
Focus remains fragmented by modal type
Private sector highly focused on return on capital employed and meeting IRR
Continued Public – Private approach
TAKEAWAYS FROM THE PRIVATE SECTOR
THE VIEW OF THE
TERMINAL OPERATOR/STEVEDORE
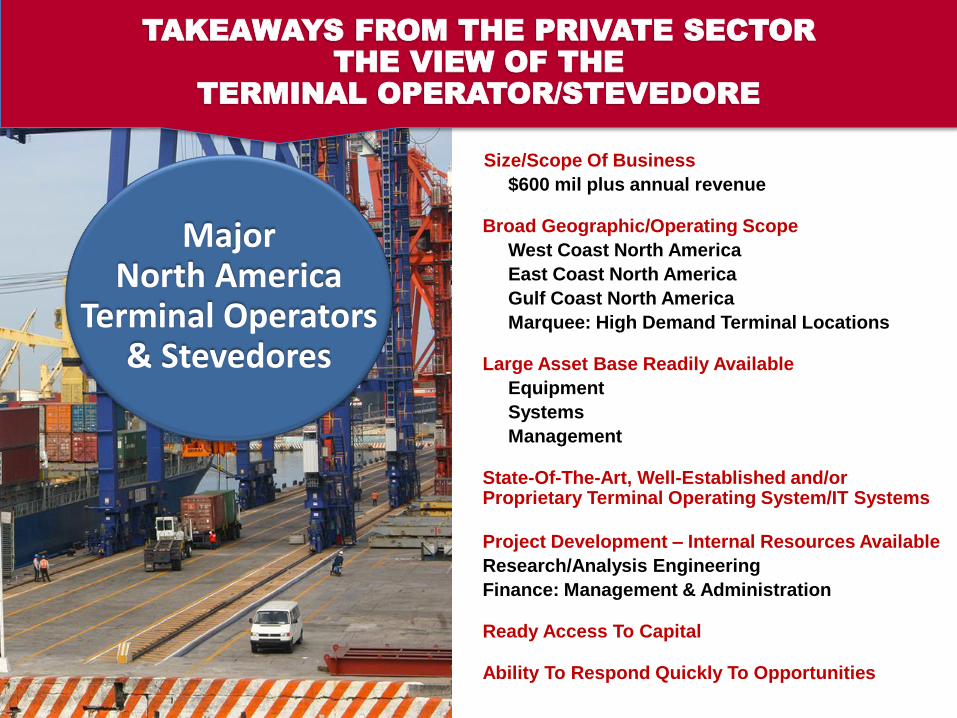
TAKEAWAYS FROM THE PRIVATE SECTOR
THE VIEW OF THE
TERMINAL OPERATOR/STEVEDORE
Size/Scope Of Business
$600 mil plus annual revenue
Broad Geographic/Operating Scope
West Coast North America
East Coast North America
Gulf Coast North America
Marquee: High Demand Terminal Locations
Large Asset Base Readily Available
Equipment
Systems
Management
State-Of-The-Art, Well-Established and/or Proprietary Terminal Operating System/IT Systems
Project Development – Internal Resources Available
Research/Analysis Engineering
Finance: Management & Administration
Ready Access To Capital
Ability To Respond Quickly To Opportunities
Major North America
Terminal Operators & Stevedores
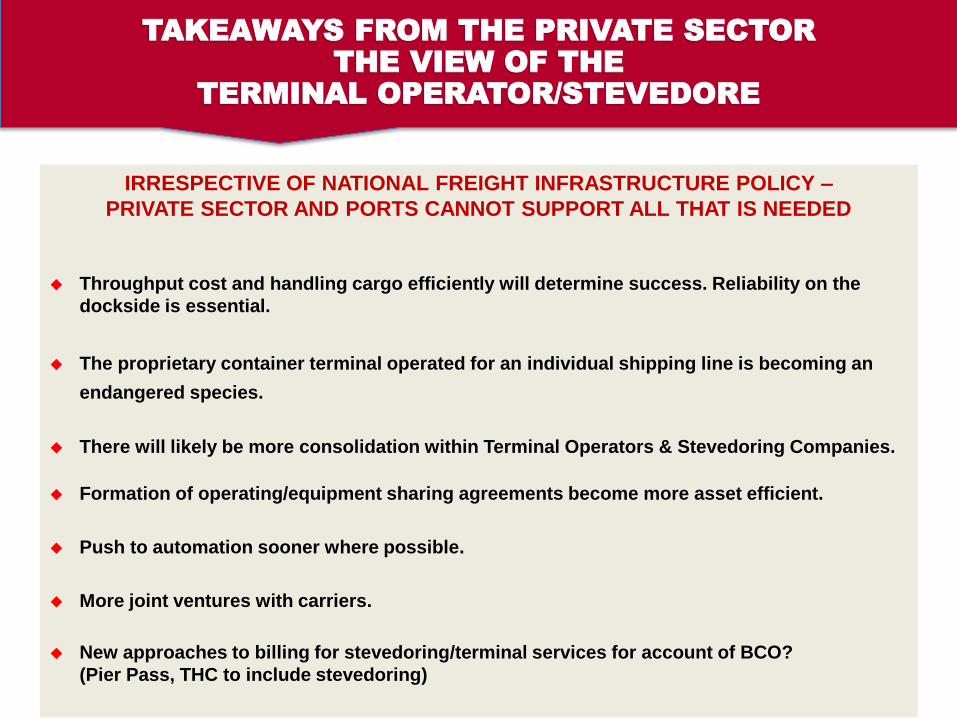
TAKEAWAYS FROM THE PRIVATE SECTOR
THE VIEW OF THE
TERMINAL OPERATOR/STEVEDORE
IRRESPECTIVE OF NATIONAL FREIGHT INFRASTRUCTURE POLICY –
PRIVATE SECTOR AND PORTS CANNOT SUPPORT ALL THAT IS NEEDED
Throughput cost and handling cargo efficiently will determine success. Reliability on the
dockside is essential.
The proprietary container terminal operated for an individual shipping line is becoming an
endangered species.
There will likely be more consolidation within Terminal Operators & Stevedoring Companies.
Formation of operating/equipment sharing agreements become more asset efficient.
Push to automation sooner where possible.
More joint ventures with carriers.
New approaches to billing for stevedoring/terminal services for account of BCO?
(Pier Pass, THC to include stevedoring)
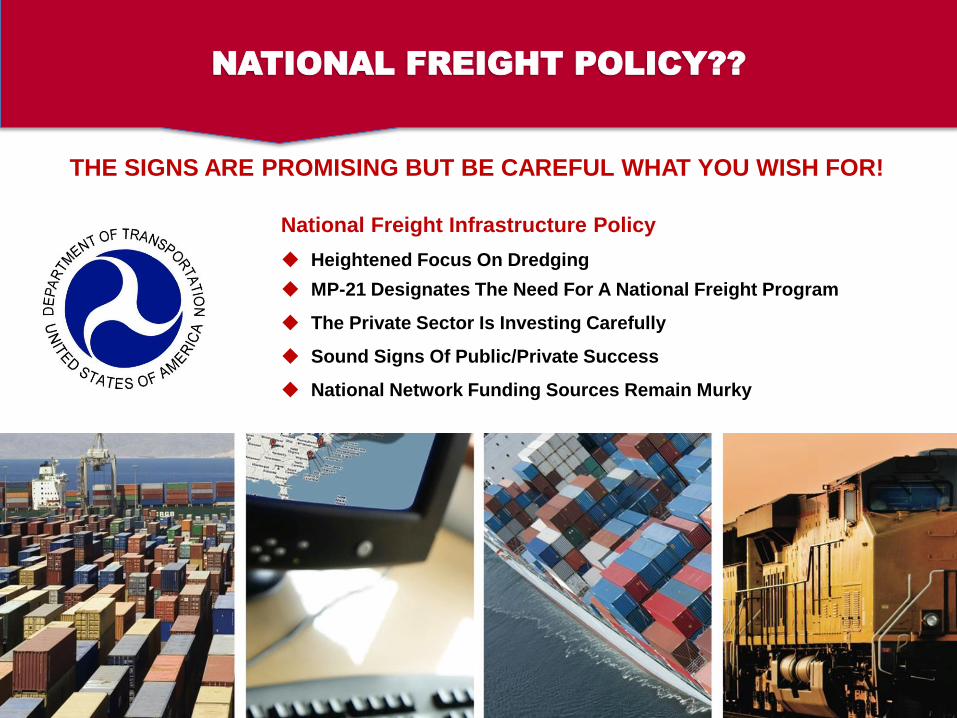
National Freight Infrastructure Policy
◆ Heightened Focus On Dredging
◆ MP-21 Designates The Need For A National Freight Program
◆ The Private Sector Is Investing Carefully
◆ Sound Signs Of Public/Private Success
◆ National Network Funding Sources Remain Murky
NATIONAL FREIGHT POLICY??
THE SIGNS ARE PROMISING BUT BE CAREFUL WHAT YOU WISH FOR!
Thank You!
Enjoy Your Stay in Tampa.