the mechanical earth model concept and its application to high-risk well construction projects
TRANSCRIPT

7/24/2019 The Mechanical Earth Model Concept and Its Application to High-Risk Well Construction Projects
http://slidepdf.com/reader/full/the-mechanical-earth-model-concept-and-its-application-to-high-risk-well-construction 1/13
Copyright 2000, IADC/SPE Drilling Conference
This paper was prepared for presentation at the 2000 IADC/SPE Drilling Conference held inNew Orleans, Louisiana, 23–25 February 2000.
This paper was selected for presentation by an IADC/SPE Program Committee followingreview of information contained in an abstract submitted by the author(s). Contents of thepaper, as presented, have not been reviewed by the International Association of DrillingContractors or the Society of Petroleum Engineers and are subject to correction by theauthor(s). The material, as presented, does not necessarily reflect any position of the IADCor SPE, their officers, or members. Papers presented at the IADC/SPE meetings are
subject to publication review by Editorial Committees of the IADC and SPE. Electronicreproduction, distribut ion, or storage of any part of this paper for commercial purposeswithout the written consent of the Society of Petroleum Engineers is prohibited. Permissionto reproduce in print is restricted to an abstract of not more than 300 words; illustrationsmay not be copied. The abstract must contain conspicuous acknowledgment of where andby whom the paper was presented. Write Librarian, SPE, P.O. Box 833836, Richardson,TX 75083-3836, U.S.A., fax 01-972-952-9435.
AbstractMany of today’s well construction projects are technically andeconomically challenging. Examples include deepwater exploration wells in the Gulf of Mexico, offshore fielddevelopment projects such as Hibernia, Newfoundland, Canadaand onshore field development projects in tectonically activeregions such as the Cusiana field in Colombia. Minimizingnon-productive time associated with wellbore instability andunexpected pore pressure regimes reduces the risk of dangerous accidents and is required to complete the well ontime and within budget. Minimizing non-productive time is acomplex task that requires thorough pre-spud planning toidentify drilling risks and geological hazards and to developcontingency plans for handling those risks. Building amechanical earth model during the well planning phase andrevising it in real time has proven to be extremely valuable indelivering complex wells safely while minimizing unplannedwell construction costs. Monitoring and revising the modelwhile drilling requires geomechanics expertise, teamwork, datamanagement and excellent communications among servicecompanies and their client.
This paper defines a mechanical earth model, explains why it isimportant, how it is developed and how it is applied to wellconstruction and field development. We will discuss sources of information and the multi-disciplinary team approach requiredto: generate, revise and maintain an earth model. Threeexamples of the application of the earth model concept arediscussed.
IntroductionMore of today’s well construction and field development
projects are both technically and economically challengingUnderstanding the geomechanics of well construction is
becoming increasing important in order to drill technically andeconomically challenging wells on budget.
Wells with hostile pore pressure and fracture gradient profiles require a good pre-drill pore pressure and fracturegradient prediction in order to design a suitable casing
program. A casing program designed on a profile significantlyless hostile than that encountered may compromise theattainable TD of the well. The cost of materials and rig timespent running extra casing significantly adds to the cost of thewell. The risk of taking kicks which can be both costly anddangerous can also be reduced by a more rigorous pre-dril
pore pressure prediction coupled with real-time pore pressureanalysis from LWD measurements. In the deepwater Gulf ofMexico there are examples of wells which require a goodmechanical earth model (MEM) in order to be drilled at all.
Despite decades of industry attention, wellbore instability isresponsible for many costly stuck pipe incidents. Stuck pipe iresponsible for lost BHAs and considerable NPT spent freeing
pipe, performing additional wiper trips and hole cleaning. Incases where wellbore stability problems are severe, theeconomics of developing a field can become challenging, forexample the Cusiana field in Colombia, S.A. Other fieldswhere lesser wellbore stability problems may still challenge thefield economics are found where the cost of drilling is veryhigh, e.g. the Hibernia field offshore Canada and or fields in the
North Sea.
Minimizing the risk of pore pressure or wellbore stabilityrelated problems requires an understanding of the fieldsgeomechanics. To gain this knowledge and to implement itsuccessfully requires a process for building a mechanical earthmodel and using it to provide timely information to decisionmakers. Building a mechanical earth model during the wel
planning phase and revising it in real time has proven to beextremely valuable in delivering complex wells safely whileminimizing unplanned well construction costs and acceleratinglearning about the field. Information developed and applied
IADC/SPE 59128
The Mechanical Earth Model Concept and Its Application to High-Risk WellConstruction ProjectsRichard Plumb, Stephen Edwards, Gary Pidcock, Donald Lee, Brian Stacey, Schlumberger, SPE Members

7/24/2019 The Mechanical Earth Model Concept and Its Application to High-Risk Well Construction Projects
http://slidepdf.com/reader/full/the-mechanical-earth-model-concept-and-its-application-to-high-risk-well-construction 2/13
2 RICHARD PLUMB,SPE, STEPHEN EDWARDS,SPE, GARY PIDCOCK,SPE, DONALD LEE,SPE, SCHLUMBERGER IADC/SPE 59128
during early field delineation has payback extending over thelife of the field.
This paper defines the mechanical earth model, explainswhy it is important, how it is developed and how it is applied towell construction and field development. Also discussed aresources of information and the multi-disciplinary teamapproach required to generate, revise and maintain an earth
model. Finally, three examples are given where mechanicalearth models have benefited high-technical and high-economicrisk well construction projects.
• In the deep water Gulf of Mexico, mechanical earthmodels have been used to forecast and revise pore
pressure while drilling.
• Offshore Canada, a mechanical earth model helped tosuccessfully drill the first 6.8 km long extended reachwell in the Hibernia field.
• In a fold and thrust belt setting, in S.America a
mechanical earth model was built and revised whiledrilling exploration wells. The evolving model helpedto minimize drilling risks, accelerate drilling learningand to generate valuable knowledge of the reservoir early in the life of the field.
Theory, Definitions and MotivationThe mechanical earth model is a numerical representation
of the state of stress and rock mechanical properties for aspecific stratigraphic section in a field or basin. The model islinked to geologic structure through the local stratigraphy and a3D seismic cube. Table 1 illustrates the relationship betweencomponents of the model and drilling planning and execution
decisions.Table 1 - Relationship between drilling decisions and the
mechanical earth modelDrillingDecision
Earth
Stresses,
pore pressure
Rock Failure
Mechanisms
Rock
Mechanical
Parameters
Geologic
Structure
Stratigraphy
Well location x x x xRig selection
and BOP
rating
x
Trajectory
analysisx x x x
Casing design x xSafe Mud
weightx
Wellbore
stability
x x x x
Drilling fluids x x x xDrilling
practicesx x x x
Cementing
Strategyx
Bit selection x x
In its basic form, the MEM consists of depth profiles: of theelastic and/or elasto-plastic parameters, rock strength and theearth stresses referenced to the local stratigraphic section.
Figure 1 shows a 1-dimensional representation of a mechanicaearth model and links to the stratigraphy and 3D-seismic cube
From left to right the profiles include: Poisson’s ratio ( ν)Young’s modulus (E), unconfined compressive strength
(UCS), friction angle (φ), pore pressure (P p), minimum
horizontal stress (σh), maximum horizontal stress (σH), vertica
stress (σv), and the direction of horizontal stress axes.
Lithologic variations in MEM parameters are governed bythe mechanical stratigraphy. Research has shown that rockstrength and earth stresses profiles are modulated according tothe nature of the dominant load-bearing solid phase. Themechanical stratigraphy is a bimodal textural model of astratigraphic sequence
1. The bimodal classification
differentiates rocks with clays as the dominant load-bearingsolid from rocks with quartz or carbonate minerals as thedominant load-bearing solid. Petrophysical models are thenused to transform the mechanical stratigraphy into elasticelasto-plastic and rock strength profiles.
Lateral variations in mechanical properties, associated withgeologic structure, are captured by linking the mechanica
stratigraphy to a 3-dimensional (3D) framework model. The3D-framework model consists of surfaces, such as formationtops and faults. The surfaces are interpreted from seismicdata, guided by log data and the geologist’s lithostratigraphicmodel.
In its most complete form, the MEM consists of a full 3Ddescription of pore pressure, stress and mechanical propertiesIn practice, the complexity of the model evolves in step withthe acquisition of new information. From exploration todevelopment, the model evolves from of a sparse set of 1-dimensional profiles to a full 3D description of rock propertieand earth stresses. The degree of detail captured by the modewill vary from field to field depending on the perceived
operational risks.
Why Build an Earth Model
The mechanical earth model concept is one of the practicaoutcomes of the Cusiana study. However, the need forinformation embodied in the earth has been know for manyyears. Bradley
2 focused attention on the role of earth stress in
wellbore stability analysis. The work of Bell and Gough3
Zoback et al4, and Plumb and Hickman
5 demonstrated
conclusively that wellbore instability was due to boreholestress concentrations and that the location of the stressconcentrations could be measured using geophysical logsThroughout the 1980s the practical theory of wellbore stability
advanced slowly in step with the development of fastercomputers and better logging tools, such as sonic and imaginglogs. At the same time geologists and engineers were gainingexperience applying wellbore stability modeling techniques ofvarious levels of complexity (Anderson et al
6., Mclean and
Addis7, Charlez
8, Bradford et al
9). A breakthrough occurred in
the early 1990s when BP encountered severe wellboreinstability in the Cusiana field in Colombia. The severity of thewellbore instability problems demonstrated that conventionaapproaches to solving wellbore stability problems simply did

7/24/2019 The Mechanical Earth Model Concept and Its Application to High-Risk Well Construction Projects
http://slidepdf.com/reader/full/the-mechanical-earth-model-concept-and-its-application-to-high-risk-well-construction 3/13
IADC/SPE 59128 THE MECHANICAL EARTH MODEL CONCEPT AND ITS APPLICATION TO HIGH-RISK WELL CONSTRUCTION PROJECTS 3
not work (Last et al10
). It took a multi-company team of geoscientists and engineers almost 1 year to compile enoughgeomechanics information about the field to affect animprovement in the drilling performance. During the timewhen the model was being compiled wellbore stability was acontinuing problem This experience motivated thedevelopment of the mechanical earth model.
Fortunately few fields in the world today have sufferedwellbore stability problems as severe as those in Cusiana.However because of market pressures, operators and servicecompanies are expected to drill more complex wells in lesstime and at lower cost. Under these constraints, even relativelyminor-wellbore stability problems in tectonically quiescentsettings can be extremely expensive (from $100,000 to$250,000/day offshore). Under these circumstances, thetendency to design wells based on “closeology” can lead tocostly surprises. Important lessons from Cusiana that applyequally well to lower-risk projects include:
• Use of all available data to develop geomechanicsknowledge of the field.
• Balance the complexity of data analysis with availabletime and information.
• The value of three specific types of information: failuremechanisms, state of stress and rock mechanical
properties.
• The value of real-time information.
• The value of data management and good communication.
What Can Go Wrong
Planning and drilling high-risk wells without the aid aMEM can lead to numerous surprises which, if handled
improperly, could result in operational delays or loss of thewell. Some recent examples of unexpected events on high-risk projects include:
• Wellbore instability develops unexpectedly. What action isrequired? Raise mud weight? Drop mud weight? Changedrilling fluid? A combination of the above?
• High angle extended reach wells can be drilled without problems northeasterly but not southwesterly. Why?
• Pore pressure increases faster than expected. Can the wellreach TD with remaining casing strings?
• The well can be drilled without any noticeable drilling problems but time dependent wellbore failure prevents
casing from reaching bottom. What to do? Substantial cost overruns occur when the first time these
questions are asked is as the problem develops. An earth modelcoupled with a process for planning and monitoring the wellwhile drilling can minimize the economic impact.
Constructing the MEM
Constructing the mechanical earth model and using it togenerate a wellbore stability forecast helps to reduce drilling
risks. Figure 2 shows a process that has been used successfullyto minimize drilling risks on high-risk projects. Consider thecase of drilling the first high-angle extended-reach well in field.
1. The first step in the process is to build a mechanical
earth model. The MEM represents all geological and
rock mechanics information that currently exists in thefield.
2. The second step uses information from the MEM toforecast wellbore stability along the planned well pathThe stability forecast summarizes the expected drilling
performance as a function of measured depth in thewell.
3. The third step is to monitor the data while drilling andto test the model predictions for anomaliesAnomalies in the forecast indicate flaws in the data andor the MEM.
4. The anomalies are analyzed to determine the source(s)of error. If immediate action is required on the rig, i
can be based on informed decisions.5. The fifth step is to correct the MEM. Correcting theMEM may be done before remedial action is taken (e.gif the pore pressure was too low, see example 1 belowor it may be done off-line if the geology or stresschanges drastically.
This process systematically captures potentially valuableinformation about the field earlier than would otherwise be
possible. The wellbore stability forecast is revised, as required by revisions to the model, and the loop continuesImplementing this process requires team work, excellentcommunications (human and electronic) among staff on the
planning team, at the rig site and between the rigsite and the
planning team. The benefits of implementing this process arefewer unexpected drilling events and accelerated learning aboutthe field.
Recent experience in a number of high technical and high-economic risk projects has demonstrated that an initial MEMcan be generated for most fields in about 1 month. Three
projects, described below, indicate that the MEM can be refinedcontinuously as new wells are drilled. Table 2 shows typicasources of information used to construct a MEM.
Profile Logs Other Mechanical
Stratigraphy
Gamma ray, density,
resistivity, sonic (Vp)
Cuttings, cavings,
sequence stratigraphy Pore Pressure(Pp)
Sonic (Vp), check shotsurvey, resistivity ,
Interval velocity fromseismic, formation test,daily drilling reports
Overburden
Stress (σv)
Bulk density Cuttings
Stress Direction Oriented multi-armcalipers, borehole images,Oriented velocityanisotropy
Structural maps 3D seismic
MinimumHorizontal stress
Sonic (Vp & Vs), wirelinestress tool,
Pp , leak-off tests,extended leak-off test,

7/24/2019 The Mechanical Earth Model Concept and Its Application to High-Risk Well Construction Projects
http://slidepdf.com/reader/full/the-mechanical-earth-model-concept-and-its-application-to-high-risk-well-construction 4/13
4 RICHARD PLUMB,SPE, STEPHEN EDWARDS,SPE, GARY PIDCOCK,SPE, DONALD LEE,SPE, SCHLUMBERGER IADC/SPE 59128
(σh )microfrac, step-rateinjection tests, database,daily drilling reports,modeling
MaximumHorizontal stress,
(σH )
borehole images, wellborestress model
Pore pressure, σh, rock
strength, database,
ElasticParameters
E, G, ν
Sonic (Vp & Vs ) bulkdensity
data base, laboratorytests on cores, cavings
Rock strengthparameters
(UCS, φ)
Sonic (Vp & Vs) bulkdensity, mechanicalstratigraphy
data base, laboratorytests on cores, cavings
Failuremechanisms
Borehole image, orientedmulti-arm caliper
Daily drilling reports,Cavings (digital images)
Table 2 - Sources of information used to build the MEM
Entries under the heading labeled logs can either be
measurements made by wireline tools or logging while drillingtools. Three of the greatest challenges in building the MEMare:
1. Compiling data from a wide range of disciplines,(drilling engineers, exploration geologists, mud loggers,
reservoir engineers etc.). 2. Data management and organizing the data onto acomputer system.
3. Timely processing (editing, splicing data) andinterpreting the data in terms of geomechanics parameters (rock strength, Pp, earth stresses etc.).
Case Studies
Following are brief descriptions of three high-risk wellconstruction projects where we have implemented the
integrated process illustrated in Figure 2. Application of thistechnology has enabled these and other challenging wells to bedrilled successfully with relatively minor difficulties.
Example 1: Deepwater Exploration. Drilling in deepwater is economically and technically challenging (water depth>1500 ft). With typical well costs between $30-to $50 millionthe financial risk is very high. An accurate pre-drill pore
pressure forecast can reduce this financial risk significantly.But, pore pressure prediction in deep water remains a challengefor earth scientists and operators because of the multiplicity of
processes that can cause overpressure and the lack of subsurface data, particularly with exploration wells. At best, aninaccurate forecast leads to cost over-runs for extra casingstrings and lost time due to well control problems. Worse, itmight not even be possible to reach the exploration target if theforecast is seriously in error. Although pore pressure predictioncan be a challenge, there are proven prediction methods where
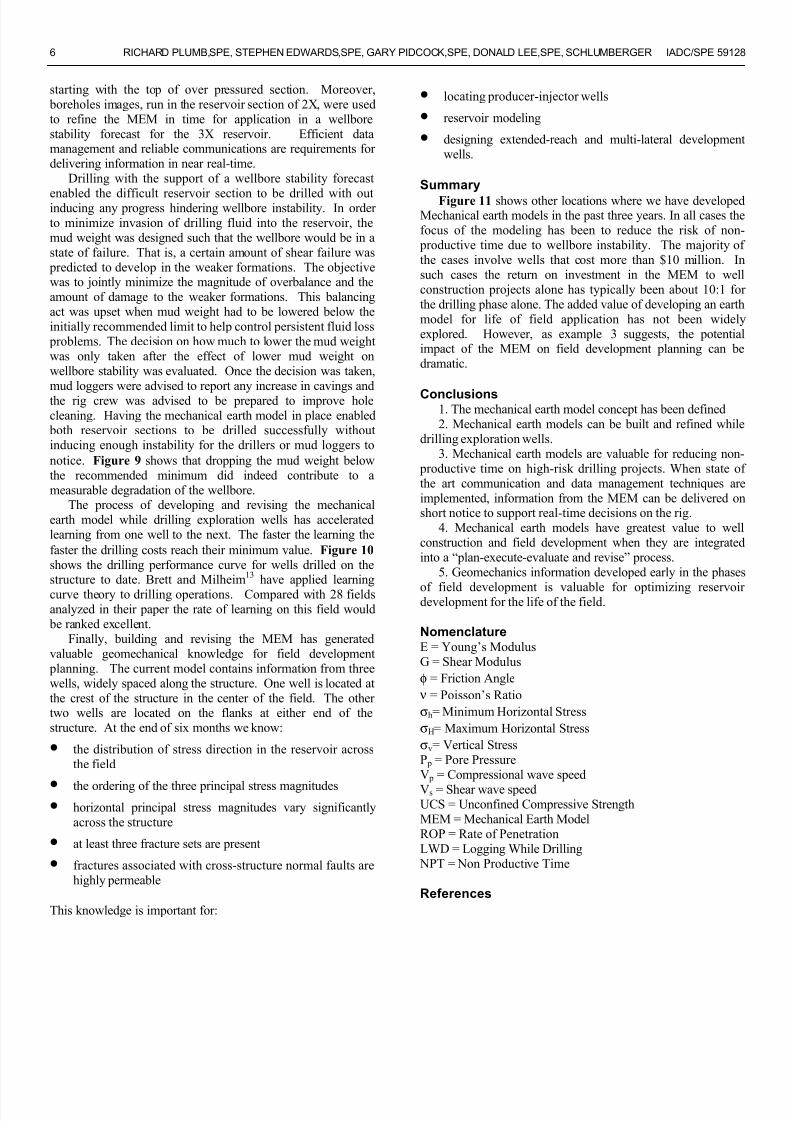
abnormal pressure results from compaction disequilibrium. Figure 3 shows a simple pre-drill earth model constructed for a deepwater exploration well in the Gulf of Mexico by third
parties. The model consists of an overburden stress and two pore pressure curves. The overburden stress was estimatedusing an empirical model
11 for the Gulf of Mexico. The lower
estimate of pore pressure was calculated using a standardcompaction disequilibrium model driven by interval transittimes obtained from 3D seismic. The other was based on mud
weights from distant (20 miles) offset wells. Notice the two profiles differ by as much as 3 ppg. The drilling program was based on the more optimistic pressure profile.
Several thousand feet below the mud line, the well took akick indicating an error in the pressure profile. A real-time
pore pressure-monitoring project was then initiated to revisethe pressure forecast and to re-evaluate the drilling program. A
real-time pore pressure analysis was performed using sonicwhile drilling (LWD) data as input to the pore pressure modelinstead of the seismic interval velocities. The real-time
pressure analysis was calibrated using drilling data (kickslosses, cavings type etc.) acquired prior to running the LWDtools.
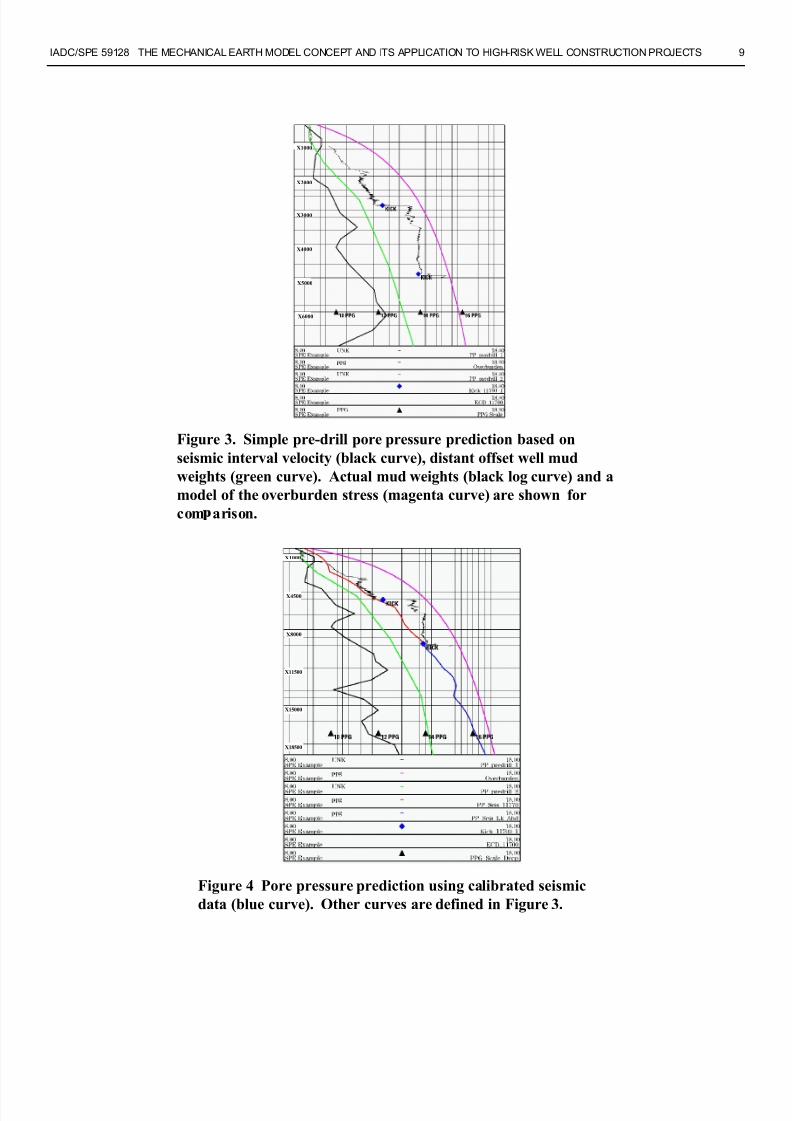
Back-analysis of the initial earth model showed that theseismic-based prediction could be calibrated using drilling data
to provide a look-ahead pore pressure prediction (Figure 4)At half the planned well depth a decision had to be madewhether or not to continue drilling the well. The higher thananticipated pore pressure resulted in setting several casingshoes shallower than planned and the question was: could the
target be reached given the remaining casing strings? On the basis of the revised model the decision was made to continuedrilling using real-time pressure monitoring and evaluation fothe remainder of the well. The real-time monitoring included adaily evaluation of the current pore pressure forecast usingLWD measurements of p-wave velocity, resistivity, annular
pressure and gamma ray and a continuous evaluation of thelook-ahead prediction. Using this methodology the welreached the planned TD safely.
Comparison of the look ahead prediction (shown in Figure4) with the actual ECD from this well (Figure 5) shows thatthe look-ahead was accurate over the 8000 ft between the depthat which it was made and TD. The above example illustrates the
process shown in Figure 2. This process:
• resulted in rapid learning about the pressure profile andearth stress while drilling the exploration well
• established effective communication between theGeomechanics planning team onshore and the executionteam offshore
• created a more complete earth model at the end of wellincluding a mechanical stratigraphy and the state of stress(direction, principal stress magnitudes).
Experience gained on this first exploration well was then
applied to successfully drill a second deepwater explorationwell in a different mini-basin.
Example 2: Offshore Continental Margin. Drilling oncontinental margins in harsh environments such as the NorthSea and eastern Canada presents other challenges. TheHibernia field is one such example where high day rates meanthe smallest problem can turn into a large expense. TheHibernia field is located in the Jeanne d'Arc Basin, 315 km easof St. John's, Newfoundland, in 80m water depth. The fieldwas discovered in 1979 and consists principally of two early

7/24/2019 The Mechanical Earth Model Concept and Its Application to High-Risk Well Construction Projects
http://slidepdf.com/reader/full/the-mechanical-earth-model-concept-and-its-application-to-high-risk-well-construction 5/13
IADC/SPE 59128 THE MECHANICAL EARTH MODEL CONCEPT AND ITS APPLICATION TO HIGH-RISK WELL CONSTRUCTION PROJECTS 5
Cretaceous reservoirs - Hibernia and Avalon - located ataverage depths of 3700 and 2400 m respectively. Between1980 and 1984 nine vertical appraisal and delineation wellswere drilled into the highly faulted structure. Developmentdrilling began in mid 1997 from a large Gravity Base Structurelocated near the top of the structure. The first four wells had amaximum deviation angle ranging from 30 to 55 degrees and
were aimed at maximizing early production rates. Longer term,extended reach wells were planned for waterflooding and gasreinjection were in order to maximize recovery of an estimated615M bbl of oil.
In economically challenging fields, timely access to fit-for- purpose information is vital for optimizing real-time decisionson the rig. The Hibernia MEM was built as a contingency for coping with unexpected wellbore stability problems. All of theearly vertical wells were characterized by elongated, overgaugewellbores indicating that hole instability was a risk for directional development wells. A mechanical earth model wasfirst developed for the Hibernia reservoir section using datafrom the vertical delineation wells and the first three deviated-development wells. The regional N-S trend for the minimumhorizontal stress, previously interpreted from caliper logs, wasconfirmed using images from LWD. Log derived rock strength
profiles were calibrated to rock strength measurements madeon a representative range of lithologies in the reservoir section.The minimum stress profile was calibrated to closure pressuremeasurements from extended leak-off tests and the maximumhorizontal stress was constrained using forward modelingtechniques
12.
The first application of the MEM was to perform awellbore stability (WBS) analysis for a high-angle extended-reach gas injector well, B-16 5 (Table 3). B-16 5 was neededto re-inject gas for reservoir pressure management. At the timeB-16 5 had the longest measure depth and the longest
horizontal displacement of any well drilled in Canada. The wellhas a measured length of 6.8 km and is drilled at an azimuth of
N 25o E at deviation angle of 70
o- to-80
o (Figure 6). The
well was completed successfully with out any wellborestability problems following the mud weight recommendations
set out in the wellbore stability forecast (Figure 7). Thewellbore stability analysis would not have been possible in the
available time frame with out the MEM. The MEM has beenused to forecast mud weights on subsequent development
wells, to provide a field wide model of rock strength to supportefforts to optimize drill bit selection and to improve ROP.The reliability of the mud weight forecasts have been validatedin several cases where instability developed when mud weights
fell below the recommended range (Table 3). The later pointreinforces the value of monitoring the prediction carefully.Careful monitoring of actual vs. predicted wellbore stabilityenables errors in the model to be corrected promotingaccelerated learning and provides confidence in the modelwhen the well performs as expected. The better the model thefewer the unexpected wellbore instability incidents and lower costs related to non-productive time.
WELLBORE STABILITY IMPACT ON LOGGING
L e g a l W e l l N a m e L o g s t o B o t t o m M u d D e n s i t y C o m m e n t s
B - 1 6 1 Y e s 1 2 6 0 N o W B S M o d e l
B - 1 6 2 N o 1 2 3 0 N o W B S M o d e l
B - 1 6 3 Y e s 1 1 8 0 N o W B S M o d e l
B - 1 6 4 N o 1 2 0 0 N o W B S m o d e l , L i n e r w o u l d n ' t g o t o b o t t o m
B - 1 6 4 Z N o 1 2 0 0 N o W B S u s e d
B - 1 6 7 N o 1 2 4 5 N o W B S u s e d
B - 1 6 6 Y e s 1 2 7 0 N o W B S u s e d
B - 1 6 5 Y e s 1 3 4 0 W B S u s e d
B - 1 6 9 Y e s 1 2 8 0 W B S u s e d
B - 1 6 1 0 Z Y e s 1 3 2 0 W B S u s e d
B - 1 6 1 1 Y e s 1 3 2 0 W B S u s e d
B - 1 6 1 4 Y e s 1 3 2 0 W B S u s e d
B - 1 6 1 5 Z N o 1 3 2 0 W B S c h a l l e n g e d
B - 1 6 1 6 Y e s 1 3 2 0 W B S u s e d
Table 3 - The impact of wellbore stability modeling on
reservoir evaluation.
Example 3: Fold and Thrust Belt. In addition to providingshort-term benefits for drillers the MEM contains informationthat can help to optimize field development:
• optimize location of producer-injector wells
• define trajectories that jointly optimize wellbore stability
and reservoir productivity• early identification of reservoir compartmentalization and
directional permeability trends.
Our third example is from a fold and thrust belt in atectonically active region of South America. The objective othe earth modeling project was to help reduce the risk ofwellbore instability while drilling the second and thirdexploration wells in the field and to develop geomechanicsinformation that would help optimize field development
planning. The target formations are located in different fault blocks a
depths ranging from around 15,000 to 17,000 ft. Neither of the
fault blocks had been drilled previously. To reach the reservoirwells must penetrate about 10,000 ft of over-pressured shaleThe first exploration well was vertical and had to be sidetracked due to problems in the over-pressured section.
The MEM evolved over a six-month period from starting
one week before the second exploration well spudded. Figure
8 shows a time line indicating when log data were available toupdate the model and MEM-based products delivered todrilling operations.
The overburden stress and pore pressure profiles were thefirst parts of the model to be built. A pore pressure forecaswas completed before the 2X well reached the over-pressuredsection. Drilling data confirmed the accuracy of the pore
pressure profile when splintered cavings appear near the predicted top of overpressure. The initial earth modelconsisting of stress and strength profiles, was completed intime to deliver a wellbore stability forecast before the 2X welreached the reservoir section. As each hole section wascompleted the LWD and wireline logs were processed and usedto refine the MEM.
Note the well 3X spudded before 2X reached TDInformation gained on 2X enabled a pore pressure forecast anda wellbore stability forecast to be delivered for the entire wel
7/24/2019 The Mechanical Earth Model Concept and Its Application to High-Risk Well Construction Projects
http://slidepdf.com/reader/full/the-mechanical-earth-model-concept-and-its-application-to-high-risk-well-construction 6/13
6 RICHARD PLUMB,SPE, STEPHEN EDWARDS,SPE, GARY PIDCOCK,SPE, DONALD LEE,SPE, SCHLUMBERGER IADC/SPE 59128
starting with the top of over pressured section. Moreover, boreholes images, run in the reservoir section of 2X, were usedto refine the MEM in time for application in a wellborestability forecast for the 3X reservoir. Efficient datamanagement and reliable communications are requirements for delivering information in near real-time.
Drilling with the support of a wellbore stability forecast
enabled the difficult reservoir section to be drilled with outinducing any progress hindering wellbore instability. In order to minimize invasion of drilling fluid into the reservoir, themud weight was designed such that the wellbore would be in astate of failure. That is, a certain amount of shear failure was
predicted to develop in the weaker formations. The objectivewas to jointly minimize the magnitude of overbalance and theamount of damage to the weaker formations. This balancingact was upset when mud weight had to be lowered below theinitially recommended limit to help control persistent fluid loss
problems. The decision on how much to lower the mud weightwas only taken after the effect of lower mud weight onwellbore stability was evaluated. Once the decision was taken,mud loggers were advised to report any increase in cavings andthe rig crew was advised to be prepared to improve holecleaning. Having the mechanical earth model in place enabled
both reservoir sections to be drilled successfully withoutinducing enough instability for the drillers or mud loggers to
notice. Figure 9 shows that dropping the mud weight belowthe recommended minimum did indeed contribute to ameasurable degradation of the wellbore.
The process of developing and revising the mechanicalearth model while drilling exploration wells has acceleratedlearning from one well to the next. The faster the learning the
faster the drilling costs reach their minimum value. Figure 10
shows the drilling performance curve for wells drilled on thestructure to date. Brett and Milheim
13 have applied learning
curve theory to drilling operations. Compared with 28 fieldsanalyzed in their paper the rate of learning on this field would
be ranked excellent. Finally, building and revising the MEM has generated
valuable geomechanical knowledge for field development planning. The current model contains information from threewells, widely spaced along the structure. One well is located atthe crest of the structure in the center of the field. The other two wells are located on the flanks at either end of thestructure. At the end of six months we know:
• the distribution of stress direction in the reservoir acrossthe field
• the ordering of the three principal stress magnitudes
• horizontal principal stress magnitudes vary significantlyacross the structure
• at least three fracture sets are present
• fractures associated with cross-structure normal faults arehighly permeable
This knowledge is important for:
• locating producer-injector wells
• reservoir modeling
• designing extended-reach and multi-lateral developmentwells.
Summary
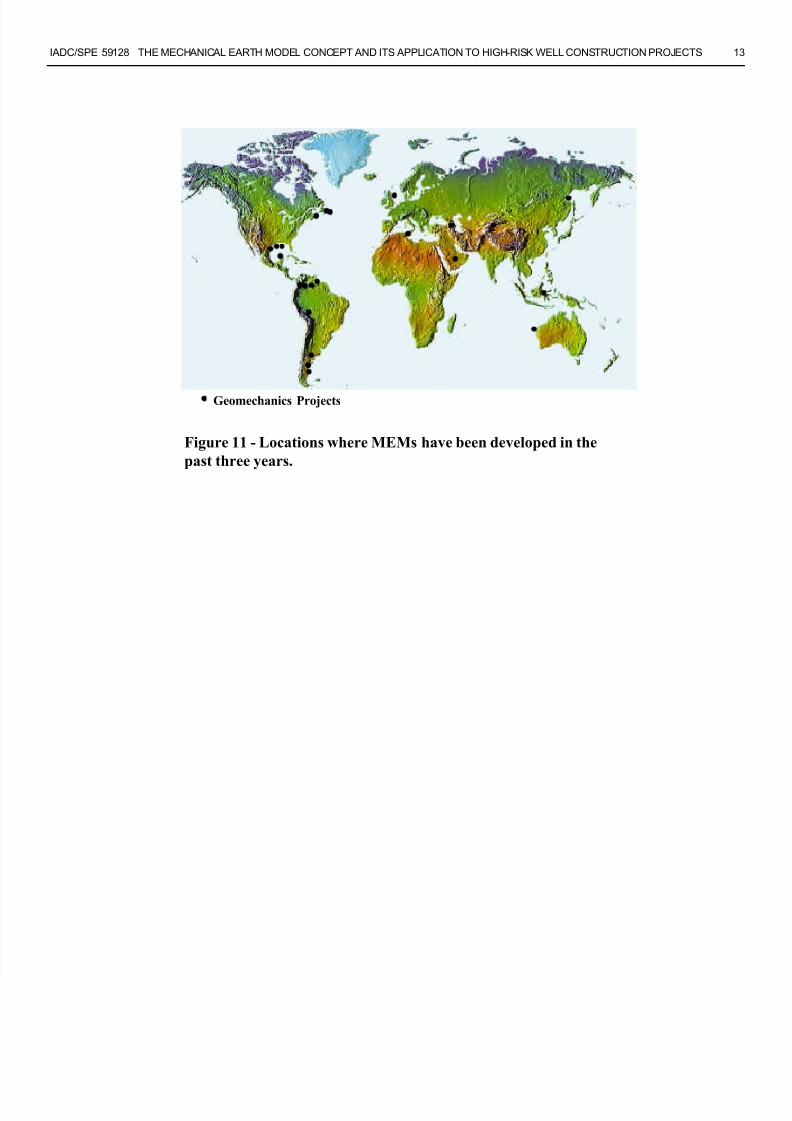
Figure 11 shows other locations where we have developedMechanical earth models in the past three years. In all cases thefocus of the modeling has been to reduce the risk of non-
productive time due to wellbore instability. The majority ofthe cases involve wells that cost more than $10 million. Insuch cases the return on investment in the MEM to welconstruction projects alone has typically been about 10:1 forthe drilling phase alone. The added value of developing an earthmodel for life of field application has not been widelyexplored. However, as example 3 suggests, the potentiaimpact of the MEM on field development planning can bedramatic.
Conclusions1. The mechanical earth model concept has been defined2. Mechanical earth models can be built and refined while
drilling exploration wells.3. Mechanical earth models are valuable for reducing non-
productive time on high-risk drilling projects. When state othe art communication and data management techniques areimplemented, information from the MEM can be delivered onshort notice to support real-time decisions on the rig.
4. Mechanical earth models have greatest value to welconstruction and field development when they are integratedinto a “plan-execute-evaluate and revise” process.
5. Geomechanics information developed early in the phases
of field development is valuable for optimizing reservoirdevelopment for the life of the field.
NomenclatureE = Young’s ModulusG = Shear Modulus
φ = Friction Angle
ν = Poisson’s Ratio
σh= Minimum Horizontal Stress
σH= Maximum Horizontal Stress
σv= Vertical StressP p = Pore PressureV p = Compressional wave speed
Vs = Shear wave speedUCS = Unconfined Compressive StrengthMEM = Mechanical Earth ModelROP = Rate of PenetrationLWD = Logging While Drilling
NPT = Non Productive Time
References

7/24/2019 The Mechanical Earth Model Concept and Its Application to High-Risk Well Construction Projects
http://slidepdf.com/reader/full/the-mechanical-earth-model-concept-and-its-application-to-high-risk-well-construction 7/13
IADC/SPE 59128 THE MECHANICAL EARTH MODEL CONCEPT AND ITS APPLICATION TO HIGH-RISK WELL CONSTRUCTION PROJECTS 7
1. Plumb, R.A., “Influence of Composition and Texture onthe Failure Properties of Clastic Rocks”, SPE/ISRM28022, Eurock, (Aug 1994)
2. Bradley, W.B., “Mathematical concept – Stress cloud can
predict borehole failure”. OGJ , 19, 75 – 102, (1979)
3. Bell, J.S. & Gough, D. I., “North East -South Westcompressive stresses in Alberta: evidence from oil wells”
Earth and Planetary Science Letters, 45, 475-482,(1979)
4. Zoback, M.D, Moos, D., Mastin, L. “Well bore breakouts
and in-situ stress”. Journal of Geophysical Research, 90,5523-5530. (1985)
5. Plumb, R.A. & Hickman, S.H. “Stress-induced boreholeelongation: a comparison between the four-arm dipmeter and the Borehole Televiewer in the Auburn geothermal
well” Journal of Geophysical Research, 90, 5513-5521,
(1985)
6. Anderson, R.A., Ingram, D.S., and Zanier,A.M.:”Determining Fracture Pressure Gradients FromWell Logs, “ JPT , 1259, (Nov. 1973)
7. McClean, M. C. and Addis, M.A., “Wellbore stability: Theeffect of strength criteria on mud weightrecommendations” SPE 20405 (1990)
8. Charlez, P. A., and Heugas, O., “Evaluation of optimalmud weight in soft shale levels”. Proceedings of the 32
nd
US symposium on rock mechanics as a multidisciplinary
science (1991)
9. Bradford, I.D.R. and Cook, J.M., “A semi-analytic Elasto- plastic Model for Wellbore Stability with Applications toSanding” SPE ISRM Eurock (Aug 1994)
10. Last, N., Plumb, R.A., Harkness, R., Charlez, P., Alsen, J.,McLean, M., “An Integrated Approach to ManagingWellbore Instability in the Cusiana Field, Columbia, SouthAmerica” SPE 30464, Dallas 22-25 (Oct 1995)
11. Traugott, M., “Pore/fracture pressure determinations indeep water” Deepwater Technology supplement to World
Oil , August 1997.
12. Plumb, R.A., Papanastasiou, P., Last, N., “Constrainingthe state of stress in tectonically active settings” Eurock ,179 – 189, SPE/ISRM 47240 (1998)
13. Brett, J.F., and Milheim, K.K., “The drilling performancecurve: A yardstick for judging drilling performance” SPE15362, 1986.

7/24/2019 The Mechanical Earth Model Concept and Its Application to High-Risk Well Construction Projects
http://slidepdf.com/reader/full/the-mechanical-earth-model-concept-and-its-application-to-high-risk-well-construction 8/13
8 RICHARD PLUMB,SPE, STEPHEN EDWARDS,SPE, GARY PIDCOCK,SPE, DONALD LEE,SPE, SCHLUMBERGER IADC/SPE 59128
Stratigraphy
Strength
UCS φ
20 400
0 70
UCS
F.Angle (φ)
Earth Stress & Pore Pressure
Pp σh σH σv
MPa0 200Stress W N E
Stress Direction σh
fault ?
RegionalTrend
ν Ε
1Poisson’sRatio ( ν)
Young’sModulus (E)
100
Elastic
1.0
0
10
Structure and Stratigraphy
Grain
SupportFacies
ClaySupport
Facies
Figure 1. Schematic mechanical earth model, showing a
framework model (left), mechanical stratigraphy (center) and
rock mechanical and earth stress profiles (right).
Figure 2 - Integrated Geomechanics Process
7/24/2019 The Mechanical Earth Model Concept and Its Application to High-Risk Well Construction Projects
http://slidepdf.com/reader/full/the-mechanical-earth-model-concept-and-its-application-to-high-risk-well-construction 9/13
IADC/SPE 59128 THE MECHANICAL EARTH MODEL CONCEPT AND ITS APPLICATION TO HIGH-RISK WELL CONSTRUCTION PROJECTS 9
X6000
X5000
X4000
X3000
X2000
X1000
X1000
X4500
X8000
X11500
X15000
X18500
Figure 4 Pore pressure prediction using calibrated seismic
data (blue curve). Other curves are defined in Figure 3.
Figure 3. Simple pre-drill pore pressure prediction based on
seismic interval velocity (black curve), distant offset well mud
weights (green curve). Actual mud weights (black log curve) and a
model of the overburden stress (magenta curve) are shown for
com arison.

7/24/2019 The Mechanical Earth Model Concept and Its Application to High-Risk Well Construction Projects
http://slidepdf.com/reader/full/the-mechanical-earth-model-concept-and-its-application-to-high-risk-well-construction 10/13
10 RICHARD PLUMB,SPE, STEPHEN EDWARDS,SPE, GARY PIDCOCK,SPE, DONALD LEE,SPE, SCHLUMBERGER IADC/SPE 59128
X15000
X4500
X8000
X11500
X18000
X1000
Extended Reach Well
Figure 6 . Simple framework model of the Hibernia field
showing vertical wells, mildly deviated wells and the first
extended-reach gas-injector well drilled in Canada, B-16 5.
Figure 5 - Comparison of predicted (red curve) and
actual pore pressure (blue curve)

7/24/2019 The Mechanical Earth Model Concept and Its Application to High-Risk Well Construction Projects
http://slidepdf.com/reader/full/the-mechanical-earth-model-concept-and-its-application-to-high-risk-well-construction 11/13
IADC/SPE 59128 THE MECHANICAL EARTH MODEL CONCEPT AND ITS APPLICATION TO HIGH-RISK WELL CONSTRUCTION PROJECTS 11
Plasticity effect
0
2 0 0 0
4 0 0 0
6 0 0 0
8 0 0 0
1 0 0 0 0
1 2 0 0 0
1 4 0 0 0
1 6 0 0 0
1 8 0 0 0
0 2 0 4 0 6 0 8 0 1 0 0 1 2 0 1 4 0 1 6 0 1 8 0 2 0 0
Start of Project
Pp Forecast
Alert, 9000 ft +,
possible instability
Wellbore Stability
Forecast-Reservoir
Trajectory Analysis
Pp forecast
Wellbore
Stability Forecast
Wellbore Stability
Forecast-Reservoir
Model Pp scenarios
Trajectory Analysis
Pp & Wellbore
Stability Forecasts
Wellbore Stability
Forecast -Reservoir
Logs
Logs
Logs
Logs
Logs
Logs
Logs
Logs
Logs
Logs
Figure 8 - Time depth curves showing key input from the geomechanics
team. Note that the MEM was supporting two wells that were being
drilled simultaneously. Two-way communication between the field and the
planning team can not be adequately shown in this figure.
Figure 7 – Example of a Wellbore Stability forecast for the
Hibernia reservoir section. Shown from left to right are the
mechanical stratigraphy, rock strength profiles, earth stress
profiles and the minimum mud weight required to drill a stable
wellbore (black curve ). The recommended mud weight is shown as
a vertical line to the right of the min mud weight curve.

7/24/2019 The Mechanical Earth Model Concept and Its Application to High-Risk Well Construction Projects
http://slidepdf.com/reader/full/the-mechanical-earth-model-concept-and-its-application-to-high-risk-well-construction 12/13
12 RICHARD PLUMB,SPE, STEPHEN EDWARDS,SPE, GARY PIDCOCK,SPE, DONALD LEE,SPE, SCHLUMBERGER IADC/SPE 59128
-0.9
-0.8
-0.7
-0.6
-0.5
-0.4
-0.3
-0.2
-0.1
0
0 0.5 1 1 .5 2
M e a n H o l e O v a l i t y
M e a n M u d W e i g h t D i f f e
r e n c e
Well 2X
Well 3X
0
20
40
60
8010 0
12 0
14 0
16 0
18 0
20 0
1 2 3 4 5
Sequence Drilled
D a y s f r o m S
p u d t o T D
Figure 9 - Change in average hole size (inches) with
deviation from the recommended mud weight (ppg).
Figure 10 - Drilling performance curve. Note that, at times,
wells 2-4 were being drilled simultaneously. The learning was
transferred via the wellbore stability forecasts and 2-way
communication with between the Geomechanics team and bothdrilling teams
7/24/2019 The Mechanical Earth Model Concept and Its Application to High-Risk Well Construction Projects
http://slidepdf.com/reader/full/the-mechanical-earth-model-concept-and-its-application-to-high-risk-well-construction 13/13
IADC/SPE 59128 THE MECHANICAL EARTH MODEL CONCEPT AND ITS APPLICATION TO HIGH-RISK WELL CONSTRUCTION PROJECTS 13
Geomechanics Projects
Figure 11 - Locations where MEMs have been developed in the
past three years.