the metropolitan community college
TRANSCRIPT

The Metropolitan Community College
Financial Statements
Fiscal Years Ended June 30, 2014 and 2013

Contents
Board of Trustees and Officers 1
School District Map 2
Independent Auditors’ Report 3
Management’s Discussion and Analysis 5
Basic Financial Statements
Combined Statement of Net Position 22
Combined Statement of Revenues, Expenses and Changes in Net Position 23
Combined Statement of Cash Flows 24
Financial Statements of Foundation – Alumni Association of the Metropolitan Community Colleges (Discretely Presented Component Unit)
Statement of Financial Position 26
Statement of Activities 27
Statement of Cash Flows 29
Notes to Combined Basic Financial Statements 30
Required Supplementary Information Schedule of Funding Progress 64
Supplementary Financial Information
Schedule of Net Position 65
Schedule of Revenues, Expenses, and Changes in Net Position 66
Schedule of Revenues, Expenses, and Changes in Fund Balances 68
Schedule of Combined Expenses by Functional and Natural Classification 69
Schedule of Explanation of Fund Transfers From/To 70
Notes to Supplementary Financial Information 71

Contents
Federal Financial Compliance
Independent Auditors’ Report on Internal Control Over Financial Reporting and on Compliance and Other Matters Based on an Audit of Financial Statements Performed in Accordance with Government Auditing Standards 73
Independent Auditor’s Report on Compliance with Requirements that Could have a Direct and Material Effect on each Major Program and on Internal Control Over Compliance in Accordance with OMB Circular A‐133 75
Schedule of Expenditures of Federal Awards 77
Notes to Schedule of Expenditures of Federal Awards 79
Schedule of Findings and Questioned Costs 80
Summary Schedule of Prior Audit Findings 81

(1)

(2)

(3) An independent member of Nexia International
Independent Auditors’ Report Board of Trustees The Metropolitan Community College Kansas City, Missouri Report on the Financial Statements
We have audited the accompanying combined financial statements of the business‐type activities and the discretely presented component unit of The Junior College District of Metropolitan Kansas City, Missouri (d/b/a The Metropolitan Community College) as of and for the years ended June 30, 2014 and 2013, and the related notes to the combined financial statements, which collectively comprise the College’s basic financial statements as listed in the table of contents.
Management’s Responsibility for the Financial Statements
Management is responsible for the preparation and fair presentation of these financial statements in accordance with accounting principles generally accepted in the United States of America; this includes the design, implementation, and maintenance of internal control relevant to the preparation and fair presentation of financial statements that are free from material misstatement, whether due to fraud or error. Auditors’ Responsibility
Our responsibility is to express opinions on these financial statements based on our audit. We conducted our audit in accordance with auditing standards generally accepted in the United States of America and the standards applicable to financial audits contained in Government Auditing Standards, issued by the Comptroller General of the United States. Those standards require that we plan and perform the audit to obtain reasonable assurance about whether the financial statements are free from material misstatement. An audit involves performing procedures to obtain audit evidence about the amounts and disclosures in the financial statements. The procedures selected depend on the auditors’ judgment, including the assessment of the risks of material misstatement of the financial statements, whether due to fraud or error. In making those risk assessments, the auditor considers internal control relevant to the College’s preparation and fair presentation of the financial statements in order to design audit procedures that are appropriate in the circumstances, but not for the purpose of expressing an opinion on the effectiveness of the College’s internal control. Accordingly, we express no such opinion. An audit also includes evaluating the appropriateness of accounting policies used and the reasonableness of significant accounting estimates made by management, as well as evaluating the overall presentation of the financial statements. We believe that the audit evidence we have obtained is sufficient and appropriate to provide a basis for our audit opinions.
Opinion
In our opinion, the combined financial statements referred to above present fairly, in all material respects, the respective financial position of the business‐type activities and the discretely presented component unit of The Metropolitan Community College as of June 30, 2014 and 2013, and the respective changes in financial position and cash flows for the years then ended in conformity with accounting principles generally accepted in the United States of America. Emphasis of Matters
As discussed in Note 1 to the financial statements, in 2014 the College adopted new accounting guidance, GASB Statement No. 65, Items Previously Reported as Assets and Liabilities. Our opinion is not modified with respect to this matter.

Board of Trustees The Metropolitan Community College
(4) An independent member of Nexia International
Other Matters
Required Supplementary Information
Accounting principles generally accepted in the United States of America require that the management’s discussion and analysis and the Schedule of Funding Progress, as listed in the table of contents, be presented to supplement the basic financial statements. Such information, although not a part of the basic financial statements, is required by the Governmental Accounting Standards Board who considers it to be an essential part of financial reporting for placing the basic financial statements in an appropriate operational, economic, or historical context. We have applied certain limited procedures to the required supplementary information in accordance with auditing standards generally accepted in the United States of America, which consisted of inquiries of management about the methods of preparing the information and comparing the information for consistency with management’s responses to our inquiries, the basic financial statements, and other knowledge we obtained during our audit of the basic financial statements. We do not express an opinion or provide any assurance on the information because the limited procedures do not provide us with sufficient evidence to express an opinion or provide any assurance. Other Information
Our audits were conducted for the purpose of forming an opinion on the combined financial statements that collectively comprise The Metropolitan Community College’s basic financial statements. The supplementary financial information, as listed in the table of contents, is presented for purposes of additional analysis and is not a required part of the basic financial statements. The schedule of expenditures of federal awards, as required by U.S. Office of Management and Budget Circular A‐133, Audits of States, Local Governments, and Non‐Profit Organization, is also presented for purposes of additional analysis and is not a required part of the basic financial statements. The supplementary financial information and the schedule of expenditures of federal awards are the responsibility of management and were derived from and relate directly to the underlying accounting and other records used to prepare the basic financial statements. Such information has been subjected to the auditing procedures applied in the audit of the basic financial statements and certain additional procedures, including comparing and reconciling such information directly to the underlying accounting and other records used to prepare the basic financial statements or to the basic financial statements themselves, and other additional procedures in accordance with auditing standards generally accepted in the United States of America. In our opinion, the information is fairly stated, in all material respects, in relation to the basic financial statements as a whole. Other Reporting Required by Government Auditing Standards
In accordance with Government Auditing Standards, we have also issued our report dated October 29, 2014 on our consideration of The Metropolitan Community College’s internal control over financial reporting and on our tests of its compliance with certain provisions of laws, regulations, contracts and grant agreements, and other matters. The purpose of that report is to describe the scope of our testing of internal control over financial reporting and compliance and the results of that testing, and not to provide an opinion on the internal control over financial reporting or on compliance. That report is an integral part of an audit performed in accordance with Government Auditing Standards in considering The Metropolitan Community College’s internal control over financial reporting and compliance.
CliftonLarsonAllen LLP
St. Louis, Missouri October 29, 2014

The Metropolitan Community College Management’s Discussion and Analysis
(5)
Introduction
This section of Metropolitan Community College’s (the College) annual financial report presents a discussion and analysis of the financial performance of the College during the fiscal year ended June 30, 2014, with comparative data for the fiscal years ended June 30, 2013 and 2012. It should be read in conjunction with the financial statements and notes that follow.
The College prepared the financial statements in accordance with Government Accounting Standards Board (GASB) Statement No. 35, Basic Financial Statements – and Management’s Discussion and Analysis – for Public Colleges and Universities. GASB Statement No. 35 establishes standards for external financial reporting for public colleges and universities and requires that the financial statements be presented to focus on the College as a whole.
As defined by generally accepted accounting principles established by GASB, the financial reporting entity consists of the accompanying combined financial statements of the College include the accounts of the Junior College District of Metropolitan Kansas City, Missouri (the District), the Kansas City Metropolitan Community College Building Corporation (the Building Corporation), as well as its discretely presented component unit, the Foundation—Alumni Association of the Metropolitan Community College (the Foundation).
Using This Annual Report
One of the most important questions asked about the College’s finances is whether the College as a whole is better off or worse off as a result of the year’s activities. The statement of net position; the statement of revenues, expenses and changes in net position; and the statement of cash flows provide information on the College as a whole and present a long‐term view of the College’s finances. These statements present financial information in a form similar to that used by private corporations. Over time, increases or decreases in net position (the difference between assets and liabilities) is one indicator of the improvement or erosion of the College’s financial health when considered with nonfinancial facts such as enrollment levels and the condition of the facilities. In addition to these three basic financial statements, this report contains notes to the financial statements, required supplementary information and other supplementary schedules as appropriate.
Financial Highlights for Fiscal Year Ended June 30, 2014
The College’s financial position improved at June 30, 2014, with total assets and deferred outflow of resources of $227.0 million compared to liabilities and deferred inflow of resources of $95.7 million compared to $226.0 million and $104.2 million, respectively, at June 30, 2013. Net position, which represents the residual interest in the College’s assets and deferred outflow of resources after liabilities and deferred inflow of resources are deducted, was $131.3 million at June 30, 2014. This represents a 7.8% increase from 2013’s restated net position of $121.8. The College’s unrestricted net position showed an increase growing from $56.6 million to $63.4 million or 12.0%.
Financial operations were better than originally budgeted, with an overall increase in net position of $9.5 million. These positive results can be attributed to lapse salaries, open vacant positions, sale of property, reduced spending across the District and additional contributions from the Institute of Workforce Innovation.
Financial Highlights for Fiscal Year Ended June 30, 2013
As of June 30, 2013 the College’s financial position declined over the past fiscal year, with total assets and deferred outflow of resources of $226.0 million compared to liabilities and deferred inflow of resources of $104.2 million compared to $236.1 million and $112.6 million, respectively, at June 30, 2012. Net position, which represents the residual interest in the College’s assets and deferred outflow of resources after liabilities and deferred inflow of resources are deducted, was $121.8 million at June 30, 2013. This represents a decline of 1.4% from prior year restated net position of $123.5 million. The College’s restated unrestricted net position remained unchanged from $56.6 million to $56.6 million from year end 2012 to year end 2013, respectively.

The Metropolitan Community College Management’s Discussion and Analysis
(6)
College expenses exceeded revenues, with an overall decrease in net position of $1.7 million for fiscal year end June 30, 2013. Contributing factors included payments associated with the discontinuation of the early retirement program, reduced state funding, a decline in enrollment and a year‐end mark to market adjustment for investments. Operations were better than budget with tax collections greater than anticipated, reduced spending across the District and additional contributions were received from the Institute for Workforce Innovation.
Financial Highlights for Fiscal Year Ended June 30, 2012
The College’s financial position declined at June 30, 2012, with total assets and deferred outflow or resources of $236.1 million compared to liabilities and deferred inflow of resources of $112.6 million compared to $242.7 million and $116.8 million, respectively, at June 30, 2011. Net position, which represents the residual interest in the College’s assets and deferred outflow of resources after liabilities and deferred inflow of resources are deducted, was $123.5 million at June 30, 2012. This represents a decline of 1.86% from 2011’s net position of $125.9 million. The College’s unrestricted net position showed decreased from $60.4 million to $56.6 million.
College operations fell short of the original budget, with an overall decrease in net position of $2.3 million for fiscal year end June 30, 2012. Contributing factors included reduced state funding, a decline in enrollment, lower tax collections and a legal settlement. Operations were better than budget with a change in the College’s post‐employment benefits plan, decreased spending District‐wide, increased grant activity and additional contributions from the Institute for Workforce Innovation.
Combined Statements of Net Position
The Statement of Net Position presents the financial position of the College at the end of the fiscal year and includes all assets and liabilities of the College. Total assets and deferred outflow or resources less total liabilities and deferred inflow of resources – net position – is one indicator of the current financial condition of the College, while the change in net position is an indicator of whether the overall financial condition has improved or worsened during the year. Assets and liabilities are generally measured using current values or historical costs.
From the data presented, readers of the Statement of Net Position are able to determine the assets available to continue the operations of the College. They are also able to determine how much the College owes vendors and lending institutions. Finally, the Statement of Net Position provides a picture of assets available for expenditure by the College.
Assets and liabilities are categorized as current or noncurrent. The difference is that current assets and liabilities mature or become payable within the normal 12‐month accounting cycle versus noncurrent, which mature or become payable after 12 months. For example, at June 30, 2014, the College’s current assets consisted primarily of cash and cash equivalents, short‐term investments, net accounts receivable, bookstore inventories, and other assets. Noncurrent assets consist primarily of long‐term investments and property and equipment. Property and equipment are the capital assets owned by the College and the Building Corporation.
Net position is presented in four major categories. The first category, net investment in capital assets, provides the College’s/Building Corporation’s equity in capital assets – the property, plant and equipment owned by the College/Building Corporation.
The second category is restricted net position, which is restricted for debt retirement. The third category is titled designated. Designated net assets are unrestricted funds which have been designated by board direction for specific purposes. And the final category is unrestricted net position, which is available for use by the College for any legal purpose.

The Metropolitan Community College Management’s Discussion and Analysis
(7)
Condensed Combined Statements of Net Position June 30, 2014, 2013 and 2012 (Dollars in Millions)
ChangeFrom ChangeFrom
2014 Prior Year 2013 Prior Year 2012
Assets:Current $ 78.8 $ (8.6) $ 87.4 $ 0.1 $ 87.3
Capital 130.1 (5.3) 135.4 (5.1) 140.5
Other 18.1 14.9 3.2 (5.1) 8.3
Total assets $ 227.0 $ 1.0 $ 226.0 $ (10.1) $ 236.1
Liabilities:Current $ 23.2 $ (4.0) $ 27.2 $ (0.8) $ 28.0
Noncurrent 72.5 (4.5) 77.0 (7.6) 84.6
Total l iabil ities $ 95.7 $ (8.5) $ 104.2 $ (8.4) $ 112.6
Net position:Invested in capital,
net of related debt $ 57.2 $ 1.1 $ 56.1 $ (1.1) $ 57.2
Restricted for debt retirement 8.2 (0.9) 9.1 (0.6) 9.7
Designated 2.5 2.5 ‐ ‐ ‐
Unrestricted 63.4 6.8 56.6 ‐ 56.6
Total net position $ 131.3 $ 9.5 $ 121.8 $ (1.7) $ 123.5
Significant assets consist of cash and cash equivalents, short‐term and long‐term investments, accounts receivable and capital assets. Significant liabilities include accounts payable and accrued liabilities, long‐term bonded debt, compensated absences and unearned revenue.
0
10
20
30
40
50
60
70
Net Investment in Capital Assets Restricted Unrestricted & Designated
In M
illions
Comparison of Net Position
2014 2013 2012

The Metropolitan Community College Management’s Discussion and Analysis
(8)
Fiscal Year 2014 compared to Fiscal Year 2013
Assets increased $1.0 million; liabilities decreased $8.5 million; for a total net position increase of $9.5 million in 2014.
The asset increase is included in current and non‐current cash and investments. Other assets are long‐term investments with maturities greater than 12 months. In 2014 long‐term investments provided more favorable interest rates as the yield curve was relatively steep.
Total liabilities decreased $8.5 million primarily associated with the $6.4 million of the reduction in principal payments of debt and with accruals, payables and other liabilities reduced $1.7 million.
Net investment in capital assets, which represents 43.6% of total net position at June 30, 2014, represents the assets’ historical costs, net of accumulated depreciation and outstanding principal balances of debt attributable to the acquisition, construction or improvement of those assets.
Expendable restricted net position is subject to externally imposed restrictions governing their use. This category of net position represents the debt service reserve funds as mandated by the trust indentures. There were no additional debt issuances in the current year. The Series 2002 was retired and the respective reserve was released and used to retire the debt.
Designated net position is not subject to externally imposed restrictions and therefore is not considered restricted net position. Rather the Board of Trustees has elected to designate a portion of unrestricted net position for the purpose of deferred maintenance and information technology.
Unrestricted net position is not subject to externally imposed stipulations and is available to the College for any legal purpose.
Fiscal Year 2013 compared to Fiscal Year 2012
Assets decreased $10.1 million; liabilities decreased $8.4 million; for a total net position reduction of $1.7 million in 2013.
The asset decrease is attributed to the reduction of cash and investments to fund the debt payment and operating loss and the reduction of net capital assets, which is due to depreciation expense being greater than the current year capital additions.
Total liabilities decreased $8.4 million. $5.9 million of the reduction is associated with principal debt payments, $0.9 million reduction in payables and accrued rent, $0.4 million pay‐down of accrued vacation and $0.3 million reduction in deferred revenue due to a decline in fall enrollment; with an offset of $0.3 million increase in OPEB.
Net investment in capital assets, which represents 46.1% of total net position at June 30, 2013, represents the assets’ historical costs, net of accumulated depreciation and outstanding principal balances of debt attributable to the acquisition, construction or improvement of those assets. The reduction of net investment in capital assets is due to depreciation expense being greater than the reduction in related capital debt and current year additions.
The Metropolitan Community College Management’s Discussion and Analysis
(9)
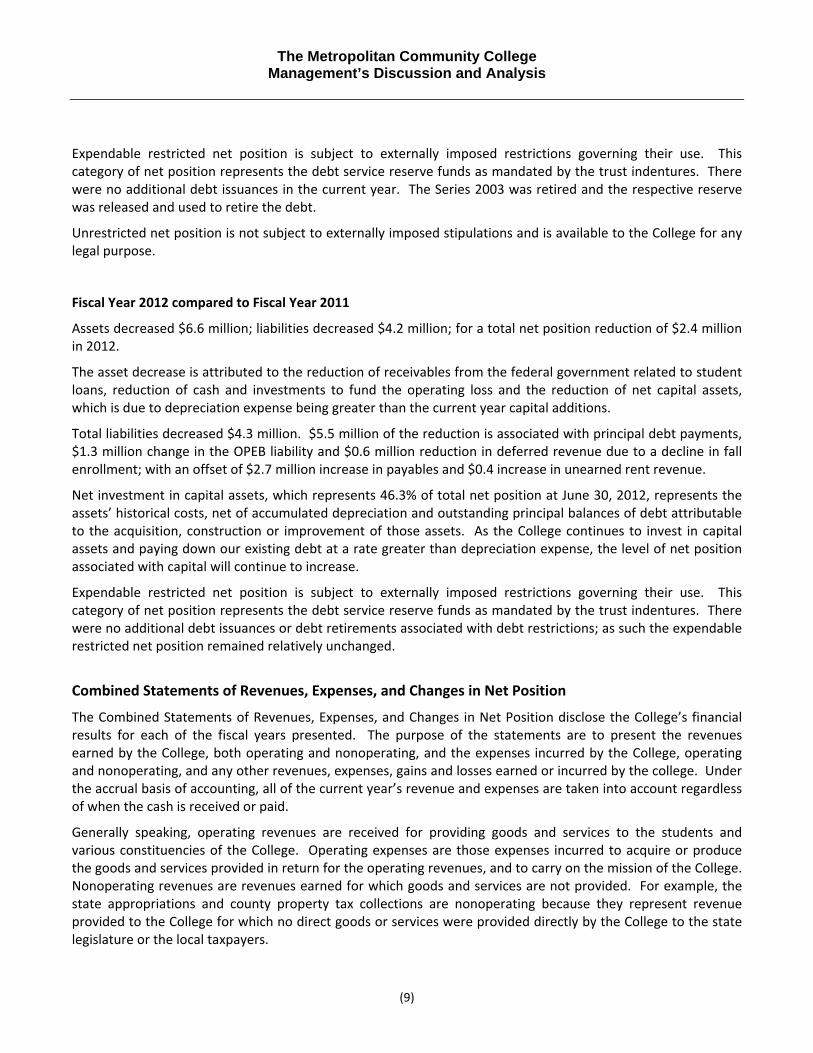
Expendable restricted net position is subject to externally imposed restrictions governing their use. This category of net position represents the debt service reserve funds as mandated by the trust indentures. There were no additional debt issuances in the current year. The Series 2003 was retired and the respective reserve was released and used to retire the debt.
Unrestricted net position is not subject to externally imposed stipulations and is available to the College for any legal purpose.
Fiscal Year 2012 compared to Fiscal Year 2011
Assets decreased $6.6 million; liabilities decreased $4.2 million; for a total net position reduction of $2.4 million in 2012.
The asset decrease is attributed to the reduction of receivables from the federal government related to student loans, reduction of cash and investments to fund the operating loss and the reduction of net capital assets, which is due to depreciation expense being greater than the current year capital additions.
Total liabilities decreased $4.3 million. $5.5 million of the reduction is associated with principal debt payments, $1.3 million change in the OPEB liability and $0.6 million reduction in deferred revenue due to a decline in fall enrollment; with an offset of $2.7 million increase in payables and $0.4 increase in unearned rent revenue.
Net investment in capital assets, which represents 46.3% of total net position at June 30, 2012, represents the assets’ historical costs, net of accumulated depreciation and outstanding principal balances of debt attributable to the acquisition, construction or improvement of those assets. As the College continues to invest in capital assets and paying down our existing debt at a rate greater than depreciation expense, the level of net position associated with capital will continue to increase.
Expendable restricted net position is subject to externally imposed restrictions governing their use. This category of net position represents the debt service reserve funds as mandated by the trust indentures. There were no additional debt issuances or debt retirements associated with debt restrictions; as such the expendable restricted net position remained relatively unchanged.
Combined Statements of Revenues, Expenses, and Changes in Net Position
The Combined Statements of Revenues, Expenses, and Changes in Net Position disclose the College’s financial results for each of the fiscal years presented. The purpose of the statements are to present the revenues earned by the College, both operating and nonoperating, and the expenses incurred by the College, operating and nonoperating, and any other revenues, expenses, gains and losses earned or incurred by the college. Under the accrual basis of accounting, all of the current year’s revenue and expenses are taken into account regardless of when the cash is received or paid.
Generally speaking, operating revenues are received for providing goods and services to the students and various constituencies of the College. Operating expenses are those expenses incurred to acquire or produce the goods and services provided in return for the operating revenues, and to carry on the mission of the College. Nonoperating revenues are revenues earned for which goods and services are not provided. For example, the state appropriations and county property tax collections are nonoperating because they represent revenue provided to the College for which no direct goods or services were provided directly by the College to the state legislature or the local taxpayers.

The Metropolitan Community College Management’s Discussion and Analysis
(10)
One of the College’s strengths is its diverse streams of revenue, which allow it the flexibility to weather difficult economic times. The statements below provide an illustration of revenues by source (both operating and nonoperating), which were used to fund the College’s operating activities for the years ended June 30, 2014, 2013 and 2012.
Condensed Combined Statements of Revenue, Expenses and Changes in Net Position Years Ended June 30, 2014, 2013 and 2012 (Dollars in Millions)
ChangeFrom ChangeFrom
2014 Prior Year 2013 Prior Year 2012
Operating revenues $ 77.3 $ (1.5) $ 78.8 $ (2.5) $ 81.3
Operating expenses 129.4 (12.3) 141.7 (2.5) 144.2
Operating loss (52.1) 10.8 (62.9) ‐ (62.9)
Non‐operating revenues, net 61.7 0.6 61.1 0.5 60.6
Increase in net assets 9.6 11.4 (1.8) 0.5 (2.3)
Net assets, beginning of year 121.8 (1.8) 123.6 (2.3) 125.9
Net assets, end of year $ 131.4 $ 9.6 $ 121.8 $ (1.8) $ 123.6
Total revenues $ 142.2 $ (1.1) $ 143.3 $ (2.3) $ 145.6
Total expenses $ 132.6 $ (12.6) $ 145.2 $ (2.8) $ 148.0
The following table of revenues by source (both operating and nonoperating) shows revenues used to fund the College’s operating activities for the years ended June 30, 2014, 2013 and 2012.

The Metropolitan Community College Management’s Discussion and Analysis
(11)
Revenues by Source: Years Ended June 30, 2014, 2013 and 2012 (Dollars in Millions)
ChangeFrom ChangeFrom
2014 Prior Year 2013 Prior Year 2012
Operating revenues:
Student tuition and fees $ 21.7 $ (0.8) $ 22.5 $ 1.5 $ 21.0
Contracts and grants 41.4 (0.1) 41.5 (2.8) 44.3
Auxiliary services 8.7 (0.9) 9.6 (0.7) 10.3
Other 5.5 0.3 5.2 (0.5) 5.7
Total operating revenues $ 77.3 $ (1.5) $ 78.8 $ (2.5) $ 81.3
Non‐operating revenues:
State appropriations $ 29.4 $ (0.3) $ 29.7 $ (0.2) $ 29.9
County property tax revenues 31.6 (0.2) 31.8 1.0 30.8
Investment income 0.8 0.9 (0.1) (0.7) 0.6
Other non‐operating revenue 3.1 ‐ 3.1 0.1 3.0
Total non‐operating
revenues, net 64.9$ 0.4$ 64.5$ 0.2$ 64.3$
Total Revenue 142.2$ (1.1)$ 143.3$ (2.3)$ 145.6$
Fiscal Year 2014 compared to Fiscal Year 2013
Total revenues decreased $1.1 million from prior year. Contracts and grants comprise 29.4% and 29.0% of total revenue respectively. State appropriations dropped $0.3 million or 1.0% from prior year. While only a minor drop from prior year, state appropriations revenue remain at levels last seen in 1998. In‐district tuition remained unchanged from prior year and all other tuition increased $11.00 per credit hour and enrollment dropped 3% in 2014 from 2013. The decline in enrollment and an increase in textbook purchasing alternatives available to students had a direct negative impact on auxiliary services as bookstore revenue dropped $0.9 million from last year.

The Metropolitan Community College Management’s Discussion and Analysis
(12)
The following graphic illustrates revenues used to fund the College’s operating activities for the years ended June 30, 2014 and 2013.
Tuition and Fees, Net15.3%
Grants and Contracts29.1%
Auxiliary Services6.1%
Other Operating3.9%
State Appropriations
20.7%
Tax Revenue22.2%
Investment0.5%
Other Nonoperating
2.2%
2014
Tuition and Fees, Net15.7%
Grants and Contracts29.0%
Auxiliary Services6.7%
Other Operating3.6%
State Appropriations
20.7%
Tax Revenue22.2%
Investment‐0.1%
Other Nonoperating
2.2%
2013

The Metropolitan Community College Management’s Discussion and Analysis
(13)
Fiscal Year 2013 compared to Fiscal Year 2012
Total revenues decreased from prior years and revenue composition continues to shift. With a decrease of $2.8 million over last year, contracts and grants continue to be the largest revenue source. Contracts and grants comprise 29.0% and 30.4% of total revenue respectively. State appropriations and revenue dropped $0.2 million or 0.7% from prior year. While only a minor drop from prior year, state appropriations revenue is at levels last seen in 1998. There was a tuition increase of $5.00 per credit hour and enrollment dropped 7% in 2013 from 2012. Likewise, the decline in enrollment had a direct negative impact on auxiliary services as bookstore revenue dropped $0.7 million from last year.
The following graphic illustrates revenues used to fund the College’s operating activities for the years ended June 30, 2013 and 2012.
Tuition and Fees, Net15.7%
Grants and Contracts29.0%
Auxiliary Services6.7%
Other Operating3.6%
State Appropriations
20.7%
Tax Revenue22.2%
Investment‐0.1%
Other Nonoperating
2.2%
2013
Tuition and Fees, Net14.4%
Grants and Contracts30.4%
Auxiliary Services7.1%
Other Operating3.9%
State Appropriations
20.5%
Tax Revenue21.2%
Investment0.4%
Other Nonoperating
2.1%
2012
The Metropolitan Community College Management’s Discussion and Analysis
(14)
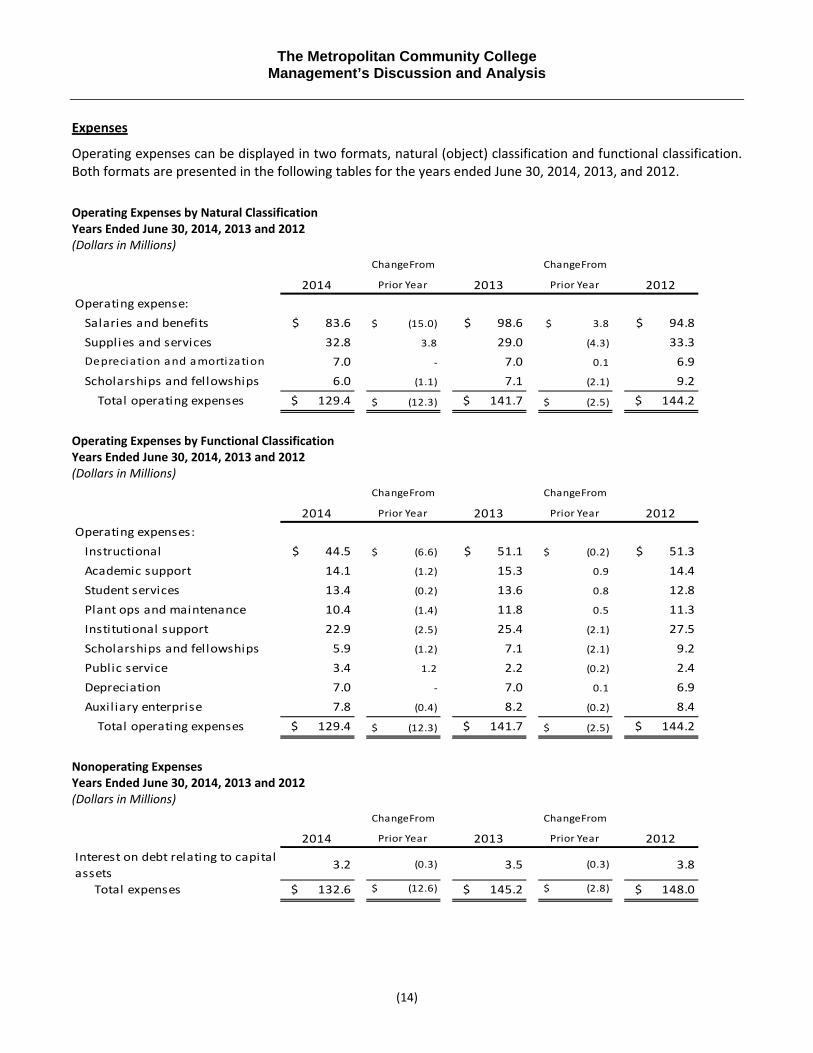
Expenses
Operating expenses can be displayed in two formats, natural (object) classification and functional classification. Both formats are presented in the following tables for the years ended June 30, 2014, 2013, and 2012.
Operating Expenses by Natural Classification Years Ended June 30, 2014, 2013 and 2012 (Dollars in Millions)
ChangeFrom ChangeFrom
2014 Prior Year 2013 Prior Year 2012
Operating expense:
Salaries and benefits $ 83.6 $ (15.0) $ 98.6 $ 3.8 $ 94.8
Supplies and services 32.8 3.8 29.0 (4.3) 33.3
Depreciation and amortization 7.0 ‐ 7.0 0.1 6.9
Scholarships and fellowships 6.0 (1.1) 7.1 (2.1) 9.2
Total operating expenses $ 129.4 $ (12.3) $ 141.7 $ (2.5) $ 144.2
Operating Expenses by Functional Classification Years Ended June 30, 2014, 2013 and 2012 (Dollars in Millions)
ChangeFrom ChangeFrom
2014 Prior Year 2013 Prior Year 2012
Operating expenses:
Instructional $ 44.5 $ (6.6) $ 51.1 $ (0.2) $ 51.3
Academic support 14.1 (1.2) 15.3 0.9 14.4
Student services 13.4 (0.2) 13.6 0.8 12.8
Plant ops and maintenance 10.4 (1.4) 11.8 0.5 11.3
Institutional support 22.9 (2.5) 25.4 (2.1) 27.5
Scholarships and fellowships 5.9 (1.2) 7.1 (2.1) 9.2
Public service 3.4 1.2 2.2 (0.2) 2.4
Depreciation 7.0 ‐ 7.0 0.1 6.9
Auxil iary enterprise 7.8 (0.4) 8.2 (0.2) 8.4
Total operating expenses $ 129.4 $ (12.3) $ 141.7 $ (2.5) $ 144.2
Nonoperating Expenses Years Ended June 30, 2014, 2013 and 2012 (Dollars in Millions)
ChangeFrom ChangeFrom
2014 Prior Year 2013 Prior Year 2012
Interest on debt relating to capital
assets 3.2 (0.3) 3.5 (0.3) 3.8
Total expenses $ 132.6 $ (12.6) $ 145.2 $ (2.8) $ 148.0

The Metropolitan Community College Management’s Discussion and Analysis
(15)
Fiscal Year 2014 compared to Fiscal Year 2013
2014 total operating and nonoperating expenses decreased by $12.6 million or 8.7% from prior year. 2013 benefits expense includes $7.0 million of one‐time payments relating to early retirement incentive payments. Omitting the one‐time incentive payments, total operating and non‐operating expenses are down $5.6 million or 4.0% over the prior year. The salaries and benefits comprise 63.0% and 67.9% of total expenses for years ended June 30, 2014 and June 30, 2013, respectively. Supplies and services increased $3.8 million or 13.1% from prior year primarily due to increased contracted services.
The following graphic illustrates expenses by natural (object) classification for the years ended June 30, 2014 and 2013.
Salaries46.2%
Benefits16.8%
Supplies and Services22.1%
Utilities2.7%
Scholarships4.5%
Depreciation5.3%
Interest2.4%
2014
Salaries46.7%
Benefits21.2%
Supplies and Services17.7%
Utilities2.3%
Scholarships4.9%
Depreciation4.8%
Interest2.4%
2013

The Metropolitan Community College Management’s Discussion and Analysis
(16)
Fiscal Year 2013 compared to Fiscal Year 2012
2013 total operating and nonoperating expenses decreased by $2.8 million or 1.9% from prior year. 2013 expenses include $7.0 million of one‐time payments relating to early retirement incentive payments. Omitting the one‐time incentive payments, total operating and non‐operating expenses are down $9.8 million or 6.7% over the prior year. The salaries and benefits comprise 67.9% and 64.0% of total expenses for years ended June 30, 2013 and June 30, 2012, respectively. Supplies and services decreased $4.3 million or 12.9% from prior year primarily due to a $4.2 million legal settlement in 2012.
The following graphic illustrates expenses by natural (object) classification for the years ended June 30, 2013 and 2012.
Salaries46.7%
Benefits21.2%
Supplies and Services17.7%
Utilities2.3%
Scholarships4.9%
Depreciation4.8%
Interest2.4%
2013
Salaries47.8%
Benefits16.2%
Supplies and Services20.3%
Utilities2.2%
Scholarships6.2%
Depreciation4.7%
Interest2.6%
2012

The Metropolitan Community College Management’s Discussion and Analysis
(17)
Combined Statements of Cash Flows
The statement of cash flows provides information about cash receipts and cash payments during the year. This statement also assists users in assessing the College’s ability to generate net cash flows, its ability to meet its obligations as they come due, and its need for external financing. The Combined Statements of Cash Flows is divided into five parts, each examining a different source of and use for cash. The first part, “Operating activities,” examines the source and use of cash from ordinary operating activities. The second part, “Noncapital financing activities,” reflects cash flows received and spent for nonoperating, noninvesting and noncapital financing activities. An example of this would be cash received from state appropriations and county property tax. The third section, “Capital financing activities,” deals with cash flows from capital and related financing activities. The section reflects the cash used in the acquisition, construction and financing of capital and related items. The fourth section, “Investing activities,” reveals the cash flows from investing activities and shows the purchases, proceeds and interest received from investing activities. The fifth and last section reconciles the net cash used by operating activities to the operating gain or (loss) reflected on the statement of revenues, expenses and changes in net position. Condensed Combined Statements of Cash Flows Years Ended June 30, 2014, 2013 and 2012 (Dollars in Millions)
ChangeFrom ChangeFrom
2014 Prior Year 2013 Prior Year 2012
Cash provided (used) by:
Operating activities $ (48.3) 10.9$ $ (59.2) (5.2)$ $ (54.0)
Noncapital financing activities 63.2 (0.4) 63.6 (0.6) 64.2
Capital financing activities (9.8) 1.4 (11.2) 1.7 (12.9)
Investing activities (5.9) (7.8) 1.9 (0.5) 2.4
Net change in cash (0.8) 4.1 (4.9) (4.6) (0.3)
Cash, beginning of year 39.8 (4.9) 44.7 (0.3) 45.0
Cash, end of year $ 39.0 (0.8)$ $ 39.8 (4.9)$ $ 44.7
The major sources of cash included state aid, county property tax revenues, student tuition, federal contracts & grants, and proceeds from maturities of investments. Significant uses of cash included payments to employees including benefits, payments to vendors and suppliers, payments for scholarships and financial aid, capital assets and purchases of investments.

The Metropolitan Community College Management’s Discussion and Analysis
(18)
Fiscal Year 2014 compared to Fiscal Year 2013
While the cash position of the College decreased by $0.8 million for the fiscal year ended June 30, 2014, the net position increased $9.5 million. Operating activity is down $10.9 million from prior year. Investing activities have increased $7.8 million over prior year. The College’s investment strategy continues to be relatively short‐term focused due to economic conditions, however relative to recent years, the yield curve has become steeper drawing attraction to longer term investments hence the increase in noncurrent investments.
Fiscal Year 2013 compared to Fiscal Year 2012
The cash position of the College decreased by $4.9 million for the fiscal year ended June 30, 2013. The reduction is attributed to the decline in net position of $1.7 million; accounts receivable, a source of cash, is up $2.0 million and accounts payables, a use of cash, is down $0.9 million. The College’s investment strategy continues to be a short term focus due to economic conditions, low interest rates and minimal rate differential on longer term investments.
Fiscal Year 2012 compared to Fiscal Year 2011
Despite the $2.4 million reduction in net position, the cash position of the College only decreased by $0.3 million for the fiscal year ended June 30, 2012. Proceeds from investing activities provided the cash for operations. Due to historically low interest rates combined with the minimal rate differential on longer term investments, the College’s investment strategy continues to be a short term focus. As such investments in cash and cash equivalents remains high.
Capital Assets
Net Capital Assets Years Ended June 30, 2014, 2013 and 2012 (Dollars in Millions)
ChangeFrom ChangeFrom
Capital Assets ‐ Net of Accum Dprc 2014 Prior Year 2013 Prior Year 2012
Land $ 8.4 $ (0.3) $ 8.7 $ ‐ $ 8.7
Buildings and Improvements 116.7 (4.9) 121.6 (2.2) 123.8
Construction in progress 0.3 0.2 0.1 (2.8) 2.9
Equipment 4.2 ‐ 4.2 (0.3) 4.5
Textbook rental 0.4 (0.2) 0.6 0.2 0.4
Software 0.1 (0.1) 0.2 (0.1) 0.3
$ 130.1 $ (5.3) $ 135.4 $ (5.2) $ 140.6
Additional information concerning capital assets is provided in Note 3 to the financial statements.

The Metropolitan Community College Management’s Discussion and Analysis
(19)
Fiscal Year 2014 compared to Fiscal Year 2013
As of June 30, 2014 the College had recorded $130.1 million in net capital assets, a decrease of $5.3 million from the prior year. 10 acres of land was sold in Blue Springs, $1.4 million in equipment purchases and $0.4 million in additional text book rentals were purchased in 2014. An interest‐free capital lease was obtained from a vendor to purchase technology equipment.
Fiscal Year 2013 compared to Fiscal Year 2012
As of June 30, 2013 the College had recorded $135.4 million in net capital assets, a decrease of $5.2 million from the prior year. Penn Valley enrollment center and parking lot, Northland Human Services roof and parking lot improvements, chemistry labs and classroom remodels were completed in 2013. No additional debt was issued to finance these projects.
Fiscal Year 2012 compared to Fiscal Year 2011
As of June 30, 2012 the College had recorded $140.6 million in net capital assets, a decrease of $3.2 million from the prior year. No major construction projects were completed in 2012. Construction in progress included the Penn Valley enrollment center and parking lot, classroom and lab remodels. No additional debt was issued to finance these projects.
Long Term Debt Long Term Debt Years Ended June 30, 2014, 2013 and 2012 (Dollars in Millions)
ChangeFrom ChangeFrom
Outstanding Debt 2014 Prior Year 2013 Prior Year 2012
Note Payable $ 1.7 $ 1.7 $ ‐ $ ‐ $ ‐
Refunding lease certificates of
participation ‐ (1.8) 1.8 (0.9) 2.7
Leasehold revenue bonds 72.9 (4.6) 77.5 (5.2) 82.7
Total long‐term debt $ 74.6 $ (4.7) $ 79.3 $ (6.1) $ 85.4
Additional information concerning long term debt is provided in Note 4 to the financial statements.

The Metropolitan Community College Management’s Discussion and Analysis
(20)
Economic Outlook
Based on the Missouri Economic Research & Information Center (MERIC), non‐farm employment in the Missouri economy grew 1.5% from May 2013 to May 2014. There was a modest rate of growth across most industries. Over this same period, the Missouri unemployment rate fell from 6.7% to 6.1%. The final fiscal year 2014 revenue report from the Office of Administration for the State of Missouri indicated that net general revenue collections decreased 1.0% during 2014 compared to an increase of 10.1% in fiscal year 2013, indicating that at least in terms of net general revenue collections, the State of Missouri’s cash flow decreased in FY 2014 versus FY 2013. In FY 2015, MCC is estimating that approximately 25.6% of all operational fund revenue will come from MCC’s state aid appropriation to Missouri Community Colleges. For this reason, MCC monitors statewide economic and political activity closely. Due to the continued uncertainty in the national economy and its impact on the Missouri economy, MCC core state aid funding remained steady in FY 2014 and is estimated to grow 0.9% in FY 2015. MCC is projecting a small appropriation increase in FY 2015 and FY 2016. FY 2014 was steady in local tax revenue collections for MCC, showing a decrease of approximately $0.2 Mil or a 0.6% decrease. FY 2013 results reflected an increase in the collection rate on current and back taxes collection. The local levy rate for FY 2014 was $0.2369 cents per $100 of assessed valuation, an increase from $0.2349 in FY 2013. MCC is allowed by statute and the Missouri Constitution to offset declines in assessed valuation by increasing the tax levy rate each year in which assessed valuation declines, but only up to the level set by district patrons in the last actual levy election, or to the ”maximum authorized levy” rate. This will allow MCC to continue to increase its tax levy rate in response to reductions in assessed valuations until the tax levy reaches $0.2700 per $100 of assessed valuation. Management continues to anticipate that there will be a stabilization in assessed valuation in the near term, and as such, does not anticipate that the tax levy will reach the $0.2700 ceiling. A significant factor in the recent assessed valuation declines has been continued historical lows in new construction activity in the MCC taxing district due to economic conditions since the FY 2010 calendar year. The last four years included new construction of $94.5 million, $98.7 million, $46.0 million, $93.0 million. As recently as FY 2008, new construction added $340.0 million to the tax base of MCC in one year alone. The College generated approximately 416,000 student credit hours and credit hour equivalents in FY 2014, down approximately 6.1% from the previous year. In the College’s three‐year financial plan, enrollment is forecasted to decline 3.0% in FY 2015, and then increase only moderately thereafter as the economy slowly emerges from an extended recession. The significance of enrollment growth and its relationship to tuition and fees is that tuition and fee revenue is the only major source of revenue driven by enrollment and as such, must support the growth in both teaching and other enrollment driven support costs, especially during periods of significant student enrollment growth. In FY 2012 and 2011, MCC did not increase its tuition and fee structure in exchange for smaller reductions in state funding. However, as a result, significant growth in enrollment during that period put additional pressure on MCC’s ability to handle the costs associated with enrollment growth without a fee increase.

The Metropolitan Community College Management’s Discussion and Analysis
(21)
The MCC budget process through FY 2015 has been reviewed. It is management’s opinion that the former budget allocation model was not well aligned with the revenue that the College had been receiving and as a result, the FY 2013 budget was formulated with a different approach which moved to actual rather than theoretical funding of expenses. In response to declining projected revenues, the College has identified a number of other revenue enhancement initiatives. These include:
Implementation of a comprehensive Strategic Enrollment Management (SEM) plan to maximize district‐wide effectiveness and efficiency in recruiting, retaining, marketing, developing, and helping students to complete their higher education objectives.
Build upon the growing success of our Institute for Workforce Innovation by expanding the institutional model of the delivery of career and technical education by partnering with the Metropolitan Kansas City Area’s businesses and industries to create more workforce “stackable credentials” that bridge the non‐credit training to associate degrees and employment.
Pursue opportunities to annex additional school districts in the MCC service area.
Better meet market demands through expansion of our KC‐Online course offerings.
Create a robust MCC Foundation and fundraising strategy and operational plan that maximally leverages existing resources and relationships into successful multi‐dimensional fundraising activities throughout the year to benefit the needs of MCC and its students.
Continue to aggressively develop MCC “brand awareness” through marketing and public information activities.
As these projects materialize, the additional revenue from these initiatives will be included in the College’s long‐range financial plan to supplement the three other major sources of revenue.
Requests for Information
These financial statements and discussions are designed to provide a general overview of the College’s finances for all those with an interest in the entity’s finances. Questions concerning any information provided in this report should be addressed to Financial Services Department, 3200 Broadway, Kansas City, MO 64111.

The Metropolitan Community College Combined Statement of Net Position
See accompanying Notes to Combined Basic Financial Statements (22)
2014 2013 (RESTATED)
Assets
Current assets
Cash and cash equivalents 38,971,908$ 39,793,392$
Short‐term investments 21,142,770 28,355,821
Short‐term investments, restricted 8,153,910 9,142,449
Accounts receivable, less allowance for doubtful
accounts of 2014 $356,058 and 2013 $472,904 7,642,627 7,991,459
Inventories 2,133,753 1,836,572
Other assets 757,162 315,066
Total current assets 78,802,130 87,434,759
Noncurrent assets
Long‐term investments 18,148,945 3,211,251
Capital assets:
Nondepreciable 8,753,400 8,841,625
Depreciable,net 121,388,573 126,540,625
Total noncurrent assets 148,290,918 138,593,501
Total assets 227,093,048 226,028,260
Deferred outflow of resources ‐ ‐
Total assets and deferred outflow of resources 227,093,048 226,028,260
Liabilities
Current liabilities
Accounts payable, accrued and other liabilities 11,756,736$ 13,418,297$
Compensated absences 2,596,870 2,760,582
Current maturities of bonds payable 4,823,550 6,440,279
Unearned revenue 3,706,853 4,543,119
Notes payable ‐ capital lease 332,432 ‐
Total current liabilities 23,216,441 27,162,277
Noncurrent liabilities
Bonds payable 68,057,303 72,880,853
Compensated absences 146,689 147,962
Post‐employment benefit obligation ‐ 193,837
Notes payable ‐ capital lease 1,329,727 ‐
Accrued rent 2,989,908 3,886,881
Total noncurrent liabilities 72,523,627 77,109,533
Total liabilities 95,740,068 104,271,810
Deferred inflow of resources ‐ ‐
Net position
Net investment in capital assets 57,261,120 56,061,118
Restricted for debt retirement 8,153,910 9,142,449
Designated for Deferred Maintenance 1,983,064 ‐
Designated for Information Technology 500,000 ‐
Unrestricted 63,454,886 56,552,883
Total net position 131,352,980$ 121,756,450$
June 30

The Metropolitan Community College Combined Statement of Revenues, Expenses and Changes in Net Position
See accompanying Notes to Combined Basic Financial Statements (23)
2014 2013 (RESTATED)
Operating revenues
Student tuition and fees (net of scholarship
allowance of 2014 $25,204,433
and 2013 $26,054,901) 21,734,681$ 22,543,810$
Federal grants and contracts 36,592,478 36,626,467
State and local grants and contracts 4,780,976 4,800,005
Auxiliary services revenues 8,731,750 9,634,675
Other operating revenues 5,492,017 5,198,355
Total operating revenues 77,331,902 78,803,312
Operating expenses
Salaries and wages 61,310,660 67,759,794
Fringe benefits 22,327,660 30,833,628
Supplies and other services 29,268,728 25,701,609
Utilities 3,553,120 3,279,946
Scholarships and fellowships 5,981,304 7,136,597
Depreciation 6,953,151 6,981,574
Total operating expenses 129,394,623 141,693,148
Operating loss (52,062,721) (62,889,836)
Nonoperating revenues (expenses)
State appropriation 29,447,940 29,705,779
County property tax revenue 31,605,159 31,831,624
Investment income (loss) 748,053 (138,590)
Other nonoperating revenue 3,086,370 3,137,387
Interest on debt related to capital assets (3,228,271) (3,435,061)
Total nonoperating revenues, net 61,659,251 61,101,139
Change in net position 9,596,530 (1,788,697)
Net position, beginning of year 121,756,450 124,264,840
Change in accounting principle ‐ (719,693)
Net position, beginning of year, as restated ‐ 123,545,147
Net position, end of year 131,352,980$ 121,756,450$
Year ended June 30

The Metropolitan Community College Combined Statement of Cash Flows
See accompanying Notes to Combined Basic Financial Statements (24)
2014 2013 (RESTATED)
Cash Flow from Operating Activities
Student tuitions and fees 21,281,216$ 21,361,910$
Payments to suppliers (34,168,468) (27,322,794)
Payments to utilities (3,553,120) (3,279,946)
Payments to employees (61,391,473) (67,686,038)
Payments for benefits (20,349,424) (29,513,521)
Payments for financial aid and scholarships (5,981,304) (7,136,597)
Auxiliary enterprise charges, bookstore and vending 8,731,750 9,634,675
Contracts and grants 41,709,822 39,658,074
Other operating receipts 5,456,316 5,092,404
Net Cash Used by Operating Activities (48,264,685) (59,191,833)
Cash Flow from Non Capital Financing Activities
State aid and grants appropriations 29,447,940 29,705,779
County property tax 31,605,159 31,831,624
Direct lending receipts 13,880,184 16,029,880
Direct lending payments (13,880,184) (16,029,880)
Other nonoperating revenue (rental) 2,170,725 2,109,564
Net Cash Provided by Noncapital Financing Activities 63,223,824 63,646,967
Cash Flow from Capital Financing
Purchases of capital assets (37,215) (1,596,037)
Debt payments (6,295,000) (5,915,000)
Interest paid on debt related to capital assets (3,517,734) (3,778,822)
Net Cash Used by Financing Activities (9,849,949) (11,289,859)
Cash Flow from Investing Activities
Proceeds from sales and maturities of investments 45,418,155 47,524,697
Interest on investments 543,886 336,122
Purchase of investments (51,892,715) (45,927,823)
Net Cash Provided (Used) by Investing Activities (5,930,674) 1,932,996
Net Decrease in Cash and Cash Equivalents (821,484) (4,901,729)
Cash and Cash Equivalents, beginning of year 39,793,392 44,695,121
Cash and Cash Equivalents, end of year 38,971,908$ 39,793,392$
Year ended June 30

The Metropolitan Community College Combined Statement of Cash Flows, Continued
See accompanying Notes to Combined Basic Financial Statements (25)
2014 2013 (RESTATED)
Reconciliation of operating loss to net cash used by
operating activities
Operating Loss (52,062,721)$ (62,889,836)$
Adjustments to reconcile operating loss to net cash
Depreciation 6,953,151 6,981,574
Changes in assets and liabilities
Accounts receivable 296,627 (2,058,193)
Inventories (297,181) (50,587)
Other assets (397,455) (16,696)
Accounts payable, accrued and other liabilities (1,682,362) (1,183,972)
Unearned revenue (836,266) (249,335)
Post‐employment benefit obligation (238,478) 275,212
Net Cash Used by Operating Activities (48,264,685)$ (59,191,833)$
Schedule of noncash capital financing activities:
Capital asset financing 1,662,159$ ‐$
Year ended June 30

Foundation – Alumni Association of The Metropolitan Community College
See accompanying Notes to Combined Basic Financial Statements (26)
Statement of Financial Position
2014 2013
ASSETS
Cash and cash equivalents 810,208$ 2,623,212$
Marketable securities 10,525,728 6,705,610
Contribution receivable, net of allowance for uncollectible
contributions: 2014 $3,352; 2013 $3,245 143,361 127,367
Accrued interest receivable 16,152 15,936
Prepaid expense 675 2,399
Total assets 11,496,124$ 9,474,524$
LIABILITIES AND NET ASSETS
Liabilities:
Due to The Metropolitan Community College 120,180$ 66,786$
Accrued liabilities 336 1,250
Total liabilities 120,516 68,036
Net Assets:
Unrestricted 3,020,474 2,338,914
Temporarily restricted 3,333,189 2,575,429
Permanently restricted 5,021,945 4,492,145
Total net assets 11,375,608 9,406,488
Total liabilities and net assets 11,496,124$ 9,474,524$
June 30

Foundation – Alumni Association of The Metropolitan Community College
See accompanying Notes to Combined Basic Financial Statements (27)
Statement of Activities
Temporarily Permanently
Unrestricted Restricted Restricted Total
Revenue:
Contributions 319,696$ 426,940$ 522,244$ 1,268,880$
Contributed services 501,019 ‐ ‐ 501,019
Investment return 731,481 786,599 ‐ 1,518,080
Other income 9,665 24,565 7,556 41,786
Net assets released from
restrictions, satisfaction of
program restrictions 480,344 (480,344) ‐ ‐
Total revenue 2,042,205 757,760 529,800 3,329,765
Expenses:
Scholarships and grants 333,956 ‐ ‐ 333,956
Foundation projects 525,670 ‐ ‐ 525,670
Fundraising 300,611 ‐ ‐ 300,611
Management and general 200,408 ‐ ‐ 200,408
Total expenses 1,360,645 ‐ ‐ 1,360,645
Total change in net assets 681,560 757,760 529,800 1,969,120
Net assets:
Beginning 2,338,914 2,575,429 4,492,145 9,406,488
Ending 3,020,474$ 3,333,189$ 5,021,945$ 11,375,608$
Year Ended June 30, 2014

Foundation – Alumni Association of The Metropolitan Community College
See accompanying Notes to Combined Basic Financial Statements (28)
Statement of Activities
Temporarily Permanently
Unrestricted Restricted Restricted Total
Revenue:
Contributions 577,294$ 439,066$ 1,032,751$ 2,049,111$
Contributed services 439,599 ‐ ‐ 439,599
Investment return 519,159 534,742 89,867 1,143,768
Other income 150,706 7,279 9,506 167,491
Net assets released from
restrictions, satisfaction of
program restrictions 452,745 (452,745) ‐ ‐
Total revenue 2,139,503 528,342 1,132,124 3,799,969
Expenses:
Scholarships and grants 240,574 ‐ ‐ 240,574
Foundation projects 945,480 ‐ ‐ 945,480
Fundraising 263,759 ‐ ‐ 263,759
Management and general 175,840 ‐ ‐ 175,840
Total expenses 1,625,653 ‐ ‐ 1,625,653
Total change in net assets 513,850 528,342 1,132,124 2,174,316
Net assets:
Beginning 1,825,064 2,047,087 3,360,021 7,232,172
Ending 2,338,914$ 2,575,429$ 4,492,145$ 9,406,488$
Year Ended June 30, 2013

Foundation – Alumni Association of The Metropolitan Community College
See accompanying Notes to Combined Basic Financial Statements (29)
Statement of Cash Flows
2014 2013
Cash Flows From Operating Activities:
Change in net assets 1,969,120$ 2,174,316$
Adjustments to reconcile change in net assets to net cash
provided by operating activities
Contributions restricted for long‐term investments (522,244) (1,032,751)
Net realized and unrealized investment gains (1,297,987) (942,078)
Changes in operating assets and liabilities:
(Increase) decrease in contributions receivable (15,994) 51,592
(Increase) decrease in accrued interest receivable (216) 533
(Increase) decrease in prepaid expense 1,724 (2,399)
Increase (decrease) in amount due to The Metropolitan
Community College 53,394 (54,073)
Decrease in accrued liabilities (914) (1,135)
Net cash provided by operating activities 186,883 194,005
Cash Flows From Investing Activities:
Purchase of marketable securities (11,633,532) (3,141,786)
Sale of marketable securities 9,111,401 4,167,184
Net cash provided by (used in) investing activities (2,522,131) 1,025,398
Cash Flows From Financing Activities:
Contributions restricted for long‐term investments 522,244 1,032,751
Net cash provided by financing activities 522,244 1,032,751
Increase (decrease) in cash and cash equivalents (1,813,004) 2,252,154
Cash and Cash Equivalents:
Beginning 2,623,212 371,058
Ending 810,208$ 2,623,212$
June 30
The Metropolitan Community College
Notes To Combined Basic Financial Statements
June 30, 2014 and 2013
(30)
1. Summary of Significant Accounting Policies Organization The Junior College District of Metropolitan Kansas City, Missouri (the District) was created in May 1964 by the voters of seven suburban school districts and the Kansas City School District to provide comprehensive higher educational programs through its area colleges. The District also offers courses which meet the needs of persons who desire enrichment or retraining in the areas of liberal arts, occupational education, continuing education and community services. The District is now comprised of twelve school districts: Belton, Center, Grandview, Hickman Mills, Lee’s Summit, North Kansas City, Raytown, Kansas City, Blue Springs, Independence, Fort Osage and Park Hill. Five primary colleges have been established to serve the patrons of the District: Blue River, Longview, Maple Woods, Penn Valley and the Business & Technology College.
The combined financial statements of the Metropolitan Community College (the College) for the years presented, include the combined accounts and operations of the District and the Kansas City Metropolitan Community Colleges Building Corporation (the Building Corporation), which is a blended component unit. This summary of significant accounting policies of the College is presented to assist in understanding the College’s financial statements. The financial statements and notes are representations of the College’s management, who are responsible for their integrity and objectivity. These accounting policies conform to accounting principles generally accepted in the United States as applicable to governmental colleges and universities and have been consistently applied in the preparation of the financial statements. The following is a summary of the more significant policies.
Reporting Entity The College is governed by a six‐member board of trustees. As required by accounting principles generally accepted in the United States, the District’s financial statements present the District (the primary government), its blended component unit (the Building Corporation) and its discretely presented component unit, the Foundation ‐ Alumni Association of the Metropolitan Community Colleges (the Foundation). The component units are included in the College’s reporting entity because of the significance of their operations and financial relationships with the College.
Blended Component Unit The Building Corporation is a not‐for‐profit corporation formed in 1984 which is governed by a four‐member board. Although it is legally separate from the District, the Building Corporation is reported as if it were part of the primary government because its sole purpose is to provide for the construction and financing of educational facilities used by the College. The Building Corporation has the authority to issue Leasehold Development Bonds for the purposes of refunding previous bond issues or constructing new facilities. The buildings are owned by the Building Corporation, which, in turn, leases the buildings to the District under annually renewable lease agreements. The lease payments are equal to the principal and interest debt service payments required to service the related bond issuances. As the Building Corporation is a blended component unit, all balances and transactions between the District and Building Corporation have been eliminated. The Building Corporation has a June 30 fiscal year‐end.
The Metropolitan Community College
Notes To Combined Basic Financial Statements
June 30, 2014 and 2013
(31)
1. Summary of Significant Accounting Policies (Continued)
Discretely Presented Component Unit The Foundation is a non‐profit corporation and is considered to be a related organization to the District. The District’s Board of Trustees approves nominations to the Foundation’s board of directors, but the District’s accountability does not extend beyond approval of board members. The District is not financially accountable for the Foundation. Although the District does not control the timing or amount of receipts from the Foundation, the majority of resources or income thereon, which the Foundation holds and invests, is restricted to the activities of the District by the donors. As these restricted resources can only be used by, or for the benefit of, the District, the Foundation is considered a component unit of the College and is discretely presented in the College’s financial statements. During the years ended June 30, 2014 and 2013, the District received direct contributions from the Foundation of $498,353 and $439,599 respectively. The Foundation has a June 30 fiscal year‐end. Separate financial statements for the Foundation can be obtained at the Metropolitan Community College, 3200 Broadway, Kansas City, Missouri, 64111. The Foundation is presented on the accrual basis of accounting.
Basis of Accounting For financial reporting purposes, the College is considered a special purpose government engaged only in business‐type activities. Accordingly, the College’s combined financial statements have been presented using the economic resources measurement focus and the accrual basis of accounting. Under the accrual basis, revenues are recognized when earned, and expenses are recorded when an obligation has been incurred. All significant inter‐company transactions have been eliminated.
Cash Equivalents Cash includes deposits held at banks and all highly liquid instruments purchased with an original maturity of three months or less. Cash equivalents represent excess operating cash swept into an overnight repurchase agreement account, which are readily converted back to cash, on a daily basis, as operating funds are needed.
Investments It is the College’s policy to invest in obligations of the U.S. Treasury, repurchase agreements, bank certificates of deposit and agencies of the federal government and instrumentalities, and top rated commercial paper, which are permissible under Missouri statutes. The Building Corporation is allowed to invest in “permitted investments” as defined by applicable bond indentures. Investments are reported at fair value.
In addition to the investment tools available to the College, the Foundation’s marketable securities consist of equity securities, mutual fund shares, corporate bonds and government notes reported at fair value.
Capital Assets Land, construction in progress, buildings and improvements, software and equipment are recorded at cost for assets purchased and at appraised value at date of grant for items acquired by donation.

The Metropolitan Community College
Notes To Combined Basic Financial Statements
June 30, 2014 and 2013
(32)
1. Summary of Significant Accounting Policies (Continued)
Capital assets are defined by the College as assets with an initial, individual cost in excess of $5,000 and estimated useful lives in excess of one year. Interest costs on construction in progress are capitalized when amounts are significant. During the fiscal year ended June 30, 2013, the College capitalized $70,414 of interest.
Buildings and improvements and equipment are being depreciated on the straight‐line basis over their estimated useful lives as follows: buildings‐40 years, improvements‐15 years, software ‐3 years, and equipment, 3 to 10 years and rental textbooks are capitalized at cost and depreciated over 3 years. The District’s investment in infrastructure assets, which is not material to the total of capital assets, is recorded at cost and included in the costs of the related property.
Inventories Inventories are carried at the lower of cost or market on either the first in, first out basis or the average cost basis. Compensated absences District employees accumulate a limited amount of earned but unused vacation and sick leave for subsequent use. Earned, but unused vacation is paid to the employee upon termination, or retirement. Earned, but unused sick leave is paid to an active employee’s beneficiary upon death if occurring during active employment. Unearned Revenue Half of the summer school tuition revenue and all tuition for school sessions starting after June 30 have been deferred to the next fiscal year. Accrued Rent Accrued rent is the difference between rent on a straight‐line basis, as required by generally accepted accounting principles, and the actual scheduled payments for the lease.
Classification of Revenues The College has classified revenues as either operating or non‐operating revenues according to the following criteria:
Operating revenues Operating revenues include activities that have the characteristics of exchange transactions, such as (1) student tuition and fees, net of scholarship discounts and allowances, (2) sales and services of auxiliary enterprises, (3) federal, state and local grants and contracts. Non‐operating revenues Non‐operating revenues include activities that have the characteristics of non‐exchange transactions, such as state appropriations, investment income, and county property taxes.

The Metropolitan Community College
Notes To Combined Basic Financial Statements
June 30, 2014 and 2013
(33)
1. Summary of Significant Accounting Policies (Continued)
Tuition and Fees Tuition and fees revenues are reported net of scholarship allowances, while stipends and other payments made directly to students are presented as scholarship expenses.
County Property Tax Revenues The four counties in which the District lies bill the residents for real and personal property taxes due the District. Bills are sent in November and are delinquent after December 31. The taxes are collected by the counties primarily from November through the end of January. Substantially all amounts are received by the end of March. Taxes are remitted to the District throughout the collection period net of a 1.5% charge for assessment and collection services on an as‐collected basis and no accrual is made for delinquent property taxes.
State Appropriations State appropriations earned for general operating purposes are determined on a fiscal year basis ending June 30 based upon the state aid funding formula. Using this formula, fiscal year 1991–92 is a base year and following years are adjusted for inflation or any major state‐approved additions to programs.
Income Tax Status The College is exempt from income tax as a local governmental unit. The Building Corporation and the Foundation have qualified for exemption from income tax under Section 501(c) 3 of the Internal Revenue Code.
Reclassifications Certain reclassifications have been made to the prior year’s financial statements to conform to the current year’s financial statement presentation.
Net Position Net position represents the difference between assets and deferred outflows of resources and liabilities and deferred inflows of resources. Net position is presented in four major categories. The first is net investment in capital assets, which represents the College’s equity in property, plant and equipment. The second is restricted. The third is designated by the Board from unrestricted reserves and the fourth is unrestricted.
Net investment in capital consists of capital assets, net of accumulated depreciation, reduced by the outstanding balances of any borrowings used for the acquisition, construction or improvement of those assets. Net position is reported as restricted when there are limitations imposed on their use through enabling legislation or through external restrictions imposed by creditors, grantors or laws or regulations of other governments.
The College first applied restricted resources when an expense is incurred for purposes for which both restricted and unrestricted assets are available.

The Metropolitan Community College
Notes To Combined Basic Financial Statements
June 30, 2014 and 2013
(34)
1. Summary of Significant Accounting Policies (Continued) Use of Estimates The preparation of financial statements in conformity with accounting principles generally accepted in the United States of America requires management to make estimates and assumptions that affect the reported amounts of assets and liabilities and disclosure of contingent assets and liabilities at the date of the basic financial statements and the reported amounts of revenues and expenses during the reporting period. Actual results could differ from those estimates.
Scholarship Allowances and Student Aid Financial aid to students is reported in the financial statements, as prescribed by the National Association of College and University Business Officers (NACUBO). Certain aid (loan, funds provided to students as awarded by third parties and Federal Direct Lending) is accounted for as third party payments (credited to the student’s account as if the student made the payment). All other aid is reflected in the financial statements as operating expenses or scholarship allowances which reduce revenue. The amount reported as operating expenses represents the portion of aid that was provided to the student in the form of cash. Scholarship allowances represent the portion of aid provided to the student in the form of reduced tuition.
Prior Period Adjustment The College adopted GASB Statement No. 65, Items Previously Reported as Assets and Liabilities, retroactive to July 1, 2012. This statement requires certain items that were previously reported as assets and liabilities to be reported as outflows of resources or inflows of resources in the year incurred or received. In conjunction with adopting this statement, the College began treating all bond issuance costs as an expense in the year incurred.
The implementation of this standard resulted in the July 1, 2012 net position being restated to reflect the write‐off of bond issuance costs that were carried on the Statement of Net Position. The impact of this restatement is as follows: As previously Amount of Restated Reported Restatement Balance
Bond issuance costs $ 719,693 ($ 719,693) $ ‐
Total net position $ 124,264,840 ($ 719,693) $ 123,545,147

The Metropolitan Community College
Notes To Combined Basic Financial Statements
June 30, 2014 and 2013
(35)
2. Deposits and Investments Missouri statutes require depository banks to pledge securities as collateral for public funds on deposit, except funds covered by federal depository insurance. Missouri statutes do not extend to the Building Corporation regarding collateralization of funds not covered by federal depository insurance. The College deposits were not exposed to custodial credit risk as of June 30, 2014 and 2013. The College has the following deposits and investments:
Investments Maturities in Years
Deposits
FY14 FY 13
Cash 770$ 87,598$
Certificate of Deposits 14,431,235 ‐
Total Deposits 14,432,005$ 87,598$
Year Ended June 30, 2014 Fair Value Less Than 1 1 ‐ 5
District
Repurchase Agreement $ 33,076,000 $ 33,076,000 $ ‐
Less outstanding checks and
deposits/withdrawals in
transit (482,603) (482,603) ‐
Federal Home Loan Bank 4,998,120 2,999,160 1,998,960
Federal National Mortgage
Association 18,846,090 ‐ 18,846,090
Federal Home Loan Mortgage
Corporation 5,986,470 2,998,950 2,987,520
Total District 62,424,077 38,591,507 23,832,570
Building Corporation
Money Market Mutual Funds 6,377,740 6,377,740 ‐
Federal Home Loan Bank 904,767 ‐ 904,767
Federal National Mortgage
Association 2,278,944 ‐ 2,278,944
Total Building Corp 9,561,451 6,377,740 3,183,711 Total Investments $ 71,985,528 $ 44,969,247 $ 27,016,281

The Metropolitan Community College
Notes To Combined Basic Financial Statements
June 30, 2014 and 2013
(36)
2. Deposits and Investments (Continued)
Investments Maturities in Years
A summary of investments and deposits at June 30, 2014 and 2013 is as follows:
Year Ended June 30, 2013 Fair Value Less Than 1 1 ‐ 5
District
Repurchase Agreement $ 29,146,000 $ 29,146,000 $ ‐
Less outstanding checks and
deposits/withdrawals in
transit (1,531,733) (1,531,733) ‐
Federal Home Loan Bank 7,977,450 7,977,450 ‐
Federal National Mortgage
Association 28,575,820 28,575,820 ‐
Total District 64,167,537 64,167,537 ‐
Building Corporation
Money Market Mutual Funds 12,091,527 12,091,527 ‐
Federal Home Loan Bank 921,239 ‐ 921,239
Federal National Mortgage
Association 3,235,012 945,000 2,290,012
Total Building Corp 16,247,778 13,036,527 3,211,251
Total Investments $ 80,415,315 $ 77,204,064 $ 3,211,251
FY14 FY13
Deposits Cash 770$ 87,598$
Certificate of Deposits 14,431,235 ‐
Investments
District Repurchase Agreement 33,076,000 29,146,000
Less outstanding checks
and deposits/withdrawals in transit (482,603) (1,531,733)
Securities 29,830,680 36,553,270
Bldg Corp Money Mutual Market 6,377,740 12,091,527
Securities 3,183,711 4,156,251
Total Deposits and Investments 86,417,533$ 80,502,913$

The Metropolitan Community College
Notes To Combined Basic Financial Statements
June 30, 2014 and 2013
(37)
2. Deposits and Investments (Continued)
The investments and deposits at June 30, 2014 and 2013 are shown on the statements of net position as follows:
State law limits investments in government and municipal bonds and top rated commercial paper as recognized by national rating organizations. The College has no investment policy that would further limit its investment choices. As of June 30, 2014, the College’s repurchase agreement is invested in government agencies that are all rated Aaa, AA+ & AAA by Moody’s Investors Services, Standards & Poor’s & Fitch’s ratings, respectively. The District’s and Building Corporation’s investments in money market mutual funds are invested in Treasury Obligations which is rated Aaa, AA+ & AAA by Moody’s Investors Services, Standard & Poor’s and Fitch’s ratings, respectively. All other investments held by the District and the Building Corporation are rated Aaa, AA+ and AAA by Moody’s Investors Service, Standard & Poor’s and Fitch ratings, respectively.
The College places no limit on the amount the College may invest in any one issuer. In fiscal year 2014, more than 5 percent of the College’s investments were invested in government agencies, Federal Home Loan Bank (FHLB), Federal National Mortgage Association (FNMA) and Federal Home Loan Mortgage Corporation (FHLMC). The investments were 8.2%, 29.3% and 8.3%, respectively.
In fiscal year 2013, more than 5 percent of the College’s investments were invested in government agencies, Federal Home Loan Bank (FHLB) and Federal National Mortgage Association (FNMA). The investments were 11.1% and 39.6%, respectively.
The College’s deposit and investment balances were not exposed to custodial credit risk as of June 30, 2014 and 2013.
FY 14 FY 13
Cash and Cash Equivalent $ 38,971,908 $ 39,793,392
Short Term Investments 29,296,680 37,498,270
Long Term Investments 18,148,945 3,211,251
Total 86,417,533$ 80,502,913$

The Metropolitan Community College
Notes To Combined Basic Financial Statements
June 30, 2014 and 2013
(38)
3. Capital Assets
Capital assets consist of the following categories:
Year Ended June 30, 2014
Capital assets not being depreciated:
Land 8,664,239$ ‐$ 250,000$ 8,414,239$
Art 56,000 ‐ ‐ 56,000
Construction in progress 62,831 251,843 62,831 251,843
Equipment in progress 58,555 31,318 58,555 31,318
Total assets not being depreciated 8,841,625 283,161 371,386 8,753,400
Capital assets being depreciated:
Buildings and improvements 215,009,464 62,831 ‐ 215,072,295
Infrastructure 6,714,403 ‐ ‐ 6,714,403
Equipment 19,990,649 1,424,455 1,423,041 19,992,063
Text book rental 1,823,057 415,837 186,637 2,052,257
Software 683,689 ‐ ‐ 683,689
Total assets being depreciated 244,221,262 1,903,123 1,609,678 244,514,707
Less accumulated depreciation:
Buildings and improvements 98,235,142 4,579,375 ‐ 102,814,517
Infrastructure 1,896,689 335,721 ‐ 2,232,410
Equipment 15,840,042 1,415,576 1,423,041 15,832,577
Text book rental 1,183,422 513,419 84,613 1,612,228
Software 525,342 109,060 ‐ 634,402
Total accumulated depreciation 117,680,637 6,953,151 1,507,654 123,126,134
Capital assets, net 135,382,250$ (4,766,867)$ 473,410$ 130,141,973$
Ending BalanceRetirementsAdditions
Beginning
Balance

The Metropolitan Community College
Notes To Combined Basic Financial Statements
June 30, 2014 and 2013
(39)
3. Capital Assets (Continued)
The College elected not to capitalize their collection of library books. This collection adheres to the College’s policy to (a) maintain them for public exhibition, education, or research; (b) protect, keep unencumbered, care for, and preserve them; and (c) require proceeds from their sale to be used to acquire other collection items. Generally accepted accounting principles permit collections maintained in this manner to be charged to operations at the time of purchase rather than be capitalized.
Beginning Ending
Balance Additions Retirements Balance
Capital assets not being depreciated:
Land 8,664,239$ ‐$ ‐$ 8,664,239$
Art 56,000 ‐ ‐ 56,000
Construction in progress 2,509,531 183,459 2,630,159 62,831
Equipment in progress 394,887 762,142 1,098,474 58,555
Total assets not being depreciated 11,624,657 945,601 3,728,633 8,841,625
Capital assets being depreciated:
Buildings and improvements 212,767,465 2,241,999 ‐ 215,009,464
Infrastructure 6,326,243 388,160 ‐ 6,714,403
Equipment 18,951,855 1,098,474 59,680 19,990,649
Text book rental 1,023,667 799,390 ‐ 1,823,057
Software 629,988 53,701 ‐ 683,689
Total assets being depreciated 239,699,218 4,581,724 59,680 244,221,262
Less accumulated depreciation:
Buildings and improvements 93,697,228 4,537,914 ‐ 98,235,142
Infrastructure 1,562,795 333,894 ‐ 1,896,689
Equipment 14,486,075 1,413,647 59,680 15,840,042
Text book rental 645,548 537,874 ‐ 1,183,422
Software 367,097 158,245 ‐ 525,342
Total accumulated depreciation 110,758,743 6,981,574 59,680 117,680,637
Capital assets, net 140,565,132$ (1,454,249)$ 3,728,633$ 135,382,250$
Year Ended June 30, 2013

The Metropolitan Community College
Notes To Combined Basic Financial Statements
June 30, 2014 and 2013
(40)
4. Long‐Term Liabilities
Long‐term liability activity for the District and the Building Corporation were as follows:
Year Ended June 30, 2014
District
Other Debt
Compensated absences 2,908,544$ $ 2,159,078 $ 2,324,063 $ 2,743,559 $ 2,596,870
Post Employment Benefit (Asset) 193,867 2,649,522 2,888,000 (44,611) (44,611)
Notes Payable ‐ 1,977,701 315,542 1,662,159 332,432
Building Corporation
Bonds Payable:
Refunding lease certificates of
participation, Series 2002 1,815,000 ‐ 1,815,000 ‐ ‐
Leasehold revenue bonds, Series 2006
Principal 50,980,000 ‐ 3,430,000 47,550,000 3,600,000
Premium 1,048,743 ‐ 168,472 880,271 155,717
Leasehold revenue bonds, Series 2008
Principal 25,695,000 ‐ 1,050,000 24,645,000 1,090,000
Discount (217,611) ‐ (23,193) (194,418) (22,167)
Total long‐term liabilities $82,423,513 $ 6,786,301 $11,967,884 $77,241,960 $ 7,708,241
Ending
Balance
Due Within
One Year
Beginning
Balance Additions Reductions
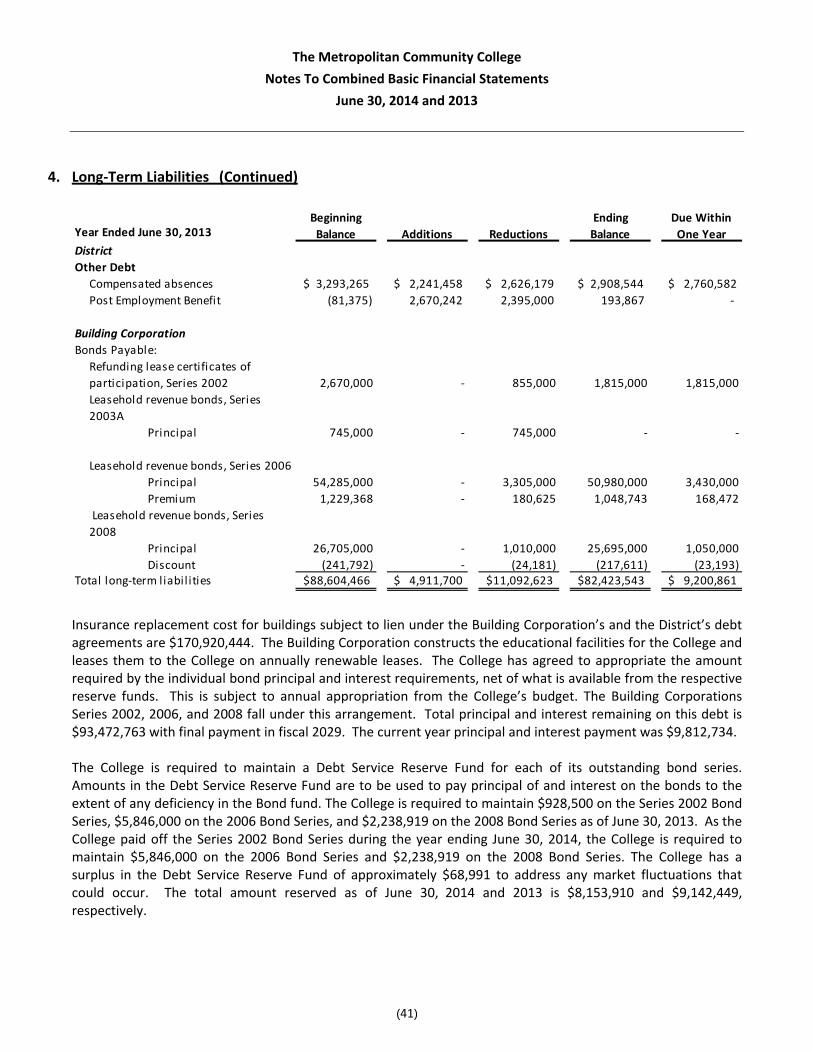
The Metropolitan Community College
Notes To Combined Basic Financial Statements
June 30, 2014 and 2013
(41)
4. Long‐Term Liabilities (Continued)
Insurance replacement cost for buildings subject to lien under the Building Corporation’s and the District’s debt agreements are $170,920,444. The Building Corporation constructs the educational facilities for the College and leases them to the College on annually renewable leases. The College has agreed to appropriate the amount required by the individual bond principal and interest requirements, net of what is available from the respective reserve funds. This is subject to annual appropriation from the College’s budget. The Building Corporations Series 2002, 2006, and 2008 fall under this arrangement. Total principal and interest remaining on this debt is $93,472,763 with final payment in fiscal 2029. The current year principal and interest payment was $9,812,734. The College is required to maintain a Debt Service Reserve Fund for each of its outstanding bond series. Amounts in the Debt Service Reserve Fund are to be used to pay principal of and interest on the bonds to the extent of any deficiency in the Bond fund. The College is required to maintain $928,500 on the Series 2002 Bond Series, $5,846,000 on the 2006 Bond Series, and $2,238,919 on the 2008 Bond Series as of June 30, 2013. As the College paid off the Series 2002 Bond Series during the year ending June 30, 2014, the College is required to maintain $5,846,000 on the 2006 Bond Series and $2,238,919 on the 2008 Bond Series. The College has a surplus in the Debt Service Reserve Fund of approximately $68,991 to address any market fluctuations that could occur. The total amount reserved as of June 30, 2014 and 2013 is $8,153,910 and $9,142,449, respectively.
Year Ended June 30, 2013
District
Other Debt
Compensated absences 3,293,265$ $ 2,241,458 $ 2,626,179 2,908,544$ $ 2,760,582
Post Employment Benefit (81,375) 2,670,242 2,395,000 193,867 ‐
Building Corporation
Bonds Payable:
Refunding lease certificates of
participation, Series 2002 2,670,000 ‐ 855,000 1,815,000 1,815,000
Leasehold revenue bonds, Series
2003A
Principal 745,000 ‐ 745,000 ‐ ‐
Leasehold revenue bonds, Series 2006
Principal 54,285,000 ‐ 3,305,000 50,980,000 3,430,000
Premium 1,229,368 ‐ 180,625 1,048,743 168,472
Leasehold revenue bonds, Series
2008
Principal 26,705,000 ‐ 1,010,000 25,695,000 1,050,000
Discount (241,792) ‐ (24,181) (217,611) (23,193)Total long‐term l iabil ities $88,604,466 $ 4,911,700 $11,092,623 $82,423,543 $ 9,200,861
Beginning
Balance
Ending
Balance
Due Within
One YearAdditions Reductions
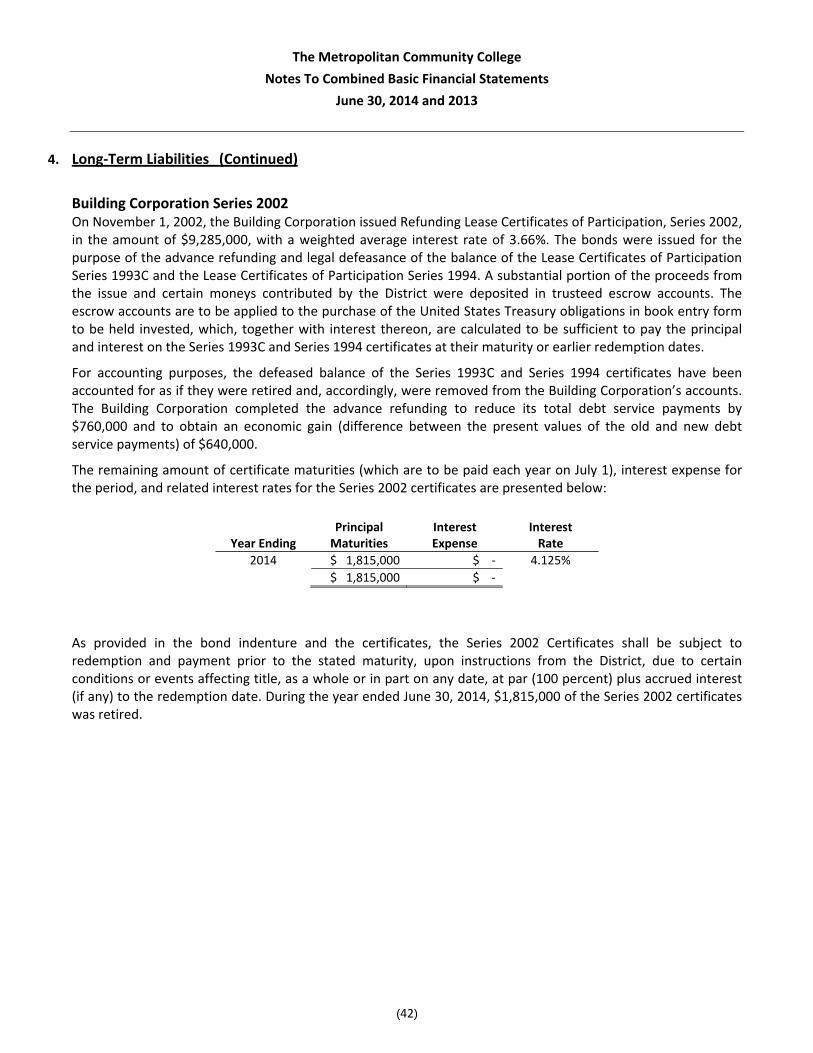
The Metropolitan Community College
Notes To Combined Basic Financial Statements
June 30, 2014 and 2013
(42)
4. Long‐Term Liabilities (Continued)
Building Corporation Series 2002 On November 1, 2002, the Building Corporation issued Refunding Lease Certificates of Participation, Series 2002, in the amount of $9,285,000, with a weighted average interest rate of 3.66%. The bonds were issued for the purpose of the advance refunding and legal defeasance of the balance of the Lease Certificates of Participation Series 1993C and the Lease Certificates of Participation Series 1994. A substantial portion of the proceeds from the issue and certain moneys contributed by the District were deposited in trusteed escrow accounts. The escrow accounts are to be applied to the purchase of the United States Treasury obligations in book entry form to be held invested, which, together with interest thereon, are calculated to be sufficient to pay the principal and interest on the Series 1993C and Series 1994 certificates at their maturity or earlier redemption dates.
For accounting purposes, the defeased balance of the Series 1993C and Series 1994 certificates have been accounted for as if they were retired and, accordingly, were removed from the Building Corporation’s accounts. The Building Corporation completed the advance refunding to reduce its total debt service payments by $760,000 and to obtain an economic gain (difference between the present values of the old and new debt service payments) of $640,000.
The remaining amount of certificate maturities (which are to be paid each year on July 1), interest expense for the period, and related interest rates for the Series 2002 certificates are presented below:
As provided in the bond indenture and the certificates, the Series 2002 Certificates shall be subject to redemption and payment prior to the stated maturity, upon instructions from the District, due to certain conditions or events affecting title, as a whole or in part on any date, at par (100 percent) plus accrued interest (if any) to the redemption date. During the year ended June 30, 2014, $1,815,000 of the Series 2002 certificates was retired.
Year Ending
Principal Maturities
Interest Expense
Interest Rate
2014 $ 1,815,000 $ ‐ 4.125%
$ 1,815,000 $ ‐

The Metropolitan Community College
Notes To Combined Basic Financial Statements
June 30, 2014 and 2013
(43)
4. Long‐Term Liabilities (Continued)
Building Corporation Series 2003 On April 1, 2003, the Building Corporation issued Leasehold Revenue Refunding Bonds Series 2003A for $13,605,000 and Series 2003B for $1,195,000, with a weighted average interest rate of 2.49%. The bonds were issued for the purpose of the advance refunding and legal defeasance of the balances of the Leasehold Revenue Refunding and Improvement Bonds, Series 1993A, and the Leasehold Revenue Refunding Bonds, Series 1993B. A substantial portion of the proceeds from the issues and certain moneys contributed by the District were deposited in trusteed escrow accounts. The escrow accounts are to be applied to the purchase of the United States Treasury obligations in book entry form to be held invested, which, together with interest thereon, are calculated to be sufficient to pay the principal and interest on the Series 1993A and Series 1993B bonds at maturity or earlier redemption dates.
For accounting purposes, the defeased balances of Series 1993A and Series 1993B bonds have been accounted for as if they were retired and, accordingly, were removed from the Building Corporation’s accounts. The Building Corporation completed the advance refunding to reduce its total debt service payments by $1.2 million and to obtain an economic gain (difference between the present values of the old and new debt service payments) of $1 million.
As provided in the bond indenture and the certificates, the Series 2003A shall be subject to redemption and payment prior to the stated maturity, upon instructions from the District, due to certain conditions or events affecting title, as a whole or in part on any date, at par (100 percent), plus accrued interest (if any) to the redemption date. During the year ended June 30, 2013, $745,000 of the Series 2003A certificates was retired.
Building Corporation Series 2006 On November 1, 2006, the Building Corporation issued Leasehold Revenue and Improvement Bonds, in the amount of $58,460,000, with a weighted average interest rate of 4.15%. The bonds were issued for the purpose of providing funds ($25,026,500) to pay costs of improvements to the College’s facilities (the “2006 project”) and refunding $33,120,000 of Series 2001 Leasehold Refunding Revenue Bonds.
The amount of certificate maturities (which are to be paid each year on July 1), interest expense for the period and the related interest rates for the Series 2006 certificates are presented below:
Principal Interest Interest Year Ending Maturities Expense Rate
2015 $ 3,600,000 $ 2,048,431 5.00% 2016 3,780,000 1,859,431 5.00% 2017 3,970,000 1,670,719 4.75% 2018 4,155,000 1,462,969 5.00% 2019 4,365,000 1,244,719 5.00%
2020‐2024 21,780,000 2,825,712 4.13%‐5.00% 2025‐2026 5,900,000 171,063 4.25%
$ 47,550,000 $ 11,283,044
As provided in the bond indenture and the certificates, the Series 2006 Bonds, maturing in years 2017 and later shall be subject to redemption and payment prior to the maturity at the option of the Corporation, upon instructions from the District, on and after July 1, 2016, as a whole or in part at any time, at par (100 percent) of the principal amount thereof, plus accrued interest thereon to the redemption date. During the year ended June 30, 2014, $3,430,000 of the Series 2006 was retired.

The Metropolitan Community College
Notes To Combined Basic Financial Statements
June 30, 2014 and 2013
(44)
4. Long‐Term Liabilities (Continued)
Building Corporation Series 2008 On July 9, 2008, the Building Corporation issued Lease Certificates of Participation Bonds, in the amount of $29,535,000, with a weighted average interest of 4.83%. The proceeds from these bonds will be used to acquire, construct, equip, renovate, remodel and improve a Health Science Institute and other facilities of the District. Proceeds will also be used to fund a Debt Service Reserve Fund and pay the costs of delivery for the Series 2008 Certificates.
The remaining amount of certificate maturities (which are to be paid each year on July 1, interest expense for the period and the related interest rates for the Series 2008 certificates are presented below:
Year Ending
Principal Maturities
Interest Expense
Interest Rate
2015 $ 1,090,000 $ 1,101,519 4.00%2016 1,135,000 1,056,119 4.00%
2017 1,180,000 1,008,919 4.25%
2018 1,230,000 956,644 4.25%
2019 1,280,000 902,244 4.38%
2020‐2024 7,295,000 3,557,526 4.50%‐5.00%
2025‐2029 11,435,000 1,411,750 5.00%
$ 24,645,000 $ 9,994,721
As provided in the bond indenture and the certificates, the Series 2008 Bonds are subject to optional prepayment on July 1, 2017 and thereafter, in whole or in part, at any time, at a prepayment price equal to par (100%), plus accrued interest thereon to the redemption date. During the year ended June 30, 2014, $1,050,000 of the principal had been retired on the Series 2008 bonds.
Capital Lease
On March 27, 2014, the College entered into a capital lease agreement with Dell Financial Services. The lease includes an interest‐free $1,977,701 agreement. The lease included wiring, wireless connectivity, security and other technology updates.
Year Ending
Principal Maturities
Interest Expense
Interest Rate
2015 $ 332,432 $ ‐ 0.0%2016 332,432 ‐ 0.0%
2017 332,432 ‐ 0.0%
2018 332,432 ‐ 0.0%
2019 332,471 ‐ 0.0%
$ 1,662,199 $ ‐
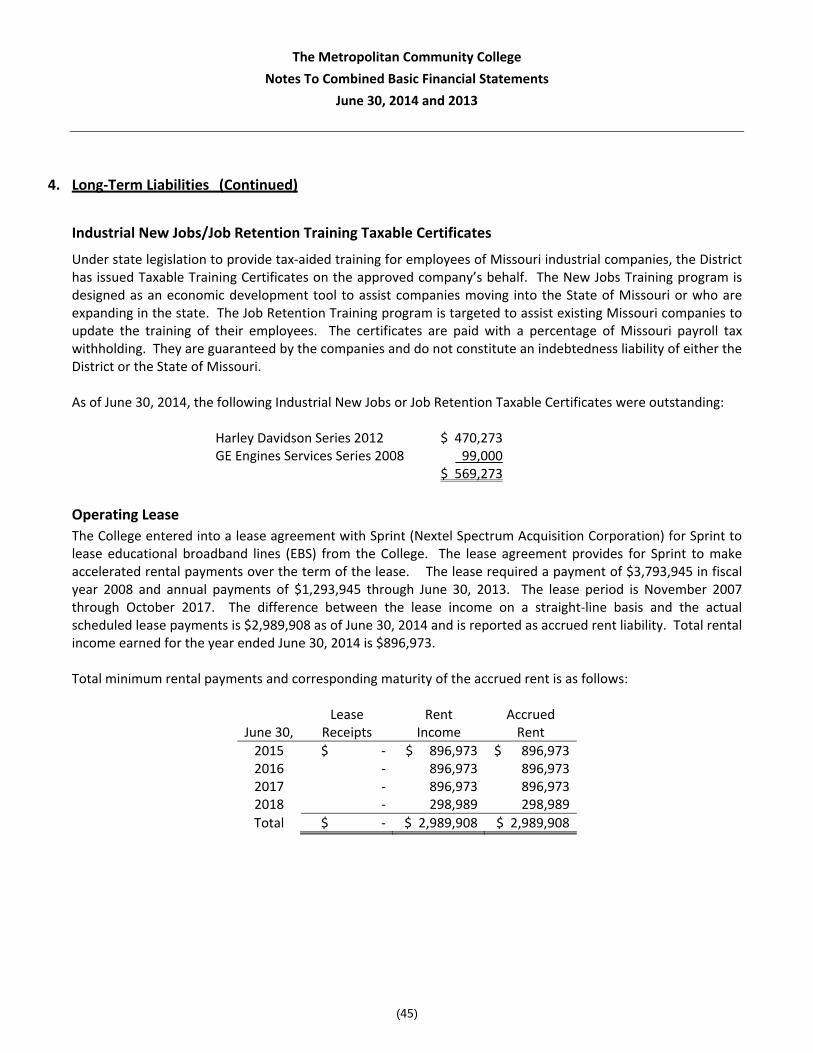
The Metropolitan Community College
Notes To Combined Basic Financial Statements
June 30, 2014 and 2013
(45)
4. Long‐Term Liabilities (Continued)
Industrial New Jobs/Job Retention Training Taxable Certificates
Under state legislation to provide tax‐aided training for employees of Missouri industrial companies, the District has issued Taxable Training Certificates on the approved company’s behalf. The New Jobs Training program is designed as an economic development tool to assist companies moving into the State of Missouri or who are expanding in the state. The Job Retention Training program is targeted to assist existing Missouri companies to update the training of their employees. The certificates are paid with a percentage of Missouri payroll tax withholding. They are guaranteed by the companies and do not constitute an indebtedness liability of either the District or the State of Missouri. As of June 30, 2014, the following Industrial New Jobs or Job Retention Taxable Certificates were outstanding: Harley Davidson Series 2012 $ 470,273 GE Engines Services Series 2008 99,000 $ 569,273
Operating Lease
The College entered into a lease agreement with Sprint (Nextel Spectrum Acquisition Corporation) for Sprint to lease educational broadband lines (EBS) from the College. The lease agreement provides for Sprint to make accelerated rental payments over the term of the lease. The lease required a payment of $3,793,945 in fiscal year 2008 and annual payments of $1,293,945 through June 30, 2013. The lease period is November 2007 through October 2017. The difference between the lease income on a straight‐line basis and the actual scheduled lease payments is $2,989,908 as of June 30, 2014 and is reported as accrued rent liability. Total rental income earned for the year ended June 30, 2014 is $896,973. Total minimum rental payments and corresponding maturity of the accrued rent is as follows:
Lease Rent Accrued June 30, Receipts Income Rent
2015 $ ‐ $ 896,973 $ 896,9732016 ‐ 896,973 896,9732017 ‐ 896,973 896,9732018 ‐ 298,989 298,989
Total $ ‐ $ 2,989,908 $ 2,989,908

The Metropolitan Community College
Notes To Combined Basic Financial Statements
June 30, 2014 and 2013
(46)
4. Long‐Term Liabilities (Continued)
Subsequent Event In September 2014, the Building Corporation completed a private‐placement advance bond refunding of the outstanding Series 2006 and Series 2008 bonds. The bonds were paid‐in‐full with a subsequent Series 2014A, $37,895,000 non‐taxable and Series 2014B, $27,450,000 taxable bond issuance.
5. Retirement Plan
All full‐time and certain part‐time employees of the District participate either in the Public School Retirement System (PSRS) or the Public Education Employee Retirement System (PEER), both of which are cost sharing multiple‐employer public employee retirement systems, as required by the retirement law set forth in Chapter 169, Revised Statutes of Missouri. As required by state law, each year the PSRS/PEERS Board retains an actuarial firm to review the retirement plan funds and recommend any contribution rate changes subject to any annual ceiling limitations. These rate changes must be voted on and approved by PSRS/PEERS Board. Contribution rates for employees in the Public School Retirement System and employees in the Public Education Employee Retirement System has remained the same at 14.5 and 6.86 percent in fiscal year 2014, 2013 and 2012. The contribution rate is based on applicable earnings and employer cost of medical, dental, and vision premiums and is matched by the District.

The Metropolitan Community College
Notes To Combined Basic Financial Statements
June 30, 2014 and 2013
(47)
5. Retirement Plan (Continued)
Employees who meet minimum retirement age and service requirements are entitled to a retirement benefit, payable monthly for life, calculated based upon the total years of service and final average salary. Final average salary for both retirement systems members is the average monthly salary for the three highest consecutive years of service. Benefits fully vest upon receiving five credited years of service. Both plans allow employees with at least five years of service to retire with full benefits at age 60 or at age 55 with reduced benefits. Employees with 30 years of service may retire with full benefits at any age. Members of both systems may retire with full benefits at age 55 and 25 years of service or with reduced benefits with 25 years of service. The system also provides death and disability benefits as established by state statute. Effective July 1, 1998, and July 1, 2000, the “Rule of 80” was initiated for members of the Public Education System and Non‐Teacher School Employee Retirement System, respectively, whereby a member could retire with full benefits when his/her age plus credited years of service total eighty.
The District’s contributions to these plans amounted to $5,808,545, $6,490,981, and $6,764,237 for fiscal years 2014, 2013, and 2012, respectively. The District paid 100% of its required contributions for each of these years.
The plans are multiemployer defined benefit plans and, as such, the District’s portions of the actuarial present values of plan benefits and assets available for plan benefits are not determinable. Both systems issue a publicly available financial report that includes financial statements and required supplementary information. That report may be obtained by writing to either system at: P.O. Box 268, Jefferson City, Missouri 65102 or by calling 1‐800‐392‐6848.
In addition, the District provides an early‐retirement incentive for those employees meeting certain age and length of service requirements. Early retirement incentive payments for the years ended June 30, 2014, 2013 and 2012 amounted to $0, $7,004,992, and $2,596,597, respectively. In fiscal year 2014, 2013 and 2012, individuals receiving incentive payments were 0, 131, and 67, respectively. As noted below under Other Post‐Employment benefits, the College’s early‐retirement program was discontinued effective July 1, 2013.
6. Other Post‐Employment Benefits
During fiscal year 2009, the District implemented GASB Statement No. 45 Accounting and financial Reporting by Employers for Postemployment Benefits Other than Pensions. This standard establishes the following measurement and recognition disclosures: Plan description: The District sponsors a single‐employer other post‐employment benefit plan that provides life insurance, medical, vision, and dental benefits to all qualifying retirees and their dependents. Under the college’s plan, an employee who meets the retirement criteria must opt to retire before July 1, 2013 to receive these benefits. The criteria for retirement is the active employee must either be at least age 55 with 10 years of consecutive full‐time service, or have 30 years of full‐time service. Eligible retirees and their dependents receive coverage through a fully‐insured plan, the same plans that are available for active employees.

The Metropolitan Community College
Notes To Combined Basic Financial Statements
June 30, 2014 and 2013
(48)
6. Other Post‐Employment Benefits (Continued)
Benefits Provided: The life insurance benefit is two times final salary at retirement. The retiree pays no premiums on this coverage until age 65. If the retiree elects to continue this coverage from age 65 to age 70, they must pay the full premium. After age 70, this benefit is no longer available. The retiree is eligible to continue coverage of other benefits upon retirement by paying no premium until age 65 and the COBRA premium from age 65 onward. The employee can choose which benefits, medical, vision, and/or dental they will continue to receive. Funding policy: The District establishes and amends contribution requirements. A retiree’s coverage shall be no greater than the insurance coverage afforded district employees. The current funding policy of the District is to fund benefits on a pay‐as‐you‐go basis. Retirees who retire prior to July 1, 2013 upon retirement pays the same premium amount as the active employees until they attain age 65. Otherwise, retirees and dependents must pay COBRA rates to maintain medical coverage with the College. Annual OPEB Cost and Net OPEB Obligation: The District’s annual OPEB cost (expense) is calculated based on the annual required contribution (ARC) of the employer, an amount actuarially determined in accordance to the parameters of GASB Statement No. 45. The ARC represents a level of funding that, if paid on an ongoing basis, is projected to cover the normal cost each year and amortize any unfunded actuarial liabilities over a period not to exceed thirty years. The following table shows the components of the District’s annual OPEB cost for the year, the amount actuarially contributed to the plan, and changes in the District’s annual OPEB obligation (asset):
2014 2013
Annual required contribution 2,664,094$ 2,664,094$
Interest on net OPEB obligation 6,784 (2,818)
Adjustment to annual required contribution (21,356) 8,966
Annual OPEB cost/expense 2,649,522 2,670,242
Contributions and payments made 2,888,000 2,395,000
Increase (Decrease) in net OPEB obligation (238,478) 275,242
Net OPEB obligation ‐ June 30, 2013 and 2012 193,867 (81,375)
Net OPEB obligation (asset) ‐ June 30, 2014 and 2013 (44,611)$ 193,867$
The District’s annual OPEB cost, the percentage of annual OPEB cost contributed to the plan and the net OPEB obligation for fiscal years 2014 and the two preceding years follows.
Fiscal Year Ended Annual OPEB Cost Percentage of Annual OPEB Cost Contributed
Net OPEB Liability (Asset)
June 30, 2014 $ 2,649,522 109.0% $ (44,611) June 30, 2013 $ 2,670,242 89.7% $ 193,867 June 30, 2012 $ 576,000 338.9% $ (81,375)

The Metropolitan Community College
Notes To Combined Basic Financial Statements
June 30, 2014 and 2013
(49)
6. Other Post‐Employment Benefits (Continued)
Funded status and funding progress: As of July 1, 2012, the most recent actuarial valuation date, the plan was zero percent funded. The District’s actuarial accrued liability for benefits was $20,420,508 and the actuarial value of assets is none resulting in an unfunded actuarial accrued liability (UAAL) of $20,420,508. The estimated covered payroll (annual payroll of active employees covered by the plan) was $47,758,000 and the ratio of the UAAL to the covered payroll was 43%. Actuarial estimates of an ongoing plan involve estimates of the value of reported amounts and assumptions about the probability of occurrence of events far into the future. Examples include assumptions about the future employment, mortality, and the healthcare cost trend. Amounts determined regarding the funded status of the plan and the annual required contributions of the employer are subject to continual revision as actual results are compared with past expectations and new estimates are made about the future. The schedule of funding progress, presented as required supplementary information following the notes to the financial statements, presents multiyear information about whether the actuarial value of plan assets is increasing or decreasing over time relative to the actuarial accrued liabilities for benefits. Actuarial methods and assumptions: Projections of benefits for financial reporting purposes are based on the substantive plan (the plan as understood by the employer and the plan members) and included the types of benefits provided at the time of each valuation and the historical pattern of sharing of benefit costs between the employer and plan members to that point. The actuarial methods and assumptions used include techniques that are designed to reduce the effects of short‐term volatility in actuarial accrued liabilities and the actuarial value of assets, consistent with the long‐term perspective of the calculations. In the July 1, 2012 actuarial valuation, the project unit credit method was used. The actuarial assumptions included a 3.5 percent discount rate, an annual health care cost trend rate of 8 percent reduced annually to an ultimate rate of 5 percent. The UAAL is being amortized as a level of percentage of pay on an open basis. As of June 30, 2012, the remaining amortization of UAAL is 10 years.
7. Missouri United School Insurance Council
The Missouri United School Insurance Council (MUSIC) is a not‐for‐profit self‐insurance association which is designed to provide uniform property and casualty coverage under one comprehensive plan for participating school districts in Missouri. The College purchases insurance coverage for property, general liability, workers’ compensation and medical malpractice (for allied health students).
Members pay annual premiums which are retained to pay losses, fund an administrative budget, buy risk management services, and purchase reinsurance for excessive losses.
Because MUSIC is a pooling arrangement comprised of member districts, the members are owners of the loss fund. In the event that the loss fund and related reserves are unable to cover claims, the members would be assessed additional premiums by MUSIC to cover the deficit. The District is not aware of any deficit situation in the MUSIC loss fund which would require the accrual of a liability as of June 30, 2014 and 2013.

The Metropolitan Community College
Notes To Combined Basic Financial Statements
June 30, 2014 and 2013
(50)
7. Missouri United School Insurance Council (Continued)
Effective January 1, 1999, the terms of insurance coverage provided by MUSIC were revised, with the District increasing the level of its self‐insurance for losses occurring below the amount of the MUSIC coverage stop‐loss, which was $408,478 for calendar year 2014. As of June 30, 2014, an accrual of $336,173 has been made to cover the estimated exposure to claims the District would have to pay under its self‐insurance agreement, including an estimate for claims incurred but not reported. This claims liability is based on estimates of the ultimate cost of claims including inflation factors and historical trend data. Other non‐incremental costs are not included in the basis of estimating the liability.
8. Federal Assistance
The District has received significant financial assistance from various federal agencies in the form of grants and entitlements. These programs are subject to audit by agents of the granting authority, or by independent public accountants under the Single Audit Act, the purpose of which is to ensure compliance with terms and conditions specified in these agreements. The District does not believe that liabilities for reimbursement, if any, will have a materially adverse effect upon the financial condition of the District.
9. Contingencies
The District is named as a defendant in various legal actions arising in the normal course of operations. The College’s management believes the resolution of those actions will not have a material effect on the District’s combined financial statements.
10. Governmental Accounting Standards Board (GASB) Statements
The College adopted the following statements during the year ended June 30, 2014: GASB Statement No. 65, Items Previously Reported as Assets and Liabilities, issued April 2012, will be effective for the College beginning with its year ending June 30, 2014. This Statement clarifies the appropriate reporting of deferred outflows or resources and deferred inflows of resources to ensure consistency in financial reporting. This Statement reclassifies certain items currently being reported as assets and liabilities as deferred outflows of resources and deferred inflows of resources. The effects of the application of Statement No. 65 in fiscal year 2014 are presented in Note 1 Summary of Significant Accounting Policies, Prior Period Adjustment. GASB Statement No. 66, Technical Corrections – 2012, issued April 2012, will be effective for the College with its year ending June 30, 2014. This Statement enhances the usefulness of financial reports by resolving conflicting accounting and financial reporting guidance that could diminish the consistency of financial reporting. The adoption of this Statement had no effect on the College in the current year. GASB Statement No. 67, Financial Reporting for Pension Plans, issued June 2012, will be effective for the College beginning with its year ending June 30, 2015. This Statement revises existing guidance for the financial reports of most pension plans. This Statement replaces the requirements of Statement No. 25,

The Metropolitan Community College
Notes To Combined Basic Financial Statements
June 30, 2014 and 2013
(51)
Financial Reporting for Defined Benefit Pension Plans and Note Disclosures for Defined Contribution Plans and GASB Statement No. 50, Pension Disclosures, as they relate to pension plans that are administered through trusts or similar arrangements meeting certain criteria. The adoption of this Statement had no effect on the College in the current year. GASB Statement No. 70, Accounting and Financial Reporting for Nonexchange Financial Guarantees is effective for the fiscal year ending June 30, 2014. This Statement specifies the information required to be disclosed by governments that extend nonexchange financial guarantees. In addition, this Statement requires new information to be disclosed by governments that receive nonexchange financial guarantees. The adoption of this Statement had no effect on the College in the current year.
As of June 30, 2014, the Governmental Accounting Standards Board (GASB) had issued the following statements not yet required to be implemented by the College. The statements which might impact the College are as follows:
GASB Statement No. 68, Accounting and Financial Reporting for Pensions, issued June 2012, will be effective for the College beginning with its year ending June 30, 2016. This Statement revises and establishes new financial reporting requirements for most governments that provide their employees with pension benefits. Statement No. 68 replaces the requirements of Statement No. 27, Accounting for Pension by State and Local Governmental Employers and Statement No. 50, Pension Disclosures, as they relate to governments that provide pensions through pension plans administered as trusts or similar arrangements that meet certain criteria. Statement No. 68 requires governments providing defined benefits pensions to recognize their long‐term obligation for pension benefits as a liability for the first time, and to more comprehensively and comparably measure the annual costs of pension benefits. The Statement also enhances accountability and transparency through revised and new note disclosures and required supplementary information (RSI). GASB Statement No. 69, Government Combinations and Disposals of Government Operations, issued January 2013, is effective for the fiscal year ending June 30, 2015. This Statement establishes accounting and financial reporting standards related to government combinations and disposals of government operations. As used in this Statement, the term government combination includes a variety of transactions referred to as mergers, acquisitions, and transfers of operations. GASB Statement No. 71, Pension Transition for Contributions Made Subsequent to the Measurement Date‐An Amendment of GASB Statement No. 68, issued November 2013, will be effective upon the implementation of GASB Statement No. 68. Beginning with the year ending June 30, 2015. This Statement amends GASB Statement No. 68 to require that, at transition, a government recognize a beginning deferred outflow of resources for its pension contributions, if any, made subsequent to the measurement date of the beginning net pension liability. Statement No. 68, as amended, continues to require that beginning balances for other deferred outflows of resources and deferred inflows of resources related to pensions be reported at transition only if it is practical to determine all such amounts.
The College’s management has not yet determined the effect these statements will have on the College’s financial statements.

The Metropolitan Community College
Notes To Combined Basic Financial Statements
June 30, 2014 and 2013
(52)
11. Foundation
The following disclosures pertain to the discretely presented component unit:
Significant Accounting Policies
Use of Estimates
The preparation of financial statements, in conformity with accounting principles generally accepted in the United States of America, requires management to make estimates and assumptions that affect the amounts reported in the financial statements and accompanying notes. Although these estimates are based on management’s knowledge of current events and actions it may undertake in the future, they may ultimately differ from actual results. Principles of Accounting The accompanying financial statements have been prepared on the accrual basis of accounting in accordance with accounting principles generally accepted in the United States of America. Cash and Cash Equivalents
Cash and cash equivalents include cash on hand, bank deposits and investments in money market mutual funds. Valuation of Marketable Securities
Marketable securities, which consist of equity securities, mutual fund shares, corporate bonds and government notes, are valued at fair value in the statements of financial position. Fair value is based on market quotations of the underlying investments.
Net Assets The accounting and reporting of the Foundation classifies resources by their nature and purpose, based on the presence or absence of donor‐imposed restrictions, into three classes of net assets:
Unrestricted net assets – Consist of funds free of any donor‐imposed restrictions. Temporarily restricted net assets – Consist of contributions and other inflows of funds temporarily subject to donor imposed restrictions. The restrictions are temporary in that they are expected to expire with the passage of time or be satisfied and removed by actions of the Foundation that fulfill donor stipulations. Permanently restricted net assets – Consist of contributions and other inflows of funds subject to donor imposed restrictions that neither expire by the passage of time nor can be fulfilled or otherwise removed by actions of the Foundation.

The Metropolitan Community College
Notes To Combined Basic Financial Statements
June 30, 2014 and 2013
(53)
11. Foundation (Continued) In August 2008, the Financial Accounting Standards Board (FASB) Accounting Standards Codification (ASC) issued FASB ASC 958‐205‐50, (formerly FASB Staff Position No. 117‐1, Endowments of Not‐for‐Profit Organizations: Net Asset Classification of Funds Subject to an Enacted Version of the Uniform Prudent Management of Institutional Funds Act, and Enhanced Disclosures of All Endowment Funds.) This staff position provides guidance on the net asset classification of donor‐restricted endowment funds for not‐for‐profit organizations that are subject to an enacted version of the Uniform Prudent Management of Institutional Funds Act (UPMIFA) and improves disclosures for endowment funds, both donor‐restricted and board designated (quasi‐endowment).
Foundation – Significant Accounting Policies
Contributions A contribution, in the form of an unconditional promise to give, is recognized as revenue by the Foundation in the period in which the promise is received. Conditional promises to give made by donors are not recognized until the conditions are met. Assets received subject to conditions are accounted for as refundable advances until the conditions are met. Contributions are recorded at their fair value. Unconditional promises to give are reported at net realizable value by establishing an allowance for uncollectible promises. Unconditional promises to give cash over a period of time in excess of one year are recorded at the present value of amounts to be received, using an appropriate discount rate, if the amounts of such discounts are material. Revenue is reported as increases in unrestricted net assets unless use of the related assets is limited by donor‐imposed restrictions. Expenses are reported as decreases in unrestricted net assets. Gains and losses on investments and other assets or liabilities are reported as increases or decreases in unrestricted net assets unless their use is restricted by explicit donor stipulation or by law. Gains and losses on temporarily restricted assets are reported as restricted until appropriated by the Board of Directors. Expirations of temporary restrictions on net assets (i.e. the donor‐stipulated purpose has been fulfilled and/or the stipulated period has elapsed) are reported as reclassifications between the applicable classes of net assets. Investment Income
Investment income and net investment gains (losses) are reported as follows:
As increases (decreases) in permanently restricted net assets if the terms of the gift or the Foundation’s interpretation of relevant state tax law requires that they be added to the principal of the permanent endowment fund.
As increases (decreases) in temporarily restricted net assets if the terms of the gift impose restrictions on the use of the income.
As increases (decreases) in unrestricted net assets in all other cases.

The Metropolitan Community College
Notes To Combined Basic Financial Statements
June 30, 2014 and 2013
(54)
11. Foundation – Significant Accounting Policies (Continued)
Investment Return
Investment return includes interest income, which is accrued as earned, and dividend income, which is recorded when notified of the dividend. Realized gains and losses are recorded when notified of the sale. The change in unrealized appreciation or depreciation, which occurs during the year, is recorded as a component of investment return in the statements of activities.
Income Tax Status
The Foundation is a Missouri not‐for‐profit corporation and has qualified for exemption from income tax under Sections 501(c)(3) of the Internal Revenue Code.
The Foundation follows standards governing the accounting for uncertainty in income taxes. This guidance prescribes a recognition threshold and measurement principles for the financial statement recognition and measurement of tax positions taken or expected to be taken on a tax return that are not certain to be realized. The Foundation evaluated its tax positions and determined it has no uncertain tax positions as of June 30, 2014 and 2013.
The Foundation’s income tax returns for 2010 to 2012 are subject to review and examination by federal and state authorities. The Foundation is not aware of any activities that would jeopardize its tax‐exempt status. The Foundation is not aware of any activities that are subject to tax on unrelated business income or excise or other taxes.
Subsequent Events In preparing the financial statements, the Foundation has evaluated events and transactions for potential recognition or disclosure in these financial statements through October 6, 2014, the date the financial statements were available to be issued. Contributed Services and Related Party Transactions The College provides the Foundation with office space and furniture and equipment without charge. The executive director and staff of the Foundation are employed by the College without compensation from the Foundation and the Financial Services Department of the College also provides accounting processing services to the Foundation. In connection with the personnel and services provided by the College, the Foundation recognized contributed services revenue and related offsetting expense in the amount of amount of $501,019 and $439,599 for the years ended June 30, 2014 and 2013, respectively. Included in these amounts are payments to outside vendors/contractors for advisory services and other expenses supporting the Foundation. No amounts have been reflected in the financial statements for donated services, which do not create or enhance nonfinancial assets or which do not require specialized skills; however, time and resources have been contributed by volunteers in furtherance of the Foundation’s objectives.

The Metropolitan Community College
Notes To Combined Basic Financial Statements
June 30, 2014 and 2013
(55)
11. Foundation – Significant Accounting Policies (Continued)
Substantially all program expenses included in the Statement of Activities are reimbursed to the College as the result of College payments on behalf of the Foundation. Accordingly, the balance “Due to The Metropolitan Community College” on the Statement of Financial Position of $120,180 and $66,786 at June 30, 2014 and 2013, respectively, represents amounts due to the College not yet reimbursed at year end.
Marketable Securities and Fair Value Measurements
Marketable securities as of June 30, 2014 and 2013, which are carried in the accompanying financial statements at fair value, are comprised of the following:
Investment return for the years ended June 30, 2014 and 2013:
2014 2013
Equity securities 9,168,024$ 5,045,230$
U.S. Treasury notes 374,120 498,685
Mutual Funds, equity 66,687 77,626
Corporate bonds 332,877 778,249
Hedge fund / REIT 584,020 305,820
10,525,728$ 6,705,610$
2014 2013
Investment income 220,093$ 201,690$
Investment gains 1,297,987 942,078
1,518,080$ 1,143,768$
Net realized and unrealized

The Metropolitan Community College
Notes To Combined Basic Financial Statements
June 30, 2014 and 2013
(56)
11. Foundation (Continued)
Marketable Securities and Fair Value Measurements (Continued) Investments, in general, are exposed to various risks, such as interest rate, credit, and overall market volatility due to the level of risk associated with certain investment securities. It is reasonably possible that changes in the values of investment securities will occur in the near term and, that such changes could materially affect the amounts reported in the financial statements. Effective July 1, 2008, the Foundation adopted the provisions of FASB ASC 820, Fair Value Measurements and Disclosures (formerly SFAS No. 157, “Fair Value Measurements” for assets and liabilities measured and reported at fair value.) FASB ASC 820 defines fair value, establishes a framework for measuring fair value and expands disclosures about fair value measurements. FASB ASC 820 defines fair value as the price that would be received to sell an asset or paid to transfer a liability in an orderly transaction between market participants. FASB ASC 820 requires the use of valuation techniques that are consistent with the market approach, the income approach and/or the cost approach. Inputs to valuation techniques refer to the assumptions that market participants would use in pricing the asset or liability. Inputs may be observable, meaning those that reflect the assumptions market participants would use in pricing the asset or liability developed based on market data obtained from independent sources, or unobservable, meaning those that reflect the reporting Foundation’s own assumptions about the assumptions market participants would use in pricing the asset or liability developed based on the best information available in the circumstances. In that regard, FASB ASC 820 establishes a fair value hierarchy for valuation inputs that gives the highest priority to quoted prices in active markets for identical assets or liabilities and the lowest priority to unobservable inputs. The fair value hierarchy is as follows: Level 1: Quoted prices (unadjusted) for identical assets or liabilities in active markets that the entity has the ability to access as of the measurement date. Level 2: Significant other observable inputs other than Level 1 prices such as quoted prices for similar assets or liabilities; quoted prices in markets that are not active; or other inputs that are observable or can be corroborated by observable market data Level 3: Significant unobservable inputs that reflect a reporting entity’s own assumptions about the assumptions that market participants would use in pricing an asset or liability.
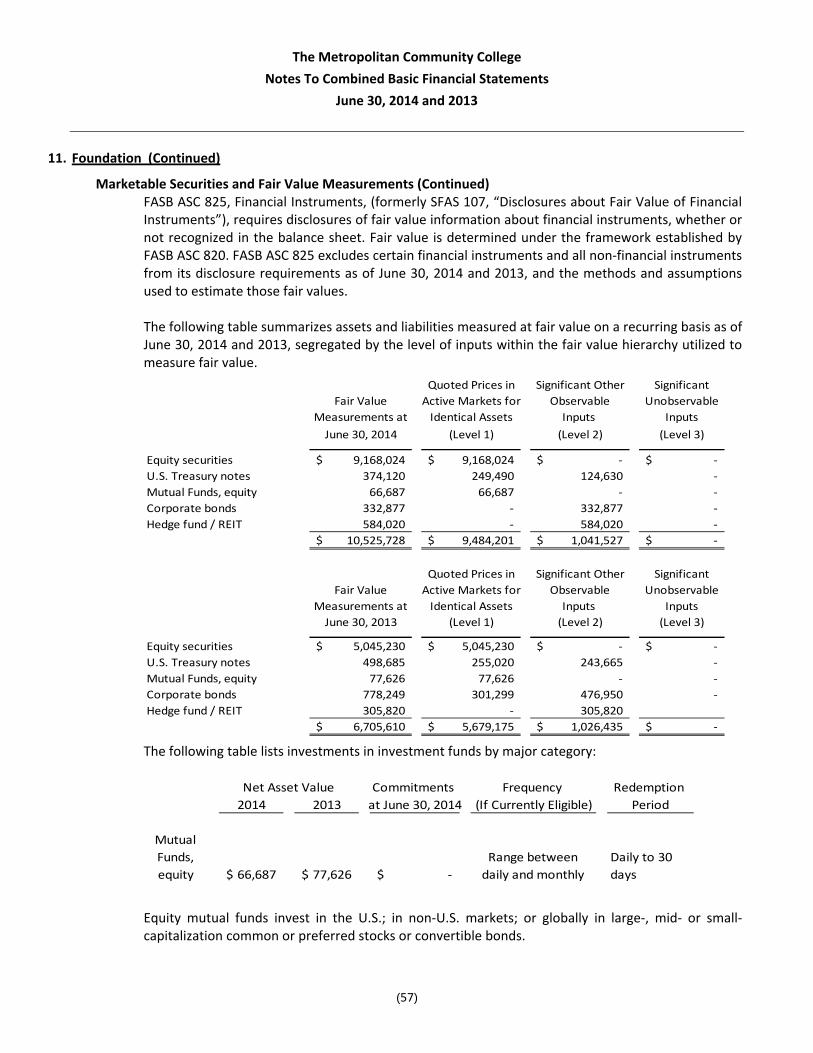
The Metropolitan Community College
Notes To Combined Basic Financial Statements
June 30, 2014 and 2013
(57)
11. Foundation (Continued)
Marketable Securities and Fair Value Measurements (Continued) FASB ASC 825, Financial Instruments, (formerly SFAS 107, “Disclosures about Fair Value of Financial Instruments”), requires disclosures of fair value information about financial instruments, whether or not recognized in the balance sheet. Fair value is determined under the framework established by FASB ASC 820. FASB ASC 825 excludes certain financial instruments and all non‐financial instruments from its disclosure requirements as of June 30, 2014 and 2013, and the methods and assumptions used to estimate those fair values. The following table summarizes assets and liabilities measured at fair value on a recurring basis as of June 30, 2014 and 2013, segregated by the level of inputs within the fair value hierarchy utilized to measure fair value.
The following table lists investments in investment funds by major category:
Equity mutual funds invest in the U.S.; in non‐U.S. markets; or globally in large‐, mid‐ or small‐capitalization common or preferred stocks or convertible bonds.
Quoted Prices in Significant Other Significant
Fair Value Active Markets for Observable Unobservable
Measurements at Identical Assets Inputs Inputs
June 30, 2014 (Level 1) (Level 2) (Level 3)
Equity securities 9,168,024$ 9,168,024$ ‐$ ‐$
U.S. Treasury notes 374,120 249,490 124,630 ‐
Mutual Funds, equity 66,687 66,687 ‐ ‐
Corporate bonds 332,877 ‐ 332,877 ‐
Hedge fund / REIT 584,020 ‐ 584,020 ‐
10,525,728$ 9,484,201$ 1,041,527$ ‐$
Quoted Prices in Significant Other Significant
Fair Value Active Markets for Observable Unobservable
Measurements at Identical Assets Inputs Inputs
June 30, 2013 (Level 1) (Level 2) (Level 3)
Equity securities 5,045,230$ 5,045,230$ ‐$ ‐$
U.S. Treasury notes 498,685 255,020 243,665 ‐
Mutual Funds, equity 77,626 77,626 ‐ ‐
Corporate bonds 778,249 301,299 476,950 ‐
Hedge fund / REIT 305,820 ‐ 305,820
6,705,610$ 5,679,175$ 1,026,435$ ‐$
Commitments Frequency Redemption
2014 2013 at June 30, 2014 (If Currently Eligible) Period
Mutual
Funds,
equity 66,687$ 77,626$ ‐$
Range between
daily and monthly
Daily to 30
days
Net Asset Value

The Metropolitan Community College
Notes To Combined Basic Financial Statements
June 30, 2014 and 2013
(58)
11. Foundation (Continued)
Contributions Receivable
Contributions receivable as of June 30, 2014 and 2013 are due to be received in the following periods:
Contributions receivable are discounted to present value using the discount rate for the year the receivable was originally pledged. Pledge receivable discount calculations include discount rates for 2007 through 2014 and range from 4.40% to 5.38%.
Temporarily Restricted Net Assets
Temporarily restricted net assets available as of June 30, 2014 and 2013 are restricted to the following purposes or periods:
2014 2013
Receivable in one year 101,638$ 80,413$
Receivable in two to five years 50,400 50,400
Receivable after five years 100 100
152,138 130,913
Less allowance for doubtful contributions 3,352 3,245
Less present value discount 5,425 301
143,361$ 127,367$
2014 2013
Investment earnings payout stabilization fund 1,412,660$ 957,865$
Scholarships 900,887 885,326
Other 523,718 246,958
Health Science Institute Program 167,113 162,867
Block Academic Coaching 87,768 76,974
Kite Festival 62,924 54,450
Polsky Business Development Fund 44,297 21,648
James Neeland Award Fund 40,977 50,750
Book & Student Emergency Fund 38,828 58,331
Brooks Center at PV 36,506 44,000
Baseball Program 6,214 5,639
Friends of the Carter Arts Center 4,203 3,757
Nursing Loan Program 4,067 3,837
Longview Cultural Arts Center 2,902 2,902
Dev Family Child Care Business 125 125
3,333,189$ 2,575,429$

The Metropolitan Community College Notes to Combined Basic Financial Statements
June 30, 2014 and 2013
(59)
11. Foundation (Continued)
Permanently Restricted Assets Permanently restricted net assets as of June 30, 2014 and 2013 are restricted to the following:
Restricted Net Assets Released
Restricted net assets released in accordance with donor restrictions during the fiscal years ended June 30, 2014 and 2013 are comprised of the following:
Endowment Fund and Net Asset Classifications
The Foundation has interpreted the Uniform Prudent Management of Institutional Funds Act (UPMIFA) adopted by the 2009 Missouri legislature as requiring the preservation of fair value of the original gift as of the gift date of the donor restricted endowment funds absent explicit donor stipulations to the contrary. As a result of this interpretation, the Foundation classifies as permanently restricted net assets (a) the original value of gifts donated to the permanent endowment, (b) the original value of subsequent gifts to the permanent endowment, (c) accumulations to the permanent endowment made in accordance with the direction of the applicable donor gift instrument at the time the accumulation is added to the fund, (d) the present value of estimated future receipts from beneficial interests in perpetual trusts and (e) subsequent changes in the value of the Foundation’s share of trust assets in perpetual trusts. The remaining portion of the donor restricted endowment fund that is not classified in permanently restricted net assets is classified as temporarily restricted net assets until those amounts are appropriated for expenditure by the Foundation in a manner consistent with the standard of prudence prescribed by the State of Missouri in its enacted version of UPMIFA.
2014 2013
Investment in perpetuity, the income from
which is expendable to support:
Scholarships 3,160,706$ 3,160,706$
Other 1,861,239 1,331,439
5,021,945$ 4,492,145$
2014 2013
Scholarships and grants 339,110$ 233,919$
Other Foundation projects 75,692 81,125
Neeland Jeanne M Award Fund 16,114 ‐
Storytelling 15,351 15,941
FI-Hall-Youth Dev Curric 13,457 ‐
Kite Festival 11,626 ‐
Brooks Center@PV 7,494 ‐
Health Science Institute 1,500 7,563
Dev Family Child Care Business ‐ 62,800
Malcolm Wilson Enrollment Center ‐ 51,397
480,344$ 452,745$

The Metropolitan Community College Notes to Combined Basic Financial Statements
June 30, 2014 and 2013
(60)
11. Foundation (Continued)
Endowment Fund and Net Asset Classifications (Continued)
In accordance with UPMIFA, the Foundation considers the following factors in making a determination to appropriate or accumulate donor‐restricted endowment funds: (1) the duration and preservation of the Endowment Fund; (2) the purposes of the Foundation and the donor‐restricted Endowment Fund; (3) general economic conditions; (4) the possible effect of inflation and deflation; (5) the expected total return from income and the appreciation of investments; (6) other resources of the Foundation and (7) the investment policies of the Foundation.
The Foundation has adopted investment and spending policies for its Endowment Fund. The objective of these policies is to provide the Foundation a predictable funding stream for its programs while protecting the purchasing power of the Endowment Fund. In accordance with the Foundation’s investment policy, the Endowment Fund shall be invested to provide for total return. The Endowment Fund shall be invested in a diversified portfolio, consisting of common stocks, bonds, cash equivalents, and other investments, which may reflect varying rates of returns. The overall rate of return objective of the portfolio is a reasonable “real” rate, consistent with the risk levels established by the Endowment and Investment Committee of the Board of Trustees.
The Foundation recognizes the need for spendable income by the beneficiaries of the endowment and long‐term institutional funds under their custodianship. The spending policy reflects an objective to distribute as much total return as is consistent with overall investment objectives defined above while protecting the real value of the Endowment Fund principal. The Board approved spending percentage, based on the average collected fund balance, was 6% and 5% for the fiscal years ended June 30, 2014 and 2013.
Endowment net assets as of June 30, 2014 and 2013 were as follows:
2014 Unrestricted
Temporarily
Restricted
Permanently
Restricted Total
Donor‐Restricted Endowment funds ‐$ 2,211,804$ 5,021,945$ 7,233,749$
Board‐designated quasi‐Endowment funds 229,988 ‐ ‐ 229,988
Total endowment funds 229,988$ 2,211,804$ 5,021,945$ 7,463,737$
2013 Unrestricted
Temporarily
Restricted
Permanently
Restricted Total
Donor‐Restricted Endowment funds ‐$ 1,550,877$ 4,492,145$ 6,043,022$
Board‐designated quasi‐Endowment funds 213,206 ‐ ‐ 213,206
Total endowment funds 213,206$ 1,550,877$ 4,492,145$ 6,256,228$

The Metropolitan Community College Notes to Combined Basic Financial Statements
June 30, 2014 and 2013
(61)
11. Foundation (Continued)
Endowment Fund and Net Asset Classifications (Continued) Changes in endowment net assets for the years ended June 30, 2014 and 2013, were as follows:
From time to time, the fair value of the endowment funds associated with individual donor‐restricted endowment funds may fall below the level that the donor or UPMIFA requires the Foundation to retain as a fund of perpetual duration, i.e. underwater endowments. The deficiency is funded through temporarily restricted or unrestricted net assets, depending on the nature of the endowment. As of June 30, 2014 and 2013, there were no underwater endowment funds.
Unrestricted
Temporarily
Restricted
Permanently
Restricted Total
Endowment Net Assets,
June 30, 2012 198,625$ 1,139,218$ 3,360,021$ 4,697,864$
Investment Return:
Investment Income 7,963 102,491 996 111,450 Net appreciation (depr)
(realized and unrealized) 12,362 432,252 88,871 533,485
Total Investment Return 20,325 534,743 89,867 644,935
Contributions ‐ 9,998 1,032,751 1,042,749
Other Income ‐ 168 9,506 9,674 Appropriation of endowment
funds for expenditure (5,744) (133,250) ‐ (138,994)
Endowment Net Assets,
June 30, 2013 213,206 1,550,877 4,492,145 6,256,228
Investment Return:
Investment Income 2,888 116,965 ‐ 119,853
Net appreciation (depr)
(realized and unrealized) 23,412 669,634 ‐ 693,046
Total Investment Return 26,300 786,599 ‐ 812,899
Contributions ‐ 59,763 522,244 582,007
Other Income (2,291) 191 7,556 5,456 Appropriation of endowment
funds for expenditure (7,227) (185,626) ‐ (192,853)
Endowment Net Assets,
June 30, 2014 229,988$ 2,211,804$ 5,021,945$ 7,463,737$

The Metropolitan Community College Notes to Combined Basic Financial Statements
June 30, 2014 and 2013
(62)
12. Condensed Combining Information
Condensed combining information for the College as of and for the fiscal years ended June 30 is as follows:
District Building Corp Eliminations Total
Condensed Statements of Net Position
Assets
Current assets 75,630,087$ 3,182,058$ (10,015)$ 78,802,130$
Noncurrent assets 43,915,306 104,375,612 ‐ 148,290,918
119,545,393 107,557,670 (10,015) 227,093,048
Liabilities
Current liabilities 16,716,130 6,510,326 (10,015) 23,216,441
Noncurrent liabilities 4,466,324 68,057,303 ‐ 72,523,627
21,182,454 74,567,629 (10,015) 95,740,068
Net position
Net investment in capital assets 33,919,305 23,341,815 ‐ 57,261,120
Restricted for debt retirement ‐ 8,153,910 ‐ 8,153,910
Designated 2,483,064 ‐ ‐ 2,483,064
Unrestricted 61,960,570 1,494,316 ‐ 63,454,886
Total net position 98,362,939$ 32,990,041$ ‐$ 131,352,980$
Condensed Statements of Revenues, Expenses and Changes in Net Position
Operating revenues (expenses)
Operating income 102,536,335$ ‐$ (25,204,433)$ 77,331,902$
Depreciation expense (2,616,996) (4,336,155) ‐ (6,953,151)
Other operating expenses (155,558,620) (2,500) 33,119,648 (122,441,472)
Operating loss (55,639,281) (4,338,655) 7,915,215 (52,062,721)
Nonoperating revenues (expenses)
Nonoperating revenues 64,748,390 8,054,347 (7,915,215) 64,887,522
Interest on debt related to capital assets ‐ (3,228,271) ‐ (3,228,271)
Total nonoperating revenues, net 64,748,390 4,826,076 (7,915,215) 61,659,251
Change in net position 9,109,109 487,421 ‐ 9,596,530
Net position, beginning of year 89,253,830 32,502,620 ‐ 121,756,450
Net position, end of year 98,362,939$ 32,990,041$ ‐$ 131,352,980$
Condensed Statements of Cash Flows
Net cash used by operating activities (48,262,185)$ (2,500)$ ‐$ (48,264,685)$
65,294,498 (2,070,674) ‐ 63,223,824
Net cash used by capital financing activities (8,235,746) (1,614,203) ‐ (9,849,949)
Net cash used by investing activities (3,904,264) (2,026,410) ‐ (5,930,674)
4,892,303 (5,713,787) ‐ (821,484)
Cash and cash equivalents, beginning of year 27,701,865 12,091,527 ‐ 39,793,392
Cash and cash equivalents, end of year 32,594,168$ 6,377,740$ ‐$ 38,971,908$
2014
Total assets and deferred outflow of
resources
Total liabilities and deferred inflow of
resources
Net cash provided by noncapital
financing activities
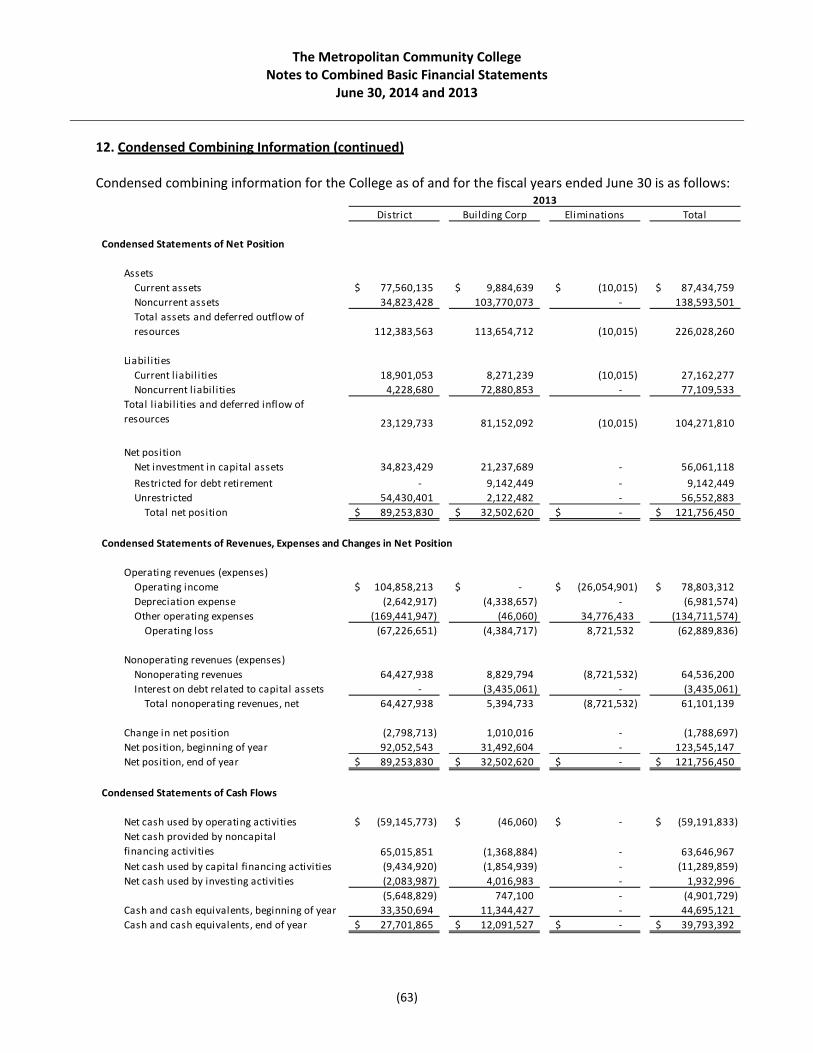
The Metropolitan Community College Notes to Combined Basic Financial Statements
June 30, 2014 and 2013
(63)
12. Condensed Combining Information (continued)
Condensed combining information for the College as of and for the fiscal years ended June 30 is as follows:
District Building Corp Eliminations Total
Condensed Statements of Net Position
Assets
Current assets 77,560,135$ 9,884,639$ (10,015)$ 87,434,759$
Noncurrent assets 34,823,428 103,770,073 ‐ 138,593,501
112,383,563 113,654,712 (10,015) 226,028,260
Liabil ities
Current l iabil ities 18,901,053 8,271,239 (10,015) 27,162,277
Noncurrent l iabil ities 4,228,680 72,880,853 ‐ 77,109,533
23,129,733 81,152,092 (10,015) 104,271,810
Net position
Net investment in capital assets 34,823,429 21,237,689 ‐ 56,061,118
Restricted for debt retirement ‐ 9,142,449 ‐ 9,142,449
Unrestricted 54,430,401 2,122,482 ‐ 56,552,883
Total net position 89,253,830$ 32,502,620$ ‐$ 121,756,450$
Condensed Statements of Revenues, Expenses and Changes in Net Position
Operating revenues (expenses)
Operating income 104,858,213$ ‐$ (26,054,901)$ 78,803,312$
Depreciation expense (2,642,917) (4,338,657) ‐ (6,981,574)
Other operating expenses (169,441,947) (46,060) 34,776,433 (134,711,574)
Operating loss (67,226,651) (4,384,717) 8,721,532 (62,889,836)
Nonoperating revenues (expenses)
Nonoperating revenues 64,427,938 8,829,794 (8,721,532) 64,536,200
Interest on debt related to capital assets ‐ (3,435,061) ‐ (3,435,061)
Total nonoperating revenues, net 64,427,938 5,394,733 (8,721,532) 61,101,139
Change in net position (2,798,713) 1,010,016 ‐ (1,788,697)
Net position, beginning of year 92,052,543 31,492,604 ‐ 123,545,147
Net position, end of year 89,253,830$ 32,502,620$ ‐$ 121,756,450$
Condensed Statements of Cash Flows
Net cash used by operating activities (59,145,773)$ (46,060)$ ‐$ (59,191,833)$
65,015,851 (1,368,884) ‐ 63,646,967
Net cash used by capital financing activities (9,434,920) (1,854,939) ‐ (11,289,859)
Net cash used by investing activities (2,083,987) 4,016,983 ‐ 1,932,996
(5,648,829) 747,100 ‐ (4,901,729)
Cash and cash equivalents, beginning of year 33,350,694 11,344,427 ‐ 44,695,121
Cash and cash equivalents, end of year 27,701,865$ 12,091,527$ ‐$ 39,793,392$
2013
Total assets and deferred outflow of
resources
Total l iabil ities and deferred inflow of
resources
Net cash provided by noncapital
financing activities

Required Supplementary Information
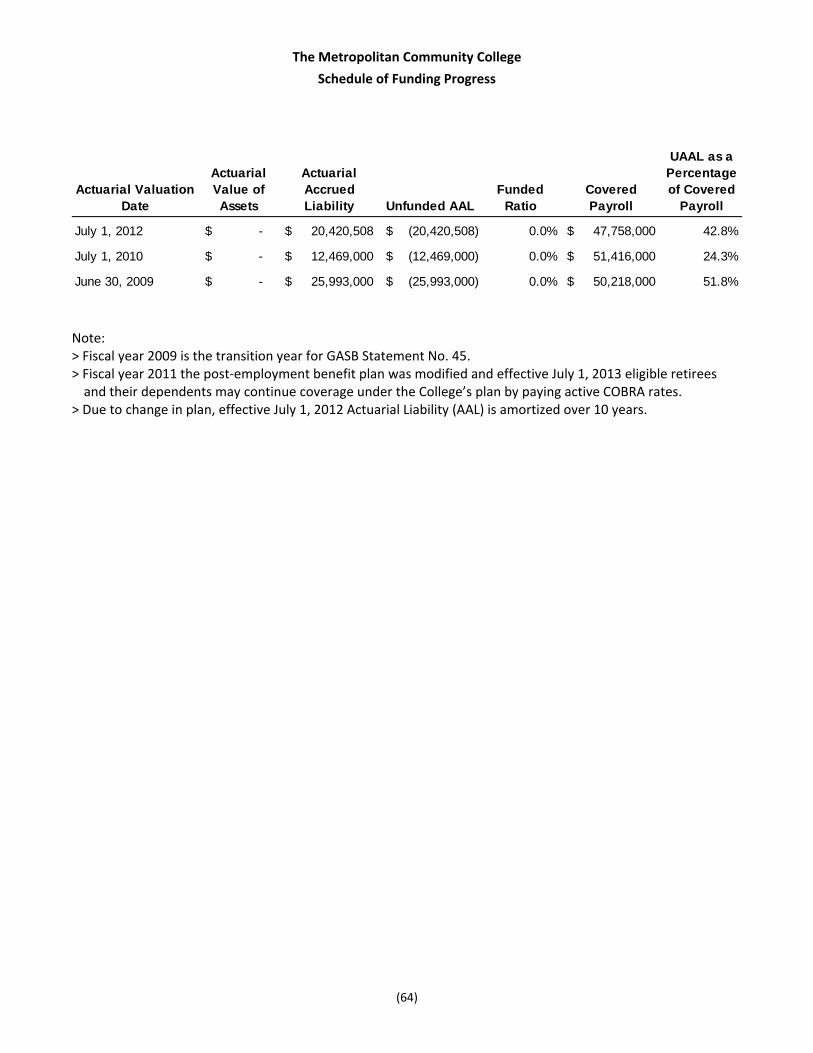
The Metropolitan Community College
Schedule of Funding Progress
(64)
Note: > Fiscal year 2009 is the transition year for GASB Statement No. 45. > Fiscal year 2011 the post‐employment benefit plan was modified and effective July 1, 2013 eligible retirees and their dependents may continue coverage under the College’s plan by paying active COBRA rates.
> Due to change in plan, effective July 1, 2012 Actuarial Liability (AAL) is amortized over 10 years.
Actuarial Valuation Date
Actuarial Value of Assets
Actuarial Accrued Liability Unfunded AAL
Funded Ratio
Covered Payroll
UAAL as a Percentage of Covered
Payroll
July 1, 2012 $ - $ 20,420,508 $ (20,420,508) 0.0% $ 47,758,000 42.8%
July 1, 2010 $ - $ 12,469,000 $ (12,469,000) 0.0% $ 51,416,000 24.3%
June 30, 2009 $ - $ 25,993,000 $ (25,993,000) 0.0% $ 50,218,000 51.8%

Other Supplementary Information

The Metropolitan Community College
Schedule of Net Position
June 30, 2014
(65)
District
Building
Corporation Eliminations Total
Assets
Current assets
Cash and cash equivalents 32,594,168$ 6,377,740$ ‐$ 38,971,908$
Short‐term investments 21,142,770 ‐ ‐ 21,142,770
Short‐term investments, restricted 8,153,910 ‐ ‐ 8,153,910
Accounts receivable, less allowance for
doubtful accounts of $ 472,904 10,848,324 (3,195,682) (10,015) 7,642,627
Inventories 2,133,753 ‐ ‐ 2,133,753
Other assets 757,162 ‐ ‐ 757,162
Total current assets 75,630,087 3,182,058 (10,015) 78,802,130
Noncurrent assets
Long‐term investments 9,996,000 8,152,945 ‐ 18,148,945
Capital assets
Nondepreciable 7,947,305 806,095 ‐ 8,753,400
Depreciable,net 25,972,001 95,416,572 ‐ 121,388,573
Total noncurrent assets 43,915,306 104,375,612 ‐ 148,290,918
Total assets 119,545,393 107,557,670 (10,015) 227,093,048
Deferred outflows of resources ‐ ‐ ‐ ‐
Total assets and deferred outflows of
resources 119,545,393 107,557,670 (10,015) 227,093,048
Liabilities
Current liabilities
Accounts payable, accrued and other
liabilities 10,079,975 1,686,776 (10,015) 11,756,736
Compensated absences 2,596,870 ‐ ‐ 2,596,870
Current maturities of bonds payable ‐ 4,823,550 ‐ 4,823,550
Unearned revenue 3,706,853 ‐ ‐ 3,706,853
Notes Payable 332,432 ‐ ‐ 332,432
Total current liabilities 16,716,130 6,510,326 (10,015) 23,216,441
Noncurrent liabilities
Bonds payable ‐ 68,057,303 ‐ 68,057,303
Compensated absences 146,689 ‐ ‐ 146,689
Post‐employment benefit obligation ‐ ‐ ‐ ‐
Notes Payable 1,329,727 ‐ ‐ 1,329,727
Accrued rent 2,989,908 ‐ ‐ 2,989,908
Total noncurrent liabilities 4,466,324 68,057,303 ‐ 72,523,627
Total liabilities 21,182,454 74,567,629 (10,015) 95,740,068
Deferred inflow of resources ‐ ‐ ‐ ‐
Net position
Net investment in capital assets 33,919,305 23,341,814 ‐ 57,261,119
Restricted for debt retirement ‐ 8,153,910 ‐ 8,153,910
Designated for Deferred Maintenance 1,983,064 ‐ ‐ 1,983,064
Designated for Information Technology 500,000 ‐ ‐ 500,000
Unrestricted 61,960,570 1,494,317 ‐ 63,454,887
Total net position 98,362,939$ 32,990,041$ ‐$ 131,352,980$

The Metropolitan Community College
Schedule of Revenues, Expenses, and Changes in Net Position
Year Ended June 30, 2014
(66)
District
Building
Corporation Eliminations Total
Operating revenues:
Student tuition and fees, net (Scholarship
allowance of 2014 $25,204,433
and 2013 $26,054,901) 46,939,114$ ‐$ (25,204,433)$ 21,734,681$
Federal grants and contracts 36,592,478 ‐ ‐ 36,592,478
State and local grants and contracts 4,780,976 ‐ ‐ 4,780,976
Auxiliary services revenues 8,731,750 ‐ ‐ 8,731,750
Other operating revenues 5,492,017 ‐ ‐ 5,492,017
Total operating revenues 102,536,335 ‐ (25,204,433) 77,331,902
Operating expenses:
Salaries and wages 61,310,660 ‐ ‐ 61,310,660
Fringe benefits 22,327,660 ‐ ‐ 22,327,660
Supplies and other services 37,181,443 2,500 7,915,215 29,268,728
Utilities 3,553,120 ‐ ‐ 3,553,120
Scholarships and fellowships 31,185,737 ‐ 25,204,433 5,981,304
Depreciation 2,616,996 4,336,155 ‐ 6,953,151
Total operating expenses 158,175,616 4,338,655 33,119,648 129,394,623
Operating loss (55,639,281) (4,338,655) 7,915,215 (52,062,721)
Non‐operating revenues (expenses):
State appropriation 29,447,940 ‐ ‐ 29,447,940
County property tax revenue 31,605,159 ‐ ‐ 31,605,159
Investment income 608,921 139,132 ‐ 748,053
Other non‐operating revenue 3,086,370 7,915,215 (7,915,215) 3,086,370
Interest on debt related to capital assets ‐ (3,228,271) ‐ (3,228,271)
Total nonoperating revenues, net 64,748,390 4,826,076 (7,915,215) 61,659,251
Change in net position: 9,109,109 487,421 ‐ 9,596,530
Net position, beginning of year 89,253,830 32,502,620 ‐ 121,756,450
Net position, end of year 98,362,939$ 32,990,041$ ‐$ 131,352,980$
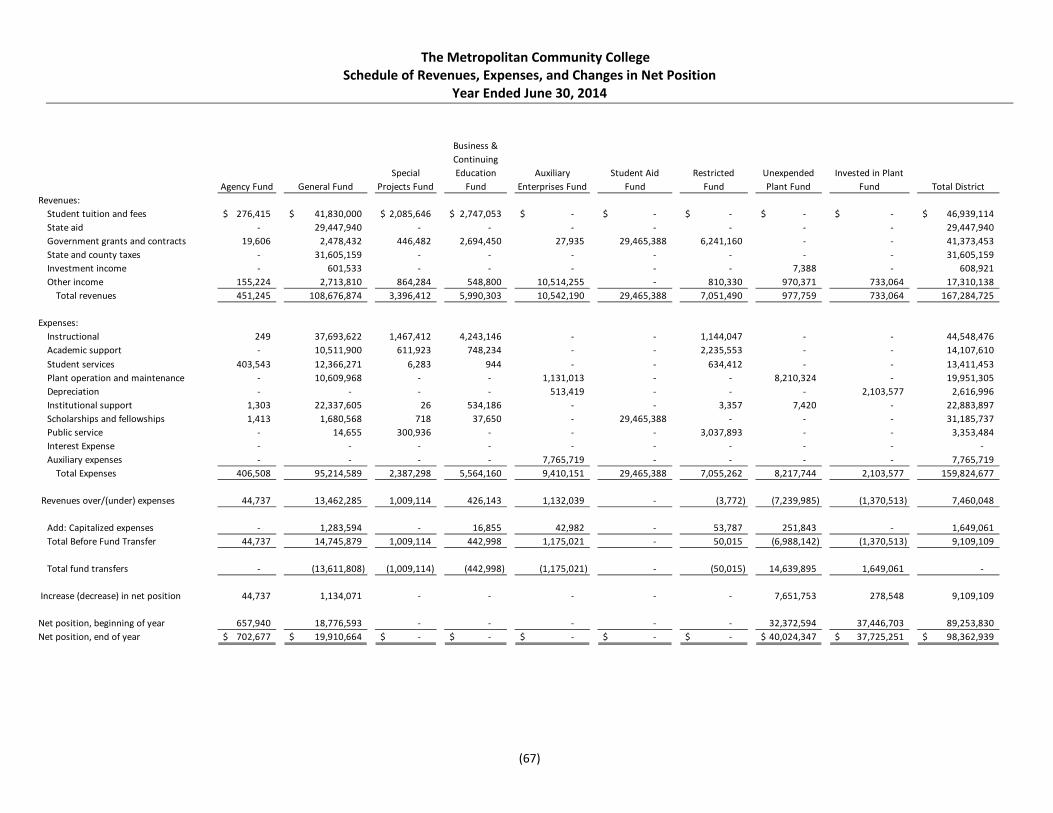
The Metropolitan Community College Schedule of Revenues, Expenses, and Changes in Net Position
Year Ended June 30, 2014
(67)
Agency Fund General Fund
Special
Projects Fund
Business &
Continuing
Education
Fund
Auxiliary
Enterprises Fund
Student Aid
Fund
Restricted
Fund
Unexpended
Plant Fund
Invested in Plant
Fund Total District
Revenues:
Student tuition and fees 276,415$ 41,830,000$ 2,085,646$ 2,747,053$ ‐$ ‐$ ‐$ ‐$ ‐$ 46,939,114$
State aid ‐ 29,447,940 ‐ ‐ ‐ ‐ ‐ ‐ ‐ 29,447,940
Government grants and contracts 19,606 2,478,432 446,482 2,694,450 27,935 29,465,388 6,241,160 ‐ ‐ 41,373,453
State and county taxes ‐ 31,605,159 ‐ ‐ ‐ ‐ ‐ ‐ ‐ 31,605,159
Investment income ‐ 601,533 ‐ ‐ ‐ ‐ ‐ 7,388 ‐ 608,921
Other income 155,224 2,713,810 864,284 548,800 10,514,255 ‐ 810,330 970,371 733,064 17,310,138
Total revenues 451,245 108,676,874 3,396,412 5,990,303 10,542,190 29,465,388 7,051,490 977,759 733,064 167,284,725
Expenses:
Instructional 249 37,693,622 1,467,412 4,243,146 ‐ ‐ 1,144,047 ‐ ‐ 44,548,476
Academic support ‐ 10,511,900 611,923 748,234 ‐ ‐ 2,235,553 ‐ ‐ 14,107,610
Student services 403,543 12,366,271 6,283 944 ‐ ‐ 634,412 ‐ ‐ 13,411,453
Plant operation and maintenance ‐ 10,609,968 ‐ ‐ 1,131,013 ‐ ‐ 8,210,324 ‐ 19,951,305
Depreciation ‐ ‐ ‐ ‐ 513,419 ‐ ‐ ‐ 2,103,577 2,616,996
Institutional support 1,303 22,337,605 26 534,186 ‐ ‐ 3,357 7,420 ‐ 22,883,897
Scholarships and fellowships 1,413 1,680,568 718 37,650 ‐ 29,465,388 ‐ ‐ ‐ 31,185,737
Public service ‐ 14,655 300,936 ‐ ‐ ‐ 3,037,893 ‐ ‐ 3,353,484
Interest Expense ‐ ‐ ‐ ‐ ‐ ‐ ‐ ‐ ‐ ‐
Auxiliary expenses ‐ ‐ ‐ ‐ 7,765,719 ‐ ‐ ‐ ‐ 7,765,719
Total Expenses 406,508 95,214,589 2,387,298 5,564,160 9,410,151 29,465,388 7,055,262 8,217,744 2,103,577 159,824,677
Revenues over/(under) expenses 44,737 13,462,285 1,009,114 426,143 1,132,039 ‐ (3,772) (7,239,985) (1,370,513) 7,460,048
Add: Capitalized expenses ‐ 1,283,594 ‐ 16,855 42,982 ‐ 53,787 251,843 ‐ 1,649,061
Total Before Fund Transfer 44,737 14,745,879 1,009,114 442,998 1,175,021 ‐ 50,015 (6,988,142) (1,370,513) 9,109,109
Total fund transfers ‐ (13,611,808) (1,009,114) (442,998) (1,175,021) ‐ (50,015) 14,639,895 1,649,061 ‐
Increase (decrease) in net position 44,737 1,134,071 ‐ ‐ ‐ ‐ ‐ 7,651,753 278,548 9,109,109
Net position, beginning of year 657,940 18,776,593 ‐ ‐ ‐ ‐ ‐ 32,372,594 37,446,703 89,253,830
Net position, end of year 702,677$ 19,910,664$ ‐$ ‐$ ‐$ ‐$ ‐$ 40,024,347$ 37,725,251$ 98,362,939$

The Metropolitan Community College
Schedule of Revenues, Expenses, and Changes in Fund Balances
Year Ended June 30, 2014
(68)
District
Building
Corporation Elimination MCC Total
Revenues:
Student tuition and fees 46,939,114$ ‐$ 25,204,433$ 21,734,681$
State aid 29,447,940 ‐ ‐ 29,447,940
Government grants and contracts 41,373,453 ‐ ‐ 41,373,453
State and county taxes 31,605,159 ‐ ‐ 31,605,159
Investment income 608,921 139,132 ‐ 748,053
Other income 17,310,138 7,915,215 7,915,215 17,310,138
Total revenues 167,284,725 8,054,347 33,119,648 142,219,424
Expenses:
Instructional 44,548,476 ‐ ‐ 44,548,476
Academic support 14,107,610 ‐ ‐ 14,107,610
Student services 13,411,453 ‐ ‐ 13,411,453
Plant operation and maintenance 19,951,305 ‐ 7,915,215 12,036,090
Depreciation 2,616,996 4,336,155 ‐ 6,953,151
Institutional support 22,883,897 2,500 ‐ 22,886,397
Scholarships and fellowships 31,185,737 ‐ 25,204,433 5,981,304
Public service 3,353,484 ‐ ‐ 3,353,484
Interest Expense ‐ 3,228,271 ‐ 3,228,271
Auxil iary expenses 7,765,719 ‐ ‐ 7,765,719
Total Expenses 159,824,677 7,566,926 33,119,648 134,271,955
Revenues (over)under Expenditures 7,460,048 487,421 ‐ 7,947,469
Add: Capitalized expenses 1,649,061 ‐ ‐ 1,649,061
Net increase (decrease) in fund balance 9,109,109 487,421 ‐ 9,596,530
Fund balance, beginning of year 89,253,830 32,502,620 ‐ 121,756,450
Fund balance, end of year 98,362,939$ 32,990,041$ ‐$ 131,352,980$

The Metropolitan Community College
Schedule of Combined Expenses by Functional and Natural Classification
Year Ended June 30, 2014
(69)
Type of Expense:
Salaries and
wages Fringe benefits
Supplies and
other services Utilities
Scholarships and
fellowships Depreciation Interest Expense
Total Expenses
by Functional
Classification
(Fund Report)Instructional 29,999,914$ 8,042,296$ 6,501,147$ 5,119$ ‐$ ‐$ ‐$ 44,548,476$
Academic support 7,586,187 2,689,284 3,895,714 (63,575) ‐ ‐ ‐ 14,107,610
Student services 8,594,477 3,033,034 1,783,942 ‐ ‐ ‐ ‐ 13,411,453
Plant operation and maintenance 3,073,844 1,270,382 4,562,093 3,129,771 ‐ ‐ ‐ 12,036,090
Institutional support 9,618,164 6,600,549 6,187,169 480,515 ‐ ‐ ‐ 22,886,397
Public service 674,555 205,480 2,472,159 1,290 ‐ ‐ ‐ 3,353,484
Auxil iary expenses 1,763,519 486,635 5,515,565 ‐ ‐ ‐ 7,765,719
Scholarships and fellowships ‐ ‐ ‐ 5,981,304 ‐ ‐ 5,981,304
Depreciation ‐ ‐ ‐ ‐ ‐ 6,953,151 ‐ 6,953,151
Interest Expense ‐ ‐ ‐ ‐ ‐ ‐ 3,228,271 3,228,271
Total Expenses 61,310,660 22,327,660 30,917,789 3,553,120 5,981,304 6,953,151 3,228,271 134,271,955
Less: Capitalized Expenses ‐ ‐ (1,649,061) ‐ ‐ ‐ ‐ (1,649,061)
Total Expenses by Natural
Classification (GASB Report) 61,310,660$ 22,327,660$ 29,268,728$ 3,553,120$ 5,981,304$ 6,953,151$ 3,228,271$ 132,622,894$
‐
Functional Expense Classification
Natural Expense Classification

The Metropolitan Community College
Schedule of Fund Transfers From/(To)
Year Ended June 30, 2014
(70)
General
Special
Projects IWI Auxiliary Student Aid Restricted
Unexpended
Plant
Invested in
Plant Total
Fund Transfers
Transfer for capitalized equipment 1,283,594$ ‐$ 16,855$ 42,982$ ‐$ 53,787$ 251,843$ (1,649,061)$ ‐$
Transfer to cover Net bond payment 6,843,847 ‐ ‐ ‐ ‐ ‐ (6,843,847) ‐ ‐
Transfer for Annual Loan Payment on Baseball
Facility 56,015 ‐ ‐ ‐ ‐ ‐ (56,015) ‐ ‐
Transfer for Technology loan 300,000 ‐ ‐ ‐ ‐ ‐ (300,000) ‐ ‐
‐
Transfer annual fund close‐out (2,563,524) 1,009,114 426,143 1,132,039 ‐ (3,772) ‐ ‐ ‐
Transfer Endowment Investment Income (5,177) ‐ ‐ ‐ ‐ ‐ 5,177 ‐ ‐
Transfer to match Financial Plan 7,697,053 ‐ ‐ ‐ ‐ ‐ (7,697,053) ‐ ‐
Net Fund Transfers 13,611,808$ 1,009,114$ 442,998$ 1,175,021$ ‐$ 50,015$ (14,639,895)$ (1,649,061)$ ‐$
Plant FundsOperational Restricted Funds

The Metropolitan Community College
Notes to Other Supplemental Financial Information
June 30, 2014
(72)
Funds statements are still used to manage the colleges and for external reporting to various agencies and have been included in the “Supplementary Information” section of the accompanying report for informational purposes. The main difference between the Colleges’ primary audited financial statements and the funds statement presentations is the treatment of scholarship aid used for tuition and fees. The primary statements per GASB 35 require such aid to be offset against tuition and fees, whereas the funds statements reflect gross tuition and fees and scholarship aid. Fund accounting is the procedure by which resources are classified for accounting and reporting purposes into funds that are maintained in accordance with activities or specific objectives. Separate accounts are maintained for each fund. Funds that have similar characteristics have been combined into fund groups. Accordingly, all financial transactions have been recorded and reported by fund groups. The assets, liabilities and fund balances of the Colleges are reported in two self‐balancing fund groups as follows: Current Funds include two separate fund groups, unrestricted and restricted, both of which are currently expendable for purposes of meeting the primary objectives of the Colleges, i.e., instruction, public service, and related supporting services. The unrestricted funds group, over which the District’s governing board retains full control to use in achieving any of its institutional purposes, includes the operational (general, business/continuing education, and special projects), auxiliary enterprise and agency funds. The general fund is used for all operational‐type charges that are not covered by the following two categories. The business/continuing education fund is utilized to account for contracted instructional activities with the business community and most other noncredit instruction. The special projects fund is used to account for programs which have been internally designated by the District’s governing board as pilot projects or require special accountability. Resources restricted by donors or other outside agencies for specific current operating purposes are accounted for in the restricted funds group, which includes the restricted and student aid funds. Plant Funds include resources available for future plant acquisitions, renewals and replacements, resources restricted for the retirement of indebtedness and funds which have been invested in plant. These funds are broken into two separate sections: Plant Funds and Building Corporation plant funds.

Compliance

CliftonLarsonAllen LLP CLAconnect.com
(73) An independent member of Nexia International
INDEPENDENT AUDITORS’ REPORT ON INTERNAL CONTROL OVER FINANCIAL REPORTING AND ON COMPLIANCE ANDOTHER MATTERS BASED ON AN AUDIT OF
FINANCIALSTATEMENTS PERFORMED IN ACCORDANCE WITH GOVERNMENT AUDITING STANDARDS
Board of Trustees The Metropolitan Community College Kansas City, Missouri We have audited, in accordance with the auditing standards generally accepted in the United States of America and the standards applicable to financial audits contained in Government Auditing Standards issued by the Comptroller General of the United States, the financial statements of the business-type activities and the discretely presented component unit of The Junior College District of Metropolitan Kansas City, Missouri (d/b/a The Metropolitan Community College), as of and for the year ended June 30, 2014 and the related notes to the financial statements, which collectively comprise The Metropolitan Community College’s basic financial statements, and have issued our report thereon dated October 29, 2014. The financial statements of the Foundation-Alumni Association were not audited in accordance with Government Auditing Standards. Internal Control Over Financial Reporting
In planning and performing our audit of the financial statements, we considered The Metropolitan Community College's internal control over financial reporting (internal control) to determine the audit procedures that are appropriate in the circumstances for the purpose of expressing our opinions on the financial statements, but not for the purpose of expressing an opinion on the effectiveness of The Metropolitan Community College’s internal control. Accordingly, we do not express an opinion on the effectiveness of The Metropolitan Community College’s internal control. A deficiency in internal control exists when the design or operation of a control does not allow management or employees, in the normal course of performing their assigned functions, to prevent, or detect and correct, misstatements on a timely basis. A material weakness is a deficiency, or a combination of deficiencies, in internal control, such that there is a reasonable possibility that a material misstatement of The Metropolitan Community College’s financial statements will not be prevented, or detected and corrected on a timely basis. A significant deficiency is a deficiency, or a combination of deficiencies, in internal control that is less severe than a material weakness, yet important enough to merit attention by those charged with governance.

BOARD OF TRUSTEES THE METROPOLITAN COMMUNITY COLLEGE
(74)
Our consideration of internal control was for the limited purpose described in the first paragraph of this section and was not designed to identify all deficiencies in internal control that might be material weaknesses or significant deficiencies. Given these limitations, during our audit we did not identify any deficiencies in internal control that we consider to be material weaknesses. However, material weaknesses may exist that have not been identified. Compliance and Other Matters
As part of obtaining reasonable assurance about whether The Metropolitan Community College's financial statements are free from material misstatement, we performed tests of its compliance with certain provisions of laws, regulations, contracts, and grant agreements, noncompliance with which could have a direct and material effect on the determination of financial statement amounts. However, providing an opinion on compliance with those provisions was not an objective of our audit, and accordingly, we do not express such an opinion. The results of our tests disclosed no instances of noncompliance or other matters that are required to be reported under Government Auditing Standards. Purpose of this Report
The purpose of this report is solely to describe the scope of our testing of internal control and compliance and the result of that testing, and not to provide an opinion on the effectiveness of The Metropolitan Community College’s internal control or on compliance. This report is an integral part of an audit performed in accordance with Government Auditing Standards in considering The Metropolitan Community College’s internal control and compliance. Accordingly, this communication is not suitable for any other purpose.
CliftonLarsonAllen LLP
St. Louis, Missouri October 29, 2014
CliftonLarsonAllen LLP CLAconnect.com
(75) An independent member of Nexia International
INDEPENDENT AUDITORS’ REPORT ON COMPLIANCE WITH REQUIREMENTS THAT COULD HAVE A DIRECT AND MATERIAL EFFECT ON EACH MAJOR FEDERAL PROGRAM, AND ON INTERNAL CONTROL OVER COMPLIANCE IN ACCORDANCE WITH OMB CIRCULAR A-133
Board of Trustees The Metropolitan Community College Kansas City, Missouri Report on Compliance for Each Major Federal Program
We have audited The Junior College District of Metropolitan Kansas City, Missouri’s (d/b/a The Metropolitan Community College) compliance with the types of compliance requirements described in the OMB Circular A-133 Compliance Supplement that could have a direct and material effect on each of The Metropolitan Community College’s major federal programs for the year ended June 30, 2014. The Metropolitan Community College’s major federal programs are identified in the summary of auditors’ results section of the accompanying schedule of findings and questioned costs. Management’s Responsibility
Management is responsible for compliance with the requirements of laws, regulations, contracts, and grants applicable to its federal programs.
Auditors’ Responsibility
Our responsibility is to express an opinion on compliance for each of The Metropolitan Community College’s major federal programs based on our audit of the types of compliance requirements referred to above. We conducted our audit of compliance in accordance with auditing standards generally accepted in the United States of America; the standards applicable to financial audits contained in Government Auditing Standards, issued by the Comptroller General of the United States; and OMB Circular A-133, Audits of States, Local Governments, and Non-Profit Organizations. Those standards and OMB Circular A-133 require that we plan and perform the audit to obtain reasonable assurance about whether noncompliance with the types of compliance requirements referred to above that could have a direct and material effect on a major federal program occurred. An audit includes examining, on a test basis, evidence about The Metropolitan Community College’s compliance with those requirements and performing such other procedures as we considered necessary in the circumstances. We believe that our audit provides a reasonable basis for our opinion on compliance for each major federal program. However, our audit does not provide a legal determination of The Metropolitan Community College’s compliance. Opinion on Each Major Federal Program
In our opinion, The Metropolitan Community College complied, in all material respects, with the compliance requirements referred to above that could have a direct and material effect on each of its major federal programs for the year ended June 30, 2014.

BOARD OF TRUSTEES THE METROPOLITAN COMMUNITY COLLEGE
(76)
Report on Internal Control Over Compliance
Management of The Metropolitan Community College is responsible for establishing and maintaining effective internal control over compliance with the types of compliance requirements referred to above. In planning and performing our audit of compliance, we considered The Metropolitan Community College’s internal control over compliance with the types of requirements that could have a direct and material effect on each major federal program to determine the auditing procedures that are appropriate in the circumstances for the purpose of expressing an opinion on compliance for each major federal program and to test and report on internal control over compliance in accordance with OMB Circular A-133, but not for the purpose of expressing an opinion on the effectiveness of internal control over compliance. Accordingly, we do not express an opinion on the effectiveness of The Metropolitan Community College’s internal control over compliance. A deficiency in internal control over compliance exists when the design or operation of a control over compliance does not allow management or employees, in the normal course of performing their assigned functions, to prevent, or detect and correct, noncompliance with a type of compliance requirement of a federal program on a timely basis. A material weakness in internal control over compliance is a deficiency, or combination of deficiencies, in internal control over compliance, such that there is a reasonable possibility that material noncompliance with a type of compliance requirement of a federal program will not be prevented, or detected and corrected, on a timely basis. A significant deficiency in internal control over compliance is a deficiency, or a combination of deficiencies, in internal control over compliance with a type of compliance requirement of a federal program that is less severe than a material weakness in internal control over compliance, yet important enough to merit attention by those charged with governance. Our consideration of internal control over compliance was for the limited purpose described in the first paragraph of this section and was not designed to identify all deficiencies in internal control over compliance that might be material weaknesses or significant deficiencies. We did not identify any deficiencies in internal control over compliance that we consider to be material weaknesses. However, material weaknesses may exist that have not been identified. The purpose of this report on internal control over compliance is solely to describe the scope of our testing of internal control over compliance and the result of that testing based on the requirements of OMB Circular A-133. Accordingly, this report is not suitable for any other purpose.
CliftonLarsonAllen LLP
St. Louis, Missouri October 29, 2014

The Metropolitan Community College Schedule of Expenditures of Federal Awards
Year Ended June 30, 2014
(77)
Federal
Federal Grantor/ Pass-Through Entity CFDA FederalPass - Through Grantor / Program Title Identifying Number Number Expenditures
U.S. Department of EducationStudent Financial Assistance Programs Cluster:
Federal Supplemental Educational Opportunity Grant 356895 * 84.007 462,694$ Federal Family Education Loans:
PLUS Loans N/A * 84.268 24,963 Stafford Loans N/A * 84.268 13,855,221
Federal Work Study 445806 * 84.033 389,711 Federal Pell Grant 11687263 * 84.063 27,798,648 Federal Pell Grant Administrative Allowance N/A * 84.063 51,080
U.S. Department of Health and Human ServicesStudent Financial Assistance Programs Cluster:
Health Resources & Services AdministrationScholarships for Disadvantaged Students N/A * 93.925 637,565
Total Student Financial Assistance Programs Cluster 43,219,882 (Included in Department Totals)
U.S. Department of EducationTrio Cluster:
Educational Opportunity Center N/A 84.066 391,640 Student Support Services N/A 84.042 434,801 Upward Bound N/A 84.047 223,150
Total Trio Cluster 1,049,591
Title III - Higher Education- Institutional Aid * 84.031F 379,489 Title III - Higher Education- Institutional Aid * 84.031A 647,455
Passed through State of Missouri Department of Elementary and Secondary Education
Carl D. Perkins Vocational Programs N/A * 84.048 827,535
Passed through State of Missouri Department of Higher Education
College Access Challenge Grant 84.378A 66,914
Total U.S. Department of Education (Including SFA Cluster) 46,190,866
U.S. Department of Health and Human ServicesPassed through State of Missouri Department of
Elementary and Secondary Education:CDA Enhancement N/A 93.575 10,638

The Metropolitan Community College Schedule of Expenditures of Federal Awards (Continued)
Year Ended June 30, 2014
(78)
See accompanying Notes to Schedule of Expenditures of Federal Awards. * Major Program
FederalFederal Grantor/ Pass-Through Entity CFDA Federal
Pass - Through Grantor / Program Title Identifying Number Number Expenditures
U.S. Department of LaborH-1B Technical Skills Training Grants N/A * 17.268 2,359,568
Trade Adjustment Assistance Community College & Career TrainingMissouri Health WINS Grant N/A 17.282 1,167,821
Trade Adjustment Assistance Community College & Career TrainingMissouri Manufacturing WINS Grant N/A 17.282 505,527
Total U.S. Department of Labor 4,032,916
U.S. Department of CommercePassed through State of Missouri Department of 29-42-B10563 11.557 86,547
Elementary and Secondary Education:Broadband Technologies Opportunity Program - ARRA
U.S. Department of Housing & Urban DevelopmentPassed through Cass County, MO & the Missouri N/A 14.228 36,456
Department of Economic DevelopmentCommunity Development Block - Training for Tomorrow
U.S. Economic Development Administration (EDA) N/A 59.007 88,225 Passed through Mid America Regional Council
Jobs Innovation Accelerator Challenge Grant
Promotions of the Humanities- Federal/State Partnership 1776 45.129 5,000$
Total Federal Expenditures: 50,450,648$

The Metropolitan Community College Notes to Schedule of Expenditures of Federal Awards
June 30, 2014
(79)
NOTE 1 SIGNIFICANT ACOUNTING POLICIES
The accompanying Schedule of Expenditures of Federal Awards includes the federal grant activity of The Metropolitan Community College and is presented on the accrual basis of accounting. The information in this schedule is presented in accordance with the requirements of the OMB Circular A-133, Audits of States, Local Governments, and Non-Profit Organizations. Therefore, some amounts presented in this schedule may differ from amounts presented in, or used in the preparation of the basic financial statements.
NOTE 2 ADDITIONAL AUDITS
Grantor agencies reserve the right to conduct additional audits of The Metropolitan Community College’s grant programs for economy and efficiency. Such audits may result in disallowed costs to The Metropolitan Community College. However, The Metropolitan Community College’s management does not believe such audits would result in any disallowed costs that would by material to The Metropolitan Community College’s financial position as of June 30, 2014.

The Metropolitan Community College Schedule of Findings and Questioned Costs
Year Ended June 30, 2014
(80)
A. SUMMARY OF AUDIT RESULTS
Financial Statements:
Type of auditor’s report issued: Unmodified
Internal control over financial reporting:
Significant deficiencies identified? No
Significant deficiencies identified that are considered to be material weaknesses? No
Noncompliance material to financial statements noted? No
Federal Awards:
Internal control over major programs:
Significant deficiencies identified? No
Significant deficiencies identified that are considered to be material weaknesses? No
Type of auditor’s report issued on compliance for major programs: Unmodified
Any audit findings disclosed that are required to be reported in accordance with Section 510(a) of Circular A-133? No
The programs tested as major programs include:
CFDA
Name of Federal Program Number
Student Financial Assistance Programs Cluster VariousPerkins IV, CTE Grant 84.048
Higher Education Institutional Aid 84.031H-1B Technical Skills Training Grant 17.268
The threshold for distinguishing type A and B programs was $300,000.
The Metropolitan Community College did qualify as a low-risk auditee.
B. FINDINGS – FINANCIAL STATEMENTS AUDIT
None

The Metropolitan Community College Schedule of Findings and Questioned Costs (continued)
Year Ended June 30, 2014
(81)
C. FINDINGS AND QUESTIONED COSTS – MAJOR FEDERAL AWARD PROGRAMS AUDIT None
D. PRIOR YEAR FINDINGS 2013-001: STUDENT FINANCIAL AID – REFUNDS OF FEDERAL AWARDS Condition: During our testing, we noted one student out of forty tested who the District failed to complete a refund of federal awards calculation for student withdraws. Criteria: Based on Department of Education guidelines, an institution is required to perform a refund calculation (R2T4) upon the student's withdraw from a class. Questioned Costs: The costs in question are $738 of Pell Grants that were awarded in excess of the student’s calculated cost of attendance. Effect: A student was awarded a portion of Pell Grants for which she was not eligible under Department of Education regulations. Auditors' Recommendation: We recommend the College return the excess grant funds to the Department of Education. We recommend the District implement procedures to assure refund calculations are performed on all student withdraws. Management’s Response: Once the District became aware of the missed refund calculation, the District immediately performed the calculation and promptly returned the $738. Status: No issues were noted during the current year audit.