the minos experiment - cgc.physics.miami.edu · minos detectors 8m far detector soudan mine two...
TRANSCRIPT

Lauren Hsu
Fermi National Accelerator Laboratory
MIAMIDecember 2007
The MINOS
Experiment

Neutrino Oscillations with
MINOS
Goal of MINOS is to measure disappearance of !µ :
P(!!"!!) = 1 - sin22#sin2( )
Beam of !µ created by NuMI (Neutrinos at the Main Injector),
detected in Minnesota 735 km away.
1.27$m2*735km
E (GeV)
A 2-Detector Measurement

Neutrinos at the Main Injector
NuMI commissioning:
Early 2005
120 GeV proton beam
2-3!1013 protons per spill
cycle period: 2.2 s
beam power ~0.17 MW
10!s spill time
3.7e20 POT delivered to date
Creating neutrinos with the Tevatron
Main Injector

Neutrino Beamline
Horns focus parent "
and K
104m
Target to Near Detector = 1 km
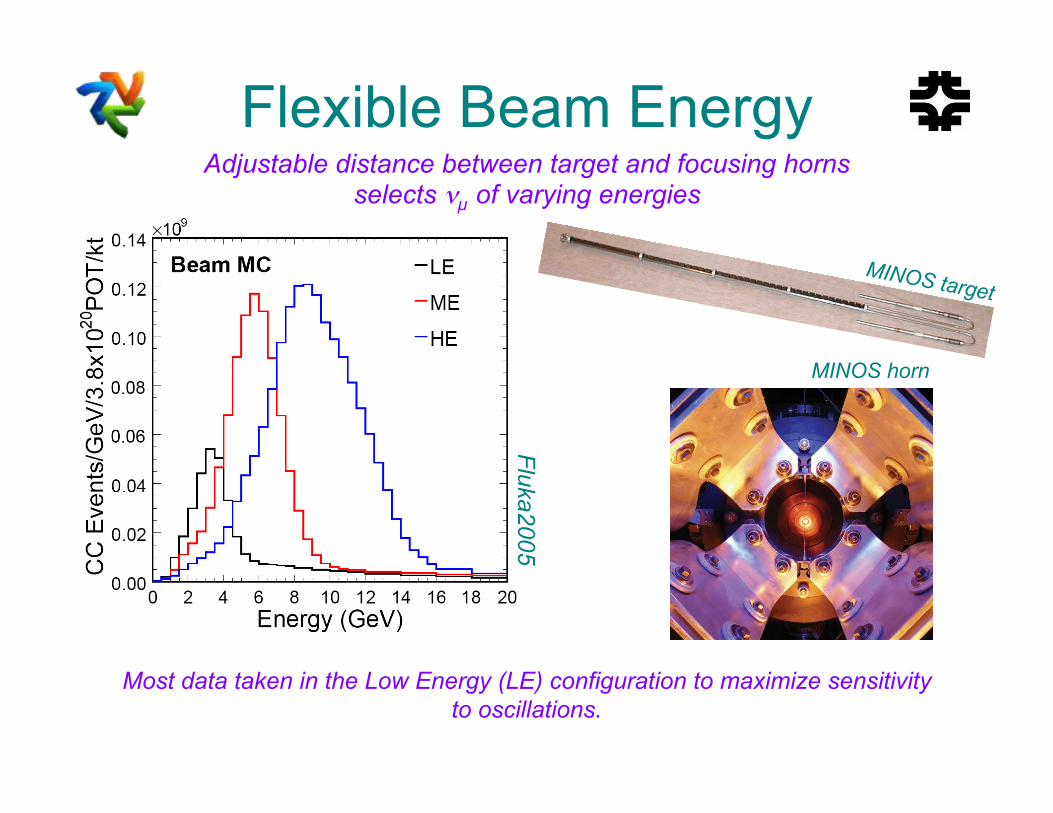
Flexible Beam Energy
Flu
ka20
05
MINOS horn
Adjustable distance between target and focusing hornsselects #! of varying energies
Most data taken in the Low Energy (LE) configuration to maximize sensitivity
to oscillations.
MINOS target

Total NuMI Delivered Protons3.7e20 POT delivered to date
beam and detectors currently up and running
20
06
sh
utd
ow
n
200
7 s
hu
tdo
wn
data analyzed to
date

MINOS Detectors
8m
Far Detector
Soudan Mine
Two nearly identical detectors monitor #! flux at “near” and “far” locations
5.4kT, 705m underground, 484 fully
instrumented planes, commissioned 2003
~6m
Near Detector
Fermilab
0.98kT, 103m underground, 282
fully/partially instrumented planes,
105x data rate of far detector,
commissioned 2005
• 2.54 cm thick steel planes alternating with 1X4.1cm scintillator strips
• scintillator strips embedded w/ WLS fibers, read out by multi-anode Hamamatsu PMTs • 1.2-1.3T toroidal Bfield distinguishes #
! from #
!
person
(for
scale)

Simple, Robust Technology
•Scint. planes alternate in “u”
and “v” directions
• 2.54cm steel = 1.4 rad. length
• 6-7 p.e. per M.I.P. per strip
Similar technologies incorporated intocomponents of NO#A, MINER#A, Double Chooz…
uv
Near Detector
underside
Scintillator
Strip w/ WLS
fiberMulti-anode PMT
Near Detector:
Scintillator Plane

Calibration
CalDet
minature copy of
MINOS detectors
$E/E = 21.4%/ %E(GeV) & 4.1%
(measured with caldet)
EM Shower Resolution:
$E/E = 6-13% (range and curvature)
Muon Momentum Resolution:
$E/E = 56%/ %E(GeV) & 2%
6% uncertainty in absolute Energy
(measured with caldet)
Hadronic Shower Resolution:
Light injection system &
cosmic rays correct for non-
uniformity and time variation
in strip response
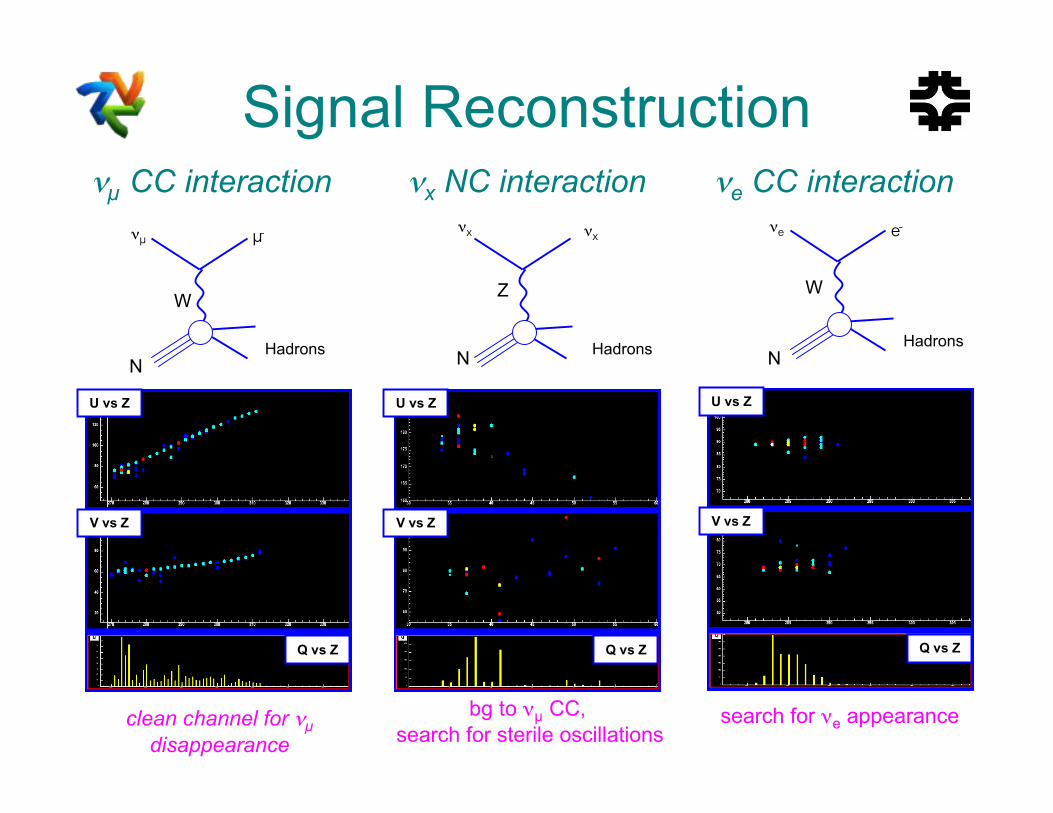
Signal Reconstruction#! CC interaction #x NC interaction #e CC interaction
U vs Z
V vs Z
Q vs Z
U vs Z
V vs Z
Q vs Z
U vs Z
V vs Z
Q vs Z
WZ W
!µ!x !e!x e-µ-
N NNHadrons
Hadrons Hadrons
clean channel for #!disappearance
search for !e appearancebg to !! CC,
search for sterile oscillations

!! Disappearancepreliminary results on 2.5e20 POT

Event SelectionSignature of a #! CC interaction is:
muon track + hadronic shower
Well reconstructed (muon) track
q < 0
track vertex inside fiducial volume
likelihood-based event topology discrimination
(NC/CC event separation)
(NC)
(NC)
(NC)
(NC)
Near Detector: NC/CC Separation Far Detector: NC/CC Separation
fiducial volume
near detector
far detector
This Result
2006 Result

Flux Predictions
Ideal Scenario: Near and Far detectors measure identical neutrino
fluxes, no need to know ! cross sections or hadron production.
Real Scenario: Angular acceptance & decay kinematics cause
Near and Far detectors to measure slightly different spectra
Construct a method to extrapolate near spectrum to obtain expected
far spectrum.
Probability toproduce #’s with
Etrue in Near Det.corresponds to #’s
with range of Etrue
in Far Det.

Beam Matrix Extrapolation
for each # of energy E# detected in Near Detector…
…p
robabili
ty to
dete
ct # o
f E#’ i
n
Far
Dete
cto
r
Elements determined by simulation of target
and beamline (Fluka05/GEANT3 )Cross-section, and flux uncertainties largely cancel!

Beam Modeling
Low
Energy
Med
Energy
High
Energy
Simultaneous fit to 8 different beam configurations (3 shown here)
constrains flux uncertainties
Remember: Many uncertainties in beam modeling cancel in construction of Beam Matrix!

Far Spectrum Cross-Checks3 additional extrapolation methods cross check the
Beam Matrix Prediction
Far/Near (F/N): Use Near data and ratio of fluxes to extrapolate to Far Detector
ND & 2DFit: Use output of Far MC after fitting Near spectrum to constrain beam
modeling, cross sections, and energy scale parameters
Far Spectrum Predictions

Disappearance Results
2.5e20 POT unblinded for this result
(cumulative with 1.27e20 POT from 2006 result)
310 events expected in [0,10]GeV, 496±20 observed
(significance of disappearance > 5$)
Improvements: 2X more data, upgrades to reconstruction, event selection
criteria, neutrino event generator…
<0.0050.041All other systematic uncertainties
0.0080.11Total systematic (summed in quadrature)
0.0080.010NC contamination ±50%
0.0800.17Statistical error (data)
<0.0050.075Absolute hadronic energy scale ±10%
<0.0050.065Near/Far normalization ±4%
Shift in
sin2(2#)
Shift in $m2
(10-3 eV2)Uncertainty

Results: Far Spectrum
Oscillation Hypothesis best fit
No Disappearance Hypothesis
P('2,n.d.f) = 0.18'2 /n.d.f = 41.2/34 = 1.2
P('2,n.d.f) is negligible'2 /n.d.f = 139.2/36
=3.9

Oscillation Contours
!
|"m32
2
|= 0.00238#0.00016+0.00020
08023
2 00.1)2(sin.!="
This Result, Best Fit:
(constrained to physical region)
eV2
Consistent with previous result within
statistical and systematic uncertainties
Fit to unconstrained physical region givesbest-fit sin2(2%) slightly > 1, Feldman-
Cousins analysis coming soon

Future MINOS Oscillation
Measurements

Sterile Oscillations
Signature of sterile oscillations:
deficit of NC events in Far Detector
!e, !!, !( interact via NC interaction.
A representative model for
interpreting MINOS NC data(Fogli et. al. PRD 63)
Looking for disappearance of standard model #’s in NC mode

Constraining #13: !e Appearance
Sensitivity Estimate:
To be updated soon!
Signature: Look for excess !e events
over expected background in Far
Detector
Data-driven techniques use Near
Detector Data to constrain backgrounds
Background
components
MIN
OS p
relim
inar
y

Summary
Future Measurements:
• Increased precision on atmospheric mixing parameters
• search for sterile oscillations
• search for nue appearance
2-detector experiment, designed to measure disappearance of #!
probes atmospheric oscillation parameters with man-made source
MINOS observes energy-dependent deficits consistent with oscillations
Preliminary Results on 2.5e20POT:
$m2 = 0.00238 eV2
sin2(2#23) = 1.00
significance of disappearance > 5)
Improvements over 2006: 2X more data + reconstruction, event selection
and event generator improvements
+0.00020*0.00016
*0.08