the mobility problem in britain: new findings from...
TRANSCRIPT

Erzsébet Bukodi, John H. Goldthorpe, Lorraine Waller, Jouni Kuha
The mobility problem in Britain: new findings from the analysis of birth cohort data Article (Accepted version) (Refereed)
Original citation: Bukodi, Erzsébet, Goldthorpe, John H., Waller, Lorraine and Kuha, Jouni (2015) The mobility problem
in Britain: new findings from the analysis of birth cohort data. The British Journal of Sociology , 66
(1). pp. 93-117. ISSN 0007-1315
DOI: 10.1111/1468-4446.12096
© 2014 London School of Economics and Political Science This version available at: http://eprints.lse.ac.uk/60249/ Available in LSE Research Online: May 2015 LSE has developed LSE Research Online so that users may access research output of the School. Copyright © and Moral Rights for the papers on this site are retained by the individual authors and/or other copyright owners. Users may download and/or print one copy of any article(s) in LSE Research Online to facilitate their private study or for non-commercial research. You may not engage in further distribution of the material or use it for any profit-making activities or any commercial gain. You may freely distribute the URL (http://eprints.lse.ac.uk) of the LSE Research Online website. This document is the author’s final accepted version of the journal article. There may be differences between this version and the published version. You are advised to consult the publisher’s version if you wish to cite from it.

1
The Mobility Problem in Britain: New Findings from the Analysis
of Birth Cohort Data
Erzsébet Bukodi
Department of Social Policy and Intervention and Nuffield College
University of Oxford
John H. Goldthorpe
Department of Social Policy and Intervention and Nuffield College
University of Oxford
Lorraine Waller
Department of Social Policy and Intervention and Nuffield College
University of Oxford
Jouni Kuha
Department of Methodology
London School of Economics and Political Sciences
Total word count: 10 631
Date the paper was last updated: 19/05/2014
2
Abstract
Social mobility is now a matter of greater political concern in Britain than at any time
previously. However, the data available for the determination of mobility trends are less
adequate today than two or three decades ago. It is widely believed in political and in media
circles that social mobility is in decline. But the evidence so far available from sociological
research, focused on intergenerational class mobility, is not supportive of this view. We
present results based on a newly–constructed dataset covering four birth cohorts that provides
improved data for the study of trends in class mobility and that also allows analyses to move
from the twentieth into the twenty–first century. These results confirm that there has been no
decline in mobility, whether considered in absolute or relative terms. In the case of women,
there is in fact evidence of mobility increasing. However, the better quality and extended
range of our data enable us to identify other „mobility problems‟ than the supposed decline.
Among the members of successive cohorts, the experience of absolute upward mobility is
becoming less common and that of absolute downward mobility more common; and class–
linked inequalities in relative chances of mobility and immobility appear wider than
previously thought.
Keywords: Intergenerational social mobility; social class; birth cohort studies; log-linear
models
3
Introduction
The background to this paper is provided by two, rather incongruous, facts. The first of these
is that while social mobility is now a matter of greater political concern than at any time
previously, the data available for the determination of levels of and trends in social mobility
are less adequate today than two or three decades ago. The data most appropriate in this
regard are those provided by repeated sample surveys of the population at large. From 1972
to 1992, such data were available from the General Household Survey (GHS) carried out
annually. Data were collected on survey respondents‟ employment status and occupation and
on respondents‟ fathers‟ „usual‟ employment status and occupation, and were then in both
cases coded to the Registrar General‟s Socio–Economic Groups (SEGs), from which an
approximation to the Goldthorpe social class schema (Goldthorpe 1987: ch. 2; 2007 vol. 2:
ch. 5) could be obtained (Heath and McDonald 1987). While subject to various limitations,
these data did allow reasonably informative tables of intergenerational class mobility to be
constructed, and thus gave a basis for the analysis of mobility trends (Goldthorpe and Mills
2004). However, from 1993 the GHS ceased to collect information on respondents‟ fathers,
or indeed on any other aspect of respondents‟ social origins. The one exception occurred in
2005 when, within an EU–SILC module incorporated into the GHS, information was again
obtained on fathers‟ occupations but together with only limited information on their
employment status – so that no close comparison with earlier GHS data was possible.
In consequence, researchers have of late been forced to analyse intergenerational mobility
using data bases that are in one way or other less satisfactory. Some have sought to relate data
from the 2005 GHS to data from the initial British Household Panel Survey (BHPS) of 1991
through the „occupation–only‟ version of the National Statistics Socio–Economic
Classification (NS–SEC) (ONS 2005: ch. 13), either in a simple two–point comparison (Li

4
and Devine 2011) or by „splicing‟ these data into the longer–term context provided by earlier
survey data derived from the GHS and elsewhere (Goldthorpe and Mills 2008). Others have
worked on the basis of birth–cohorts – or, more precisely, „quasi–cohorts‟ – constructed
within the BHPS dataset (Paterson and Ianelli 2007; and cf. Heath and Payne 2000, using the
British General Election Surveys). And others still (Goldthorpe and Jackson 2007) have
resorted to comparisons of mobility data derived from „true‟, but limited, birth–cohort studies
– i.e. the National Child Development Study (NCDS) and the British Cohort Study (BCS),
based on all individuals born in one week in 1958 and 1970, respectively.
The second incongruous fact to be noted is that over recent years the view has become firmly
established in political and also in media circles that social mobility in Britain is in decline or
has even „ground to a halt‟ – despite the evidence for such a view being slight and the
evidence going contrary to it far more substantial. The empirical basis for the idea of mobility
in decline is provided by just one paper, by a group of economists who are actually concerned
with intergenerational income mobility. Analysing data from the two birth cohort studies
previously referred to, Blanden et al. (2004) claim to show that in the 1970 cohort there was a
stronger association than in the 1958 cohort between the earnings of men and women when in
their early 30s and their family incomes when they were aged 16: i.e. across the two cohorts
mobility fell. The strength of this claim has been questioned on various grounds (Gorard
2008; Erikson and Goldthorpe 2010; and, for a response, see Blanden, Gregg and Macmillan
2013), while other economists have produced results that are in part at least conflicting
(Ermisch and Francesconi 2004; Nicoletti and Ermisch 2007). None the less, for reasons
examined elsewhere (Goldthorpe 2013), the research of Blanden and her associates achieved
a massive impact, and a consensus view of mobility in decline steadily built up around it.

5
This development was all the more remarkable in that the far more extensive sociological
research on intergenerational class mobility, referred to above, pointed to clearly different
conclusions – and also to ones of a more nuanced kind as a result, first, of a clear distinction
being made between absolute and relative mobility rates and, second, of a concern with
gender differences. This research, while drawing, as noted, on a variety of data sources, led to
a large measure of consensus on at least the two following points.
(1) As regards absolute mobility, the total mobility rate – measured as the percentage of
individuals whose class destinations are different from their class origins – has been fairly
stable throughout the later twentieth century for both men and women alike. However, this
similarity conceals gender differences as regards the upward and downward components of
total mobility. Among men, upward mobility ceased to rise as it did over the middle decades
of the last century and is, if anything, decreasing, while downward mobility is, if anything,
increasing. In contrast, among women, upward mobility has continued to rise, though from an
initially lower level than that found among men.
(2) As regards relative mobility rates – i.e. as measured conventionally by odds ratios (see
further below) – a generally stable situation has again existed over the later twentieth century;
or, at all events, such changes as do show up display trendless fluctuation rather than any
sustained direction. If any directional change has been in evidence, it is among women, and is
in fact towards more equal mobility chances or, that is, towards greater social fluidity rather
than less.
It is of course possible for intergenerational income mobility and intergenerational class
mobility to show different patterns and trends; but in public discussion of social mobility in
recent years the contrast between the attention given to research by economists and the
neglect of that by sociologists has been striking.
6
Against this background, the aims of the present paper are as follows. Basing our analyses on
a newly constructed dataset covering four birth cohorts and providing better quality data for
the study of trends in intergenerational class mobility than those that have been used of late,
we wish to discover how far the results we obtain are consistent with the findings set out
above and, in turn, how far the conclusions on mobility trends suggested by this earlier
research can be extended from the twentieth into the twenty-first century.
We accept that in analysing data from separate birth cohorts rather than data from repeated
cross-sectional surveys of the British population, our attempts to determine secular trends
may be made difficult by specific cohort effects on mobility (cf. Bukodi and Goldthorpe
2011). However, being able to compare changes over four cohorts rather than some smaller
number should help in this regard, and a birth–cohort approach has an important
compensating advantage. Cross-sectional population surveys give an essentially retrospective
view on mobility. Thus, the latest results that we have from such a survey, the EU-SILC
survey of 2005, will relate, so far as older respondents are concerned, to men and women
whose education and formative labour market experience date back to the 1970s or even the
1960s. In contrast, results for more recent birth cohorts provide a better guide to current
developments, and probably, too, the best indications that we can have of likely future
developments. At least from the time of Ryder‟s classic paper (1965), cohorts have been
recognised as vehicles of societal change; and in the case of mobility rates specifically, there
are good grounds for believing that change in the population at large is driven primarily by
cohort–replacement rather than by period effects (Breen and Jonsson 2007).
Data and variables
We use data from the 1958 and 1970 British birth cohort studies but we supplement these in
two ways. First, in order to gain greater historical perspective, we also draw on data from the

7
earliest British cohort study, the National Survey of Health and Development (NSHD), which
has followed through their life–courses a sample of men and women born in Britain in one
week in 1946. (For further information on all three of these studies, see Wadsworth et al.
2006; Power and Elliott 2006; and Elliott and Shepherd 2006). Second, in order to bring our
analyses as far as possible into the twenty-first century and to maintain, approximately, the
12-year sequencing of the three earlier cohorts, we have constructed a cohort of men and
women born in Britain between 1980 and 1984 from the dataset of the first wave of the UK
Household Longitudinal Study (UKHLS; „Understanding Society‟) which was carried out
between 2009 and 2011 (for details, see Waller 2013). Since the data for the 1946 and 1980–
–4 cohorts are based on samples, we apply survey weights to our analyses of these data.
The two main variables in our analyses are those of cohort members‟ social class origins and
social class destinations, which we determine according to a version of NS–SEC, as
discussed in detail below. Social class origin we index by father‟s class. We would have
preferred to bring mother‟s class into consideration also, say, through the dominance method
(Erikson 1984) but data limitations prevent this with the 1946 and 1980–4 cohorts. However,
for the 1958 and 1970 cohorts we have compared results using both father‟s class only and
the dominance method, and these show no significant differences in the overall strength or
pattern of the association between class origins and destinations.1 For the 1946 and 1958
cohorts, we establish father‟s class, wherever possible, at cohort member‟s age 11, and for the
1970 cohort at age 10. Where relevant information is not available at these ages, but is
available at age 15 (for the 1946 cohort) or at age 16 (for the 1958 and 1970 cohorts), we use
this latter information instead. For the 1980–4 cohort, we have information on father‟s class
at respondent‟s age 14. Again, we have, wherever possible, checked whether the strength and
pattern of the origin-destination association are significantly affected by these differences in
the treatment of fathers‟ class, and again with negative results.
8
For the first three cohorts, we take social class destinations at cohort members‟ ages 27 and
38, with 38 being the latest age for which we have information for the 1970 cohort, while age
27 is taken since this represents the mid–point of the age–range 24–30 within which we have
the latest information for members of the 1980–4 cohort. In this way we can extend our
analyses over all four cohorts but it should be recognised that the late-20s is somewhat early
in life for our purposes, given that individuals tend to reach a stage of „occupational maturity‟
– i.e. one at which the probability of job changes implying changes of class position falls
away – only around their mid-30s (Bukodi and Goldthorpe 2009, 2011).
With the 1946, 1958 and 1970 cohorts, we have brought together all data on cohort members‟
class destinations that were obtained from successive „sweeps‟, and have in fact been able to
construct their complete employment and class histories in person/month form from the time
of their entry into the labour market. We can then substantially increase the number of cases
available for analysis by allocating individuals who were not in employment at age 27 or age
38 to a class position on the basis of their last employment.2 With the 1980–4 cohort, a
separate variable provides information on previous employment, for respondents who were
not employed at the time of survey.
As indicated above, in earlier research into class mobility, whether based on the GHS or other
data sources, class has been determined by coding relevant data on cohort members and their
fathers either to the Goldthorpe class schema or to NS–SEC. However, as also noted, this
could often be done only approximately: for example, in the case of the Goldthorpe schema,
via SEGs, or in the case of NS–SEC, on the basis of occupational data only. We have
improved on this situation in the following way. We have recoded all occupational data for
members of our four cohorts and for their fathers to a common occupational classification,
that is, SOC90 (OPCS 1990). But only in the case of fathers of members of the 1980–4
9
cohort, for whom no information on employment status is available, do we then have to rely
on this occupational data alone and use the „simplified‟ derivation of NS-SEC (ONS 2005:
Table 15). In all other cases, we are able to take the SOC90 codings together with a binary
employment status code, distinguishing employers and the self-employed from employees,
and then move to the seven–class analytical version of NS–SEC following an algorithm taken
from the „reduced‟ derivation (ONS 2005: Table 17). We can once more check on the
adequacy of our procedures, in this case by comparing the results we thus achieve for the
1946 and 1970 cohorts with those from the „full‟ derivation of NS–SEC (ONS 2005: Table
15) that can also be produced for these two cohorts. We find that a similar strength and
pattern of the origins-destination association is in general brought out (though see note 12)3.
NS–SEC, which takes over the theoretical basis of the Goldthorpe schema (Rose, Pevalin and
O‟Reilly 2005: ch. 4) while providing an improved instantiation of it, is sometimes referred
to as an „occupation–based‟ classification, and may then be regarded as unsuitable in studies
of mobility trends (e.g. Blanden, Gregg and Machin 2005), since, over time, the occupational
composition of classes will change. However, this argument rests on a misunderstanding of
the way in which NS–SEC is „occupation-based‟. The conception of class that informs NS-
SEC is that class positions are defined by social relations in labour markets and production
units or, in other words, by employment relations; and occupation, and also employment
status, are then taken as indicators of employment relations – a procedure that has been
subject to, and has emerged well from, extensive studies of both the construct and criterion
validity of NS–SEC (Rose and Pevalin, eds. 2003; Rose, Pevalin and O‟Reilly 2005: ch. 6).
In brief (for fuller discussion, see Rose, Pevalin and O‟Reilly 2005: ch. 4; Goldthorpe 2007:
vol. 2, ch. 5; McGovern et al. 2007: ch. 3), Classes 1 and 2 of NS–SEC refer primarily to
positions in which, to a greater (Class 1) or lesser (Class 2) degree, professional and
managerial employees provide service to an employing organisation, on the basis of an at

10
least implicitly continuing contract, in return for salaries on an incremental scale, structured
career opportunities, and a range of fringe benefits. In contrast, Classes 6 and 7 refer to
positions in which, to a greater (Class 7) or lesser (Class 6) degree, employees engaged in
more routine tasks sell their labour to an employing organisation, on the basis of a contract
subject to short-term discontinuation, in return for wages that are related to output or time
worked. Classes 3 and 5 then refer to positions defined by employment relations that are
„mixed‟ in the above respects, while Class 4 refers to the obviously quite different positions
of self-employed workers and small employers.
From this standpoint, therefore, changes over time in the occupational composition of classes
in the sense of the specific kinds of job included are not of relevance, provided that
employment relations remain the same. For example, if we were to compare the occupations
of members of the 1980–4 cohort in Classes 6 and 7 – i.e. the broadly defined working class –
with those of their counterparts in the 1946 cohort, we would certainly find far fewer miners,
iron and steel workers, textile operatives and bus conductors and far more shelf-stackers, care
assistants, kitchen staff and security guards. But what is important is that in both cases alike
the employment relations of the individuals involved, as wage–workers, are essentially
comparable. How class positions differentiated in terms of employment relations impact on
individuals‟ life–chances and, most immediately, on their economic circumstances – as
regards income security, short-term income stability and longer-term income prospects, as
well as current income level – is by now well documented (Goldthorpe and McKnight 2006;
McGovern et al. 2007; Chan and Goldthorpe 2007).
Finally, in this connection, we may also note that in being derived from a theoretically-
grounded conception of class relations and positions and in being then implemented in ways
open to tests of validity, NS–SEC has major advantages over class „maps‟ (e.g. Savage et al.
2013) that are produced through essentially inductive methods: that is, by analyses of data

11
that refer both to what might be regarded as constitutive elements of class and to a rather
arbitrary collection of – possibly – class–linked outcomes. In the absence of any distinction in
this regard, validity cannot be established. Moreover, in applying such an approach in the
study of mobility serious problems of intergenerational comparability could indeed be
expected: first, in that data items used to establish the class positions of present-day survey
respondents could well be inapplicable to their parents and, second, in that class maps
resulting from inductive procedures would in any case be very likely to differ across
generations.
In Tables I and II we show the class origin and destination distributions of men and women in
our four cohorts based on our version of NS-SEC. These tables and all of our subsequent
analyses derive from a dataset obtained from a multiple imputation exercise that we have
undertaken in order to compensate for missing data in the cohort studies, due primarily to
cohort attrition but also to item non–response. Full details of this exercise are given in Kuha
(2013).
[Tables I and II here]
Results: absolute rates
For each cohort and for men and women separately, we construct 7 x 7 class mobility tables
based on NS-SEC as shown in Tables I and II. We have in all 14 such tables: i.e. tables for
men and women in three cohorts with class destinations taken at age 38, and in four cohorts
with class destinations taken at age 27.
We treat absolute mobility in terms of total mobility rates: i.e. the percentage of individuals
found in cells of the mobility table off the main diagonal and thus in a different class to that

12
of their father. We also distinguish between the upward and downward components of total
mobility rates – an obvious distinction to make but one that is usually lost sight of in political
discussion of mobility in which „mobility‟ tends to be equated with upward mobility and
downward mobility is a taboo topic. Total mobility rates can best be interpreted as showing
the extent of the actual experience of mobility, as opposed to immobility, and likewise of
upward as opposed to downward mobility, among the totality of men and women within each
of our four cohorts. In Figures I and II, we graph these rates across the cohorts for men and
women, respectively.
[Figure I here]
In the case of men, it can be seen that, whether destinations are considered at age 27 or at age
38, total mobility rates are more or less stable at around 77–78 per cent.4 In other words, in
each cohort upwards of three–quarters of men were found in different class positions to those
of their fathers. This result is in fact highly consistent with those of earlier studies. The level
of the total mobility rate will of course be influenced by the number of classes distinguished,
and between which mobility can therefore occur. But where 7-class versions of either the
Goldthorpe schema or NS–SEC have previously been used, total mobility rates for men in the
75–80 per cent range have generally been reported (e.g. Goldthorpe and Jackson 2007;
Goldthorpe and Mills 2008; Li and Divine 2011), while slightly lower rates are reported if a
6–class version of the Goldthorpe schema is used (Paterson and Ianelli 2007).5
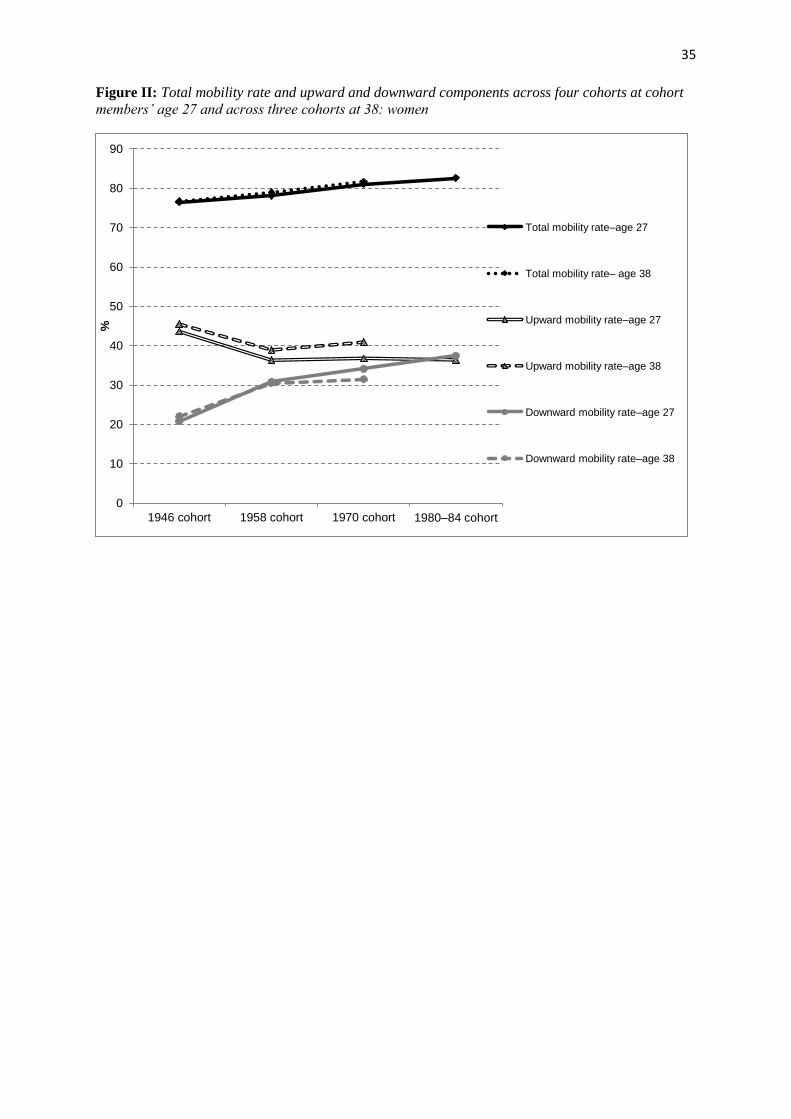
[Figure II here]
In the case of women, Figure II indicates a somewhat different situation. With class
destinations taken at both age 27 and 38, total rates show a rising tendency, reaching the 80
per cent mark with the 1970 cohort. This development has not been noted in earlier analyses,
whether ones based on retrospective population surveys or on the 1958 and 1970 birth

13
cohorts. But it could be indicative – and we will present further evidence in support of this
possibility – of an emerging longer-term trend.
In any event, what we can say here with certainty is that so far as total rates of
intergenerational class mobility are concerned, our results, like those reported in earlier
sociological research, give no support whatever to claims of mobility in decline.
Turning now to the upward and downward components of total mobility, it has first of all to
be noted that these are calculated on the basis of the hierarchical divisions that we make
within NS-SEC, as indicated by the dashed lines in Tables I and II: i.e. any intergenerational
movement from a lower to a higher division is counted as an instance of upward mobility,
and any movement from a higher to a lower division, as an instance of downward mobility. It
can be seen that, following standard practice, Classes 3, 4 and 5, while involving clearly
different employment relations, are not treated as ones that can be unequivocally ordered as
more or less advantaged: i.e. as higher or lower. Mobility between them is therefore regarded
as „horizontal‟ and does not contribute to either the upward or downward rate.6
For men, Figure I indicates a pattern of generally decreasing upward and increasing
downward mobility – although in each cohort alike men are more likely to have experienced
upward mobility, and less likely to have experienced downward mobility, at age 38 than at
age 27: i.e. there is clear evidence of a tendency for worklife advancement up to the stage at
which occupational maturity is reached. Some disturbance of the overall pattern is apparent in
the case of men in the 1958 cohort who could be seen as falling „below trend‟ as regards
decreasing upward mobility and „above trend‟ as regards increasing downward mobility.
From previous analyses, we do indeed know that the early work histories of many of these
men were adversely affected by the highly unfavourable labour market conditions prevailing
at the start of the 1980s (Bukodi and Goldthorpe 2011). However, what most notably emerges

14
from Figure I could be summed up as follows. While men in the 1946 cohort were at age 27
about twice as likely, and at age 38 almost three times more likely, to have experienced
upward rather than downward mobility, these differences narrow considerably in later
cohorts. And in fact for men in the 1980–4 cohort at age 27, the chances of having been
upwardly or downwardly mobile are more or less equal at around the 35 per cent mark,
although some improvement in the situation of these men could be expected by the time they
reach age 38.
The results we report here are consistent with those of earlier research in that this has shown
that the experience of upward mobility is no longer increasing over time, nor that of
downward mobility decreasing, as was the case among men whose working lives fell in the
middle decades of the last century (Goldthorpe and Mills 2004, 2008; Paterson and Ianelli
2007). However, our inclusion of more recent birth cohorts brings out the fact that the
balance of men‟s upward and downward mobility is now tending to move in quite the
opposite direction to that which prevailed in what has become known as the „Golden Age‟ of
mobility in which social advancement predominated.
For women, Figure II shows a pattern of change broadly comparable to that for men – with
the similar „convergence‟ in the 1980–4 cohort in the chances of having experienced upward
or downward mobility at age 27 being of particular interest. At the same time, though, at least
two differences should be recognized. First, the tendency for upward mobility to be more
common, and for downward mobility to be less common, at age 38 than at age 27 is less
marked for women than for men. In other words, over their earlier working lives women‟s
class trajectories appear not to follow a steady upward path to the same extent as men‟s –
although this difference may be narrowing (cf. Dex 1987; Bukodi, Dex and Joshi 2012). And
second, women‟s upward mobility does not continue to decline between the 1970 and the
1980–4 cohorts in the same way as with men.

15
None the less, despite this last result, our findings still suggest a less favourable situation for
women than has previous work (Goldthorpe and Mills 2004, 2008; Li and Devine 2011) in
which women‟s chances of upward mobility have been shown to be rising and to be clearly
greater than their chances of downward mobility. Again, our focus on the experience of more
recent birth cohorts enables us to point to a newly emergent trend: that is, for the composition
of women‟s total mobility rates, as regards upward and, especially, downward mobility, to be
coming closer to that which now prevails among men.
Changes in the composition of total mobility on the lines we have indicated, for men and
women alike, should not in fact be found all that surprising if the evolution of the British
class structure is taken into account. Two features of this evolution are of main relevance:
first, the rapid growth of the professional and managerial salariat in the mid-twentieth
century, which, however, slackened off towards the century‟s end; and, second, the
continuing decline of the wage-earning working class (Goldthorpe and Mills 2008).
The earlier expansion of the professional and managerial salariat, as represented by NS-SEC
Classes 1 and 2, is reflected in our data in the growing proportion of cohort members
originating in these classes. It can be calculated from the relevant columns of Tables I and II
that this proportion more or less tripled between the 1946 and 1980–4 cohorts, a clearly more
rapid growth than that which occurs in salariat destinations, and this then in itself tends to
increase the probability that more individuals within each cohort will experience downward
mobility – i.e. from salariat origins – simply because more are ‘at risk’ of so doing. In other
words, conditions have been created under which the experience of such downward mobility
will become more common among the members of successive cohorts unless changes in
relative mobility chances in some way counteract this. Correspondingly, the contraction of
the wage-earning working class, as represented by NS-SEC Classes 6 and 7, means that a
falling proportion of our cohort members come from these classes. From Tables I and II it

16
can be calculated that this proportion approximately halved between the 1946 and 1980–4
cohorts. In this case, therefore, fewer individuals will, all else equal, experience upward
mobility from working–class origins, in this case on account of the decreasing numbers „at
risk‟.7 In the following section we take up the question of how far changes in relative
mobility rates are in fact involved in the trends in absolute rates that we have described, but,
to anticipate, we find that their effects are very slight. In other words, it is indeed structural
change, on the lines indicated, that is all-important.
The main conclusion that we would then draw so far as absolute mobility rates are concerned
is the following. If in this regard there is a „mobility problem‟ in present–day Britain, it is not
that mobility overall has fallen. It is, rather, that the balance of upward and downward
mobility in the experience of successive birth cohorts is moving in an unfavourable direction.
Perhaps it is this that has been sensed by politicians in their concern with mobility understood
simply as upward mobility. But, at all events, the emerging situation is one for which there is
little historical precedent and that carries potentially far–reaching political and wider social
implications.
Results: relative rates
We now move on to consider rates of intergenerational class mobility in relative terms: i.e.
we focus on the relative chances of individuals of different class origins arriving at different
class destinations considered net of all class structural change. Relative rates impinge little on
individuals‟ awareness of being mobile or immobile but they have direct relevance for issues
of equality of opportunity among individuals and of societal „openness‟.

17
In analysing changes in relative rates across our cohorts, it is necessary to resort to the
statistical modelling of the data comprised by our 14 mobility tables, as previously described.
We fit to these tables the following three standard models (for further discussion of which,
see Breen 2004) which treat the association between class origins and destinations in terms of
log odds ratios.
(1) The log-linear model of conditional independence of class origins and destinations
where is the expected frequency in cell ijk of a three-way table comprising origin i (O),
destination j (D) and birth cohort k (C) and, on the right-hand side of the equation, µ is a
scale factor,
,
, represent the main effects of the distributions of individuals over
origins, destinations and cohorts and the and
terms refer to the associations between
origin and cohort and destination and cohort, respectively. Under this model all log odds
ratios defining associations between origins and destinations remain equal at 0, implying no
association or, in other words, that „perfect mobility‟ prevails. This is of course substantively
implausible but the model serves as a useful baseline.
(2) The log-linear model of constant association between class origins and destinations across
cohorts, generally known as the constant social fluidity (CSF) model
This model recognises that an association exists between origins and destinations net of
marginal effects – the further two–way association is added to model (1) – but requires
that the log odds ratios defining this association, our indicators of relative mobility, do not

18
change from one cohort to another. The one possible three-way association implying such
change, – which would in fact produce a saturated model – is not included.
(3) The log-multiplicative model, known as the UNIDIFF model (Erikson and Goldthorpe
1992)
where represents the general pattern of the origin–destination association across cohorts
and the relative strength of this association that is specific to a particular cohort. This
model thus allows us to test for the possibility that from one cohort to another the log odds
ratios defining the origin-destination association increase or decrease by some common,
multiplicative factor; or, in other words, for the possibility that relative rates become
uniformly more or less unequal, implying either a fall or a rise in fluidity within the class
structure.
[Table III here]
In Table III we show the results of fitting these models to our data for men. If class
destinations are taken at age 27, it can be seen that, while the CSF model comes close to
giving an acceptable fit, the UNIDIFF model significantly improves on it. Further, the β
parameters estimated under UNIDIFF, with that for the 1946 cohort being set at 1, show a
monotonic decline across the later cohorts. In other words, the indication here is that relative
mobility rates are becoming steadily less unequal – or that social fluidity is increasing.
However, it can also be seen from Table III that if class destinations are taken at age 38 – i.e.
when men can be supposed to have reached a stage of occupational maturity – we have a
different outcome. Over our first three cohorts it is doubtful if UNIDIFF does improve on
CSF, and in any event the monotonic decline in the β parameters disappears. These results are

19
then more in line with those of earlier inquiries (Goldthorpe and Mills 2004, 2008; Paterson
and Ianelli 2007; Goldthorpe and Jackson 2007) in suggesting that insofar as fluidity levels
do show any change, this is of a trendless kind.8
Additional grounds for caution in claiming a secular tendency for fluidity to increase are
found in Figure III. Here we plot across our cohorts the β parameters reported in Table III
together with „comparison intervals‟ (Firth 2003; Firth and De Menezes 2004), a form of
confidence intervals based on „quasi–variances‟ that allows comparisons to be made between
the intervals for any pair of parameters. It can be seen that even with class destinations taken
at age 27, it is only between the 1946 and later cohorts that a difference in the βs can very
safely be claimed. For the 1958, 1970 and 1980–4 cohorts the comparison intervals overlap
substantially – as they also do for the first three cohorts when class destinations are taken at
age 38.
[Figure III here]
So far as men are concerned, it is therefore doubtful if any steady increase in fluidity is in
train. But what can at the same time be said is that, if intergenerational mobility is considered
in terms of social class, then, with relative just as with absolute rates, there is no evidence at
all to support the idea of mobility in decline.
[Table IV here]
In Table IV and Figure IV we show our results for women in exactly the same form as for
men, but in this case a clearly different picture emerges. The results reported in Table IV
reveal that whether class destinations are taken at age 27 or age 38, UNIDIFF improves on
CSF and that the β parameters returned under UNIDIFF decline monotonically across the
20
cohorts. Moreover, the comparison intervals around these parameters shown in Figure IV do
not overlap for the 1946 and 1958 cohorts and scarcely so for the 1958 and 1970 cohorts.
[Figure IV here]
Here, then, we have far more persuasive evidence than with men of a sustained equalization
in relative rates or, that is, of a trend towards greater fluidity. As regards earlier research, we
may note that a similar trend was already indicated in analyses reported by Goldthorpe and
Mills (2004) on the basis of GHS data but that this was not confirmed in their later (2008)
analyses in which mobility tables derived from other population surveys, including the 2005
EU-SILC survey, were represented. Further, Goldthorpe and Jackson (2007), also using data
from the 1958 and 1970 birth cohort studies, found that CSF fitted their mobility tables for
women very well and that UNIDIFF made no improvement. However, in this last case, we
can identify exactly how the divergent findings come about since we can make a direct
comparison of the two analyses in question.9 And this exercise, it turns out, produces results
that are of some more general importance.
Our mobility tables differ from those constructed by Goldthorpe and Jackson in two main
ways. First, we have substantially larger Ns as a result of our integrating data across different
„sweeps‟ of the two cohort studies and of being able to include non-employed women on the
basis of their class of last employment. Second, through our occupational recoding exercise,
we can base our tables on NS-SEC rather than on an approximation to the Goldthorpe
schema.10
From our comparative analyses, we are then able to conclude that it is in fact this
latter difference that is the crucial one. If we apply the Goldthorpe schema, rather than NS-
SEC, to our own data for women in the 1958 and 1970 cohorts, we too find that CSF is the
preferred model. Further, though, what we also find is that, as well as NS-SEC serving to
bring out some equalisation in relative rates that the Goldthorpe schema does not pick up, it

21
does at the same time reveal generally more unequal relative rates or, that is, a stronger net
association between women‟s class origins and destinations – the decline across cohorts
notwithstanding. And this effect, we can show, is also present with men, although to a
somewhat lesser degree. In other words, NS-SEC appears a more sensitive instrument than
the Goldthorpe schema for determining both changes in relative rates and their actual level.11
Since, as earlier noted, NS–SEC takes over the theoretical basis of the schema but provides a
better instantiation of it, this result is not altogether surprising.
In the light of the foregoing, we can then have further confidence in our finding of increasing
social fluidity among women, and on this basis we can reaffirm, and indeed go beyond, what
we maintained in regard to men. So far as intergenerational class mobility is concerned, not
only are there no grounds for supposing a decline in relative rates but the opposite can in fact
be claimed.
Before leaving the question of relative rates, there are, however, two other observations that
we would wish to make. The first is that whatever changes may have occurred in relative
rates, their impact on absolute rates should be recognized as being quite slight. Thus, to revert
to the issue raised in the previous section of how far changes in total mobility rates reflect
changes in relative mobility chances as distinct from class structural change, we may note the
following result. If for all our mobility tables we replace actually observed cell values with
those that would be expected under the CSF model, so that changes in relative rates are
eliminated, and then redraw the graphs of Figures I and II, these are virtually
indistinguishable from those we have presented, with only one exception. Consistently with
our finding of increasing fluidity among women, the rise in their total mobility rate under the
CSF model is slightly less marked – i.e. by 1––2 percentage points.

22
The second observation is that while with relative as with absolute rates we find no evidence
of declining mobility, a mobility problem can again be pointed to that has not received the
attention it deserves: namely, the degree of inequality that prevails in relative rates, even
when any possible reduction across the cohorts is allowed for. To illustrate this point, we
present in Table V certain odds ratios derived from our mobility tables, with class
destinations taken at age 38, which are „symmetrical‟ in form: i.e. odds ratios whereby
relative chances of mobility are compared as between the same pairs of origin and destination
classes.
[Table V here]
In the first row of the table, we consider Class 1/Class 7 odds ratios: i.e. those which relate
the chances of an individual born into Class 1 being found in Class 1 rather than in Class 7 to
the chances of an individual born into Class 7 being found in Class 1 rather than in Class 7.
We do not in this case report odds ratios for the 1946 cohort since the numbers involved are
too small to give reliable results. For the other odds ratios, we show confidence intervals
which, as can be seen, are quite wide. None the less, what is clear is that the disparities in
mobility chances that do exist are very large. A conservative view would be that the Class
1/Class 7 odds ratio is around 20 for men and around 10 – with perhaps a falling tendency –
for women. In other words, the inequality in chances that exists is, respectively, 20 or 10
times greater than it would be under conditions of „perfect mobility‟, with no association
existing between the classes of origin and destination in question (in which case the odds
ratio would of course be 1).
This example could be regarded as representing a somewhat extreme case – if still not a
negligible one – and so to give a wider view we combine Classes 1 and 2 and Classes 6 and
7, and in the second row of Table V show the odds ratios that then result. These ratios could
23
be taken as comparing the chances of individuals born into the professional and managerial
salariat being themselves found in the salariat rather than in the working class with the
chances of individuals born in the working class being found in the salariat rather than in the
working class. In other words, substantial sections of the total population are here involved
(see Tables I and II). Still, though, the ratios for men could be reasonably thought to lie
somewhere between 5 and 10, with those for women probably falling somewhat below this
range for younger cohorts.12
Views may differ on how far these inequalities should be taken as a matter for social concern.
But two points can in any event be made. First, the odds ratios shown above not only indicate
a greater degree of inequality than do economists‟ findings on income mobility (cf.
Goldthorpe 2013: Table 1) but are also larger than directly corresponding ones reported in
earlier sociological research (e.g. Heath and Payne 2000: Tables 7.12 and 7.13; Goldthorpe
and Jackson 2007: Table VII; Li and Devine 2011: Table VII). We would see this as the
result of the inequalities involved being previously underestimated through the use of
classifications less reliable than our version of NS–SEC and that thus lead to some
attenuation of the intergenerational association between class positions. Second, a fuller
understanding is needed of how these inequalities are actually generated – and not only from
an academic standpoint but also to provide a better basis for any normative judgements that
might be made or for any policy interventions that might be envisaged.
Conclusions
In this paper we use a new data-set based on four cohorts of men and women born in Britain
in 1946, 1958, 1970 and 1980–4 in order to update findings on social mobility in the context
of the widely held belief that mobility is in decline. We are able to underwrite the conclusions
reached in previous sociological research that, so far at least as intergenerational class

24
mobility is concerned, no evidence for such a decline exists, whether mobility is considered
in absolute or in relative terms. At the same time, though, our birth-cohort perspective on
mobility, together with the improved quality of the data–set we have constructed, allows us to
bring out how certain other changes in mobility rates and patterns suggested in previous
research have in fact developed and also to identify some newly emergent and hitherto
unreported tendencies.
Thus, in the case of absolute rates, we are able to show how, for men, within a total mobility
rate that remains remarkably stable across our cohorts, the upward mobility component is
tending to fall and the downward mobility component to rise; and, further, how, for women,
while the total mobility rate increases somewhat, a similar pattern of change in its
composition would appear to be in formation. Insofar, then, as a mobility problem could be
thought in this respect to exist, it concerns not the overall level of mobility but rather the
extent to which the experience of upward mobility is becoming less common, and that of
downward mobility more common in the lives of members of successive cohorts.
In the case of relative rates, our findings for men and women alike go clearly contrary to any
suggestion of mobility chances becoming more unequal. For men, the results we report are
most safely interpreted as showing a continuation of trendless fluctuation. But, for women,
the evidence of an equalising tendency is quite strong. At the same time, though, our
improved coding of individuals‟ classes of origin and destination to a version of NS-SEC
allows us to show that, despite any reduction that may have occurred, inequalities in relative
mobility chances are still wider than has previously been appreciated, and could be regarded
as constituting a further mobility problem.
It is in regard to relative rates that our findings most obviously mark out areas for future
research. The emerging patterns in absolute rates that we have demonstrated are, as we have

25
sought to show, ones that can be essentially accounted for in terms of recent class structural
change. But with relative rates the explanatory challenge is much greater. This is most
apparent in the case of the gender differences that we have reported. Why should it be that an
equalisation of relative rates – or greater social fluidity – is rather clearly in evidence for
women but not for men? Does this come about because women have been raising their levels
of educational attainment more rapidly than men, and because for women such attainment is
becoming less strongly associated with class origins but more strongly associated with class
destinations? Or is there simply an increase in „perverse fluidity‟ (Goldthorpe and Mills
2004: 209), resulting from more women from more advantaged backgrounds returning to
employment after their period of active motherhood but at lower levels than those in which
they were previously engaged? Or again should greater weight be attached to policy and other
changes favouring more continuous labour market participation and worklife advancement on
the part of women, which have been especially beneficial for women of less advantaged
social origins?
Further, though, the issues that arise here of the relative importance in processes of
intergenerational mobility or immobility of educational attainment, on the one hand, and of
intragenerational mobility or immobility, on the other, have a relevance that extends beyond
the explanation of gender differences. One may, for example, go on to ask – in cross–cohort
perspective – how far are the worklife trajectories of men and women alike simply a
reflection of the level of educational qualifications that they acquire prior to entering the
labour market, or of any further qualifications they may later obtain, and how far are these
trajectories also significantly influenced by other factors, whether social or psychological,
considered independently of education. And in turn one would then wish to know whether
these other factors are ones that are more or less closely associated with individuals‟ social
origins than is their educational attainment.

26
In seeking in our subsequent research to address these and related questions, we will in one
further way be able to benefit from grounding our initial analyses of rates and patterns of
mobility in the datasets of the British cohort studies. For these datasets, as well as providing a
wealth of information on cohort members‟ social backgrounds and individual characteristics,
also allow us to construct their complete employment and class histories, and likewise their
educational and family histories, and thus to form the essential basis for the dynamic, life-
course analyses that will be required.
(Date accepted: April 2014)

27
Bibliography
Blanden, J. Gregg, P. and Machin, S. 2005 „Educational Inequality and Intergenerational
Mobility‟ in S. Machin and A. Vignoles (eds) What’s the Good of Education? Princeton:
Princeton University Press.
Blanden, J., Goodman, A., Gregg, P. and Machin, S. 2004 „Changes in Intergenerational
Mobility in Britain‟ in M. Corak (ed.) Generational Income Mobility in North America and
Europe, Cambridge: Cambridge University Press.
Blanden, J., Gregg, P. and Macmillan, L. 2013 „Intergenerational Persistence in Income
and Social Class: the Effect of within–group Inequality‟, Journal of Royal Statistical Society,
Series A 176: 1–23.
Breen, R. 2004 „Statistical Methods of Mobility Research‟ in R. Breen (ed.) Social Mobility
in Europe, Oxford: Oxford University Press.
Breen, R. and Jonsson, J.O. 2007 „Explaining Change in Social Fluidity: Educational
Equalization and Educational Expansion in Twentieth–Century Sweden‟, American Journal
of Sociology 112: 1775–1810.
Bukodi, E. and Neuburger, J. 2009 Data Note: Job and Occupational Histories For the
HSHD 1946 Birth Cohort, London: Institute of Education.
Bukodi. E. and Goldthorpe, J. H. 2009 „Class Origins, Education and Occupational
Attainment: Cross-Cohort Changes among Men in Britain‟, Centre for Longitudinal Studies,
Working Paper 2009/3, London: Institute of Education.

28
Bukodi, E. and Goldthorpe, J. H. 2011 „Class Origins, Education and Occupational
Attainment in Britain: Secular Trends or Cohort–Specific Effects? European Societies 13:
347–75.
Bukodi, E., Dex, S. and Joshi, H. 2012 „Changing Career Trajectories of Women and Men
across Time‟ in J. Scott, S. Dex and A. C. Plagnol (eds) Gendered Lives, Cheltenham:
Edward Elgar.
Chan, T.–W and Goldthorpe, J. H. 2007 „Class and Status: the Conceptual Distinction and
its Empirical Relevance‟, American Sociological Review 72: 512–32.
Dex, S. 1987 Women’s Occupational Mobility, London: Macmillan.
Elliott, J. and Shepherd, P. 2006 „Cohort Profile: 1970 British Birth Cohort (BCS70)‟,
International Journal of Epidemiology 35: 836–843.
Erikson, R. 1984 „Social Class of Men, Women and Families‟, Sociology 18: 500–14.
Erikson, R. and Goldthorpe, J. H. 2010 „Has Social Mobility in Britain Decreased?
Reconciling Divergent Findings on Income and Class Mobility‟, British Journal of Sociology
61: 211–30.
Ermisch, J. and Francesconi, M. 2004 „Intergenerational Mobility in Britain: New
Evidence from the British Household Panel Study‟ in M. Corak (ed.) Generational Income
Mobility in North America and Europe, Cambridge: Cambridge University Press.
Firth, D. 2003 „Overcoming the Reference Category Problem in the Presentation of
Statistical Models‟, Sociological Methodology 33: 1–18.
Firth D. and De Menezes, R. X. 2004 „Quasi-Variances‟, Biometrika 91: 65–80.

29
Goldthorpe, J. H. (with Llewellyn, C. and Payne, C.) 1987 Social Mobility and Class
Structure in Modern Britain, 2nd ed., Oxford: Clarendon Press.
Goldthorpe, J. H. 2007 On Sociology, 2nd ed., 2 vols., Stanford: Stanford University Press.
Goldthorpe, J. H. 2013 „Understanding – and Misunderstanding – Social Mobility in
Britain: The Entry of the Economists, the Confusion of Politicians and the Limits of
Educational Policy‟, Journal of Social Policy 42: 431–450.
Goldthorpe, J. H. and Jackson, M. 2007 „Intergenerational Class Mobility in
Contemporary Britain: Political Concerns and Empirical Findings‟, British Journal of
Sociology 58: 526–46.
Goldthorpe, J. H. and McKnight, A. 2006 „The Economic Basis of Social Class‟ in S.
Morgan, D. B. Grusky and G. S. Fields (eds) Mobility and Inequality: Frontiers of Research
from Sociology and Economics, Stanford: Stanford University Press.
Goldthorpe, J. H. and Mills, C. 2004 „Trends in Intergenerational Class Mobility in Britain
in the Late Twentieth Century‟ in R. Breen (ed.) Social Mobility in Europe, Oxford: Oxford
University Press.
Goldthorpe, J. H. and Mills, C. 2008 „Trends in Intergenerational Class Mobility in Modern
Britain: Evidence from National Surveys, 1972–2005‟, National Institute Economic Review
205: 83–100.
Gorard, S. 2008 „A Re–consideration of Rates of “Social Mobility” in Britain: or Why
Research Impact is not Always a Good Thing‟, British Journal of Sociology of Education 29:
317–24.

30
Heath, A. F. and McDonald, S. 1987 „Social Change and the Future of the Left, Political
Quarterly 58: 364–77.
Heath, A. F. and Payne, C. 2000 „Social Mobility‟ in A. H. Halsey (ed.) Twentieth Century
British Social Trends, London: Macmillan.
Kuha, J. 2013 Trends in Intergenerational Class Mobility in Britain: New Findings From the
Analysis of Birth Cohort Data. A Note on the Multiple Imputation of Missing Data, Oxford:
University of Oxford.
Li, Y. and Devine, F. 2011 „Is Social Mobility Really Declining?‟, Sociological Research
Online 16: 1–25.
McGovern, P., Hill, S., Mills, C. and White, M. 2008 Market, Class, and Employment,
Oxford: Oxford University Press.
Meng, X.–L. and Rubin, D.B. 1992 „Performing Likelihood Ratio Tests with Multiply–
Imputed Data Sets‟, Biometrika 79: 103–111.
Nicoletti, C. and Ermisch, J. 2007 „Intergenerational Earnings Mobility: Changes across
Cohorts in Britain‟, The B.E. Journal of Economic Analysis and Policy 7: 1–36.
Office of National Statistics 2005 The National Statistics Socio–economic Classification:
User Manual, London: Palgrave-Macmillan.
Paterson, L. and Ianelli, C. 2007 „Patterns of Absolute and Relative Social Mobility: A
Comparative Study of England, Wales and Scotland‟, Sociological Research Online 12: 1–
33.

31
Power, C. and Elliott, J. 2006 „Cohort Profile: 1958 British Birth Cohort (National Child
Development Study)‟, International Journal of Epidemiology 35: 34–41.
Rose, D. and Pevalin, D. (eds) 2003 A Researcher’s Guide to the National Statistics Socio-
economic Classification, London: Sage.
Rose, D., Pevalin. D and O’Reilly, K. 2005 The National Statistics Socio-economic
Classification: Origins, Development and Use, London: National Statistics and Palgrave
Macmillan.
Ryder, N. B. 1965 „The Cohort as a Concept in the Study of Social Change‟, American
Sociological Review 30: 843–61.
Savage, M., Devine, F., Cunningham, M., Taylor, M., Li, Y., Hjellbrekke, J., Le Roux,
B., Friedman, S. and Miles, A. 2013 „A New Model of Social Class? Findings from the
BBC‟s Great British Class Survey Experiment‟, Sociology 47: 219–250.
Wadsworth, M., Kuh, D., Richards, M. and Hardy, R. 2006 „Cohort Profile: The 1946
National Birth Cohort (MRC National Survey of Health and Development)‟, International
Journal of Epidemiology 35: 49–54.
Waller, L. 2013 Data Note: UKHLS 1980–4 Quasi-Cohort. Oxford: University of Oxford.

32
Table I: Distributions of class origins and destinations across four cohorts: men
1946 cohort 1958 cohort 1970 cohort 1980–84 cohort
NS-SEC analytical
version
Class of
origina
Class of
destination
Class of
origina
Class of
destination
Class of
origina
Class of
destination
Class of
origin
Class of
destination
Age 27 Age 38 Age 27 Age 38 Age 27 Age 38 Age 24–30
1. Higher managers and
professionals 4.6 7.6 8.9 6.5 11.3 16.3 11.3 15.4 21.1 16.3 17.5
2. Lower managers and
professionals 9.7 18.7 26.6 15.4 17.9 20.3 17.2 19.7 20.8 20.5 20.9
3. Intermediate occupations 9.8 15.4 9.8 14.7 12.4 9.0 7.5 11.4 9.7 10.9 13.6
4. Small employers and own
account workers 10.1 8.5 10.7 5.6 8.3 14.7 14.1 9.6 14.6 12.9 10.0
5. Lower supervisory and
technical occupations 12.6 15.2 12.6 19.6 14.3 11.1 14.0 11.3 8.9 13.2 6.3
6. Semi–routine occupations 16.5 13.3 13.0 10.9 15.0 13.2 14.0 17.3 12.9 12.5 17.7
7. Routine occupations 36.7 21.3 18.5 27.4 20.8 15.4 21.9 15.3 12.1 13.7 14.1
Total 100 100 100 100 100 100 100 100 100 100 100
N 2395 6217 6797 5781 5893 1126
Note
a: Distribution based on men with class destinations taken at age 27. The distribution based on men with class destinations taken at age 38 is not significantly
different.
The dash lines indicate the collapses of the NS-SEC categories that are used for calculating upward and downward mobility rates.

33
Table II: Distributions of class origins and destinations across four cohorts: women
1946 cohort 1958 cohort 1970 cohort 1980–84 cohort
NS–SEC analytical
version
Class of
origina
Class of
destination
Class of
origina
Class of
destination
Class of
origina
Class of
destination
Class of
origin
Class of
destination
Age 27 Age 38 Age 27 Age 38 Age 27 Age 38 Age 24–30
1. Higher managers and
professionals 3.9 0.8 1.7 5.8 5.8 5.9 11.6 7.5 9.7 15.2 12.0
2. Lower managers and
professionals 8.1 14.8 19.8 17.7 18.6 22.2 18.3 21.6 25.7 19.1 24.4
3. Intermediate occupations 9.4 39.4 29.7 15.8 34.7 26.5 7.1 30.2 25.8 7.9 21.6
4. Small employers and own
account workers 8.4 5.3 5.8 4.8 5.1 8.5 13.3 4.1 6.7 16.0 4.7
5. Lower supervisory and
technical occupations 15.9 2.1 2.4 19.3 2.1 1.2 14.3 1.8 0.9 13.1 0.7
6. Semi–routine occupations 18.1 19.3 20.1 9.9 18.6 21.9 14.0 21.5 22.0 10.9 24.3
7. Routine occupations 36.2 18.3 20.7 26.7 15.1 13.9 21.4 13.3 9.1 17.8 12.3
Total 100 100 100 100 100 100 100 100 100 100 100
N 2004 2070 5390 6457 5864 6019 1626
Note
See Table I.

34
Figure I: Total mobility rate and upward and downward components across four cohorts at cohort
members’ age 27 and across three cohorts at age 38: men
0
10
20
30
40
50
60
70
80
90
1946 cohort 1958 cohort 1970 cohort 1980–84 cohort
%
Total mobility rate–age 27
Total mobility rate– age 38
Upward mobility rate–age 27
Upward mobility rate–age 38
Downward mobility rate–age 27
Downward mobility rate–age 38
35
Figure II: Total mobility rate and upward and downward components across four cohorts at cohort
members’ age 27 and across three cohorts at 38: women
0
10
20
30
40
50
60
70
80
90
1946 cohort 1958 cohort 1970 cohort 1980–84 cohort
%
Total mobility rate–age 27
Total mobility rate– age 38
Upward mobility rate–age 27
Upward mobility rate–age 38
Downward mobility rate–age 27
Downward mobility rate–age 38

36 Table III: Fit of independence, CSF and UNIDIFF models to intergenerational class mobility tables
for men in four cohorts at age 27 and in three cohorts at age 38
Modified
LR testa df
b p DI
Age 27
(1) Independence 11.26 144 0.00 0.15
(2) CSF 1.25 108 0.04 0.04
(3) UNIDIFF 1.14 105 0.15 0.04
(2) versus (3) 4.50 3 0.00
β parameters under UNIDIFF
1946 set at 1.00
1958 0.81
1970 0.76
1980 – 84 0.65
Age 38
(1) Independence 10.63 108 0.00 0.15
(2) CSF 1.12 72 0.24 0.04
(3) UNIDIFF 1.09 70 0.29 0.04
(2) versus (3) 2.56 2 0.08
β parameters under UNIDIFF
1946 set at 1.00
1958 1.03
1970 0.90
Notes
a: The likelihood ratio test was calculated using the method for multiply imputed data proposed by
Meng and Rubin (1992).
b: The p-value of the test statistic is obtained from an F distribution. Only its first degrees of freedom
are reported. These are identical to the degrees of freedom for the likelihood ratio test if the data were
complete.

37
Figure III: β parameters under UNIDIFF with comparison intervals: men
0.3
0.4
0.5
0.6
0.7
0.8
0.9
1.0
1.1
1.2
1.3
1946
cohort
1958
cohort
1970
cohort1980–84
cohort
1946
cohort
1958
cohort
1970
cohort1980–84
cohort
Age 27 Age 38
UN
IDIF
F p
aram
eter
(β
)

38
Table IV: Fit of independence, CSF and UNIDIFF models to intergenerational class mobility tables
for women in four cohorts at age 27 and in three cohorts at age 38
Modified
LR testa df
b p DI
Age 27
(1) Independence 8.47 144 0.00 0.12
(2) CSF 1.41 108 0.00 0.04
(3) UNIDIFF 0.91 105 0.73 0.03
(2) versus (3) 13.64 3 0.00
β parameters under UNIDIFF
1946 set at 1.00
1958 0.61
1970 0.49
1980–84 0.40
Age 38
(1) Independence 7.83 108 0.00 0.11
(2) CSF 1.14 72 0.19 0.03
(3) UNIDIFF 0.82 70 0.86 0.03
(2) versus (3) 10.33 2 0.00
β parameters under UNIDIFF
1946 set at 1.00
1958 0.69
1970 0.54
Notes
a, b: See Table III.

39
Figure IV: β parameters under UNIDIFF with comparison intervals: women
0.3
0.4
0.5
0.6
0.7
0.8
0.9
1.0
1.1
1.2
1.3
1946
cohort
1958
cohort
1970
cohort1980–84
cohort
1946
cohort
1958
cohort
1970
cohort1980–84
cohort
Age 27 Age 38
UN
IDIF
F p
aram
eter
(β
)

40
Table V: Symmetrical odds ratios (at age 38): Class 1/Class 7 and Classes 1–2/Classes 6–7
Men
Women
1946 cohort 1958 cohort 1970 cohort
1946 cohort 1958 cohort 1970 cohort
Class 1/Class 7 – 23.7 24.1
– 18.7 14.5
95% confidence
interval
(12.3–45.7) (12.5–46.6)
(9.7–36.3) (8.2–25.8)
Class 1–2/Class 6–7 6.2 5.1 6.2
7.7 5.4 4.1
95% confidence
interval (3.8–9.9) (4.0–6.4) (5.0–7.7)
(4.5–13.4) (4.5–6.6) (3.4–4.9)

41
Notes
1 These results and all others referred to in the text but not presented are available on request.
2 The proportion of women not in employment at either age 27 or 38, and thus allocated to a
class position on the basis of their last employment, is in the range of 20 to upwards of 30 per
cent across the cohorts. The corresponding proportion of men is always lower, being less than
10 per cent except for men in the 1980–4 cohort where it rises to almost 15 per cent.
3 For the 1946 and 1980–84 cohorts we have also checked whether or not coding all
occupational information into SOC90 makes any substantial difference to cohort members‟
allocation to NS-SEC classes. For the 1946 cohort we have not found any large effect of
mapping information on occupations into SOC90 rather than into other SOC classifications
(see Bukodi and Neuburger 2009). For the 1980–84 cohort we find some differences between
NS-SeC allocations based on SOC90 and on SOC2000 (Waller 2013), but not sufficient to
outweigh the advantages for comparative purposes of using the same, SOC90 basis for all of
our four cohorts.
4 Here and in what follows, we refer, simply as a convenience, to the class destinations of
members of the 1980–4 cohort as being taken at age 27, although, as earlier noted, they were
in fact taken within the age–range 24–30.
5 The 9-class version of the schema used by Goldthorpe and Mills (2004, 2008) with GHS
data does in fact yield a still lower total mobility rate for men. But this seemingly paradoxical
result comes about because the classes differ unduly in size. When using the GHS data,
Classes I, II and IVa of the Goldthorpe schema have to be collapsed into one, while,

42
following cross-national comparative practice, Goldthorpe and Mills distinguish classes of
farmers (IVc) and agricultural workers (VIIb) which in the British case are very small.
6 The horizontal component of the total mobility rate in the case of men is remarkably stable
across the cohorts at around 30 per cent; in the case of women, it tends to decline from a little
above to a little below 30 per cent.
7 As can be seen from the hierarchical ordering of classes indicated in Tables I and II,
downward mobility can occur in other ways than from Class 1 and 2 origins and likewise
upward mobility in other ways than from Class 6 and 7 origins. But the aspects of vertical
mobility on which we concentrate are numerically as well as sociologically the most
important.
8 It is in fact in this respect that analyses based on the data deriving from our multiple
imputation exercise chiefly differ from analyses of „complete cases‟ – the latter indicating
steadily increasing fluidity. This outcome is in line with the suggestion previously made
(Goldthorpe 2007: vol. 2, ch. 7, n. 34) that such a finding could result from increasingly
biased non–response, relating, especially, to respondents from disadvantaged backgrounds.
9 We are grateful to Michelle Jackson for help she provided in this work.
10 Two further minor differences are that we take women‟s class destinations at ages 27 and
38 rather than at age 33 (1958 cohort) and 30 (1970 cohort) and that we use information on
father‟s class at age 16 if not available at age 11 (1958 cohort) or 10 (1970 cohort).
11 Goldthorpe and Jackson use the approximate version of the Goldthorpe schema that can be
obtained via SEGs. However, in our comparative analyses we have in fact used the full

43
version obtained via the standard algorithms based on SOC90 and related employment status
codes.
12 Although the selected odds ratios shown in Table V are generally lower for women than for
men, this should not be taken to mean that social fluidity overall is greater among women.
Preliminary comparisons of our mobility tables for men and women suggested that fluidity
was in fact less among women than among men in the 1946 cohort but then increased so as to
be above the level for men for the 1970 cohort. However, this is one case in which the checks
that can be made with these two cohorts using the full version of NS-SEC suggest caution,
and the matter is one we will investigate further.