the nafta preference and u.s.-mexico trade · pdf filethe nafta preference and u.s.-mexico ......
TRANSCRIPT

No. 2002-10-A
OFFICE OF ECONOMICS WORKING PAPER U.S. INTERNATIONAL TRADE COMMISSION
Laurie-Ann Agama U.S. International Trade Commission
Christine A. McDaniel
U.S. International Trade Commission
October 2002 The authors are with the Office of Economics of the U.S. International Trade Commission. Office of Economics working papers are the result of the ongoing professional research of USITC Staff and are solely meant to represent the opinions and professional research of individual authors. These papers are not meant to represent in any way the views of the U.S. International Trade Commission or any of its individual Commissioners. Working papers are circulated to promote the active exchange of ideas between USITC Staff and recognized experts outside the USITC, and to promote professional development of Office staff by encouraging outside professional critique of staff research.
Address correspondence to: Office of Economics
U.S. International Trade Commission Washington, DC 20436 USA
The NAFTA Preference and U.S.-Mexico Trade

The NAFTA Preference and U.S.-Mexico Trade*
Laurie-Ann Agama
Christine A. McDaniel
October 2002
Draft - Please comment
Abstract: This paper focuses on the U.S. tariff preference afforded to Mexico vis-à-vis non-NAFTA trading partners, and allows us to evaluate the impact of NAFTA in a manner consistent with the idea behind a preferential trading agreement. The estimation technique exploits the time-varying dimension of the tariff preference, over 1983 to 2001. We find that a higher tariff preference corresponds to increased U.S. import demand for goods, and that import demand was more responsive to changes in the tariff preference once NAFTA was in place than it was on average.
*The authors are with the Office of Economics, U.S. International Trade Commission, Washington, D.C. Office of Economics working papers are the result of ongoing professional research of the USITC staff and are solely meant to represent the opinions and professional research of the individual author. The views in this paper should not be attributed in any way to the U.S. International Trade Commission or any of its individual Commissioners. Working papers are circulated to promote the active exchange of ideas between USITC Staff and recognized experts outside the USITC, and to promote professional development of staff by encouraging outside professional critique of staff research. Any errors remain are our own.

1
1. Introduction
Since 1993, U.S. trade has grown more quickly with NAFTA partners than with non-NAFTA
partners. U.S.-Mexico trade in particular has expanded significantly and rapidly. Since 1993 when
NAFTA was announced, trade data from the U.S. Department Commerce indicate that real U.S. exports
to Mexico have increased by 93 percent, compared to 35 percent for Canada and 20 percent for non-
NAFTA partners. Real U.S. imports from Mexico have increased by 190 percent, compared to 69 percent
for Canada and 59 percent for non-NAFTA partners.
How much of this trade growth can be attributed to NAFTA is a question of considerable interest.
However, NAFTA is not a particularly clean policy to assess. To what extent trade growth can be
attributed to NAFTA is obscured by several pre- and post-NAFTA events and policy changes. Mexico’s
unilateral trade liberalization and domestic reforms occurred well before NAFTA was implemented in
1994.1 The establishment of the World Trade Organization and its associated agreements in 1995, other
bilateral and sectoral trade negotiations (Mexico-Chile in 1999, Mexico-EC and Mexico-Israel in 2000),
Mexico’s exchange rate policy change in 1994, and the business cycle further confound the identification
of the effects of NAFTA. Further, Mexico has been increasing its presence in not only the U.S. market
but in nearly every major region’s marketplace since 1994.
Prior to NAFTA, several studies projected economy wide impacts of NAFTA, using applied
general equilibrium models.2 The results converged on the main finding that NAFTA would provide
positive gains to member countries, namely, large and positive effects on the Mexican economy, and
1 In the mid-1980s, Mexico took significant steps towards domestic reform and trade liberalization, resulting in a reduction in the average ad valorem tariff from about 25 percent to 13 percent over 1985 to 1993. Increased trade corresponded with Mexico’s unilateral trade liberalization, and Mexico’s total trade (in nominal terms) increased 186 percent over 1985 to 1993 and further by 128 percent over 1993 to 1999. Mexico’s GDP increased 119 percent during these pre-NAFTA years, and further by 20 percent following NAFTA. 2 Burfisher, Robinson and Thierfelder (2001) provide a comprehensive analysis of the debate and actual post-NAFTA data, a review of simulation analyses that projected economy wide impacts of NAFTA, and, in drawing lessons from the NAFTA debacle, the authors provide a context in which to consider future FTAs.

2
small and positive effects on the U.S. economy. Minimal effects on the Canadian economy were
expected as most bilateral trade barriers were eliminated, or had begun to be phased-out, with the 1989
Canada-U.S. FTA (see Brown, Deardorff and Stern (1992) and Brown (1992) for taxonomy of the AGE
results from studies prior to NAFTA).
There have been relatively few econometric studies of the trade effects of NAFTA. Some of the
first studies to econometrically examine the trade effects of NAFTA typically employed a time series
estimation approach. Due largely to data limitations, blunt instruments such as time dummy variables
were used to capture the effects of NAFTA.3 Using a gravity model approach at the macro level, Gould
(1998) finds that both U.S. imports from Mexico and U.S. exports to Mexico were about 16 percent
higher on average each year, over 1994-1996 due to NAFTA. This translates into a cumulative impact of
about $20.5 billion in imports, and $21.3 billion in exports, over that period. Also using a gravity model
approach, Krueger (1999) finds that NAFTA did not have large effects on trade relative to other factors.
Recent studies attempt more direct measures of the Agreement. Romalis (2001) exploits the
cross-commodity variation in the actual U.S. tariff preference that is afforded to Canada and Mexico vis-
à-vis non-NAFTA partners in 2001. He finds that the industries with the larger preferences also
experience larger changes in U.S. import share. Beginning in 1994, Mexican trade appears to very
rapidly respond to NAFTA preferences, with each 1 percentage point change in the preference linked to a
0.18 to 0.28 percentage point rise in Mexico’s share of U.S. imports.
Another recent study that uses tariff data to examine trade effects is Clausing (2001) who
examines the US-Canada FTA. Clausing examines the responsiveness of import shares to tariff changes
from that Agreement at the product level and finds substantial trade creation effects. To our knowledge,
we are the first to exploit the time variation in the tariff preference and consider a responsiveness of
import demand to the actual tariff preference while isolating the NAFTA preference.

3
In this paper we estimate the effects of NAFTA on U.S. import demand for Mexican goods and
Mexico’s demand for U.S. exports, using tariff data to capture the actual policy changes over time. Tariffs
have been coming down across the globe, and North American tariffs began to decline long before
NAFTA. Thus, in order to observe the relevant policy change from the preferential trading agreement,
we use the actual tariff preference afforded to Mexico vis-à-vis non-NAFTA trading partners. This
allows us to isolate the observed policy change in a manner consistent with the idea behind a preferential
trading agreement. We exploit the time-varying dimension of the tariff preference over 1989 to 2001 on
the import side (due to data limitations we begin at 1989). We examine the tariff preference over 1993 to
2001 on the export side. Mexico did not grant the U.S. a tariff preference prior to NAFTA.
U.S. import demand for Mexican goods and Mexico’s demand for U.S. goods both appear to be
responsive to changes in the actual tariff preference, that each country affords to the other relative to its
non-NAFTA trading partners. On average, a one percentage point increase in the tariff preference
corresponds to somewhere between an 11.2 and 16.5 percent increase in U.S. import demand for Mexican
goods, and an additional 4.4 to 3.8 percent, respectively, during the NAFTA period. On the export side, a
one percentage point increase in the NAFTA tariff preference corresponds to roughly a 5.1 to 6.7 percent
increase in Mexico’s demand for U.S. goods.
The paper is organized as follows. In section 2, we describe the tariff preference and changes in
North American trade. In section 3 we provide the theoretical framework and section 4 evaluates the
results. The last section concludes.
2. Tariff Preferences and North America Trade
In order to capture the actual preference afforded to Mexico vis-à-vis non-NAFTA trading
partners, we calculate the difference between the tariff rate applied to imports from Mexico and the tariff
3 Gould (1998) and USITC (1997).

4
rate applied to imports from non-NAFTA trading partners. We regard the non-NAFTA rate better than the
often-used MFN rate, particularly at the HTS-6 level, given the various arrangements and trading
agreements that the U.S. has with particular countries, e.g., developing countries (Generalized System of
Preferences), Andean region, and Caribbean countries. Using the MFN rate will tend to over-state the
actual preference.
Applied U.S. tariff rates were calculated as the ratio of calculated duties to customs value. The
tariff preference that the United States affords to Mexico vis-à-vis its non-NAFTA trading partners was
calculated as the difference between the non-NAFTA applied tariff rate and the Mexican applied tariff
rate. The tariff preference was calculated at the 6-digit HTS level, and the average over all lines represents
the aggregate figure. This series goes back to 1989.
We are also interested in the responsiveness of Mexico’s demand for U.S. exports to tariff
preferences. Due to lack of available data for Mexican calculated duties and customs value data, the tariff
preference that Mexico affords to the United States vis-à-vis its non-NAFTA trading partners was
calculated as the difference between Mexico’s MFN rate and the NAFTA rate, according to Mexico’s
NAFTA staging schedule. The difference between these rates represents Mexico’s NAFTA tariff
preference over 1993 to 2001. Mexican tariff data and NAFTA staging schedule are available from the
Official Gazette, Secretary of the Economy of the Mexican Government.
The data in Table 1 shows U.S. average tariffs for Mexico, Canada and the rest of the world in
1989, 1993 and 2001. The U.S. simple average tariff applied to imports from Mexico declined from 4.01
percent in 1989 to 3.15 percent in 1993 before falling further to 0.52 percent in 2001. U.S. simple
average tariff rates applied to Canadian goods followed a similar pattern, although average tariff rates
declined sharply between 1989 and 1993, as the Canada-U.S. FTA was implemented. U.S. simple
average tariffs on goods imported from the rest of the world also declined during this period, albeit at a
much slower pace. The Uruguay Round negotiations, which concluded shortly after NAFTA was signed,
5
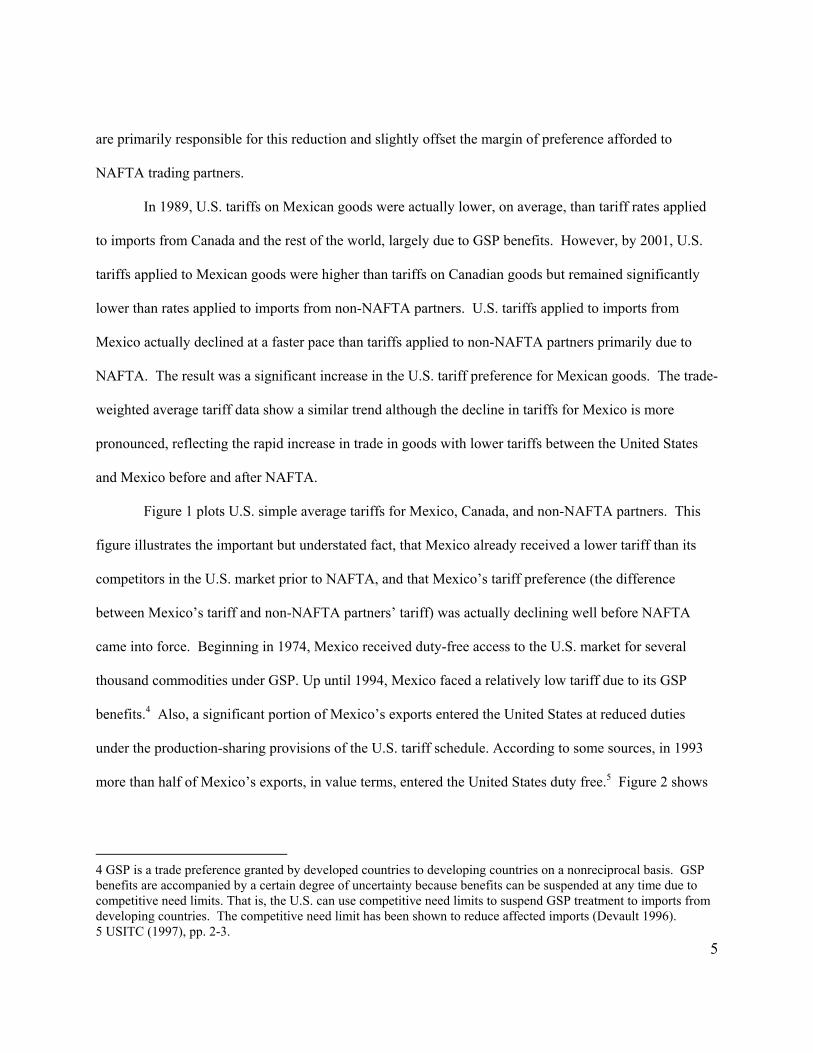
are primarily responsible for this reduction and slightly offset the margin of preference afforded to
NAFTA trading partners.
In 1989, U.S. tariffs on Mexican goods were actually lower, on average, than tariff rates applied
to imports from Canada and the rest of the world, largely due to GSP benefits. However, by 2001, U.S.
tariffs applied to Mexican goods were higher than tariffs on Canadian goods but remained significantly
lower than rates applied to imports from non-NAFTA partners. U.S. tariffs applied to imports from
Mexico actually declined at a faster pace than tariffs applied to non-NAFTA partners primarily due to
NAFTA. The result was a significant increase in the U.S. tariff preference for Mexican goods. The trade-
weighted average tariff data show a similar trend although the decline in tariffs for Mexico is more
pronounced, reflecting the rapid increase in trade in goods with lower tariffs between the United States
and Mexico before and after NAFTA.
Figure 1 plots U.S. simple average tariffs for Mexico, Canada, and non-NAFTA partners. This
figure illustrates the important but understated fact, that Mexico already received a lower tariff than its
competitors in the U.S. market prior to NAFTA, and that Mexico’s tariff preference (the difference
between Mexico’s tariff and non-NAFTA partners’ tariff) was actually declining well before NAFTA
came into force. Beginning in 1974, Mexico received duty-free access to the U.S. market for several
thousand commodities under GSP. Up until 1994, Mexico faced a relatively low tariff due to its GSP
benefits.4 Also, a significant portion of Mexico’s exports entered the United States at reduced duties
under the production-sharing provisions of the U.S. tariff schedule. According to some sources, in 1993
more than half of Mexico’s exports, in value terms, entered the United States duty free.5 Figure 2 shows
4 GSP is a trade preference granted by developed countries to developing countries on a nonreciprocal basis. GSP benefits are accompanied by a certain degree of uncertainty because benefits can be suspended at any time due to competitive need limits. That is, the U.S. can use competitive need limits to suspend GSP treatment to imports from developing countries. The competitive need limit has been shown to reduce affected imports (Devault 1996). 5 USITC (1997), pp. 2-3.
6
Mexico’s trade with the United States rose much more sharply than Mexico’s trade with the rest of the
world.
Mexican Reforms Prior to NAFTA
In many ways, NAFTA capped a decade of improved and expanded bilateral trade and
investment ties more than drastically changing these ties. Both U.S. investments into Mexico and U.S
trade with Mexico began to rise sharply before 1994. Prior to NAFTA, Mexico significantly liberalized
its trade regime by reducing tariffs on an MFN basis and eliminated quantitative restrictions on imports.
In 1986, Mexico joined the General Agreement on Tariffs and Trade (GATT), and as part of its accession
agreement, Mexico reduced and bound its tariffs. Mexico also committed to other trade-enhancing
reforms. Indeed, much of the increase in Mexico’s domestic production and international trade over the
past two decades occurred prior to 1994, and begins with Mexico’s domestic reform and unilateral trade
liberalization in the mid-1980s.
NAFTA
While the signing of NAFTA eliminated GSP treatment for goods imported from Mexico,
NAFTA provisions addressed both tariffs and nontariff barriers to trade and investment. The Agreement
removed tariffs on goods over a 15-year period, established disciplines that covered a broad range of
nontariff barriers, committed the signatories to high security levels and openness for foreign direct
investors and intellectual property rights owners, liberalized services trade, and created dispute settlement
mechanisms.6
Figure 3 graphs the tariff preference that the U.S. has afforded Mexico since 1989. This is the
difference between the tariff rate (ad valorem) applied to Mexico and the tariff rate applied to non-
NAFTA partners. As can be seen there is quite a bit of time variation in the preference. The tariff

7
preference for Mexico began increasing under GSP, prior to the implementation of NAFTA, and
continued to increase after 1994. The preference margin for Mexico widened during the post-NAFTA
years as U.S. tariffs on Mexican goods fell more rapidly than U.S. tariffs on goods imported from the rest
of the world. The tariff preference rose in 1991, reached a peak in 1998 and then declined slightly in 2001
as U.S. tariffs against the world continued to decline at a much slower pace.
As can be seen in figure 4, Mexico greatly reduced its tariffs from an initial position of high
tariffs averaging above 25% in 1985 to an average level of 10 percent against all imports by 1999.
Mexico also removed virtually all quantitative restrictions governing most imports by the early 1990s.
Thus, when NAFTA came into effect, the effect of Mexico’s trade liberalization was still influencing
trade flows between the U.S. and Mexico. This complication suggests some caution in the interpretation
of any results regarding the effects of NAFTA.
While a certain amount of the pre-1994 economic growth and trade may have been investment-
induced in anticipation of NAFTA, it remains that NAFTA is not a particularly clean policy to assess.
Herein lies the problem with measuring the effects of NAFTA with blunt instruments such as time
dummy variables.
Table 2 shows the distribution of NAFTA- and non-NAFTA-U.S. trade flows changed from
1993, the year before NAFTA, to 2001, eight years after the agreement was implemented. While U.S.
trade with NAFTA partners increased more than that with the rest of the world, U.S. trade with Mexico
increased by a substantially higher amount than that with Canada. Mexico’s increased importance in U.S.
trade is seen in real terms, as Mexico’s share of U.S. imports increased from 6.7 percent to 11.5 percent,
and the share of U.S. exports destined to Mexico increased from 9.2 to 13.6 over this period.
While on the surface the increased share of Mexico’s imports in the U.S. may be suggestive of
6 See USITC (1997).

8
some trade diversion,7 Mexico also increased its share of imports in nearly every major region of the
world since 1993. Table 3 shows Mexico’s share of imports increased not only in the U.S. but in South
and Central America, Asia and Europe. Prior to NAFTA, Mexico’s share of imports in the world rose
over 1989 to 1993 but that appears largely due to its increased presence in U.S. imports. Since 1993,
Mexico has been exporting more not only to the U.S., but to nearly every major region in the world.
3. Econometric Analysis
Theoretical Framework
The import demand and export demand equations derived from a standard micro-theoretic
framework can be used to estimate trade effects of NAFTA. Much has been written on the theory behind,
and the actual estimation of, the time series behavior of the quantities and prices of merchandise imports
and exports (see Goldstein and Khan 1985). Instead of reviewing the empirical trade literature here, we
focus on the significant developments in the literature that are relevant to our empirical specification.
Following the assumption that neither imports nor exports are perfect substitutes for domestic
goods, we adopt the imperfect substitutes model. This assumption rests on two observations. First,
neither domestic nor foreign goods have full market share, and second, each country imports and exports
goods (see Goldstein and Khan (1985), Magee (1975), and Rhomberg (1973) for discussion on the
competing models). Suppose that the consumer maximizes utility subject to a budget constraint, and the
resulting demand for imports (and exports) can be expressed as a function of income levels in the
importing region, the import (export) good’s own price, and the domestic substitute price. An imperfect
substitutes model of U.S. imports with Mexico can be presented generally as:
( )ePPIYfI USUSUSUSd ,,,, = (1)
7 See Krueger (1999) for discussion on trade creation and trade diversion under NAFTA.
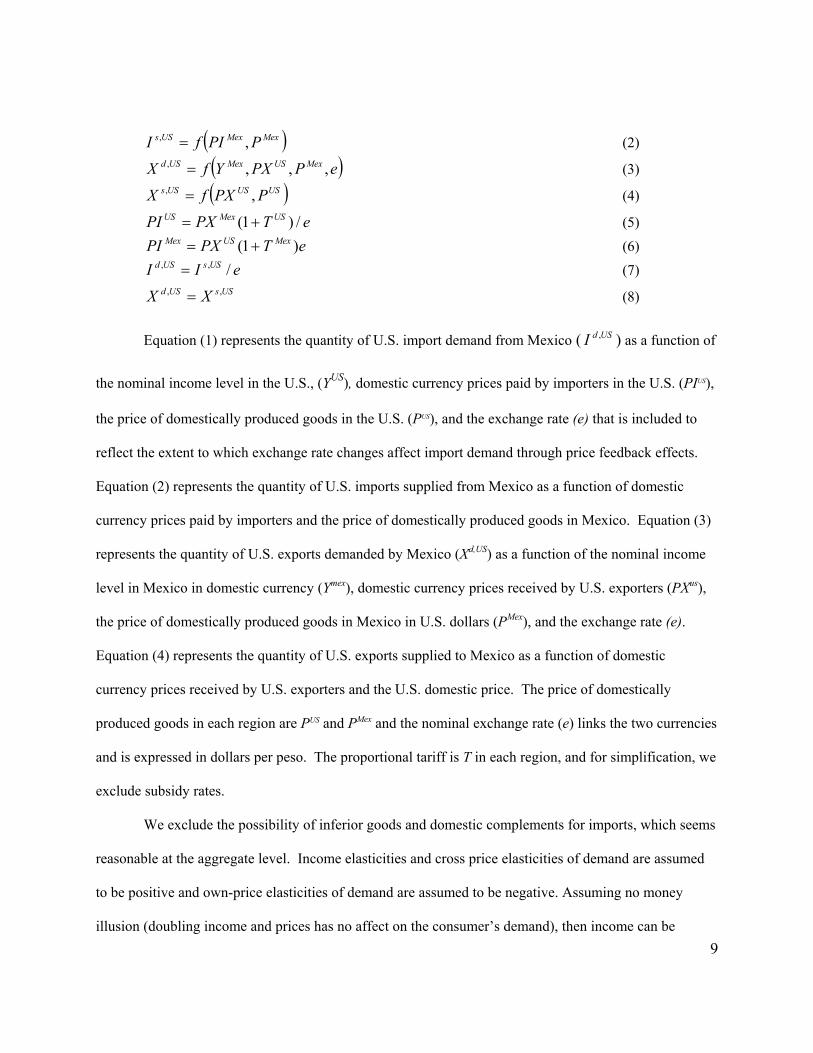
9
( )MexMexUSs PPIfI ,, = (2)
( )ePPXYfX MexUSMexUSd ,,,, = (3)
( )USUSUSs PPXfX ,, = (4)
eTPXPI USMexUS /)1( += (5) eTPXPI MexUSMex )1( += (6)
eII USsUSd /,, = (7) USsUSd XX ,, = (8)
Equation (1) represents the quantity of U.S. import demand from Mexico ( USdI , ) as a function of
the nominal income level in the U.S., (YUS), domestic currency prices paid by importers in the U.S. (PIUS),
the price of domestically produced goods in the U.S. (PUS), and the exchange rate (e) that is included to
reflect the extent to which exchange rate changes affect import demand through price feedback effects.
Equation (2) represents the quantity of U.S. imports supplied from Mexico as a function of domestic
currency prices paid by importers and the price of domestically produced goods in Mexico. Equation (3)
represents the quantity of U.S. exports demanded by Mexico (Xd,US) as a function of the nominal income
level in Mexico in domestic currency (Ymex), domestic currency prices received by U.S. exporters (PXus),
the price of domestically produced goods in Mexico in U.S. dollars (PMex), and the exchange rate (e).
Equation (4) represents the quantity of U.S. exports supplied to Mexico as a function of domestic
currency prices received by U.S. exporters and the U.S. domestic price. The price of domestically
produced goods in each region are PUS and PMex and the nominal exchange rate (e) links the two currencies
and is expressed in dollars per peso. The proportional tariff is T in each region, and for simplification, we
exclude subsidy rates.
We exclude the possibility of inferior goods and domestic complements for imports, which seems
reasonable at the aggregate level. Income elasticities and cross price elasticities of demand are assumed
to be positive and own-price elasticities of demand are assumed to be negative. Assuming no money
illusion (doubling income and prices has no affect on the consumer’s demand), then income can be
10
expressed in real terms and import prices can be expressed in terms relative to the domestic price.
Aggregation issues
Aggregate data are used for our estimation purposes. One advantage of aggregate data is
avoiding the measurement errors of disaggregated data, and the consequent misspecification in the
disaggregated functions. The well-known concern with aggregate data is aggregation bias and that the
sectoral aggregation is veiling changes in the sectoral composition.8 The main issue of concern on
aggregate data for our purposes is whether the variation in the applied tariff rate (calculated as collected
duties divided by customs value) reflects changes in the tariff rate over time or compositional changes.
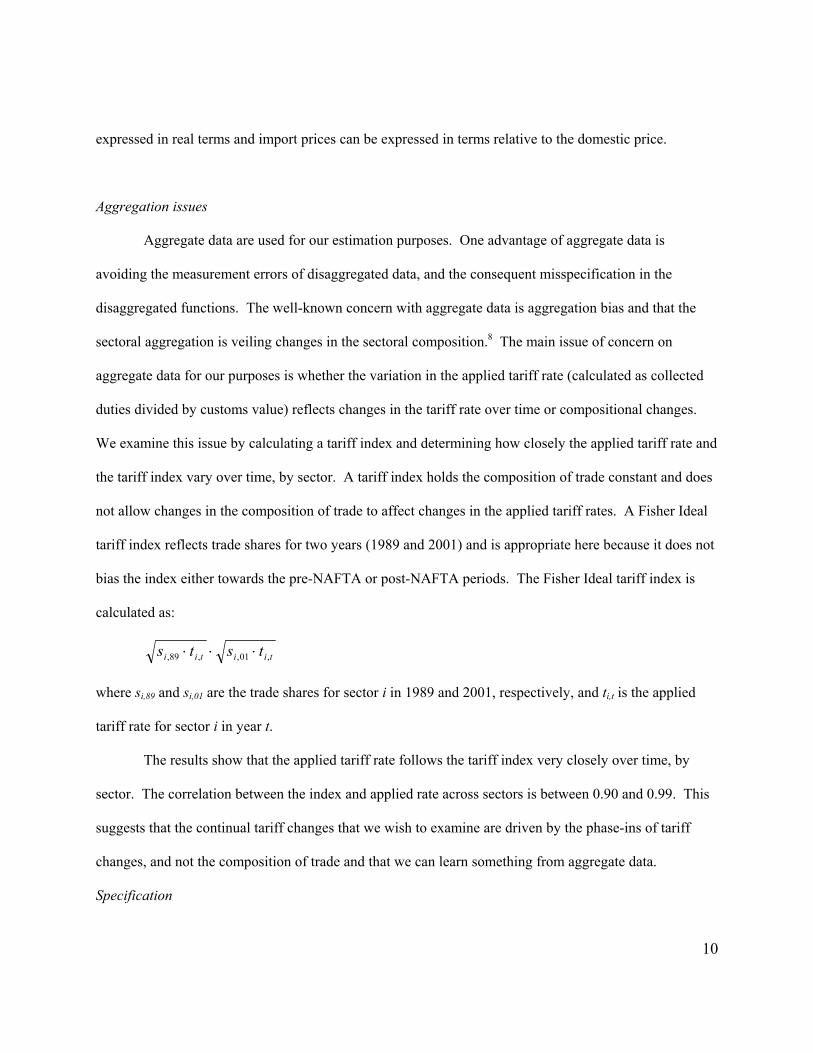
We examine this issue by calculating a tariff index and determining how closely the applied tariff rate and
the tariff index vary over time, by sector. A tariff index holds the composition of trade constant and does
not allow changes in the composition of trade to affect changes in the applied tariff rates. A Fisher Ideal
tariff index reflects trade shares for two years (1989 and 2001) and is appropriate here because it does not
bias the index either towards the pre-NAFTA or post-NAFTA periods. The Fisher Ideal tariff index is
calculated as:
tiitii tsts ,01,,89, ⋅⋅⋅
where si,89 and si,01 are the trade shares for sector i in 1989 and 2001, respectively, and ti,t is the applied
tariff rate for sector i in year t.
The results show that the applied tariff rate follows the tariff index very closely over time, by
sector. The correlation between the index and applied rate across sectors is between 0.90 and 0.99. This
suggests that the continual tariff changes that we wish to examine are driven by the phase-ins of tariff
changes, and not the composition of trade and that we can learn something from aggregate data.
Specification

11
The theoretical relationship between prices and quantities is simultaneous. However, in practice,
the supply side is often addressed only by assumption. The prevailing practice in the time series work on
import and export equations has been to assume that the price elasticity of supply for imports and exports
is infinite. This is appealing because it allows single equation estimation of import and export demand.
A popular argument for this assumption is that firms are operating at less than full capacity and prices are
less than flexible. A decrease in demand would lead firms to cut production instead of price; an increase
in demand would cause firms to increase their capacity (but would not affect prices). In other words, the
supply curve remains flat until all firms have reached full capacity.
If the supply elasticities are less than infinite, then one should estimate the full structural
simultaneous model or solve for and estimate the reduced form expressions for quantities and prices as
functions of only the exogenous variables in the system. In a broad survey of the estimation of trade
equations, Goldstein and Kahn (1985, p. 1048) maintain that the infinite supply elasticity assumption is
probably more defensible for a country’s imports than for its exports. They point out that it is unlikely
that a large country can increase its export supply at a constant price unless a large pool of unemployed
resources exists. Thus, below we test whether the domestic price is endogenous in the import and export
demand equation. Results from tests for endogeneity suggest that domestic prices are endogenous in each
trade equation. Therefore we estimate equation (1) using 2SLS, with the exogenous variables from (1)
and (2) as instruments. Similarly, we estimate equation (3) using 2SLS, with the exogenous variables
from (3) and (4) as instruments.
Another specification issue is how to treat import prices and domestic prices in the import
demand regression, and export prices and domestic competing prices in the export demand regression.
There is precedent for using relative prices. However, there is also support for including them separately.
Relative prices in the specification essentially constrain the demand elasticities to be equal in magnitude
8 See Goldstein and Khan (1985) and Madalla (1977).

12
but opposite in sign. That is, the import (export) demand elasticity with respect to import (export) prices
to be equal in magnitude but opposite in sign to the elasticity with respect to domestic (foreign) prices.
Houthakker and Magee (1969) estimate import and export demand elasticities for many countries as a
function of income and relative prices. Specifically, they include the price of imports relative to the price
of domestic goods in the import demand equation, and the price of exports relative to the price of
competing goods in the foreign market. Their results are encouraging as they find positive income
elasticities and negative price elasticities. However, Murray and Ginman (1976) explicitly test the
constraint that the demand elasticities are equal in magnitude but opposite in sign and find that their
results reject this hypothesis. They argue that prices in import demand models should be included
separately else the model will be misspecified. For these purposes, we include the U.S. domestic price
and competing Mexican import price variables separately in the import demand equation; and, we include
the Mexican domestic price and competing U.S. export price variables separately in the export demand
equation.
Finally, because U.S. imports from Mexico face competition not only from U.S. producers, but
also from “third country” import sources, we include the Mexican import price relative to the price of
competing imports. Similarly, we include the U.S. export price relative to the price of competing exports
in the export demand equation, which captures the dominant relative price competition that occurs among
exports.
The estimated import demand equation is:
tttUSt
USt
USt
USdt PESOPREFeppiyi εββββββα +++++++= 654321
, (9)
and the estimated export demand equation is:
tttmext
mext
mext
USdt DOMLIBPESOPREFeppxyx εβββββββα ++++++++= 765421
, 3
(10)

13
where the actual tariff preference is denoted as PREF. The lower case letters represent variables in
logarithmic form. Time dummy variables were used to control for the peso crisis (PESO) during the last
quarter of 1994 and first quarter of 1995 and the domestic liberalization regime change (DOMLIB) during
1985 to 1988. The domestic liberalization period is only singled out in the export demand equation.
Equation (9) represents U.S. import demand for Mexican goods and equation (10) represents Mexican
demand for U.S. exports. Due to evidence of serial correlation, a first order autoregressive specification
with a multiplicative seasonal autoregressive term was included.9
Data
The data set used for the estimation is aggregate and covers the time period 1983 to 2001 on a
quarterly basis. The real value of imports and exports was used to represent import and export quantity.
U.S. Department of Commerce provides U.S. trade data and calculated duties at the 6-digit HTS level.
Applied U.S. tariff rates were calculated as the ratio of calculated duties to customs value. Mexican tariff
data and Mexico’s NAFTA staging schedule are available from the Official Gazette, Secretary of the
Economy of the Mexican Government.
BEA provides import and export price indices, which we used to deflate customs value of U.S.
imports from Mexico. U.S. personal consumption expenditures represent income in the import demand
equation, and Mexican per capita GDP represents domestic income in the export demand equation. BLS
provides the CPI, GDP and personal consumption expenditure data for the U.S., and Instituto Nacional de
Estadistica, Geografia e Informatica (INEGI) reports most of these data for Mexico. The IMF provides the
nominal exchange rate.
9 With both an AR(1) and SAR term, the error term is a first order autoregressive process with multiplicative seasonal autoregressive terms, and the results from Durbin-Watson tests and Breusch-Godfrey Lagrange multiplier tests for general, high-order, ARMA errors indicated no serial correlation in the residuals. In addition, results from Ramsey’s regression specification error test indicated no evidence

14
4. Results
The econometric results for U.S. import demand are reported in table 4. The first set of results is
from the specification that uses the simple NAFTA dummy variable. The second set reports results from
the specification that uses the tariff preference variable, and the third set included the preference variable
interacted with the NAFTA time dummy variables. While the peso crisis was economically important, the
peso dummy (PESO) was not always statistically significant. One possible reason for this could be that
the nominal exchange rate variable is capturing the effect of the peso crisis. Thus, we report results with
and without the peso crisis dummy variable.
While our interest is in the coefficients on the preference variables, it is useful to consider the
resulting coefficients on the other variables in the equation. Income and the nominal exchange rate
explained much of the variation in import demand. As expected, increased income corresponds to
increased import demand, and as the peso depreciated with respect to the dollar, import demand rose. The
sign on the relative import price was positive, not as expected, but it was not significant except in the
third specification. One possible explanation for this is measurement error due to using the Mexican
domestic price index as a proxy for the Mexican import price. Another possible explanation is an upgrade
in quality and variety of Mexican imports, but this is just a conjecture; we can make no conclusive
statement on this point. The coefficient on domestic price was positive but not significant, indicating
possibly that domestic and Mexican import goods are not close substitutes, at least not on the aggregate
level on which this analysis was conducted.
Considering the first set of results, the coefficient on NAFTA time dummy variable is positive
and statistically significant, and indicates that U.S. import demand for Mexican goods was approximately
0.10 percent higher over the last quarter of 1993 to the end of 2001 than for the entire period. This
of specification error.

15
coefficient cannot explain the trade effect of NAFTA per se since it is capturing not only NAFTA but all
other events during these years that affected trade. Some of these events may have positively affected
trade; others may have negatively affected trade. This result reflects the net effect of all trade-related
events during this period.
The second set of results suggests that U.S. import demand is responsive to the tariff preference.
The coefficient on the tariff preference variable captures the overall responsiveness of import demand to
the tariff preference (shown in figure 3) over the entire period, whether due to GSP, NAFTA, or another
program. Overall, controlling for the peso crisis, each one percent increase in the U.S. tariff preference for
Mexico corresponds to approximately 18.6 percent increase in U.S. import demand for Mexico’s goods,
and 19.4 not controlling for the peso crisis.
Next, we examine whether the responsiveness to the tariff preference is different from the average
responsiveness over the entire period. Interestingly, the results indicate that the response to the NAFTA
preference was higher than the average response. Each one percent increase in the tariff preference for
Mexico corresponds to approximately a 16.5 percent increase in U.S. import demand for Mexico’s goods,
and an additional 3.8 percent, respectively, during the NAFTA period controlling for the peso crisis (and
11.2 and 4.4 not controlling for the peso crisis); the coefficients are statistically significant. The PESO
variable was significant in this specification and thus the latter set of results is probably more valid.
The coefficient on the tariff preference can be interpreted as the implied elasticity of substitution.
Our results suggest that, in general, a one percent increase in the tariff preference corresponds to about a
18.6 percent increase in U.S. import demand for Mexican goods. When the NAFTA period is considered
exclusively, the average responsiveness is about 16.45 percent, and the NAFTA responsiveness is 3.80
percent greater than the average. In other words, on average, the responsiveness of import demand to
changes in the tariff preference was greater during the NAFTA years. This estimate is large relative to
previous estimates of the responsiveness of import demand to price changes. For example, Erkel-Rousse

16
and Mirza (2002) recently estimated trade price elasticities with time series data and reported estimates up
to 13. However, our methodology differs in that we estimate responsiveness to changes in the actual
tariff preference.
Another implication from our results is the impact on trade. Since NAFTA was implemented, the
cumulative impact of NAFTA-related tariff preferences on U.S.-Mexico trade amounts to approximately
$11.2 billion. The econometric results from which this estimate is calculated were statistically significant
at the five percent level and a 95 percent confidence interval suggests a range of the cumulate trade
impact from $9.9 to $12.5 billion. This figure reflects only the tariff preference aspect of NAFTA. It is
interesting to compare it to the trade effects from NAFTA of $20.5 billion found by Gould. Note that
Gould’s figure reflects the trade effects of all aspects of NAFTA as well as all other trade-related events
and so the disparity between our figure and Gould’s is not surprising.
The econometric results for Mexican demand for U.S. exports are reported in table 5. Because our
calculated tariff preference series is only from 1994 through 2001 we can only consider the
responsiveness to the NAFTA tariff preference. On the other hand, the export demand specification was a
somewhat cleaner exercise in that our pricing series match the theoretical specification. The results on the
control variables were generally as expected. Increases in the Mexican domestic price correspond to
increases in U.S. export demand, as expected. Mexico’s per capita GDP is positively and significantly
related to export demand, also as expected. The U.S. export price appears not to be a significant
determinant of export demand. The peso crisis was not significant, again, probably captured in the
nominal exchange rate, which was negative and significant as expected. Mexico’s domestic reform period
appears not to have had a significant affect on export demand in this model.
The first column reports the results from the specification that uses the simple NAFTA dummy
variable for comparative purposes. Mexico’s demand for U.S. exports was positively and significantly
higher during the NAFTA years than overall. The results indicate that demand for U.S. exports was
17
approximately 0.11 percent higher over the last quarter of 1993 to the end of 2000 than for the entire
period. Again, this coefficient cannot explain the trade effect of NAFTA per se since it is capturing not
only NAFTA but also all other events during these years that affected trade.
The second set of results is from the specification that isolates NAFTA with Mexico’s NAFTA
tariff preference afforded to the U.S. relative to its non-NAFTA trading partners. Mexico’s demand for
U.S. exports appears to have responded positively and significantly to the NAFTA tariff preference. A
one percent increase in the tariff preference corresponds to a 6.65 percent increase in Mexico’s demand
for U.S. exports. We note that the responsiveness to the tariff preference is stronger on the import side
than the export side for U.S. trade with Mexico. One possible reason for this is that export demand was
more responsive to other factors, such as the production-sharing arrangements between U.S. and Mexican
industries and the related investment provisions. However, we do not systematically explore these issues
here.
5. Concluding Remarks
In this paper we examine the trade effects of NAFTA and focus on the U.S. tariff preference
afforded to Mexico vis-à-vis non-NAFTA trading partners. This allows us to observe the policy change in
a manner consistent with the idea behind a preferential trading agreement. Prior to NAFTA, Mexico was
receiving U.S. tariff preferences under the U.S. under the Generalized System of Preferences (GSP) and a
sizable share of Mexican exports entered under GSP or at low rates under production-sharing
arrangements. Benefits from these programs, particularly GSP, are granted with a certain degree of
uncertainty, whereas NAFTA tariffs locked in the tariff cuts. Thus, it is informative to exploit the time
variation in the tariff preference to consider the responsiveness of imports to the tariff preference, both in
general and under the FTA. We find that U.S. import demand for Mexican goods is responsive to tariff
preferences, and that responsiveness is greater during the NAFTA years. We also find that Mexico’s

18
demand for U.S. exports was responsive to the NAFTA preference. The increased import demand
responsiveness to the tariff preference was NAFTA was in place could reflect the confidence and
certainty that accompanied the NAFTA-related tariff cuts; it may also reflect the corresponding removal
of nontariff barriers and investment-related provision in NAFTA that indirectly affected trade.

19
References
Brown, Drusilla K., “The Impact of a North American Free Trade Area: Applied General Equilibrium Models,” in N. Lustig, B.P. Bosworth, and R.Z. Lawrence, ed., North American Free Trade: Assessing the Impact, The Brookings Institution, Washington, DC, pp. 26-68.
Brown, Deardorff and Stern, 1992. “A North American Free Trade Agreement: Analytical Issues and a
Computational Assessment,” The World Economy, vol.23, no. 2, pp. 11-29. Burfisher, Mary E., Sherman Robinson and Karen Thierfelder, 2001. “The Impact of NAFTA on the
United States,” Journal of Economic Perspectives, vol. 15, no. 1, Winter 2001, pp. 125-44. Clausing, Kimberly A., 2001. “Trade Creation and Trade Diversion in the Canada-United States Free
Trade Agreement,” Canadian Journal of Economics, vol. 34, no. 3, pp. 676-96. Devault, James, 1996. “Competitive Need Limits and the U.S. Generalized System of Preference,”
Contemporary Economic Policy, vol. 14, no. 4, pp. 58-66. Erkel-Rousse, Helene and Daniel Mirza, 2002. “Import Price Elasticities: Reconsidering the Evidence,”
Canadian Journal of Economics, vol. 35, no. 2, pp. 283 306. Goldstein, Morris and Mohsin S. Kahn, 1985. “Income and Price Effect in Foreign Trade,” in R.W. Jones
and P.B.Kenen, ed., Handbook of International Economics, vol. II. Gould, David M., 1998. “Has NAFTA Changed North American Trade?” Federal Reserve Bank of Dallas
Economic Review, First Quarter, pp. 12-23. Houthakker, Hendrick S. and Stephen P. Magee, 1969. “Income and Price Elasticities in World Trade,
Review of Economics and Statistics, vol. 51, no. 2, pp. 111-25. Kreuger, Anne O., 1999. “Trade Creation and Trade Diversion Under NAFTA,” NBER Working Paper
No. 7429, December. Magee, Stephen P., 1975. “Price, Income and Foreign Trade: A Survey of Recent Economic Studies,” in
P.B. Kenen, ed., International Trade and Finance: Frontiers for Research, Cambridge University Press, Cambridge.
Murray, Tracy and Peter J. Ginman, 1976. “An Empirical Examination of the Traditional Aggregate
Import Demand Model,” Review of Economics and Statistics, vol. 58, no. 1, pp. 75-80. Rhomberg, Rudolph R., 1973. “Towards a General Trade Model,” in R.J.Ball, ed., The International
Linkage of National Economic Models, North-Holland Amsterdam, pp. 9-20. Romalis, John, 2001. “NAFTA’s Impact on North American Trade,” University of Chicago Graduate
School of Business Working Paper. U.S. International Trade Commission, 1997. “Impact of North American Free Trade Agreement on the
20
U.S. Economy and Industries: A Three Year Review,” Washington, DC.

21
Figure 1. U.S. Tariffs for Mexico, Canada, and Non-NAFTA Parners
0
0.01
0.02
0.03
0.04
0.05
0.06
1989
1990
1991
1992
1993
1994
1995
1996
1997
1998
1999
2000
2001
US
Sim
ple
Aver
age
Tari
ff
Mexico Canada Non-Nafta Partners

22
Figure 2. Mexican Trade with the United States and Rest of World, US$, billions
Mexican Trade with the United States and Rest of World, $ bln
020406080
100120140
1980
1982
1984
1986
1988
1990
1992
1994
1996
1998
Exports to U.S.Imports from U.S.Exports to ROWImports from ROW

23
Figure 3. NAFTA preference for Mexico, 1989-2001
Nafta preference for Mexico, 1989-2001
0
0.005
0.01
0.015
0.02
0.025
0.03
0.035
0.04
1989 1990 1991 1992 1993 1994 1995 1996 1997 1998 1999 2000 2001
Simple Trade-weighted

24
Figure 4. Mexican Tariff Liberalization (1993-1999)
2423 23
11 1113
11
13 13 13 14 13 13 13 13
101012141618202224
1983
1984
1985
1986
1987
1988
1989
1990
1991
1992
1993
1994
1995
1996
1997
1998
1999
Avg.
Unw
eigh
ted
Tari
ff Ra
te

25
Figure 5. Mexico’s Real GDP, constant 1995 $ millions (1980-1999)
22.22.4
2.62.8
33.2
3.43.6
1980
1981
1982
1983
1984
1985
1986
1987
1988
1989
1990
1991
1992
1993
1994
1995
1996
1997
1998
1999

26
Table 1: Simple and Trade-Weighted Average Tariffs on Mexico, Canada, and World (ad valorem) Simple Average Trade-Weighted
Mexico Canada World Mexico Canada World
1989 4.01 % 4.33 % 5.39 % 3.13 % 0.82 % 3.44 %
1993 3.15 % 2.35 % 4.54 % 2.07 % 0.37 % 3.19 %
2001 0.52 % 0.45 % 2.67 % 0.18 % 0.04 % 1.64 %
Table 2: Value of U.S. Goods Trade with Mexico, Canada, and the rest of the world, billions of 2001 US$, 1993 and 2001
U.S. Imports from: 1993 Share of
U.S. trade 2001 Share of
U.S. trade
Growth in Trade over 1993 to 2001
(% change) World 669 1133 70 Mexico 45 .067 131 .115 190 Canada 129 .192 217 .191 69 Rest of World 495 .741 785 .693 59 U.S. Exports to: World 511 666 30 Mexico 47 .092 91 .136 93 Canada 107 .209 145 .217 35 Rest of World 357 .699 431 .647 20
Table 3. Mexico’s Share of World and Region Imports, 1989, 1993, 1999
1989 1993 1999 World 0.83 % 1.37 % 2.44 % U.S. 3.73 % 7.15 % 11.69 % South and Central America 38.75 % 16.04 % 24.55 % Asia 0.30 % 0.13 % 0.16 % Europe 0.20 % 0.17 % 0.23 %

27
Table 4. The Tariff Preference and U.S. Import Demand NAFTA Dummy Tariff Preference Tariff Preference and
NAFTA NAFTA Dummy 0.1015 **
(0.0468) 0.1077 ** (0.0458)
Tariff Preference
18.64 ** (7.10)
19.44 ** (7.768)
16.45 ** (6.41)
11.17 * (6.65)
Tariff Pref*NAFTA
3.80 ** (1.84)
4.43 ** (2.00)
yd 1.1032 *** (0.3709)
1.1361 *** (0.3671)
0.8078 (0.7617)
0.9768 (0.722)
0.1802 (0.5117)
0.7099 (0.4847)
pm 0.1676 * (0.0988)
0.1502 (0.0944)
0.4564 * (0.2396)
0.393 * (0.222)
0.6826 *** (0.1616)
0.4995 *** (0.1494)
pd 0.0089 (0.0064)
0.0086 (0.0065)
0.0041 (0.0063)
0.0029 (0.006)
0.0047 (0.0056)
0.0011 (0.0056)
Exchange rate 0.1586 *** (0.0438)
0.1608 *** (0.0429)
0.0497 (0.1036)
0.0521 (0.1043)
-0.0197 (0.0832)
0.0545 (0.0808)
Peso 0.0388 (0.0441)
0.0397 (0.0362)
0.0611 * (0.0328)
Constant 8.10 *** (2.71)
7.86 *** (2.67)
10.617 * (5.804)
9.32 (5.54)
15.79 *** (3.81)
11.79 *** (3.63)
F-statistic PV of F-statistic D-W-statistic Std.error of reg. No. of obs.
1373 0.00 2.01 0.0559 48
1529 0.00 2.01 0.0559 48
985 0.00 2.03 0.0434 50
1095 0.00 2.02 0.0436 50
1067 0.00 1.95 0.04 50
1209 0.00 1.94 0.04 50
Note: Standard errors are in parentheses. *** indicates statistical significance at the 10 percent level, ** indicates significance at the 5 percent level, and * indicates significance at the 1 percent level.

Table 5. The Tariff Preference and Mexican Demand for U.S. Exports NAFTA Dummy NAFTA Tariff
Preference NAFTA Preference
5.146 ** (2.216)
6.654 ** (2.595)
NAFTA Dummy 0.1095 * (0.0615)
0.1115 * (0.0605)
yd 0.3182 *** (0.0659)
0.3091 *** (0.0647)
0.3276 *** (0.0673)
0.3355 (0.0706)
Px 0.0106 (0.0143)
0.0149 (0.0143)
0.0082 (0.0137)
0.0045 (0.0137)
pd 0.0051 *** (0.0016)
0.0056 *** (0.0015)
0.0042 ** (0.0017)
0.0037 ** (0.0018)
Exchange rate -0.1566 * (0.0819)
-0.1841 ** (0.0809)
-0.1706 ** (0.0829)
-0.1814 ** (0.0866)
Peso -0.0463 (0.0531)
-0.0405 (0.0505)
DMT 0.0314 (0.0768)
0.0360 (0.0773)
0.0381 (0.0749)
0.0375 (0.0748)
Constant 14.75 *** (1.15)
14.40 *** (1.15)
14.94 *** (1.08)
15.25 *** (1.082)
F-statistic PV of F-statistic D-W-statistic Std.error of regression No. of obs.
866 0.00 2.01 0.062 70
960 0.00 2.00 0.062 70
881 0.00 1.98 0.061 70
943 0.00 1.97 0.062 70
Note: Standard errors are in parentheses. *** indicates statistical significance at the 10 percent level, ** indicates significance at the 5 percent level, and * indicates significance at the 1 percent level.