yr10extensionmath.wikispaces.comyr10extensionmath.wikispaces.com/file/view/ch08.pdf · rockets the...
TRANSCRIPT

C H A P T E R
Quadratic graphs
What you will learn8.1 Plotting quadratic graphs
8.2 Investigating the transformations of f(x) � x2
8.3 Sketching with transformations
8.4 Sketching quadratic graphs using factorisation
8.5 Sketching quadratic graphs using turning-point form
8.6 Sketching quadratic graphs using the quadratic formula
8.7 Applications of quadratics
8.8 Modelling with quadratics
8
0521681774c08_p330_365.qxd 8/11/06 12:16 PM Page 330

RocketsThe National Aeronautics and SpaceAdministration (NASA) in the USA hassent many rockets into space, as haveother countries such as Russia andFrance. Some of these rockets deploysatellites which travel our solar systemcollecting information about otherplanets. The path that these travelwhen leaving earth forms a parabolicshape, and the equation used tomodel it involves This is due to theway gravity acts on moving objects.The distance that things fall dependson the square of the time for whichthey are falling.
x2.
VELSNumber
Use calculators for arithmeticcomputations and rationalapproximations of irrational numbersCarry out exact arithmeticcomputations involving square roots ofprime numbers and rational numbersthat are not perfect squaresCarry out computations to a requiredaccuracy in terms of decimal place
StructureApply algebraic properties to rearrangeformulas, rearrange and simplifyalgebraic expressions, and verify theequivalence of algebraic expressionsIdentify quadratic functions by table,rule and graphRecognise and explain the roles of theconstants in f (x) � a (x � b)2 � cSolve equations of the form f (x) � k,where k is a real constant, andsimultaneous linear and quadraticequations
Working mathematicallyFormulate generalisations andarguments in natural language andsymbolic form for quadratic functions.Use technology to analyse thequadratic functionRepresent relationships inmathematical terms of the features of the context being modelledRoutinely make judgements about the reasonableness of calculations
0521681774c08_p330_365.qxd 8/11/06 12:16 PM Page 331

Do now
Skillsheet
T EACHE R
332 Essential Mathematics VELS Edition Year 10
1 Factorise the following.
a bc de f
2 Factorise the following by completing the square.
a b
3 Solve the following quadratic equations.
a b
4 Use the discriminant to determine the number of solutions to the followingequations.
a b c
5 Solve the following using the quadratic formula.
a b
6 For the graph state the coordinates of the:
a x interceptsb y interceptc turning point
7 For the following functions:
a b cDetermine:i f(0) ii iii f(5) iv
Answers1 a b c d e
f 2 a b 3 a or
b 4 a 0 solutions b 2 solutions c 1 solution 5 a b or
6 a (0, 0) and (2, 0) b (0, 0) c 7 a i ii iii ivb i ii iii iv c i ii iiiiv no solution
f (5) � 3f (�1) � 3f (0) � 3�53f (5) � �20f (�1) � �2f (0) � �5
�32f (5) � 13f (�1) � 1f (0) � 3(1, �1)
�13x � 2x �
�9 ; 2772
x � 4x � 0
x � 33(x � 2 � 26)(x � 2 � 26)(x � 4 � 215)(x � 4 � 215)3(x � 3)(x � 4)
(x � 16)(x � 1)(x � 5)(x � 4)(x � 4)(x � 1)(11x � 6)(11x � 6)(x � 4)(x � 4)
5x: f (x) � 06f (�1)
f (x) � 3f (x) � �3x � 5f (x) � 2x � 3
3x2 � 7x � 2 � 0x2 � 9x � 1 � 0
3x2 � 6x � 3 � 0x2 � 3x � 2 � 03x2 � 2x � 4 � 0
(b2 � 4ac)
x2 � 8x � 16 � 0x2 � 3x � 0
3x2 � 12x � 6x2 � 8x � 1
3x2 � 21x � 36x2 � 15x � 16x2 � 9x � 20x2 � 5x � 4121x2 � 36x2 � 16
x
y
0–1 1 2 3–1
1
2
3
0521681774c08_p330_365.qxd 8/11/06 12:16 PM Page 332

Chapter 8 — Quadratic graphs
8.1 Plotting quadratic graphs
333
Linear relations that were dealt with previously took the form of where m, c were constants. With these graphs wewere able to see some key features, including gradient, x interceptsand y intercepts. Drawing the set of points equidistant from apoint and a line produces a new type of graph. It is a smoothcontinuous curve called a parabola, based on the quadraticrelation
A quadratic relation is a function, hence we can use the notation or
Parabolas can be sketched over a given set of x values (the domain) which produces a set ofy values (the range).
f (x) � py � py � x2.
y � mx � c,
Key ideas
QQuuaaddrraattiicc rreellaattiioonnss, now defined as where a, b, c are constants and produce graphs called ppaarraabboollaass.
The key features of a parabola are:1 the turning point: a maximum or a minimum 3 the x intercepts (can be 0, 1 or 2 intercepts)2 the axis of symmetry 4 the y intercept
For endpoints, use an open circle for non-inclusive and a closed circle for inclusive.
Set notation, e.g. {x: �1 � x � 2}, or interval notation, e.g. (�1, 2], can be used to describedomain and range.
4
3 3
12
x
y
x
y
1
2
4x
y
4
3
2 1
3x
y
2
1 3 4
a � 0,f (x) � ax2 � bx � c,
Example 1
Determine the following key features of each of the given graphs.
i turning point and its nature ii axis of symmetryiii x-intercepts iv y-intercept
x
y
0–1
–33
(1, –4)
x
y
0–2
–4
0521681774c08_p330_365.qxd 8/11/06 12:17 PM Page 333
Essential Mathematics VELS Edition Year 10334
ExplanationSolution
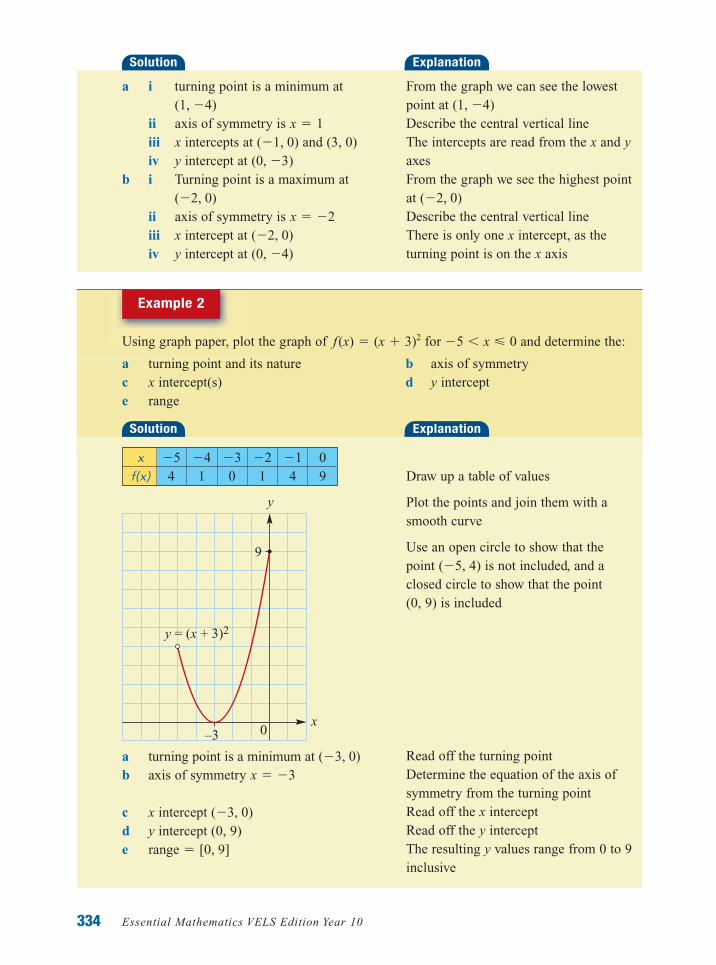
a i turning point is a minimum at
ii axis of symmetry is iii x intercepts at and (3, 0)iv y intercept at
b i Turning point is a maximum at
ii axis of symmetry is iii x intercept at iv y intercept at (0, �4)
(�2, 0)x � �2
(�2, 0)
(0, �3)(�1, 0)
x � 1(1, �4)
From the graph we can see the lowestpoint at Describe the central vertical line The intercepts are read from the x and yaxesFrom the graph we see the highest pointat Describe the central vertical lineThere is only one x intercept, as theturning point is on the x axis
(�2, 0)
(1, �4)
Example 2
ExplanationSolution
Using graph paper, plot the graph of for and determine the:
a turning point and its nature b axis of symmetryc x intercept(s) d y intercepte range
�5 � x � 0f (x) � (x � 3)2
a turning point is a minimum at b axis of symmetry
c x intercept d y intercept (0, 9)e range � [0, 9]
(�3, 0)
x � �3(�3, 0)
Draw up a table of values
Plot the points and join them with asmooth curve
Use an open circle to show that the point (�5, 4) is not included, and aclosed circle to show that the point (0, 9) is included
Read off the turning pointDetermine the equation of the axis ofsymmetry from the turning pointRead off the x interceptRead off the y interceptThe resulting y values range from 0 to 9inclusive
x 0f(x) 4 1 0 1 4 9
�1�2�3�4�5
y
9
x0–3
y = (x + 3)2
0521681774c08_p330_365.qxd 8/11/06 12:17 PM Page 334

TI-nspire
APPE NDIX
Chapter 8 — Quadratic graphs 335
TI 84 plus family TI 89 family
Go to WINDOWand set Xmin at and Xmax at 6,Ymin at and Ymax at 10.Go to and type
To plot press GRAPH.
a Decide whether the turning point is a maximum or a minimum. Press 2ndCALC maximum.
Arrow to the left of the turning point (called the left bound), press ÎÍ.
Arrow to the right of the turning point (called the right bound), press Í.
Arrow to a point close to the turning point and press Í.Turning point is a maximum at (2, 3).
b Axis of symmetry is x � 2.
�x2 � 4x � 1.Y �
�20
�2
Example 3
Plot the graph of over the domain using technology anddetermine:
a the turning point and its nature b the axis of symmetryc the x intercept(s) d the y intercept
�2 � x � 6y � �x2 � 4x � 1
Go to WINDOWand set xmin at and xmax at 6, ymin at �20 and ymax at 10Go to and type To plot press GRAPH.
a Decide whether the turning point is a maximum or a minimum. Press F5 MATH Maximum.
Arrow just to the left of the turning point (called the lower bound), press Í.
Arrow just to the right of the turning point (called the upper bound), pressÍ.
Turning point is a maximum at (2, 3).
b Axis of symmetry is .x � 2
�x2 � 4x � 1.�Y �
�2
0521681774c08_p330_365.qxd 8/11/06 12:17 PM Page 335
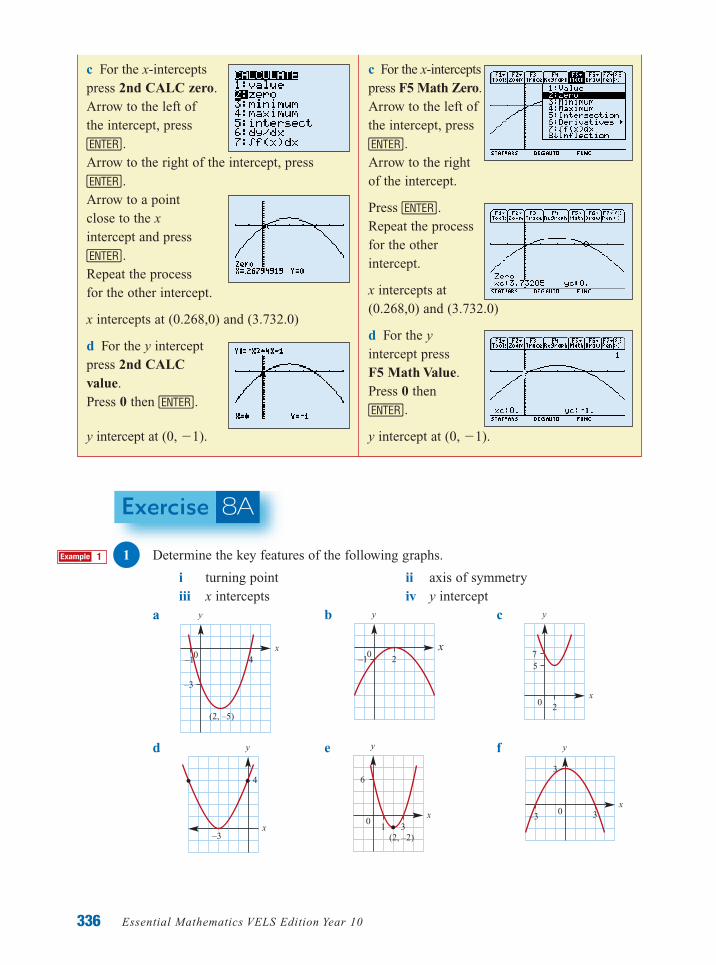
c For the x-interceptspress F5 Math Zero.Arrow to the left of the intercept, press Í.Arrow to the right of the intercept.
Press Í.Repeat the process for the other intercept.
x intercepts at (0.268,0) and (3.732.0)
d For the yintercept press F5 Math Value.Press 0 then Í.
y intercept at .(0, �1)
Essential Mathematics VELS Edition Year 10336
c For the x-interceptspress 2nd CALC zero.Arrow to the left of the intercept, press Í.Arrow to the right of the intercept, pressÍ.Arrow to a point close to the xintercept and press Í.Repeat the process for the other intercept.
x intercepts at (0.268,0) and (3.732.0)
d For the y intercept press 2nd CALC value.Press 0 then Í.
y intercept at .(0, �1)
8AExercise
1 Determine the key features of the following graphs.
i turning point ii axis of symmetryiii x intercepts iv y intercept
a b c
d e f
x
y
–3
3
30x
y
1
6
(2, –2)
03
y
x–3
4
0
y
x
57
2
x
y
–1 20
x
y
–1
–3
4
(2, –5)
0
1Example
0521681774c08_p330_365.qxd 8/11/06 12:17 PM Page 336

Chapter 8 — Quadratic graphs 337
2Example
3Example
2 Using graph paper, plot the graph of the following over the given domain and determine the:
i turning point and its nature ii axis of symmetryiii x intercepts iv y interceptv range
a bc de fg hi j
3 Using appropriate technology (for example, a graphics or CAS calculator) or otherwise,plot the following graphs over the specified domain and determine:
i turning point ii axis of symmetryiii x intercepts iv y intercept
a bc de fg h
4 For find the following. Note: f (a) means ‘find the function value( y value) at x � a’.
a f(0) b f(3) c d f(2)e f(4) f f(6) g h
5 Find the coordinates of the end points of for the given domainsand state the range using interval notation, e.g. (1, 7].
a b c d
6 Find the maximum value of f(x) if:
a bc de �3 � x � 1f (x) � �4(x � 2)2
2 � x � 4f (x) � �3x2 � 120 � x � 1f (x) � (x � 2)2 � 11 � x � 2f (x) � x2 � 3�2 � x � �4f (x) � x2
�5 � x � 13 � x � 6�2 � x � 02 � x � 5
f (x) � 2(x � 1)2 � 4
f (�4)f (�2)f (�3)
f (x) � x2 � 3x � 7
�8 � x � 2y � �x2 � 5x�1 � x � 6y � �x2 � 4x�7 � x � 1y � �x2 � 5x � 14�4 � x � 3y � �x2 � x � 6�10 � x � 5y � x2 � 5x�1 � x � 4y � x2 � 3x�4 � x � 4y � x2 � 2x � 3�5 � x � 1y � x2 � 5x � 4
�5 � x � 0f (x) � �2(x � 3)2 � 2�1 � x � 5f (x) � �4(x � 2)2
�3 � x � 3f (x) � �3x2 � 12�4 � x � 2f (x) � 3(x � 2)2 � 3�2 � x � 5f (x) � 2(x � 2)2 � 1�5 � x � 1f (x) � (x � 3)2 � 4�2 � x � 4f (x) � (x � 2)2 � 1�2 � x � 5f (x) � (x � 3)2
�5 � x � 2f (x) � x2 � 3�4 � x � �4f (x) � x2
Enrichment
7 The range can be determined using the endpoints or between one of the endpoints andthe graph’s maximum or minimum depending on its domain.Sketch the following parabolas, labelling their endpoints and determine their rangeover the given domains.
ai ii iii
bi ii iii
ci ii iii 3 � x � 5�2 � x � 0�5 � x � 5f (x) � �2(x � 3)2 � 2
1 � x � 4�5 � x � �2�5 � x � 2f (x) � x2 � 2
0 � x � 31 � x � 43 � x � 4y � x2 � 5x � 4
Th
0521681774c08_p330_365.qxd 8/11/06 12:17 PM Page 337

Essential Mathematics VELS Edition Year 10
8.2 Investigating the transformations of f (x) � x2
338
The simplest quadratic function is The graph of this function is shown.
It is a symmetrical continuous curve that has a minimumturning point at (0, 0).
While retaining the properties of a parabola, we canchange (transform) the shape and position of the graphof to form other quadratic graphs.f(x) � x2
f(x) � x2.
x 0 1 2 3y 9 4 1 0 1 4 9
�1�2�3
x
y
10987654321
0–1 1 2 3 4–2–3–4
Key ideas
The graph of f(x) � x2 can be transformed by:
• dilation—making the graph appear wider or narrower• translation in the x and y direction—shifting left or right and up or down• reflection—in the x and y axes
Example 4
Copy and complete the table for the following graphs.
a b c
x
y
0
y = x2
3
y = –x2 + 3
x
y
0–2
2
y = (x + 2)2
y = x2
x
y
0
y = 4x2
y = x2
Formula Maximum or Reflected in Turning y value when Wider orminimum the x axis point x � 1 narrower than
(yes/no) y � x2
aa
bb
cc y � �x2 � 3
y � (x � 2)2
y � 4x2
0521681774c08_p330_365.qxd 8/11/06 12:17 PM Page 338
Chapter 8 — Quadratic graphs 339
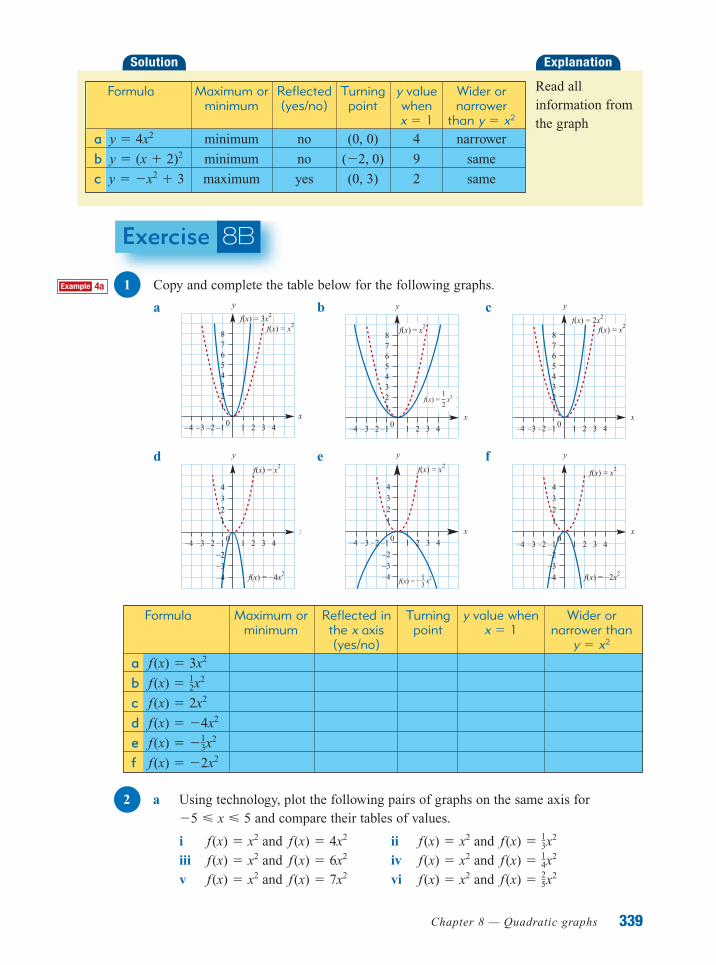
ExplanationSolution
Read allinformation fromthe graph
Formula Maximum or Reflected Turning y value Wider or minimum (yes/no) point when narrower
x � 1 than y � x2
aa minimum no (0, 0) 4 narrower
bb minimum no 9 same
cc maximum yes (0, 3) 2 samey � �x2 � 3
(�2, 0)y � (x � 2)2
y � 4x2
8BExercise
1 Copy and complete the table below for the following graphs.
a b c
d e f y
x0
–1 1
–3–2
1234
2 3 4–2–3–4
f(x) = –2x2
f(x) = x2
–4
y
x
13
f(x) = – x2
0–1 1
–3–2
1234
2 3 4–2–3–4
f(x) = x2
–4
y
x0–1 1
–3–2
1234
2 3 4–2–3–4
f(x) = –4x2
f(x) = x2
–4
y
x0–1 1
12345678
2 3 4–2–3–4
f(x) = 2x2
f(x) = x2
x
y
0–1 1
12345678
2 3 4–2–3–4
f(x) = x21
2
f(x) = x2
x
y
0–1 1
12345678
2 3 4–2–3–4
f(x) = 3x2
f(x) = x2
Formula Maximum or Reflected in Turning y value when Wider orminimum the x axis point x � 1 narrower than
(yes/no) y � x2
aa
bb
cc
dd
ee
ff f (x) � �2x2
f (x) � �13x
2
f (x) � �4x2
f (x) � 2x2
f (x) � 12x
2
f (x) � 3x2
2 a Using technology, plot the following pairs of graphs on the same axis forand compare their tables of values.
i and ii and iii and iv and v and vi and f (x) � 2
5x2f (x) � x2f (x) � 7x2f (x) � x2
f (x) � 14x
2f (x) � x2f (x) � 6x2f (x) � x2
f (x) � 13x
2f (x) � x2f (x) � 4x2f (x) � x2
�5 � x � 5
4aExample
0521681774c08_p330_365.qxd 8/11/06 12:17 PM Page 339

Essential Mathematics VELS Edition Year 10
b Suggest how the constant a in transforms the graph of
3 Copy and complete the table below for the following graphs.
a b
c d y
x
y = x2y = (x + 4)2
–6 –5 –4 –3 –2 –1
4
78
1
1 20
56
23
y
x
y = x2
y = (x – 2)2
–3 –2 –1 1
4
78
1
2 3 4 50
56
23
y
x
y = x2
y = (x – 1)2
–4 –3 –2 –1 1 2
4
78
1
3 40
56
23
y
x
y = x2
y = (x + 3)2
–5 –4 –3 –2 –1 1
234
78
1
2 30
56
f (x) � x2.f (x) � ax2
340
Formula Turning point y interceptaa
bb
cc
dd y � (x � 4)2
y � (x � 2)2
y � (x � 1)2
y � (x � 3)2
4 a Using technology, plot the following sets of graphs on the same axes forand compare the turning point of each.
iii
b Explain how the constant h in transforms the graph of
5 Copy and complete the table for the following graphs.
a b c dy
–4
x
y = x2
y = x2 – 4
y
2
xy = x2
y = x2 + 2y
–1
y = x2
y = x2 – 1x
y
3
xy = x2
y = x2 + 3
f (x) � x2.f (x) � (x � h)2
f (x) � (x � 3)2f (x) � (x � 2)2,f (x) � (x � 1)2,f (x) � x2,f (x) � (x � 3)2f (x) � (x � 2)2,f (x) � (x � 1)2,f (x) � x2,
�5 � x � 5
4bExample
4cExample
0521681774c08_p330_365.qxd 8/11/06 12:17 PM Page 340

Chapter 8 — Quadratic graphs 341
Formula Turning point y value when x � 1aabbccdd y � x2 � 4
y � x2 � 2y � x2 � 1y � x2 � 3
6 a Using technology, plot the following sets of graphs on the same axes forand compare the turning point of each.
iii
b Explain how the constant k in transforms the graph of
7 Match each of the following equations to one of the graphs below.
a b cd e fg hi ii iii iv
v vi vii viii
x
y
2
1
(1, 2)
x
y
4
–2x
(2, 3)
y
7
x
y
1, 14
x
y
(1, –5)
x
–6
y
(1, –5)x
4
y
(1, 5)
x3
9
y
y � (x � 2)2 � 3f (x) � x2 � 4y � 1
4x2f (x) � (x � 3)2y � �5x2
f (x) � (x � 2)2y � x2 � 6y � 2x2
f (x) � x2.f (x) � x2 � kf (x) � x2 � 5f (x) � x2 � 3,f (x) � x2 � 1,f (x) � x2,f (x) � x2 � 3f (x) � x2 � 2,f (x) � x2 � 1,f (x) � x2,
�5 � x � 5
Enrichment
8 Given the following functions:
i ii iii iv
write the following and describe the transformations on the original graph.
a b c de f g
9 In chapter 5, mapping notation was used to describe transformations.
• means a translation in the positive x direction and areflection in the x axis.
Find the equation of the image of after the following transformations.
a b
c d (x, y) ¡ a x � 32
, 3y b(x, y) ¡ (2x, y � 2)
(x, y) ¡ (�x, �y)(x, y) ¡ (x � 1, y � 1)
f(x) � x2
(x, y) ¡ (x � 1, �y)
f (x) � kf (x � h)f (�x)�f (x)2f (x)f (x) � 3f (x � 1)
f (x) � 3x2f (x) � (x � 2)2f (x) � x2 � 4f (x) � x2
Th
0521681774c08_p330_365.qxd 8/11/06 12:18 PM Page 341
Essential Mathematics VELS Edition Year 10
8.3 Sketching with transformations
342
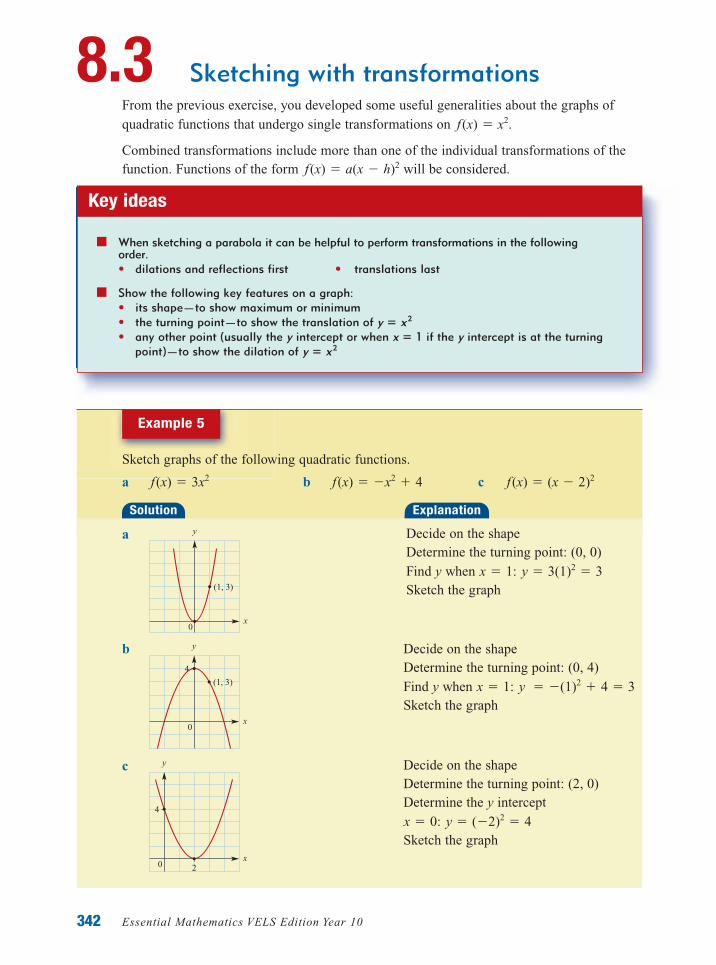
From the previous exercise, you developed some useful generalities about the graphs ofquadratic functions that undergo single transformations on
Combined transformations include more than one of the individual transformations of thefunction. Functions of the form will be considered.f(x) � a(x � h)2
f (x) � x2.
Key ideas
When sketching a parabola it can be helpful to perform transformations in the followingorder.• dilations and reflections first • translations last
Show the following key features on a graph:• its shape—to show maximum or minimum• the turning point—to show the translation of • any other point (usually the y intercept or when if the y intercept is at the turning
point)—to show the dilation of y � x 2
x � 1y � x
2
Example 5
Sketch graphs of the following quadratic functions.
a b c f (x) � (x � 2)2f (x) � �x2 � 4f (x) � 3x2
ExplanationSolution
a
x
y
0
(1, 3)
Decide on the shapeDetermine the turning point: (0, 0)Find y when Sketch the graph
y � 3(1)2 � 3x � 1:
b
c
x
y
0
4
2
0x
y
(1, 3)
4
Decide on the shapeDetermine the turning point: (0, 4)Find y when Sketch the graph
Decide on the shapeDetermine the turning point: (2, 0)Determine the y intercept
Sketch the graphy � (�2)2 � 4x � 0:
y � �(1)2 � 4 � 3x � 1:
0521681774c08_p330_365.qxd 8/11/06 12:18 PM Page 342

Chapter 8 — Quadratic graphs 343
8CExercise
1 Sketch graphs of the following quadratic functions.
a b cd e fg h ij k l
2 Determine the rule for the following parabolas.
a b c
d e f
g h i
3 Consider the following graphs of the form and
i ii
iii iv
0x
y
2
(1, 3)
x
y
0
(2, –4)
y � �(x � 1)2 � 3y � (x � 2)2 � 4
x
y
0
5
(–1, 2)
x
y
7
0
(2, 3)
y � (x � 1)2 � 2y � (x � 2)2 � 3
y � �(x � h)2 � k.y � (x � h)2 � k
x
y
(1, –7)
0
x
y
1
1
0
y
x–1
–11
0
(1, 1)
0
2
y
x
y
x0
12
1,0
y
x–2
–4
0x
y
3
9
x
y
(1, 5)
0
4
x
y
(1, 6)
0
f (x) � �(x � 3)2f (x) � �(x � 2)2f (x) � (x � 1)2
f (x) � (x � 3)2f (x) � �x2 � 3f (x) � �x2 � 1f (x) � x2 � 4f (x) � x2 � 2f (x) � �1
3x2
f (x) � 12x
2f (x) � �3x2f (x) � 2x2
5Example
0521681774c08_p330_365.qxd 8/11/06 12:18 PM Page 343
Essential Mathematics VELS Edition Year 10344
a State the turning point of each graph.b How does the turning point relate to the values of h and k in the equations given
initially?
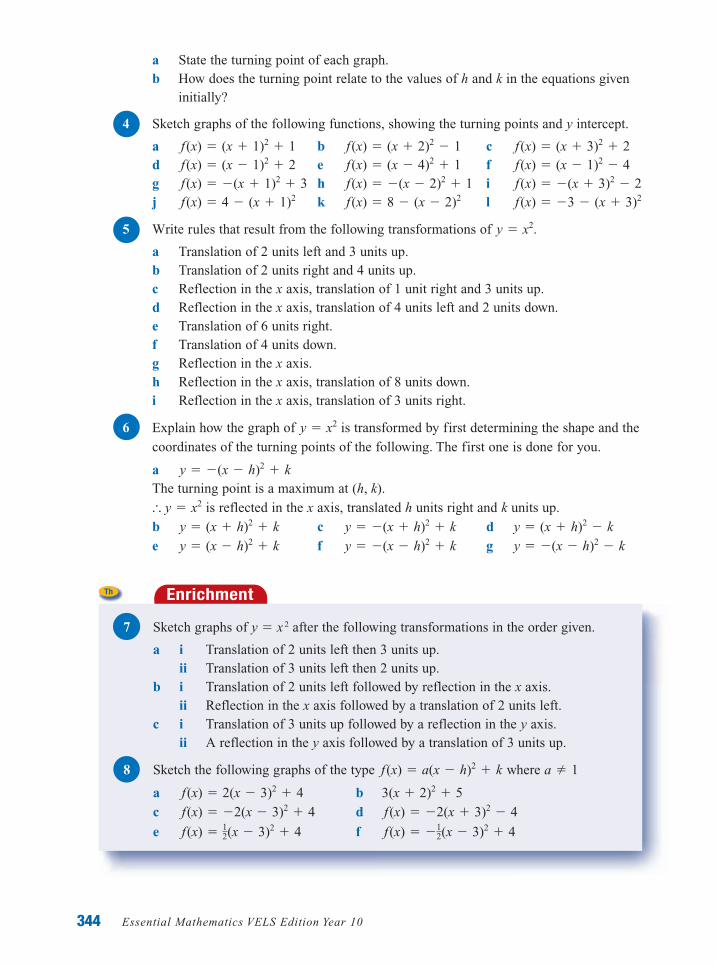
4 Sketch graphs of the following functions, showing the turning points and y intercept.
a b cd e fg h ij k l
5 Write rules that result from the following transformations of
a Translation of 2 units left and 3 units up.b Translation of 2 units right and 4 units up.c Reflection in the x axis, translation of 1 unit right and 3 units up.d Reflection in the x axis, translation of 4 units left and 2 units down.e Translation of 6 units right.f Translation of 4 units down.g Reflection in the x axis.h Reflection in the x axis, translation of 8 units down.i Reflection in the x axis, translation of 3 units right.
6 Explain how the graph of is transformed by first determining the shape and thecoordinates of the turning points of the following. The first one is done for you.
aThe turning point is a maximum at
is reflected in the x axis, translated h units right and k units up.b c de f g y � �(x � h)2 � ky � �(x � h)2 � ky � (x � h)2 � k
y � (x � h)2 � ky � �(x � h)2 � ky � (x � h)2 � k� y � x2
(h, k).y � �(x � h)2 � k
y � x2
y � x2.
f (x) � �3 � (x � 3)2f (x) � 8 � (x � 2)2f (x) � 4 � (x � 1)2
f (x) � �(x � 3)2 � 2f (x) � �(x � 2)2 � 1f (x) � �(x � 1)2 � 3f (x) � (x � 1)2 � 4f (x) � (x � 4)2 � 1f (x) � (x � 1)2 � 2f (x) � (x � 3)2 � 2f (x) � (x � 2)2 � 1f (x) � (x � 1)2 � 1
Enrichment
7 Sketch graphs of y � x 2 after the following transformations in the order given.
a i Translation of 2 units left then 3 units up.ii Translation of 3 units left then 2 units up.
b i Translation of 2 units left followed by reflection in the x axis.ii Reflection in the x axis followed by a translation of 2 units left.
c i Translation of 3 units up followed by a reflection in the y axis.ii A reflection in the y axis followed by a translation of 3 units up.
8 Sketch the following graphs of the type where
a bc de f f (x) � �1
2(x � 3)2 � 4f (x) � 12(x � 3)2 � 4
f (x) � �2(x � 3)2 � 4f (x) � �2(x � 3)2 � 43(x � 2)2 � 5f (x) � 2(x � 3)2 � 4
a � 1f (x) � a(x � h)2 � k
Th
0521681774c08_p330_365.qxd 8/11/06 12:18 PM Page 344
Chapter 8 — Quadratic graphs
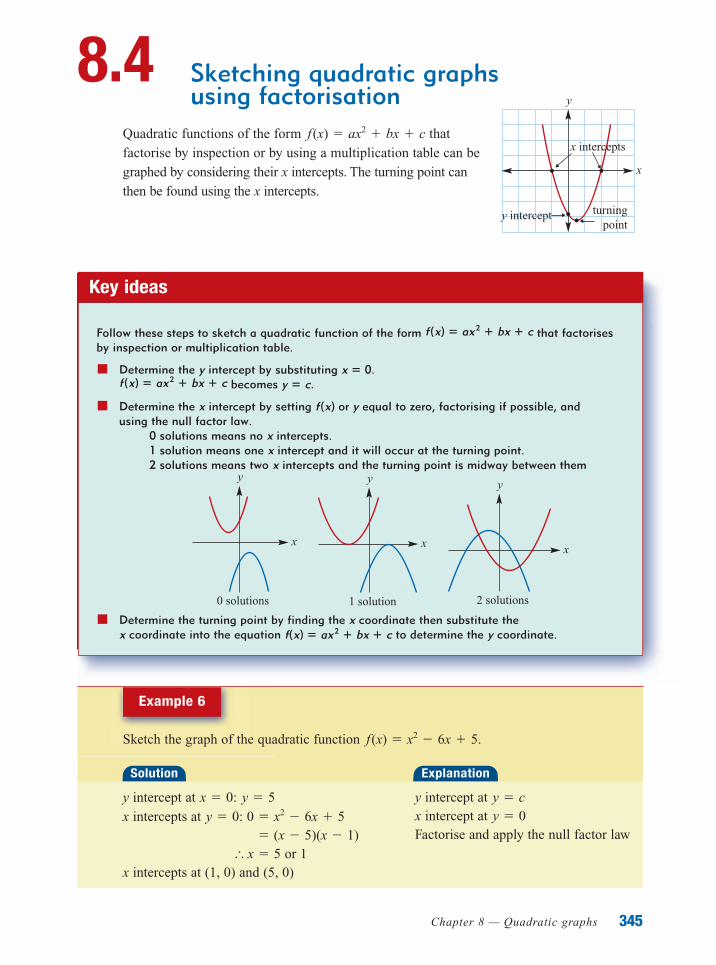
8.4 Sketching quadratic graphs using factorisation
345
Quadratic functions of the form thatfactorise by inspection or by using a multiplication table can begraphed by considering their x intercepts. The turning point can then be found using the x intercepts.
f (x) � ax2 � bx � c
x
y
x intercepts
y intercept turningpoint
Key ideas
Follow these steps to sketch a quadratic function of the form that factorisesby inspection or multiplication table.
Determine the y intercept by substituting becomes
Determine the x intercept by setting f (x) or y equal to zero, factorising if possible, andusing the null factor law.
0 solutions means no x intercepts.1 solution means one x intercept and it will occur at the turning point.2 solutions means two x intercepts and the turning point is midway between them
y � c.f (x) � ax 2 � bx � c
x � 0.
f (x) � ax 2 � bx � c
Determine the turning point by finding the x coordinate then substitute thex coordinate into the equation to determine the y coordinate.f(x) � ax
2 � bx � c
x
y
0 solutions
x
y
1 solution
x
y
2 solutions
Example 6
Sketch the graph of the quadratic function f(x) � x2 � 6x � 5.
ExplanationSolution
y intercept at x intercepts at
or 1x intercepts at (1, 0) and (5, 0)
� x � 5� (x � 5)(x � 1)
0 � x2 � 6x � 5y � 0:y � 5x � 0: y intercept at
x intercept at Factorise and apply the null factor law
y � 0y � c
0521681774c08_p330_365.qxd 8/11/06 12:18 PM Page 345

Essential Mathematics VELS Edition Year 10346
Turning point at
Turning point at (3, �4)� �4� 9 � 18 � 5
y � (3)2 � (6 � 3) � 5x � 3: Turning point at
Sketch the graph showing the keypoints
x �1 � 5
2� 3
Example 7
ExplanationSolution
y intercept at x intercepts at
x intercept at Turning point at
y
0
–9
–3x
(�3, 0)(�3, 0)
� x � �3� (x � 3)2
0 � x2 � 6x � 9y � 0:y � 9x � 0: y intercept at
x intercept at Factorise and apply the null factor law
Turning point is at the x intercept sincethere is only one x intercept
Sketch the graph showing the key points
y � 0y � c
Sketch the graph of the quadratic function .y � x2 � 6x � 9
8DExercise
1 Sketch the graphs of the following quadratic functions.
a b cd e fg h i
2 Sketch graphs of the following quadratic functions.
a b cd e f y � x2 � 13x � 12y � x2 � 5x � 4y � x2 � 11x � 30
y � x2 � 13x � 12y � x2 � 5x � 6y � x2 � 9x � 20
f (x) � x2 � 4x � 4f (x) � x2 � 8x � 15f (x) � x2 � 4x � 3f (x) � x2 � 4x � 21f (x) � x2 � 2x � 8f (x) � x2 � 6x � 16f (x) � x2 � 10x � 16f (x) � x2 � 6x � 8f (x) � x2 � 6x � 8
6Example
y
x
5
10 5
(3, –4)
0521681774c08_p330_365.qxd 8/11/06 12:19 PM Page 346

Chapter 8 — Quadratic graphs 347
Enrichment
8 For the following quadratic functions use a graph to help you determine the followingusing interval notation, e.g. [�2, 3] or :
i ii iiiiv va bc de fg h f (x) � 3x2 � 75f (x) � 2x2 � 50
f (x) � x2 � 12x � 36f (x) � x2 � 8x � 16f (x) � 3x2 � 11x � 8f (x) � 2x2 � 3x � 20f (x) � x2 � 8x � 16f (x) � x2 � 7x � 12
5x: f (x) 065x: f (x) � 065x: f (x) 0)5x: f (x) � 065x: f (x) � 06
(�q, �2) ´ (3, q)
7Example
g h ij k l
3 Determine the x intercepts of the graphs of the following quadratic functions.
a bc de fg h
4 Determine the turning points of the following quadratic functions.
a bc de fg hi j
5 Sketch graphs of the following quadratic functions.
a bc de fg h
6 Determine the coordinates of the turning point for these functions.
a bc de f
7 Sketch graphs of the following quadratic functions which include a difference ofperfect squares.
a b cd e fg h i y � 4x2 � 121y � 9x2 � 16y � 4x2 � 9
y � 25x2 � 100y � 4x2 � 4y � 3x2 � 12y � x2 � 16y � x2 � 25y � x2 � 4
f (x) � 2x2 � 4x � 2f (x) � 4x2 � 20x � 25f (x) � 9x2 � 6x � 1f (x) � x2 � 10x � 25f (x) � x2 � 8x � 16f (x) � x2 � 2x � 1
f (x) � 5x2 � 10x � 5f (x) � 3x2 � 12x � 12f (x) � 3x2 � 6x � 3f (x) � 2x2 � 12x � 18f (x) � x2 � 6x � 9f (x) � x2 � 8x � 16f (x) � x2 � 6x � 9f (x) � x2 � 4x � 4
y � 5x2 � 10x � 5y � 3x2 � 6x � 3y � �3(x2 � 81)y � 3(x2 � 81)y � 4x2 � 24x � 32y � 3x2 � 18x � 24y � �4(x2 � 9x � 18)y � 4(x2 � 6x � 8)y � 3(x2 � 7x � 10)y � 2(x2 � 7x � 10)
f(x) � 5x2 � 24x � 5f (x) � 3x2 � 2x � 1f(x) � 3x2 � 11x � 4f(x) � 5x2 � 2x � 3f(x) � 2x2 � 11x � 5f(x) � 3x2 � 5x � 2f(x) � 2x2 � 3x � 1f(x) � 3x2 � 10x � 3
y � x2 � 9x � 20y � x2 � 7x � 30y � x2 � 3x � 4y � x2 � 5x � 14y � x2 � x � 2y � x2 � 4x � 12
Th
0521681774c08_p330_365.qxd 8/11/06 12:19 PM Page 347

Essential Mathematics VELS Edition Year 10
8.5 Sketching quadratic graphs using turning-point form
348
Quadratic functions can be written in the form known as theturning-point form. This form is useful in that the turning point can be easily determined.
f(x) � a(x � h)2 � k
Key ideas
By ccoommpplleettiinngg tthhee ssqquuaarree,, all quadratic functions in the form can beexpressed in turning-point form.In order to sketch a quadratic function in the form • Determine the turning point (both its coordinates and nature).
Turning point is at (h, k).If a is positive the parabola has a minimum turning point.If a is negative the parabola has a maximum turning point.
• Determine the y intercept by substituting
• Determine the x intercepts, if there are any, by substituting and solving theequation using the null factor law if possible:
0 � a(x � h)2 � k
y � 0
f(x) � a(0 � h)2 � k
x � 0:
f(x) � a(x � h)2 � k:
f (x) � ax2 � bx � c
Example 8
For
a determine the coordinates and nature of its turning pointb determine the y interceptc determine the coordinates of the x intercepts (if any)
f (x) � �4(x � 1)2 � 16:
ExplanationSolution
a Turning point is a maximum at (1, 16)b y intercept at
y intercept at (0, 12)c x intercepts at
or x intercepts at and (3, 0)(�1, 0)
� 1� x � 3� (x � 3)(x � 1)� (x � 1 � 2)(x � 1 � 2)� (x � 1)2 � (2)2
� (x � 1)2 � 4 0 � �4(x � 1)2 � 16
y � 0:�
� 12� �4 � 16
y � �4(0 � 1)2 � 16x � 0:Turning point at (h, k) and a � 0Substitute
Substitute
Divide both sides by �4
Factorise using DOPS
Use the null factor law
y � 0
x � 0
0521681774c08_p330_365.qxd 8/11/06 12:19 PM Page 348

Chapter 8 — Quadratic graphs 349
Example 9
Sketch the graph of y � x2 � 6x � 15.
ExplanationSolution
Turning point:
Turning point is minimum at y intercept
y intercept at (0, 15)x intercepts
no solution and no x intercepts
x
y
(–3, 6)
(1, 15)
0
�
0 � (x � 3)2 � 6y � 0:
�
� 15y � (0)2 � 6(0) � 15
x � 0:(�3, 6).
� (x � 3)2 � 6� x2 � 6x � 9 � 9 � 15
y � x2 � 6x � 15 Complete the square to change theequation into turning point formNote: in this case
Substitute
Substitute This cannot be expressed as adifference of perfect squares(DOPS) and hence there are nofactors and zero x intercepts
Sketch the graph showing the keypoints
y � 0
x � 0
a � 1
8EExercise
1 Determine the coordinates and nature of the turning points of the following.
a bc de fg h
2 Determine the y intercepts of the following.
a b cd e fg h ij k l
3 Determine the coordinates of x intercepts (if any) of the following.
a bc de fg h f (x) � �(x � 3)2 � 16f (x) � �(x � 2)2 � 9
f (x) � (x � 7)2 � 4f (x) � (x � 8)2 � 25f (x) � (x � 7)2f (x) � (x � 3)2
f (x) � (x � 4)2 � 16f (x) � (x � 2)2 � 9
f (x) � x2 � 12x � 5f (x) � x2 � 5x � 12f (x) � x2 � x � 5f (x) � x2 � 7x � 5f (x) � x2 � 5x � 1f (x) � x2 � 6x � 3f (x) � �(x � 7)2 � 2f (x) � �(x � 8)2 � 14f (x) � (x � 4)2 � 5f (x) � (x � 1)2 � 2f (x) � (x � 3)2 � 7f (x) � (x � 2)2 � 3
f (x) � (x � 3)2 � 6f (x) � �7(x � 2)2 � 10f (x) � �4(x � 7)2 � 2f (x) � 3(x � 8)2 � 14f (x) � 9(x � 3)2 � 4f (x) � �5(x � 3)2 � 2f (x) � �4(x � 3)2 � 6f (x) � 3(x � 2)2 � 4
8aExample
8bExample
8cExample
0521681774c08_p330_365.qxd 8/11/06 12:20 PM Page 349

Essential Mathematics VELS Edition Year 10350
Enrichment
10 Sketch the parabola that represents the following quadratic functions. (First take outthe coefficient of and introduce brackets.)
a b cd e fg h ij
11 Using technology, plot the graphs you have sketched in Question 10 and verify:
a the turning point b the y intercept c the x intercepts (if any)
y � 7x2 � 10xy � 5x2 � 12xy � 5x2 � 3x � 7y � 6x2 � 5x � 9y � 4x2 � 8x � 20y � 2x2 � 7x � 3y � 2x2 � x � 3y � 2x2 � 12x � 1y � 3x2 � 12x � 10y � 4x2 � 8x � 3
x2
9Example
4 Determine the x intercepts (if any) by first completing the square and rewriting theequation in turning-point form.
a b cd e f
5 Sketch the graphs of the following.
a b cd e fg h ij k l
6 Sketch the graphs of the following quadratics functions.
a bc de fg h
7 Using technology, plot the graphs you have sketched inQuestion 6 and verify:
a the turning pointb the y interceptc the x intercepts (if any)
8 Sketch the graphs of the following quadratic functions.
a b cd e fg h i
9 Using technology, plot the graphs you have sketched in Question 8 and verify:
a the turning point b the y intercept c the x intercepts (if any)
y � x2 � 12xy � x2 � 6x � 5y � x2 � 8x � 7y � x2 � 2x � 15y � x2 � 2x � 8y � x2 � 8x � 16y � x2 � 6x � 9y � x2 � 2x � 3y � x2 � 4x � 3
f (x) � �2(x � 3)2 � 6f (x) � �3(x � 1)2 � 15f (x) � 2(x � 7)2 � 2f (x) � 4(x � 2)2 � 12f (x) � (x � 6)2 � 5f (x) � (x � 7)2 � 3f (x) � (x � 5)2 � 6f (x) � (x � 3)2 � 2
y � �(x � 2)2 � 4y � �(x � 9)2 � 25y � �(x � 4)2 � 9y � �(x � 5)2 � 4y � (x � 3)2 � 6y � (x � 2)2 � 1y � (x � 7)2 � 2y � (x � 8)2 � 16y � (x � 3)2 � 4y � (x � 4)2 � 1y � (x � 4)2 � 9y � (x � 2)2 � 4
y � x2 � 12x � 13y � x2 � 4x � 12y � x2 � 2x � 8y � x2 � 8x � 16y � x2 � 6x � 1y � x2 � 6x � 5
Th
0521681774c08_p330_365.qxd 8/11/06 12:20 PM Page 350
Chapter 8 — Quadratic graphs
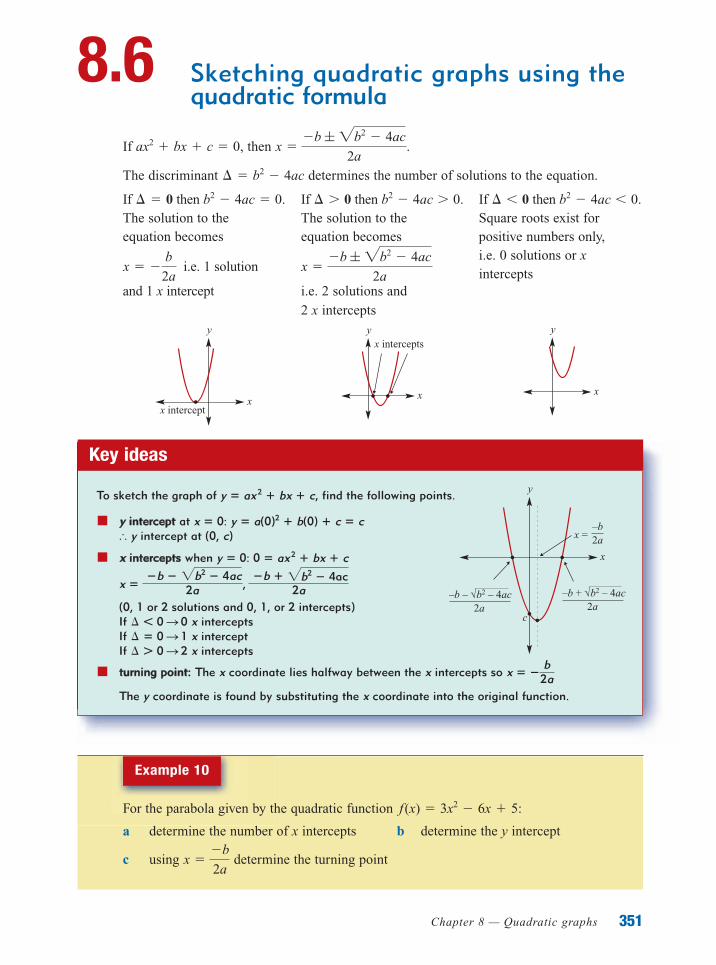
8.6 Sketching quadratic graphs using thequadratic formula
351
If then
The discriminant determines the number of solutions to the equation.
If then If then If then The solution to the The solution to the Square roots exist for equation becomes equation becomes positive numbers only,
i.e. 1 solution i.e. 0 solutions or x
and 1 x intercept i.e. 2 solutions and intercepts
2 x intercepts
x ��b ; 2b2 � 4ac
2ax � �
b
2a
b2 � 4ac � 0.¢ � 0b2 � 4ac 0.¢ 0b2 � 4ac � 0.¢ � 0
¢ � b2 � 4ac
x ��b ; 2b2 � 4ac
2a.ax2 � bx � c � 0,
xx intercept
y
x
yx intercepts
x
y
Key ideas
To sketch the graph of find the following points.
yy iinntteerrcceepptt at y intercept at (0, c)
xx iinntteerrcceeppttss when
(0, 1 or 2 solutions and 0, 1, or 2 intercepts)If x interceptsIf x interceptIf x intercepts
ttuurrnniinngg ppooiinntt:: The x coordinate lies halfway between the x intercepts so
The y coordinate is found by substituting the x coordinate into the original function.
x � �b2a
¢ � 0 S 2¢ � 0 S 1¢ � 0 S 0
x ��b � 2b2 � 4ac
2a , �b � 2b2 � 4ac
2a
0 � ax 2 � bx � cy � 0:
�
y � a(0)2 � b(0) � c � cx � 0:
y � ax 2 � bx � c,
x
y
2a–b – √b2 – 4ac
2a–b + √b2 – 4ac
2a–b
x =
c
Example 10
For the parabola given by the quadratic function
a determine the number of x intercepts b determine the y intercept
c using determine the turning pointx ��b
2a
f (x) � 3x2 � 6x � 5:
0521681774c08_p330_365.qxd 8/11/06 12:20 PM Page 351

Essential Mathematics VELS Edition Year 10352
ExplanationSolution
a
0 x interceptsb y intercept at (0, 5)
c
turning point at (1, 2)�
� 3 � 6 � 5 � 2 y � 3(1)2 � 6(1) � 5
x � �b
2a� �
(�6)
2(3)� 1
�¢ � 0 � �14
b2 � 4ac � (�6)2 � 4(3)(5) Use the discriminant to determine thenumber of x intercepts
y intercept is at (0, c)
Determine the x value for the turning pointDetermine the y value of the turning pointWrite the coordinates of the turning point
Example 11
Sketch the graph of the quadratic function labelling all significantpoints. Round the x intercepts to two decimal places.
y � 2x2 � 4x � 3,
ExplanationSolution
y intercept at
x intercepts:
x intercepts at (0.58, 0) and
Turning point is at
and turning point at
x
y
–2.58 0.58
(–1, –5)
–3
(�1, �5)�
y � 2(�1)2 � 4(�1) � 3�
� �1
x � �b
2a� �
(4)
2(2)
(�2.58, 0)�
x � 0.58, �2.58
�42
; 21210
42�
2 ; 222
��4 ; 240
4
��4 ; 242 � 4(2)(�3)
2(2)
x ��b ; 2b2 � 4ac
2a
(0, �3) y intercept is at (0, c)
Use the quadratic formula to solve for the x intercepts
Write the coordinates of the intercepts
Determine the x value for the turningpointDetermine the y value of the turning pointWrite the coordinates of the turning pointSketch the graph
0521681774c08_p330_365.qxd 8/11/06 12:20 PM Page 352
Chapter 8 — Quadratic graphs 353
8FExercise
10aExample
10bExample
10cExample
11Example
Enrichment
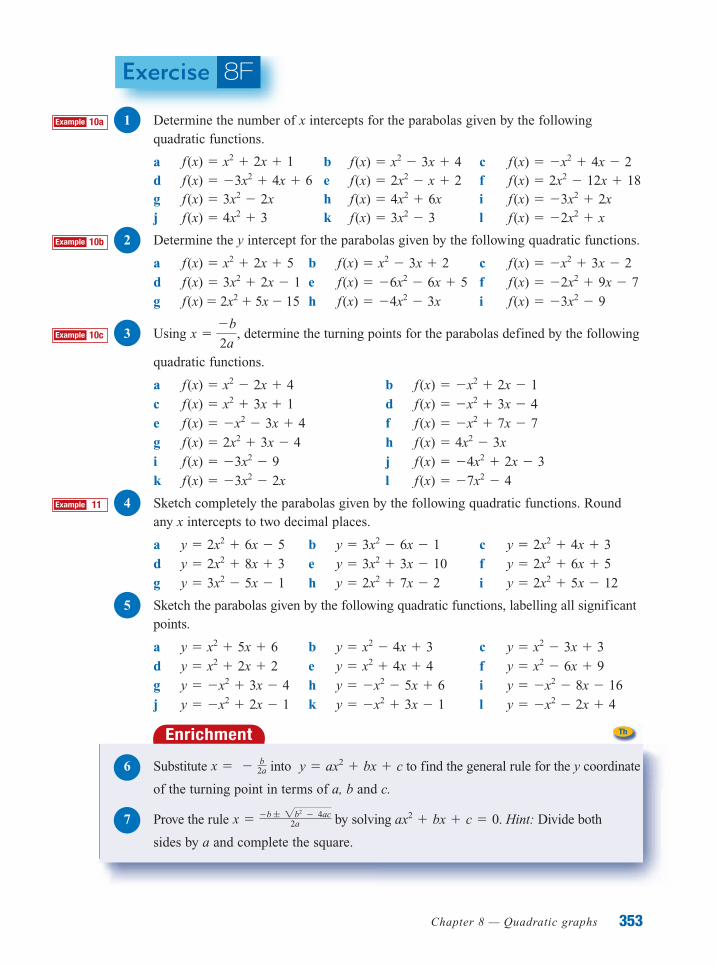
6 Substitute into to find the general rule for the y coordinate
of the turning point in terms of a, b and c.
7 Prove the rule by solving . Hint: Divide both
sides by a and complete the square.
ax2 � bx � c � 0x � �b ; 2b2 � 4ac2a
y � ax2 � bx � cx � � b2a
1 Determine the number of x intercepts for the parabolas given by the followingquadratic functions.
a b cd e fg h ij k l
2 Determine the y intercept for the parabolas given by the following quadratic functions.
a b cd e fg h i
3 Using determine the turning points for the parabolas defined by the following
quadratic functions.
a bc de fg hi jk l
4 Sketch completely the parabolas given by the following quadratic functions. Roundany x intercepts to two decimal places.
a b cd e fg h i
5 Sketch the parabolas given by the following quadratic functions, labelling all significantpoints.
a b cd e fg h ij k l y � �x2 � 2x � 4y � �x2 � 3x � 1y � �x2 � 2x � 1
y � �x2 � 8x � 16y � �x2 � 5x � 6y � �x2 � 3x � 4y � x2 � 6x � 9y � x2 � 4x � 4y � x2 � 2x � 2y � x2 � 3x � 3y � x2 � 4x � 3y � x2 � 5x � 6
y � 2x2 � 5x � 12y � 2x2 � 7x � 2y � 3x2 � 5x � 1y � 2x2 � 6x � 5y � 3x2 � 3x � 10y � 2x2 � 8x � 3y � 2x2 � 4x � 3y � 3x2 � 6x � 1y � 2x2 � 6x � 5
f (x) � �7x2 � 4f (x) � �3x2 � 2xf (x) � �4x2 � 2x � 3f (x) � �3x2 � 9f (x) � 4x2 � 3xf (x) � 2x2 � 3x � 4f (x) � �x2 � 7x � 7f (x) � �x2 � 3x � 4f (x) � �x2 � 3x � 4f (x) � x2 � 3x � 1f (x) � �x2 � 2x � 1f (x) � x2 � 2x � 4
x ��b
2a,
f (x) � �3x2 � 9f (x) � �4x2 � 3xf (x) � 2x2 � 5x � 15f (x) � �2x2 � 9x � 7f (x) � �6x2 � 6x � 5f (x) � 3x2 � 2x � 1f (x) � �x2 � 3x � 2f (x) � x2 � 3x � 2f (x) � x2 � 2x � 5
f (x) � �2x2 � xf (x) � 3x2 � 3f (x) � 4x2 � 3f (x) � �3x2 � 2xf (x) � 4x2 � 6xf (x) � 3x2 � 2xf (x) � 2x2 � 12x � 18f (x) � 2x2 � x � 2f (x) � �3x2 � 4x � 6f (x) � �x2 � 4x � 2f (x) � x2 � 3x � 4f (x) � x2 � 2x � 1
Th
0521681774c08_p330_365.qxd 8/11/06 12:21 PM Page 353
Essential Mathematics VELS Edition Year 10
8.7 Applications of quadratics
354
Many real-life objects or situations can be modelled by quadratic functions including lenses,satellite dishes, parts of suspension bridges and projectiles.
It is often the case that key features of a quadratic sketch can help to determine thesolution to problems that are modelled by quadratic functions.
Key ideas
When using quadratic models and their graphs we should consider:
• the domain of the function (which can be stated, for example, as or • the coordinates of the endpoints of the graph• the turning point of the graph• any axis intercepts
[�5, 7))�5 � x � 7
Example 12
ExplanationSolution
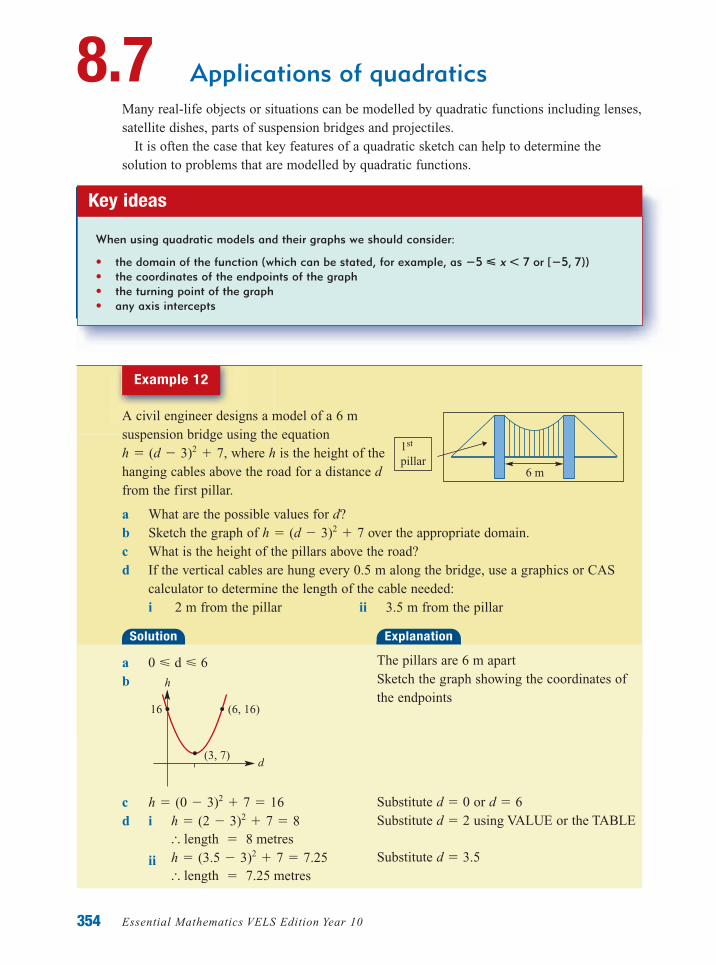
A civil engineer designs a model of a 6 msuspension bridge using the equation
where h is the height of thehanging cables above the road for a distance dfrom the first pillar.
a What are the possible values for d?b Sketch the graph of over the appropriate domain.c What is the height of the pillars above the road?d If the vertical cables are hung every 0.5 m along the bridge, use a graphics or CAS
calculator to determine the length of the cable needed:i 2 m from the pillar ii 3.5 m from the pillar
h � (d � 3)2 � 7
h � (d � 3)2 � 7,
a 0 � d � 6b
cd i
ii� length � 7.25 metresh � (3.5 � 3)2 � 7 � 7.25� length � 8 metresh � (2 � 3)2 � 7 � 8
h � (0 � 3)2 � 7 � 16
d
h
16
(3, 7)
(6, 16)
The pillars are 6 m apartSketch the graph showing the coordinates ofthe endpoints
Substitute d � 0 or d � 6Substitute d � 2 using VALUE or the TABLE
Substitute d � 3.5
6 m
1st
pillar
0521681774c08_p330_365.qxd 8/11/06 12:21 PM Page 354
Chapter 8 — Quadratic graphs 355
12Example
8GExercise
1 A ball is thrown upwards from ground level and reaches a height of h metres after tseconds, given by the formula
a What are the possible values for t?b Sketch the graph of h versus t over the appropriate domain.c What maximum height does the ball reach?d How long does it take the ball to return to ground level?e Using a graphics or CAS calculator, determine at what times the ball is at a height of:
i 20 m ii 10 m
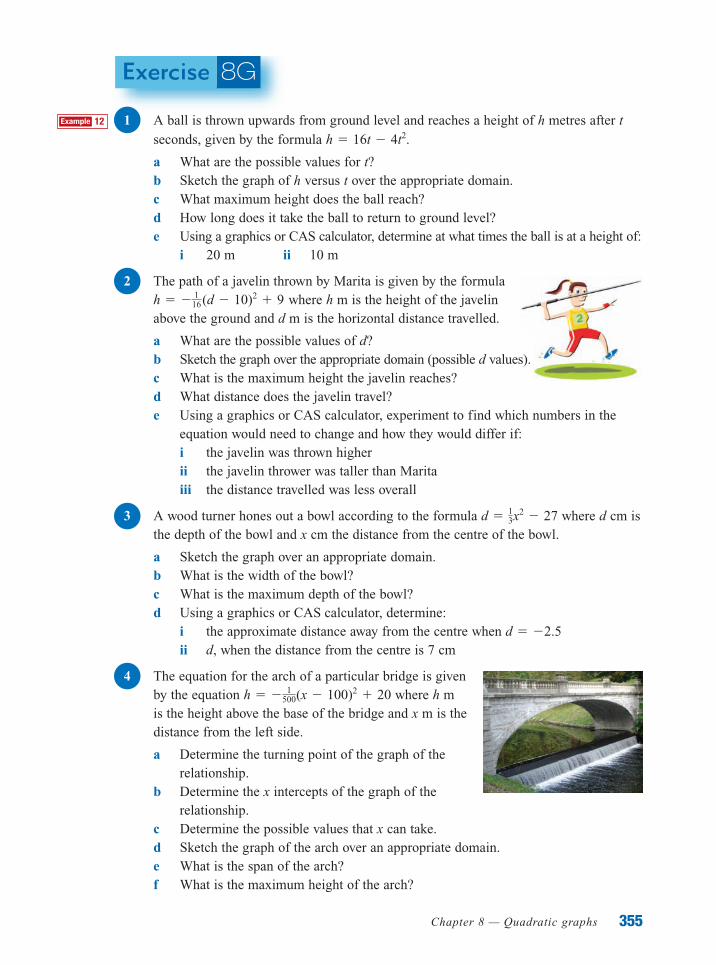
2 The path of a javelin thrown by Marita is given by the formulawhere h m is the height of the javelin
above the ground and d m is the horizontal distance travelled.
a What are the possible values of d?b Sketch the graph over the appropriate domain (possible d values).c What is the maximum height the javelin reaches?d What distance does the javelin travel?e Using a graphics or CAS calculator, experiment to find which numbers in the
equation would need to change and how they would differ if:i the javelin was thrown higherii the javelin thrower was taller than Maritaiii the distance travelled was less overall
3 A wood turner hones out a bowl according to the formula where d cm isthe depth of the bowl and x cm the distance from the centre of the bowl.
a Sketch the graph over an appropriate domain.b What is the width of the bowl?c What is the maximum depth of the bowl?d Using a graphics or CAS calculator, determine:
i the approximate distance away from the centre when ii d, when the distance from the centre is 7 cm
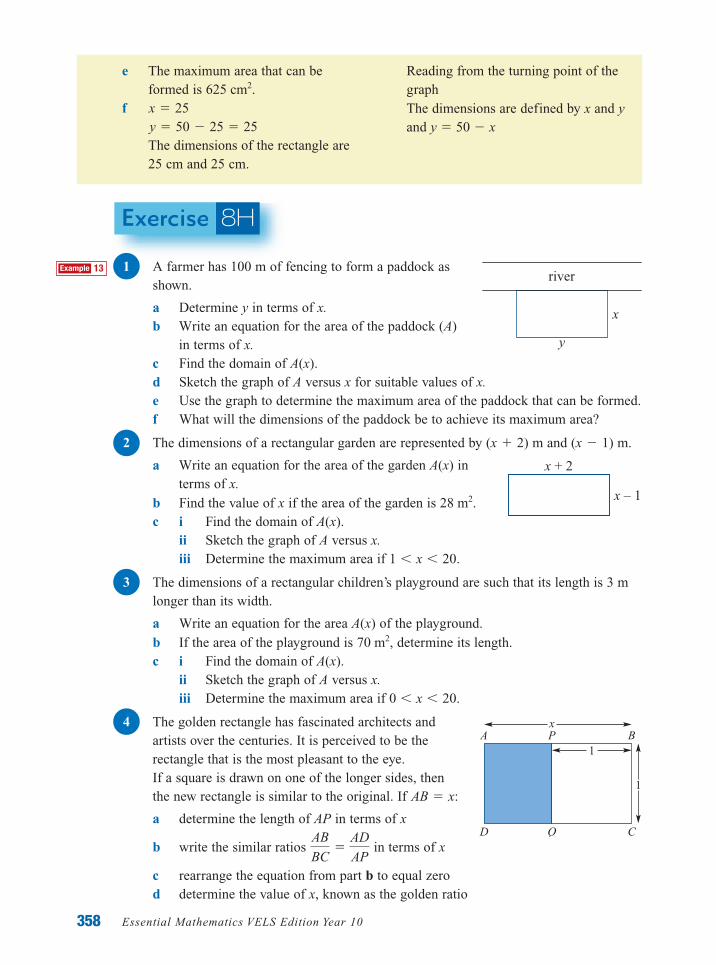
4 The equation for the arch of a particular bridge is givenby the equation where h m is the height above the base of the bridge and x m is thedistance from the left side.
a Determine the turning point of the graph of therelationship.
b Determine the x intercepts of the graph of therelationship.
c Determine the possible values that x can take.d Sketch the graph of the arch over an appropriate domain.e What is the span of the arch?f What is the maximum height of the arch?
h � � 1500(x � 100)2 � 20
d � �2.5
d � 13x
2 � 27
h � � 116
(d � 10)2 � 9
h � 16t � 4t2.
0521681774c08_p330_365.qxd 8/11/06 12:21 PM Page 355

Essential Mathematics VELS Edition Year 10356
Enrichment
8 A car travels on a stretch of farm road modelled by the equation where
a Sketch a graph over the given domain.b Determine the equation of a straight line that joins the endpoints of this model.c A fence is to be built on a line modelled by the equation At what
coordinates will the farmer need to install gates?y � 2x � 5.
�3 � x � 8.y � x2 � 4x � 12
Th
g If a lookout is to be located on the arch at a height of 10 m, use a graphics orCAS calculator to determine where it would be located on the arch.
5 The equation for a support span is given by where h m is the
distance below the base of a bridge and x m is the distance from the left side.
a Determine the turning point of the graph of the relationship.b Determine the possible values of x.c Determine the range of values of h.d Sketch a graph of the equation over the appropriate domain.e What is the width of the support span?f What is the maximum height of the support span?
6 The height of a parachutist above the ground (h m) is represented by the relationship
where t is the time in minutes after jumpingfrom the aeroplane.
a Sketch a graph of h versus t over anappropriate domain.
b How long does it take the parachutist toreach the ground?
c At what height did the parachutist jumpfrom the plane?
7 A clay pigeon is projected from a platform and a shooter tries to hit it before it hits theground to score points in a competition. The height of the clay pigeon above theground (h m) is given by the equation
where t is the time, in seconds, after the clay pigeon is released.
a Sketch a graph of h versus t over an appropriate domain.b What is the maximum height reached and when did it happen?c What is the height of the platform?d How much time does the shooter have to hit the clay pigeon?
h � �2t2 � 9t � 3
h � �40t2 � 4t � 10 000
h � � 140(x � 20)2
0521681774c08_p330_365.qxd 8/11/06 12:21 PM Page 356

Chapter 8 — Quadratic graphs
8.8 Modelling with quadratics
357
Creating models involves setting up a function that satisfies the given conditions. All keyideas from the last section apply except you will need to set up your own equations and payparticular attention that the domain suits the situation you are modelling.
Key ideas
Modelling with quadratics may involve:
• defining variables• forming equations• eliminating a variable• defining a suitable domain• sketching a graph over an appropriate domain• finding maximums and minimums or other key elements of a function and its graph
Example 13
ExplanationSolution
A piece of wire 100 cm in length is bent into the shape of a rectangle.
a Determine y in terms of x.b Write an equation for the area of the rectangle (A) in terms of x.c Find the domain of A(x).d Sketch the graph of A versus x for suitable values of x.e Use the graph to determine the maximum area that can be formed.f What will the dimensions of the rectangle be to achieve its maximum area?
a
b
c x 0 and y 0So �x 0
x � 50∴ Domain � (0, 50)
d
x
A
50
(25, 625)
� x(50 � x)A � xy
y � 50 � x 2y � 100 � 2x
Perimeter � 2x � 2y � 100 100 m of wire is used, so the perimeter of the rectangle is 100 cm
Area of a rectangle is Replace y with The domain of the function is (0, 50) asboth lengths must be positive
First find the x intercepts then show thecoordinates of the turning point
50 � xlenght � width
y cm
x cm
0521681774c08_p330_365.qxd 8/11/06 12:21 PM Page 357
Essential Mathematics VELS Edition Year 10358
8HExercise
1 A farmer has 100 m of fencing to form a paddock asshown.
a Determine y in terms of x.b Write an equation for the area of the paddock (A)
in terms of x.c Find the domain of A(x).d Sketch the graph of A versus x for suitable values of x.e Use the graph to determine the maximum area of the paddock that can be formed.f What will the dimensions of the paddock be to achieve its maximum area?
2 The dimensions of a rectangular garden are represented by m and m.
a Write an equation for the area of the garden A(x) interms of x.
b Find the value of x if the area of the garden is c i Find the domain of A(x).
ii Sketch the graph of A versus x.iii Determine the maximum area if
3 The dimensions of a rectangular children’s playground are such that its length is 3 mlonger than its width.
a Write an equation for the area A(x) of the playground.b If the area of the playground is determine its length.c i Find the domain of A(x).
ii Sketch the graph of A versus x.iii Determine the maximum area if
4 The golden rectangle has fascinated architects andartists over the centuries. It is perceived to be therectangle that is the most pleasant to the eye.If a square is drawn on one of the longer sides, thenthe new rectangle is similar to the original. If
a determine the length of AP in terms of x
b write the similar ratios in terms of x
c rearrange the equation from part b to equal zerod determine the value of x, known as the golden ratio
AB
BC�
AD
AP
AB � x:
0 � x � 20.
70 m2,
1 � x � 20.
28 m2.
(x � 1)(x � 2)
river
x
y
x + 2
x – 1
D
A P B
Q C
1
1
x
13Example
e The maximum area that can beformed is
f
The dimensions of the rectangle are25 cm and 25 cm.
y � 50 � 25 � 25x � 25
625 cm2.Reading from the turning point of thegraphThe dimensions are defined by x and yand y � 50 � x
0521681774c08_p330_365.qxd 8/11/06 12:21 PM Page 358
Chapter 8 — Quadratic graphs
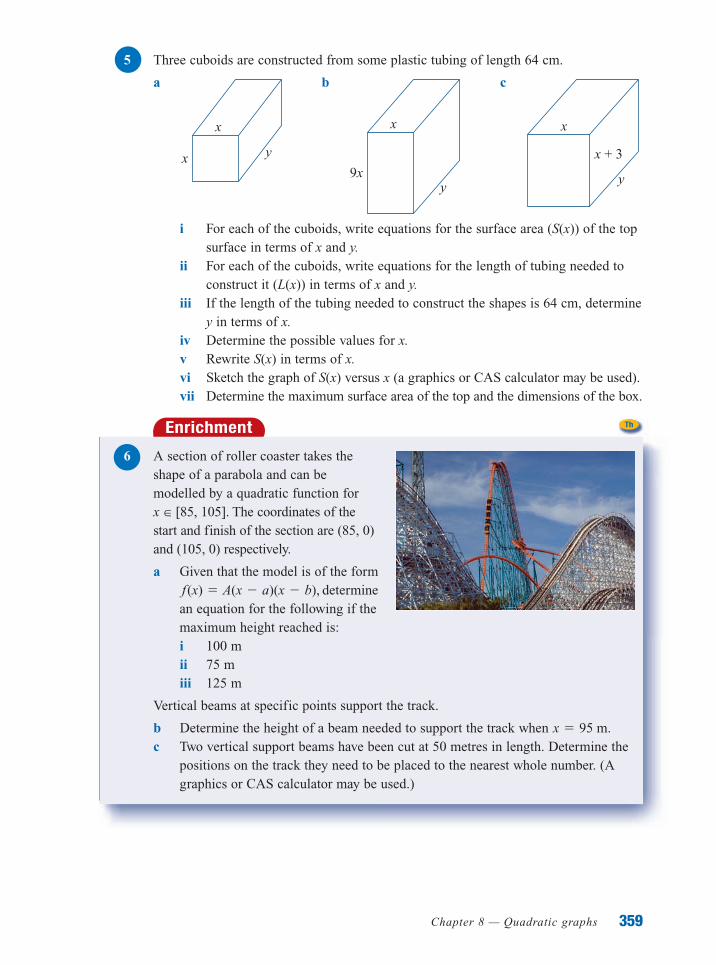
5 Three cuboids are constructed from some plastic tubing of length 64 cm.
a b c
i For each of the cuboids, write equations for the surface area (S(x)) of the topsurface in terms of x and y.
ii For each of the cuboids, write equations for the length of tubing needed toconstruct it (L(x)) in terms of x and y.
iii If the length of the tubing needed to construct the shapes is 64 cm, determiney in terms of x.
iv Determine the possible values for x.v Rewrite S(x) in terms of x.vi Sketch the graph of S(x) versus x (a graphics or CAS calculator may be used).vii Determine the maximum surface area of the top and the dimensions of the box.
x
x + 3
y
x
y9x
x y
x
359
Enrichment
6 A section of roller coaster takes theshape of a parabola and can bemodelled by a quadratic function for x � [85, 105]. The coordinates of thestart and finish of the section are (85, 0)and (105, 0) respectively.
a Given that the model is of the formdetermine
an equation for the following if themaximum height reached is:i 100 mii 75 miii 125 m
Vertical beams at specific points support the track.
b Determine the height of a beam needed to support the track when c Two vertical support beams have been cut at 50 metres in length. Determine the
positions on the track they need to be placed to the nearest whole number. (Agraphics or CAS calculator may be used.)
x � 95 m.
f (x) � A(x � a)(x � b),
Th
0521681774c08_p330_365.qxd 8/11/06 12:21 PM Page 359
Essential Mathematics VELS Edition Year 10360
Esse
nti
al
Ma
the
ma
tic
s V
EL
S P
roje
cts
W O R K I N G
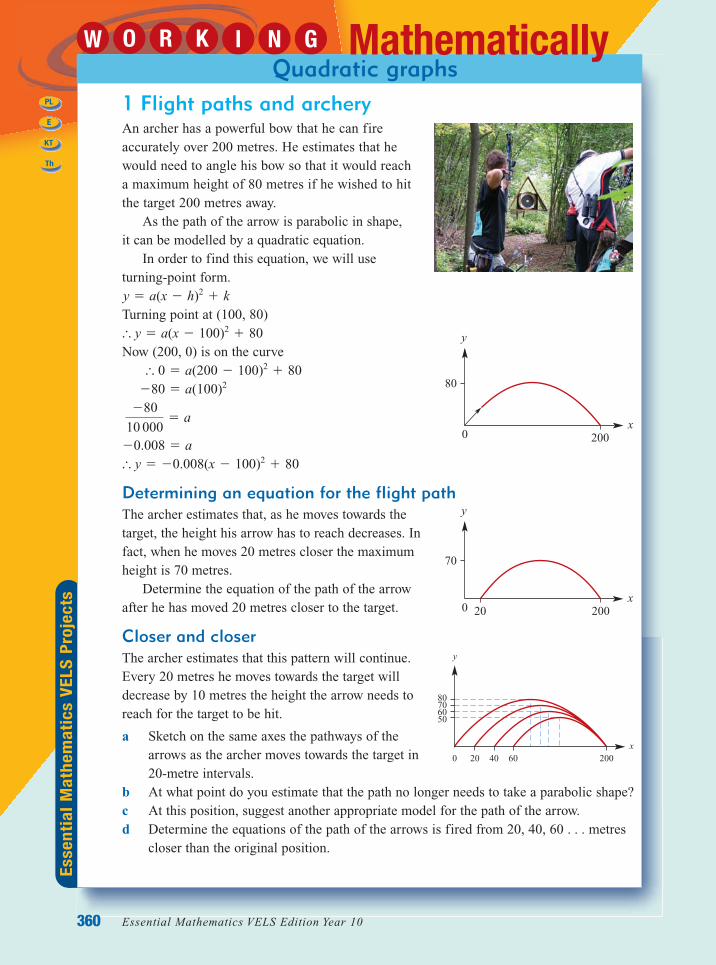
1 Flight paths and archeryAn archer has a powerful bow that he can fireaccurately over 200 metres. He estimates that hewould need to angle his bow so that it would reacha maximum height of 80 metres if he wished to hitthe target 200 metres away.
As the path of the arrow is parabolic in shape, it can be modelled by a quadratic equation.
In order to find this equation, we will use turning-point form.
Turning point at (100, 80)
Now (200, 0) is on the curve
Determining an equation for the flight pathThe archer estimates that, as he moves towards thetarget, the height his arrow has to reach decreases. Infact, when he moves 20 metres closer the maximumheight is 70 metres.
Determine the equation of the path of the arrowafter he has moved 20 metres closer to the target.
Closer and closerThe archer estimates that this pattern will continue.Every 20 metres he moves towards the target willdecrease by 10 metres the height the arrow needs toreach for the target to be hit.
a Sketch on the same axes the pathways of thearrows as the archer moves towards the target in20-metre intervals.
b At what point do you estimate that the path no longer needs to take a parabolic shape?c At this position, suggest another appropriate model for the path of the arrow.d Determine the equations of the path of the arrows is fired from 20, 40, 60 . . . metres
closer than the original position.
� y � �0.008(x � 100)2 � 80 �0.008 � a
�80
10 000� a
�80 � a(100)2
� 0 � a(200 � 100)2 � 80
� y � a(x � 100)2 � 80
y � a(x � h)2 � k
Quadratic graphsMathematically
y
x
80
0 200
y
x
70
0 20020
y
x
706050
80
0 20020 40 60
E
KT
Th
PL
0521681774c08_p330_365.qxd 8/11/06 12:21 PM Page 360
Chapter 8 — Quadratic graphs 361
Esse
nti
al
Ma
the
ma
tic
s V
EL
S P
roje
cts
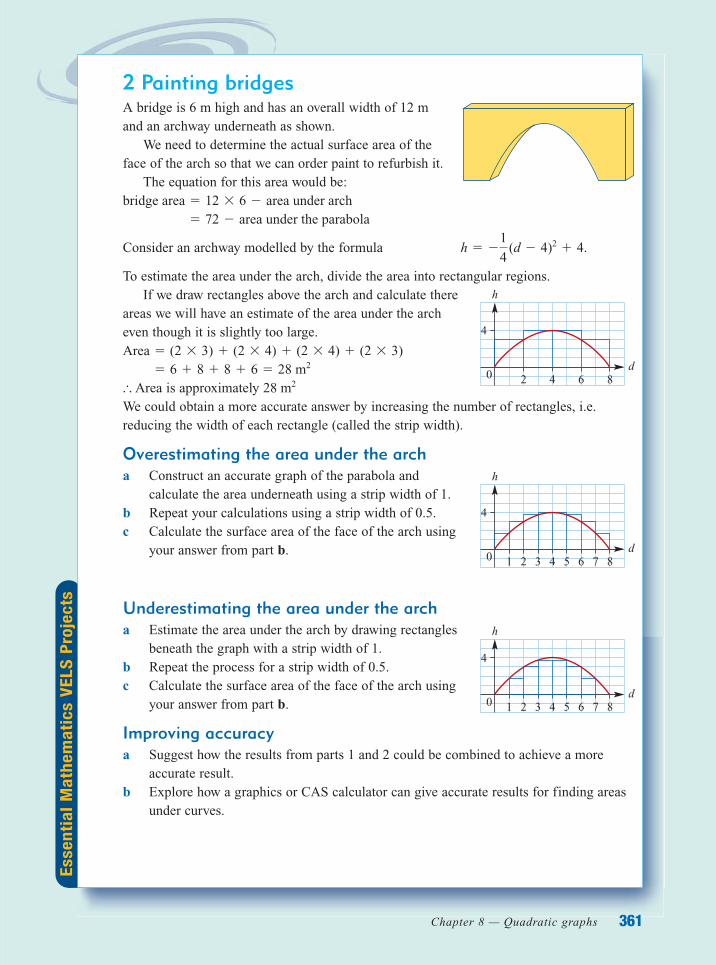
2 Painting bridgesA bridge is 6 m high and has an overall width of 12 mand an archway underneath as shown.
We need to determine the actual surface area of theface of the arch so that we can order paint to refurbish it.
The equation for this area would be:
Consider an archway modelled by the formula
To estimate the area under the arch, divide the area into rectangular regions.If we draw rectangles above the arch and calculate there
areas we will have an estimate of the area under the archeven though it is slightly too large.
Area is approximately We could obtain a more accurate answer by increasing the number of rectangles, i.e.reducing the width of each rectangle (called the strip width).
Overestimating the area under the archa Construct an accurate graph of the parabola and
calculate the area underneath using a strip width of 1.b Repeat your calculations using a strip width of 0.5.c Calculate the surface area of the face of the arch using
your answer from part b.
Underestimating the area under the archa Estimate the area under the arch by drawing rectangles
beneath the graph with a strip width of 1.b Repeat the process for a strip width of 0.5.c Calculate the surface area of the face of the arch using
your answer from part b.
Improving accuracya Suggest how the results from parts 1 and 2 could be combined to achieve a more
accurate result.b Explore how a graphics or CAS calculator can give accurate results for finding areas
under curves.
28 m2�
� 6 � 8 � 8 � 6 � 28 m2
Area � (2 � 3) � (2 � 4) � (2 � 4) � (2 � 3)
h � �14
(d � 4)2 � 4.
� 72 � area under the parabola bridge area � 12 � 6 � area under arch
h
2
4
0 4d
6 8
h
2 31
4
0 4 5d
6 7 8
h
2 31
4
0 4 5d
6 7 8
0521681774c08_p330_365.qxd 8/11/06 12:21 PM Page 361
Rev
iew
Chapter summary
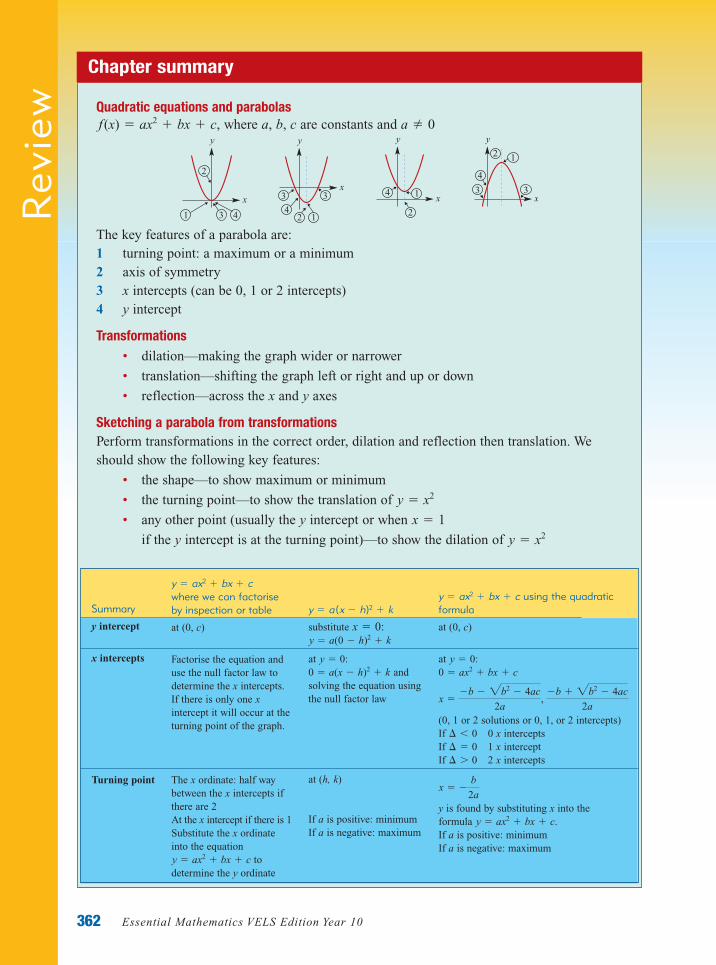
Quadratic equations and parabolas
where a, b, c are constants and
The key features of a parabola are:1 turning point: a maximum or a minimum2 axis of symmetry3 x intercepts (can be 0, 1 or 2 intercepts)4 y intercept
Transformations
• dilation—making the graph wider or narrower
• translation—shifting the graph left or right and up or down
• reflection—across the x and y axes
Sketching a parabola from transformations
Perform transformations in the correct order, dilation and reflection then translation. Weshould show the following key features:
• the shape—to show maximum or minimum
• the turning point—to show the translation of
• any other point (usually the y intercept or when
if the y intercept is at the turning point)—to show the dilation of y � x2
x � 1
y � x2
4
3 3
12
x
y
x
y
1
2
4x
y
4
3
2 1
3x
y
2
1 3 4
a � 0f (x) � ax2 � bx � c,
Essential Mathematics VELS Edition Year 10362
Summary
y intercept
x intercepts
Turning point
y � ax2 � bx � cwhere we can factoriseby inspection or table
at (0, c)
Factorise the equation anduse the null factor law todetermine the x intercepts. If there is only one xintercept it will occur at theturning point of the graph.
The x ordinate: half waybetween the x intercepts ifthere are 2 At the x intercept if there is 1 Substitute the x ordinateinto the equation
todetermine the y ordinate y � ax2 � bx � c
y � a(x � h)2 � k
substitute
at and
solving the equation usingthe null factor law
at (h, k)
If a is positive: minimumIf a is negative: maximum
0 � a(x � h)2 � ky � 0:
y � a(0 � h)2 � kx � 0:
y � ax2 � bx � c using the quadraticformula
at (0, c)
at
(0, 1 or 2 solutions or 0, 1, or 2 intercepts)If 0 x interceptsIf 1 x interceptIf 2 x intercepts
y is found by substituting x into the formula If a is positive: minimumIf a is negative: maximum
y � ax2 � bx � c.
x � �b
2a
¢ 0¢ � 0¢ � 0
x ��b � 2b2 � 4ac
2a,
�b � 2b2 � 4ac
2a
0 � ax2 � bx � cy � 0:
0521681774c08_p330_365.qxd 8/11/06 12:21 PM Page 362

Review
Multiple-choice questions
Questions 1 to 5 refer to the following graph
1 The turning point of the graph is
A B C D E
2 The coordinates of the y intercept are
A B C D E
3 The axis of symmetry is
A B C D E
4 The coordinates of the x intercepts are
A B C
D E
5 Which of the following statements is not true about the graph?
A It is a parabola. B It has 2 x intercepts. C It is a function.
D It passes through the origin. E It has a minimum turning point.
Questions 6 and 7 refer to the following graph
6 The equation of the graph is
A B C
D E
7 The transformation of to the graph shown can be described as
A a translation of 3 across and 2 up B a translation of 1 across and 3 up
C a dilation of 3 upwards D a translation of 1 in the x direction
E a dilation of 3 in the y direction
8 If the graph of is translated 3 units downward it
A has a maximum turning point B has 0 x intercepts
C has 1 x intercept D has 2 x intercepts
E has 2 y intercepts
y � x2
y � x2
f (x) � (x � 3)2 � 1f (x) � 3x2 � 1
f (x) � (x � 1)2 � 3f (x) � 3x2f (x) � (x � 1)2 � 3
x
y
(1, 3)
(�1, �2)(1, �3)(�3, 1)(0, �2)
(0, �1)(0, 3)(1, �3)(�2, 0)(�1, 0)(3, 0)
x � �3x � 1x � 3x � �1y � �2
x � 0(1, �3)(0, �2)(�2, 0)y � �2
(�1, 3)(1, �3)x � 3x � �1x � 1
x
y
3–10
(1, –3)
Chapter 8 — Quadratic graphs 363
0521681774c08_p330_365.qxd 8/11/06 12:21 PM Page 363
Rev
iew
9 The graph of has
A 0 x intercepts B 1 x intercept C 2 x intercepts
D 0 y intercepts E 2 y intercepts
10 The turning point for the parabola given by the quadratic equation is
A B C D E
1 Plot the graphs of the following, showing the key features.
a b c
2 For determine:
a f(0) b f (3) c d
3 Find the coordinates of the endpoints of for the given domains.
a b
4 Find the maximum value of f (x) if:
a b
5 Sketch the graphs of the following.
a b c d
6 Write equations that result from the transformation of by being:
a translated 3 units left and 2 units up
b reflected in the x axis and translated 4 units down
c reflected in the x axis and translated 4 units down
7 Sketch the graphs of the following functions, showing the turning point and anyintercepts.
a b c
d e f
8 Sketch the graphs of the following functions, showing the turning point and any intercepts.
a b
9 By first completing the square and rewriting the equation in turning-point form, determine:
i the turning point ii x intercepts (if any)
a b
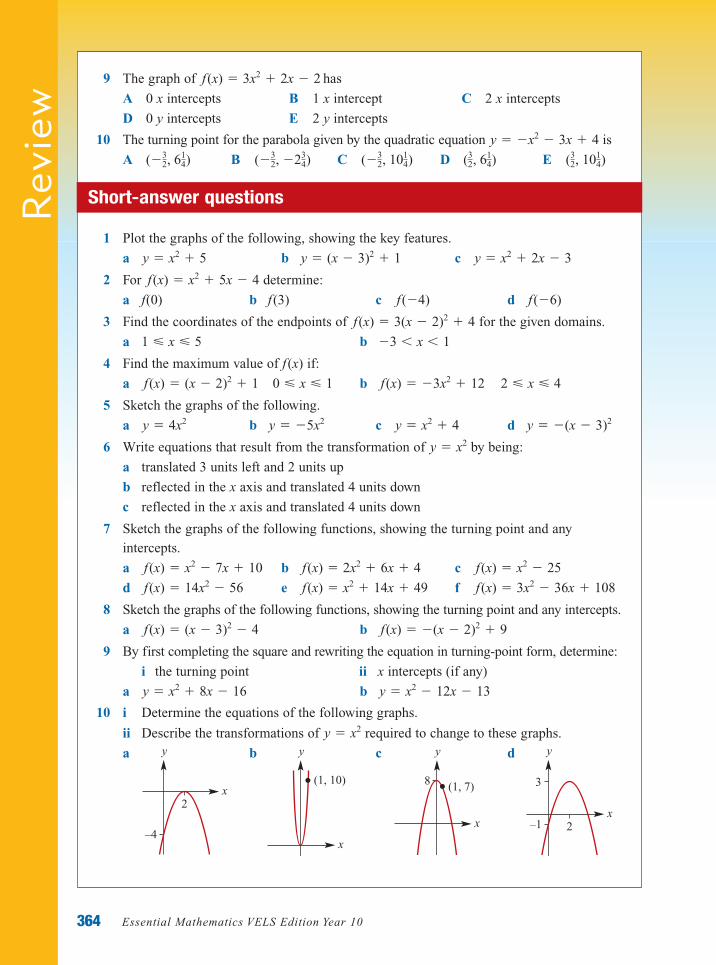
10 i Determine the equations of the following graphs.
ii Describe the transformations of required to change to these graphs.
a b c d
x
y
3
–1 2x
y
(1, 7)8
x
y
(1, 10)x
y
2
–4
y � x2
y � x2 � 12x � 13y � x2 � 8x � 16
f (x) � �(x � 2)2 � 9f (x) � (x � 3)2 � 4
f (x) � 3x2 � 36x � 108f (x) � x2 � 14x � 49f (x) � 14x2 � 56
f (x) � x2 � 25f (x) � 2x2 � 6x � 4f (x) � x2 � 7x � 10
y � x2
y � �(x � 3)2y � x2 � 4y � �5x2y � 4x2
2 � x � 4f (x) � �3x2 � 120 � x � 1f (x) � (x � 2)2 � 1
�3 � x � 11 � x � 5
f (x) � 3(x � 2)2 � 4
f (�6)f (�4)
f (x) � x2 � 5x � 4
y � x2 � 2x � 3y � (x � 3)2 � 1y � x2 � 5
(32, 101
4)(32, 6
14)(�3
2, 1014)(�3
2, �234)(�3
2, 614)
y � �x2 � 3x � 4
f (x) � 3x2 � 2x � 2
Essential Mathematics VELS Edition Year 10364
Short-answer questions
0521681774c08_p330_365.qxd 8/11/06 12:22 PM Page 364

Review
11 Use the quadratic formula to sketch the parabolas given by the following quadraticequations, labeling all significant points.
a
b
12 The dimensions of a rectangular are such that its length is 15 m longer than its width (x).
a Write an equation for the area of the rectangle A(x).
b If the area of the rectangle is determine its length.
13 a Plot the graph of the function f
b List the coordinates of:
i the x intercepts ii the y intercept iii the turning point
c Determine:
i f(0) ii f(6)
d Determine x when:
i ii
1 The cable for a suspension bridge is modelled by the equation
where h m is the distance above the base of the bridge and x m is the distance from theleft side of the bridge.
a Determine the turning point of the graph of the relationship.
b Determine the possible values of x.
c Determine the range of values of h.
d Sketch a graph of the equation over the appropriate domain.
e What distance does the cable span?
f What is the closest distance the cable is from the base of the bridge?
g What is the greatest distance the cable is from the base of the bridge?
2 An open rectangular box is 2 cm wider than it is high and twice as long as it is wide. If x cm is the height of the box:
a find an expression for its total surface area A(x) in terms of x
b find A(x) if:
i ii
c find the value of x if
d sketch the graph of A versus x for suitable values of x
e using a graphics calculator and its table of values determine the value of x (to
1 decimal place) if the block has a surface area of?
i ii 1000 cm3150 cm3
A(x) � 386
x � 2x � 1
cm2
h �1
1500 (x � 300)2 � 20
f (x) � 8f (x) � 0
(x) � x2 � 5x � 6.
100 m2,
y � �x2 � 3x � 4
y � x2 � 2x � 2
Chapter 8 — Quadratic graphs 365
Extended-response questions
MC
TEST
D&D
TEST
0521681774c08_p330_365.qxd 8/11/06 12:22 PM Page 365