the new european economic policyaei.pitt.edu/7716/1/brunet-f-01f.pdf · 2011-02-15 · sections....
TRANSCRIPT

Preliminary
Paper to be presented at the Tenth Biennial International Conference
of the European Union Studies Association, Montréal, Canada, May 17- 19, 2007
The New European Economic Policy:
An Analysis of its Development, Performance, and Limitations
Ferran Brunet
Universitat Autònoma de Barcelona
Department of Applied Economics
University Campus, Building B, E-08193 Bellaterra, Spain.
[email protected] ℡ 34-3-581-4580.
This version: May 8, 2007
1
The New European Economic Policy:
An Analysis of its Development, Performance, and Limitations
Ferran Brunet Universitat Autònoma de Barcelona
Abstract
The new European economy, complete with monetary union, gave rise to the emergence of a New European Economic Policy (NEEP). This paper takes as its task the analysis of: i) forms of the European Union elaborating on some of the specifics of the NEEP; ii) the problems the new European economy has which demand huge reforms: low employment rate, the rigidity of the labor market, non-competition in product and service markets, slowing of process of convergence with American levels, differences in living-standards, ageing and globalization; iii) the elements of the NEEP: Common policies such as those on competition, trade and agriculture, the program of pro-competitive structural reforms, monetary policy, and the coordination of economic and employment policies of the Member States; iv) European policy mix and its high performance except in regard to reforming economies of old Europe. The structural tendencies of the European economy need to be considerably more competitive. While maintaining this policy mix, reformations of the economic institutions need to be realized by linking Europe, competition and solidarity.
JEL E61, F15, N24. Keywords: European Economy, Economic Policy, Structural Reforms, European Integration, Europe.
La nouvelle économie et l’union monétaire de l’Europe pressent au déroulement d’une Nouvelle politique économique européenne (NEEP). Dans ce papier nous analysons: i) les formes de l’Union européenne qui expliquent certaines spécificités de la NEEP; ii) les problèmes de l’économie européenne qui demandent des réformes urgentes : taux d’emploi réduits, rigidité dans les marchés de travail et les salaires, absence de concurrence dans les marchés de facteurs et de produits, fin du procès de convergence vers les niveaux américains, écarts dans les niveaux de vie et les standards de consommation, vieillissement et globalisation; iii) les éléments qui composent la NEEP : les politiques communes comme celle de la concurrence, commerciale et agricole, les programmes de réformes structurelles pro-compétitives, la politique monétaire, ainsi que la coordination des politiques-économiques et d’emploi des États membres; et iv) les performances du policy mix européen, bonnes sauf en ce qui concerne aux réformes dont la vieille Europe a besoin. Pour surmonter plusieurs graves tendances structurelles de l‘économie européenne il convient de la rendre plus compétitive. Pour aboutir aux réformes écono9miques il faut établir un lien solide et brillant entre l’Europe, la concurrence et la solidarité.
A new European economic policy (NEEP) is in development. The analysis of this process is organized into four sections. Firstly, we profile the new European situation, in which 27 Member States (MS) constitute a European Union (EU) centred around values of peace, freedom, democracy, market economy, competition, welfare and social inclusion, while operating with special forms and of course the ensuing democratic, social and administrative deficits.
Secondly, we analyse the new European economy (EE) currently in formation, presenting the major differences between the old western states, the new eastern states and the territories in between, in which regulations are recurrent, competition is limited and social services for pensions, health and education takes up one-third of the income. The European catching-up process with American levels stopped a decade ago and the gap between respective living-standards is growing. The EU average employment rate is ten points under that of the American, and productivity is static. Aging, deindustrialization, globalization, delocation, immobility of workers, inflexibility of salaries, profusion of public regulations are the most daunting external, sociological and ideological challenges.
Thirdly, discussion of the development of a new European economic policy: from out of the monetary union, European monetary policy hastens the coordination of economic and employment policies. Growth, employment, price stabilization, sustainability of public finances are cultivated by limiting deficits. There are four sources for the NEEP: Community policies, through which are distinguished competition, regional and agricultural policies; the Lisbon
Department of Applied Economics, University Campus, Building B, E-08193 Bellaterra, Spain. [email protected] ℡ 34-3-581-4580.
Résumé
Introduction
2
strategy, for structural reforms that enlarge employment by promoting competition in factor, product and service markets in a new and open economy based on information technologies; European monetary policy; and the coordination of economic and employment policies.
Fourthly, the analysis of the performance and limitations of the new EE and the NEEP. Europe is more stable, nevertheless is growing at a slower pace. Currently, employment is growing but productivity is slowing. Pro-competitive reforms (despite an overwhelming consensus that the EE urgently needs them) have been stalled, more precisely in the bigger nations of the Union. The current European policy mix is performing well, though the slightest sneeze from America could wipe out the European twin surpluses. This is essential for a commencing policy in a complex Europe that as of yet has not the means required of a powerful new economy and its common political and social ambitions. But the structural dynamics of Europe need to be accompanied, counterbalanced, and its impacts anticipated by substantial economy reforms which its governments are incapable of instigating. A link between the EU and its policies, ineluctable competition and interpersonal/interstate solidarity should be more conducive to applying these structural reforms.
I. The New European Economy
The NEEP being developed together by the EU and by its MS. The NEEP respond to the new EE and to new
economic policy orientations.
A. An European Economy in formation
The EU is now comprised of 27 MS: the 6 founder MS, the 9 more recently joined MS from Western Europe forming with the first the EU15, and the 12 MS joined in 2004 and 2007, 10 of them former socialist countries. Thus the first threat of the EE is diversity. There are MS of all sizes and in all kinds of conditions. 6 of them are big countries, from 80 to 40 millions inhabitants: Germany, France, United Kingdom, Italy, Spain, and Poland. Some MS are medium countries e.g. The Netherlands, Belgium or Sweden. A lot of MS are small e.g. Denmark, Ireland or the Czech Republic, and some MS are little countries e.g. Luxemburg, Cyprus or Malta. Naturally the conditions, abilities, activities and performances are quite different, divergent, and complimentary. Sometimes they are seemingly-incompatible in their historical, cultural, political, sociological, and economic aspects, and sometimes they are in opposition.
This is precisely the value of the EU: a common civilization and contemporary union of the diverse, the search for peace and gentle neighborhoods, common freedom and development. Unanimity, law, gradualism and the economy are the principles of the EU’s path.
The EU law, the primary law established in the Treaties and the deriving law produced by the EU institutions, always prevails. The so-called Common, Community or European policies are usually just that for every MS, sometimes with some regional adjustments. This is the case for the Common Market, and thus for the competition rules, foreign commercial policy, and for some special common policies developed by the EU institutions, namely the Council of the Union, the European Commission (EC), and the European Parliament.
From 1986 the Common Market was turned into an Unique Market, enforcing competition policy and extending it to all service activities. From 1999 some of the EU MS formed a monetary union. Today 13 MS are in the euro area (€A). But diversity in the EU is higher than in the United States (US) and the integration quite less advanced.
Democracy and the rule of law, as well as private property and market orientation prevail in all the EU MS. But there are different traditions even in its contemporary There are two poles in considering the EE: advanced economies, with high productivity applied to mass consumption and high social protection in old Western Europe, and developing economies in transition in new Central and Eastern Europe. But in the old EU different sensibilities exist related to economic and policies. There are the Nordic States, with more social-democratic models and in which the small countries perform highly using flexicurity.1 (Karl Aiginger, 2005; Wolfgang Streek and Christine Trampusch, 2005)
In continental MS such as France and Germany the socio-economic model is based on a labor market more paternalist and regulated and in a State-oriented fashion. The Mediterranean socioeconomic model is the most regulated: Italy, Greece, Portugal and Spain have the largest and most persistent MS regulations in the markets of products and services, and in the labor market of course. (OECD, 2002 and 2007a).The United Kingdom and Ireland are the liberal exceptions to the European panorama, with a more pro-competitive socioeconomic model orientation, even though social expenditures in education, health and pensions surpass one third of the GDP, as in the rest of the EU15. With all of this, a European economy is in formation: first by the common market, labor mobility, capital circulation, and monetary integration; second by policy coordination between MS and its integration in the EU. Activities and forms, performances and relations are grow more commonly European. (EC-DG Ecofin, 2006).
The benefits of economic integration are made evident by researchers from Bela Balassa to Paul Krugman. European economic integration produces a large domestic market, and thus greater efficiency, productivity, and
1 The neologism flexisecurity or flexicurity combines the flexibility for employers with the security for employee, the liberty of employment with the protection of workers. (On flexicurity see below the table 6 and in the Appendix the table D.)
3
competitiveness (ECB, 2006) But some deriving problems exist also, solvable by the benefits of the integration process. 2
B. The Dynamics of the European Economy
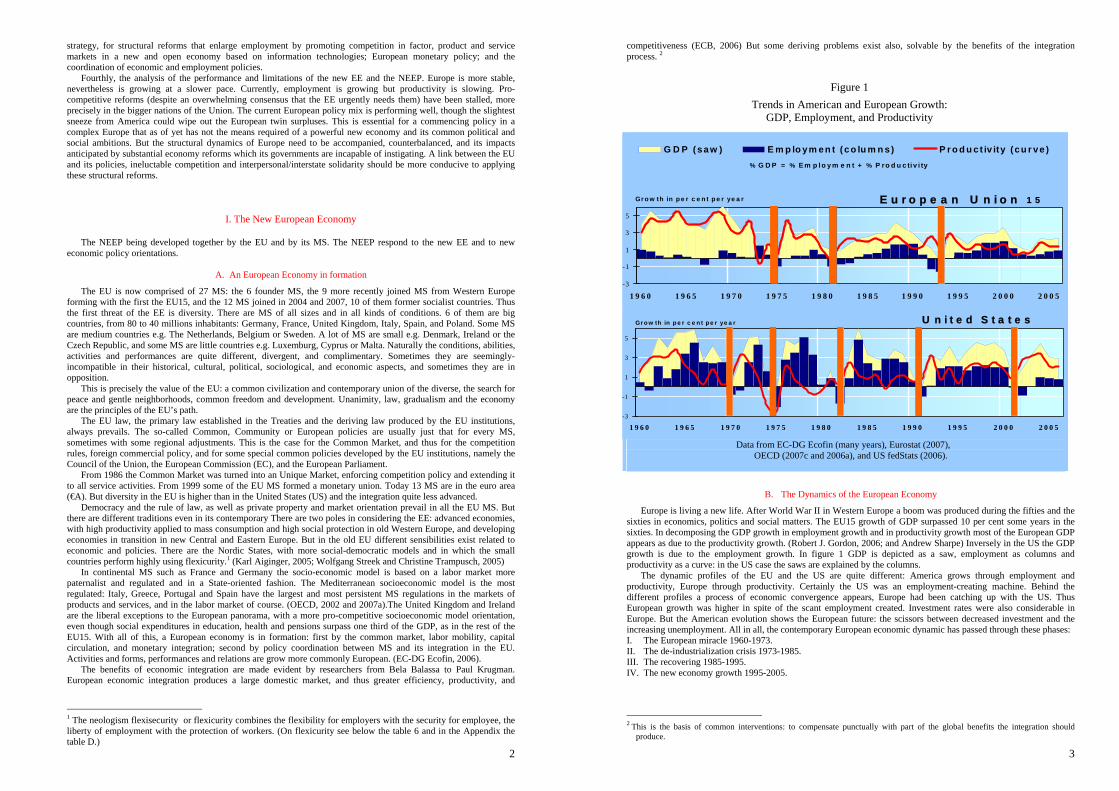
Europe is living a new life. After World War II in Western Europe a boom was produced during the fifties and the sixties in economics, politics and social matters. The EU15 growth of GDP surpassed 10 per cent some years in the sixties. In decomposing the GDP growth in employment growth and in productivity growth most of the European GDP appears as due to the productivity growth. (Robert J. Gordon, 2006; and Andrew Sharpe) Inversely in the US the GDP growth is due to the employment growth. In figure 1 GDP is depicted as a saw, employment as columns and productivity as a curve: in the US case the saws are explained by the columns.
The dynamic profiles of the EU and the US are quite different: America grows through employment and productivity, Europe through productivity. Certainly the US was an employment-creating machine. Behind the different profiles a process of economic convergence appears, Europe had been catching up with the US. Thus European growth was higher in spite of the scant employment created. Investment rates were also considerable in Europe. But the American evolution shows the European future: the scissors between decreased investment and the increasing unemployment. All in all, the contemporary European economic dynamic has passed through these phases: I. The European miracle 1960-1973. II. The de-industrialization crisis 1973-1985. III. The recovering 1985-1995. IV. The new economy growth 1995-2005.
2 This is the basis of common interventions: to compensate punctually with part of the global benefits the integration should
produce.
Figure 1
Trends in American and European Growth: GDP, Employment, and Productivity
-3
-1
1
3
5
1 9 6 0 1 9 6 5 1 9 7 0 1 9 7 5 1 9 8 0 1 9 8 5 1 9 9 0 1 9 9 5 2 0 0 0 2 0 0 5
G D P (saw ) E m p lo ym en t (co lu m n s) P r o d u c t iv ity (cu r ve )
E u r o p e a n U n io n 1 5
% G D P = % E m p lo y m e n t + % P ro d u c tiv i ty
Gr o w th in p e r c e n t p e r ye a r
-3
-1
1
3
5
1 9 6 0 1 9 6 5 1 9 7 0 1 9 7 5 1 9 8 0 1 9 8 5 1 9 9 0 1 9 9 5 2 0 0 0 2 0 0 5
U n i t e d S t a t e sGr o w th in p e r c e n t p e r ye a r
Data from EC-DG Ecofin (many years), Eurostat (2007), OECD (2007c and 2006a), and US fedStats (2006).

4
But the European catching-up process halted in 1995. Thus this is the major question on European economic dynamics and economic policy. Reasons explaining this hiatus in the convergence process of the EE to American levels: I. The maturity of the growth process in which the quantitative changes have less impact and in which qualitative
changes are required to maintain the earlier high growth rates. (Karl Aiginger, 2004). II. The lessened capacity of the EE to profit from the so-called New Economy based on:
• The new technological paradigm mixing electronics and information, diffusing the use of computers into all activities, and opening new fields in the use of biological advancements. (Martin Neil Baily and Jacob Funk Kirkegaard, 2004)
• The privatization of the economy, reducing public enterprises, public subsidies, and public regulations. (OECD, 2007a)
• The globalization of activities, enlarging the size of productions, opening new markets, reducing frontiers, producing cheaply on a world scale (Richard Florida, 2002; and Richard Florida and Irene Tinagli, 2004) .
III. The less competitive orientation of the European economy. (Olaf Gersemann, 2004) IV. The integration economy gap, limiting the size and the competitiveness of the market, called the cost of non-
Europe. (Tomasso Padoa Schioppa, dir., 1987 and EC-DG Ecofin, many years) Thus the big problem is not the productivity gap but the living standard gap. In other words advanced economies share a broadly similar production frontier (John Kay, 2005), or they can share a similar productivity. 3
C. Problems of the New European Economy
The NEE is historically an important result in point of view of the political equilibrium it shows, of the economic performance it produces, and of the social cohesion it generates. But there are two mixed problems: i) the immediate differences between what the EE is and what it should be, and ii) the present and future structural problems derived from its condition, that of mature economy. The EE should perform more easily if some policies and structural reforms are introduced. The size of the future problems depends from the current structural problems and by the delay in introducing the reforms needed. The current structural problems of the EE can be summarized as follows:
3 See table A in the Appendix for an estimation of the costs of the gaps, the elements contributing to explain the Europe/America
gaps.
Table 1
Elements of the Socio-economic European Model and Pillars of the European Economy
A. Developed Economy B. Rule of Law
C. Welfare State
acquired in EU15,
in formation in other MS
C.1. Employment and Labour Market Protection
Contracts, bargaining, and layoff
Pensions
C.2. Social Services SSS
Health
A.1. Advanced Economy (EU 15)
High productivity, High material and energy consumptions,
Competition, Efficiency, Equity, Free foreign trade, Mass
production for mass consumption
A.2. Transition Economy
(almost 10 new MS of the EU 27) High growth, Economic
convergence, Privatization
B.1. Political Freedom
Representation and democracy, Power separation,
Personal rights: from liberties to social services, Justice, Security
Liberté, égalité, fraternité
B.2. Economic Freedom
Limited regulation, Law security, Transparency, No corruption
Education
C.3. Social policies
Fiscal redistribution, Cohesion: family, housing,
integration, Compensatory and active social policies, Income
guarantee
5
I. The gap between the European and the American levels of productivity4: the gap was reduced from 9% in 1990 to 18 % in 2006 (see the figure 2). From a historical perspective, European productivity caught up with American productivity in the nineties and fell afterwards. (Robert J. Gordon and Ian Dew-Becker, 2005)
II. The gap between European and the American standard of living5: in 1990 the European GDP per capita was 75% of the American, in 2006 it was 71%. From a historical perspective, the European living-standard maintained this gap relative to the American, despite the important growth in productivity. Europe is not applying the growth of productivity to living-standard.
III. The European gap between productivity and living-standard: From a historical perspective the two curves produce an ‘X’. This gap was inverted in the early seventies and then enlarged. Relative to the American, European productivity grew until the nineties but the living-standard planed out. If not to living-standard, to where did these productivity increases go?
IV. The halting of the convergence and catching-up process between the European and the American economies from 1990.
V. The gaps existing between MS in productivity and especially in living-standard. The European convergence process between MS appears to have stopped. Analyses of the EE dynamics and structure are unanimous and conclusive. Europe suffers from :
I. A low utilization of the labor force. This is due to an exiguous employment rate. The European employment rate is less than 65,5% while the American surpasses 72% (see the figure 3 and EC. DG Employment, 2006: 21). This is the key problem. This little employment rate explains both the European productivity difference from America and the European gap between productivity and living-standard. In MS the employment rate varies: the Mediterranean countries as France, Italy, and especially Spain, Portugal and Greece have the lowest employment rate of the EU15.In the new MS the employment rate was higher in the past, but in the current transition phase is falling below the EU15 average.
II. Labor force rigidity, producing extreme immobility,6 an inflexibility of wages in the economic situation and sector productivity dynamics. Inflation and the general productivity clause are the primary elements in bargaining. (R. Schettkat, 2003)
III. A deficit of competition and over-regulation. Not just factor markets, product and service markets had restricted accessibility. The over-regulation of activities is a European speciality. Nevertheless some progresses in deregulating were produced in the last decades. (OECD, 2002, 2003 and 2007a)
IV. A deficit in technological investments and in high-tech productions. The new knowledge economy and competitiveness works together (Maria Joao Rodrigues, ed, 2003 and 2004).
4 Productivity can be analysed by GDP per employed and by GDP per worked hour. (OECD, 2003) 5 Living-standard can be analysed by GDP per capita. (Ibid.) 6 Only 1,6% of the EU15 population is living in a MS different from their national MS. (Ferran Brunet, 1999 and 2006b).
Figure 2
Economic Convergence Process: The European Catching-Up of America
7175
71
69
8682
68 6869
6772
72
59 58
91 90 90
84
GDP per capitaGDP per worked hour
US = 100
EU1
Data from US Council of Economic Advisers (2007), Eurostat (2007), and OECD (2007c).
6
D. The European Sources of Growth
Vectors of Economic Policy, and the Benefits of Structural Reforms
What are the EU’s sources of growth? The EU is composed of two groups of countries: the advanced economies forming the EU15 and the rest, the transitional economies. For these latter countries growth depends largely on their incardination in the EE, in particular on the investments they can attract from EU15, US, Japan and other developed countries.
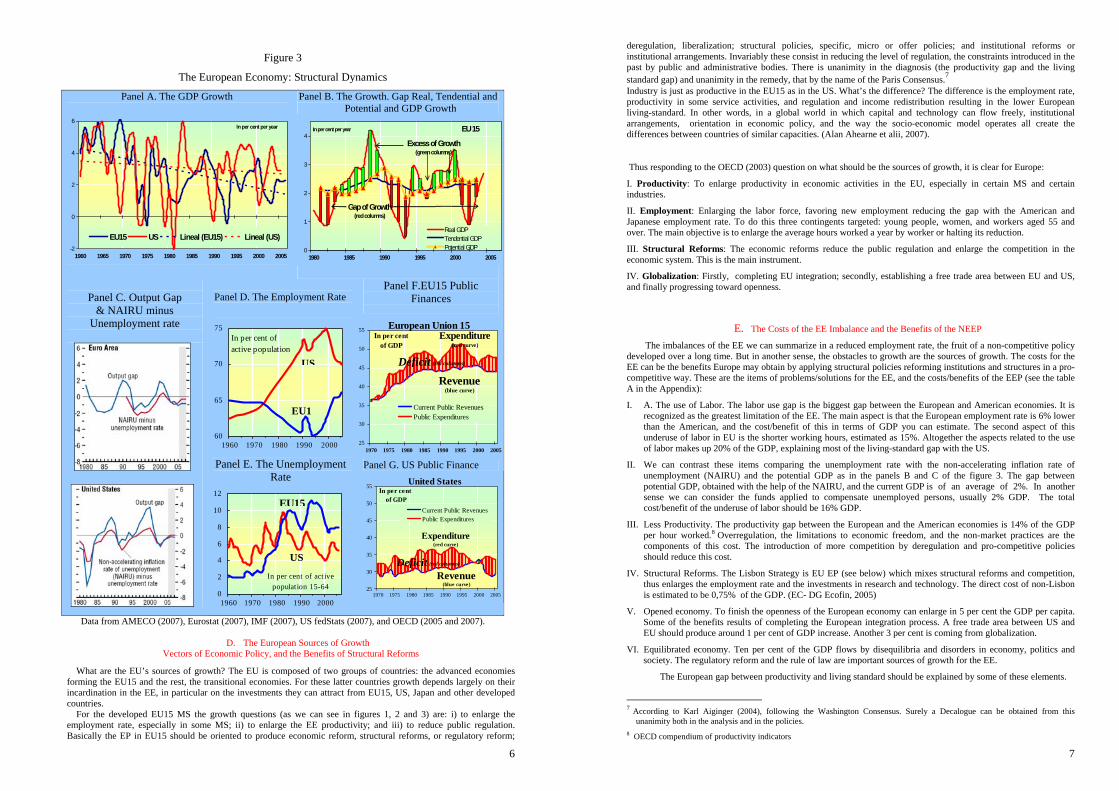
For the developed EU15 MS the growth questions (as we can see in figures 1, 2 and 3) are: i) to enlarge the employment rate, especially in some MS; ii) to enlarge the EE productivity; and iii) to reduce public regulation. Basically the EP in EU15 should be oriented to produce economic reform, structural reforms, or regulatory reform;
Figure 3
The European Economy: Structural Dynamics
Panel A. The GDP Growth
-2
0
2
4
6
1960 1965 1970 1975 1980 1985 1990 1995 2000 2005
EU15 US Lineal (EU15) Lineal (US)
In per cent per year
Panel B. The Growth. Gap Real, Tendential and Potential and GDP Growth
0
1
2
3
4
1980 1985 1990 1995 2000 2005
Real GDPTendential GDPPotential GDP
EU 15
Excess of Growth (green columns)
Gap of Growth(red columns)
In per cent per year
Panel C. Output Gap & NAIRU minus
Unemployment rate
Panel D. The Employment Rate
60
65
70
75
1960 1970 1980 1990 2000
US
EU1
In per cent of active population
Panel E. The Unemployment Rate
0
2
4
6
8
10
12
1960 1970 1980 1990 2000
US
EU15
In per cent of act ive population 15-64
Panel F.EU15 Public Finances
European Union 15
25
30
35
40
45
50
55
1970 1975 1980 1985 1990 1995 2000 2005
Current Public RevenuesPublic Expenditures
In per cent of GDP
Expenditure (red curve)
Deficit (red columns)
Revenue (blue curve)
Panel G. US Public Finance United States
25
30
35
40
45
50
55
1970 1975 1980 1985 1990 1995 2000 2005
Current Public RevenuesPublic Expenditures
In per cent of GDP
Expenditure (red curve)
Deficit (red columns)
Revenue (blue curve)
Data from AMECO (2007), Eurostat (2007), IMF (2007), US fedStats (2007), and OECD (2005 and 2007).
7
deregulation, liberalization; structural policies, specific, micro or offer policies; and institutional reforms or institutional arrangements. Invariably these consist in reducing the level of regulation, the constraints introduced in the past by public and administrative bodies. There is unanimity in the diagnosis (the productivity gap and the living standard gap) and unanimity in the remedy, that by the name of the Paris Consensus.7
Industry is just as productive in the EU15 as in the US. What’s the difference? The difference is the employment rate, productivity in some service activities, and regulation and income redistribution resulting in the lower European living-standard. In other words, in a global world in which capital and technology can flow freely, institutional arrangements, orientation in economic policy, and the way the socio-economic model operates all create the differences between countries of similar capacities. (Alan Ahearne et alii, 2007).
Thus responding to the OECD (2003) question on what should be the sources of growth, it is clear for Europe:
I. Productivity: To enlarge productivity in economic activities in the EU, especially in certain MS and certain industries.
II. Employment: Enlarging the labor force, favoring new employment reducing the gap with the American and Japanese employment rate. To do this three contingents targeted: young people, women, and workers aged 55 and over. The main objective is to enlarge the average hours worked a year by worker or halting its reduction.
III. Structural Reforms: The economic reforms reduce the public regulation and enlarge the competition in the economic system. This is the main instrument.
IV. Globalization: Firstly, completing EU integration; secondly, establishing a free trade area between EU and US, and finally progressing toward openness.
E. The Costs of the EE Imbalance and the Benefits of the NEEP The imbalances of the EE we can summarize in a reduced employment rate, the fruit of a non-competitive policy
developed over a long time. But in another sense, the obstacles to growth are the sources of growth. The costs for the EE can be the benefits Europe may obtain by applying structural policies reforming institutions and structures in a pro-competitive way. These are the items of problems/solutions for the EE, and the costs/benefits of the EEP (see the table A in the Appendix):
I. A. The use of Labor. The labor use gap is the biggest gap between the European and American economies. It is recognized as the greatest limitation of the EE. The main aspect is that the European employment rate is 6% lower than the American, and the cost/benefit of this in terms of GDP you can estimate. The second aspect of this underuse of labor in EU is the shorter working hours, estimated as 15%. Altogether the aspects related to the use of labor makes up 20% of the GDP, explaining most of the living-standard gap with the US.
II. We can contrast these items comparing the unemployment rate with the non-accelerating inflation rate of unemployment (NAIRU) and the potential GDP as in the panels B and C of the figure 3. The gap between potential GDP, obtained with the help of the NAIRU, and the current GDP is of an average of 2%. In another sense we can consider the funds applied to compensate unemployed persons, usually 2% GDP. The total cost/benefit of the underuse of labor should be 16% GDP.
III. Less Productivity. The productivity gap between the European and the American economies is 14% of the GDP per hour worked.8 Overregulation, the limitations to economic freedom, and the non-market practices are the components of this cost. The introduction of more competition by deregulation and pro-competitive policies should reduce this cost.
IV. Structural Reforms. The Lisbon Strategy is EU EP (see below) which mixes structural reforms and competition, thus enlarges the employment rate and the investments in research and technology. The direct cost of non-Lisbon is estimated to be 0,75% of the GDP. (EC- DG Ecofin, 2005)
V. Opened economy. To finish the openness of the European economy can enlarge in 5 per cent the GDP per capita. Some of the benefits results of completing the European integration process. A free trade area between US and EU should produce around 1 per cent of GDP increase. Another 3 per cent is coming from globalization.
VI. Equilibrated economy. Ten per cent of the GDP flows by disequilibria and disorders in economy, politics and society. The regulatory reform and the rule of law are important sources of growth for the EE.
The European gap between productivity and living standard should be explained by some of these elements.
7 According to Karl Aiginger (2004), following the Washington Consensus. Surely a Decalogue can be obtained from this
unanimity both in the analysis and in the policies. 8 OECD compendium of productivity indicators
8
II. The New European Union
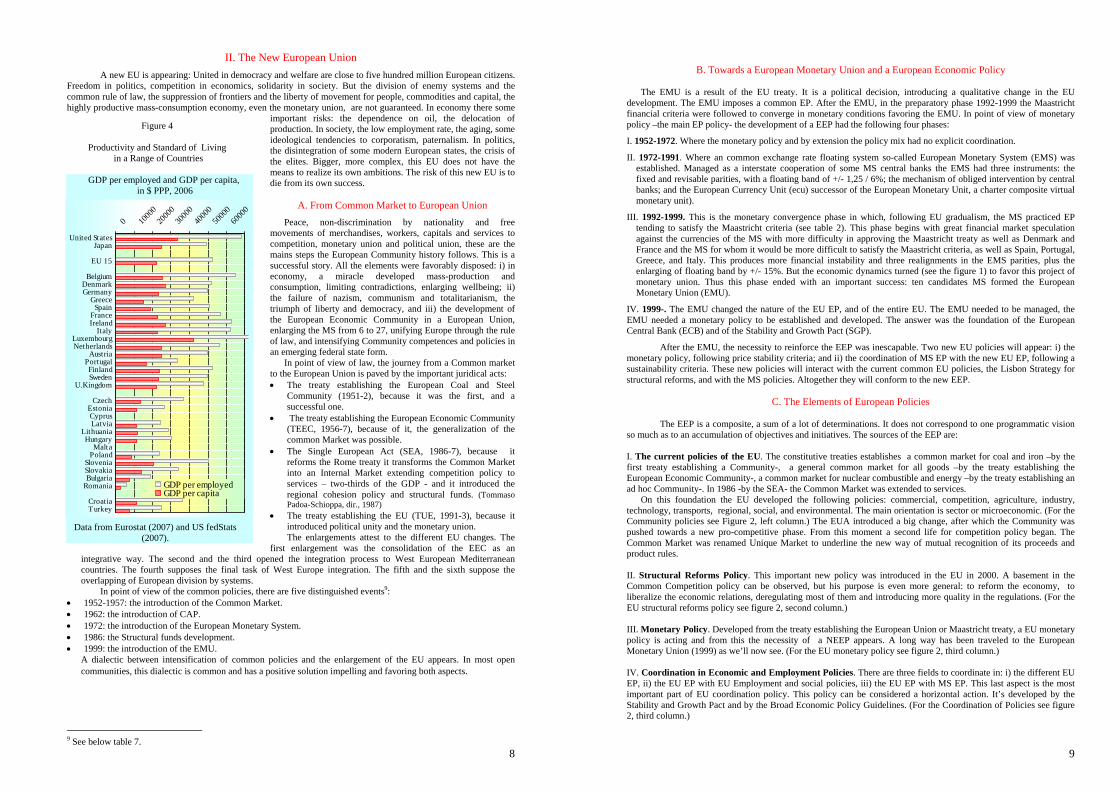
A new EU is appearing: United in democracy and welfare are close to five hundred million European citizens. Freedom in politics, competition in economics, solidarity in society. But the division of enemy systems and the common rule of law, the suppression of frontiers and the liberty of movement for people, commodities and capital, the highly productive mass-consumption economy, even the monetary union, are not guaranteed. In economy there some
important risks: the dependence on oil, the delocation of production. In society, the low employment rate, the aging, some ideological tendencies to corporatism, paternalism. In politics, the disintegration of some modern European states, the crisis of the elites. Bigger, more complex, this EU does not have the means to realize its own ambitions. The risk of this new EU is to die from its own success.
A. From Common Market to European Union Peace, non-discrimination by nationality and free
movements of merchandises, workers, capitals and services to competition, monetary union and political union, these are the mains steps the European Community history follows. This is a successful story. All the elements were favorably disposed: i) in economy, a miracle developed mass-production and consumption, limiting contradictions, enlarging wellbeing; ii) the failure of nazism, communism and totalitarianism, the triumph of liberty and democracy, and iii) the development of the European Economic Community in a European Union, enlarging the MS from 6 to 27, unifying Europe through the rule of law, and intensifying Community competences and policies in an emerging federal state form.
In point of view of law, the journey from a Common market to the European Union is paved by the important juridical acts: • The treaty establishing the European Coal and Steel
Community (1951-2), because it was the first, and a successful one.
• The treaty establishing the European Economic Community (TEEC, 1956-7), because of it, the generalization of the common Market was possible.
• The Single European Act (SEA, 1986-7), because it reforms the Rome treaty it transforms the Common Market into an Internal Market extending competition policy to services – two-thirds of the GDP - and it introduced the regional cohesion policy and structural funds. (Tommaso Padoa-Schioppa, dir., 1987)
• The treaty establishing the EU (TUE, 1991-3), because it introduced political unity and the monetary union. The enlargements attest to the different EU changes. The
first enlargement was the consolidation of the EEC as an integrative way. The second and the third opened the integration process to West European Mediterranean countries. The fourth supposes the final task of West Europe integration. The fifth and the sixth suppose the overlapping of European division by systems. In point of view of the common policies, there are five distinguished events9:
• 1952-1957: the introduction of the Common Market. • 1962: the introduction of CAP. • 1972: the introduction of the European Monetary System. • 1986: the Structural funds development. • 1999: the introduction of the EMU.
A dialectic between intensification of common policies and the enlargement of the EU appears. In most open communities, this dialectic is common and has a positive solution impelling and favoring both aspects.
9 See below table 7.
Figure 4
Productivity and Standard of Living in a Range of Countries
GDP per employed and GDP per capita,
in $ PPP, 2006
0 1000
020
000
3000
040
000
5000
060
000
United StatesJapan
EU 15
BelgiumDenmarkGermany
GreeceSpain
FranceIreland
ItalyLuxembourgNetherlands
AustriaPortugalFinlandSweden
U.Kingdom
CzechEstoniaCyprusLatvia
LithuaniaHungary
MaltaPoland
SloveniaSlovakiaBulgaria
Romania
CroatiaTurkey
GDP per employedGDP per capita
Data from Eurostat (2007) and US fedStats
(2007).
9
B. Towards a European Monetary Union and a European Economic Policy
The EMU is a result of the EU treaty. It is a political decision, introducing a qualitative change in the EU development. The EMU imposes a common EP. After the EMU, in the preparatory phase 1992-1999 the Maastricht financial criteria were followed to converge in monetary conditions favoring the EMU. In point of view of monetary policy –the main EP policy- the development of a EEP had the following four phases:
I. 1952-1972. Where the monetary policy and by extension the policy mix had no explicit coordination.
II. 1972-1991. Where an common exchange rate floating system so-called European Monetary System (EMS) was established. Managed as a interstate cooperation of some MS central banks the EMS had three instruments: the fixed and revisable parities, with a floating band of +/- 1,25 / 6%; the mechanism of obliged intervention by central banks; and the European Currency Unit (ecu) successor of the European Monetary Unit, a charter composite virtual monetary unit).
III. 1992-1999. This is the monetary convergence phase in which, following EU gradualism, the MS practiced EP tending to satisfy the Maastricht criteria (see table 2). This phase begins with great financial market speculation against the currencies of the MS with more difficulty in approving the Maastricht treaty as well as Denmark and France and the MS for whom it would be more difficult to satisfy the Maastricht criteria, as well as Spain, Portugal, Greece, and Italy. This produces more financial instability and three realignments in the EMS parities, plus the enlarging of floating band by +/- 15%. But the economic dynamics turned (see the figure 1) to favor this project of monetary union. Thus this phase ended with an important success: ten candidates MS formed the European Monetary Union (EMU).
IV. 1999-. The EMU changed the nature of the EU EP, and of the entire EU. The EMU needed to be managed, the EMU needed a monetary policy to be established and developed. The answer was the foundation of the European Central Bank (ECB) and of the Stability and Growth Pact (SGP).
After the EMU, the necessity to reinforce the EEP was inescapable. Two new EU policies will appear: i) the monetary policy, following price stability criteria; and ii) the coordination of MS EP with the new EU EP, following a sustainability criteria. These new policies will interact with the current common EU policies, the Lisbon Strategy for structural reforms, and with the MS policies. Altogether they will conform to the new EEP.
C. The Elements of European Policies
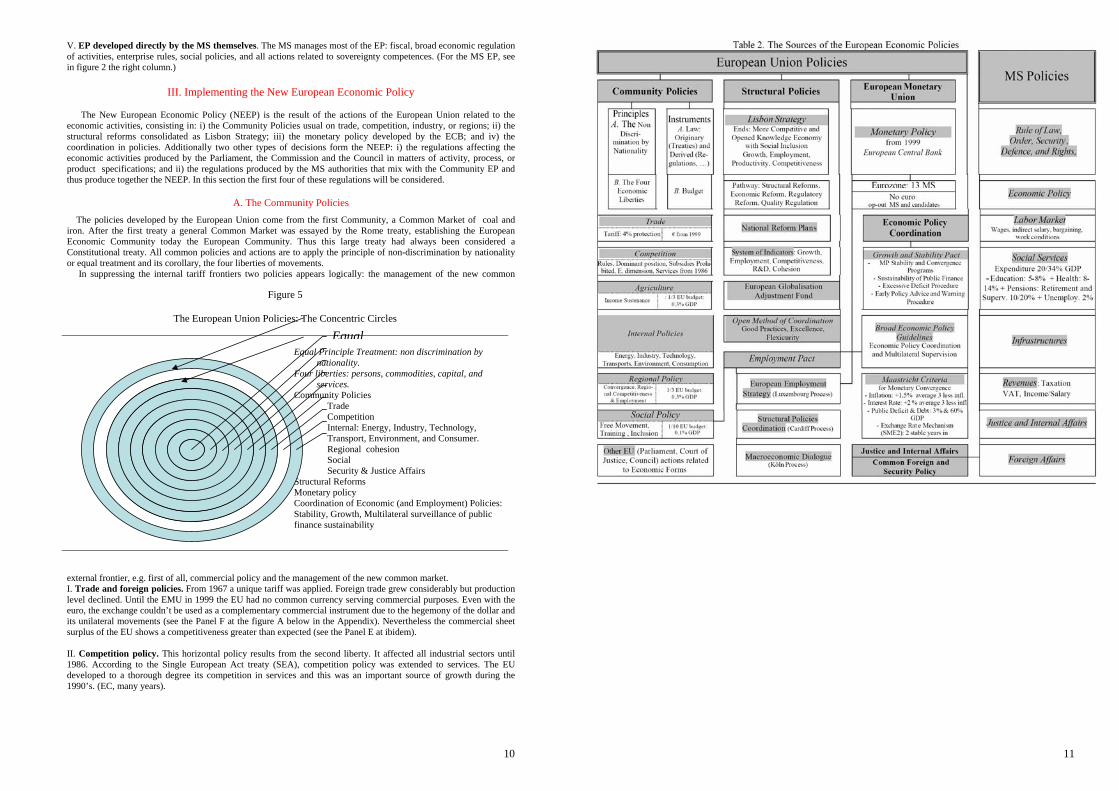
The EEP is a composite, a sum of a lot of determinations. It does not correspond to one programmatic vision so much as to an accumulation of objectives and initiatives. The sources of the EEP are:
I. The current policies of the EU. The constitutive treaties establishes a common market for coal and iron –by the first treaty establishing a Community-, a general common market for all goods –by the treaty establishing the European Economic Community-, a common market for nuclear combustible and energy –by the treaty establishing an ad hoc Community-. In 1986 -by the SEA- the Common Market was extended to services.
On this foundation the EU developed the following policies: commercial, competition, agriculture, industry, technology, transports, regional, social, and environmental. The main orientation is sector or microeconomic. (For the Community policies see Figure 2, left column.) The EUA introduced a big change, after which the Community was pushed towards a new pro-competitive phase. From this moment a second life for competition policy began. The Common Market was renamed Unique Market to underline the new way of mutual recognition of its proceeds and product rules.
II. Structural Reforms Policy. This important new policy was introduced in the EU in 2000. A basement in the Common Competition policy can be observed, but his purpose is even more general: to reform the economy, to liberalize the economic relations, deregulating most of them and introducing more quality in the regulations. (For the EU structural reforms policy see figure 2, second column.) III. Monetary Policy. Developed from the treaty establishing the European Union or Maastricht treaty, a EU monetary policy is acting and from this the necessity of a NEEP appears. A long way has been traveled to the European Monetary Union (1999) as we’ll now see. (For the EU monetary policy see figure 2, third column.) IV. Coordination in Economic and Employment Policies. There are three fields to coordinate in: i) the different EU EP, ii) the EU EP with EU Employment and social policies, iii) the EU EP with MS EP. This last aspect is the most important part of EU coordination policy. This policy can be considered a horizontal action. It’s developed by the Stability and Growth Pact and by the Broad Economic Policy Guidelines. (For the Coordination of Policies see figure 2, third column.)
10
V. EP developed directly by the MS themselves. The MS manages most of the EP: fiscal, broad economic regulation of activities, enterprise rules, social policies, and all actions related to sovereignty competences. (For the MS EP, see in figure 2 the right column.)
III. Implementing the New European Economic Policy
The New European Economic Policy (NEEP) is the result of the actions of the European Union related to the
economic activities, consisting in: i) the Community Policies usual on trade, competition, industry, or regions; ii) the structural reforms consolidated as Lisbon Strategy; iii) the monetary policy developed by the ECB; and iv) the coordination in policies. Additionally two other types of decisions form the NEEP: i) the regulations affecting the economic activities produced by the Parliament, the Commission and the Council in matters of activity, process, or product specifications; and ii) the regulations produced by the MS authorities that mix with the Community EP and thus produce together the NEEP. In this section the first four of these regulations will be considered.
A. The Community Policies
The policies developed by the European Union come from the first Community, a Common Market of coal and iron. After the first treaty a general Common Market was essayed by the Rome treaty, establishing the European Economic Community today the European Community. Thus this large treaty had always been considered a Constitutional treaty. All common policies and actions are to apply the principle of non-discrimination by nationality or equal treatment and its corollary, the four liberties of movements.
In suppressing the internal tariff frontiers two policies appears logically: the management of the new common
external frontier, e.g. first of all, commercial policy and the management of the new common market. I. Trade and foreign policies. From 1967 a unique tariff was applied. Foreign trade grew considerably but production level declined. Until the EMU in 1999 the EU had no common currency serving commercial purposes. Even with the euro, the exchange couldn’t be used as a complementary commercial instrument due to the hegemony of the dollar and its unilateral movements (see the Panel F at the figure A below in the Appendix). Nevertheless the commercial sheet surplus of the EU shows a competitiveness greater than expected (see the Panel E at ibidem). II. Competition policy. This horizontal policy results from the second liberty. It affected all industrial sectors until 1986. According to the Single European Act treaty (SEA), competition policy was extended to services. The EU developed to a thorough degree its competition in services and this was an important source of growth during the 1990’s. (EC, many years).
Figure 5
The European Union Policies: The Concentric Circles
Equal Principle Treatment: non discrimination by
nationality. Four liberties: persons, commodities, capital, and
services. Community Policies
Trade Competition Internal: Energy, Industry, Technology, Transport, Environment, and Consumer. Regional cohesion Social Security & Justice Affairs
Structural Reforms Monetary policy Coordination of Economic (and Employment) Policies: Stability, Growth, Multilateral surveillance of public finance sustainability
Equal
11

III. Internal Policies: Energy, Industry, Technology, Transport, Environment and other internal policies. There are a lot of actions related to incidental problems creating a Industrial Strategy (European Parliament. DG for Research, 2007). Even with a Community for iron and coal and another for nuclear, European energy policy was not developed and the oil was managed outside EU policies. In fact, the common market in all sectors and competition policy is the main industrial policy of the EU. Probably the Lisbon Strategy (see below) and the European subsidized projects on technology the regional and cohesion policy should serve the competitiveness of the EE. IV. Agriculture Policy. The Common Agricultural Policy (CAP) is the European policy with the largest budgetary impact. There was no doubt as to the main Community policy: the CAP was the way to finance the revolution that occurred in the European agriculture during the last five decades. Productivity was multiplied using intensively industrial inputs as machinery, oil, and fertilizers. The CAP supposes 40 per cent of the EU budget, 40,000 M € per year, 0.4 per cent of the EU GDP.10 From 2003 the decoupling introduced between the production and the subsidies the farmer receives can favor the final dismantling of the CAP in the next financial period 2013-2019. (Eurostat, 2006a) V. Regional Policy. The Cohesion Policy is the EU’s way of reducing the territorial income differences. Developed in the late 1980’s after the enlargement of differences between the MS due to the accession of the United Kingdom and Ireland and of Greece, Portugal and Spain, regional policy co-financed public investments in selected areas of the EU, usually infrastructure. These so-called structural funds represent one third of the EU budget, 40,000 M € per year, 0.4 per cent of the EU GDP. (European Court of Auditors, 2006.) The 2004 and 2007 enlargements with twelve new MS with incomes well under the EU average obliged an important remake of regional policy, to the detriment of the old Mediterranean MS. The Lisbon Strategy for structural reforms introduced a pro-competitive orientation in regional EU policy. (EC-DG Regional Policy, 2004) VI. Social Policies. European social actions turn on the first liberty of free movement of MS citizens. Thus the coordination of social security systems (SSS) to totalize the rights acquired in different SSS was developed. In training, work conditions, non-discrimination by gender, sexual orientation, race, and age the EU promoted a lot of projects searching for excellence and the demonstration of good practices in social inclusion. MS maintained all the competences in SSS, labor market, bargaining, unions, the capabilities to develop a visible EU social policy are limited. Thus the EU way in social and employment matters is the coordination of the MS
policies (see below). (EC–DG Employment, 2006). The structural reforms in labor market with which the European
10 In contrast with the MS, public budgets surpassing greatly half of the GDP the EU budget is confined to 1.24 per
cent of the EU GDP. (European Court of Auditors, 2006).
Table 3
Activities of the European Commission’s Directorate-General for Economic and
Financial Affairs
• Economic surveillance: euro area and EU o Member States country pages o Key indicators o Economic forecasts: spring, autumn and interim
forecasts o Business and consumer surveys o Annual Review on the EU economy o Convergence reports
• Monitoring budgetary policies and public finances o Stability and Growth Pact and fiscal surveillance o Annual “Public Finance Report” o Contribution of public finances to growth and
employment o The consequences of ageing
• Economic policy coordination o BEPG incl. Implementation report o Structural reforms o Luxembourg, Cardiff, and Cologne processes o Assessing the policy-mix in the euro area
• The euro: legal, practical and institutional aspects o Legal and institutional issues of the euro o Euro coins o Update and maintenance of the Commission's
euro web site
• Financial markets and capital movement o Integration of EU financial markets o Freedom of capital movements
• Economic relations with third countries o Accession countries : economic aspects of
enlargement o G7 Countries o Russia o Western Balkan Countries, Mediterranean
Countries, and development issues o Macro-financial assistance to third countries o Relations with international financial institutions:
IMF, WB, EBRD,...
• Financing o Investment Financing o EIB o EIF o Funding Programmes for SMEs o Funding for Trans-European Networks o Euratom loans o Opinions and surveys on investments for the
European Coal and Steel Community
Source: http://ec.europa.eu/economy_finance
13
employment rate, productive capacity, growth, and living standard should be propelled are stopped due to their potential political cost for the responsible MS. (See figure E in the Appendix.) VII. Other Community policies and initiatives. In a range of matters the EU is developing actions according to different exigencies or possibilities. Some correspond to Community competences or are close of it: fisheries, forests, environment, etc. A lot of other miscellaneous actions of the EU correspond to general possibilities or purposes, such as: peace interventions in the Balkans, Afghanistan, or Lebanon; air regulations, space technology and engines; immigration and border control; and justice and police affairs.
B. The EU Structural Reforms Policy The policies of structural reform (SR) were introduced explicitly in the European Union during the process of
discussion of the financial perspectives and budget of the Community for 2000-2006 named Agenda 2000. In Spring 2000 the Lisbon European Council agreed upon a common strategy for the EU to become by 2010 “the most competitive and dynamic knowledge-based economy in the world". (EC, 2006; EC-Economic Policy Committee, many years)
The Lisbon Strategy (LS) mixes different exigencies: the liberal orientations imprinting EP in the US, the UK and in some other MS, the interest in the depth of the competition policy, existing structural EU policies as well as regional policy, and the convenience of introducing some strategic perspectives on the current EU policies. Profiting from the discussion of the budgetary impact of the community policies, some MS pressed to enlarge the budget support for technological policies, reducing the CAP and structural funds, and orienting these to support the competitiveness of the less favored regions.
As with the majority of the EU developments, this was reached by successive approximations with a formidable design. The immediate precedent for the LS and the Agenda 2000 were the White Book on Growth Initiative (Jacques Delors, dir., 1992) and the Inter-institutional Agreement on Financial Perspectives, called the budget Packs Delors I and II for 1988-1993 and 1994-1999, respectively.
I. Orientations of the SR and the LS. The LS mixes: i) general purposes, i.e. growth and employment rate objectives; ii) EU direct actions, i.e. some arrangements of the community policies; iii) EU influences, i.e. on the ECB policy; and iv) a large cooperation with MS, i.e. the so-called coordination of policies (see below). This LS mix produced a bittersweet taste. Thus the LS is both: • Pro competitive, and it should be considered an extension of EU competition policy. • Pro productive, and it should be considered an extension of EU industrial strategy and of its competitiveness
actions. • Pro employment, and it should be considered an extension of EU social policies. • Pro new economy, and it should be considered an extension of EU technological actions. • Pro openness economy, and it should be considered an extension of EU trade policy. • Pro deregulation, privatizing, limiting public intervention, producing high quality regulations.
The LS bases its necessity in the analysis of the Directorate-General for Economic and Financial Affairs.11 The LS general orientation is compatible with the analysis OECD and IMF style.12 In this sense the economic problem of Europe is the small growth due to the low employment rate and to the low productivity. These tendencies stopped the convergence and catching-up processes of the EU to the US and of the less advanced MS of the EU15 to the more developed. Although in the hands of the MS, the EU can help them to reform most of the regulations (Rodrigues, ed., 2003, André Sapir, dir., 2003, and Wim Kok, dir., 2004). II. Objectives of the SR and the LS. Inside the general EU equilibrium, the pro-competitive LS should be in agreement with the social orientations prevailing in the European socio-economic model. In particular the LS needs to be in agreement with the objectives of employment –more quantity and more quality- and of social inclusion. More precisely, the LS objectives are: • Growth of GDP, given as the condition for employment. • Stability, first of all of prices, later of public finances. • Sustainability of public finances risked by large public deficits and by structural tendencies enlarging the pensions
impact. • Employment. • Social orientation of the European Socialist Party (left), the partenariat orientation of the European Popular Party,
social-Christian-democrat (centre-right). • EU policies: Competition (easy), Regional (insisting on its pro-competitive orientation). • Competitiveness and solidarity.
11 See before the first section of this paper and visit <http://ec.europa.eu/economy_finance>. 12 See also before the first section of this paper and visit <http://www.oecd.org> and < http://www.imf.org>.
14
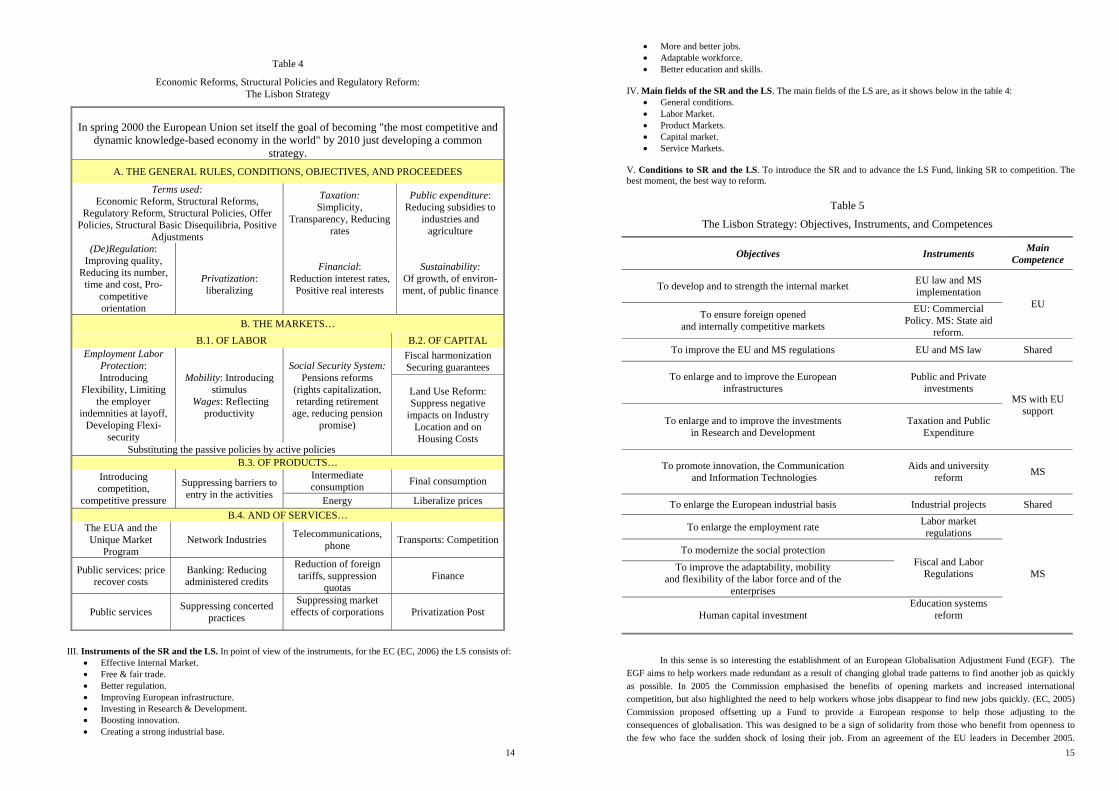
III. Instruments of the SR and the LS. In point of view of the instruments, for the EC (EC, 2006) the LS consists of: • Effective Internal Market. • Free & fair trade. • Better regulation. • Improving European infrastructure. • Investing in Research & Development. • Boosting innovation. • Creating a strong industrial base.
Table 4
Economic Reforms, Structural Policies and Regulatory Reform: The Lisbon Strategy
In spring 2000 the European Union set itself the goal of becoming "the most competitive and
dynamic knowledge-based economy in the world" by 2010 just developing a common strategy.
A. THE GENERAL RULES, CONDITIONS, OBJECTIVES, AND PROCEEDEES
Terms used: Economic Reform, Structural Reforms,
Regulatory Reform, Structural Policies, Offer Policies, Structural Basic Disequilibria, Positive
Adjustments
Taxation: Simplicity,
Transparency, Reducing rates
Public expenditure: Reducing subsidies to
industries and agriculture
(De)Regulation: Improving quality,
Reducing its number, time and cost, Pro-
competitive orientation
Privatization: liberalizing
Financial: Reduction interest rates,
Positive real interests
Sustainability: Of growth, of environ-ment, of public finance
B. THE MARKETS…
B.1. OF LABOR B.2. OF CAPITAL Fiscal harmonization Securing guarantees
Employment Labor Protection: Introducing
Flexibility, Limiting the employer
indemnities at layoff, Developing Flexi-
security
Mobility: Introducing stimulus
Wages: Reflecting productivity
Social Security System: Pensions reforms
(rights capitalization, retarding retirement
age, reducing pension promise)
Substituting the passive policies by active policies
Land Use Reform: Suppress negative
impacts on Industry Location and on Housing Costs
B.3. OF PRODUCTS… Intermediate consumption Final consumption Introducing
competition, competitive pressure
Suppressing barriers to entry in the activities Energy Liberalize prices
B.4. AND OF SERVICES… The EUA and the Unique Market
Program Network Industries Telecommunications,
phone Transports: Competition
Public services: price recover costs
Banking: Reducing administered credits
Reduction of foreign tariffs, suppression
quotas Finance
Public services Suppressing concerted practices
Suppressing market effects of corporations
Privatization Post
15
• More and better jobs. • Adaptable workforce. • Better education and skills.
IV. Main fields of the SR and the LS. The main fields of the LS are, as it shows below in the table 4:
• General conditions. • Labor Market. • Product Markets. • Capital market. • Service Markets.
V. Conditions to SR and the LS. To introduce the SR and to advance the LS Fund, linking SR to competition. The best moment, the best way to reform.
Table 5
The Lisbon Strategy: Objectives, Instruments, and Competences
Objectives Instruments Main Competence
To develop and to strength the internal market EU law and MS implementation
To ensure foreign opened and internally competitive markets
EU: Commercial Policy. MS: State aid
reform.
EU
To improve the EU and MS regulations EU and MS law Shared
To enlarge and to improve the European infrastructures
Public and Private investments
To enlarge and to improve the investments in Research and Development
Taxation and Public Expenditure
MS with EU support
To promote innovation, the Communication and Information Technologies
Aids and university reform MS
To enlarge the European industrial basis Industrial projects Shared
To enlarge the employment rate Labor market regulations
To modernize the social protection
To improve the adaptability, mobility and flexibility of the labor force and of the
enterprises
Fiscal and Labor Regulations
Human capital investment Education systems
reform
MS
In this sense is so interesting the establishment of an European Globalisation Adjustment Fund (EGF). The EGF aims to help workers made redundant as a result of changing global trade patterns to find another job as quickly as possible. In 2005 the Commission emphasised the benefits of opening markets and increased international competition, but also highlighted the need to help workers whose jobs disappear to find new jobs quickly. (EC, 2005) Commission proposed offsetting up a Fund to provide a European response to help those adjusting to the consequences of globalisation. This was designed to be a sign of solidarity from those who benefit from openness to the few who face the sudden shock of losing their job. From an agreement of the EU leaders in December 2005.

16
During 2006 the Council and the European Parliament debated and refined the concept, until it was adopted on 20 December 2006.13 The fund was launched by the European Union in 2007 and will provide up to 500 million euro a year in support. (Andrew Hughes Hallet, Sevend S. Hougaard Jensen and Christian Richter, 2005) More open trade leads to overall benefits for growth and employment, but it can cost some jobs. All Member States, large and small, new and old, can be affected by these changes and will all therefore be eligible for EGF assistance. While the EU Structural Funds support the anticipation and management of change with activities such as life-long-learning with a strategic and long-term perspective, the EGF will provide one-off, time-limited individual support geared to helping workers who are 'severely and personally affected by trade-adjustment redundancies'. Starting from 1 January 2007, the EGF can fund active labour market policies focused entirely on helping the workers affected by globalisation-related redundancies, for example through: • Job-search assistance, occupational guidance, tailor-made training and re-training including IT skills and
certification of acquired experience, outplacement assistance and entrepreneurship promotion or aid for self-employment.
• Special time-limited measures, such as job-search allowances, mobility allowances or allowances to individuals participating in lifelong learning and training activities.
• Measures to stimulate in particular disadvantaged or older workers, to remain in or return to the labour market. It is intended to complement support provided by the employers and national authorities concerned in terms of
active employment measures. It will not fund passive social protection measures such as retirement pensions or unemployment benefits, which are the competence of the Member States. (Martin Feldstein and Horst Siebert, eds., 2002)
Table 6
Flexicurity:
The Four Components of An Active Employment Policy
The 2006/2007 Joint Employment Report (Council of the European Union and European Commission, 2007) developed a broad view on flexicurity comprising four components, all of them related to the guidelines and priority areas of the Growth and Jobs Strategy:
• Flexible contractual arrangements, both from the perspective of the employer and the employee, through modern labor laws allowing for sufficiently flexible work arrangements and reducing labor market segmentation and undeclared work. The link between productivity and wages is part of such arrangements.
• Active Labor Market Policies which effectively help people to cope with rapid change, unemployment spells and transitions to new jobs
• Reliable and responsive lifelong learning systems to ensure the continual adaptability and employability of workers. Financial and other incentives should be reviewed to achieve a breakthrough. EU funding should strongly support these enhanced efforts.
• Modern Social Security systems which combine the provision of adequate income support with the need to facilitate labor market mobility. This includes the removal of all restrictions on the mobility of workers within the EU.
See the table C in the Appendix for some developments on flexicurity.
C. The European Monetary Policy Since 1999, the ECB has managed European monetary policy according to his independent status and in agreement
with the Council of the Union and the EC. During this time the standing of the euro appears solid and the results in point of view of its objectives are excellent. The independence of the fosters price stability. Enshrined in the EU Treaty the ECB independence is institutional, operational, and financial independence and vis-à-vis either the Community institutions or national governments.
Of contemporary tasks of central banks, transparency is essential for gaining credibility and for realising its objective in a gentle way, i.e. specifying its quantitative definition of price stability. The institutional system of the
13 Official Journal of the European Union, No. L 406, Dec . 30.
17
ECB is so complex, mixing the participation of the central bank of all the EU27 MS and a special framework with the central bank of the euro area (€A) (ECB, 2006).
The management of monetary policy by the Eurosystem is based on an operational decentralisation. It arises from the principle of subsidiarity, which underlies the entire European integration process. The monetary policy decisions are made in a centralised fashion, by the Governing Council of the ECB, but implemented by the national central banks. The Eurosystem benefits from an efficient operational framework and from procedures that guarantee a high level of security for payment systems, especially the Target system. The strategic ECB framework is based on a precise definition of the primary objective of price stability, defined as an annual increase in the Harmonized Index of Consumer Prices close to but below 2% of the medium-term. This choice is made in order to exclude situations of deflation and inflation differentials in the €A.
In the ECB "medium term" orientation the single monetary policy does not have a fixed horizon defined ex ante but is medium-term oriented. This is a two-pillar approach: cross-checking of the economic analysis for short-term determinants of inflation; and the monetary analysis of long-term determinants of inflation. There are two achievements of the ECB monetary policy: i) the credibility of the single monetary policy. In spite of adverse exogenous supply shocks, leading to a rise in HICP above 2%, long-term inflation expectations anchored at around 1.8% to 1.9%; and most of monetary policy decisions were correctly anticipated by the markets.
The achievements of the monetary policy relies on the smooth functioning of multilateral surveillance procedures within EMU. There is a framework of multilateral surveillance procedures. Thus the implementation is entrusted to the Eurogroup composed of the €A economy MS ministers, or the Ecofin composed of all of the MS Ministers of Economy. In these meetings, all economic fields are considered: labour market (Luxembourg process), product and capital markets (Cardiff process), wage development (Cologne process), and fiscal policy (SGP). The whole process is coordinated under the Broad Economic Policy Guidelines (BEPGs) recommendations, which encompass a medium-term assessment of the convergence of the economies. The performances are annually scrutinised, following the SGP updates.
Thus the fiscal discipline within a cooperative framework is the corollary to the European unique monetary policy. The SPG imposes the same fiscal discipline to all EU members. MS are expected to consider their economic policies as a matter of "common concern". The acceding countries will abide by the same rules. In another sense the euro is a powerful driving force towards more economic and financial integration and an international currency. There are three pillars to be an optimal currency area: • The macroeconomic fundamentals defining the Eurosystem: a low level of inflation; the resilience of the banking
and financial system; quality of the labour force and the infrastructure. As a consequence, during this period the €A receive more foreign direct investments than the US. (Daniel S. Hamilton and Joseph P. Quinlan, 2005)
• A growing economic homogeneity favours monetary policy transmission. There is an increasing correlation between national and the €A business cycles. The inflation dispersion in the €A is not much higher than in the US, whereas the latter benefits from a unifying federal budget. There is a rising homogeneity of responses of MS to monetary policy impulses.
• The changeover to the euro acted as a catalyst for financial integration. The establishment of a euro money market is a process almost complete. The price differentials in interbank markets is under five basis points. It is underway in European bond markets, as well as in derivatives markets, with a healthy development of the Eurex. The EU financial architecture frames up, completing the process in the field of financial regulation and supervision.
The euro successfully became an international currency and a nominal anchor. There have been a lot of developments in the private use of the euro. As a financial instrument, the euro took off immediately: more than 60% of net issuance of international debt securities are in euro, bolstered by EU companies and households. The euro is already a significant intermediary in exchanges.14 The euro is acting a growing pricing role in trading activities: in the €A 60% of international trade outside the zone was denominated in euro, as well as in Central and Eastern Europe. There is a growing official role of the euro: it’s the second reserve currency after the US dollar, a factor of diversification of currency reserves against fluctuations. (Ahearne et alii, 2007) There is a trend bound to gain momentum as major Asian central banks want to better balance their assets between US dollar and the euro. The euro is an anchor for a number of exchange rate regimes: euro is used as a monetary benchmark (sole anchor or currency baskets) in 51 countries, with strong ties or institutional arrangements with the EU.
14 The euro has the 26 % of foreign exchange transactions, the dollar's share is 51 %, and this is more than the sum of shares of the
European legacy currencies. (IMF, 2007)

18
As a single currency for the EU, the euro faces important challenges. A strengthening budgetary cohesion and co-ordination in the EU is needed. In line with the concept of structural balances, EU MS should respect their commitment to achieve in the business cycle a budgetary position that is "close to balance or in surplus". Incentives should be devised to strengthen sound fiscal policy in good times to get margins for the rainy days. Complementary structural reforms are needed in several areas. To be a knowledge-based economy the 2000 Lisbon strategy the corporate attractiveness should be developed creating "agglomeration dynamics". Certainly the €A benefits from its high purchasing power but progress is required as regards controlling production costs (labour costs). In goods and services market integration reforms are needed to remove entry barriers and promote complete integration, especially in the services, but also in energy and transport sectors and postal services.
Some challenges of the euro are related to the latest enlargements. There are some institutional challenges concerning the Eurosystem decision-making process: voting procedures have already been amended. But the implementation of the whole EU institutional framework is still a challenge, especially concerning the anti money-laundering procedures and the upgrading of banking supervision.
A sustainable convergence should be an interesting contribution to be a monetary optimum area. A real convergence must be achieved, in spite of the development gap even with the acceding countries supposing only 44 per cent of total GDP per capita of the €A. The catching-up process needs 25 years under the hypothesis of a 1.5% growth differential. But it has to be compatible with the nominal convergence. The disinflation must continue, the inflation rates are twice as high as in the €A. The fiscal position of new MS: the average public deficit is at 5 per cent and the external deficit is at 4 per cent of the GDP. The competitiveness must be preserved.
In this convergence process the Exchange Rate Mechanism or European Monetary System II is a "training room" rather than a "waiting room". The ECB follows a pragmatic approach: a successful participation in this stabilization mechanism is essential to achieve rate stability, decided on a case-by-case approach, in order to prevent excessive volatility of exchange rates. A flexible approach: to enhance economic cohesion, the mechanism envisages the possibility of realignments during the period of participation.
D. The European Policy Mix: The Stability and Growth Pact and the EP
Coordination The NEEP is in formation: necessities, objectives,
instruments, institutions, coordination, management, and analysis. In the past, a strong necessity for common EP and coordination between MS made itself evident with the general floating of currencies after the dollar gold suspension in 1971. Thus a European Monetary System is in operation since 1999. During the transition phase to the EMU the convergence Maastricht criteria generated the necessity to coordinate MS policy mix.
I. The Stability and Growth Pact. Then the SGP
prevented the occurrence of an excessive budgetary deficit in the euro area (€A). As the Treaty provided only for quantitative criteria for the adoption of the unique currency and not for any definition of a budgetary policy to be
Figure 6 The Policy-Mix:
Orientations and Performances Panel A. Euro Area Policy Mix Orientation
Panel B. United States Policy Mix Orientation
Output Gap (discontinuous line) = Potential GDP – Effective GDP Policy Mix (continuous line) = Monetary and Financial Component
(white column) + Fiscal Component (coloured column) Accommodative Policy-Mix Effective GDP >Potential GDP
Restrictive Policy-Mix Effective GDP <Potential GDP
Panel C. Euro Area Policy Mix Performance
Panel D. United States Policy Mix Performance
Change of Real Short Term Interest Rate Change of Public Deficit
Four Policy-Mix combinations appear in each figure
Source : L’Angevin and Montagné (2006)
19
conducted after the changeover to the euro, the adoption of such a pact was considered necessary by the MS. The SGP intended to ensure sound management of public finances in the €A in order to prevent a situation arising in which one MS lax budgetary policy penalises the other MS via interest rates
and undermines confidence in the economic stability of the €A. It seeks to achieve sustained and lasting convergence of the economies of the MS belonging to the €A.
The SGP was adopted by the Amsterdam European Council in June 1997 as a resolution on the stability and GDP growth.15 The implementation of the SGP rests primarily on two pillars: i) the principle of multilateral surveillance of budgetary positions and ii) the excessive deficit procedure. In addition, the BEPGs, which the Council addresses to the MS, are intended to help them frame their economic policies effectively. To be more precise, this involves: • Multilateral surveillance. With a view to coordinating their economic and financial situations, the MS in the €A
present a stability programme containing medium-term public accounting objectives that are updated each year. The MS outside the €A draw up 'convergence' programmes. These programmes serve as a basis for multilateral surveillance within the Council. Any fiscal slippage may therefore form the subject matter of a Council recommendation, which may be made public.
• An excessive deficit procedure. This procedure is triggered if a MS exceeds the public deficit criterion, which is set at 3% of GDP. If the existence of an excessive deficit is established by the Council, it issues recommendations to the MS concerned calling on it to take steps to put an end to the excessive deficit. If the MS does not comply with these recommendations or does not take steps to remedy the situation, the Council may impose sanctions on it, initially in the form of a non-interest-bearing deposit with the Community. The deposit will, as a rule, be converted into a fine if, within the next two years, the excessive deficit has not been corrected.
Since the third stage of EMU was embarked upon, the multilateral surveillance procedure has given rise to a constant dialogue on economic and budgetary policy between MS. The BEPGs are a central element of this dialogue. They take the form of recommendations drawn up each year by the Council, acting on a Commission proposal, and then issued to the MS, which are required to frame their economic policies accordingly. Each year the Commission draws up a report on their implementation.
The Commission is responsible for monitoring implementation of the SGP. If it seems likely that a MS will not meet its obligations with respect to its economic policy, the Council may, on a recommendation from the Commission, issue a specific recommendation to the MS concerned (early warning). If the MS does not comply with the recommendation and the deficit exceeds 3% of GDP, an excessive deficit procedure is triggered.
In view of the difficulties that some MS are having in achieving their budgetary targets compared with the commitments entered into, a lively debate began in 2002 on the SGP and on the commitments for achieving balanced or surplus budgets. The debate surrounding the SGP gathered momentum following a ruling on 13 July 2004 by the Court of Justice of the European Communities concerning the excessive deficit procedures initiated against Germany and France (Case C-27/04). In November 2003 the Commission had sent to the Council recommendations for speeding up the excessive deficit procedure in both cases. However, the Council did not act on those recommendations and suspended the excessive deficit procedures. It argued that its conclusions were of a political nature.
The Court ruled that: i) the action of the Commission against the Council for failure to adopt the formal instruments contained in the Commission recommendations was inadmissible; and ii) the Council conclusions of 25 November 2003 adopted in respect of France and Germany were annulled as regards suspension of the excessive deficit procedure. Following these findings and in view of the debate surrounding the stability and growth pact, in September 2004 the Commission adopted a communication on strengthening economic governance and clarifying the implementation of the SGP and proposing some possible improvements. The Commission was concerned primarily with economic developments in the MS and with the long-term sustainability of public finances.
The €A MS will share a unique monetary policy and a single exchange rate, while the other aspects of economic policy will remain national issues. To the extent that national economic developments will influence monetary conditions in the €A, closer Community surveillance and coordination of economic policies among €A MS will be necessary. All MS, including those remaining outside the €A (Denmark, the United Kingdom, and Sweden) must be included in the coordination of economic policies, as they all participate in the unique market and may also participate in the new exchange rate mechanism. (Bodil Nyboe Andersen, 2005; and Ian Bache, 2005) Coordination must adhere to the principle of subsidiarity. Enhanced surveillance and coordination should cover the following areas: • Macroeconomic developments in MS and the development of the exchange rate for the euro. • Budgetary positions and policies. • Structural policies in labour, product and services markets, as well as cost and price trends.
To ensure the smooth functioning of EMU, the BEPGs should provide more concrete and country-specific guidelines and focus more on measures to improve growth potential and create jobs. MS should commit themselves to a comprehensive and speedy exchange of information on economic developments and policy intentions with a cross-border impact, even if there is no threat of a deterioration in the budgetary situation. For its part, the Council could show more inclination to address recommendations to MS whose EP are not consistent with the broad guidelines.
15 Regulation (EC) No 1466/97. It was amended by: i) Regulation (EC) No 1055/2005, dealing with the surveillance of
the MS budgetary positions and the coordination of their economic policies (prevention aspect); and ii) Regulation (EC) No 1056/2005, on the implementation of the excessive deficit procedure whenever a MS exceeds the reference value, i.e. a deficit of more than 3% of GDP (punitive aspect). (EC, 2007)
20
The Ecofin Council occupies the defining position at the centre of the economic coordination and decision-making process. Whenever matters of common interest are addressed, they will be discussed by the ministers of all MS. However, the ministers of the MS participating in the €A may meet informally among themselves to discuss issues connected with their shared specific responsibilities for the unique currency. (Guido Tabellini and Charles Wyploz, 2004)
As the Council must monitor the development of the euro exchange rate, it is important for it to be able to exchange views and information with the ECB. It may, in exceptional circumstances, formulate general orientations for exchange-rate policy in relation to non-EC currencies. These general orientations must respect the independence of the ECB and be consistent with its primary objective which is to maintain price stability. The Council should decide on the position of the Community on issues of particular relevance to EMU, in connection with both bilateral relations with third countries and proceedings in international organisations or informal international groupings. Only euro-zone MS will participate in votes. (Denis et alii, 2005)
The Council and the European Central Bank will represent the Community at international level in compliance with the allocation of powers laid down in the Treaty. On elements of economic policy other than monetary and exchange-rate policy, the MS should continue to present their policies outside the Community framework, while taking full account of the Community interest.
Representation in international organisations should take account of those organisations' rules. For example, only countries can be members of the IMF. In the light of the allocation of responsibilities laid down in the EU Treaty, the harmonious economic development of the Community will necessitate continuous dialogue between the Council and the ECB, involving the Commission and respecting all aspects of the independence of the ECB. The Economic and Financial Committee will provide the framework within which the dialogue can be prepared and pursued at senior official level.
II. Broad Economic Policy Guidelines
The BEPGs are the main instrument for coordinating the economic policies of the MS. For the first time they cover a period of three consecutive years in order to rationalise and synchronise the process of coordinating economic policies with employment policy. The broad outlines for 2005-2008 emphasise the contribution of economic policies to the Lisbon Strategy
The first part contains the general guidelines for all MS and the Community and a section devoted to the challenges specific to the €A. The second part contains recommendations for individual MS and takes account of their specific situations. The Commission has updated the broad guidelines for 2004 in a new recommendation that includes the 10 new MS in the current framework for economic policy coordination. The policy guidelines for the EU15 remain entirely relevant. To help it achieve the Lisbon Strategy the Council decided to rationalise the various processes for coordinating economic policy and employment policy. The BEPGs emphasise the contribution of these policies to the Lisbon programme. In addition to these BEPGs, MS must apply the employment guidelines and related recommendations.
The economic growth has been significantly weaker than anticipated because of geopolitical tensions, a slowdown in external demand and falling confidence among businesses and consumers. Employment prospects are therefore likely to deteriorate. Inflation has remained just above 2%, but could drop below that level in future. Economic policies must therefore bolster confidence and thereby help to create conditions for stronger domestic demand and job creation in the short term and an expansion of growth potential in the medium term.
The growth and stability-oriented macroeconomic policies play a key role in sustaining growth and employment and in preserving price stability. MS should, in particular: i) To reach or maintain budgetary positions that are close to balance or in surplus throughout the economic cycle; ii) To correct any excessive deficits in line with the SGP; and iii) Subject to this, to avoid pro-cyclical policies that counteract the symmetric play of the automatic stabilisers over the cycle. (Paul de Grauwe, 2003)
MS should promote the right framework for wage negotiations by the social partners. It is important that they ensure that nominal wage increases are consistent with price stability and productivity gains. Labour cost increases should remain moderate to allow more job-creating investment.
Structural reforms are essential to increase the EU's growth potential. To yield maximum synergies, they should be implemented in a comprehensive and coordinated way. The MS should introduce the following measures over the next three years (the reforms to boost employment are described in detail in the employment guidelines: • Make the tax and benefits system more employment-friendly. • Make sure that wage bargaining systems take account of differences in productivity and that these are reflected in
wages. • Review Labour market regulations: access to the labour market, employment protection, more flexible work
organisation. • Facilitate labour mobility, both geographical and occupational. • Ensure efficient active labour market policies. Related to the productivity: • Foster competition in the markets for goods and services, by increasing the transposition rate of internal market
directives, by further opening up public procurement, by ensuring the independence of competition authorities and by reducing and reorienting state aid.
21
• Accelerate the integration of EU capital markets, by implementing the Risk Capital Action Plans and the Financial Services Action Plan. (M.-J. Radio and C.A. Bates Jr., eds., 2006)
• Foster entrepreneurship and the creation of small and medium-sized enterprises.
• Promote investment in knowledge, new technologies and innovation by increasing public and private expenditure on R&D to make progress towards the 3% of GDP objective, for example by developing a framework conducive to R&D, facilitating the protection of intellectual property promoting the Action Plan, developing the Galileo satellite navigation system and improving education and training.
• Enhance the contribution of the public sector to growth, by providing more growth-enhancing, cost-effective investment in physical and human capital and knowledge, increasing the efficiency of the public sector and promoting joint public-private initiatives.
To strengthening the long-term sustainability of public finances the EU EP coordination proposes: i) reduce public debt ratios. MS with government debt ratios above the 60% of the GDP reference value should ensure a satisfactory pace of government debt reduction towards that value; ii) design, introduce and effectively implement reforms of pension systems, for example encouraging people to extend their working lives, linking benefits to contributions better and improving access to supplementary pension schemes, etc.; and like the MS, the Community should apply strict budgetary discipline.
The economic and social cohesion needs to modernise social protection systems while ensuring an adequate level of protection and fighting poverty and exclusion, and to improve the functioning of markets to encourage private investment in regions that lag behind, ensure that public support, including from EU sources, is focused on investment in human capital and infrastructure, and that investment programmes are designed and administered efficiently.
The efficient management of natural resources should: • Reduce sectoral subsidies, tax exemptions and other incentives
that have a negative environmental impact. • Reduce subsidies to non-renewable energy, promote energy
efficiency and increase the proportion of renewable energy. • Adjust the system of transport taxes, charges and subsidies to
better reflect environmental damage and social costs and to increase competition in transport modes such as rail freight.
• Renew efforts to meet the commitments under the Kyoto protocol, for example by introducing a greenhouse gas emissions trading scheme.
There specific challenges to the €A. Economic growth failed to fulfil its potential. The guidelines list four challenges for the €A: to strengthen potential growth, to cater for balanced macroeconomic policies, to monitor inflation differences, and finally to strengthen economic policy coordination.
The Council advises national decision-makers in the €A to strive for an economic policy mix that is compatible with price stability and with business and consumer confidence. Countries in the €A should maintain budgetary positions that are close to balance or in surplus throughout the economic cycle in cyclically adjusted terms. Where necessary, they must ensure an annual improvement of at least 0.5% of GDP, and those countries with excessive deficits need to correct them. They are asked to analyse the causes of inflation differences in order to take measures in sectors where such differences are undesirable. As far as policy coordination is concerned, the members of the €A should deepen the analysis and discussion of economic developments (exchange of information, external representation, etc.) and improve the efficiency of coordination procedures in the area of structural reforms.
IV. NEEP: Performances and Challenges
Does NEEP correspond to the new EE? To what measure are the EE performances due to NEEP? Now the EE is a stable economy and NEEP is well-oriented. But there are some substantive challenges to the EE: i.e. aging, globalization, deindustrialization, low employment and productivity, territorial and cultural disparities. Largest of the problems facing the EE is NEEP is possessed of limitations not easily surpassed. A more effective EU action towards structural reforms placing emphasis on pro-competition in the economy and European institutions is sorely needed. Meanwhile, the impact of non-competition reduces the Europeans living-standard.
Figure 7
Income Distribution in a Range of Countries
Gini Index
0,30,3270,3250,327
0,3590,2730,269
0,3260,231
0,3560,256
0,250,361
0,2540,376
0,2440,3240,3240,316
0,2840,195
0,2640,282
0,4080,249
0,290,415
0,4870,217
0,290,3710,395
0,2470,25 Bélgica
DinamarcaAlemaniaGreciaEspañaFranciaIrlandaItaliaLuxemburgoPaíses BajosAustriaPortugalFinlandiaSueciaReino UnidoR. ChecaEstoniaHungríaLituaniaLetoniaPoloniaEsloveniaEslovaquiaBulgariaRumania
EEUUJapón
CroaciaTurquíaIsraelRusiaBielorrusiaUcraniaGeorgiaMarruecos
In an absolute equal distribution GI = 0. In an absolute unequal distribution (a person
takes all the income) GI = 1. Data from United Nations (2007) for 2006 or more
close year.
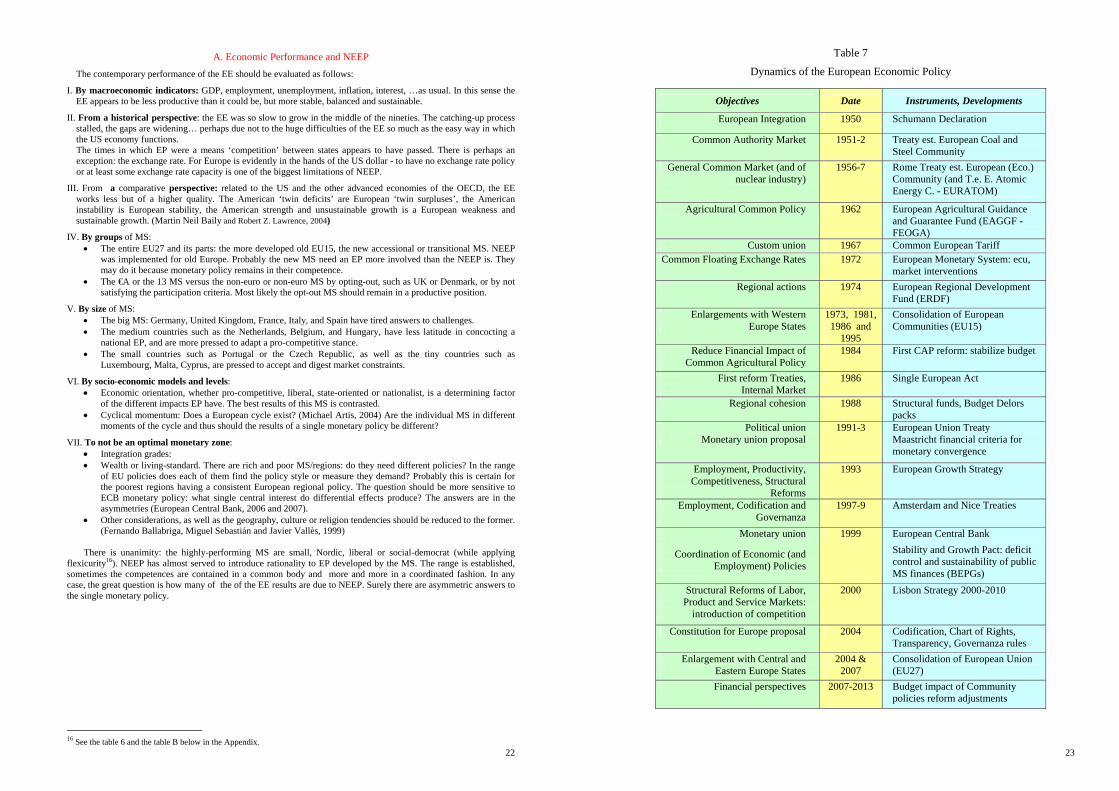
22
A. Economic Performance and NEEP
The contemporary performance of the EE should be evaluated as follows:
I. By macroeconomic indicators: GDP, employment, unemployment, inflation, interest, …as usual. In this sense the EE appears to be less productive than it could be, but more stable, balanced and sustainable.
II. From a historical perspective: the EE was so slow to grow in the middle of the nineties. The catching-up process stalled, the gaps are widening… perhaps due not to the huge difficulties of the EE so much as the easy way in which the US economy functions. The times in which EP were a means ‘competition’ between states appears to have passed. There is perhaps an exception: the exchange rate. For Europe is evidently in the hands of the US dollar - to have no exchange rate policy or at least some exchange rate capacity is one of the biggest limitations of NEEP.
III. From a comparative perspective: related to the US and the other advanced economies of the OECD, the EE works less but of a higher quality. The American ‘twin deficits’ are European ‘twin surpluses’, the American instability is European stability, the American strength and unsustainable growth is a European weakness and sustainable growth. (Martin Neil Baily and Robert Z. Lawrence, 2004)
IV. By groups of MS: • The entire EU27 and its parts: the more developed old EU15, the new accessional or transitional MS. NEEP
was implemented for old Europe. Probably the new MS need an EP more involved than the NEEP is. They may do it because monetary policy remains in their competence.
• The €A or the 13 MS versus the non-euro or non-euro MS by opting-out, such as UK or Denmark, or by not satisfying the participation criteria. Most likely the opt-out MS should remain in a productive position.
V. By size of MS: • The big MS: Germany, United Kingdom, France, Italy, and Spain have tired answers to challenges. • The medium countries such as the Netherlands, Belgium, and Hungary, have less latitude in concocting a
national EP, and are more pressed to adapt a pro-competitive stance. • The small countries such as Portugal or the Czech Republic, as well as the tiny countries such as
Luxembourg, Malta, Cyprus, are pressed to accept and digest market constraints.
VI. By socio-economic models and levels: • Economic orientation, whether pro-competitive, liberal, state-oriented or nationalist, is a determining factor
of the different impacts EP have. The best results of this MS is contrasted. • Cyclical momentum: Does a European cycle exist? (Michael Artis, 2004) Are the individual MS in different
moments of the cycle and thus should the results of a single monetary policy be different?
VII. To not be an optimal monetary zone: • Integration grades: • Wealth or living-standard. There are rich and poor MS/regions: do they need different policies? In the range
of EU policies does each of them find the policy style or measure they demand? Probably this is certain for the poorest regions having a consistent European regional policy. The question should be more sensitive to ECB monetary policy: what single central interest do differential effects produce? The answers are in the asymmetries (European Central Bank, 2006 and 2007).
• Other considerations, as well as the geography, culture or religion tendencies should be reduced to the former. (Fernando Ballabriga, Miguel Sebastián and Javier Vallès, 1999)
There is unanimity: the highly-performing MS are small, Nordic, liberal or social-democrat (while applying
flexicurity16). NEEP has almost served to introduce rationality to EP developed by the MS. The range is established, sometimes the competences are contained in a common body and more and more in a coordinated fashion. In any case, the great question is how many of the of the EE results are due to NEEP. Surely there are asymmetric answers to the single monetary policy.
16 See the table 6 and the table B below in the Appendix.
23
Table 7
Dynamics of the European Economic Policy
Objectives Date Instruments, Developments
European Integration 1950 Schumann Declaration
Common Authority Market 1951-2 Treaty est. European Coal and Steel Community
General Common Market (and of nuclear industry)
1956-7 Rome Treaty est. European (Eco.) Community (and T.e. E. Atomic Energy C. - EURATOM)
Agricultural Common Policy 1962 European Agricultural Guidance and Guarantee Fund (EAGGF - FEOGA)
Custom union 1967 Common European Tariff Common Floating Exchange Rates 1972 European Monetary System: ecu,
market interventions Regional actions 1974 European Regional Development
Fund (ERDF) Enlargements with Western
Europe States 1973, 1981,
1986 and 1995
Consolidation of European Communities (EU15)
Reduce Financial Impact of Common Agricultural Policy
1984 First CAP reform: stabilize budget
First reform Treaties, Internal Market
1986 Single European Act
Regional cohesion 1988 Structural funds, Budget Delors packs
Political union Monetary union proposal
1991-3 European Union Treaty Maastricht financial criteria for monetary convergence
Employment, Productivity, Competitiveness, Structural
Reforms
1993 European Growth Strategy
Employment, Codification and Governanza
1997-9 Amsterdam and Nice Treaties
Monetary union
Coordination of Economic (and Employment) Policies
1999 European Central Bank
Stability and Growth Pact: deficit control and sustainability of public MS finances (BEPGs)
Structural Reforms of Labor, Product and Service Markets:
introduction of competition
2000 Lisbon Strategy 2000-2010
Constitution for Europe proposal 2004 Codification, Chart of Rights, Transparency, Governanza rules
Enlargement with Central and Eastern Europe States
2004 & 2007
Consolidation of European Union (EU27)
Financial perspectives 2007-2013 Budget impact of Community policies reform adjustments
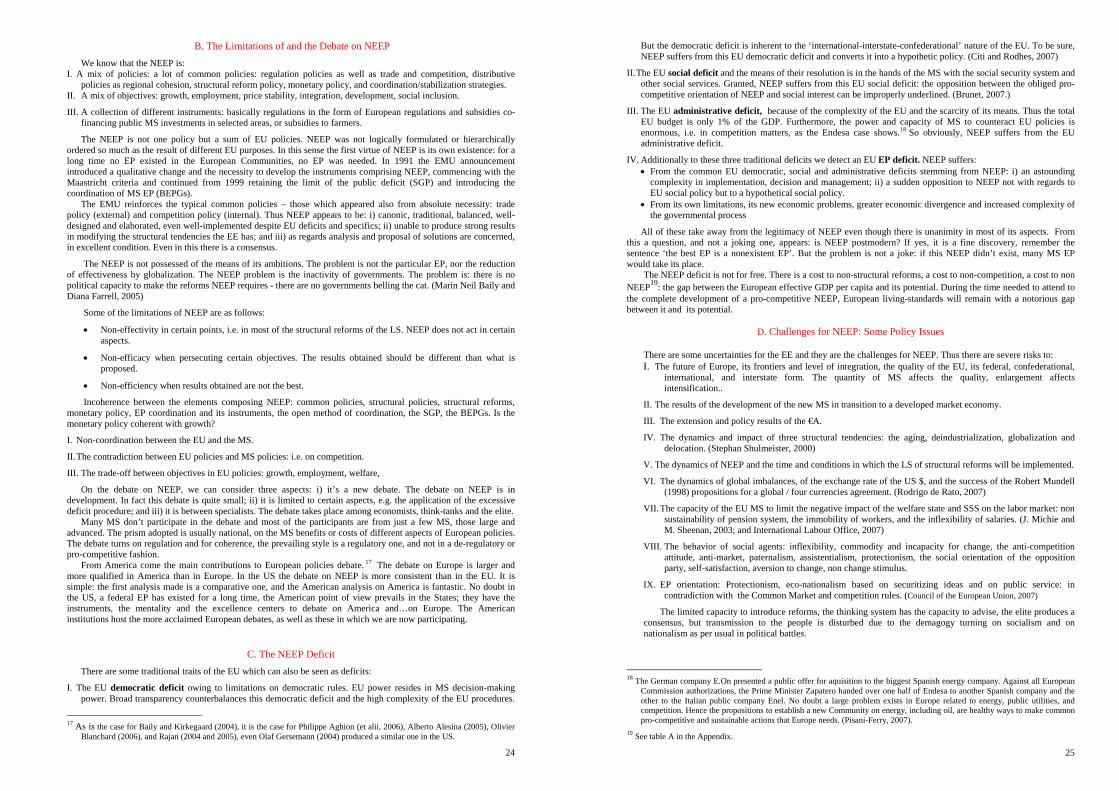
24
B. The Limitations of and the Debate on NEEP We know that the NEEP is:
I. A mix of policies: a lot of common policies: regulation policies as well as trade and competition, distributive policies as regional cohesion, structural reform policy, monetary policy, and coordination/stabilization strategies.
II. A mix of objectives: growth, employment, price stability, integration, development, social inclusion.
III. A collection of different instruments: basically regulations in the form of European regulations and subsidies co-financing public MS investments in selected areas, or subsidies to farmers.
The NEEP is not one policy but a sum of EU policies. NEEP was not logically formulated or hierarchically ordered so much as the result of different EU purposes. In this sense the first virtue of NEEP is its own existence: for a long time no EP existed in the European Communities, no EP was needed. In 1991 the EMU announcement introduced a qualitative change and the necessity to develop the instruments comprising NEEP, commencing with the Maastricht criteria and continued from 1999 retaining the limit of the public deficit (SGP) and introducing the coordination of MS EP (BEPGs).
The EMU reinforces the typical common policies – those which appeared also from absolute necessity: trade policy (external) and competition policy (internal). Thus NEEP appears to be: i) canonic, traditional, balanced, well-designed and elaborated, even well-implemented despite EU deficits and specifics; ii) unable to produce strong results in modifying the structural tendencies the EE has; and iii) as regards analysis and proposal of solutions are concerned, in excellent condition. Even in this there is a consensus.
The NEEP is not possessed of the means of its ambitions. The problem is not the particular EP, nor the reduction of effectiveness by globalization. The NEEP problem is the inactivity of governments. The problem is: there is no political capacity to make the reforms NEEP requires - there are no governments belling the cat. (Marin Neil Baily and Diana Farrell, 2005)
Some of the limitations of NEEP are as follows:
• Non-effectivity in certain points, i.e. in most of the structural reforms of the LS. NEEP does not act in certain aspects.
• Non-efficacy when persecuting certain objectives. The results obtained should be different than what is proposed.
• Non-efficiency when results obtained are not the best.
Incoherence between the elements composing NEEP: common policies, structural policies, structural reforms, monetary policy, EP coordination and its instruments, the open method of coordination, the SGP, the BEPGs. Is the monetary policy coherent with growth?
I. Non-coordination between the EU and the MS.
II. The contradiction between EU policies and MS policies: i.e. on competition.
III. The trade-off between objectives in EU policies: growth, employment, welfare,
On the debate on NEEP, we can consider three aspects: i) it’s a new debate. The debate on NEEP is in development. In fact this debate is quite small; ii) it is limited to certain aspects, e.g. the application of the excessive deficit procedure; and iii) it is between specialists. The debate takes place among economists, think-tanks and the elite.
Many MS don’t participate in the debate and most of the participants are from just a few MS, those large and advanced. The prism adopted is usually national, on the MS benefits or costs of different aspects of European policies. The debate turns on regulation and for coherence, the prevailing style is a regulatory one, and not in a de-regulatory or pro-competitive fashion.
From America come the main contributions to European policies debate. 17 The debate on Europe is larger and more qualified in America than in Europe. In the US the debate on NEEP is more consistent than in the EU. It is simple: the first analysis made is a comparative one, and the American analysis on America is fantastic. No doubt in the US, a federal EP has existed for a long time, the American point of view prevails in the States; they have the instruments, the mentality and the excellence centers to debate on America and…on Europe. The American institutions host the more acclaimed European debates, as well as these in which we are now participating.
C. The NEEP Deficit There are some traditional traits of the EU which can also be seen as deficits:
I. The EU democratic deficit owing to limitations on democratic rules. EU power resides in MS decision-making power. Broad transparency counterbalances this democratic deficit and the high complexity of the EU procedures.
17 As is the case for Baily and Kirkegaard (2004), it is the case for Philippe Aghion (et alii, 2006), Alberto Alesina (2005), Olivier
Blanchard (2006), and Rajan (2004 and 2005), even Olaf Gersemann (2004) produced a similar one in the US.
25
But the democratic deficit is inherent to the ‘international-interstate-confederational’ nature of the EU. To be sure, NEEP suffers from this EU democratic deficit and converts it into a hypothetic policy. (Citi and Rodhes, 2007)
II. The EU social deficit and the means of their resolution is in the hands of the MS with the social security system and other social services. Granted, NEEP suffers from this EU social deficit: the opposition between the obliged pro-competitive orientation of NEEP and social interest can be improperly underlined. (Brunet, 2007.)
III. The EU administrative deficit, because of the complexity of the EU and the scarcity of its means. Thus the total EU budget is only 1% of the GDP. Furthermore, the power and capacity of MS to counteract EU policies is enormous, i.e. in competition matters, as the Endesa case shows.18 So obviously, NEEP suffers from the EU administrative deficit.
IV. Additionally to these three traditional deficits we detect an EU EP deficit. NEEP suffers: • From the common EU democratic, social and administrative deficits stemming from NEEP: i) an astounding
complexity in implementation, decision and management; ii) a sudden opposition to NEEP not with regards to EU social policy but to a hypothetical social policy.
• From its own limitations, its new economic problems, greater economic divergence and increased complexity of the governmental process
All of these take away from the legitimacy of NEEP even though there is unanimity in most of its aspects. From this a question, and not a joking one, appears: is NEEP postmodern? If yes, it is a fine discovery, remember the sentence ‘the best EP is a nonexistent EP’. But the problem is not a joke: if this NEEP didn’t exist, many MS EP would take its place.
The NEEP deficit is not for free. There is a cost to non-structural reforms, a cost to non-competition, a cost to non NEEP19: the gap between the European effective GDP per capita and its potential. During the time needed to attend to the complete development of a pro-competitive NEEP, European living-standards will remain with a notorious gap between it and its potential.
D. Challenges for NEEP: Some Policy Issues
There are some uncertainties for the EE and they are the challenges for NEEP. Thus there are severe risks to: I. The future of Europe, its frontiers and level of integration, the quality of the EU, its federal, confederational,
international, and interstate form. The quantity of MS affects the quality, enlargement affects intensification..
II. The results of the development of the new MS in transition to a developed market economy.
III. The extension and policy results of the €A.
IV. The dynamics and impact of three structural tendencies: the aging, deindustrialization, globalization and delocation. (Stephan Shulmeister, 2000)
V. The dynamics of NEEP and the time and conditions in which the LS of structural reforms will be implemented.
VI. The dynamics of global imbalances, of the exchange rate of the US $, and the success of the Robert Mundell (1998) propositions for a global / four currencies agreement. (Rodrigo de Rato, 2007)
VII. The capacity of the EU MS to limit the negative impact of the welfare state and SSS on the labor market: non sustainability of pension system, the immobility of workers, and the inflexibility of salaries. (J. Michie and M. Sheenan, 2003; and International Labour Office, 2007)
VIII. The behavior of social agents: inflexibility, commodity and incapacity for change, the anti-competition attitude, anti-market, paternalism, assistentialism, protectionism, the social orientation of the opposition party, self-satisfaction, aversion to change, non change stimulus.
IX. EP orientation: Protectionism, eco-nationalism based on securitizing ideas and on public service: in contradiction with the Common Market and competition rules. (Council of the European Union, 2007)
The limited capacity to introduce reforms, the thinking system has the capacity to advise, the elite produces a consensus, but transmission to the people is disturbed due to the demagogy turning on socialism and on nationalism as per usual in political battles.
18 The German company E.On presented a public offer for aquisition to the biggest Spanish energy company. Against all European
Commission authorizations, the Prime Minister Zapatero handed over one half of Endesa to another Spanish company and the other to the Italian public company Enel. No doubt a large problem exists in Europe related to energy, public utilities, and competition. Hence the propositions to establish a new Community on energy, including oil, are healthy ways to make common pro-competitive and sustainable actions that Europe needs. (Pisani-Ferry, 2007).
19 See table A in the Appendix.
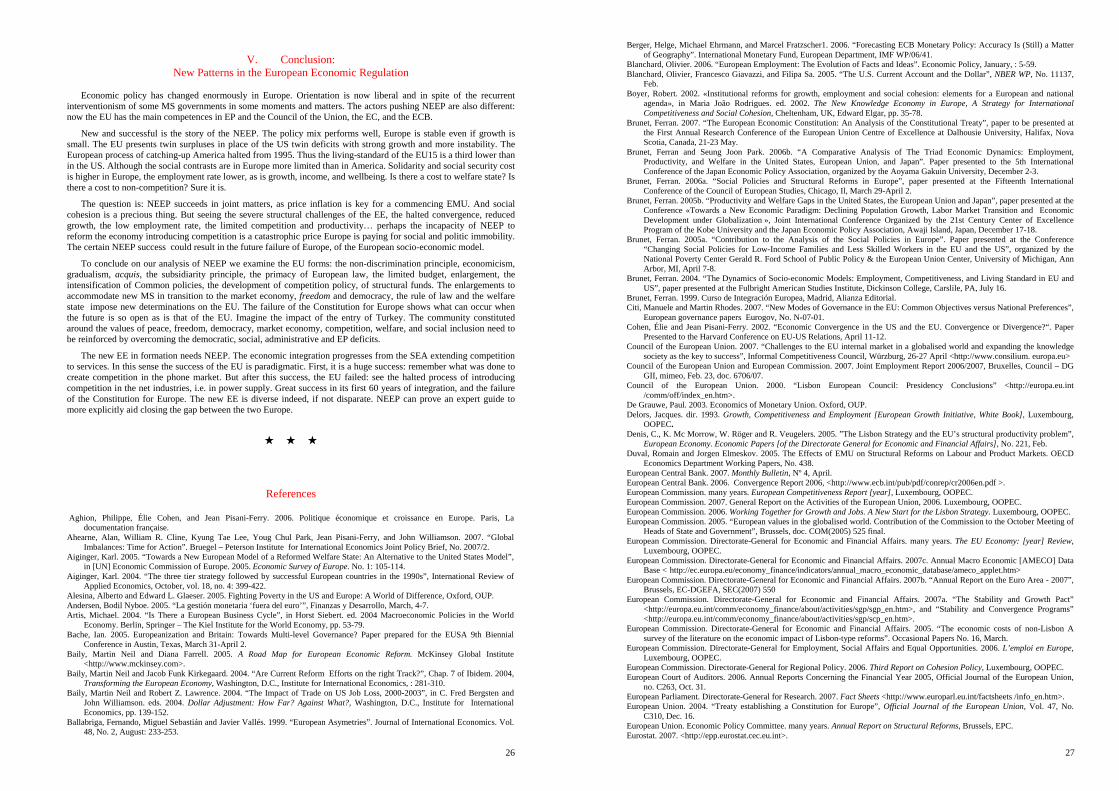
26
V. Conclusion:
New Patterns in the European Economic Regulation
Economic policy has changed enormously in Europe. Orientation is now liberal and in spite of the recurrent interventionism of some MS governments in some moments and matters. The actors pushing NEEP are also different: now the EU has the main competences in EP and the Council of the Union, the EC, and the ECB.
New and successful is the story of the NEEP. The policy mix performs well, Europe is stable even if growth is small. The EU presents twin surpluses in place of the US twin deficits with strong growth and more instability. The European process of catching-up America halted from 1995. Thus the living-standard of the EU15 is a third lower than in the US. Although the social contrasts are in Europe more limited than in America. Solidarity and social security cost is higher in Europe, the employment rate lower, as is growth, income, and wellbeing. Is there a cost to welfare state? Is there a cost to non-competition? Sure it is.
The question is: NEEP succeeds in joint matters, as price inflation is key for a commencing EMU. And social cohesion is a precious thing. But seeing the severe structural challenges of the EE, the halted convergence, reduced growth, the low employment rate, the limited competition and productivity… perhaps the incapacity of NEEP to reform the economy introducing competition is a catastrophic price Europe is paying for social and politic immobility. The certain NEEP success could result in the future failure of Europe, of the European socio-economic model.
To conclude on our analysis of NEEP we examine the EU forms: the non-discrimination principle, economicism, gradualism, acquis, the subsidiarity principle, the primacy of European law, the limited budget, enlargement, the intensification of Common policies, the development of competition policy, of structural funds. The enlargements to accommodate new MS in transition to the market economy, freedom and democracy, the rule of law and the welfare state impose new determinations on the EU. The failure of the Constitution for Europe shows what can occur when the future is so open as is that of the EU. Imagine the impact of the entry of Turkey. The community constituted around the values of peace, freedom, democracy, market economy, competition, welfare, and social inclusion need to be reinforced by overcoming the democratic, social, administrative and EP deficits.
The new EE in formation needs NEEP. The economic integration progresses from the SEA extending competition to services. In this sense the success of the EU is paradigmatic. First, it is a huge success: remember what was done to create competition in the phone market. But after this success, the EU failed: see the halted process of introducing competition in the net industries, i.e. in power supply. Great success in its first 60 years of integration, and the failure of the Constitution for Europe. The new EE is diverse indeed, if not disparate. NEEP can prove an expert guide to more explicitly aid closing the gap between the two Europe.
References Aghion, Philippe, Élie Cohen, and Jean Pisani-Ferry. 2006. Politique économique et croissance en Europe. Paris, La
documentation française. Ahearne, Alan, William R. Cline, Kyung Tae Lee, Youg Chul Park, Jean Pisani-Ferry, and John Williamson. 2007. “Global
Imbalances: Time for Action”. Bruegel – Peterson Institute for International Economics Joint Policy Brief, No. 2007/2. Aiginger, Karl. 2005. “Towards a New European Model of a Reformed Welfare State: An Alternative to the United States Model”,
in [UN] Economic Commission of Europe. 2005. Economic Survey of Europe. No. 1: 105-114. Aiginger, Karl. 2004. “The three tier strategy followed by successful European countries in the 1990s”, International Review of
Applied Economics, October, vol. 18, no. 4: 399-422. Alesina, Alberto and Edward L. Glaeser. 2005. Fighting Poverty in the US and Europe: A World of Difference, Oxford, OUP. Andersen, Bodil Nyboe. 2005. “La gestión monetaria ‘fuera del euro’”, Finanzas y Desarrollo, March, 4-7. Artis, Michael. 2004. “Is There a European Business Cycle”, in Horst Siebert. ed. 2004 Macroeconomic Policies in the World
Economy. Berlin, Springer – The Kiel Institute for the World Economy, pp. 53-79. Bache, Ian. 2005. Europeanization and Britain: Towards Multi-level Governance? Paper prepared for the EUSA 9th Biennial
Conference in Austin, Texas, March 31-April 2. Baily, Martin Neil and Diana Farrell. 2005. A Road Map for European Economic Reform. McKinsey Global Institute
<http://www.mckinsey.com>. Baily, Martin Neil and Jacob Funk Kirkegaard. 2004. “Are Current Reform Efforts on the right Track?”, Chap. 7 of Ibidem. 2004,
Transforming the European Economy, Washington, D.C., Institute for International Economics, : 281-310. Baily, Martin Neil and Robert Z. Lawrence. 2004. “The Impact of Trade on US Job Loss, 2000-2003”, in C. Fred Bergsten and
John Williamson. eds. 2004. Dollar Adjustment: How Far? Against What?, Washington, D.C., Institute for International Economics, pp. 139-152.
Ballabriga, Fernando, Miguel Sebastián and Javier Vallés. 1999. “European Asymetries”. Journal of International Economics. Vol. 48, No. 2, August: 233-253.
27
Berger, Helge, Michael Ehrmann, and Marcel Fratzscher1. 2006. “Forecasting ECB Monetary Policy: Accuracy Is (Still) a Matter of Geography”. International Monetary Fund, European Department, IMF WP/06/41.
Blanchard, Olivier. 2006. “European Employment: The Evolution of Facts and Ideas”. Economic Policy, January, : 5-59. Blanchard, Olivier, Francesco Giavazzi, and Filipa Sa. 2005. “The U.S. Current Account and the Dollar”, NBER WP, No. 11137,
Feb. Boyer, Robert. 2002. «Institutional reforms for growth, employment and social cohesion: elements for a European and national
agenda», in Maria João Rodrigues. ed. 2002. The New Knowledge Economy in Europe, A Strategy for International Competitiveness and Social Cohesion, Cheltenham, UK, Edward Elgar, pp. 35-78.
Brunet, Ferran. 2007. “The European Economic Constitution: An Analysis of the Constitutional Treaty”, paper to be presented at the First Annual Research Conference of the European Union Centre of Excellence at Dalhousie University, Halifax, Nova Scotia, Canada, 21-23 May.
Brunet, Ferran and Seung Joon Park. 2006b. “A Comparative Analysis of The Triad Economic Dynamics: Employment, Productivity, and Welfare in the United States, European Union, and Japan”. Paper presented to the 5th International Conference of the Japan Economic Policy Association, organized by the Aoyama Gakuin University, December 2-3.
Brunet, Ferran. 2006a. “Social Policies and Structural Reforms in Europe”, paper presented at the Fifteenth International Conference of the Council of European Studies, Chicago, Il, March 29-April 2.
Brunet, Ferran. 2005b. “Productivity and Welfare Gaps in the United States, the European Union and Japan”, paper presented at the Conference «Towards a New Economic Paradigm: Declining Population Growth, Labor Market Transition and Economic Development under Globalization », Joint International Conference Organized by the 21st Century Center of Excellence Program of the Kobe University and the Japan Economic Policy Association, Awaji Island, Japan, December 17-18.
Brunet, Ferran. 2005a. “Contribution to the Analysis of the Social Policies in Europe”. Paper presented at the Conference “Changing Social Policies for Low-Income Families and Less Skilled Workers in the EU and the US”, organized by the National Poverty Center Gerald R. Ford School of Public Policy & the European Union Center, University of Michigan, Ann Arbor, MI, April 7-8.
Brunet, Ferran. 2004. “The Dynamics of Socio-economic Models: Employment, Competitiveness, and Living Standard in EU and US”, paper presented at the Fulbright American Studies Institute, Dickinson College, Carslile, PA, July 16.
Brunet, Ferran. 1999. Curso de Integración Europea, Madrid, Alianza Editorial. Citi, Manuele and Martin Rhodes. 2007. “New Modes of Governance in the EU: Common Objectives versus National Preferences”,
European governance papers Eurogov, No. N-07-01. Cohen, Élie and Jean Pisani-Ferry. 2002. “Economic Convergence in the US and the EU. Convergence or Divergence?“. Paper
Presented to the Harvard Conference on EU-US Relations, April 11-12. Council of the European Union. 2007. “Challenges to the EU internal market in a globalised world and expanding the knowledge
society as the key to success”, Informal Competitiveness Council, Würzburg, 26-27 April <http://www.consilium. europa.eu> Council of the European Union and European Commission. 2007. Joint Employment Report 2006/2007, Bruxelles, Council – DG
GII, mimeo, Feb. 23, doc. 6706/07. Council of the European Union. 2000. “Lisbon European Council: Presidency Conclusions” <http://europa.eu.int
/comm/off/index_en.htm>. De Grauwe, Paul. 2003. Economics of Monetary Union. Oxford, OUP. Delors, Jacques. dir. 1993. Growth, Competitiveness and Employment [European Growth Initiative, White Book], Luxembourg,
OOPEC. Denis, C., K. Mc Morrow, W. Röger and R. Veugelers. 2005. ”The Lisbon Strategy and the EU’s structural productivity problem”,
European Economy. Economic Papers [of the Directorate General for Economic and Financial Affairs], No. 221, Feb. Duval, Romain and Jorgen Elmeskov. 2005. The Effects of EMU on Structural Reforms on Labour and Product Markets. OECD
Economics Department Working Papers, No. 438. European Central Bank. 2007. Monthly Bulletin, Nº 4, April. European Central Bank. 2006. Convergence Report 2006, <http://www.ecb.int/pub/pdf/conrep/cr2006en.pdf >. European Commission. many years. European Competitiveness Report [year], Luxembourg, OOPEC. European Commission. 2007. General Report on the Activities of the European Union, 2006. Luxembourg, OOPEC. European Commission. 2006. Working Together for Growth and Jobs. A New Start for the Lisbon Strategy. Luxembourg, OOPEC. European Commission. 2005. “European values in the globalised world. Contribution of the Commission to the October Meeting of
Heads of State and Government”, Brussels, doc. COM(2005) 525 final. European Commission. Directorate-General for Economic and Financial Affairs. many years. The EU Economy: [year] Review,
Luxembourg, OOPEC. European Commission. Directorate-General for Economic and Financial Affairs. 2007c. Annual Macro Economic [AMECO] Data
Base < http://ec.europa.eu/economy_finance/indicators/annual_macro_economic_database/ameco_applet.htm> European Commission. Directorate-General for Economic and Financial Affairs. 2007b. “Annual Report on the Euro Area - 2007”,
Brussels, EC-DGEFA, SEC(2007) 550 European Commission. Directorate-General for Economic and Financial Affairs. 2007a. “The Stability and Growth Pact”
<http://europa.eu.int/comm/economy_finance/about/activities/sgp/sgp_en.htm>, and “Stability and Convergence Programs” <http://europa.eu.int/comm/economy_finance/about/activities/sgp/scp_en.htm>.
European Commission. Directorate-General for Economic and Financial Affairs. 2005. “The economic costs of non-Lisbon A survey of the literature on the economic impact of Lisbon-type reforms”. Occasional Papers No. 16, March.
European Commission. Directorate-General for Employment, Social Affairs and Equal Opportunities. 2006. L’emploi en Europe, Luxembourg, OOPEC.
European Commission. Directorate-General for Regional Policy. 2006. Third Report on Cohesion Policy, Luxembourg, OOPEC. European Court of Auditors. 2006. Annual Reports Concerning the Financial Year 2005, Official Journal of the European Union,
no. C263, Oct. 31. European Parliament. Directorate-General for Research. 2007. Fact Sheets <http://www.europarl.eu.int/factsheets /info_en.htm>. European Union. 2004. “Treaty establishing a Constitution for Europe”, Official Journal of the European Union, Vol. 47, No.
C310, Dec. 16. European Union. Economic Policy Committee. many years. Annual Report on Structural Reforms, Brussels, EPC. Eurostat. 2007. <http://epp.eurostat.cec.eu.int>.
28
Eurostat. 2006b. Eurostat Yearbook 2006-07. Luxembourg, Eurostat. Eurostat. 2006a. Agricultural Statistics. Luxembourg, Eurostat. Eurostat. 2005. Living Conditions in Europe. Statistical Pocket, Luxembourg, Eurostat. Feldstein, Martin. 2005. “The Euro and The Stability Pact“. National Bureau of Economic Research, wp 11249. Feldstein, Martin and Horst Siebert. eds. 2002. Social Security Pension Reform in Europe, Chicago, IL, The University of Chicago
Press. Fischer, Jonas and Lars Jonung, Martin Larch. 2007. “101 Proposals to reform the Stability and Growth Pact. Why so many? A
Survey”. European Economy. Economic Papers, No. 267, Jan. Florida, Richard and Irene Tinagli. 2004. Europe in the Creative Age <http://www.creativeclass.org> Florida, Richard. 2002. The Rise of the Creative Class: And How It's Transforming Work, Leisure, Community and Everyday Life,
New York, NY, Basic Books. Gersemann, Olaf. 2004. Cowboy Capitalism. European Myths, American Reality. Washington, D.C., Cato Institute. Gordon, Robert J. 2006. “Future U.S. Productivity Growth: Looking Ahead by Looking Back”, paper presented at the Workshop in
Occasion of Angus Madisson’s 80th Birthday, World Economic Performance: Past, Present, and Future, University of Groningen, the Netherlands, Oct. 27.
Gordon, Robert J., and Ian Dew-Becker. 2005. “Why Did Europe’s Productivity Catch-up Sputter Out? A Tale of Tigers and Tortoises,” paper presented at FRBSF/CSIP Conference Productivity Growth: Causes and Consequences, Federal Reserve Bank of San Francisco, Nov. 18.
Hamilton, Daniel S. and Joseph P. Quinlan. 2005. Partners In Prosperity: The Changing Geography Of The Transatlantic Economy. Washington, D.C., Johns Hopkins UP-Center for Transatlantic Relations.
Hughes Hallet, Andrew, Sevend S. Hougaard Jensen and Christian Richter. 2005. “The European Economy at the cross roads: Structural Reforms, Fiscal Constraints, and the Lisbon Agenda”. Research in International Business and Finance, Volume 19, No. 2, June: 229-250.
International Labour Office. 2007. The 20 Key Indicators of The Labour Market, <http://www.ilo.org/public/english/employment/ strat/kilm/indicats.htm>.
International Monetary Fund. 2007. World Economic Outlook. Washington, D.C., IMF. International Monetary Fund. 2006. Concluding Statement of the IMF Mission on Euro-Area Policies,
<http://www.imf.org/external/np/ms/2006/053006.htm> Kay, John. 2005. “Is the European Social Model Doomed?”, Jacquemin Micro-economic Seminar, European Commission, Group
of Economic Policy Analysis, Oct. 13. Kok, Wim, dir. 2004. Facing the challenge. The Lisbon strategy for growth and employment, Luxembourg, OOPEC. L’Angevin, Clotilde and Fabrice Montagné. 2006. “Le policy-mix en zone euro et aux États-Unis de 1999 à aujourd’hui”.
Diagnostics, Prévisions et Analyses Économiques, [République Française], Direction Générale du Trésor et de la Politique Économique, No. 113, June
Madsen, P. K. 2002. “The Danish Model of "Flexicurity" – A Paradise with some Snakes”, European Foundation for the Improvement of Living and Working Conditions <http://www.eurofound.eu.int/ewco/employment/ documents/madsen.pdf>
Mundell, Robert. 1998. “The Euro and the Stability of the International Monetary System”, paper presented at a conference sponsored jointly by the Luxembourg Institute for European and International Studies and the Pierre Werner Foundation on "The euro as a stabilizer in the international economic system," Dec. 3-4.
Michie, J., Sheenan, M. 2003. “Labour market deregulation, 'flexibility' and innovation”, Cambridge Journal of Economics, Vol. 27, p. 123-143.
Nicoletti, G., A. Bassanini, E. Ernst, S. Jean, P. Santiago, P. Swaim. 2001. “Product and Labour Market Interactions in OECD Countries”, Economics Department Working Papers [of the Directorate-General for Economic and Financial Affairs], No. 312.
Noyer, Christian. 2004. “The Euro Five Years On: Achievements and New Challenges”, paper presented to the Conference “Five Years of the Euro: Successes and New Challenges”, organized by The Federal Reserve Bank of Dallas and the University of Texas at Austin, May 14–16.
OECD. 2007c. Main Economic Indicators, Vol. 2007, No. 4. Paris, OECD. OECD. 2007b. <http://www.oecd.org/statsportal>. OECD. 2007a. Economic Policy Reforms: Going for Growth, Paris, OECD. OECD. 2006b. Economic Outlook, Vol. 2006/2, No. 80, Dec., Paris, OECD. OECD. 2006a. Employment Outlook 2005, Paris, OECD. OECD. 2005. OECD in Figures, Paris, OECD. OECD, 2003. The Sources of Growth in the OECD Countries, Paris, OECD. OECD. 2002. Regulatory Policies in OECD Countries: From Interventionism to Regulatory Governance, Paris, OECD. Padoa-Schioppa, Tommaso. dir. 1987. Efficiency, Stability, And Equity : A Strategy for the evolution of the Economic System of
the European Community. Oxford: OUP. Pisani-Ferry, Jean. 2007. “Will France and Germany diverge on fiscal policy?”. Financial Times Deutschland/Wirtschaftswunder,
April. Pisani-Ferry, Jean and André Sapir. 2006. “Last exit to Lisbon”. Bruegel Policy Brief, No. 2006/02. Radio, M-J and C.A. Bates Jr. eds. 2006. National Reform Programs. Key to Successful Future of the European project? Gdansk,
Pl, Institute for Market Economics. Rajan, Raghuram. 2005. Revitalizing Reforms in Europe. The Ludwig Erhard Lecture,
http://www.imf.org/external/np/speeches/2005/120805.htm. Rajan, Raghuram. 2004. “Why Are Structural Reforms so Difficult?”. Finance and Development, June: 56-57. Rato, Rodrigo de. 2007. Speech by Rodrigo de Rato, Managing Director of the International Monetary Fund at the Peterson
Institute for International Economics, Washington D.C., April 9. Rodrigues, Maria João. 2003. European Policies for a Knowledge Economy, Cheltenham, UK, Edward Elgar. Rodrigues, Maria João. ed. 2002. The New Knowledge Economy in Europe., A Strategy for International Competitiveness and
Social Cohesion, Cheltenham, UK, Edward Elgar. Sapir, André. 2005. “Globalisation and the Reform of European Social Models. Background Document for the Presentation at the
Ecofin Informal Meeting in Manchester”, Sept. 9.
29
Sapir, André. dir. 2003. An Agenda For A Growing Europe. Making the EU Economic System Deliver. Report of an Independent High-Level Study Group established on the initiative of the President of the European Commission, Luxembourg, OOPEC.
Scheide, Joachim. 2004. “Macroeconomic Policy Coordination in Europe. An Agnostic View”, in Horst Siebert. ed. 2004. Macroeconomic Policies in the World Economy, Berlin, Springer – The Kiel Institute for the World Economy, pp. 235-261.
Schettkat, R. 2003. “Are institutional rigidities at the root of European unemployment?”. Cambridge Journal of Economies, Vol. 27: 771-787.
Schulmeister, Stephan. 2000. „Die unterschiedliche Wachstumsdynamik in den USA und Deutschland in den Neunziger Jahren“, WIFO Working Paper, No. 134.
Sharpe, Andrew. 2007. “Lessons for Canada from International Productivity Experience”, International Productivity Monitor, No. 14: 20-37.
Soukiazis, Elias and Vítor Castro. 2005. “How the Maastricht criteria and the Stability and Growth >Pact Affected Rel Convergence in the European Union: A Panel Data Analysis”. Journal of Policy Modeling, Vol. 27, No. 3, April: 385-399.
Streek, Wolfgang and Christine Trampusch. 2005. “Economic Reform and the Political Economy of the German Welfare State”, German Politics, Vol. 14, No.2, June: 174-195.
Tabellini, Guido and Charles Wyploz. 2004. Réformes structurelles et coordination en Europe. Paris : La documentation française. United Nations. 2007. Human Development Index <http://hdr.undp.org> US Bureau of Labor Statistics. 2007. <http://stats.bls.gov/blshome.html>. US Council of Economic Advisers. many years. Economic Report of the President Transmitted to the Congress,
February [year], Together with the Annual Report of the Council of Economic Advisers, Washington, D.C., Government Printing Office.
US fedStats. 2007. <http://www.fedStats.gov>. Van Ark, Bart, Robert Inklaar, Robert H. McGuckin and Marcel P. Timmer. 2003. “The Employment Effects of the ‘New
Economy’. A Comparison of the European Union and the United States”, National Institute Economic Review, No. 184, April: 70-82.
Véron, Nicolas. 2006. “Farewell National Champions”. Bruegel Policy Brief , No. 2006/04. Wyploz, Charles. 2006. New Europe’s Old Problems <http://www.project-syndicate.org>.

30
Appendix
Table A
An Estimation of the Cost of the European Economy Disequilibria And of the Benefits of an European Economic Policy
A limitation to growth can be a source of growth after to be removed
Pool of problems and sources of solutions
Costs of Problems
= Benefits of Solutions
A+B. Living standard gap between EU15 and US
30 % GDP
A. Less Use of Labor 16% GDPpc (+/- 10%)
A.1. Less Employment rate in EU and in US 6% employment rate A.2. Unemployment compensation 2% GDP
A.3. Less Time of work 15 % annual time of work
Contrast: i). Gap between Unemployment rate and NAIRU 1,5% employment Contrast: ii). Gap between Potential GDP and Current GDP 2% GDP
B. Less Productivity 14% GDPphw
B.1. Reduced economic freedom 1.5% GDP B.2. Over-regulation and non-competitive market practices 1% GDP
B.3 Less skills 2% GDP B.4. Reduced flexibility of workers 2% GDP
B.5. Investments in R + D (a 0,1% increase in Business R&D intensity enlarges 1,2% GDPpw)
2% GDP
B.6. Cost of non-Lisbon 8% GDPpw acc. in 10 years
Structural Reform
s: + 2,8% [+1,7%
in US]
C. Broad 5% GDP
C.1. Non-Europe Cost: benefits to complete the integration process 2% GDP C.2. The US-EU Free Trade Area Benefits 0,3% [0,9% for US] C.3. A 10% more trade exposure enlarges 4% GDPpw
D. Cost of other disequilibria 10% GDP
D.1. Economic 6% GDP D.1.1. Inflation price (a 1% reduction increases 0,4/0,5% GDPpw) 0,5%
D.1.2. CAP Agriculture Regulation Costs 0,4% GDP D.1.3. Trade imbalance 0,5% GDP
D.1.4. Public deficit: Interests and Cost of investment eviction 2 % GDP D.1.5. Over Taxation and Unproductive public expenditures (a 1% reduction in tax burden enlarges GDPpw in 0,6/0,7%)
2,5% GDP
D.1.6. Deficit of Common EU Policies, Non Constitution for Europe 0,5% GDP D.2. Social 3% GDP
D.2.1. Immigrant SSS benefits 0,5 GDP D.2.2. Deviation and Prisons Cost 1% GDP
D.2.3. Environment: Degradation and Waste 1% GDP D.3. Politic 2% GDP
D.3.1. Fraud, over-protection, and errors of the fiscal and the SSS 1,5 % GDP D.3.2. Political Instability in MS, Practices against the economic security 0,4% GDP Parameters of this estimation: To explain the gap between the US productivity by worker (around 65,000 $ PPC
and the EU living standard (around 25,000).
31
Table B
Progress of the European Union in the Economic Policy Reforms
A slowdown in labour productivity growth since the mid-1990s combined with weak growth in labour resource utilisation has resulted in a widening of the per capita income gap vis-à-vis the United States.
Policy priorities
Ease the regulatory burden on business operations
Challenge and recommendations: To strengthen labour productivity performance, it was recommended that internal regulatory obstacles to cross-border trade and entry be further eased. This should include an improvement of the EU-wide public procurement regime and the adoption of EU-wide standards if needed. Actions taken: The Commission submitted a draft Directive on Services in the Internal Market for a first reading to the European Parliament in March 2005. It underpins the freedom to provide services in another member state and the freedom for consumers to purchase services from providers in another member state. After the draft met with heavy opposition from some member states, the Commission is reconsidering the most contentious provisions.
Raise competition in network industries Challenge and recommendations: To promote greater competition in product markets, it was recommended that barriers to market contestability in network industries, where incumbents remain dominant despite liberalisation measures in recent years, be further reduced. Actions taken: A new liberalisation package for port services, to be phased in by 2020, was tabled by the Commission in late 2004. In June 2005, the Commission began investigating possible distortions of competition in the electricity and gas sectors, and in July 2005, a regulation favouring competitive tendering processes in both public rail and road transport was introduced.
Reduce producer support to agriculture Challenge and recommendations: To improve economy-wide and global efficiency, it was recommended to reduce high producer support to agriculture and to improve market access for non-EU countries. This would involve further moves away from production to income support and the elimination of export subsidies. Actions taken: Decoupling of support from output is being implemented in the hops, cotton, olive oil and tobacco sectors, adding to the range of products which were decoupled in 2003. A reduction of support to sugar producers has been agreed. Other actions are pending the outcome of the Doha trade round.
Enhance intra-European labour mobility Challenge and recommendations: To promote the efficient allocation of labour resources, it was recommended that obstacles to cross-border labour mobility, notably the lack of cross-border portability of pension and social security entitlements, be removed. Actions taken: A pan-European Job Mobility Portal (EURES), disclosing information of national public employment services, is being implemented. A new “Social Agenda” launched by the Commission in February 2005 aims to promote the cross-border portability of pension and social security entitlements.
Further integrate European financial market Challenge and recommendations: In order to foster economic integration, the Financial Services Action Plan, the EU central tool to foster financial market integration, is being implemented. However, more progress needs to be made to enhance the cross-border integration in markets for retail financial services. Actions taken: The Commission has opened an inquiry into the stance of competition in retail banking and has launched a consultation on the functioning of the EU mortgage market, looking for ways to strengthen competition and raise efficiency.
Source: OECD (2006).
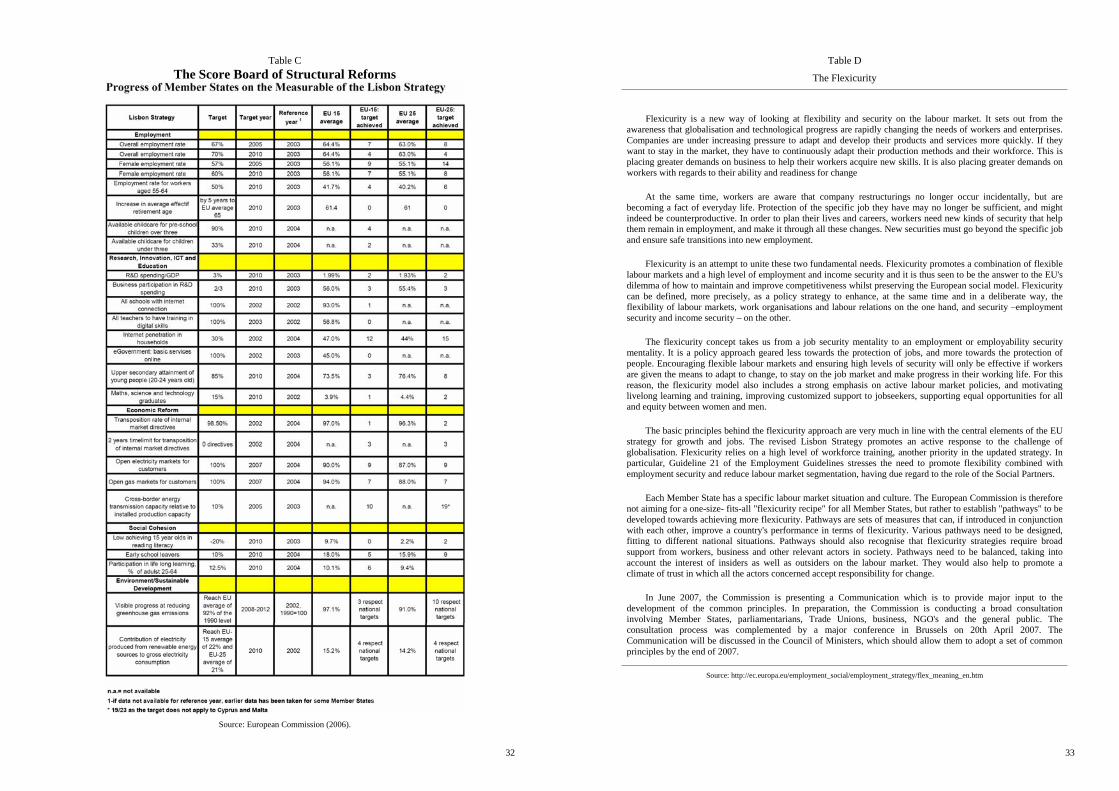
32
Table C
The Score Board of Structural Reforms
Source: European Commission (2006).
33
Table D
The Flexicurity
Flexicurity is a new way of looking at flexibility and security on the labour market. It sets out from the awareness that globalisation and technological progress are rapidly changing the needs of workers and enterprises. Companies are under increasing pressure to adapt and develop their products and services more quickly. If they want to stay in the market, they have to continuously adapt their production methods and their workforce. This is placing greater demands on business to help their workers acquire new skills. It is also placing greater demands on workers with regards to their ability and readiness for change
At the same time, workers are aware that company restructurings no longer occur incidentally, but are becoming a fact of everyday life. Protection of the specific job they have may no longer be sufficient, and might indeed be counterproductive. In order to plan their lives and careers, workers need new kinds of security that help them remain in employment, and make it through all these changes. New securities must go beyond the specific job and ensure safe transitions into new employment.
Flexicurity is an attempt to unite these two fundamental needs. Flexicurity promotes a combination of flexible labour markets and a high level of employment and income security and it is thus seen to be the answer to the EU's dilemma of how to maintain and improve competitiveness whilst preserving the European social model. Flexicurity can be defined, more precisely, as a policy strategy to enhance, at the same time and in a deliberate way, the flexibility of labour markets, work organisations and labour relations on the one hand, and security –employment security and income security – on the other.
The flexicurity concept takes us from a job security mentality to an employment or employability security mentality. It is a policy approach geared less towards the protection of jobs, and more towards the protection of people. Encouraging flexible labour markets and ensuring high levels of security will only be effective if workers are given the means to adapt to change, to stay on the job market and make progress in their working life. For this reason, the flexicurity model also includes a strong emphasis on active labour market policies, and motivating livelong learning and training, improving customized support to jobseekers, supporting equal opportunities for all and equity between women and men.
The basic principles behind the flexicurity approach are very much in line with the central elements of the EU strategy for growth and jobs. The revised Lisbon Strategy promotes an active response to the challenge of globalisation. Flexicurity relies on a high level of workforce training, another priority in the updated strategy. In particular, Guideline 21 of the Employment Guidelines stresses the need to promote flexibility combined with employment security and reduce labour market segmentation, having due regard to the role of the Social Partners.
Each Member State has a specific labour market situation and culture. The European Commission is therefore not aiming for a one-size- fits-all "flexicurity recipe" for all Member States, but rather to establish "pathways" to be developed towards achieving more flexicurity. Pathways are sets of measures that can, if introduced in conjunction with each other, improve a country's performance in terms of flexicurity. Various pathways need to be designed, fitting to different national situations. Pathways should also recognise that flexicurity strategies require broad support from workers, business and other relevant actors in society. Pathways need to be balanced, taking into account the interest of insiders as well as outsiders on the labour market. They would also help to promote a climate of trust in which all the actors concerned accept responsibility for change.
In June 2007, the Commission is presenting a Communication which is to provide major input to the development of the common principles. In preparation, the Commission is conducting a broad consultation involving Member States, parliamentarians, Trade Unions, business, NGO's and the general public. The consultation process was complemented by a major conference in Brussels on 20th April 2007. The Communication will be discussed in the Council of Ministers, which should allow them to adopt a set of common principles by the end of 2007.
Source: http://ec.europa.eu/employment_social/employment_strategy/flex_meaning_en.htm
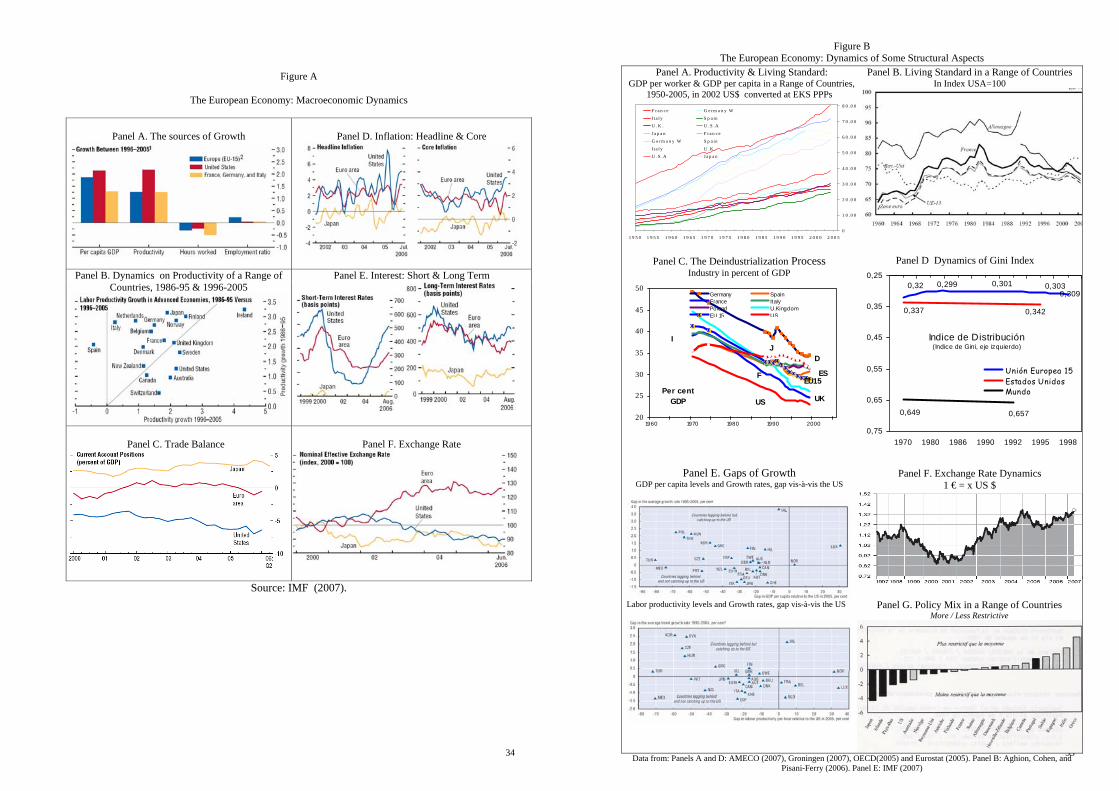
34
Figure A
The European Economy: Macroeconomic Dynamics
Panel A. The sources of Growth
Panel D. Inflation: Headline & Core
Panel E. Interest: Short & Long Term Panel B. Dynamics on Productivity of a Range of Countries, 1986-95 & 1996-2005
Panel C. Trade Balance
Panel F. Exchange Rate
Source: IMF (2007).
35
Figure B The European Economy: Dynamics of Some Structural Aspects
Panel A. Productivity & Living Standard: GDP per worker & GDP per capita in a Range of Countries,
1950-2005, in 2002 US$ converted at EKS PPPs
0
1 0 .0 0
2 0 .0 0
3 0 .0 0
4 0 .0 0
5 0 .0 0
6 0 .0 0
7 0 .0 0
8 0 .0 0
1 9 5 0 1 9 5 5 1 9 6 0 1 9 6 5 1 9 7 0 1 9 7 5 1 9 8 0 1 9 8 5 1 9 9 0 1 9 9 5 2 0 0 0 2 0 0 5
F r a n c e G e rm a n y W
It a l y S p a inU .K . U .S .A
J a p a n F r a n c e
G e r m a n y W S p a in
It a l y U .K .U .S .A Ja p a n
Panel B. Living Standard in a Range of Countries In Index USA=100
Panel C. The Deindustrialization Process Industry in percent of GDP
20
25
30
35
40
45
50
1960 1970 1980 1990 2000
Germany SpainFrance ItalyPoland U.KingdomEU 15 US
F ES
UK
JI
US
D
EU15Per cent
GDP
Panel D Dynamics of Gini Index
0,3090,32 0,299 0,301 0,303
0,3420,337
0,649 0,657
0,25
0,35
0,45
0,55
0,65
0,751970 1980 1986 1990 1992 1995 1998
Unión Europea 15Estados UnidosMundo
Indice de Distribución (Indice de Gini, eje izquierdo)
Panel F. Exchange Rate Dynamics
1 € = x US $
Panel E. Gaps of Growth GDP per capita levels and Growth rates, gap vis-à-vis the US
Labor productivity levels and Growth rates, gap vis-à-vis the US
Panel G. Policy Mix in a Range of Countries More / Less Restrictive
Data from: Panels A and D: AMECO (2007), Groningen (2007), OECD(2005) and Eurostat (2005). Panel B: Aghion, Cohen, and Pisani-Ferry (2006). Panel E: IMF (2007)
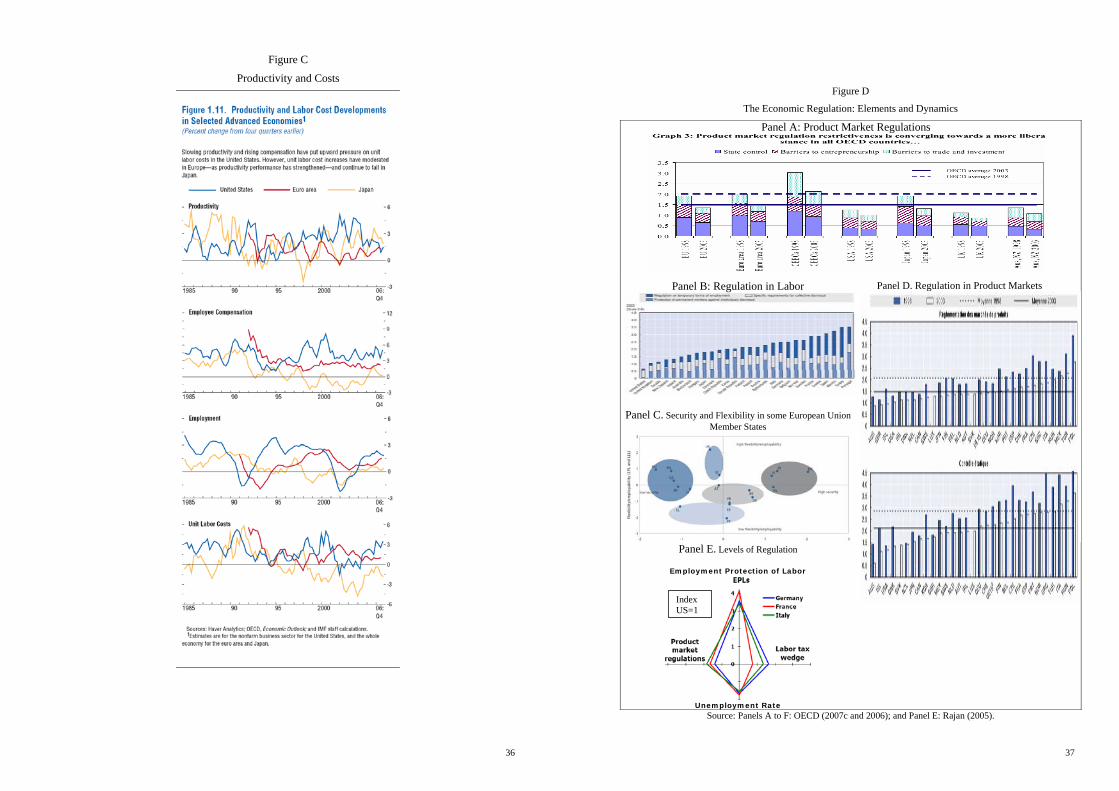
36
Figure C
Productivity and Costs
37
Figure D
The Economic Regulation: Elements and Dynamics
Panel A: Product Market Regulations
Panel B: Regulation in Labor
Panel C. Security and Flexibility in some European Union
Member States
Panel E. Levels of Regulation
Employment Protection of Labor
Unemployment Rate
Panel D. Regulation in Product Markets
Source: Panels A to F: OECD (2007c and 2006); and Panel E: Rajan (2005).
Index US=1
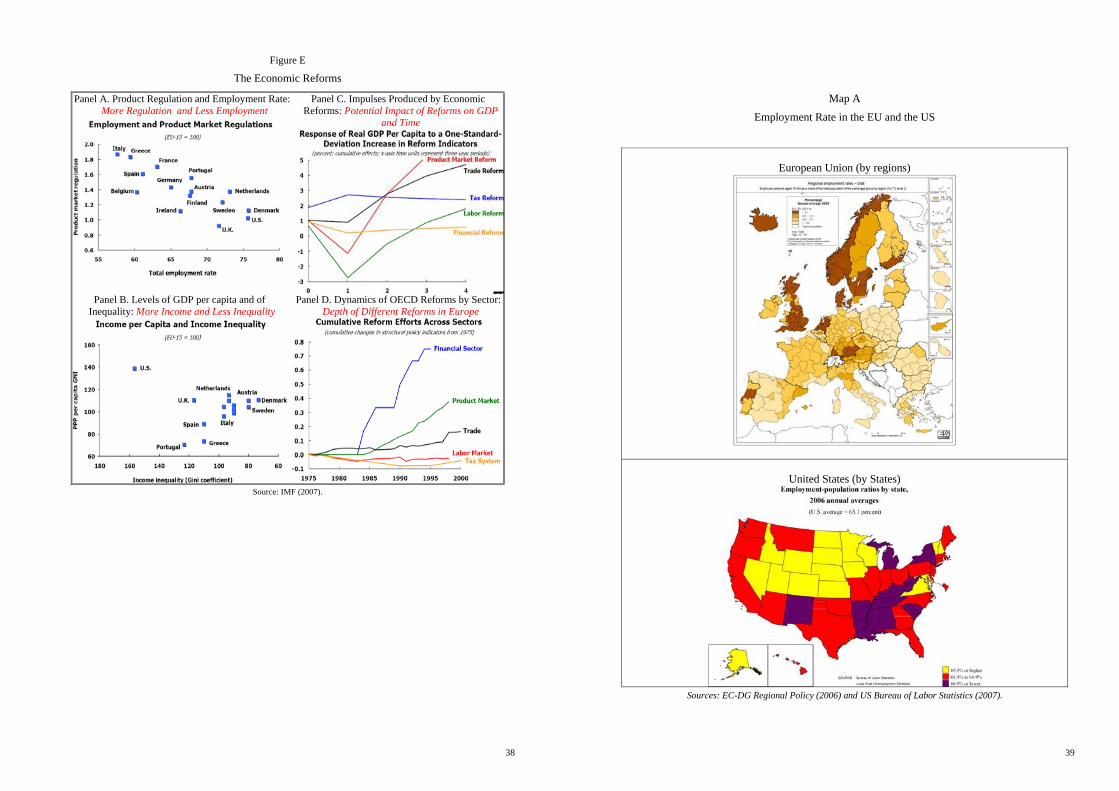
38
Figure E
The Economic Reforms
Panel A. Product Regulation and Employment Rate: More Regulation and Less Employment
Panel C. Impulses Produced by Economic Reforms: Potential Impact of Reforms on GDP
and Time
Panel B. Levels of GDP per capita and of Inequality: More Income and Less Inequality
Panel D. Dynamics of OECD Reforms by Sector: Depth of Different Reforms in Europe
Source: IMF (2007).
39
Map A
Employment Rate in the EU and the US
European Union (by regions)
United States (by States)
Sources: EC-DG Regional Policy (2006) and US Bureau of Labor Statistics (2007).