the next era of aerospace and defense: how to outperform ... · source: deloitte analysis of...
TRANSCRIPT

The next era of aerospace and defense: How to outperform in an environment of innovative disruption 2017 Company performance update
2
The Next Era of Aerospace & Defense | 2017 Company Performance Update
IntroductionIn 2016, Deloitte released the Next era of aerospace and defense study. The study showed a vast portion of the Aerospace & Defense (A&D) sector was underperforming its potential by 1) not pursuing active strategies (e.g., consolidation vs. staying the course), and 2) using legacy business models that no longer align with market needs. Companies that chose better strategies and business models outperformed those that didn’t by up to seven times. We also showed which companies were better positioned to outperform than others.
This study, a follow up to the 2016 Next Era of Aerospace & Defense study, shows updated findings that reflect 2016 company financial data. Highlights include:
• Average total shareholder returns (“TSR”) of A&D companies increased 11.8 percentage points from 2015, although the improvement was smaller (10.6 percent) when removing the effects of dividends and share buybacks (“OpTSR” as defined in the right hand call out box)1
• However, neither 2016 average A&D TSR nor underlying OpTSR kept pace with the S&P 500; A&D company average TSR was ~40 percent below the S&P 5002 while OpTSR was over 20 percent below the S&P 5003
• Only 35 of the 85 A&D companies analyzed outperformed the S&P 500 in 2016; this is similar to 2015 when 38 of the 85 A&D companies analyzed outperformed the S&P 5004
• Tier 1 through 3 and MRO/Aftermarket suppliers posted the best annual OpTSR improvement of the subsectors (15 to 20 percentage points); all subsectors except Engine Manufacturers posted annual gains in 20165
• There was significant churn in annual OpTSR performance rankings, with over 40 percent of companies in each OpTSR performance quartile shifting quartiles up or down; almost 70 percent of companies in the middle two performance quartiles shifted positions6
• Perhaps most importantly, similar to what was reported in the original study, companies with more active strategies continued to outperform those with less active strategies by up to approximately five times7
Approximating the measurement of core operations performance
In this study, Deloitte uses a financial metric called “Operational Total Shareholder Return” or “OpTSR” which is used as a proxy for shareholder return from core operations as opposed to financial techniques. OpTSR can be argued to be a more reliable metric for the long-term health and performance of a company’s foundational business given variations in share buybacks and dividend growth can mask the performance of a company’s core operations. OpTSR is calculated by deducting the components of dividends and changes in outstanding shares from total shareholder return. Other financial metrics such as EBITDA and ROIC are good indicators of certain aspects of financial performance, but mainly for short-term “snapshots”, and individually they are largely uncorrelated with long-term company performance.8

3
The Next Era of Aerospace & Defense | 2017 Company Performance Update
4
The Next Era of Aerospace & Defense | 2017 Company Performance Update
Industry performance
2016 a better year, but the shadow of 2014 and 2015 lingers
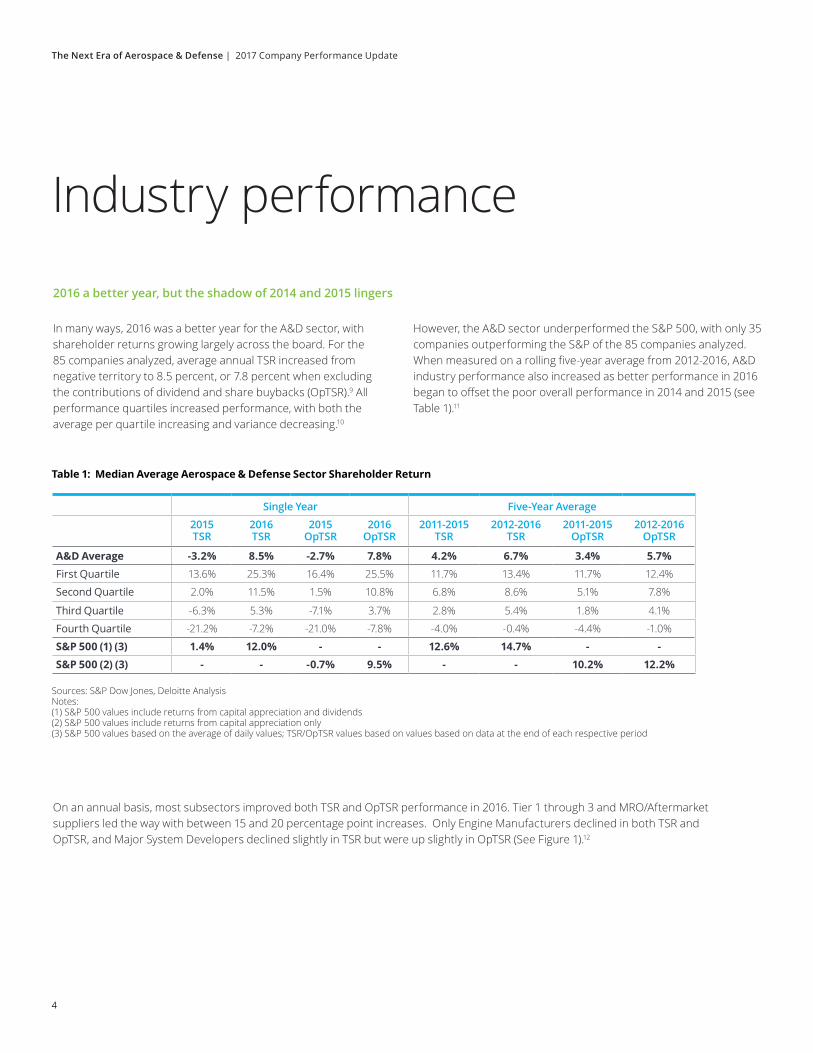
In many ways, 2016 was a better year for the A&D sector, with shareholder returns growing largely across the board. For the 85 companies analyzed, average annual TSR increased from negative territory to 8.5 percent, or 7.8 percent when excluding the contributions of dividend and share buybacks (OpTSR).9 All performance quartiles increased performance, with both the average per quartile increasing and variance decreasing.10
Table 1: Median Average Aerospace & Defense Sector Shareholder Return
However, the A&D sector underperformed the S&P 500, with only 35 companies outperforming the S&P of the 85 companies analyzed. When measured on a rolling five-year average from 2012-2016, A&D industry performance also increased as better performance in 2016 began to offset the poor overall performance in 2014 and 2015 (see Table 1).11
Sources: S&P Dow Jones, Deloitte AnalysisNotes:(1) S&P 500 values include returns from capital appreciation and dividends(2) S&P 500 values include returns from capital appreciation only(3) S&P 500 values based on the average of daily values; TSR/OpTSR values based on values based on data at the end of each respective period
On an annual basis, most subsectors improved both TSR and OpTSR performance in 2016. Tier 1 through 3 and MRO/Aftermarket suppliers led the way with between 15 and 20 percentage point increases. Only Engine Manufacturers declined in both TSR and OpTSR, and Major System Developers declined slightly in TSR but were up slightly in OpTSR (See Figure 1).12
Single Year Five-Year Average
2015 TSR
2016 TSR
2015 OpTSR
2016 OpTSR
2011-2015 TSR
2012-2016 TSR
2011-2015 OpTSR
2012-2016 OpTSR
A&D Average -3.2% 8.5% -2.7% 7.8% 4.2% 6.7% 3.4% 5.7%First Quartile 13.6% 25.3% 16.4% 25.5% 11.7% 13.4% 11.7% 12.4%
Second Quartile 2.0% 11.5% 1.5% 10.8% 6.8% 8.6% 5.1% 7.8%
Third Quartile -6.3% 5.3% -7.1% 3.7% 2.8% 5.4% 1.8% 4.1%
Fourth Quartile -21.2% -7.2% -21.0% -7.8% -4.0% -0.4% -4.4% -1.0%
S&P 500 (1) (3) 1.4% 12.0% - - 12.6% 14.7% - -S&P 500 (2) (3) - - -0.7% 9.5% - - 10.2% 12.2%

5
The Next Era of Aerospace & Defense | 2017 Company Performance Update
Figure 1: Median Average A&D Subsector OpTSR, 2015 vs 2016
Figure 2: Change in Three-Year Average OpTSR Performance Quartiles (% Companies/Quartile)
Note: Reflects quartiles based on average annual OpTSR performance 2013-2015 to 2014-2016Source: Deloitte analysis based on S&P Capital IQ data
Source: Deloitte analysis of S&P Capital IQ
Significant performance churn
In 2016 significant churn between performance quartiles occurred. Almost 40 percent of companies fell out of the top quartile, while almost 40 percent of companies climbed out of the bottom quartile. In the middle two quartiles, almost 70 percent of companies changed position; of those changing position, more companies in the second quartile fell at least one quartile while more companies in the third quartile improved position.13
59%
32%
32%
55%
32%
9%
0%32%
18%
23%
18%
14%
10%
32%
5%
30%
Top Quartile
2nd Quartile
3rd Quartile
Bottom Quartile
15.0%
2015 2016
10.0%
5.0%
-6.0%-5.1%
Aerost
ruct
ures
Comm
ercia
l & D
efen
se
Platfo
rm In
tegr
ators
Comm
ercia
l Plat
form
Inte
grat
orsDef
ense
Platfo
rm
Inte
grat
ors
Engin
e
Man
ufact
urers
Govern
men
t
Serv
ices
Majo
r Sys
tem
Develo
pers (
Tier 0.5)
MRO an
d
Afterm
arke
tSa
tellit
e and Rock
et
Man
ufact
urers
Tier 1
Supplie
rs
Tier 2
Supplie
rs
Tier 3
Supplie
rs
-3.0%
6.7%
1.4%
4.3% 4.8% 5.6% 5.3% 5.8%7.3% 7.2%
8.2%
10.3%
13.5%
2.5%
12.7%
0.5%
-10.9%-8.7%
-2.5%
-8.1%-9.5%
-1.8%
0.0%
-5.0%
-10.0%
-15.0%

6
The Next Era of Aerospace & Defense | 2017 Company Performance Update
What happened to dividends and share buybacks?
When comparing the two most recent five year periods, the amount of share buybacks and dividends decreased as a percent of total shareholder return. Across all company sizes, the percent share of shareholder return attributable to dividends and share buybacks decreased by ~8.5 percentage points on average.14
Table 2: Distribution of Financial Technique Usage by Company Revenue Size
Source: Deloitte analysis of S&P Capital IQ data for the largest 85 A&D companies; some companies excluded given incomplete data.
Size of Company Median Average TSR 2012-2016
Median Average OpTSR 2012-2016
Median Percent Contribution to TSR of Dividends and Share Buybacks
2012-2016
Top Quartile 9.9% 7.9% 32.7%
Second Quartile 7.1% 5.7% 19.1%
Third Quartile 6.4% 4.5% 24.6%
Bottom Quartile 6.6% 5.7% 12.8%
Size of Company Median Average TSR 2011-2015
Median Average OpTSR 2011-2015
Median Percent Contribution to TSR of Dividends and Share Buybacks
2011-2015
Top Quartile 8.9% 4.7% 32.0%
Second Quartile 3.5% 2.0% 39.1%
Third Quartile 4.7% 3.0% 29.0%
Bottom Quartile 2.9% 2.0% 23.1%
7
The Next Era of Aerospace & Defense | 2017 Company Performance Update
Active strategies still win
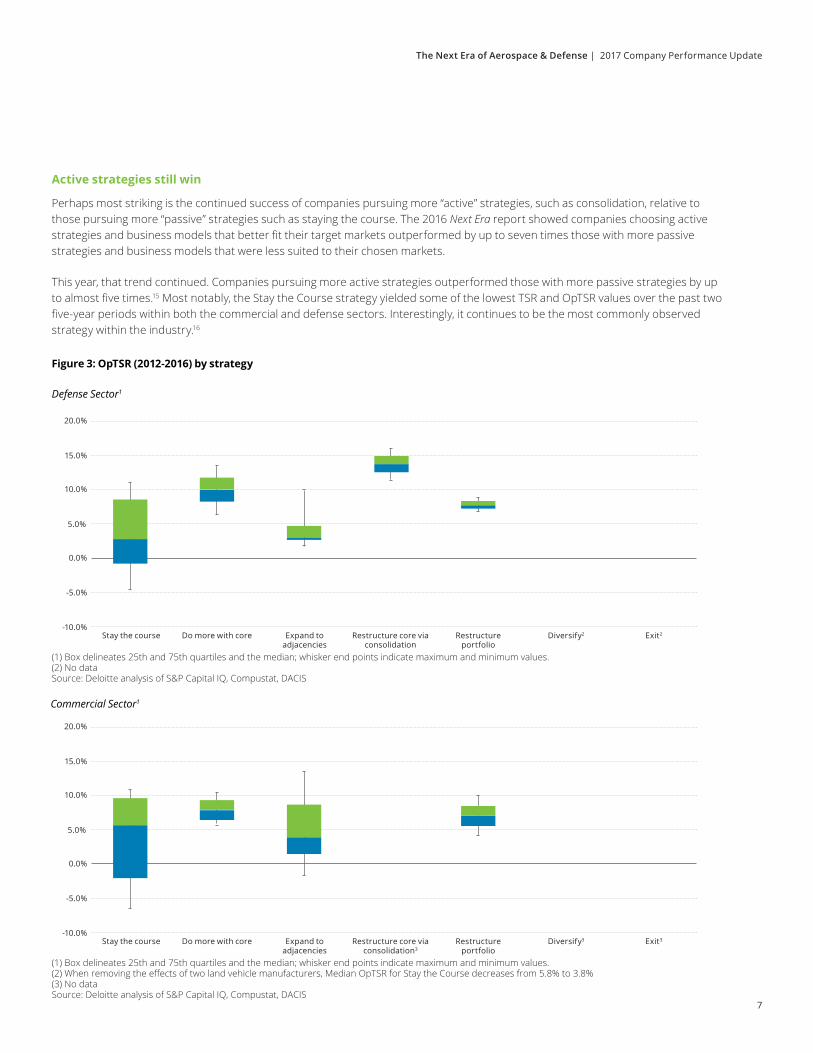
Perhaps most striking is the continued success of companies pursuing more “active” strategies, such as consolidation, relative to those pursuing more “passive” strategies such as staying the course. The 2016 Next Era report showed companies choosing active strategies and business models that better fit their target markets outperformed by up to seven times those with more passive strategies and business models that were less suited to their chosen markets.
This year, that trend continued. Companies pursuing more active strategies outperformed those with more passive strategies by up to almost five times.15 Most notably, the Stay the Course strategy yielded some of the lowest TSR and OpTSR values over the past two five-year periods within both the commercial and defense sectors. Interestingly, it continues to be the most commonly observed strategy within the industry.16
Figure 3: OpTSR (2012-2016) by strategy
Defense Sector1
Commercial Sector1
(1) Box delineates 25th and 75th quartiles and the median; whisker end points indicate maximum and minimum values. (2) No dataSource: Deloitte analysis of S&P Capital IQ, Compustat, DACIS
(1) Box delineates 25th and 75th quartiles and the median; whisker end points indicate maximum and minimum values.(2) When removing the effects of two land vehicle manufacturers, Median OpTSR for Stay the Course decreases from 5.8% to 3.8% (3) No dataSource: Deloitte analysis of S&P Capital IQ, Compustat, DACIS
20.0%
20.0%
15.0%
15.0%
10.0%
10.0%
5.0%
5.0%
0.0%
0.0%
-5.0%
-5.0%
-10.0%
-10.0%
Stay the course
Stay the course
Do more with core
Do more with core
Expand to adjacencies
Expand to adjacencies
Restructure core via consolidation
Restructure core via consolidation3
Restructure portfolio
Restructure portfolio
Diversify2
Diversify3
Exit2
Exit3
8
The Next Era of Aerospace & Defense | 2017 Company Performance Update
Potential causes
A series of factors within both the defense and commercial sectors are driving these results. These factors likely include:
Some operational improvements underway; financial engineering still a large factor
• Improvements in operational performance have begun to be more of a focus, but structural inefficiencies largely have not been addressed
• Financial levers continued to be an important means to generate returns
Limited core growth options
• Despite the promise of increased defense spending, core organic growth of defense-focused A&D companies has been anemic, and many companies vertically integrate or capture market share as primary means of growth
• On the commercial side, backlogs remain strong although order books continue to show some signs of weakness and may continue despite demands for increased air travel
Inability to transition Research and Development
• Many companies continue to struggle to transition Research and Development expenditures into meaningful revenue opportunities
• Within defense, recent budget sequestration and use of continuing resolutions robs the services of long-term recapitalization and of establishing programs of record for many of its new technology initiatives
Business models are a drag
• With lowering technology barriers and globalization, many A&D markets continue to move away from the traditional ways in which they have been served
• On the whole, A&D companies have been slow to react to these shifts, and have seen margins erode and some share captured by more nimble competitors

9
The Next Era of Aerospace & Defense | 2017 Company Performance Update
How should management react?
It is clear, going forward, financial methods to boost shareholder return are not enough. Additionally, more conservative and staid strategies are the lowest returning strategies within the A&D industry. To adapt to changing realities, aerospace executives should consider a series of themes to outperform:
1. Focus on the tough tasks
• Namely, management should feel confident to move beyond the low-hanging fruit and into the structural constraints on their businesses
• Among other things, look for operational and engineering efficiencies that leverage analytics, cognitive capabilities, and artificial intelligence to continue to streamline operations and manage costs
2. Get a growth story
• Pure organic growth will likely not be enough to sustain the returns that investors have come to expect
• Management teams will be increasingly forced to consider inorganic growth options going forward, and we have seen this happening over the past months
• The changing nature of M&A is highlighted in a recent Deloitte study, “Merger and acquisition trends in aerospace and defense: A closer look at value creation.”17 Building upon this study key assertions include:
Winning strategies and business model innovation
- Traditionally, A&D companies used M&A to deliver synergies and to drive economies of scale
- Instead, many A&D organizations are now using M&A to acquire companies with new products to gain access to new markets – as traditional A&D markets are generally stagnant
- Extracting value from this type of acquisition without destroying it poses a major new challenge for many A&D companies
3. Destroy (part of) your business
• Now, more than any time in the past decades, have the effects of commoditizing technology and global competition been so potentially disruptive to the legacy A&D industrial base
• Executive teams that have the confidence to cannibalize portions of their business by rethinking and innovating to disrupt the portions of their business most at risk will ultimately win
The bottom line
Making better strategy and business model choices demonstrably improves financial performance. But “running faster to keep up” may be a grossly insufficient strategy in the face of today’s fundamental market disruptions. Rethinking the constraints that are the basis upon which strategy and business model decisions are made today will be the hallmark of those companies that are truly poised to outperform the A&D industry over the next decade.

10
The Next Era of Aerospace & Defense | 2017 Company Performance Update
AuthorsErich M. Fischer, Ph.D. Principal, Aerospace & Defense Deloitte Consulting LLP +1 571 882 5081 [email protected]
Thank you to Alexander Fischer, Consultant, Deloitte Consulting LLP and Aijaz Hussain, Associate Vice President, Deloitte Center for Industry Insights, Deloitte Services LP, for their contributions to this study.
Douglas H. Bartels Manager, Aerospace & Defense Deloitte Consulting LLP +1 571 766 0859 [email protected]

11
The Next Era of Aerospace & Defense | 2017 Company Performance Update
Endnotes1. Deloitte analysis of S&P Capital IQ, S&P Dow Jones
2. Deloitte analysis of S&P Capital IQ, S&P Dow Jones (including dividends)
3. Deloitte analysis of S&P Capital IQ, S&P Dow Jones (excluding divideds)
4. Deloitte analysis of S&P Capital IQ, S&P Dow Jones
5. Ibid.
6. Ibid.
7. Deloitte analysis of S&P Capital IQ, Compustat, DACIS, public company reports
8. Next Era of Aerospace and Defense study, Deloitte, 2016, https://www2.deloitte.com/us/en/pages/manufacturing/articles/aerospace-defense-business-model-strategy-innovation.html
9. Deloitte analysis of S&P Capital IQ, S&P Dow Jones
10. Ibid.
11. Ibid.
12. Deloitte analysis of S&P Capital IQ
13. Ibid.
14. Ibid.
15. Deloitte analysis of S&P Capital IQ, Compustat, DACIS, public company reports
16. Ibid.
17. Merger and acquisition trends in aerospace and defense, Deloitte, 2016, https://www2.deloitte.com/us/en/pages/manufacturing/articles/aerospace-defense-industry-mergers-acquisitions-trends.html

About Deloitte
Deloitte refers to one or more of Deloitte Touche Tohmatsu Limited, a UK private company limited by guarantee (“DTTL”), its network of member firms, and their related entities. DTTL and each of its member firms are legally separate and independent entities. DTTL (also referred to as “Deloitte Global”) does not provide services to clients. Please see www.deloitte.com/about for a detailed description of DTTL and its member firms. Please see www.deloitte.com/us/about for a detailed description of the legal structure of Deloitte LLP and its subsidiaries. Certain services may not be available to attest clients under the rules and regulations of public accounting
Copyright © 2017 Deloitte Development LLC. All rights reserved.