the north carolina solar experience: high penetration of...
TRANSCRIPT
The North Carolina solar experience: high penetration of
utility-scale DER on the distribution system
John W. Gajda, P.E.Duke Energy
1
IEEE PES Working Group on Distributed Resources Integration

High penetration of utility-scale DER
• North Carolina’s solar story, 1978-2017
– what does this mean?
• Discoveries, considerations, requirements
– Distribution Reliability & Power Quality• medium voltage construction
• transformer energization & transient harmonics
– Distribution Planning• Area planning limitations & substation backfeed
• Capacity & Losses
• Policy changes, pre-2014 through to 2017
2
3
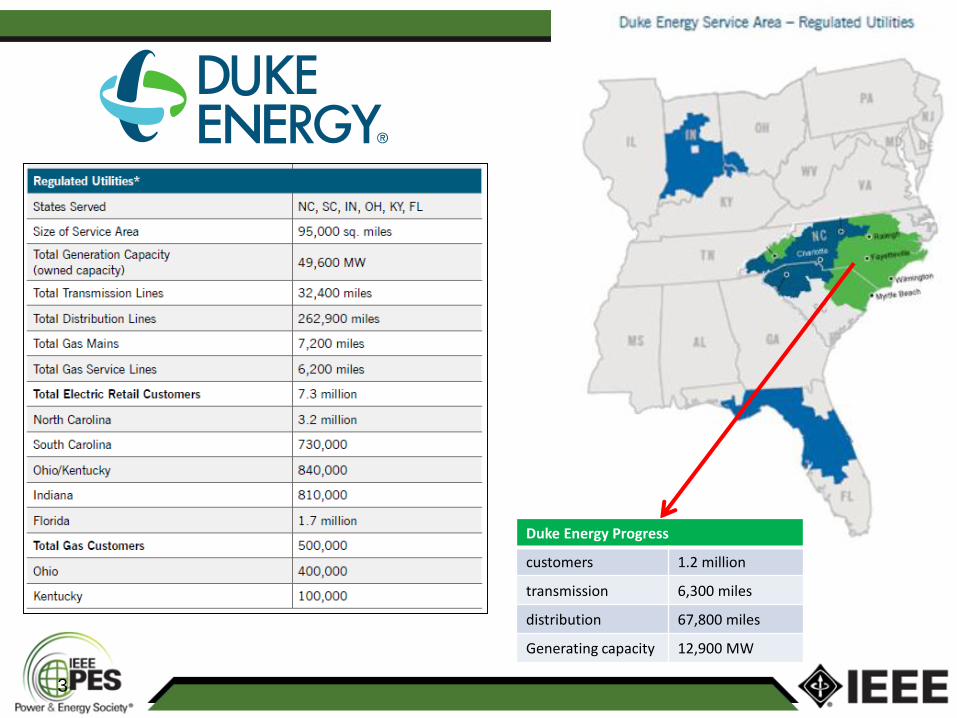
Duke Energy Progress
customers 1.2 million
transmission 6,300 miles
distribution 67,800 miles
Generating capacity 12,900 MW
4
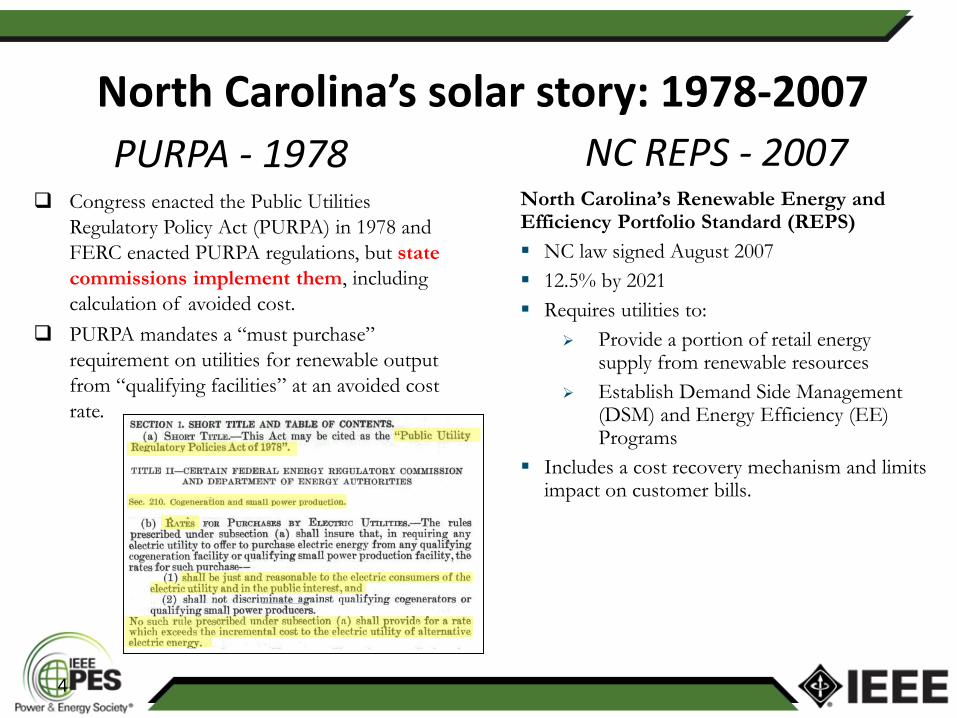
North Carolina’s Renewable Energy and Efficiency Portfolio Standard (REPS)
NC law signed August 2007
12.5% by 2021
Requires utilities to:
Provide a portion of retail energy supply from renewable resources
Establish Demand Side Management (DSM) and Energy Efficiency (EE) Programs
Includes a cost recovery mechanism and limits impact on customer bills.
PURPA - 1978 NC REPS - 2007 Congress enacted the Public Utilities
Regulatory Policy Act (PURPA) in 1978 and
FERC enacted PURPA regulations, but state
commissions implement them, including
calculation of avoided cost.
PURPA mandates a “must purchase”
requirement on utilities for renewable output
from “qualifying facilities” at an avoided cost
rate.
North Carolina’s solar story: 1978-2007

• PURPA: NC’s 5 MW non-negotiated PPA ceiling for QFs
– In place since 1980s
• Avoided cost rate methodology
• State tax credit
– 35%, ended 12/31/15
• 2007 NC REPS (Renewable Energy Portfolio Standard)
• Inexpensive land (DEP)
• Federal ITC
– 30% through 2019
• Declining cost of PV equipment
5
North Carolina’s solar story: 2007-2017

North Carolina’s solar story: 2017
• In the Carolinas (NC & SC), to-date:
– DER capacity in Duke Energy (Carolinas & Progress) = 2,834 MW (July 2015)
• Current queue (T&D) = 7,813 MW
• At end of 2016, NC is #2 in the U.S. in solar capacity (3,016 MW)
• Most DER not utility-owned today
– However, Duke Energy accelerating self-built facilities
• NC House Bill 589 (July 2015)
– Additional 6,800 MW of solar generation in NC by 2022*
• Does not include solar growth in South Carolina
– Currently accelerating at a robust pace
6
7
0 0 1 5 6 9 15 23
100
243
458
878
1,088
1,216
0
200
400
600
800
1,000
1,200
1,400
2004 2005 2006 2007 2008 2009 2010 2011 2012 2013 2014 2015 2016 2017
MW
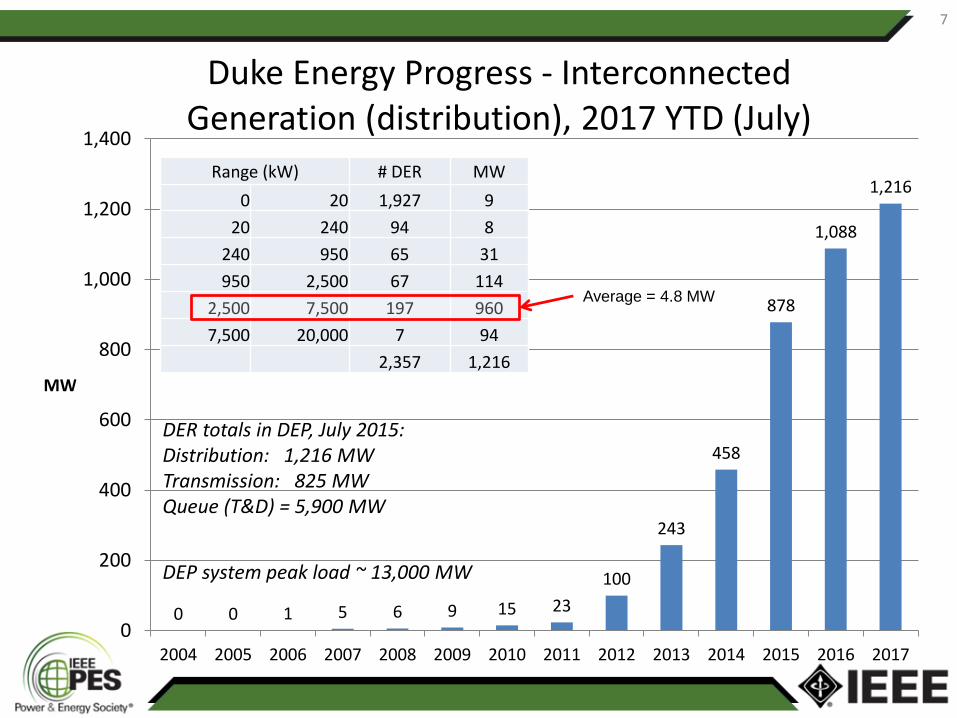
Duke Energy Progress - Interconnected Generation (distribution), 2017 YTD (July)
Range (kW) # DER MW
0 20 1,927 9
20 240 94 8
240 950 65 31
950 2,500 67 114
2,500 7,500 197 960
7,500 20,000 7 94
2,357 1,216
Average = 4.8 MW
DER totals in DEP, July 2015:Distribution: 1,216 MWTransmission: 825 MWQueue (T&D) = 5,900 MW
DEP system peak load ~ 13,000 MW
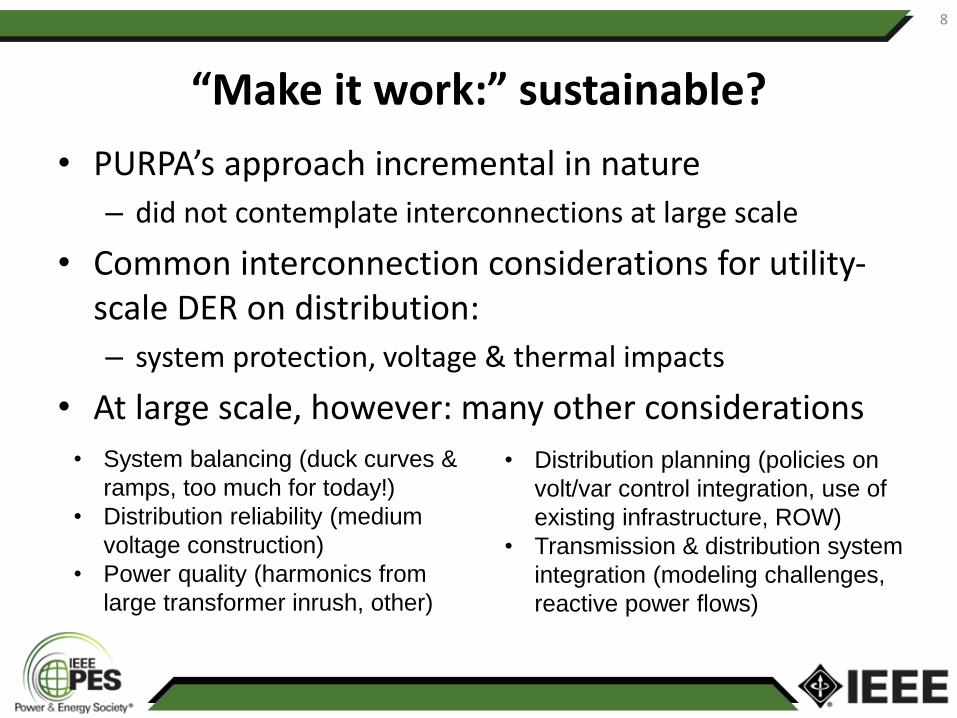
“Make it work:” sustainable?
• PURPA’s approach incremental in nature
– did not contemplate interconnections at large scale
• Common interconnection considerations for utility-scale DER on distribution:
– system protection, voltage & thermal impacts
• At large scale, however: many other considerations
8
• System balancing (duck curves &
ramps, too much for today!)
• Distribution reliability (medium
voltage construction)
• Power quality (harmonics from
large transformer inrush, other)
• Distribution planning (policies on
volt/var control integration, use of
existing infrastructure, ROW)
• Transmission & distribution system
integration (modeling challenges,
reactive power flows)
9
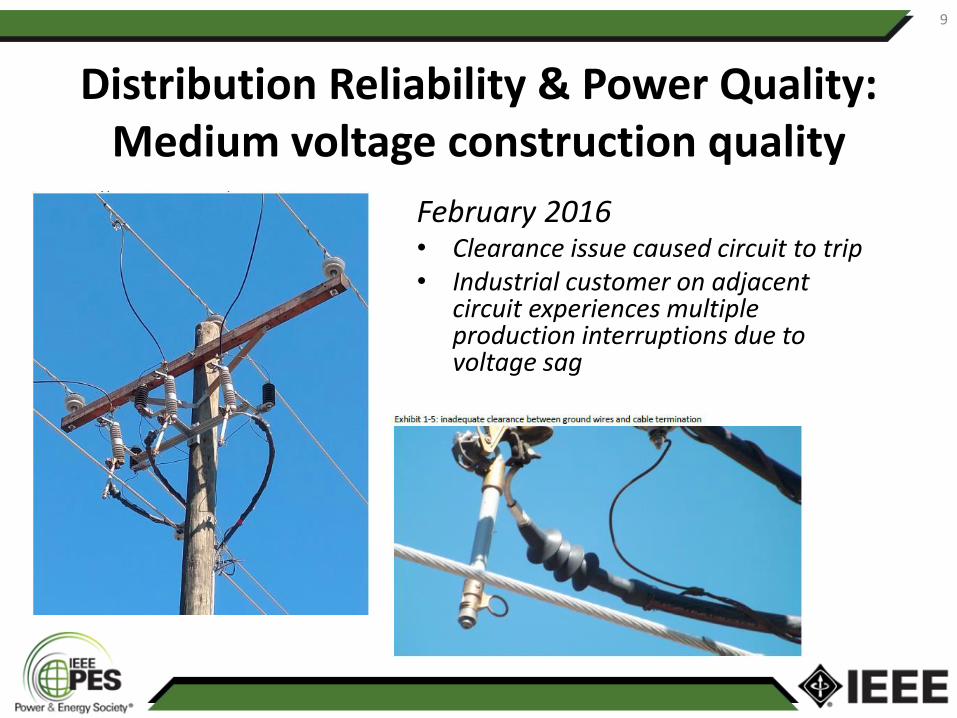
Distribution Reliability & Power Quality:Medium voltage construction quality
February 2016• Clearance issue caused circuit to trip• Industrial customer on adjacent
circuit experiences multiple production interruptions due to voltage sag

No lightning arresters on any
dip poles
After this, several random site inspections
10
Crossarm brace bolts without lock washers
???
Missing extension link
Weak ground connections
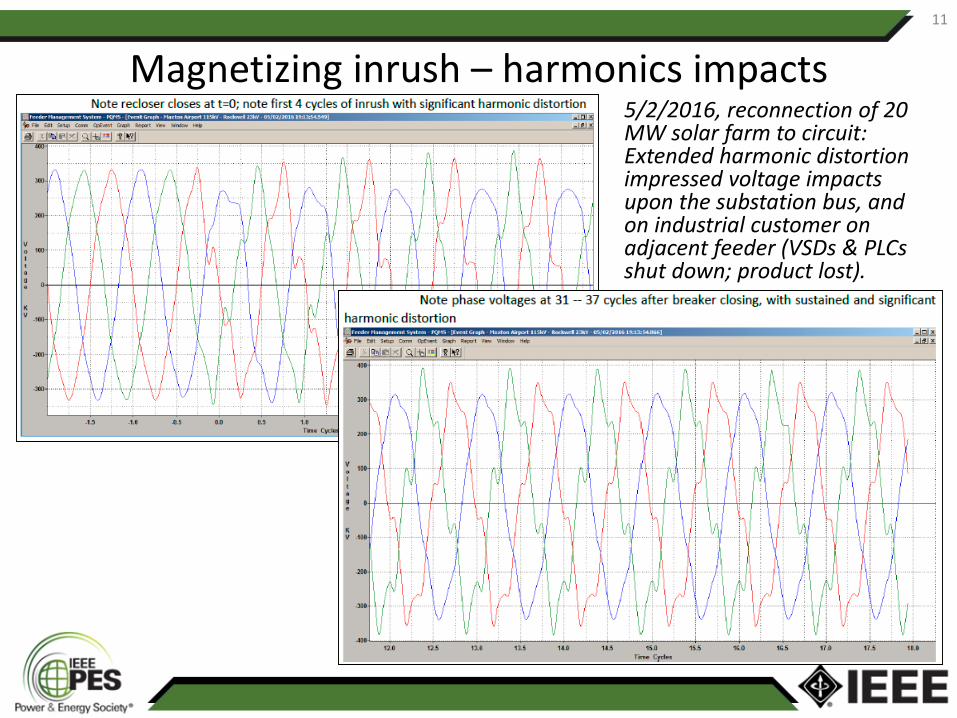
11
Magnetizing inrush – harmonics impacts5/2/2016, reconnection of 20 MW solar farm to circuit: Extended harmonic distortion impressed voltage impacts upon the substation bus, and on industrial customer on adjacent feeder (VSDs & PLCs shut down; product lost).

12
All
transformers
energized at
once =
Typical one-line diagram, large distribution-
connected solar farm
• Nine 2.2 MVA transformers
New requirements:
• evaluation of harmonics risk as part of interconnection study
• Possible requirement to switch transformer blocks on in stages
• Significant new design task for utility’s distribution protection engineers
– Staging of generating site reconnections

Area PlanningIgnoring Mr. Ohm: a favorite pastime. But with DER?
135 MW
Much distribution-connected DER being located away from load centers. Not quite “distributed,” depending upon your perspective.
13
More
generation
than load in
northeast NC
Expected load growth

Duke Energy Progress, Lagrange 115 kV / 12 kV Substation near LaGrange, NC: August 4 & 5, 2013
One-minute real & reactive power flow measured at distribution bus, 48 hour period
No solar DER on any of
the three distribution
feeders yet
0400 1200 2000 0400 1200 2000
Afternoon ramp ~
0.7 MW / hour
MW
MVAR
14
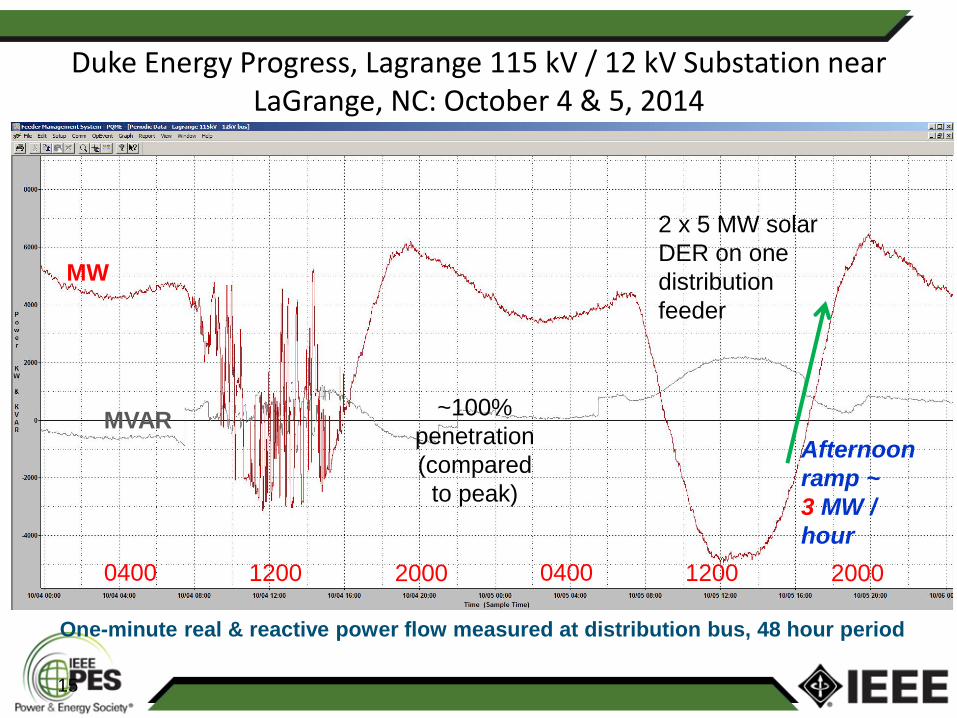
2 x 5 MW solar
DER on one
distribution
feeder
~100%
penetration
(compared
to peak)
0400 1200 2000 0400 1200 2000
Afternoon
ramp ~
3 MW /
hour
MW
MVAR
15
Duke Energy Progress, Lagrange 115 kV / 12 kV Substation near LaGrange, NC: October 4 & 5, 2014
One-minute real & reactive power flow measured at distribution bus, 48 hour period
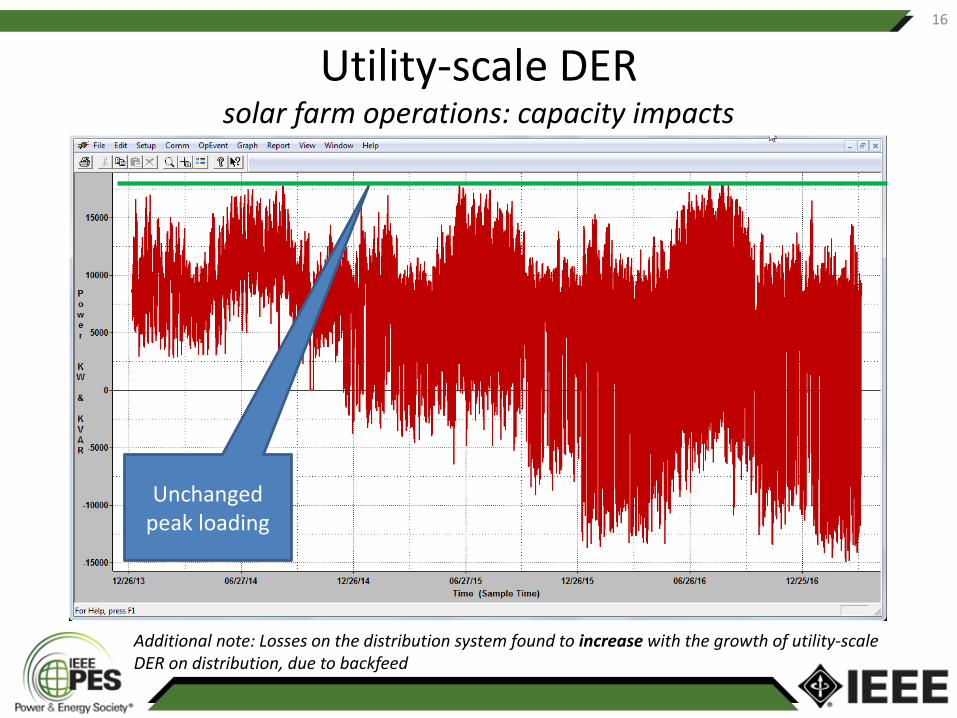
Unchanged peak loading
16
Additional note: Losses on the distribution system found to increase with the growth of utility-scale DER on distribution, due to backfeed
Utility-scale DERsolar farm operations: capacity impacts
17
Evolution of planning requirements (pre-2014)
Prior to fall 2014, system scale was not a consideration• interconnection studies included allowance for DER reactive
power import to help control voltage rise and flicker
• Downward adjustment of voltage regulator band center also an option.
• As scale grew, realization that centralized volt/var control system may not be able to resolve distribution load variability vs. intermittent generation when running power flow solutions
• Further questions arose on scalability of significant dynamic reactive flows from the transmission to distribution system, with reverse real power flows
18
Evolution of planning requirements(2014-2017)
Voltage regulator band center adjustment impacts• As the number of interconnections grew further, realization that
Duke Energy Progress’ volt/var control system, known as DSDR (Distribution System Demand Reduction – dispatchable 300 MW demand reduction resource), was being negatively impacted
Fall 2014 policy changes• DER required to operate at unity PF• Substation voltage regulator bandcenters to remain unchanged• Utility-scale interconnections must be located electrically ahead
of all line voltage regulators
19
Evolution of planning requirements (2017)
Capacity planning impacts• As the number of interconnections grew yet further, capacity
planning engineers noted the loss of valuable right-of-way (ROW) & double-circuit path options for future planning
Early 2017 policy changes• Interconnections must still be electrically located ahead of all
line voltage regulators, but distribution upgrades cannot utilize utility ROW or double-circuiting methods• For many multi-MW DER, this means acquisition of new ROW
for delivery path to the “grid”• New substations may be required to connect these DER

reg
20
R
DG
“reg” is location of existing line
voltage regulator. “DG” is a
proposed interconnection point.
Load patterns drive
decisions on voltage
regulator placement
EXAMPLE:Evolution of planning requirements
(pre-2014)
21
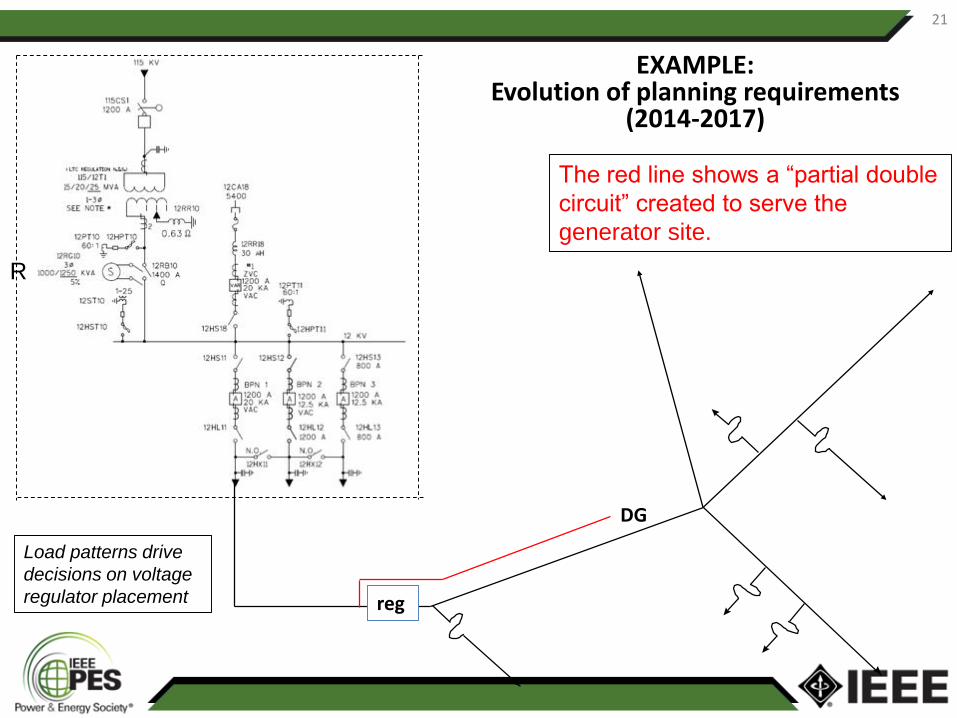
R
DG
reg
Load patterns drive
decisions on voltage
regulator placement
The red line shows a “partial double
circuit” created to serve the
generator site.
EXAMPLE:Evolution of planning requirements
(2014-2017)
22
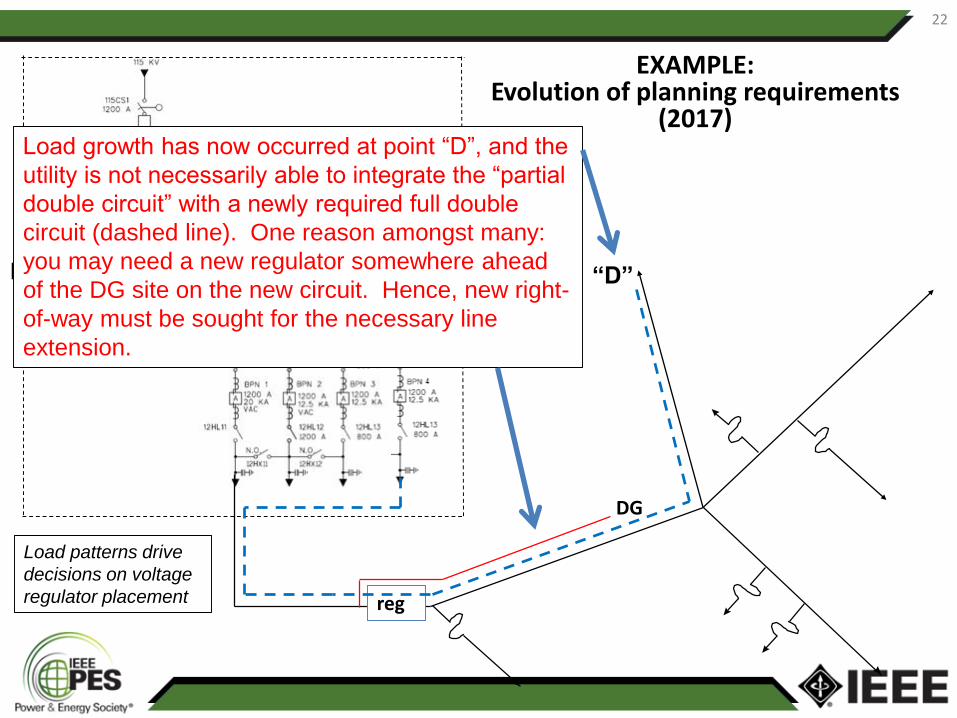
DG
reg
R “D”
Load growth has now occurred at point “D”, and the
utility is not necessarily able to integrate the “partial
double circuit” with a newly required full double
circuit (dashed line). One reason amongst many:
you may need a new regulator somewhere ahead
of the DG site on the new circuit. Hence, new right-
of-way must be sought for the necessary line
extension.
Load patterns drive
decisions on voltage
regulator placement
EXAMPLE:Evolution of planning requirements
(2017)

23
Evolution of planning requirements(beyond 2017)
Steps being taken to better manage real & reactive power flow at the substation• NC HB 589 calls for:
• 10 MW limit for interconnection to the distribution system• Aggregate DER capacity behind substation to not exceed transformer
nameplate (OA/ONAN) capacity
• Seeking better modeling methods for T/D interface, with respect to DER

24