the opportunity costs of informal care: does gender matter?
TRANSCRIPT

Journal of Health Economics 22 (2003) 781–803
The opportunity costs of informal care:does gender matter?�
Fiona Carmichaela,∗, Susan Charlesba School of Accounting, Economics and Management Science, University of Salford, Salford M5 4WT, UK
b Department of Business and Management, University of Wales, Cledwyn Building, Penglais,Aberystwyth, Ceredigion, Wales SY23 3DD, UK
Received 24 March 2000; accepted 28 March 2003
Abstract
In this paper, we investigate the costs borne by both male and female carers in terms of theirforgone formal employment opportunities. Traditionally, informal care was supplied by women butnowadays women are not only more likely to work, but also likely to be significant contributorsto family finances. For women, this implies that the size of any forgone earnings cost of informalcare is increasing. At the same time, population ageing is making for increasing numbers requiringcare. From a policy perspective it is therefore helpful to consider a less traditional but neverthelessimportant source of informal care, men. We find that both male and female carers bear indirect costsin that they are less likely to be in paid work than otherwise similar non-carers and when they are inpaid work they earn significantly less. However, we find that the motivation for lower employmentparticipation is not the same for men as it is for women.© 2003 Elsevier Science B.V. All rights reserved.
JEL classification: H2; J21; J22
Keywords: Labour supply; Informal care; Community care; Wage determination
1. Introduction
A key objective of the social services modernisation programme1 launched by the UKgovernment in 1998 is to help people to live independently. Central to this objective is
� Material from the General Household Survey, made available through the Office of National Statistics and theESRC Data Archive, has been used with permission of the Controller of HM Stationery Office.
∗ Corresponding author. Tel.:+44-161-2953001; fax:+44-161-2952130.E-mail address: [email protected] (F. Carmichael).
1 Department of Health (1998).
0167-6296/$ – see front matter © 2003 Elsevier Science B.V. All rights reserved.doi:10.1016/S0167-6296(03)00044-4

782 F. Carmichael, S. Charles / Journal of Health Economics 22 (2003) 781–803
continued support for the policy of caring for the elderly infirm and chronic sick in thecommunity.2 Furthermore, government policy makers acknowledge that people generallywant to live in their own homes if they can, and that within the community informal carersare the most important providers of social care.3 However, they also concede that “thecare system does not adequately recognise the enormous contribution that informal carersmake to maintain the independence of people with care needs” (Department of Health,1998, para 2.10). In order to address this problem the government has included supportfor carers as one of the key elements in its action plan for modernising social services4
and developed a national strategy for carers (Department of Health, 1999). But in order todevelop appropriate support packages it is important to identify who is caring and discoverhow informal care responsibilities impact on their lives. With respect to the latter, a keyelement is the quantification of the opportunity costs that arise because of the constraintsimposed on carers’ labour supply by caring commitments.5 With respect to the questionof identification the supply of informal care has traditionally been regarded as a femaleactivity. However, successive General Household Surveys (GHS)6 have revealed that suchactivities are surprisingly common amongst men. This result is of some policy interestduring a period when population ageing is making for ever increasing numbers needingcare and labour market opportunities for women are expanding. The combination of thesetwo factors raises doubts about women’s continuing willingness to meet such needs on therequired scale. Men are a potential alternative source of supply but, perhaps even more sothan for their female counterparts, there may be a trade-off to be made between caring andearning. This paper reports what is to our knowledge the first ever investigation of this issuefrom the male perspective.
In previous work (Carmichael and Charles, 1998, 1999) using the 1985 General House-hold Survey and its follow-up, the 1990 GHS we investigated, the impact of informal careresponsibilities on the labour market behaviour of women—the traditional and still thenumerically more important source of informal care. We found that working aged femaleinformal carers were earning less per hour than would have been expected given their hu-man capital. In addition, more committed female carers were less likely to participate in theformal labour market than otherwise similar non-carers. In this paper, we turn our attentionto men, comparing and contrasting the labour market experience of male carers with thatof their female counterparts.
2 This stance towards community care is longstanding. See, for example,Department of Health (1989), para 1.9and earlier reports dating back to 1957 (seeRowlands and Parker, 1998, v).
3 Department of Health (1998), paras 2.7 and 2.10.4 Department of Health (1998), para 2.11.5 The national strategy for carers (Department of Health, 1999) acknowledges that a majority of working-age
carers are in paid employment and therefore flexibility needs to be a key theme in any package of support.6 The 1985 General Household survey was the first ever large scale official survey of informal care activity in
the UK and included a series of question designed to identify carers and provide information about them. A similarset of questions was included in the 1990 and 1995 surveys and more recently a new question on informal careresponsibilities were included in the 2001 census. The data set used in this paper is extracted from the 1990 GHS,the 1995 data was not available when the study was initiated, however,Rowlands and Parker (1998)report somefindings from a mainly bivariate analysis of the 1995 data and also provide a useful comparison with findings fromthe 1985 and 1990 data sets.

F. Carmichael, S. Charles / Journal of Health Economics 22 (2003) 781–803 783
The plan of the paper is as follows. InSection 2, we describe our dataset and discusssome summary statistics relating to the prevalence of male and female carers.Section 3outlines the empirical model and inSection 4we summarise and interpret the results of theempirical estimation.Section 5concludes with some policy implications.
2. The prevalence and labour force characteristics of male and female carers
The data used for this study is the 1990 GHS. We analyse a sub-sample of female respon-dents between the ages of 18 and 59 years and a sub-sample of male respondents betweenthe ages of 18 and 64 years. We exclude those still in full time education, those permanentlyunable to work due to ill health, those on government training and employment programmesand those in self-employment.7 This gives a total of 5463 female sample members and 4635males.
Any impact on the labour supply and earnings of carers is likely to depend on the extent ofthe caring commitment involved. The GHS data allows three approximations to the degreeof commitment: (i) self-reported weekly care hours, (ii) degree of responsibility for anydependent in terms of whether the respondent is the sole main, joint main or subsidiary carerof a dependent living at the same address or living at a different address8 and (iii) whetherthe dependent is incapacitated enough to be claiming Attendance Allowance (ATTAL).The summary statistics reported inTables 1–3take a preliminary look at the relationshipbetween each of these three proxies for caring commitment and labour supply and earnings.
Table 1show that, 18.34% of women in our sub-sample but only 13.2% of men wereengaged in informal care activity on a regular basis.9 These figures are consistent with the
7 We exclude the self-employed because a significant number of self-employed respondents report incrediblylong working weeks and/or incredibly small (including negative) earnings, the raw data from which the wage rate iscalculated. Whilst these figures are difficult to credit, they are not impossibly so—some forms of self-employmentprobably do involve highly variable work patterns, others may allow for the mixing of work and non-work activitiesat the same time. Whatever the explanation, the data is problematic to use and could give misleading results, and sothe self-employed were excluded from the analysis. This is regrettable since, as pointed out by one of the referees,it is possible that certain types of self-employment (e.g. those which permit one to work from home) might beparticularly attractive to carers. However, an examination of the original data set provides no evidence that a dis-proportionate number of working carers were self-employed. Within the male sample, 13.3% of the self-employedwere carers compared to 13% of the employed. Amongst the female sample, the figures are 23.4 and 17.4%. How-ever, as our results suggest that caring commitments impact on ability to work only when they are substantial, themore relevant figures are 30.1% of self-employed carers compared with 34.2% of employed ones report that caringtakes up at least 10 h of their time each week, and 32.5% of self-employed carers compared with 31.2% of em-ployed ones regard their caring role as being subsidiary to another ‘main’ carer. These figures, added to the fact thatself-employment is relatively uncommon (less than 10% of the original sample were self-employed) lead us to con-clude that the exclusion of the self-employed from the subsequent analysis has not introduced serious distortions.
8 The GHS classifies a respondent as a main sole carer if no one else spends more time looking after theirdependent, for example, another member of the family, a relative or friend or some kind of paid helper. If someother helper spends the same amount of time looking after the dependent as the respondent then the latter isclassified as a main joint carer. The respondent is classified as a subsidiary carer if someone else qualifies as themain sole carer.
9 These figures are only a little different than those for the whole GHS sample; 17 and 13%, respectively. In the1985 and 1995 GHS the corresponding figures were somewhat lower; 15 and 12% in 1985 and 14 and 11% in1990, respectively, for women and men.Rowlands and Parker (1998)suggest that these differences are explained
784 F. Carmichael, S. Charles / Journal of Health Economics 22 (2003) 781–803
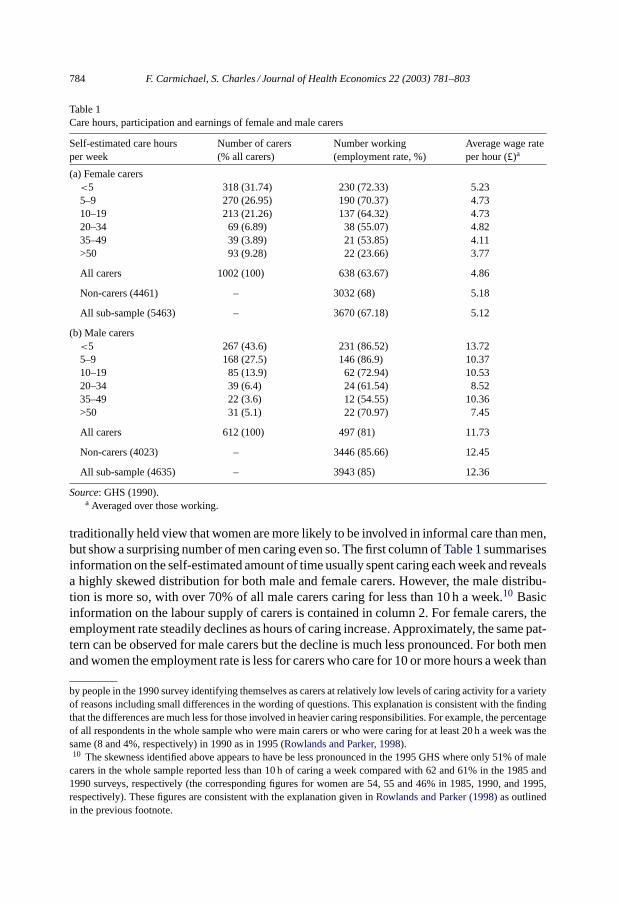
Table 1Care hours, participation and earnings of female and male carers
Self-estimated care hoursper week
Number of carers(% all carers)
Number working(employment rate, %)
Average wage rateper hour (£)a
(a) Female carers<5 318 (31.74) 230 (72.33) 5.235–9 270 (26.95) 190 (70.37) 4.7310–19 213 (21.26) 137 (64.32) 4.7320–34 69 (6.89) 38 (55.07) 4.8235–49 39 (3.89) 21 (53.85) 4.11>50 93 (9.28) 22 (23.66) 3.77
All carers 1002 (100) 638 (63.67) 4.86
Non-carers (4461) – 3032 (68) 5.18
All sub-sample (5463) – 3670 (67.18) 5.12
(b) Male carers<5 267 (43.6) 231 (86.52) 13.725–9 168 (27.5) 146 (86.9) 10.3710–19 85 (13.9) 62 (72.94) 10.5320–34 39 (6.4) 24 (61.54) 8.5235–49 22 (3.6) 12 (54.55) 10.36>50 31 (5.1) 22 (70.97) 7.45
All carers 612 (100) 497 (81) 11.73
Non-carers (4023) – 3446 (85.66) 12.45
All sub-sample (4635) – 3943 (85) 12.36
Source: GHS (1990).a Averaged over those working.
traditionally held view that women are more likely to be involved in informal care than men,but show a surprising number of men caring even so. The first column ofTable 1summarisesinformation on the self-estimated amount of time usually spent caring each week and revealsa highly skewed distribution for both male and female carers. However, the male distribu-tion is more so, with over 70% of all male carers caring for less than 10 h a week.10 Basicinformation on the labour supply of carers is contained in column 2. For female carers, theemployment rate steadily declines as hours of caring increase. Approximately, the same pat-tern can be observed for male carers but the decline is much less pronounced. For both menand women the employment rate is less for carers who care for 10 or more hours a week than
by people in the 1990 survey identifying themselves as carers at relatively low levels of caring activity for a varietyof reasons including small differences in the wording of questions. This explanation is consistent with the findingthat the differences are much less for those involved in heavier caring responsibilities. For example, the percentageof all respondents in the whole sample who were main carers or who were caring for at least 20 h a week was thesame (8 and 4%, respectively) in 1990 as in 1995 (Rowlands and Parker, 1998).10 The skewness identified above appears to have be less pronounced in the 1995 GHS where only 51% of male
carers in the whole sample reported less than 10 h of caring a week compared with 62 and 61% in the 1985 and1990 surveys, respectively (the corresponding figures for women are 54, 55 and 46% in 1985, 1990, and 1995,respectively). These figures are consistent with the explanation given inRowlands and Parker (1998)as outlinedin the previous footnote.

F. Carmichael, S. Charles / Journal of Health Economics 22 (2003) 781–803 785
Table 2Caring responsibilities, participation, and earnings of female and male main carersa
Responsibility of carer Number of carers(% of all carers)
Number working(employment rate)
Average wage rateper hour (£)b
(a) Female main carersSole main carer for dependent in
household156 (15.52)c 68 (43.59) 4.55
Sole main carer for dependentoutside household
391 (38.91)c 257 (65.73) 5.06
Joint main carer for dependent inhousehold
17 (1.69)d 9 (52.94) 4.26
Joint main carer for dependentoutside household
127 (12.64)d 82 (64.57) 4.22
Secondary carer for dependent inhousehold
13 (1.29) 11 (84.62) 4.16
Secondary carer for dependentoutside household
301 (29.95) 215 (71.43) 5.28
(b) Male main carersSole main carer for dependent in
household71 (11.43)e 42 (59.16) 6.84
Sole main carer for dependentoutside household
149 (24.00)e 117 (78.52) 10.26
Joint main carer for dependent inhousehold
17 (2.74) 13 (76.47) 9.99
Joint main carer for dependentoutside household
97 (15.62) 83 (85.57) 9.81
Secondary carer for dependent inhousehold
43 (6.92)f 36 (83.72) 10.07
Secondary carer for dependentoutside household
244 (39.29)f 213 (87.30) 14.44
Source: GHS (1990).a Totals are less than inTable 1due to missing data.b Averaged over those working.c Includes 18 sole main carers for dependents in and outside household.d Includes 3 joint main carers for dependents in and outside household.e Includes 14 sole main carers for dependents in and outside household.f Includes 2 secondary carers for dependents in and outside household.
it is for the average non-carer. Column 3 shows the hourly gross earnings of working maleand female carers. The figures show that for both groups earnings decline as the commitmentto caring increases and if anything the decline is sharper for male carers. For both sexes,workers who also care for at least 5 h a week earn less than the average working non-carer.
Table 2summarises information on the responsibilities of carers according to whetherthey are classified as the main carer (with joint or sole responsibilities) for any dependent andwhether they are caring for someone in or outside their own household. The first columns ofTable 2show that most carers are caring for someone outside their household and most aremain carers. However, a greater proportion of female carers are main (sole or joint) carersand over half the female carers are sole main carers. Columns 3 and 4 ofTable 2show basicinformation on the labour supply and earnings of main and other carers. The data show that

786F.C
armichael,S.C
harles/JournalofH
ealthE
conomics
22(2003)
781–803
Table 3Care hours, caring responsibilities and labour market behaviour of carers with dependents claiming Attendance Allowance
Number Number caring10 or morehours per week
Number ofmain carers
Number working(employment rate, %)
Number workingfull time, >35 h aweek
Number caring 10 ormore hours a week andworking (full time)
Number of maincarers working(full time)
Average wageratea (£/h)(full time)
Females 44 40 42 8 (18.18) 4 6 (3) 8 (4) 3.28 (3.20)Males 25 18 18 15 (60) 12 10 (7) 10 (7) 5.44 (5.92)
Source: GHS (1990).a Averaged over those working.

F. Carmichael, S. Charles / Journal of Health Economics 22 (2003) 781–803 787
participation and earnings are generally lower for main carers (especially sole main carerswith dependents in their household). A correlation between heavier caring responsibilitiesand lower earnings appears to be particularly evident in the male sub-sample.
A small sub-sample of dependents is able to claim some state support in the form ofAttendance Allowance. To qualify for support, the dependent needs to satisfy an independentmedical practitioner that he or she requires either frequent attention ‘in connection with theirbodily functions’ or constant supervision ‘to avoid substantial danger to themselves or toothers’. These dependency criteria suggest that the payment of ATTAL will be indicativeof a higher degree of responsibility on the part of the carer. This claim is supported by thefigures in columns 2 and 3 ofTable 3which show that the majority of carers with dependentsclaiming ATTAL11 are main carers caring for more than 10 h per week. This is particularlythe case for female carers. Column 4 shows that the payment of ATTAL also appears to havea negative effect on participation. Columns 6 and 7 show that this effect is strengthenedby caring for more than 10 h a week and, for men, being a main carer. However, the directeffect of ATTAL on employment participation appears to be much stronger for women,even though the earnings of male carers with dependents in receipt of ATTAL are very lowrelative to average male earnings (column 8).
The negative correlation between the payment of ATTAL and employment status canbe interpreted as suggesting that the payment of the benefit does identify those caring forthe more heavily dependent who, because of their commitment to caring, are less likely towork. However, the payment of ATTAL could also have a negative impact on employmentparticipation through a financial disincentive effect. ATTAL is paid to infirm individualsto allow the purchase of help that will enable claimants to continue to live outside of aninstitution. The money could therefore be being passed on to claimants’ carers althoughclaimants do not have to use the allowance for this. How much is actually passed on tocarers is therefore not known but, to the extent that it is, the payment of this benefit maybe expected to reduce the carer’s incentive (or need) to work. However, the evidence ofcolumn 5 suggests that such an effect if it exists at all is weak especially for men, in thata considerable proportion of those working are continuing to work full time. Fifty percentof working females and 80% of working males with dependents in receipt of the allowanceare working full time. The comparable figures for the whole female sample and the wholemale sample are 59.97 and 72.05%, respectively, while for all female carers and all malecarers the comparable figures are 55.64 and 71.77%. Columns 6 and 7 show that womenwith main carer responsibilities and/or caring for more than 10 h a week are equally likelyto work full time as those without these extra responsibilities but men in the same positionare a little less likely to be working full time than either the whole sample or carers overall.
To summarise, the data inTables 1–3show that there are similarities as well as differencesbetween male and female carers. Both male and female carers are less likely to be in paidemployment than non-carers and, for men as well as women, both the likelihood of workingand earnings in paid work decline as the caring commitment increases. However, femalecarers are more likely to be main carers and tend to report longer care hours than male
11 Not all carers with dependents claiming ATTAL are identified in our sample, only those with a dependent wholives in the same household as the carer or who are claiming Invalid Care Allowance (ICA; one of the qualifyingcriteria for payment of ICA is that the carer’s dependent is in receipt of ATTAL).

788 F. Carmichael, S. Charles / Journal of Health Economics 22 (2003) 781–803
carers.12 Male carers also appear to have a stronger attachment to work (relative to the malesub-sample as a whole). This is also true of carers with dependents claiming AttendanceAllowance although in this case small numbers make generalisation difficult. Lastly, theearnings of male carers are lower relative to the male average than the earnings of female car-ers relative to the female average. However, given that average female earnings are anywaylower than average male earnings, female carers still earn less on average than male carers.13
3. The empirical model
In order to provide the first ever econometric evidence on the effect of caring amongstmales and to do so in a way which permits comparison with female carers we investigatethe effect of informal care within the context of a two-equation recursive model commonlyused to investigate the relationship between female labour supply and earnings. By doing sowe are treating men as women for the purposes of estimating their labour supply since weimplicitly assume that the decision to participate in the labour market is not an automaticone but one based on a trade-off between the need to earn and the need to supply unpaidlabour within the home. However, the model is estimated separately for each gender, therebyallowing the coefficients to differ in the standard way.
The model consists of a wage equation and a participation/labour supply equation derivedfrom a neoclassical income-leisure choice model. The wage rate predicted from the wageequation (WAGEFIT) is used as an instrumental variable in the labour supply equation inplace of the unknown rate the non-working members of the sample could have earned and,to avoid the possibility of introducing a systematic measurement bias, the known rate thosein work were earning. The potential sample selection bias problem in estimating the wageand hours equations from the observations of the non-random, self-selected sample of work-ers is treated by the well established method of including the Heckman correction term asan additional regressor (Heckman, 1976). Further details of the model are inAppendix A;Appendix Bcontains definitions of the variables used in the analysis.
The impact of informal care responsibilities on employment (and earnings) is investigatedby including independent variables indicating caring commitment in the estimated laboursupply equations. Informal care responsibilities may influence labour supply decisions inthree ways. Because of constraints on time, caring commitments may lead the individualto substitute unpaid for paid work—the substitution effect. However, the extra financialexpenditure typically associated with informal care may give the individual an added motiveto undertake unpaid work—the income effect.14 Similarly, the desire for a break from theemotional demands associated particularly with the care of the more highly dependent maygive a motive to take on at least some hours of paid work away from the dependent—the
12 If, as discussed inSection 3, men are more likely than women to overstate reported care hours then thedifference would be more dramatic than it appears in the statistics.13 In Table 1, the female–male wage ratio is 41.4% which at first glance seems low in comparison with other
data sets where a comparable rate of around 70% is more usual. However, comparing the wage rates of only thefull time male and female workers in the sample gives a female–male wage ratio of 64.4% which is closer to thefigures observed elsewhere, the difference reflecting differences in part time and full time hourly rates.14 SeeTwigg and Atkin (1994), p. 42.

F. Carmichael, S. Charles / Journal of Health Economics 22 (2003) 781–803 789
respite effect.15 Given women’s traditionally weaker attachment to the labour force andmen’s traditional role as the breadwinner we expect the substitution effect to be stronger,and the income and respite effects weaker for women.
The informal care variables included in the estimated equations are derived from theGHS data on caring commitment. Hours spent caring is the most obvious indicator ofcaring commitment. In the GHS data, care hours are not reported in continuous form butare instead grouped, with the classes as shown inTable 1. The data therefore permits us touse either a complete set of dummy variables or to construct pairs of dichotomous variablesdefined on whether the sample member is an informal carer caring for less than or at leasta threshold number of hours a week. On the basis of the results from our earlier workon female carers in the 1990 GHS (Carmichael and Charles, 1999) and preliminary workon male carers not reported here, we opt for the latter and adopt a 10 h threshold. Thus,we use two dichotomous variables indicating whether a carer is caring for less than or atleast 10 h a week (CARE<10HRS and CARE≥10HRS). Our rationale is that the degreeof responsibility involved in caring for less than 10 h week is likely to be relatively minorone associated with supporting someone who needs no more than a regular but relativelyundemanding, ‘bit of help’. On the other hand, care hours of 10 or more a week implymore than this and may involve caring for someone who needs considerable care and/orsupervision.
In our earlier work on female carers, we found that women spending more than 10 h a weekon caring activities and/or with dependents in receipt of ATTAL were less likely to workthan otherwise similar non-carers. These results are consistent with the hypothesis that formore committed carers the substitution effect dominates. However, the self-reported natureof the care hours data presents some problems in that the measure is likely to be inaccuratenot least because, as pointed out by an anonymous referee, men and women might employdifferent implicit definitions of care inputs and hours because of their traditionally differentexpectations about carrying out household tasks. If this is so, the estimations will tendto exaggerate the caring demands faced by men, compared to women. Because of theseconcerns we constructed additional indicators of informal care commitments from the GHSdata recording different categories of responsibility for caring. The alternative variablesindicate whether or not the carer is a main carer (sole or joint) caring for a dependent inor outside the carer’s own household (MAIN CARER IN, MAIN CARER OUT, NMAINCARER IN and NMAIN CARER OUT). The distinction between caring in or outside thehousehold is made because it seems likely to affect the demands faced by carers. Caringfor someone who lives with the carer is likely to involve more round-the-clock activity thanotherwise. On the other hand, there may be more room for flexibility in the provision ofcare for someone in the same household. In other words, caring for someone in or outsidethe household may constrain the carer in different ways.16 In the employment participation
15 SeeParker (1993)andTwigg and Atkin (1994).16 As pointed out by one of the referees there is a further distinction between co-resident and non-co-resident
carers in that co-resident carers might do more caring but would also have greater difficulty deciding what is andwhat is not ‘informal care’. The latter may therefore under-report their hours of caring. This possibility givesfurther justification for the use of this alternative set of informal care indicators. However, as pointed out by thesame referee there may be a gender difference in the categorisation given the traditional caring/home-making roletraditionally associated with women.

790 F. Carmichael, S. Charles / Journal of Health Economics 22 (2003) 781–803
equation, we also include a dichotomous independent variable indicating the payment ofAttendance Allowance to a carer’s dependent, DEPATTAL.
To summarise, our main hypotheses are as follows: first that the impact of informal careon labour supply will depend on the nature and sizes of the income, respite and substitutioneffects. Given the traditionally stronger attachment of males to the labour force we expectthe substitution effect of informal care to be weaker for male carers and therefore expectcaring responsibilities to have a stronger negative effect on female labour supply. Second,we expect the impact of informal care on labour supply to depend on the degree of caringcommitment as indicated by longer care hours, a main carer role or the payment of ATTAL.
4. Results
Tables 4–6show the results of our estimation procedure. The first set of results, reportedin Table 4, show the direct impact of informal care commitments on labour supply. Theresults inTables 5 and 6additionally allow for effects of caring on the wage rate.
4.1. The effects of caring on labour supply
The basic econometric evidence on the labour supply effects of informal care is reportedin Table 4. This contains the two specifications for informal care responsibilities discussedin Section 3: CARE<10HRS and CARE≥10HRS and MAIN CARER IN, MAIN CAREROUT, NMAIN CARER IN, NMAIN CARER OUT. Our primary interest is in the per-formance of these informal care variables and as most of the control variables behave asexpected17 we turn directly to them.
A comparison of equation 4(i) with 4(iii) and 4(ii) with 4(iv) suggests that the impact ofinformal care on the labour supply of men and women is remarkably similar. In equations4(i) and 4(iii), the indicators of caring commitment are CARE<10HRS and CARE≥10HRS.The influence of the former is not significant in either estimation indicating that the laboursupply of both male and female carers caring for less than 10 h a week is not significantlydifferent from that of non-carers. In contrast, the influence of CARE≥10HRS is negativeand highly significant in equations 4(i) and 4(iii) indicating that both men and women caringfor more than 10 h a week are significantly less likely to be working than similarly qualifiednon-carers. However, the payment of ATTAL only exerts a significant negative influenceon female participation. These results suggest that for all carers committed to helping theirdependents for 10 or more hours a week and for female carers with a dependent in receiptof ATTAL, the substitution effect of informal care on participation outweighs the respiteand income effects.
In equations 4(ii) and 4(iv), indicators of caring responsibility are employed as an alterna-tive surrogate for the extent of caring commitment. Again, we find that there are similarities
17 The signs on all the control variables are as predicted by standard neo classical theory of labour supply withthe exception of the positive sign on OTHINH in the male participation equations. One interpretation of this resultis simply that men with working wives are more likely to be working themselves and this over-rides the negativeeffect which is evident in the female sample.

F.Carm
ichael,S.Charles
/JournalofHealth
Econom
ics22
(2003)781–803
791Table 4Hours of caring, caring responsibilities and employment participation with WORK as the dependent variable
Independent variables Female sample Male sample
Equation 4(i) Equation 4(ii) Equation 4(iii) Equation 4(iv)
CARE<10 HRS 0.06628 (1.033) 0.0185 (0.189)CARE≥10 HRS −0.3234 (−4.33∗∗∗) −0.5022 (−3.916∗∗∗)MAIN CARER IN −0.3555 (−2.996∗∗∗) −0.4087 (−2.311∗∗)MAIN CARER OUT −0.122 (−1.87∗) −0.2393 (−2.033∗∗)NMAIN CARER IN 0.1094 (0.243) −0.0095 (−0.032)NMAIN CARER OUT 0.0858 (0.983) 0.0899 (0.699)DEPATTAL −1.023 (−4.24∗∗∗) −0.9469 (−3.773∗∗∗) −0.2061 (−0.657) −0.2251 (−0.669)WAGEFITa 1.488 (20.167∗∗∗) 1.3555 (18.715∗∗∗) 2.336 (24.005∗∗∗) 2.3147 (23.899∗∗∗)OTHINCO −0.000056 (−11.467∗∗∗) −0.000055 (−11.367∗∗∗) −0.000034 (−13.892∗∗∗) −0.000034 (−13.886∗∗∗)OTHINCH −0.000003 (−2.513∗∗∗) −0.000002 (−2.377∗∗∗) 0.000012 (5.789∗∗∗) 0.000012 (5.863∗∗∗)AGE −0.0136 (−6.609∗∗∗) −0.014 (−6.791∗∗∗) −0.0246 (−11.557∗∗∗) −0.0243 (−11.404∗∗∗)CHILD<2 −1.459 (−20.896∗∗∗) −1.4076 (−22.53∗∗∗) −0.0094 (−0.095) −0.016 (−0.163)CHILD2–4 −1.034 (−15.056∗∗∗) −0.8555 (−10.262∗∗∗) −0.2022 (−1.134) −0.2028 (−1.347)CHILD5–10 −0.3554 (−6.035∗∗∗) −0.3563 (−6.065∗∗∗) −0.0396 (−0.376) −0.0.437 (−0.416)CHILD11–16 0.0677 (1.034) 0.0648 (0.995) −0.0497 (−0.417) −0.0487 (−0.410)CONSTANT −7.284 (−14.419∗∗∗) −6.5192 (−13.07∗∗∗) −12.134 (−17.174∗∗∗) −12.006 (−17.07∗∗∗)REGIONAL DUMMIES Yes Yes Yes Yes
log likelihood −2710.201 −2736.09 −1323.705 −1328.136
χ2 1468.747∗∗∗ 1393.412∗∗∗ 1229.918∗∗∗ 1215.311∗∗∗Likelihood ratio index 0.213197 0.20296 0.317208 0.313906%Correct 76 77 90 84No. of observationsb 5443 5426 4618 4611
Thet statistics are in parenthesis.a The earningsEq. (1)estimated to obtain WAGEFIT do not include any indicators of informal care. Otherwise they are identical to the formulations inTables 5 and 6.b Number is less than full sample because of missing data for YRSOUT and main carer responsibilities.∗ Indicates significance at the 10% level.∗∗ Indicates significance at the 5% level.∗∗∗ Indicates significance at the 1% level.

792F.C
armichael,S.C
harles/JournalofH
ealthE
conomics
22(2003)
781–803
Table 5Hours of caring, earnings and employment
Independent variables Female sample Male sample
ln WAGEaa WORKa ln WAGE WORKEquation 5(i) Equation 5(ii) Equation 5(iii) Equation 5(iv)
CARE<10HRS −0.0531 (−1.7∗) 0.1528 (2.358∗∗) −0.0293 (−0.798) 0.0804 (0.789)CARE≥10HRS −0.0873 (−2.057∗∗) −0.1802 (−2.382∗∗) −0.1838 (−2.891∗∗∗) −0.0395 (−0.294)DEPATTAL −1.0295 (−4.23∗∗∗) −0.2131 (−0.656)WAGEFIT 1.6644 (22.057∗∗∗) 2.7239 (26.039∗∗∗)OTHINCO −0.00006 (−11.785∗∗∗) −0.000037 (−14.993∗∗∗)OTHINCOH −0.000003 (−2.778∗∗∗) 0.000013 (5.962∗∗∗)AGE −0.0133 (−6.402∗∗∗) −0.0278 (−12.57∗∗∗)YRSOUT 0.0338 (9.037∗∗∗) 0.079 (22.061∗∗∗)YRSOUTSQ −0.0007 (−8.356∗∗∗) −0.0014 (−18.442∗∗∗)EDLEVA 0.9838 (8.329∗∗∗) 0.8853 (10.908∗∗∗)EDLEVB 0.9516 (20.961∗∗∗) 0.8907 (20.39∗∗∗)EDLEVC 0.7646 (20.128∗∗∗) 0.5443 (13.67∗∗∗)EDLEVD 0.3045 (11.792∗∗∗) 0.3002 (10.033∗∗∗)EDLEVF 0.5098 (5.157∗∗∗) 0.379 (3.368∗∗)CHILD<2 −1.46 (−20.708∗∗∗) −0.0553 (−0.537)CHILD2–4 −1.03 (−14.862∗∗∗) −0.2991 (−1.898∗)CHILD5–10 −0.3507 (−5.904∗∗∗) −0.1201 (−1.09)CHILD11–16 0.0716 (1.083) −0.1558 (−1.255)λ (LAMBDA) 0.0427 (0.94) 0.1131 (1.69∗)CONSTANT 5.2591 (34.213∗∗∗) −8.2792 (−16.152∗∗∗) 5.2589 (33.452∗∗∗) −14.292 (−19.139∗∗∗)CHILD BORN DUMMIES Yes No No NoREGIONAL DUMMIES Yes Yes Yes Yes
Adj. R2 0.239 0.227F 32.91∗∗∗ 38.1∗∗∗log likelihood −2657.489 −1215.577χ2 1574.172∗∗∗ 1446.173∗∗Likelihood ratio index 0.2285 0.372982%Correct 76.34 94.45No. of observations 3653 5443 3943 4618
Thet statistics are in parenthesis.a Dependent variables.∗ Indicates significance at the 10% level.∗∗ Indicates significance at the 5% level.∗∗∗ Indicates significance at the 1% level.

F.Carm
ichael,S.Charles
/JournalofHealth
Econom
ics22
(2003)781–803
793
Table 6Caring responsibilities, earnings and employment
Independent variables Female sample Male sample
ln WAGEaa WORKa ln WAGE WORKEquation 6(i) Equation 6(ii) Equation 6(iii) Equation 6(iv)
MAIN CARER IN −0.1718 (−2.471∗∗) −0.0675 (−0.556) −0.2299 (−2.467∗∗) 0.2083 (1.121)MAIN CARER OUT −0.073 (−2.119∗∗) −0.0079 (−0.119) −0.1156 (−2.335∗∗) 0.0357 (0.29)NMAIN CARER IN −0.0209 (−0.118) 0.1414 (0.31) −0.1439 (−1.282) 0.3857 (1.227)NMAIN CARER OUT −0.0207 (−0.493) 0.1225 (1.377) 0.0424 (0.893) −0.0417 (−0.31)DEPATTAL −0.9581 (−3.759∗∗∗) −0.2616 (−0.749)WAGEFIT 1.6875 (22.322∗∗∗) 2.7254 (26.024∗∗∗)OTHINCO −0.00006 (−11.966∗∗∗) −0.00004 (−15.011∗∗∗)OTHINCH −0.000003 (−2.874∗∗∗) 0.00001 (6.043∗∗∗)AGE −0.0129 (−6.201∗∗∗) −0.0279 (−12.581∗∗∗)YRSOUT 0.0337 (9.04∗∗∗) 0.0791 (22.056∗∗∗)YRSOUTSQ −0.0007 (−8.313∗∗∗) −0.0014 (−18.422∗∗∗)EDLEVA 0.9838 (8.319∗∗∗) 0.881 (10.862∗∗∗)EDLEVB 0.9549 (20.979∗∗∗) 0.8619 (20.401∗∗∗)EDLEVC 0.7683 (20.168∗∗∗) 0.5416 (13.618∗∗∗)EDLEVD 0.3065 (11.832∗∗∗) 0.2993 (10.006∗∗∗)EDLEVF 0.512 (5.176∗∗∗) 0.3749 (3.334∗∗∗)CHILD<2 −1.4047 (−22.115∗∗∗) −0.0642 (−0.623)CHILD2–4 −0.8422 (−9.931∗∗∗) −0.3046 (−1.933∗)CHILD5–10 −0.3457 (−5.794∗∗∗) −0.129 (−1.172)CHILD11–16 0.0735 (1.11) −0.1602 (−1.29)λ (LAMBDA) 0.0447 (0.983) 0.1129 (1.688∗)CONSTANT 5.2524 (34.114∗∗∗) −8.3985 (−16.375∗∗∗) 5.267 (33.546∗∗∗) −14.311 (−19.161∗∗∗)CHILD BORN DUMMIES Yes No No NoREGIONAL DUMMIES Yes Yes Yes Yes
Adj. R2 0.24 0.227F 31.23∗∗∗ 36.03∗∗∗log likelihood −5639.591 −1216.365χ2 1586.41∗∗∗ 1438.853∗∗∗Likelihood ratio index 0.231067 0.37145%Correct 76.37 89.03No. of observations 3604 5426 3924 4611
Thet statistics are in parenthesis.a Dependent variables.∗ Indicates significance at the 10% level.∗∗ Indicates significance at the 5% level.∗∗∗ Indicates significance at the 1% level.

794 F. Carmichael, S. Charles / Journal of Health Economics 22 (2003) 781–803
in the impact of informal care on the labour supply of men and women. In neither equation isthe influence of either indicator of secondary responsibility (NMAIN CARER IN, NMAINCARER OUT) significant implying that the labour supply of both male and female sec-ondary carers is not significantly different from that of non-carers. However, the influence ofMAIN CARER IN is negative and highly significant in both equations 4(ii) and 4(iv) whilethe influence of MAIN CARER OUT is negative but much smaller in absolute terms andsomewhat less significant (especially in the female participation equation). These resultsindicate that main carers (especially those caring for a dependent inside their own house-hold) are significantly less likely to be working than comparable non-carers. For male maincarers caring for a dependent outside the household the negative effect on the probability ofworking is stronger than it is for women but the payment of ATTAL is only significant in thefemale employment equation. These results suggest that for main carers, as for carers com-mitted for longer hours, the substitution effect of informal care on participation outweighsthe respite and income effects and this is true for men as well as women.
On the basis of the results inTable 4, it is possible to calculate the opportunity costs ofcaring by calculating predicted probabilities at the mean (seeGreene, 1993, p. 637–643).Using this approach, the opportunity costs of caring in terms of expected foregone earningsarew̄o(pnc − pc), wherew̄o is the predicted offered wage (eWAGEFIT) for the mean samplemember (£7.49 for men and £3.11 for women) andpnc andpc are the probabilities that themean sample member is working for a non-carer and a carer, respectively.18 If we considercarers committed to 10 or more hours of informal care per week with dependents not inreceipt of ATTAL then for the mean female sample memberpnc − pc = 0.123 and annualforegone earnings amount to £614.53 (on the basis of average weekly hours of 30.82).For an equivalent male carerpnc − pc = 0.1165 and annual foregone earning amount to£1550.59 (although the reduction in the probability of working is less for men the earningsloss is greater because male average earnings and hours of work are higher). The opportunitycosts are higher still for female carers with dependents in receipt of ATTAL and amount toannual foregone earnings of £1891.01. Equivalent calculations can be performed to showsimilar foregone earnings losses for male and female main carers.19 These results implythat significant negative effects of informal care on the probability of employment for menas well as women involve non-trivial earnings losses for more committed carers.
4.2. The effects of caring on the wage rate and the indirect effect of ability to earn onwillingness to work
Next we consider the possibility of a causal relationship from informal care to earningsby including indicators of caring commitment in the earnings equations and subsequentlyincluding the resulting fitted wage variable in the participation equations. The demands ofinformal care can be hypothesised to limit the job opportunities available to the individual
18 pnc = Φ(∑
βix̄i) andpc = Φ(∑
βix̄i + αj) whereΦ is the cumulative density function,βi the estimatedcoefficient on theith non-caring variable andαj the coefficient on thejth caring variable (αj = 0 for non-carers);andx̄i the mean value of theith independent variable.19 For example, expected foregone earnings for female main carers with dependents in the same household who
are not in receipt of ATTAL are £693.91 and for an equivalent male carer they are £1248.49.

F. Carmichael, S. Charles / Journal of Health Economics 22 (2003) 781–803 795
such that their earning power is depressed below that indicated by their human capital. Inaddition, informal care, like childcare responsibilities will have a direct effect on labourmarket experience and therefore wages if labour supply is reduced or withdrawn.
The results of these estimations are included inTables 5 and 6and show that when weallow for the possibility that informal care has a direct effect on earnings, some interestingdifferences emerge in the observed labour market behaviour of male and female carers.These results can be contrasted with those inTable 4which were based on the assumptionof no independent impact of informal care on the wage rate. Consequently, no informal carevariables were included in the wage equations used to predict the fitted wage, WAGEFITwhich constrained the wage of carers to be the same as that of otherwise similar non-carers.In Tables 5 and 6, the earnings of carers and non-carers are not constrained in this way.
Equation 5(i) shows that for women even low levels of caring commitment are consistentwith lower earnings. However, the negative influence on the offered wage rate of womencaring for more than 10 h a week is larger and more significant. In the male wage equation,CARE≥10HRS is negative and significant at the 1% level but men caring for less than10 h a week do not earn significantly less than comparable non-carers. Furthermore, thecoefficients on CARE≥10HRS are larger in the male wage equation and imply a wagereduction of around 18% for males caring for 10 or more hours a week while the wagereduction for a comparable female carer is just under 9%. These results suggest that thenegative influence of informal care on the offered wage rate is considerably more costly formale carers.
As a consequence of allowing for indirect wage effects the participation equations 5(ii)and 5(iv) are very different from equations 4(i) and 4(iii). In equation 5(ii), the highly signif-icant positive coefficient on CARE<10HRS in the female labour market participation equa-tion suggests that women who spend less than 10 h a week on caring activities are more likelyto work than otherwise similar andequally low paid non-carers. This result is consistent withthe hypothesis that, for this sub-group of female carers, it is the income and/or respite effectsof caring which dominate. In contrast, the coefficient on CARE≥10HRS, although muchless significant than in equation 4(i) is still negative and suggests that for this subgroup ofmore committed female carers the substitution effect is dominant. In addition, the negativeand significant influence of DEPATTAL remains so and is consistent with the hypothesisthat the group of carers identified by the payment of this benefit face heavier demands.
In the male participation equation, the pattern is very different. None of the caring vari-ables are significant indicating that the negative significance of CARE≥10HRS in equation4(iii) is entirely due to the indirect wage effect and that male carers are no more or less likelyto work than otherwise similar andequally low paid non-carers. This result is consistentwith the hypothesis that for men the substitution effect and the income and respite effectsare equally important. The lack of significance of DEPATTAL suggests that for men theincome and respite effects are strong enough to counter any negative employment incentiveeffects associated with the payment of ATTAL.
The results inTable 6are, as expected, similar to those inTable 5but very much in contrastto those inTable 4. First of all the negative influence on earnings is only significant for maincarers and the percentage reduction is again greater for men. Secondly, in the participationequations only the negative influence of DEPATTAL in the female participation equation issignificant. These results suggest that the negative coefficients on MAIN CARER IN/OUT

796 F. Carmichael, S. Charles / Journal of Health Economics 22 (2003) 781–803
in equations 4(ii) and 4(iv) are entirely due to indirect wage effects.20 The insignificanteffects of MAIN CARER IN/OUT in the male and female participation equations implythat for main carers the substitution and income/respite effect balance out. This result isin contrast to the negative significance of DEPATTAL and CARE≥10HRS (in equation5(ii)). One possible interpretation is that, for women at least, it is actual time spent caringrather than responsibility (or time spent caring relative to that of any other helper) that isthe crucial determinate of whether an individual can simultaneously maintain a paid joband be committed to informal care.21
4.3. Interpretation of results
The relationship between the informal care indicators and participation inTables 4–6suggests that more committed male and female carers are less likely to work than other-wise similar non-carers but for different reasons. For females committed to at least 10 h ofinformal care a week the negative effect on employment is due to the combined impact ofa lower ability to earn and a direct substitution effect. For males the lower probability ofemployment is due entirely to the indirect effect of lower ability to earn. So while at firstsight the informal care effect on male and female participation appears very similar, thisappearance is deceptive. Once the indirect earnings effect on participation is taken into ac-count, a direct negative relationship between caring commitment and participation can onlybe identified for female carers. Our interpretation is that for some more committed femalecarers the negative substitution effect is dominant while for male carers the income (andpossibly respite) effects are more compelling. This would not be altogether surprising andis consistent with the traditional bread winning role and stronger labour market attachmentof males.
This interpretation relies on the assumption that informal care is exogenously deter-mined, i.e. that the decision to supply care is made independently of the opportunity costin terms of the rate of earnings foregone. Thus, the direction of causality is assumed to rununambiguously from informal care responsibilities to consequential effects on the wagerate which can be earned. However, causality could also run the other way: potential car-ers could be more likely to become carers, and to supply more care hours when they doso, the lower is the opportunity cost in terms of the wage rate they could earn.22 This
20 The greater earnings reduction for main carers when the dependent lives with the carer suggests that this groupface the most demands—on their time and their physical, emotional and financial resources.21 As noted the payment of ATTAL is likely to indicate a greater degree of dependency on the part of the
dependent and there is therefore a degree of co-determination between the payment of ATTAL and both MAINCARER IN/OUT and CARE≥10HRS. The exclusion of DEPATTAL in the participation equations has no effecton the results for men but in equation 5(ii) the negative impact of CARE≥10HRS is much more substantial andsignificant at the 1% level with very little effect on the significance of CARE<10HRS. A similar effect on MAINCARER IN is noted with the exclusion of DEPATTAL from equation 6(ii)—the former becomes significant at the10% level and takes a negative sign.22 For example, informal carers may have invested in less human capital and therefore earn systematically less
than non-carers for reasons unrelated to their informal care responsibilities. However, we allow for human capital,albeit imperfectly and we have also investigated the possibility that carers as a group are characterised by lowerhuman capital investment (in terms of educational attainment) but we found no compelling evidence that this wasthe case.

F. Carmichael, S. Charles / Journal of Health Economics 22 (2003) 781–803 797
argument rests on the assumption that caring is to at least some extent a matter of rationalchoice; i.e. that a potential carer, faced with a situation in which a person for whom shefeels some degree of emotional commitment becomes infirm or chronic sick and in needof care, decides whether and how much of that care to supply on the basis of a rational(but not necessarily selfish) assessment of the costs and benefits. The major determinantsof the caring decision are likely to be ‘non-economic’ factors such as the closeness ofthe kinship bond between the potential carer and dependent; the nature and strength ofsocial mores operating on the potential carer; his or her ability to cope with the psycho-logical and emotional demands of caring; and the geographical distance between theirhomes. But other more ‘economic’ factors might also play their part: the availability andcost of alternative sources of care; the financial means of the dependent and/or wider fam-ily; and the opportunity cost (in terms of both ability to earn and time) to the potentialcarer.
Such considerations suggest that it would be useful to estimate a more general allocation-of-time model in which the caring and working decisions are made simultaneously. Thiswould make caring endogenous and allow, in particular, the wage rate to influence the caringdecision. Unfortunately, some important data limitations prevent us from estimating thismore general model. First of all there is very little data on the non-economic determiningfactors—in particular, the degree of dependency of the potential dependent, somethinglikely to be a major determinant on the caring side. Secondly the sample of non-carers willcontain many respondents for whom the question of whether or not to take on informal careresponsibilities has never arisen. We therefore cannot distinguish between sample memberswho are not carers because (a) there is no one amongst their family, etc. who needs care;or (b) there is someone for whom they could care, but they choose not. As the data do notallow us to distinguish the members of the (b) group from the great mass of (a) types themodel we can estimate would be biased if caring is strongly endogenous.23 Furthermore, itis difficult to test for endogeneity by using either the Heckman method or an instrumentalvariable. In the first case, the inability to distinguish between the (a) and (b) groups prohibitsthe derivation of the appropriate Inverse Mills ratio (seeAppendix A) and in the secondcase we would need a variable which is strongly correlated to caring but independent of thewage rate.
Thus, while we are unable to estimate a more general allocation-of-time model thatcontrols for the possibility that informal care responsibilities are exogenously determined,there is the possibility of bias in our results. However, it is difficult to believe that forwomen anyway informal care is any more endogenous than child care and yet child careis generally treated as exogenous in labour supply models. Indeed, endogeneity is possiblymore problematic in association with child care than with informal care. After all whilecontraception makes the decision to have children a genuine one, chronic illness in a closerelative is something beyond the individual’s control.
23 In the same way that using the wages of workers to estimate the offered wages of non-workers without allowingfor self-selection leads to bias (because the decision to work is not exogenous). However, excluding informal carevariables from the earnings equation allows for the possibility that informal care and earnings are jointly determinedas in this case the initial estimate of the wage equation, excluding informal care variables, is effectively the reducedform earnings equation.

798 F. Carmichael, S. Charles / Journal of Health Economics 22 (2003) 781–803
5. Summary and policy implications
A comparison of male and female working age carers in the GHS data shows that notonly are carers more likely to be women but that female carers care for longer hours andare more likely to be main carers than men. Nevertheless, more than 10% of men are carersand over a third of these men are sole main carers for some dependent. Furthermore, whenmen do undertake heavy caring commitments they seem just as willing to ‘suffer’ labourmarket losses as women. However, there are some differences in the nature of the lossessuffered by male and female carers.
Econometric analysis of the GHS data confirms that the use of informal care to support thechronic sick and elderly in the community is costly for men as well as women. Both foregosignificant earnings because they are less likely to be in paid employment and when theyare working they earn less than equally qualified non-carers. The direct earnings reductionincreases with the degree of caring commitment and is greater for working men. One possibleexplanation for the relatively lower earnings of male carers is that the demands of informalcare restrict their hours of employment to those consistent with periods when respite careis available. Their job opportunities will therefore be limited and those with more flexiblehours are traditionally located in female labour markets where average earnings are lower.According to this line of reasoning, the earnings loss experienced by male carers dependson the gender wage gap and therefore these men would benefit from a relative improvementin female pay.
In contrast, the total effect on male participation is less than for females, at most reducingthe probability of working by 12.9% (for male carers committed to at least 10 h of informalcare per week). The comparable reduction in female labour market participation is a littleover 27% and for some female carers with dependents in receipt of ATTAL it is higherstill. Our results also suggest that the negative relationship between the probability of maleemployment and informal care is attributable solely to the negative indirect earnings effect;because carers earn less and earnings and employment participation are positively related,informal carers are less likely to be working. However, we found that for female carerscaring for more than 10 h a week and those caring for a dependent in receipt of ATTALthere was an additional direct effect on participation such that they were significantly lesslikely to be in paid employment. These results are consistent with the traditionally weakerattachment of females to the labour force and might also suggest that for male carers theincome effects of informal care are relatively more important.
The lack of a direct negative influence on male participation of either informal careresponsibilities or the payment of informal care related benefits suggests that on the wholemale carers do not willingly give up paid work even when caring for someone who is highlydependent.24 This is true even though, or perhaps because, male carers earn significantlyless than male non-carers. As a result, most male carers (and a significant number of femalecarers) are trying to combine full time work with their caring commitments. For thesecarers policies directed to respite care, carer-friendly employment practices and additional(non-means tested) financial support would be of particular benefit. The UK government
24 It is not surprising that the payment of informal care related benefits do not give men an incentive to give uppaid work as ATTAL and ICA are paid at a rate that is less than 1% of average male earnings in the sample.

F. Carmichael, S. Charles / Journal of Health Economics 22 (2003) 781–803 799
acknowledges the special needs of working carers and action on all three of these frontsis being considered to varying degrees. The national strategy for carers (Department ofHealth, 1999) outlines a clear business case for carer-friendly employment policies and thegovernment has responded by offering unpaid leave for family emergencies. In 1999, £140million over 3 years was set aside to improve the provision of respite care, i.e. services whichtypically allow carers occasional holidays, weekends off or an evening out. New powershave been given to local authorities to make direct cash payments to people who need careto pay for home care, day care or occasional short stays in residential or nursing homes.Although such payments are not made to carers they may enable respite for carers andmay also in some cases allow dependents to assist their carers financially. The governmenthas also proposed raising the means tested payments made directly to carers (by £50 aweek in today’s terms by 2050) and has introduced an entitlement to a second pension(Department of Health, 1999). Although such measures do not directly address the specialneeds of working carers the government has stated that financial support for working carersis to be kept under review (Department of Health, 1999). While such a commitment iswelcome there is nothing to indicate any concrete intention to extend the current limitedprovisions.25
The implementation of the kinds of polices outlined here give men as well as women agreater incentive to undertake care in the community. However, polices aimed specificallyat working carers should give a particular incentive to men to undertake care. Men area potential but still relatively under-utilised source of informal care and at a time whenpopulation ageing is making for increasing numbers requiring care, policy measures aimedat maintaining the supply of informal care need to be directed at men as well as women.
Appendix A. Econometric model
The wage equation is estimated in semi-log form26 and the offered market wage rate is as-sumed to be determined by the individual’s human capital (followingMincer, 1974), derivedfrom their level of skill, indicated by the highest educational and professional qualificationobtained (EDUC), and their potential work experience, proxied by years since leaving fulltime education (YRSOUT and YRSOUTSQ). Temporary labour market disruptions due tochildbirths are additionally allowed for in the female wage equations by a including set ofdichotomous variables indicating the number of children to which the sample member hasgiven birth (CHBORN1–CHBORN5+).27 Average earnings also vary locally and this isallowed for by a set of dichotomous variables indicating regions of residence (REGION).Informal care commitments can be allowed for by including a set of informal care indicators
25 The situation for working carers in the UK contrasts unfavourably with that in countries such as Canada wherea tax credit for carers has been introduced.26 This is the standard approach in labour economics because of the evidence that earnings are log-normally
distributed (see, for example,Sapsford and Tzannatos, 1993, p.85).27 In this study, we have tried to include the same variables in the male and female wage and participation
equations but with the CHBORN variables this was clearly not possible. However, child care responsibilities areallowed for in both the male and female participation equations and therefore child care variables are included inthe initial probit estimation required to estimate Heckman’sλ (see below).

800 F. Carmichael, S. Charles / Journal of Health Economics 22 (2003) 781–803
(INFCARE1). Thus, the wage equation to be estimated is of the form:
ln Wage= α0 + α1 × EDUC+ α2 × YRSOUT+ α3 × YRSOUTSQ+ α4
× CHBORN+ α5 × INFCARE1 + α6 × REGION+ α7λ + u1 (1)
where ln WAGE is the log of the offered market wage rate;λ is the Inverse Mills ratioincluded (followingHeckman, 1976) to counter for bias associated with a self-selectedsample of labour market participants,28 andu1 is the error term.29 We initially estimateEq. (1)without including indicators of informal care to obtain the results inTable 4andthen subsequently include indicators of informal care in the calculation of WAGEFIT toobtain the results inTables 5 and 6.
The employment participation equation is derived from the standard neo-classical income-leisure choice model in which the individual’s labour supply is assumed to result from autility maximising choice, given the wage rate they can earn and any non-wage incomeavailable. The estimated labour market supply equation is given below, where WORK isa dichotomous variable representing the employment participation30 decision, taking theunit value when the individual works some positive number of hours:
WORK= β0 + β1 × WAGEFIT + β2 × OTHINCO+ β3 × OTHINCH + β4
× AGE+β5×CHCARE+β6 × INFCARE2 + β7 × REGION+ u2 (2)
where OTHINCO and OTHINCH represent the individual’s own non-wage income andother household income, respectively.31 CHCARE is a set of childcare indicators included
28 Although, as stated, the estimated wage is an offered or market wage the Heckman method takes into accountthe reservation wage effect viaλ as it is the sign of the difference between a person’s offered wage and theirreservation wage that determines whether they select into paid work (seeGreene, 1993, p. 708). However, weshould note that recent research has shown that the parameter estimates from the selection model are sensitive tothe assumption of normality which calls into question the generality of the model (Greene, 1993, p. 714). Greene(ibid) also refers to some alternative approaches to the selection problem based on robust and non-parametricmethods that have greater generality but are limited in other ways. He concludes that the issue remains unsettledbut that ‘the empirical literature on the subject continues to be dominated by Heckman’s original model builtaround the joint normal distribution’.29 An anonymous referee has pointed out that the possibility of discontinuity of the labour supply contract is
only partially addressed by using an hourly wage measure. Including a dummy variable for part time status mighthelp in this respect however this is not possible using the Heckman method as the determining variables in thereduced form probability of employment equation formulated to obtain the Inverse Mills ratio must be ones thatcan be measured for workers and non-workers alike. Furthermore, the predicted wage needs to be estimated fornon-workers as well as workers and therefore the same restrictions on the independent variables apply. We didhowever estimate separate hours of work equations, but in all cases and for both the male and female samples,the influence of informal care responsibilities on hours of work is insignificant. We have also estimated full timeparticipation equations with similar results. In the interests of brevity, these results are not reported but are availablefrom the authors.30 Strictly speaking WORK indicates employment status rather than participation as the unemployed who are
actively seeking work are clearly not working but are generally categorised as labour market participants. IfWORK = 1 then hours of work are positive.31 These variables were taken directly from the GHS as ONS pre-constructed data. Although the GHS collects
information on every member of each sample household, the data is made available to researchers via the ESRCData Archive as ‘organised’ by the ONS. It is accessible either as a set of household files or as a set of individual

F. Carmichael, S. Charles / Journal of Health Economics 22 (2003) 781–803 801
in both the male and female estimations as the decision to take on paid work is likely tobe influenced by current child care responsibilities including responsibility for step chil-dren etc. These responsibilities are proxied by a set of dichotomous variables indicatingthe age of the youngest dependent child in the family of the sample member (CHILD<2,CHILD2–4, CHILD5–10, CHILD11–16). As the CHBORN and CHILD variables are likelyto be correlated they are not included together in any of the estimated equations. AGE isincluded to control for cohort-related attitudes towards employment and family responsi-bilities. INFCARE2 is a set of informal care indicators that may differ from INFCARE1.
The model is estimated in the standard way. The reduced form probability of employmentequation is derived by substitutingEq. (1)intoEq. (2)and estimated by maximum likelihoodmethods; the resulting estimates are used to predict the value of Heckman’sλ for eachsample member. The wageEq. (1)is then estimated by OLS for the sub-sample of labourmarket participants. The structural form employment participationEq. (2) is estimated inprobit form across the sample as a whole with WAGEFIT, the log wage rate predicted fromthe estimatedEq. (1). In each case, the wage and participation equations are estimatedseparately for the male and female samples.
Appendix B. Definition of variables
Variable Definition
ln WAGE log of gross hourly wage rate (£)WORK Dichotomous variable taking the unit value where sample
member is in paid employmentCARE<10HRS Dichotomous variable taking the unit value where the
sample member is an informal carer for whom the usualamount of time spent on caring is less than 10 h per week
CARE≥10HRS Dichotomous variable taking the unit value where thesample member is an informal carer for whom the usualamount of time spent on caring is at least 10 h per week
MAIN CARER IN Dichotomous variable taking the unit value where thesample member is a main carer for a dependant who shareshis or her household
MAIN CARER OUT Dichotomous variable taking the unit value where thesample member is a main carer for a dependant who doesnot share his or her household
files. We use individual level data as our empirical model estimates individual labour supply. The record for eachsample member contains their particular responses to the ‘individual’ questionnaire plus, as attached by the ONS,some of the information from the ‘household’ questionnaire and some data derived from the responses of otherhousehold members to their ‘individual’ questionnaires. The household income variable is a constructed variablein this sense. Given the well known difficulties associated with the derivation and calculation of unearned incomemeasures the use of a measure constructed by the originators of the data seems the least problematic approach.However, as pointed out by an anonymous referee the disadvantage of using such a measure is that it cannot bebroken down into components.

802 F. Carmichael, S. Charles / Journal of Health Economics 22 (2003) 781–803
Appendix B (Continued )
Variable Definition
NMAIN CARER IN Dichotomous variable taking the unit value where thesample member is a carer but not a main carer for adependant who shares his or her household
NMAIN CARER OUT Dichotomous variable taking the unit value where thesample member is a carer but not a main carer for adependant who does not share his or her household
DEPATTAL Dichotomous variable taking the unit value where thesample member is an informal carer for a dependent whoreceives Attendance Allowance. The sample member mayalso be claiming Invalid Care Allowance
WAGEFIT Predicted log of gross hourly wage rate (£)OTHINCO Weekly gross own income from sources other than earnings
(£)OTHINCH Weekly gross income of other household members (£)AGE Age of sample memberYRSOUT Years since leaving full time educationYRSOUTSQ The square of YRSOUTEDLEVA Dichotomous variable taking the unit value if the highest
educational qualification of the sample member is a higherdegree
EDLEVB Dichotomous variable taking the unit value if the highesteducational qualification of the sample member is a firstdegree or equivalent diploma
EDLEVC Dichotomous variable taking the unit value if the highesteducational qualification of the sample member is an HNC;Btec; City and Guilds (Part III): nursing qualification;teaching qualification, or equivalent
EDLEVD Dichotomous variable taking the unit value if the highesteducational qualification of the sample member is a GCE Alevel; CGE O level; CSE; trade apprenticeship; City andGuilds (Part I or II); clerical and commercial qualification;or equivalent
EDLEVF Dichotomous variable taking the unit value if the highesteducational qualification of the sample member is a foreignqualification
CHILD<2 Dichotomous variable taking the unit value where theyoungest child in the family of the sample member is lessthan 2 years old
CHILD2–4 Dichotomous variable taking the unit value where theyoungest child in the family of the sample member isbetween 2 and 4 years of age

F. Carmichael, S. Charles / Journal of Health Economics 22 (2003) 781–803 803
Appendix B (Continued )
Variable Definition
CHILD5–10 Dichotomous variable taking the unit value where theyoungest child in the family of the sample member isbetween 5 and 10 years of age
CHILD11–16 Dichotomous variable taking the unit value where theyoungest child in the family of the sample member isbetween 11 and 16 years of age
CHILD BORN DUMMIES Dichotomous variables taking the unit value where thesample member has given birth toi children (i = 1, . . . , 4,5 or more)
REGIONAL DUMMIES Dichotomous variables taking the unit value where thesample member lives in 1 of 22 regions in the Britain
λ (LAMBDA) Heckman’s sample selection term
References
Carmichael, F., Charles, S., 1997. Informal care and female labour supply some results from the 1990 GHS’.Aberystwyth Economic Research Papers, 97-15.
Carmichael, F., Charles, S., 1998. The labour market costs of community care. Journal of Health Economics 17 (6),645–795.
Department of Health, 1989. Caring for people; community care in the next decade and beyond, Cm. 849. HMSO,London.
Department of Health, 1998. Modernising social services, Cm. 4169. HMSO, London.Department of Health, 1999. Caring about carers: a national strategy for carers,http://www.doh.gov.uk/carers.htm.Greene, W.H., 1993. Econometric Analysis. Macmillan, New York.Heckman, J.J., 1976. The common structure of statistical models of truncated, sample selection and limited
dependent variables, and a simple estimator for such models. Annals of Economic and Social Measurement 5,475–492.
Mincer, J., 1974. Schooling Experience Ad Earnings. National Bureau of Economic Research, New York.Parker, G., 1993. With this Body, Caring and Disability in Marriage. Open University Press, Buckingham.Rowlands, O., Parker, G., 1998. Informal carers: an independent study carried out by the Office for National
Statistics on behalf of the Department of Health as part of the 1995 General Household Survey. HMSO,London.
Sapsford, D., Tzannatos, Z., 1993. The Economics of the Labour Market. Macmillan, Basingstoke.Twigg, J., Atkin, K., 1994. Carers Perceived Policy and Practice in Informal Care. Open University Press,
Buckingham.