the persistence of ipo mispricing and the predictive … offer price represents a partial adjustment...
TRANSCRIPT
The Persistence of IPO Mispricing and thePredictive Power of Flipping
LAURIE KRIGMAN, WAYNE H. SHAW, and KENT L. WOMACK*
ABSTRACT
This paper examines underwriters’ pricing errors and the information content of first-day trading activity in IPOs. We show that first-day winners continue to be winnersover the first year, and first-day dogs continue to be relative dogs. Exceptions are “extra-hot” IPOs, which provide the worst future performance. We also demonstrate thatlarge, supposedly informed, traders “f lip” IPOs that perform the worst in the future.IPOs with low f lipping generate abnormal returns of 1.5 percentage points per monthover the first six months beginning on the third day. We show that f lipping is pre-dictable and conclude that underwriters’ pricing errors are intentional.
THE PRICE SETTING PROCESS FOR initial public offerings ~IPOs! is a multi-roundnegotiation among the firm going public, the underwriter, and investors.Despite the presumed intention of underwriters to obtain the best price forthe issuing firm by balancing supply and demand, the evidence is less thanconvincing that they are able to accomplish this task consistently. In a sam-ple of 1,232 large-capitalization IPOs in the period from 1988 to 1995, 149,or 12 percent, provided a first-day return of 30 percent or more. One mightconclude that substantial money was left on the table in these “hot” deals.However, 25 percent of IPOs during the same period closed trading on thefirst day at or below the offer price. In these “cold” deals, the issuing firmsostensibly received top dollar for their shares, but possibly alienated newshareholders due to disappointing first-day performance.
We show that despite this apparent mispricing the market underreacts inchoosing its initial trading price relative to both the offering price and the ini-tial filing range. Hanley ~1993! offers the first piece of the IPO pricing puzzle.
*Krigman is at the University of Arizona; Shaw is at the Cox School of Business, SouthernMethodist University; and Womack is at the Amos Tuck School, Dartmouth College. We ac-knowledge the contribution of MBA student David Wolff for conducting a pilot project at theAmos Tuck School in 1996 and research assistance by Deanna Young, Louis Crosier, and An-drew Brownell. We thank Brad Barber, Larry Benveniste, Richard Bower, Alon Brav, JohnDowning, Craig Dunbar, Tim Loughran, Dennis Logue, Roger Lynch, Victor McGee, Bob Miller,Jay Ritter, Scott Sipprelle, René Stulz, Jacob Thomas, and seminar participants at the 1997National Bureau of Economic Research Corporate Finance Conference, the 1997 Western Fi-nance Association Meetings, the 1996 Financial Management Association Meetings, Case West-ern Reserve University, the University of Colorado, Columbia University, HEC, the Universityof Rochester, SMU, Yale, the Arizona Finance Symposium, the Tuck Underwriting Conference,and the UCLA Behavioral Finance Conference for helpful comments. Mark Carhart and KenFrench generously provided data. We are solely responsible for any remaining errors.
THE JOURNAL OF FINANCE • VOL. LIV, NO. 3 • JUNE 1999
1015
She demonstrates that the relationship between the IPO offer price and the“price talk” ~the preliminary filing range! predicts the direction of initial stockreturns. Stocks that are priced above the initial filing price range perform verywell on the first day ~in spite of being offered at the higher price!, and stocksthat are priced below the initial filing range do poorly on the first day. Thus,the offer price represents a partial adjustment to the information about in-vestor demand received subsequent to the price talk.
Aff leck-Graves, Hegde, and Miller ~1996! provide another piece of the puz-zle. They examine the relationship between opening-day return and short-term aftermarket performance and find that three-month risk-adjusted returnsare in the same direction as the original mispricing. We provide a fineropening-day partitioning and show that initial returns predict subsequentlong-term ~one-year! excess returns.1 Hot IPOs outperform in the first year,cold IPOs underperform, and extra-hot IPOs ~those with first-day returns inexcess of 60 percent! provide the worst future performance.
Prior literature gives us only modest evidence as to what information weshould expect from one-day returns. There is pervasive evidence in behav-ioral decision research that decision makers anchor on an initial expectedoutcome and insufficiently adjust to new information.2 The correspondingresult, stock price drift, has been exhibited in investors’ responses to earn-ings announcements, dividend initiations and omissions, share repurchaseannouncements, seasoned equity offerings, and brokerage analysts’ buy andsell recommendations.3 In the case of IPOs, underwriters anchor on the mid-point of the filing range and do not sufficiently adjust the offer price to fullyref lect institutional indications of interest gathered during roadshows. Wedemonstrate that information about the quality of issues appears to be avail-able because we observe large investors selling on the first day those issuesthat have the worst future performance.
We focus on the information contained in this first-day trading. Flipping,which is defined as the immediate sale of IPO allocations back to the marketor the underwriting syndicate, has been demonized by both underwritersand the financial press. “Flipping screws up the market,” and “they ~f lip-pers! are parasites who prey off a system that basically works,” say syndi-cate managers ~Maher ~1990!, Pratt ~1994!!. Underwriters aggressively attemptto discourage f lippers by various penalty schemes such as threatened exclu-
1 This result is not without controversy. Ritter ~1991! and Carter and Dark ~1993! find instudies of prior periods ~1975 to 1984 and 1979 to 1984! that firms with the highest initialreturns do not have higher aftermarket excess returns. There are two differences between ourdata sets. First, Ritter includes smaller firms not included in our sample. These smallest firmshave the highest initial return, but the lowest three-year returns in his sample ~Table IV inRitter ~1991!!. Second, market reactions are different in the more recent time period we exam-ine. Levis ~1993! finds, in U.K. data, a three-year return distribution conditional on the first-day return consistent with our results.
2 See Slovic and Lichtenstein ~1971! or Kahneman, Slovic, and Tversky ~1982!.3 Post-earnings announcement drift has been shown by Bernard and Thomas ~1989, 1990!,
among others. For dividends, see Michaely, Thaler, and Womack ~1995!; for share repurchases,see Ikenberry, Lakonishok, and Vermaelen ~1995!; and for brokerage recommendations, seeWomack ~1996!.
1016 The Journal of Finance
sion from future hot offerings.4 They, as well as academics ~Carter and Dark~1993!!, contend that f lipping has a detrimental effect on the early priceperformance of IPOs. In contrast, we conclude that f lipping is a rationalresponse to underwriters’ mispricing. We demonstrate that heavily f lippedIPOs significantly underperform IPOs with less f lipping over future holdingperiods.5 If new issue prices adjust toward fair value in the first year, thenf lipping is the appropriate response to unfavorable pricing. Flipping is notthe cause of the poor price performance.
In order to capture information-based trading, we operationalize f lippingas the percentage of first-day dollar volume “sold” ~traded on the bid side ofthe market! in block trades.6 Flipping accounts for 45 percent of tradingvolume on the first day in cold issues compared to only 22 percent in hotissues, despite significantly higher trading volume in hot issues. We dem-onstrate that f lipping is a significant predictor of future stock performance.The difference in one-year size-adjusted returns ~beginning on the third day!between the first and fourth f lipping quartiles is 26.2 percentage points.Block traders appear to possess and use superior information; they f lip is-sues that subsequently underperform the market. Thus, f lipping providesvaluable information ~superior to the initial return! about the direction ofthe subsequent price adjustment to equilibrium fair value.
We show that f lipping provides a link between the empirical findings of Han-ley and Wilhelm ~1995! and Field ~1995! on institutional investment in IPOsand the theoretical underpricing literature. Rock ~1986! argues that IPOs areunderpriced to provide incentives for uninformed investors to bid for shares.Institutional investors bid for and gain a larger allocation of stronger IPOs,leaving a disproportionate share of weaker IPOs for the smaller investor. Un-derpricing exists to mitigate the impact of the lemons problem for small in-vestors. The implication of Rock’s model is that, assuming institutions are proxiesfor informed investors, we should find lower institutional investment in coldissues relative to hot issues. Benveniste and Spindt ~1989! argue that under-pricing exists to compensate regular investors for revealing truthful informa-tion. They demonstrate that distributional priority for future IPOs is given toregular investors, providing a motivation to take all IPO allocations. Hanleyand Wilhelm ~1995! show that the level of institutional buy-in to IPOs is con-
4 On June 2, 1997, the Depository Trust Company ~DTC! brought to full implementation itsnew IPO tracking system, which monitors f lipping in an automated fashion. The system allowsthe lead underwriter to know within three days who has f lipped shares. This enables the leadunderwriter to punish syndicate members who place shares in the hands of f lippers. It remainsan empirical question whether this system will result in lower levels of f lipping.
5 Hanley, Lee, and Seguin ~1996! examine IPOs of closed-end funds and show that a sellingimbalance ~which is different from our f lipping metric! in the first few days of trading predictscumulative ~negative! returns for the first three to four months of trading. Our paper differs intwo important respects: first, we analyze large operating company IPOs where institutionshave more long-term interest, and second, we find that the return disparity ~conditioned onprice and trading activity! extends substantially beyond the underwriter’s stabilization period.
6 We use block trades as a proxy for institutional informed trading. Specifically, we use theLee and Ready ~1991! algorithm to “sign” trades as buys or sells according to the bid and askquote in place at the time of the trade.
IPO Mispricing and Flipping 1017
stant at about 70 percent. Field ~1995!, however, demonstrates that the levelof institutional investment in IPOs ~measured approximately six months af-ter the IPO! is highly variable. These findings appear to be at odds.
We demonstrate that f lipping, a rational response to underwriters’ mis-pricing, completes the story. Institutional investors may buy all issues equally.Based on either superior information, or opening trade performance, how-ever, institutions selectively f lip IPOs that have the worst future perfor-mance, resulting in differential institutional investment levels across IPOswhen measured at a later point in time. The cost of f lipping is minimized bythe underwriting syndicate’s provision of aftermarket price support. By plac-ing a stabilizing bid, underwriters effectively truncate the lower tail of theinitial return distribution, minimizing the risk exposure of investors whohave the ability to f lip unwanted allocations ~Ruud ~1993!!. Importantly, itis the industry practice of price support that supports f lipping as a profit-able trading strategy ~for those who have access to primary IPO offerings!.
Finally, Fama ~1997! asserts that much of the apparent overreaction andunderreaction to information disappears when portfolios are value-weightedand common factors such as size and book-to-market effects are controlledfor. Our results on f lipping do not disappear. In a five-factor model ~market,size, book-to-market, general market momentum, and IPO market momen-tum! using calendar-time value-weighted portfolio regressions, the level off lipping continues to differentiate good from poor first-year performers. Themodels “load” significantly on the size and book-to-market factors that havebeen observed elsewhere for IPOs ~Brav and Gompers ~1997! and Loughranand Ritter ~1995!!, but the proxies for equity and IPO momentum have little~if any! explanatory power ~see Table VII, Section VI!.
The remainder of the paper is summarized as follows. Section I provides adescription of our IPO data and sample selection. Section II has an analysisof the long-term performance of IPOs. Section III discusses the microstruc-ture characteristics of the first day of trading. Section IV relates f lipping toinstitutional investment and future performance. Section V examines therobustness of our results. Section VI addresses methodological concerns andaddresses IPO and general market momentum as explanations for IPO per-formance, and Section VII concludes.
I. Data and Sample Selection
The data used in this study come from three sources. Firms conductinginitial public offerings in the period of January 1988 through May 1995 arecollected from the Securities Data Company ~SDC! New Issues database.7
7 We stop our initial data collecting in May 1995 so that we have at least six months ofpost-IPO return for each company. These are critical to our analysis; return ~CRSP! data wereavailable only until December 1995, at the time of collection. Our results do not change signif-icantly if we use December 1994 as our stopping point. In Section V, we verify our resultsout-of-sample on 232 IPOs ~which meet our selection criteria! issued between June 1995 andDecember 1995 ~inclusive! using CRSP data through December 1996.
1018 The Journal of Finance

We exclude financial corporations including banks, savings and loans, closed-end funds, and real estate investment trusts, partnerships, and unit offer-ings. Our intention is to study IPOs that are reasonably large and importantto institutional investors. Ritter ~1991! establishes that, on the whole, IPOsperform poorly in the aftermarket. However, Michaely and Shaw ~1998! dem-onstrate that performance can be explained in part by institutional invest-ment in an issue. During the 1984 to 1988 period, IPOs with no institutionalholdings significantly underperformed both the market and a portfolio ofIPOs that had positive institutional presence. Thus, we exclude the smallestIPOs from our analysis and focus on issues with potential institutional in-terest. As such, we constrain our sample to IPOs with an offer price above $8per share and for which the post-issue equity market capitalization ~basedon the offer price and assuming no overallotment option exercise! of the firmis greater than $50 million.8 Requiring prices and return data for all com-panies from the Center for Research in Security Prices ~CRSP! databasefurther reduces the SDC sample by 38 ~mostly foreign! companies.
Finally, in order to examine trading patterns in IPOs, we collect trade andquote data from the New York Stock Exchange TAQ database ~TAQ!. Thissource permits examination of intraday price and volume results such as afirm’s return from the offer price to the opening trade on the first day ~seeTable III in Section IV!. The TAQ database begins in January 1993. Wecollect trade and quote data for the first five days of trading for the 611firms in our sample that went public after January 1, 1993. This sample isused for our inquiry into f lipping as a rational response to mispricing.
Our final sample of IPOs, for which we have SDC variables such asoffering date, number of shares offered, offer price, lead underwriter, andCRSP daily return and volume information, covers 1,232 IPOs, of which244 began trading on the NYSE, 31 on the AMEX, and 957 ~78 percent! onNasdaq.
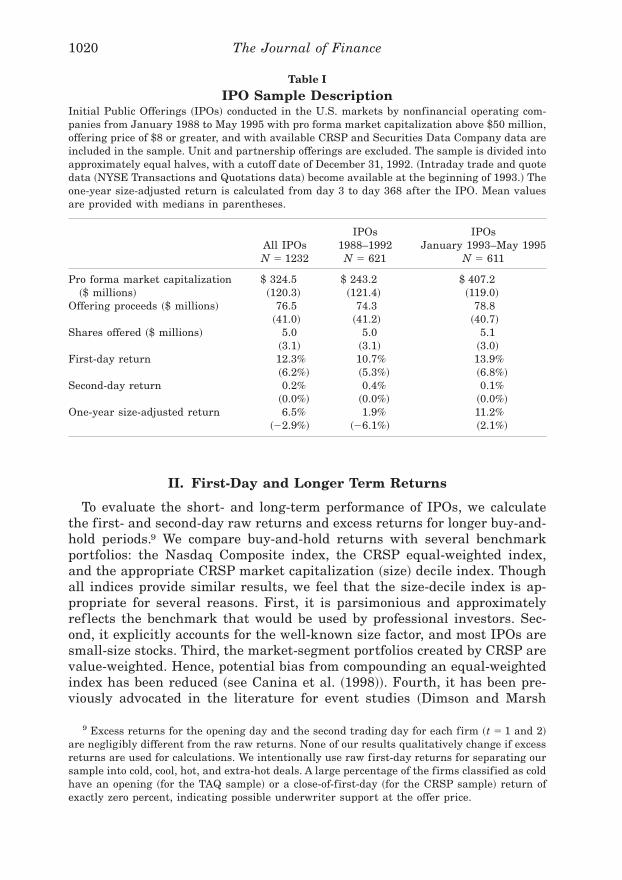
Table I provides descriptive statistics on the 1,232 IPOs examined in thispaper. The median firm in our sample offers 3 million shares, garneringproceeds of about $41 million. The mean and median market capitalizationof the firms at their offering is $325 million and $120 million. Of course,these figures slightly understate the actual initial market capitalizations formost companies once they are trading since they do not consider the exerciseof overallotment options or the underpricing of most IPOs.
8 SDC reports 3,331 IPO offerings in our time frame. Of those, 866 ~26 percent! are financialcorporations ~including closed-end funds and REITs! and 479 ~14 percent! are unit offerings. Ofthe 3,331 IPO offerings, 1,019 ~31 percent! are excluded because they are below $8 per shareand 1,369 ~41 percent! are excluded because of the $50 million minimum capitalization con-straint. With some overlap among these various constraints, 1,232 IPOs are included in oursample, representing a sizable proportion of all money raised by corporations through IPOs.Although the market roughly doubled during the time period we analyze, there is no indicationthat our fixed cutoffs of $8 per share and $50 million market capitalization have induced anybias. That is, the percentage of all IPOs we select in each year because of these cutoffs does notappear to increase or decrease over the eight-year period.
IPO Mispricing and Flipping 1019
II. First-Day and Longer Term Returns
To evaluate the short- and long-term performance of IPOs, we calculatethe first- and second-day raw returns and excess returns for longer buy-and-hold periods.9 We compare buy-and-hold returns with several benchmarkportfolios: the Nasdaq Composite index, the CRSP equal-weighted index,and the appropriate CRSP market capitalization ~size! decile index. Thoughall indices provide similar results, we feel that the size-decile index is ap-propriate for several reasons. First, it is parsimonious and approximatelyref lects the benchmark that would be used by professional investors. Sec-ond, it explicitly accounts for the well-known size factor, and most IPOs aresmall-size stocks. Third, the market-segment portfolios created by CRSP arevalue-weighted. Hence, potential bias from compounding an equal-weightedindex has been reduced ~see Canina et al. ~1998!!. Fourth, it has been pre-viously advocated in the literature for event studies ~Dimson and Marsh
9 Excess returns for the opening day and the second trading day for each firm ~t 5 1 and 2!are negligibly different from the raw returns. None of our results qualitatively change if excessreturns are used for calculations. We intentionally use raw first-day returns for separating oursample into cold, cool, hot, and extra-hot deals. A large percentage of the firms classified as coldhave an opening ~for the TAQ sample! or a close-of-first-day ~for the CRSP sample! return ofexactly zero percent, indicating possible underwriter support at the offer price.
Table I
IPO Sample DescriptionInitial Public Offerings ~IPOs! conducted in the U.S. markets by nonfinancial operating com-panies from January 1988 to May 1995 with pro forma market capitalization above $50 million,offering price of $8 or greater, and with available CRSP and Securities Data Company data areincluded in the sample. Unit and partnership offerings are excluded. The sample is divided intoapproximately equal halves, with a cutoff date of December 31, 1992. ~Intraday trade and quotedata ~NYSE Transactions and Quotations data! become available at the beginning of 1993.! Theone-year size-adjusted return is calculated from day 3 to day 368 after the IPO. Mean valuesare provided with medians in parentheses.
All IPOsN 5 1232
IPOs1988–1992N 5 621
IPOsJanuary 1993–May 1995
N 5 611
Pro forma market capitalization $ 324.5 $ 243.2 $ 407.2~$ millions! ~120.3! ~121.4! ~119.0!
Offering proceeds ~$ millions! 76.5 74.3 78.8~41.0! ~41.2! ~40.7!
Shares offered ~$ millions! 5.0 5.0 5.1~3.1! ~3.1! ~3.0!
First-day return 12.3% 10.7% 13.9%~6.2%! ~5.3%! ~6.8%!
Second-day return 0.2% 0.4% 0.1%~0.0%! ~0.0%! ~0.0%!
One-year size-adjusted return 6.5% 1.9% 11.2%~22.9%! ~26.1%! ~2.1%!
1020 The Journal of Finance
~1986!!. Thus, we use the size-adjusted benchmark in our preliminary analy-sis. In Section VI, we demonstrate that accounting for other factors such asprice-to-book and momentum in calendar-time portfolios does not signifi-cantly affect our conclusions. As noted by other researchers, calendar-timeportfolio regressions do not ref lect either an investor’s result or a typicalbenchmark, so we choose to use them in a diagnostic capacity.
The size-adjusted excess return is defined as the geometrically com-pounded ~buy-and-hold! return on the stock minus the geometrically com-pounded return on the relevant CRSP market-cap decile portfolio:
ER3 to Mi 5 F)
t53
M
~1 1 rti ! 2 )
t53
M
~1 1 risize !G, ~1!
where rti is the raw return on stock i on day t, and rt
size is the return on thematching CRSP market capitalization size decile for day t. ER3 to M
i is theexcess return for firm i beginning on the third trading day for the IPO,extending for M months ~M periods of 21 trading days!. If a firm is delistedduring the period ~four observations in the first 12 trading months, zeroobservations in the first six months!, the mean return ref lects fewer obser-vations in subsequent periods. An analysis of the delisted firms shows thattheir returns at the time of delisting are not significant outliers and there-fore do not bias our results.
The average excess return for each period, PER ~Portfolio Excess Return!is the mean of the ERi :
PER 51
nMS(
i51
n
ERiD, ~2!
where nM equals the number of surviving firms in the event period withavailable returns; t-statistics are calculated using the cross-sectional vari-ance of excess returns in the relevant period.
We partition all IPOs into one of four categories. Cold IPOs are defined asofferings where the first-day unadjusted return is zero or negative ~26 per-cent of IPOs!. Cold issues are often price-supported. We expect to observethe syndicate bid in many of these offerings, which demonstrates the will-ingness of the underwriter to repurchase shares, usually at the offer price,to support the stock. The remaining IPOs are classified as cool, hot, or extra-hot. Cool IPOs ~35 percent of the sample! are defined as those with a first-day return greater than zero but less than 10 percent. Hot IPOs ~36 percentof the sample! have a first-day return equal to or greater than 10 percentbut less than 60 percent. Extra-hot IPOs ~three percent of the sample! arethose with a first-day return greater than 60 percent.
Data suggest two significant regime shifts. First, cold IPOs appear to be-have differently than non-cold IPOs. Asquith, Jones, and Kieschnick ~1998!provide evidence that cold IPOs are drawn from a different distribution than
IPO Mispricing and Flipping 1021

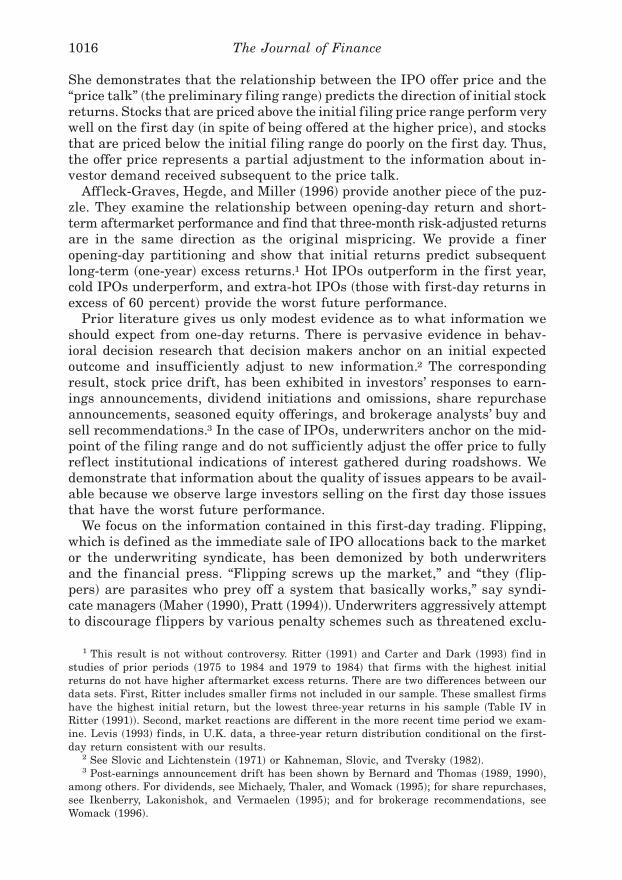
other IPOs. Second, extra-hot IPOs perform worse than cool and hot IPOs.Our cutoff between cool and hot definitions is arbitrary; the relationship islocally monotonic, and other partitions yield similar results. We show a finerpartition of the data in Figure 1, Panels B and C, allowing the reader toassess our cutoffs.
Tables I and II include return calculations using daily CRSP data for bothshort and long horizons. Table I contains return data for the entire sampleand provides a partitioning by the subperiods 1988 to 1992 and 1993 to 1995~the period with TAQ data!. We find an average first-day return of 12.3 per-cent overall, which is consistent with other studies using large IPOs duringour time period. We also show that the initial and subsequent performanceof IPOs in the most recent two and one-half years ~January 1993 to May1995! is higher than in the earlier period. The 621 IPOs offered in 1988to 1992 have one-year excess returns averaging 1.9 percent, compared to11.2 percent for the 611 IPOs issued in January 1993 to May 1995. We be-lieve this accounts for the differences between our mean and median returnsand those of earlier studies.
Figure 1. Size-adjusted performance (beginning on day 3) partitioned by opening dayreturn. Those IPOs conducted in the U.S. markets by operating companies from January 1988to May 1995 with pro forma market capitalization greater than $50 million, offering price of $8or greater, and with available CRSP and SDC data are included in the sample. Unit and part-nership offerings are excluded. The IPOs are partitioned into four groups using the raw returnfrom offer price to the first-day closing price. Cold IPOs ~318! are those with a first-day returnof zero percent or less and extra-hot IPOs ~33! are those with a first-day return of 60 percentor more. The partition of cool ~438! versus hot ~443! is split at 10 percent. Panels B and Cpartition the IPOs into 11 groups using the raw return from offer price to the first-day closingprice. Panel B contains mean size-adjusted one-year excess returns, and Panel C contains me-dian one-year size-adjusted excess returns.
1022 The Journal of Finance

Table II presents the return statistics partitioned by opening day perfor-mance. A majority of the offerings in the cold category close trading on thefirst day unchanged from the offering price, not lower than the offeringprice. As mentioned previously, this is the result of temporary price supportfrom underwriters, as described by Ruud ~1993! and others. Hanley, Kumar,and Seguin ~1993! find that prices fall following the hypothesized period ofprice support. Consistent with their findings, the cold IPOs in our sampledecline 1.5 percent on average in the month following the offering.
Table II and Figure 1 quantify and show the first main result of thispaper—that partitioning the sample of IPOs by first-day returns gives anindication of future performance. However, the results are not monotonic.We find extra-hot IPOs do not outperform hot ones. No theoretical cutoff
Figure 1. Continued.
IPO Mispricing and Flipping 1023

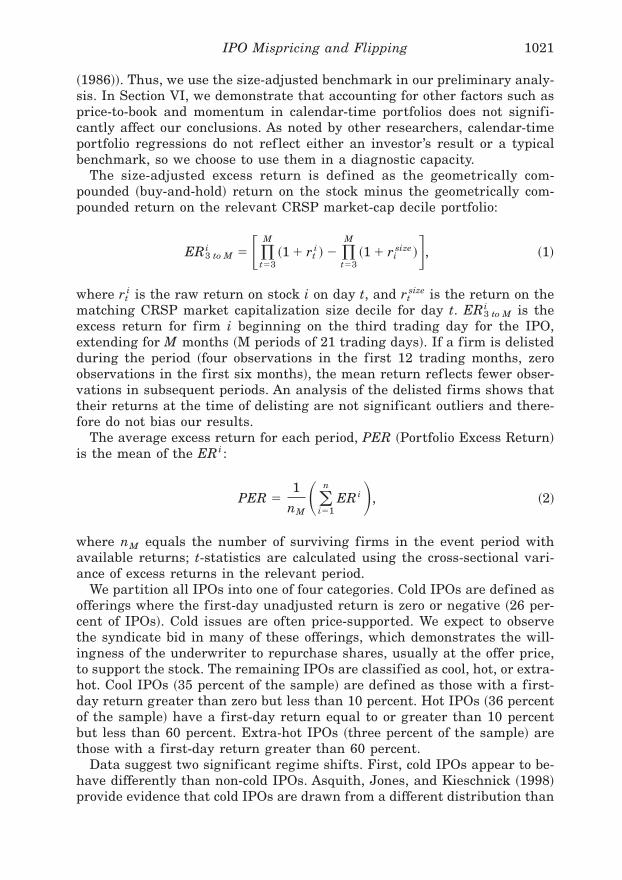
Table II
Full IPO Sample Partitioned by UnderpricingIPOs for January 1988 through May 1995 are partitioned into four groups using the raw return from the offer price to the first-day closing price.Cold IPOs are those with a first-day return of zero or less and extra-hot IPOs as those with a first-day return greater than 60 percent. Thepartitions of cool and hot are split at 10 percent. Medians are not reported when they are essentially the same as the means. Post-offering excessreturns beginning on the third day after the offering are buy-and-hold returns, using a capitalization-weighted size-decile benchmark. First-dayvolume as a percentage of shares offered is presented unadjusted and adjusted by dividing Nasdaq volume by two to account for interdealertransactions.
Cold IPOsFirst-Day # 0%
N 5 318
Cool IPOs0% , First-Day
# 10%N 5 438
Hot IPOs10% , First-Day
# 60%N 5 443
Extra-Hot IPOsFirst-Day . 60%
N 5 33Kruskal–Wallis Test
x2 ~ p-value!
First-day return ~offer-to-close!Mean 21.2% 4.6% 24.4% 80.3% no meaning, definedMedian 0.0% 4.3% 21.1% 75.0% as different
First-day volume as percentageof shares offered
Mean 42.3% 51.1% 81.3% 130.6% 359.3 ~0.0001!Adjusted mean 24.0% 29.7% 43.7% 67.3% 366.6 ~0.0001!
One-month excess returnfrom day 3
Mean 21.5% 1.9% 5.7% 20.9% 52.6 ~0.0001!Median 22.7% 1.0% 4.1% 25.2%
Six-month excess returnfrom day 3
Mean 2.2% 6.4% 11.3% 26.2% 12.7 ~0.0052!Median 24.2% 3.2% 5.8% 215.7%
One-year excess return from day 3Mean 0.3% 5.1% 13.2% 26.8% 11.0 ~0.0117!Median 212.4% 22.7% 4.7% 221.3%
1024T
he
Jou
rnal
ofF
inan
ce
Percentage change frommidpoint of filing range to offer price
Mean 29.7% 21.7% 12.6% 29.2% 442.7 ~0.0001!Overallotment exercised ~mean! 2.8% 7.4% 12.1% 13.2% 323.6 ~0.0001!
~15 percent maximum!Second-day return ~mean! 20.1% 0.1% 0.7% 20.3% 4.4 ~0.2217!Pro forma market capitalization~$ millions!
Mean $237.37 $472.19 $250.90 $192.48 7.9 ~0.0480!Median $116.35 $125.94 $115.04 $172.60
Proceeds of offering ~$ millions!Mean $77.15 $85.98 $68.88 $48.19 5.9 ~0.1155!Median $39.00 $42.00 $40.25 $43.01
IPO
Mispricin
gan
dF
lipping
1025

has been suggested between the cool0hot and the “overheated” extra-hotgroups. We have chosen 60 percent for our presentation, but one shouldrecognize that a cutoff is making dichotomous what is essentially a contin-uous variable.
We find that the mean and median one-month excess returns for cold andextra-hot IPOs are negative and that the same returns are positive for cooland hot IPOs. This relationship of cold and extra-hot to cool and hot IPOscontinues at the six-month and one-year time frames as well. In parametricas well as nonparametric statistical tests, the differences between the fourgroups are significant at conventional levels.
III. Initial Trading Activity in IPOs
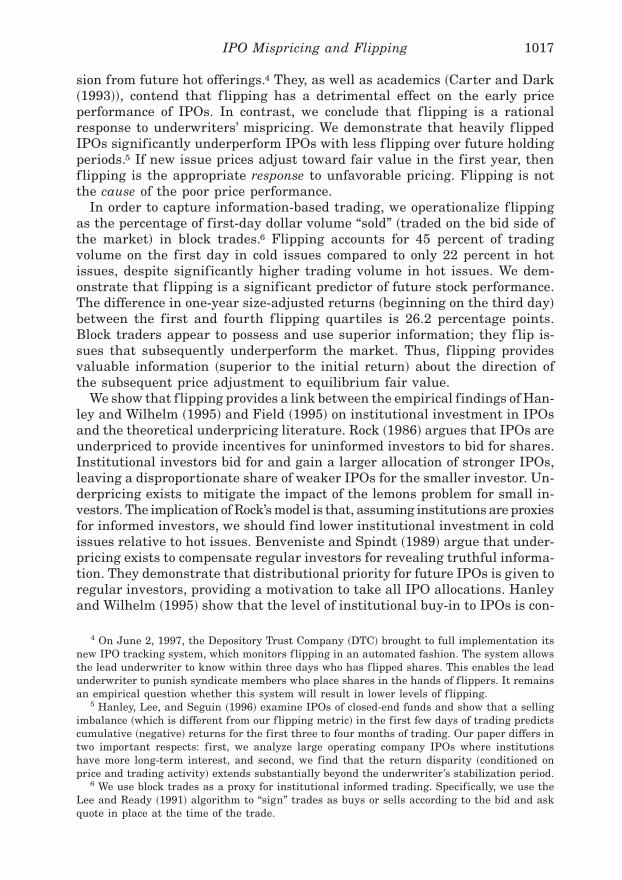
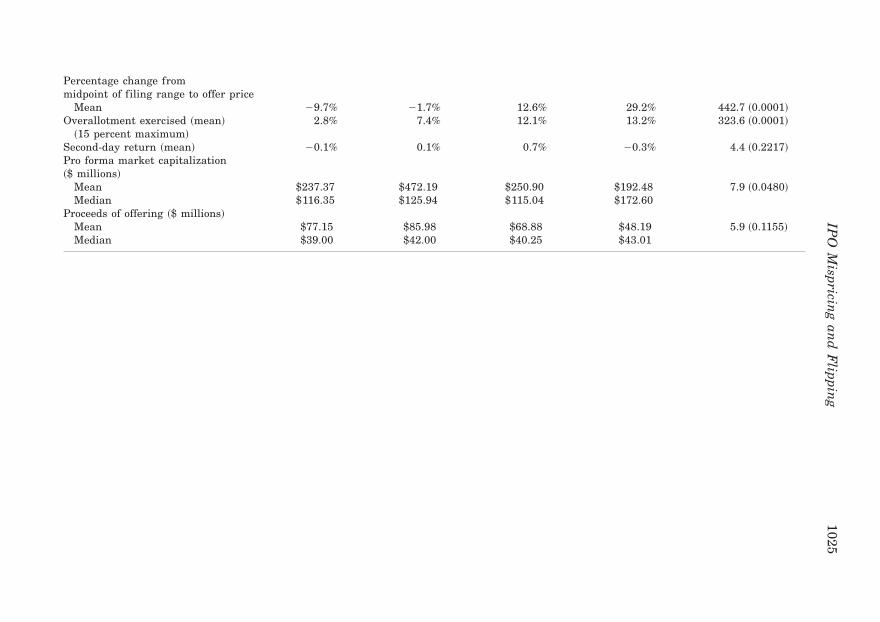
One aspect of IPOs often highlighted by the financial press is the heavyfirst-day trading that puts many IPO firms on the list of the largest volumestocks for the day. From this point in the study, we focus on the 611 IPOsfrom the January 1993 through May 1995 period for which TAQ data areavailable. TAQ data allow us to examine intraday trading activity. To pro-vide a basic understanding of the magnitude of first-day trading, we calcu-late the total number of shares traded on the first day as a percentage of thenumber of shares offered in the IPO.10 We find a significant range of first-day adjusted trading volume within the sample with a minimum of one per-cent, a median of 33 percent, and a maximum of 209 percent of shares offered.However, volume quickly dissipates. The mean number of trades executed onthe first day of public trading is 822, declining consistently over the nextfour days to an average level of only 93 trades by the fifth day. Figure 2shows shares traded as a percentage of shares offered over the first fivedays, partitioned by initial IPO performance. The heaviest trading activitytakes place in extra-hot IPOs, with average first-day ~adjusted! volume ofabout 1.9 million shares or 70 percent of shares offered. However, the rela-tive level of trading quickly dissipates on days 2–5 across all IPOs regard-less of first-day return.
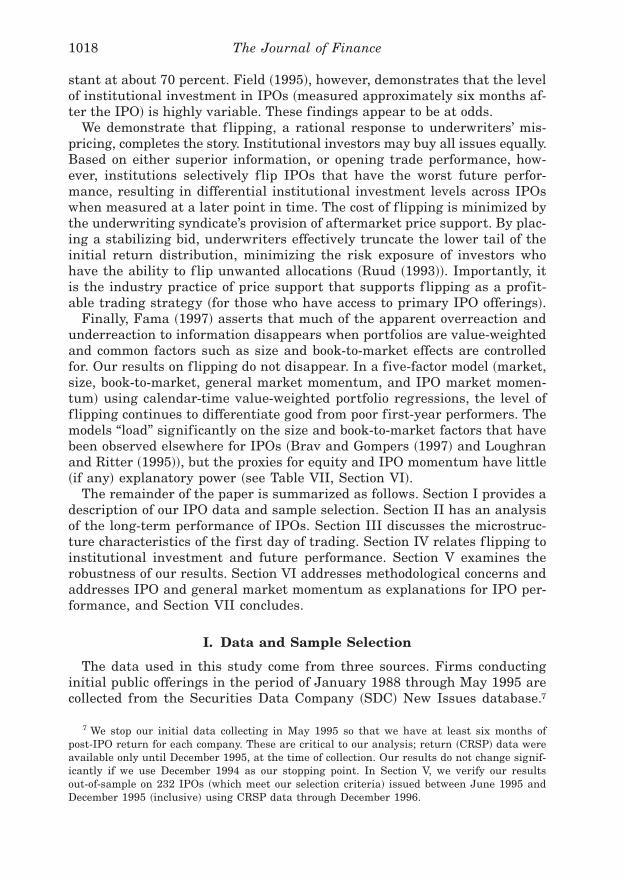
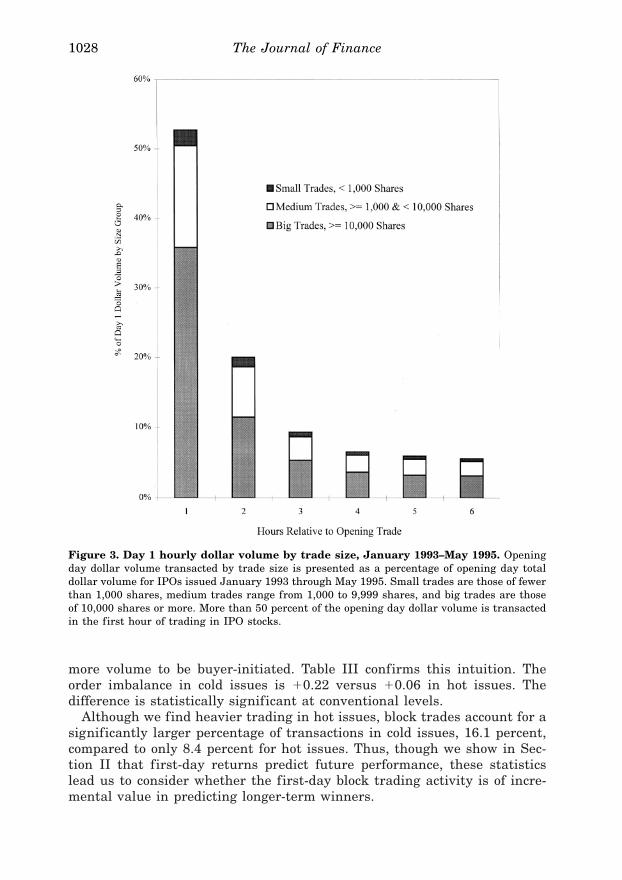
A similar pattern of rapid trading decline also occurs within the first trad-ing day. We construct this information by aligning trades in event time start-ing with the first hour of trading. The percentage of trades that occur duringeach of the first six hours of trading is shown in Figure 3.11 The immediacy
10 To keep NYSE0AMEX and Nasdaq results comparable, we divide shares traded in theNasdaq market by two and report these as adjusted volume totals ~Atkins and Dyl ~1997!!.Transaction-specific measures of trading activity ~f lipping and order imbalance! are based ontransactions as reported in the TAQ database. There is no known methodology that can beuniformly implemented to adjust volume at the transactions level. Krigman ~1997! demon-strates that the level of volume inf lation is highly variable from stock to stock and day to dayfor the same stock.
11 In Figure 3, we only include trading for the first six hours because the majority of IPOs inour sample open between 10:00 a.m. and 11:00 a.m., and thus do not have a full six and one-halfhours of trading on the first day.
1026 The Journal of Finance
of the trading is dramatic. Approximately 52 percent of the day’s tradingactivity takes place in the first hour of trading. The first two hours accountfor more than 72 percent of the day’s trading activity.
To provide some insight into who is trading during this time, we partitionthe trades into three groups; trades of fewer than 1,000 shares, trades of1,000 to 9,999 shares, and trades of 10,000 shares or more. We find that57 percent of the block trades ~10,000 shares or more! on the opening day oftrading take place within the first hour.
Trading activity is much greater in hot issues than in cold ones. On theopening day of trading, an average of 2,886 trades are made in the extra-hotissues compared to only 345 trades in the cold issues. The number of blocktrades is significantly higher in the hot issues as well. Interestingly, how-ever, block trades in the extra-hot issues account for only 39 percent of theshares transacted for the day compared to 68 percent in the cold issues. Thedifference is significant at the 0.0001 level and is indicative of heavier pro-portionate institutional trading in cold issues. Hanley et al. ~1996! examineorder imbalance, defined as @~shares sold 2 shares bought! 4 ~total sharesissued!# , as indicative of buyer versus seller initiated trading. In cold issues,we expect trading to be seller-initiated, whereas in hot issues we expect
Figure 2. Daily trading activity by day 1 performance: January 1993–May 1995. Dailytrading volume is presented by day 1 offer-to-close return groups. Of the 611 IPOs for thisperiod, 136 cold IPOs have first-day performance less than or equal to zero percent, 227 havefirst-day returns greater than zero percent but less than 10 percent, 224 have returns equal toor greater than 10 percent but less than 60 percent, and 24 extra-hot IPOs have first-dayreturns greater than 60 percent. Nasdaq volume is divided by two to control for differences intrading protocol between the exchanges.
IPO Mispricing and Flipping 1027
more volume to be buyer-initiated. Table III confirms this intuition. Theorder imbalance in cold issues is 10.22 versus 10.06 in hot issues. Thedifference is statistically significant at conventional levels.
Although we find heavier trading in hot issues, block trades account for asignificantly larger percentage of transactions in cold issues, 16.1 percent,compared to only 8.4 percent for hot issues. Thus, though we show in Sec-tion II that first-day returns predict future performance, these statisticslead us to consider whether the first-day block trading activity is of incre-mental value in predicting longer-term winners.
Figure 3. Day 1 hourly dollar volume by trade size, January 1993–May 1995. Openingday dollar volume transacted by trade size is presented as a percentage of opening day totaldollar volume for IPOs issued January 1993 through May 1995. Small trades are those of fewerthan 1,000 shares, medium trades range from 1,000 to 9,999 shares, and big trades are thoseof 10,000 shares or more. More than 50 percent of the opening day dollar volume is transactedin the first hour of trading in IPO stocks.
1028 The Journal of Finance
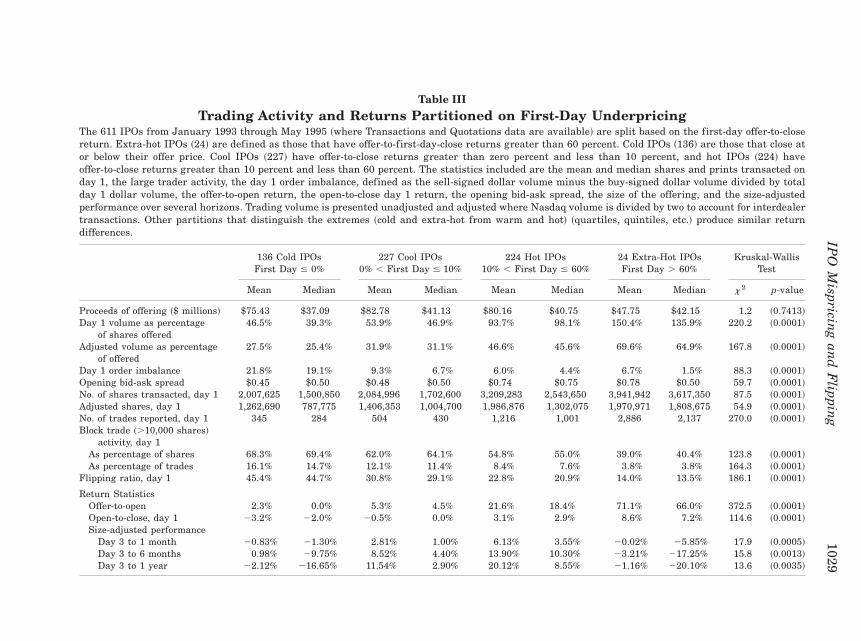
Table III
Trading Activity and Returns Partitioned on First-Day UnderpricingThe 611 IPOs from January 1993 through May 1995 ~where Transactions and Quotations data are available! are split based on the first-day offer-to-closereturn. Extra-hot IPOs ~24! are defined as those that have offer-to-first-day-close returns greater than 60 percent. Cold IPOs ~136! are those that close ator below their offer price. Cool IPOs ~227! have offer-to-close returns greater than zero percent and less than 10 percent, and hot IPOs ~224! haveoffer-to-close returns greater than 10 percent and less than 60 percent. The statistics included are the mean and median shares and prints transacted onday 1, the large trader activity, the day 1 order imbalance, defined as the sell-signed dollar volume minus the buy-signed dollar volume divided by totalday 1 dollar volume, the offer-to-open return, the open-to-close day 1 return, the opening bid-ask spread, the size of the offering, and the size-adjustedperformance over several horizons. Trading volume is presented unadjusted and adjusted where Nasdaq volume is divided by two to account for interdealertransactions. Other partitions that distinguish the extremes ~cold and extra-hot from warm and hot! ~quartiles, quintiles, etc.! produce similar returndifferences.
136 Cold IPOsFirst Day # 0%
227 Cool IPOs0% , First Day # 10%
224 Hot IPOs10% , First Day # 60%
24 Extra-Hot IPOsFirst Day . 60%
Kruskal-WallisTest
Mean Median Mean Median Mean Median Mean Median x2 p-value
Proceeds of offering ~$ millions! $75.43 $37.09 $82.78 $41.13 $80.16 $40.75 $47.75 $42.15 1.2 ~0.7413!Day 1 volume as percentage
of shares offered46.5% 39.3% 53.9% 46.9% 93.7% 98.1% 150.4% 135.9% 220.2 ~0.0001!
Adjusted volume as percentageof offered
27.5% 25.4% 31.9% 31.1% 46.6% 45.6% 69.6% 64.9% 167.8 ~0.0001!
Day 1 order imbalance 21.8% 19.1% 9.3% 6.7% 6.0% 4.4% 6.7% 1.5% 88.3 ~0.0001!Opening bid-ask spread $0.45 $0.50 $0.48 $0.50 $0.74 $0.75 $0.78 $0.50 59.7 ~0.0001!No. of shares transacted, day 1 2,007,625 1,500,850 2,084,996 1,702,600 3,209,283 2,543,650 3,941,942 3,617,350 87.5 ~0.0001!Adjusted shares, day 1 1,262,690 787,775 1,406,353 1,004,700 1,986,876 1,302,075 1,970,971 1,808,675 54.9 ~0.0001!No. of trades reported, day 1 345 284 504 430 1,216 1,001 2,886 2,137 270.0 ~0.0001!Block trade ~.10,000 shares!
activity, day 1As percentage of shares 68.3% 69.4% 62.0% 64.1% 54.8% 55.0% 39.0% 40.4% 123.8 ~0.0001!As percentage of trades 16.1% 14.7% 12.1% 11.4% 8.4% 7.6% 3.8% 3.8% 164.3 ~0.0001!
Flipping ratio, day 1 45.4% 44.7% 30.8% 29.1% 22.8% 20.9% 14.0% 13.5% 186.1 ~0.0001!
Return StatisticsOffer-to-open 2.3% 0.0% 5.3% 4.5% 21.6% 18.4% 71.1% 66.0% 372.5 ~0.0001!Open-to-close, day 1 23.2% 22.0% 20.5% 0.0% 3.1% 2.9% 8.6% 7.2% 114.6 ~0.0001!Size-adjusted performance
Day 3 to 1 month 20.83% 21.30% 2.81% 1.00% 6.13% 3.55% 20.02% 25.85% 17.9 ~0.0005!Day 3 to 6 months 0.98% 29.75% 8.52% 4.40% 13.90% 10.30% 23.21% 217.25% 15.8 ~0.0013!Day 3 to 1 year 22.12% 216.65% 11.54% 2.90% 20.12% 8.55% 21.16% 220.10% 13.6 ~0.0035!
IPO
Mispricin
gan
dF
lipping
1029
IV. Flipping as a Predictor of Future Returns
We define f lipping for our study as the immediate first-day selling of blockallocations by institutional investors. Clearly, large investors are not the onlyones capable of selling their shares in the aftermarket, but there are severalreasons to examine block sales specifically. First, the academic literature of-ten characterizes large traders as informed ~as opposed to naive or ‘noise’ trad-ers!. By focusing on large-trader behavior, we may be able to discern whetherthey in fact garner excess profits due to their potentially informed nature. Sec-ond, underwriters report that most IPO firms are vitally interested in placinglarge allocations of shares in the hands of committed institutional investors,presumably from a belief that thereby trading volatility will be minimized andvalue will be maximized. The absence of f lipping, then, is a measure of whethertheir placement strategy has been successful.
First, we provide an operationalized definition of large traders. We defineactivity of large traders as transactions of 10,000 shares or more, althoughour results are not sensitive to this arbitrary, but institutionally accepted,cutoff.12 Though the frequency ~count! of trades by large traders is smallrelative to other traders’ activity, averaging 9.9 percent of first-day trades,the effect of their trading is significant. On the first day of trading, blocktrades account for 59.8 percent of all shares traded.
We hypothesize that a measure of f lipping may be valuable in detectinginformed behavior by large traders. We define f lipping as the ratio of first-day sell-signed block-trade dollar volume to total dollar volume traded onthe first day.13 Table III shows that the level of f lipping is very differentfrom cold IPOs to hot IPOs. For cold IPOs, f lipping accounts for 45 percentof total dollar volume executed on the first day of trading. For hot and extra-hot IPOs, 22 percent and 14 percent, respectively, of the first-day dollarvolume is f lipped. The monotonic difference in f lipping among the four first-day return groups is significant at the 0.0001 level. Consequently, we rankand partition all IPOs into quartiles by this f lipping metric. Figure 4 illus-trates that the portfolio of lowest f lipping quartile IPOs achieves the high-est size-adjusted return over one-month, six-month, and one-year holdingperiods. An examination of the one-year excess return of IPOs partitioned byflipping group shows that the lowest f lipping quartile has significantly higherreturns than the interquartile range, which has significantly higher returnsthan the high f lipping quartile ~F-value 5 12.41, p-value 5 0.0005!.
Thus, the second main result of this study is that IPOs with lower f lippingon the first day ~especially the lowest quartile! significantly outperform thosewith high first-day f lipping, over the next year. We have shown that first-
12 We replicate our results using a 5,000-share cutoff for large trades. The results are sub-stantially identical to those reported using the 10,000-share designation. The NYSE TAQ data-base does not provide information on exact trades. Prints are provided that sometimes areaggregates of trades executed at the same price and time on an exchange. All references totrades are prints as reported by TAQ. The aggregated trades are f lagged with a B code thatindicates a bunched transaction. All results remain when we exclude the trades f lagged B.
13 We use the Lee and Ready ~1991! algorithm to sign all transactions.
1030 The Journal of Finance

day performance predicts one-year returns and that f lipping also predictsone-year returns. Next, we ask the question: Can we predict the amount off lipping from ex ante factors?
The offer-to-open return provides the market with the first indication ofIPO performance. As such, institutional investors may condition f lipping be-havior on the first trade price. The offer-to-open return in our sample rangesfrom 24.5 percent to 1127.5 percent with an average of 13.2 percent. Wealso control for the effects of firm size and underwriter and estimate thefollowing regression ~White’s heteroskedasticity-adjusted t-statistics are re-ported in parentheses!:
Flipping 5 20.054~20.34!
1 0.0001 Rank~1.46!
1 0.021 ln~Mktcap!~2.43!
2 0.333 Return,~29.88!
~3!
N 5 611, Adj. R2 5 0.135 F-value 5 32.74 p-value 5 0.0001,
where Flipping is the percentage of sell-signed dollar volume executed intrades of 10,000 shares or more on the first day of trading; Rank is a rank-ing of underwriters based on equity capital; Mktcap is the total market cap-italization of the firm at the time of the IPO; and Return is the percentagechange from the offer price to the opening trade price.
Figure 4. Size-adjusted performance by flipping quartile. One-month, six-month, andone-year size-adjusted returns are presented for the 611 IPOs offered from January 1993 throughMay 1995. The sample is partitioned by the level of day 1 “f lipping,” defined as the percentageof dollar volume executed in sell-signed trades of more than 10,000 shares. Low f lipping is thelowest quartile, medium flipping represents the interquartile range, and high f lipping is theupper quartile. The IPOs with the lowest level of f lipping on the opening day perform the bestover future trading periods.
IPO Mispricing and Flipping 1031
The level of f lipping is explained by the level of underpricing ~Return!,controlling for both firm size and the quality of the underwriter. The nega-tive and significant coefficient of the Return variable indicates that largetraders f lip IPOs that open at a low price relative to the offer price. Thepositive and significant coefficient of the Mktcap variable is consistent withthe argument in Michaely and Shaw ~1994! that larger IPOs are more dif-ficult to market, holding other things constant. Thus, we see higher f lippingin larger deals.
We have demonstrated that f lipping is predictable and is related to thefuture performance of IPO stocks. We next examine whether first-day f lip-ping partially explains the divergent results of Field ~1995!, who finds sig-nificant variance in institutional holdings in the period subsequent to IPO,and Hanley and Wilhelm ~1995!, who find a stable allocation of IPO sharesto institutional investors of about 70 percent of shares offered.14 To do this,we collect institutional holdings as of the first quarterly 13F filing post-IPOfor the 552 IPOs in our sample ~of 611! for which data are available. Resultsof this analysis are presented in Table IV.
We show that the percentage of shares offered that are held by institutionsafter three months is significantly different across f lipping quartiles. IPOstocks that are heavily f lipped on the first day have lower institutional hold-ings after three months. A Wilcoxon Rank Sum test rejects the equality ofthe distribution of the number of institutional investors across f lipping quar-tiles ~x2 5 10.59, p-value 5 0.005!. Shares held by institutions, measured asa percent of shares offered, is also significantly different across f lippingquartiles ~x2 5 6.72, p-value 5 0.0347!. Table IV documents that institu-tional investment is also related to the opening price performance of IPOs.We conclude that if institutional buy-in to IPOs is constant, as found byHanley and Wilhelm ~1995!, f lipping based on either superior information oropening day performance results in differential institutional investment pro-files a few months later.
V. A Two-Factor Trading Strategy and Robustness
We have shown that the first-day return and the level of f lipping on thefirst day predict the performance of IPO stocks over the next year. Withthe exception of extra-hot IPOs, the higher the first-day return, the higherthe one-year size-adjusted return; the lower the f lipping ~sell-side block ac-tivity!, the higher the one-year size-adjusted return. For example, selectinga portfolio of the lowest f lipping quartile produces a mean one-year size-adjusted return of 27.8 percent relative to 0.1 percent for the highest f lip-ping quartile. Portfolio selection based on f lipping yields a larger return
14 Field’s IPO sample contains 1,862 IPOs issued during the period 1984–1988. Our exclu-sion of small IPOs results in significantly higher levels of institutional holdings during the1993 to 1995 period than she finds in her sample.
1032 The Journal of Finance

differential than conditioning on opening day performance. A natural follow-onquestion is whether the two factors jointly can provide a more potent modelfor predicting returns, or whether they proxy for a single factor.
To address this issue, we partition the IPOs by f lipping quartile withinthe opening-day performance categories. Again, low f lipping is defined asthe first quartile, medium contains the next 50 percent of the firms, andhigh contains firms in the highest quartile of firms ranked by f lipping. Theresults shown in Table V and Figure 5 are consistent with first-day returnand first-day trading activity having independent predictive power for fu-ture returns. Focusing on one-year returns, we find that average returns
Table IV
Institutional Investment by Flipping Activityand First-Day Performance
Institutional ownership from the first quarterly 13F filing that is at least one-quarter post-IPOis provided for 552 of the 611 IPOs for which data are available. We provide data on the numberof institutions reporting holdings and institutional shares as a percentage of shares offered inthe IPO. We include a nonparametric Kruskal–Wallis test of the equality of the distributionacross f lipping and performance partitions. Panel A presents institutional ownership parti-tioned by f lipping quartile. Flipping is defined as the sell-signed dollar volume executed inblocks of 10,000 shares or more divided by the total day 1 dollar volume. The sample is splitbased on f lipping levels; low f lipping is the lowest quartile, medium flipping represents theinterquartile range, and high f lipping is the upper quartile. Panel B presents the data parti-tioned by opening day performance. Extra-hot IPOs ~23! are defined as those with offer-to-first-day-close returns greater than 60 percent. Cold IPOs ~115! are those that close at or below theiroffer price. Cool IPOs ~211! have offer-to-close returns greater than zero percent but less than10 percent, and hot IPOs ~203! have offer-to-close returns greater than 10 percent and less than60 percent.
No. of InstitutionalHolders
Institutional Sharesas Percentage ofShares Offered
Obs. Mean Median Mean Median
Panel A: Partitioned by Flipping Quartile
High f lipping 134 30 25 66% 64%Medium flipping 278 34 30 71% 68%Low flipping 140 33 31 82% 73%x2 Kruskal–Wallis 10.594 6.721~ p-value! ~0.0050! ~0.0347!
Panel B: Partitioned by Opening Day Performance
Cold IPOs 115 23 21 66% 62%Cool IPOs 211 30 26 73% 67%Hot IPOs 203 40 35 75% 73%Extra-hot IPOs 23 42 39 82% 84%x2 Kruskal–Wallis 86.176 16.049~ p-value! ~0.0001! ~0.0011!
IPO Mispricing and Flipping 1033

Table V
Returns Partitioned by First-Day Performance and Flipping ActivityThe 611 IPOs from January 1993 through May 1995 are split based on opening day offer-to-close performance and f lipping activity. Flipping isdefined as the sell-signed dollar volume executed in blocks of 10,000 shares or more divided by the total day 1 dollar volume. The sample is splitbased on f lipping levels; low f lipping is the lowest quartile, medium flipping represents the interquartile range, and high f lipping is the upperquartile. Mean and median size-adjusted returns are provided for one-month, six-month, and one-year return horizons.
136 Cold IPOsFirst Day # 0%
227 Cool IPOs0% , First Day $ 10%
224 Hot IPOs10% , First Day $ 60%
24 Extra-Hot IPOsFirst Day . 60% All IPOs ~611!
Mean Median Mean Median Mean Median Mean Median Mean Median
1-month size-adjustedreturns by day 1f lipping activity
Low 21.9% 21.5% 8.8% 9.5% 6.2% 4.8% 20.9% 26.5% 5.9% 3.5%Medium 1.2% 20.7% 2.0% 0.5% 6.3% 4.1% 3.2% 18.7% 3.7% 1.9%High 21.9% 21.3% 20.7% 23.2% 3.7% 20.2% None None 21.0% 21.6%
6-month size-adjustedreturns by day 1f lipping activity
Low 23.2% 15.3% 17.8% 13.1% 19.0% 14.8% 1.1% 218.8% 16.6% 13.2%Medium 8.3% 21.2% 7.3% 6.4% 10.8% 7.4% 219.5% 2.2% 8.5% 6.4%High 24.6% 219.5% 3.0% 21.2% 12.6% 6.9% None None 20.3% 27.5%
1-year size-adjustedreturns by day 1f lipping activity
Low 13.7% 9.3% 33.8% 10.1% 29.2% 20.2% 3.3% 213.5% 27.1% 11.1%Medium 5.6% 28.3% 2.6% 23.4% 16.4% 7.1% 217.4% 231.3% 8.6% 2.4%High 27.5% 230.5% 11.7% 1.6% 20.1% 4.7% None None 0.1% 210.8%
1034T
he
Jou
rnal
ofF
inan
ce

increase across the cold, cool, and hot classifications. Also, within each clas-sification, the low f lipping IPOs have substantially higher returns than thehigh f lipping IPOs for both six-month and one-year horizons. For example,the low f lipping quartile of hot IPOs has a one-year size-adjusted meanreturn of 129.2 percent compared with 20.1 percent for the high f lippingquartile. The low f lipping quartile provides the highest six-month and one-year return within each of the opening-day return categories.
An important question is whether these results hold consistently through-out our sample and in future periods. We address concerns of robustness intwo ways. First, we provide results partitioned by shorter time periods. Sec-ond, we collect an additional 232 IPOs issued from June 1995 through De-cember 1995 which meet the selection criteria outlined in Section I. This
Figure 5. Mean returns by opening day performance and flipping group. One-yearsize-adjusted excess returns are presented partitioned by opening day offer-to-close perfor-mance and f lipping group. Low f lipping is the lowest quartile, medium flipping representsthe interquartile range, and high f lipping is the upper quartile. The 611 IPOs offered fromJanuary 1993 through May 1995 are included in the analysis. The high f lipping, extra-hotcategory contains no observations and the medium flipping, extra-hot category contains onlyfive observations.
IPO Mispricing and Flipping 1035
group of IPOs is used to perform an out-of-sample robustness check. We stopcollecting observations at the end of 1995 so that we can calculate post-offerone-year performance.
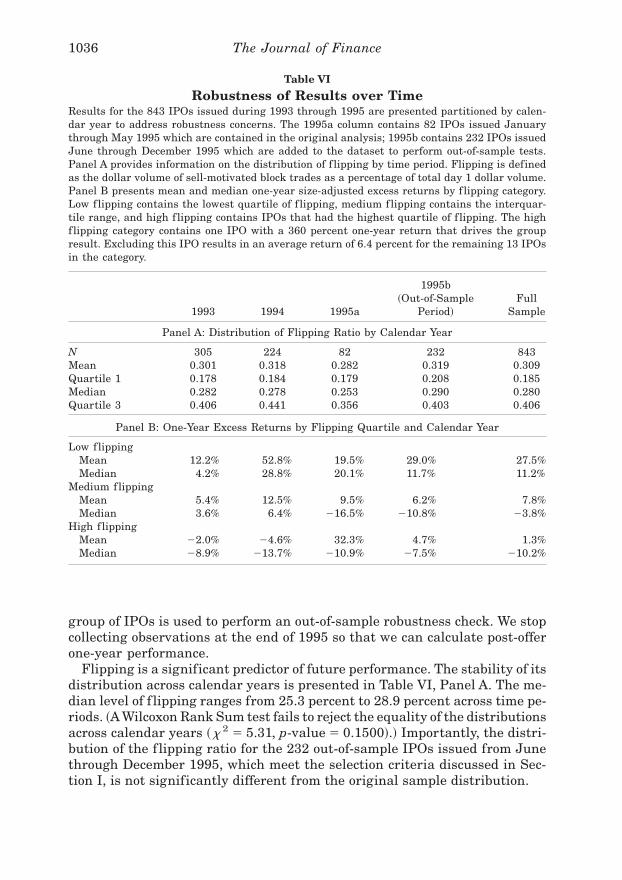
Flipping is a significant predictor of future performance. The stability of itsdistribution across calendar years is presented in Table VI, Panel A. The me-dian level of f lipping ranges from 25.3 percent to 28.9 percent across time pe-riods. ~A Wilcoxon Rank Sum test fails to reject the equality of the distributionsacross calendar years ~x2 5 5.31, p-value 5 0.1500!.! Importantly, the distri-bution of the f lipping ratio for the 232 out-of-sample IPOs issued from Junethrough December 1995, which meet the selection criteria discussed in Sec-tion I, is not significantly different from the original sample distribution.
Table VI
Robustness of Results over TimeResults for the 843 IPOs issued during 1993 through 1995 are presented partitioned by calen-dar year to address robustness concerns. The 1995a column contains 82 IPOs issued Januarythrough May 1995 which are contained in the original analysis; 1995b contains 232 IPOs issuedJune through December 1995 which are added to the dataset to perform out-of-sample tests.Panel A provides information on the distribution of f lipping by time period. Flipping is definedas the dollar volume of sell-motivated block trades as a percentage of total day 1 dollar volume.Panel B presents mean and median one-year size-adjusted excess returns by f lipping category.Low f lipping contains the lowest quartile of f lipping, medium flipping contains the interquar-tile range, and high f lipping contains IPOs that had the highest quartile of f lipping. The highf lipping category contains one IPO with a 360 percent one-year return that drives the groupresult. Excluding this IPO results in an average return of 6.4 percent for the remaining 13 IPOsin the category.
1993 1994 1995a
1995b~Out-of-Sample
Period!Full
Sample
Panel A: Distribution of Flipping Ratio by Calendar Year
N 305 224 82 232 843Mean 0.301 0.318 0.282 0.319 0.309Quartile 1 0.178 0.184 0.179 0.208 0.185Median 0.282 0.278 0.253 0.290 0.280Quartile 3 0.406 0.441 0.356 0.403 0.406
Panel B: One-Year Excess Returns by Flipping Quartile and Calendar Year
Low f lippingMean 12.2% 52.8% 19.5% 29.0% 27.5%Median 4.2% 28.8% 20.1% 11.7% 11.2%
Medium flippingMean 5.4% 12.5% 9.5% 6.2% 7.8%Median 3.6% 6.4% 216.5% 210.8% 23.8%
High f lippingMean 22.0% 24.6% 32.3% 4.7% 1.3%Median 28.9% 213.7% 210.9% 27.5% 210.2%
1036 The Journal of Finance

Next we present one-year size-adjusted returns for the out-of-sample pe-riod conditioned on first-day f lipping. The f lipping groups ~low, medium,and high! are based on f lipping quartiles during the period January 1993through May 1995. We use the same quartile breaks for the June 1995 throughDecember 1995 subset of data. As can be seen in Panel B of Table VI, thef lipping-return relationship is robust across subsamples and the out-of-sample period.
On average, the low f lipping group provides the greatest average returnover time and the high f lipping group provides the lowest one-year excessreturns. For the original sample of 611 IPOs ~January 1993 through May1995!, the low f lipping quartile outperforms the high f lipping quartile by27.0 percentage points. For the out-of-sample period, the difference is 24.3percentage points. We conclude that the results presented in the main bodyof the paper are reasonably robust over time and are even predictive.
VI. Methodological Concerns and Momentum
We have demonstrated that IPOs with low levels of f lipping outperformIPOs with higher levels of f lipping. We have also demonstrated that coldIPOs continue to underperform and hot IPOs continue to do well in thefollowing year. However, to this point, we have only controlled for size in ourbuy-and-hold return analysis.
Lyon, Barber, and Tsai ~1997! support use of the Fama–French three-factor model using calendar time portfolios to estimate long-run abnormalperformance. This approach controls for the nonindependence of returns overtime, size, and book-to-market effects, and avoids the problem associatedwith drawing inferences on skewed long-horizon returns. We estimate thefollowing three-factor model:
rit 2 rft 5 aiT 1 biT RMRFt 1 siT SMBt
1 hiT HMLt 1 eit t 5 1,2, . . . ,T, ~4!
where rit is the monthly return on a portfolio of IPOs, rft is the monthlyreturn on three-month T-bills, RMRF is the excess return on a value-weighted aggregate market proxy, SMB is the difference in the returns of avalue-weighted portfolio of small stocks and large stocks, HML is the differ-ence in the returns of a value-weighted portfolio of high book-to-market stocksand low book-to-market stocks. The estimate of the intercept, aiT, provides atest of the null hypothesis that the mean monthly abnormal return on thecalendar portfolio is zero. The number of IPOs is not constant from month tomonth, thus we use weighted least squares to account for the time-varyingnumber of observations used to create the calendar portfolios. The calendarportfolios are value-weighted to minimize the impact of “bad model” prob-
IPO Mispricing and Flipping 1037
lems.15 Loughran and Ritter ~1998! argue that multifactor model regressionsmay actually induce bias against finding abnormal returns when they are infact present, especially when the target population comprises small stockslike typical IPOs.
Additionally, Jegadeesh and Titman ~1993! and Carhart ~1997!, amongothers, have shown momentum in stock returns to be a significant factor inexplaining performance. Therefore we include PR1YR, a factor-mimickingportfolio for return momentum.16 Finally, to control for the effect of hot ver-sus cold IPO markets ~IPO momentum!, we construct a fifth factor. We de-fine IPOMOM for a month as the median change from the midpoint of theinitial filing range to the final offer price for all IPOs issued in the priormonth. This variable is a proxy for the level of pre-issue excess demand inIPO underwriting. We estimate the following five-factor model that controlsfor both general equity momentum and IPO momentum:
rit 2 rft 5 aiT 1 biT RMRFt 1 siT SMBt 1 hiT HMLt
1 piT PR1YRt 1 miT IPOMOMt 1 eit t 5 1,2, . . . ,T. ~5!
For each calendar month, we calculate the value-weighted return ~weighedby the offering proceeds! on a portfolio composed of all firms that went pub-lic during the previous 12 months ~and, separately, during the last sixmonths!.17 For example, construction of the 12-month portfolio for January1994 includes the return on all IPOs issued in January 1993 through De-cember 1993 inclusive. We calculate a time series of monthly portfolio re-turns. The time series of monthly portfolio excess returns ~portfolio returnless the risk-free rate! is regressed on the five factors above. The model iscalculated for the full sample of IPOs for January 1988 through December1995 and for the subperiod January 1993 through December 1995 ~the pe-riod with TAQ data available!. We partition the portfolios based on f lippingquartiles and opening day performance. Regression results are presented inTable VII.
For the period 1988 to 1995, hot IPOs, those with first-day returns greaterthan 10 percent and less than 60 percent, generate small positive excessreturns. The inclusion of momentum terms in the regression, however, ren-
15 Fama and French ~1993, 1996! document that three-factor models have systematic prob-lems explaining the average returns on categories of small stocks. Value weighing is used toavoid giving more weight to small stocks.
16 PR1YR is defined as the equal-weight average of firms with the highest 30 percent re-turns lagged one month minus the equal-weight average of firms with the lowest 30 percentreturns lagged one month. The four factors, RMRF, SMB, HML, and PR1YR, are provided byMark Carhart.
17 The calendar-time regressions capture excess returns starting on the first day of the monthfollowing the month of the IPO. Returns between the offering date and the end of the firstmonth are not incorporated in this analysis.
1038 The Journal of Finance
ders the abnormal performance of hot IPOs insignificant in value-weightedportfolios. ~In equal-weighted portfolios, the abnormal performance is sig-nificant.! Thus, equity momentum appears to explain some of the perfor-mance of hot IPOs. However, the extra-hot IPOs ~those with first-day returnsgreater than 60 percent! generate significantly negative abnormal returns.For the 6-month and 12-month portfolios, extra-hot IPOs underperform bytwo to three percentage points per month. The majority of this underperfor-mance is not generated in the first six months but in months seven through12 following the IPO.
Consistent with the results in Section IV, the low f lipping quartile port-folio provides significant positive excess returns in the calendar time regres-sions. Interestingly, neither the general momentum nor the IPO momentumfactors are significant in the regressions. In the six-month portfolio, the lowf lipping group provides positive abnormal returns of 1.6 percent per month.In each model specification, the abnormal return or “alpha” of the low f lip-ping portfolio is statistically significantly higher than that of the mediumflipping quartile portfolio. We conclude that informed institutional investorsappear to execute a profitable trading strategy, f lipping IPOs that performthe worst in the future.
VII. Discussion and Conclusion
We begin this paper with the observation that there is considerable vari-ance in the first-day returns of IPOs. Furthermore, this variance and theassociated trading activity predict returns for the next year. This begs animportant question: Are underwriters intentionally mispricing IPOs?
The partial adjustment phenomenon appears to be pervasive in the finan-cial markets, as it is in most human behavior. As shown here and in Hanley’s~1993! study, underwriters fail to fully adjust their estimates of a firm’s valuewhen they price a security relative to the preliminary price range ~the pricetalk!. There are plausible explanations for this partial adjustment. In the caseof cold IPOs, it is clear that underwriters have a difficult time “building thebook” of committed investors. We observe substantial f lipping by uncommit-ted investors in these IPOs. We suggest that at least two factors are at workin cold IPOs. First, having overestimated the price associated with adequatedemand in the preliminary price range, underwriters are unable to adjust com-pletely to the new lower demand information because of their prior pricing “com-mitments.” An important factor an IPO firm weighs in choosing an underwriteris: What price will the underwriter get for my stock? A cold IPO often resultsfrom an issuing firm’s unwillingness to accept a price lower than that “prom-ised” in the price talk. In these cold deals, if the underwriting is consummated~and these are the only ones we observe!, it is due to the marketing muscle ofthe underwriting firm which ostensibly drums up marginal buyers to com-plete the “book.” Thus, on average, the IPO firm and its original shareholderswin at the expense of new investors.
IPO Mispricing and Flipping 1039

Table VII
Calendar Time Portfolio RegressionsWeighted least squares regressions are run for all IPOs for the 1993 to 1995 and 1988 to 1995 horizons. Monthly return alphas are calculated for12-month calendar time portfolios. These are calculated by regressing the monthly return of all IPOs issued within the preceding 12 months on threeand five factors. We also provide the alpha intercept from identical regressions run on six-month calendar time portfolios that contain all IPOs is-sued within the preceding six months. Returns are included beginning in the first calendar month after the IPO. The dependent variable in theregressions is the portfolio return less the risk-free T-bill rate, the independent variables are the excess return on the market portfolio ~Rm 2 Rf !,SMB is the difference in returns of a value-weighted portfolio of big and small stocks, HML is the difference in returns of a value-weighted portfolioof high book-to-market and low book-to-market stocks, PR1YR is a factor mimicking portfolio for one-year return momentum, and IPOMOM is themedian change from the midpoint of the initial filing range to the offer price for all IPOs in the preceding month. Portfolios are then partitioned byf lipping and opening-day performance groups. The low f lip portfolio contains the first quartile, medium flip contains the interquartile range, andhigh f lip contains IPOs in the highest quartile of f lippers. Cold IPOs are defined as those with a first-day return of 0 percent or less and extra-hotIPOs as those with a first-day return greater than 60 percent. The partitions of cool and hot are split at 10 percent. t-statistics are contained inparentheses. F-tests for the equality of regression intercepts across models are presented in the bottom panel.
Panel A: Calendar Time Regression Estimations
12-Month Calendar Time Portfolios
Intercept Rm 2 Rf SMB HML PR1YR IPOMOM Adj. R26-MonthIntercept
All IPOs 1993–1995 0.257 1.393 0.828 20.553 0.88 0.565~0.91! ~11.90! ~5.24! ~22.91! ~1.34!
0.252 1.389 0.818 20.564 20.037 0.025 0.89 0.491~0.78! ~11.63! ~4.94! ~22.89! ~20.28! ~0.59! ~1.01!
Low flip portfolio 0.816*** 1.407 0.665 20.909 0.83 1.582***~2.23! ~9.20! ~3.17! ~20.36! ~2.78!
0.858** 1.403 0.633 20.937 20.124 0.039 0.84 1.502***~2.06! ~9.05! ~2.92! ~23.69! ~20.71! ~0.70! ~2.26!
Medium flip portfolio 20.074 1.426 1.024 20.450 0.85 0.146~20.21! ~9.88! ~5.33! ~21.93! ~0.30!
20.008 1.418 0.987 20.473 20.126 0.037 0.85 0.205~20.02! ~9.70! ~4.93! ~22.00! ~20.77! ~0.70! ~0.37!
High f lip portfolio 0.406 1.242 0.650 20.596 0.69 0.615~0.88! ~6.45! ~2.45! ~21.90! ~0.95!
0.247 1.244 0.696 20.568 0.165 0.000 0.69 0.389~0.47! ~6.34! ~2.52! ~21.77! ~0.76! ~0.00! ~0.52!
1040T
he
Jou
rnal
ofF
inan
ce

All IPOs 1988–1995 0.305 1.336 1.007 20.361 0.88 0.736***~1.50! ~18.81! ~12.27! ~23.98! ~2.85!
0.246 1.333 1.025 20.361 0.0333 0.018 0.88 0.711***~1.10! ~18.55! ~10.87! ~23.68! ~0.37! ~0.71! ~2.47!
Cold IPO portfolio 0.170 1.244 1.098 20.032 0.72 0.906**~0.54! ~11.52! ~8.64! ~20.23! ~2.14!
0.272 1.253 1.042 20.069 20.112 20.002 0.73 0.970**~0.79! ~11.46! ~7.14! ~20.46! ~20.80! ~20.05! ~2.09!
Cool IPO portfolio 0.199 1.241 0.949 20.212 0.73 0.578~0.68! ~12.19! ~7.75! ~21.60! ~1.60!
0.168 1.239 0.961 20.208 0.024 0.007 0.73 0.746*~0.52! ~11.98! ~6.95! ~21.43! ~0.18! ~0.19! ~1.90!
Hot IPO portfolio 0.544* 1.474 1.054 20.671 0.85 1.049***~1.95! ~14.87! ~9.57! ~25.37! ~2.74!
0.322 1.459 1.162 20.612 0.198 0.026 0.85 0.747*~1.05! ~14.73! ~9.10! ~24.57! ~1.63! ~0.72! ~1.70!
Extra-hot IPO portfolio 21.917* 1.896 0.988 21.936 0.60 21.354~21.87! ~4.65! ~2.26! ~23.88! ~20.85!
22.423** 1.848 1.030 21.977 0.166 0.155 0.61 22.492~22.02! ~4.45! ~2.17! ~23.82! ~0.36! ~0.99! ~21.34!
Panel B: Tests for Equality of 12-Month Regression Intercepts
3-Factor Model 5-Factor Model
F-value p-value F-value p-value
H0: Flipping: low 5 medium 5 high 2.649 ~0.0745! 2.131 ~0.1213!
H0: Day 1 return: cold 5 cool 5 hot 5 extra-hot 1.736 ~0.1600! 2.456 ~0.0636!
*, **, *** Indicates significance at the 10, 5, and 1 percent levels, respectively.
IPO
Mispricin
gan
dF
lipping
1041

Capital markets specialists at investment banks suggest a second, lessintuitive reason for the partial price adjustment to low demand signals. Theysuggest that lowering the price during the pricing process may actually lessen,rather than increase, demand for shares.18 This counterintuitive result isconsistent with positive feedback investment strategies wherein investorsform extrapolative expectations; they buy when prices rise and sell whenprices fall ~DeLong et al. ~1990!!.
It is more puzzling why new issues are often underpriced by huge amounts.We report that 12 percent of IPOs open for trading up more than 30 percentfrom the offer price. It is clear that these over-heated IPOs open at a pre-mium considerably higher than is targeted for most underwritings and thatthe IPO firm and its previous shareholders receive substantially less ~byselling at the offer price! than immediate fair value for their shares. Thoughindications of interest from institutional investors are not publicly disclosedby underwriters, the financial press regularly reports that these extra-hotIPOs are oversubscribed by 10 or more times the shares being offered. Weconjecture that the resulting ~substantial! underpricing in these hot deals isintentional. Underwriters rarely raise the price enough in extra-hot deals tolessen the excess demand. It is unclear why or if firms that are substantiallyunderpriced ~and “leave millions on the table”! do not find the means topunish underwriters who insufficiently adjust the final offer price of theirshares. Dunbar ~1999! suggests that underwriters are punished by sub-sequent loss of underwriting market share. However, the loss of future mar-ket shares does not compensate the IPO firm for money left on the table.This appears to be a fruitful topic for further research.
Again, investment banking professionals offer a more complex story forwhy they do not raise the offering prices of what are obviously extra-hotdeals. Price maximization ~for the IPO firm! is important, but it is not theunique goal. A common goal of both the underwriter and the IPO firm is toattract well known and informed institutions as buy-and-hold purchasers ofthe offering. Underwriters claim that by raising the offer price more thanabout 20 percent above the original price range, their ability to attract thedesired set of investors is compromised. In fact, they claim that ex postextra-hot deals usually obtain from “irrational” retail demand ~by small in-vestors! rather than institutional purchases ~at levels of 50 percent or higherthan the offer price!. Conversations with portfolio managers at several well-known investment management firms confirm these claims and support ourfinding that extra-hot deals have the lowest proportion of block trades ~as apercentage of all trades on the first day!.
Finally, we conclude that f lipping of IPOs is rational behavior. That is,f lippers quickly sell issues that perform the worst in the future ~often withthe benefit of underwriter price support that minimizes their exposure tolosses!, and they sell less in the best future performing issues. The evidence
18 We acknowledge and greatly appreciate conversations with senior officials at GoldmanSachs and Morgan Stanley.
1042 The Journal of Finance
suggests that either ~1! institutional investors have superior informationrelative to the underwriter regarding IPO quality ~for they collectively ap-pear to execute a profitable trading strategy on the first day! or ~2! under-writers intentionally under- and overprice IPOs without immediate measurablepenalties. We conjecture that the latter is more likely.
This study also suggests a profitable trading strategy in IPOs—namely,IPOs with positive ~but not too positive! returns and with relatively lowsell-motivated block trading activity on the first day outperform other IPOsover the next year.
REFERENCES
Aff leck-Graves, John, Shantaram Hegde, and Robert E. Miller, 1996, Conditional price trendsin the aftermarket for initial public offerings, Financial Management 25, 25–40.
Asquith, Daniel, Jonathan D. Jones, and Robert Kieschnick, 1998, Evidence on price stabiliza-tion and underpricing in early IPO returns, Journal of Finance 53, 1759–1773.
Atkins, Allen B., and Edward A. Dyl, 1997, Market structure and reported trading volume:Nasdaq versus the NYSE, Journal of Financial Research 20, 291–304.
Benveniste, Lawrence M., and Paul A. Spindt, 1989, How investment bankers determine theoffer price and allocation of new issues, Journal of Financial Economics 24, 343–361.
Bernard, Victor L., and Jacob J. Thomas, 1989, Post-earnings-announcement drift: Delayedprice response or risk premium?, Journal of Accounting Research 27, 1–36.
Bernard, Victor L., and Jacob J. Thomas, 1990, Evidence that stock prices do not fully ref lectthe implications of current earnings for future earnings, Journal of Accounting and Eco-nomics 13, 305–340.
Brav, Alon, and Paul A. Gompers, 1997, Myth or reality? The long-run underperformance ofinitial public offerings: Evidence from venture and nonventure capital-backed companies,Journal of Finance 52, 1791–1821.
Canina, Linda, Roni Michaely, Richard Thaler, and Kent L. Womack, 1998, Caveat compounder:A warning about using the CRSP equal-weighted index, Journal of Finance 53, 403–416.
Carhart, Mark M., 1997, On persistence in mutual fund performance, Journal of Finance 52,57–82.
Carter, Richard B., and Frederick H. Dark, 1993, Underwriter reputation and initial publicoffers: The detrimental effects of f lippers, The Financial Review 28, 279–301.
De Long, J. Bradford, Andrei Shleifer, Lawrence H. Summers, and Robert J. Waldmann, 1990,Positive feedback investment strategies and destabilizing rational speculation, Journal ofFinance 45, 379–395.
Dimson, Elroy, and Paul Marsh, 1986, Event study methodologies and the size effect: The caseof UK press recommendations, Journal of Financial Economics 17, 113–142.
Dunbar, Craig G., 1997, Factors affecting investment bank initial public offering market share,Journal of Financial Economics, forthcoming.
Fama, Eugene F., 1997, Market efficiency, long-term returns, and behavioral finance, Workingpaper, University of Chicago.
Fama, Eugene F., and Kenneth French, 1993, Common risk factors in the returns on stocks andbonds, Journal of Financial Economics 33, 3–56.
Fama, Eugene F., and Kenneth French, 1996 Multifactor explanations of asset pricing anom-alies, Journal of Finance 51, 55–84.
Field, Laura C., 1995, Is institutional investment in initial public offerings related to long-runperformance of these firms?, Working paper, Pennsylvania State University.
Hanley, Kathleen Weiss, 1993, The underwriting of initial public offerings and the partial ad-justment phenomenon, Journal of Financial Economics 34, 231–250.
Hanley, Kathleen Weiss, Arun Kumar, and Paul J. Seguin, 1993, Price stabilization in themarket for new issues, Journal of Financial Economics 34, 177–197.
IPO Mispricing and Flipping 1043
Hanley, Kathleen Weiss, Charles M. Lee, and Paul J. Seguin, 1996, The marketing of closed-endfund IPOs: Evidence from transactions data, Journal of Financial Intermediation 5, 127–159.
Hanley, Kathleen Weiss, and William J. Wilhelm Jr., 1995, Evidence on the strategic allocationof initial public offerings, Journal of Financial Economics 37, 239–257.
Ikenberry, David, Josef Lakonishok, and Theo Vermaelen, 1995, Market underreaction to openmarket share repurchases, Journal of Financial Economics 39, 181–208.
Jegadeesh, Narasimhan, and Sheridan Titman, 1993, Returns to buying winners and sellinglosers: Implications for stock market efficiency, Journal of Finance 48, 65–91.
Kahneman, Daniel, Paul Slovic, and Amos Tversky, 1982, Judgment under Uncertainty: Heu-ristics and Biases ~Cambridge University Press, New York, N.Y.!.
Krigman, Laurie, 1997, The impact of trading protocol on reported volume and empirical mea-sures of liquidity, volatility and execution cost, Unpublished Ph.D. dissertation, Universityof Colorado.
Lee, Charles M. C., and Mark Ready, 1991, Inferring trade direction from intraday data, Jour-nal of Finance 46, 733–746.
Levis, Mario, 1993, The long-run performance of initial public offerings: The UK experience1980–1988, Financial Management 22, 28–41.
Loughran, Tim, and Jay R. Ritter, 1995, The new issues puzzle, Journal of Finance 50, 23–51.Loughran, Tim, and Jay R. Ritter, 1998, Uniformly least powerful tests of market efficiency,
Unpublished manuscript, University of Florida.Lyon, John D., Brad M. Barber, and Chih-Ling Tsai, 1999, Improved methods for tests of long-
run abnormal stock returns, Journal of Finance 54, 165–201.Maher, Philip, 1990, Winning the war on f lippers has brokers howling in pain, Investment
Dealers Digest 56, 6–7.Michaely, Roni, and Wayne H. Shaw, 1994, The pricing of initial public offerings: Tests of adverse-
selection and signaling theories, The Review of Financial Studies 7, 279–319.Michaely, Roni, and Wayne H. Shaw, 1998, Underwriter choice, institutional holdings, and fu-
ture IPO performance, Advances in Quantitative Analysis of Finance and Accounting 6,137–150.
Michaely, Roni, Richard Thaler, and Kent L. Womack, 1995, Price reaction to dividend initia-tions and omissions: Overreaction or drift?, Journal of Finance 50, 573–608.
Pratt, Tom, 1994, Book-entry IPO tracking said to expose f lippers, Investment Dealers’ Digest50, 12.
Ritter, Jay, 1991, The long-run performance of initial public offerings, Journal of Finance 46,3–27.
Rock, Kevin, 1986, Why new issues are underpriced, Journal of Financial Economics 15, 187–212.
Ruud, Judith S., 1993, Underwriter support and the IPO underpricing puzzle, Journal of Fi-nancial Economics 34, 135–151.
Slovic, Paul, and Sarah Lichtenstein, 1971, Comparison of Bayesian and regression approachesto the study of information processing in judgment, Organizational Behavior and HumanPerformance 6, 649–744.
Womack, Kent L., 1996, Do brokerage analysts’ recommendations have investment value?, Jour-nal of Finance 51, 137–167.
1044 The Journal of Finance