the phase behavior and synthesis of mesostructured coupled semiconductor thin films ... ·...
TRANSCRIPT

THE PHASE BEHAVIOR AND SYNTHESIS OF
MESOSTRUCTURED COUPLED SEMICONDUCTOR THIN
FILMS: MESO-CdS-TiO2
A THESIS
SUBMITTED TO THE DEPARTMENT OF CHEMISTRY
THE INSTITUTE OF ENGINEERING AND SCIENCES
OF
BILKENT UNIVERSITY
IN PARTIAL FULFILLMENT OF THE
REQUIREMENTS FOR THE DEGREE
OF
MASTER OF SCIENCE
By
HALĠL ĠBRAHĠM OKUR
JULY 2009
ii
I certify that I have read this thesis and in my opinion it is fully adequate, in scope
and quality, as a thesis of the degree of Master of Science
_____________________________________
Prof. Dr. Ömer DAĞ (Supervisor)
I certify that I have read this thesis and in my opinion it is fully adequate, in scope
and quality, as a thesis of the degree of Master of Science
_____________________________________
Prof. Dr. Engin AKKAYA
I certify that I have read this thesis and in my opinion it is fully adequate, in scope
and quality, as a thesis of the degree of Master of Science
_____________________________________
Assoc. Prof. Dr. Margarita KANTCHEVA

iii
I certify that I have read this thesis and in my opinion it is fully adequate, in scope
and quality, as a thesis of the degree of Master of Science
_____________________________________
Assoc. Prof. Oğuz GŰLSEREN
I certify that I have read this thesis and in my opinion it is fully adequate, in scope
and quality, as a thesis of the degree of Master of Science
_____________________________________
Asst. Prof. Dr. Erman BENGŰ
Approved for the Instıtute of Engineering and Sciences
______________________________
Prof. Dr. Mehmet BARAY
Director of Institute of Engineering and Sciences

iv
ABSTRACT
THE PHASE BEHAVIOUR AND SYNTHESIS OF
MESOSTRUCTURED COUPLED SEMICONDUCTOR THIN
FILMS: MESO-CdS-TiO2
HALĠL ĠBRAHĠM OKUR
M.S. in Chemistry
Supervisor: Prof. Dr. Ömer DAĞ
JULY 2009
Mesostructured [Cd(H2O)4](NO3)2 - titania - P123
((PEO)20(PPO)70(PEO)20, PEO = -OCH2CH2-, PPO = -OCH(CH3)CH2-) materials
have been investigated by changing the [Cd(H2O)4](NO3)2 and titania content of the
structures. This has been achieved by making thick samples by casting and thin film
samples by spin coating of a butanol solution of [Cd(H2O)4](NO3)2, P123, nitric acid
and Ti(OC4H9)4. The film samples are named as meso-xCd(II)-yTiO2, where x is the

v
Cd(II)/P123 and y is TiO2/P123 mole ratios. Increasing the titania amount in the
media has transformed the samples from LC-like to soft and then to rigid
mesostructured materials. Changing the amount of [Cd(H2O)4](NO3)2 salt in the
media only influenced the mesostructure, such that no change on the mechanical
properties is observed. However, the synthesis of rigid mesostructured titania
materials required controlled humidity. The rigid film samples were prepared first by
spin coating and then by aging under a 50% humidity oven.
The mesostructure remains stable upon H2S reaction, in the soft and rigid
materials region. However, only rigid samples stand to removal of nitrates from the
media that is important to keep the CdS nanoparticles stable in or on the pore walls
of mesostructured film samples. The phase behavior of the meso-Cd(II)-TiO2, the
structural properties of the meso-xCdS-yTiO2 samples, coordination and elimination
of the NO3- ions and the particle size of the CdS nanocrystallites were investigated
using diffraction (XRD), spectroscopy (FT-IR, Raman and UV-Vis absorption, EDS)
and microscopy (POM, SEM, and TEM) techniques.
Keywords: Phase diagram, Pluronics, Transition Metal Complexes, Titania,
Mesostructured and Mesoporous Titania, CdS Nanoparticles, Thin Films.

vi
ÖZET
ĠKĠ YARI ĠLETKEN ĠÇEREN MEZOYAPILI ĠNCE FĠLMLERĠN
FAZ DAVRANIġI VE SENTEZĠ: MESO-CdS-TiO2
HALĠL ĠBRAHĠM OKUR
Kimya Bölümü Yüksek Lisans Tezi
Tez Yöneticisi: Prof. Dr. Ömer Dağ
Temmuz 2009
Bu çalışmada mezoyapılı [Cd(H2O)4](NO3)2 – titanyum dioksit - P123
sörfektant ((PEO)20(PPO)70(PEO)20, PEO = -OCH2CH2-, PPO = -OCH(CH3)CH2-)
malzemeler; [Cd(H2O)4](NO3)2 ve titanyum dioksit içerikleri değiştirerek araştırıldı.
Bu [Cd(H2O)4](NO3)2, P123 ((PEO)20(PPO)70(PEO)20, EO= -OCH2CH2-, PO= -
OCH(CH3)CH2- ), nitrik asit ve Ti(OC4H9)4’den oluşan bütanol çözeltilerinin dövülü
kaplama yöntemiyle ince filmlerinin ve döküm yöntemiyle kalın filmlerinin
hazırlanmasıyla başarıldı. Film numuneler meso-xCd(II)-yTiO2 olarak adlandırıldı,
burada x Cd(II)/P123 ve y TiO2/P123 mol oranıdır.Ortamdaki titanyum dioksitin

vii
artırılası malzemelerin sıvı kristal gibi bir yapıdan, esnek malzemelere daha sonrada
daha sert mesoyapılı titanyum dioksit malzemelere dönüştürür. Ortamdaki
[Cd(H2O)4](NO3)2 tuz miktarının artırılması sadece mezoyapıyı değiştiriken,
mekanik özellikde hiçbir değişiklik gözlenmedi. Ancak mesoyapılı sert titanyum
dioksit malzemeler kontrollü nem ve sıcaklık ortamında üretilme gerektirir. Sert film
örnekleri önce dövülü kaplama yöntemiyle sonra nem fırınında %50 nem ortamında
bekletilerek hazırlandı.
Esnek ve Sert malzemelerde mezoyapı H2S reaksiyonundan sonrada devam
eder. Ancak, ortamdaki nitrat iyonlarının uzaklaştırılmasıyla sadece sert malzemeler
kararlı kalır, bu ise CdS, nanoparçacıklarının mesoyapılı film örneklerinin gözenek
duvarlarının içinde veya üstünde kararlı tutulmasında önemli bir gerekliliktir. Meso-
Cd(II)-TiO2’lerin faz davranışları, meso-xCdS-yTiO2 numunelerin yapısal özellikleri,
NO3- iyonlarının koordinasyonu ve uzaklaştırılması ve CdS nanokristallerinin
parçacık boyutları, Kırınım (XRD), Spektroskopi (FT-IR, Raman, UV-Vis soğurma,
EDS) ve mikroskopi (POM, SEM, ve TEM) teknikleri kullanılarak incelenmiştir.
Anahtar Kelimeler: Faz Diagramı, Pluronikler, Geçiş Metal Kompleksleri,
Titanyum Dioksit, Mezoyapılı ve Mezogözenekli Titanyum Dioksit, CdS
Nanoparçacıkları, Ġnce Filmler.

viii
ACKNOWLEDGEMENT
I would like to extend my gratitude to;
… Prof. Dr. Ömer Dağ for his encouragement and supervision throughout my
studies…
… my wife Hilal and my family, for their continuous support and help…
… my group members Cemal Albayrak, Altuğ S. Poyraz, Mustafa Sayın and
Yurdanur Türker for their help in this project…
… Past and present members of Chemistry Department; Fahri Alkan, Pınar Cönger,
Hacı Osman Güvenç, Fatih Genişel, Alper Kılıklı, Hikmet Sezen, Ġlknur Çayırtepe,
Eda Özkaraoğlu, Ġlknur Tunç, Sencer Selçuk, Mustafa Yılmaz for their friendship
during last 7 years…
…. the Science and Technical Research Council of Turkey (TŰBĠTAK) for the
financial support in the framework of the project 107T837…

ix
TABLE OF CONTENTS
1. INTRODUCTION……………………………………………………...……1
1.1 Porous Inorganic Materials……………………………………………….1
1.1.2 Mesoporous Silica Materials……………………………………3
1.1.3 The Non-Siliceous Mesoporous Materials……………………...6
1.1.3.1 Sol-Gel Process of Titania…………………………….7
1.1.3.2 Evaporation Induced Self Assembly (EISA)………….8
1.1.4 The Mesostrucutred Titania Materials…………………………10
1.2 Liquid Crystalline Templating (LCT) Approach………………………..14
1.2.1 Nitrate Ion and Coordination of Nitrate……………………….17
1.3 Nanoparticles…………………………………………………………….19
1.3.1 The CdS and CdSe semiconductors in mesoporous titania
system………………………………………………………..………21
2. EXPERIMENTAL…………………………………………………………24
2.1 Materials…………………………………………………………………24
2.2 Synthesis…………………………………………………………………24
2.2.1 Preparation of Titania Cadmium(II) Samples for Phase
Behavior……………………………………………………………..24
2.2.2 Synthesis of Cd(II) Modified Mesostructured Titania Films….25
2.2.3 Synthesis of CdS Nanoparticles in Mesostrucutred Titania…...26
2.3 Instrumentation…………………………………………………………..26

x
2.3.1 X-Ray Diffraction.......................................................................26
2.3.2 FT-IR Spectroscopy……………………………………………26
2.3.3 Raman Spectroscopy ………………………………………….27
2.3.4 UV-Vis Spectroscopy………………………………………….27
2.3.5 SEM and EDS………………………………………………….28
2.3.6 TEM……………………………………………………………28
2.3.7 Polarized Electron Microscope (POM)………………………..28
3. RESULTS AND DISCUSSION……………………………………………29
3.1.1 The Phase Behavior of the [Cd(H2O)4](NO3)2 / Titania / P123
system………………………………………………………………..29
3.1.2 Rigid Mesostrucutred Titania Materials……………………….43
3.1.3 The Nitrate Coordination of Titania…………………………...47
3.1.4 The Thermal Stability and Calcination ………………………..54
3.1.5 X-Ray Analysis………………………………………………..60
3.2.1 Synthesis of meso-CdS-TiO2 Couples…………………………65
3.2.2 The removal of NO3- ions from meso-Cd(II)-TiO2
samples…............................................................................................72
3.2.3 Stabilized meso-CdS-TiO2 samples…………………………...77
4. CONCLUSION……………………………………………………………..83
5. REFERENCES……………………………………………………………..86

xi
LIST OF TABLES
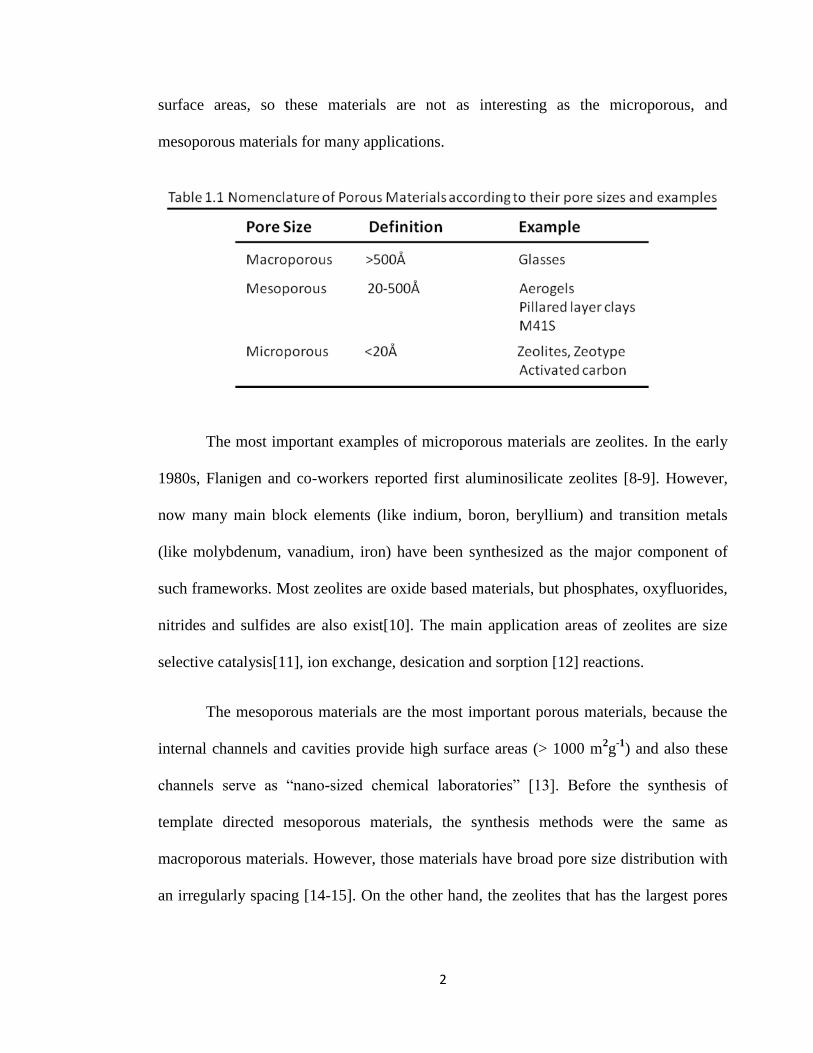
1.1 Nomenclature of Porous Materials according to their pore sizes and
examples………………………………………………………………………………2
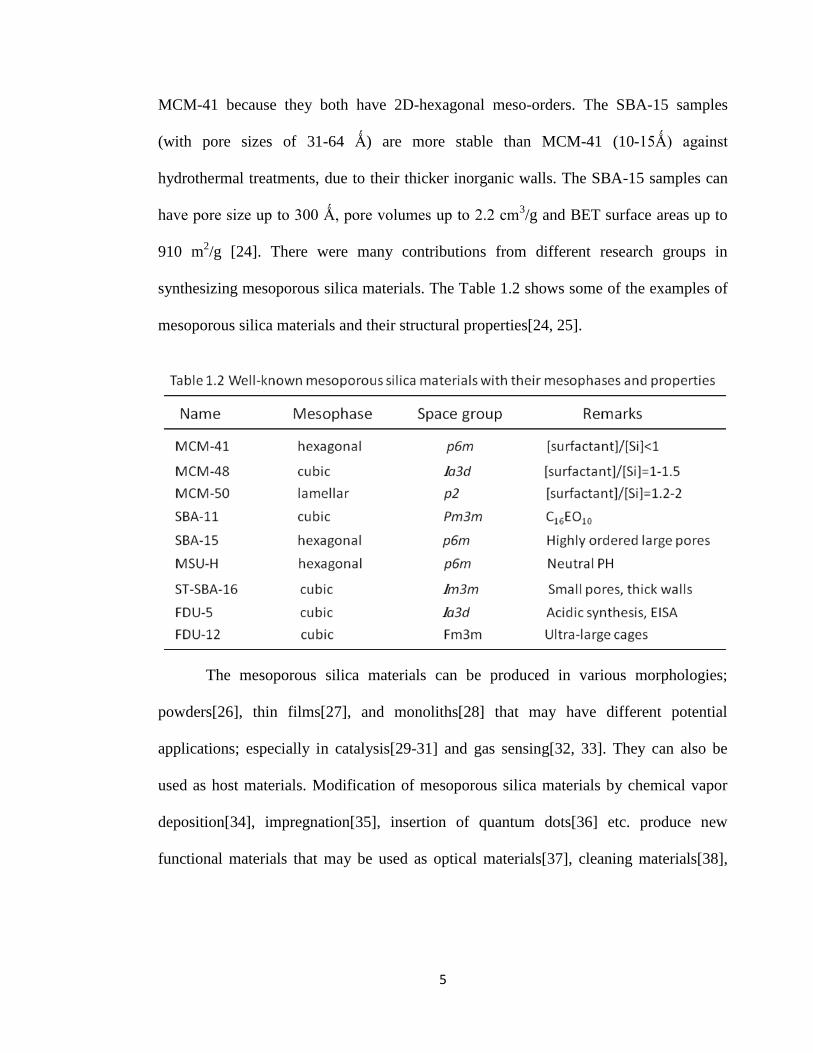
1.2 Well-known mesoporous silica materials with their mesophases and
properties……………………………………………………………………………...5
3.1.1 The first three diffraction lines and corresponding d- spacing of sample
prepared at ambient conditions……………………………………………………...62
3.1.2 The first three diffraction lines and corresponding d- spacing of sample
prepared under controlled 50% humidity at 30°C………………………………….64

xii
LIST OF FIGURES
1.1 Illustration of mesoporous M41S materials: a) MCM-41, bMCM-48, MCM-
50…...............................................................................................................................3
1.2 a) Schematically representing the stages of film formation by the EISA method.
b) Thickness evolution with time of mesostructured TiO2-F127 film; corresponding
2D-SAXS in situ images are also shown. c) Evolution of the volatile species as
determined by mass spectrometer for the same conditions………………………….10
1.3 Various types of surfactants……………………………………………………..14
1.4 a) Non-ionic surfactant micelle, b) pluronic surfactant micelle, c) Coordinated
water molecules of metal cations interacting with the etoxy groups of the surfactant
molecules through H-bonding……………………………………………………….16
1.5 a) Free nitrate, b) monodentate coordination, b) bidentate coordination, c) bridge
coordination of nitrate ion.(where N refers to nitrogen, O refers to oxygen and M
refers to a metal center)……………………………………………………………..19
1.6 Schematic representation of electron transfer from CdS and CdSe nanoparticles
to titania.(VB refers to valance band, CB refers to conduction band, λ1, λ2, λ3 are the
wavelengths of the light(energy) that is needed to produce an electron-hole pair.) ...22
3.1.1 A) A series of XRD patterns of fresh samples of the a) meso–0CdCl2-20TiO2,
b) meso–5CdCl2-20TiO2, and c) meso–10CdCl2-20TiO2. B) The XRD patterns, at
high angles of the a) fresh meso–10CdCl2-20TiO2, and b) 5 days aged meso–
10Cd(II)-20TiO2..........................................................................................................32
3.1.2 The POM images of the meso–10CdCl2-20TiO2 a) fresh, b) 1day aged, and c) 1
week aged thin film samples………………………………………………………...33
3.1.3 The small angle XRD patterns of the a) meso–5Cd(II) –10TiO2, b) meso–
8Cd(II)–10TiO2, c) meso–10Cd(II)–10TiO2, d) meso–13Cd(II –10TiO2, e) meso–
15Cd(II)–10TiO2, and f) meso–18Cd(II)–10TiO2.…………………………..………34

xiii
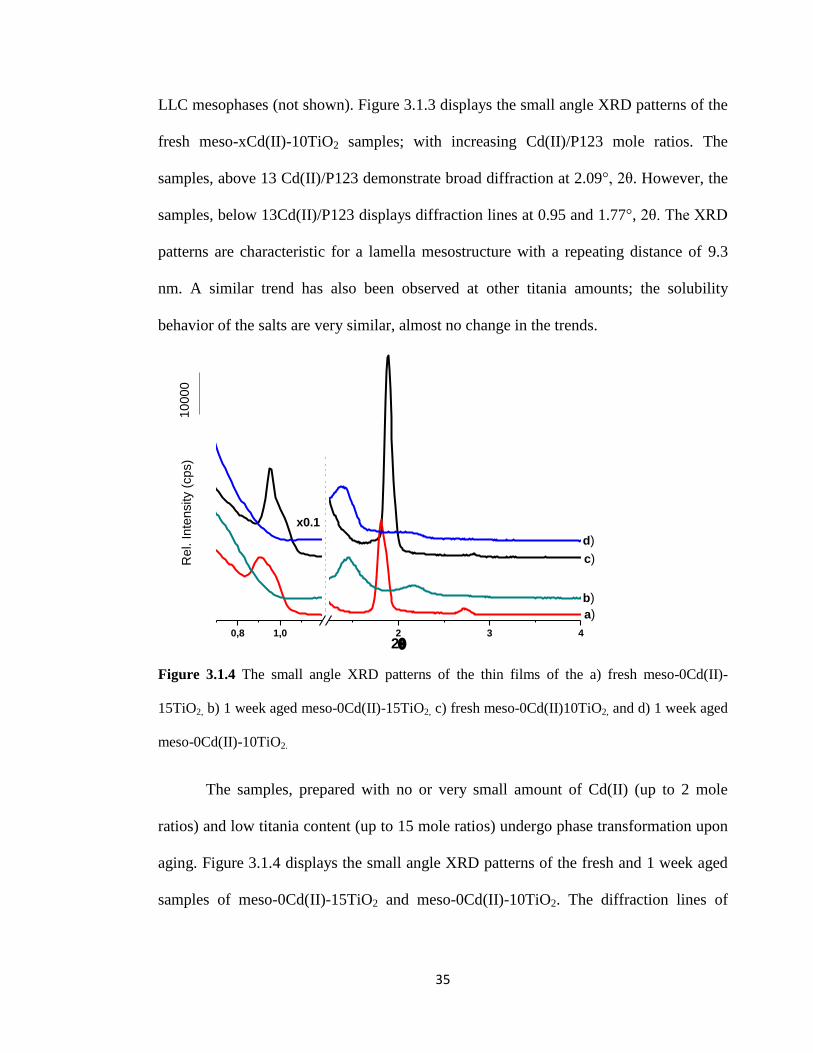
3.1.4 The small angle XRD patterns of the thin films of the a) fresh meso-0Cd(II)-
15TiO2, b) 1 week aged meso-0Cd(II)-15TiO2, c) fresh meso-0Cd(II)10TiO2, and d) 1
week aged meso-0Cd(II)-10TiO2................................................................................35
3.1.5 The small angle XRD patterns of fresh samples of the a) meso-2Cd(II)–12TiO2,
b) meso-4Cd(II)–12TiO2, c) meso-6Cd(II)–12TiO2, d) meso-8Cd(II)–12TiO2, e)
meso-10Cd(II)–12TiO2,and, f) meso-12Cd(II)–12TiO2…………………………….36
3.1.6 A) The photo of thick film sample of meso-4Cd(II)-28TiO2. B) The small angle
XRD patterns of the a) meso-2Cd(II)–24TiO2, b) meso-4Cd(II)–24TiO2, c) meso-
8Cd(II)–24TiO2, d) meso-10Cd(II)–24TiO2, and e) meso-12Cd(II)–24TiO2……….38
3.1.7 The POM images of the meso–4Cd(II)-24TiO2 a) fresh, b) scratched sample.
The inset displays a closer view of the scratched sample...........................................40
3.1.8 The small angle XRD diffraction patterns of the thin film sample of the a) fresh
meso-5Cd(II)–35TiO2, b) 1 day aged meso-5Cd(II)–35TiO2, c) 1 week aged meso-
5Cd(II)-35TiO2, d) fresh meso-8Cd(II)–35TiO2, and e) fresh meso-10Cd(II)–
35TiO2……………………………………………………………………………….41
3.1.9 The phase diagram of Cd(II), titania and p123 surfactant…………………..43
3.1.10 The small angle XRD patterns of the a) meso–4Cd(II) –60TiO2 aged at
ambient conditions at RT, and b) meso–4Cd(II)–60TiO2 aged at 30°C and %50
humidity for 12 hours………………………………………………………………..45
3.1.11 The small angle XRD diffraction patterns of the a) fresh sample of meso–
0Cd(II) –60TiO2, b) fresh sample of meso–2Cd(II)-60TiO2, c) fresh sample of meso–
5Cd(II)–60TiO2, d) fresh sample of meso–10Cd(II)–60TiO2, and e) fresh sample of
meso–13Cd(II)–60 TiO2…………………………………………………………….46
3.1.12 The FTIR spectra of a) the meso-0Cd(II)-60TiO2 prepared using HCl, and b)
the meso-0Cd(II)-60TiO2 prepared using HNO3. The inset is a FT-IR spectra of the
same sample in the 1050- 1150 cm-1
region………………………………………..47

xiv
3.1.13 The FT-IR spectra of the a) mesostructured titania prepared with HCl, b)
meso-2Cd(II)–60TiO2, c) meso–5Cd(II)–60TiO2, d) meso–10Cd(II)-60TiO2, and e)
meso–13Cd(II)–60 TiO2 samples……………………………………………………49
3.1.14 FT-IR spectra of the a) meso–2Cd(II)–40TiO2, b) meso–2Cd(II)–60TiO2, and
c) meso–2Cd(II)–80TiO2……………………………………………………………50
3.1.15 The UV-Vis spectrum of A) a) HCl-P123 mixture, b) HNO3-P123 mixture, c)
meso–5Cd(II)–0TiO2, d) meso–10Cd(II)–0TiO2, and e) meso–15Cd(II)–0TiO2, B) a)
HCl-P123 mixture, b) HNO3- P123 mixture, c) meso–0Cd(II)–5TiO2, and d) meso–
0Cd(II)–15TiO2……………………………………………………………………...51
3.1.16 The FT-IR spectra of the a) fresh sample of meso-0Cd(II)–20TiO2, b) 1day
aged sample, and c) 10 days aged sample…………………………………………...52
3.1.17 The FT-IR spectra of the a) meso-2Cd(II)-50TiO2 under room humidity and
room temperature for 12 hours, b) meso-2Cd(II)-50TiO2 under %50 humidity at
30°C for 12 hours, and c) meso-2Cd(II)-50TiO2 under %50 humidity at 30°C for 24
hours…………………………………………………………………………………54
3.1.18 A) The small angle XRD diffraction patterns of the A) meso-0Cd(II)-40TiO2
heated at a) fresh, b) 100°C, c) 200°C, and d) 300°C; B) meso-10Cd(II)-40TiO2
heated at a) fresh, b) 100°C, c) 200°C, and d) 300°C……………………………….55
3.1.19 The small angle XRD diffraction patterns of the A) meso-0Cd(II)-60TiO2
heated at a) fresh, b) 100°C, c) 200°C, and d) 300°C; B) meso-10Cd(II)-60TiO2
heated at a) fresh, b) 100°C, c) 200°C, and d) 300°C………………………………56
3.1.20 The FT-IR spectra of meso-4Cd(II)-60TiO2 sample throughout calcination
process; a) fresh, b) 100°C, c) 200°C, and d) 250°C………………………………..58
3.1.21 The TEM images of meso-10Cd(II)-60TiO2 sample a)calcinated to 200°C
(scale bar is 10 nm), b) calcinated to 300°C (scale bar is 50 nm)…………………...59
3.1.22 The FT-IR spectrum of the samples a) meso-2Cd(II)-12TiO2, b) meso-
6Cd(II)-12TiO2, c) meso-10Cd(II)-12TiO2………………………………….………63

xv
3.2.1 Plot of band gap shift (ΔEg) of CdS, obtained from equation 3.2.1, versus
particle size (Å). The inset is the same plot showing the regions used in this
thesis…………………………………………………………………………………66
3.2.2 A) The small angle XRD patterns of the a) fresh meso-5Cd(II)-5TiO2, b) fresh
meso-5CdS-5TiO2, c) fresh meso-10CdS-5TiO2, and d) fresh meso-10CdS-5TiO2. B)
The UV-Vis spectrum of the a) fresh meso-5Cd(II)-5TiO2 and fresh meso-5CdS-
5TiO2, b) fresh meso-10CdS-5TiO2 and fresh meso-10CdS-5TiO2………………...67
3.2.3 The small angle XRD diffraction lines of as prepared (top) and after H2S
reaction (bottom) of the samples a) meso-2Cd(II)-12TiO2, b) meso-4Cd(II)-12TiO2,
c) meso-6Cd(II)-12TiO2, d) meso-8Cd(II)-12TiO2, e) meso-10Cd(II)-
12TiO2……………………………………………………………………………….68
3.2.4 The UV-Vis spectra of the samples a) meso-2CdS-12TiO2, b) meso-4CdS-
12TiO2, c) meso-6CdS-12TiO2, d) meso-8CdS-12TiO2, and e) meso-10CdS-12TiO2.
The inset displays the UV-Vis spectra of the a) meso-2Cd(II)-12TiO2, b) meso-
2CdS-12TiO2, c) meso-4CdS-12TiO2, d) meso-6CdS-12TiO2, and e) meso-8CdS-
12TiO2……………………………………………………………………………….69
3.2.5 The small angle XRD diffraction lines of the samples fresh (top) and after
reaction (bottom) a) meso-2Cd(II)-24TiO2, b) meso-4Cd(II)-24TiO2, c) meso-
6Cd(II)-24TiO2, d) meso-8Cd(II)-24TiO2, e) meso-10Cd(II)-24TiO2…………...…71
3.2.6. The UV-Vis spectra of the meso-10CdS-20TiO2 sample throughout ageing; a)
as-synthesized, b) aged 2 days, c) aged 1 week, and d) a fresh meso-10Cd(II)-20TiO2
sample………………………………………………………………………….……72
3.2.7 The FT-IR spectra of A) the meso-2Cd(II)-20TiO2 heated to different
temperatures; a) as prepared, b) 50°C, c) 100°C, and d) 150°C, B) the meso-
10Cd(II)-20TiO2 heated to different temperatures; a) as prepared, b) 50°C, c) 100°C,
and d) 150°C, C) the meso-2Cd(II)-60TiO2 heated to different temperatures; a) as
prepared, b) 50°C, c) 100°C, and d) 150°C, and D) the meso-10Cd(II)-60TiO2,
heated to different temperatures; a) as prepared, b) 50°C, c) 100°C, and d)
150°C………………………………………………………………………………..73

xvi
3.2.8 The small angle XRD patterns of the a) as prepared meso-2Cd(II)-20TiO2, b)
meso-2Cd(II)-20TiO2 heated at 130°C, c) as prepared meso-2Cd(II)-60TiO2, d)
meso-2Cd(II)-60TiO2 heated at 130°C, e) as prepared meso-10Cd(II)-60TiO2, and f)
meso-10Cd(II)-60TiO2 heated at 130°C……………………………………………..75
3.2.9 The UV-Vis spectra of the meso-2Cd(II)-60TiO2 throughout heating process a)
as prepared, b) heated 2 hours at 130°C, and c) heated 4 hours at 130°C. The inset is
a UV-Vis spectra of the same sample in the 200-300 nm region……………………76
3.2.10 The small angle XRD diffraction patterns of the as prepared (top), 130°C
heated for 4 hours (middle), after H2S reacted (bottom) samples of a) meso-2Cd(II)-
60TiO2, b) meso-5Cd(II)-60TiO2, c) meso-10Cd(II)-60TiO2, and d) meso-13Cd(II)-
60TiO2…………………………………………………………………….…………78
3.2.11 The FT-IR spectrum of the A) meso-13Cd(II)-60TiO2 a) as-synthesized, b)
aged at 130°C, c) after H2S reactions; and B) meso-13CdS-60TiO2 sample
throughout ageing at ambient conditions at room temperature after H2S reaction a)
fresh, b) 1day aged, c) 3 days aged, d) 6 days aged…………………………………79
3.2.12 A) The EDS spectra of the a) bulk CdS, b) meso-2CdS-60TiO2, c) meso-
5CdS-60TiO2, d) meso-10CdS-60TiO2, and e) meso-13CdS-60TiO2; B) The plot of
the Cd/Ti mole ratios versus the S/Ti intensity ratios………………………………80
3.2.13 A) The high angle XRD diffraction pattern of meso-13CdS-60TiO2 thick
sample B) The UV-Vis spectrum of the meso-13CdS-60TiO2………………..…….81
3.2.14 The TEM images of the as-synthesized meso-10CdS-60TiO2 sample aged at
300°C with different resolutions; a) scale bar is 50 nm, b) scale bar is 5 nm, and c)
scale bar is 5 nm (red circles show crystalline domains)……………………………82

1
1. INTRODUCTION
Producing high surface area materials is an important challenge in chemistry and
a need in technology, because heterogeneous chemical reaction takes place on the
surface of substances. There are plenty of approaches to synthesize high surface area
materials. The synthesis of porous materials and nanoparticles are two main strategies
where the syntheses of these kinds of materials are still active research fields.
1.1 Porous Inorganic Materials
Porous materials are one of the strategies for synthesizing high surface area
materials. These porous inorganic materials have critical roles in a variety of
applications, and can be divided into three subgroups; i) macroporous with pore sizes
higher than 500 Å, ii) microporous with pore sizes smaller than 20 Å, and iii)
mesoporous materials, which are defined as inorganic solids with pore diameter sizes in
the range of 20 to 500 Å by the IUPAC[1]. Some properties of each type of the porous
materials are tabulated in Table 1.1[2].
Many different synthesis methods of ordered macroporous materials (pore size >
50 nm) have been developed using colloidal templates, such as; apolar droplets in a polar
solvent, like oil-water emulsions [3], vesicles [4], foams [5], polystyrene latex spheres in
a colloidal solution [6-7], etc. However, the macroporous materials have much lower
2
surface areas, so these materials are not as interesting as the microporous, and
mesoporous materials for many applications.
The most important examples of microporous materials are zeolites. In the early
1980s, Flanigen and co-workers reported first aluminosilicate zeolites [8-9]. However,
now many main block elements (like indium, boron, beryllium) and transition metals
(like molybdenum, vanadium, iron) have been synthesized as the major component of
such frameworks. Most zeolites are oxide based materials, but phosphates, oxyfluorides,
nitrides and sulfides are also exist[10]. The main application areas of zeolites are size
selective catalysis[11], ion exchange, desication and sorption [12] reactions.
The mesoporous materials are the most important porous materials, because the
internal channels and cavities provide high surface areas (> 1000 m2g
-1) and also these
channels serve as “nano-sized chemical laboratories” [13]. Before the synthesis of
template directed mesoporous materials, the synthesis methods were the same as
macroporous materials. However, those materials have broad pore size distribution with
an irregularly spacing [14-15]. On the other hand, the zeolites that has the largest pores

3
in the microporous materials known as cacoxenite, has 14 Ǻ channel openings, the other
zeolites like VPI-5[16] and cloverite [17] have pore size range between 8 and 13 Ǻ,
with an ordered pore structures. However, even these materials are not in the
mesoporous range. Furthermore, these zeolites also have drawbacks like thermal and
hydrothermal stabilities[10].
1.1.2 Mesoporous Silica Materials
The surfactant templated mesoporous materials were first synthesized by Mobil
Research and Development corporation in 1992by Kresge and coworkers [18] with a
variety of pore sizes, in the range of 15 Ǻ to 120 Ǻ, named as M41S family. The
members of this family were produced by silicates. The MCM-41 is the first reported
mesoporous silica material, which is assembled in a 2D hexagonal meso-order[18],
MCM-48 is a cubic and MCM-50 is a lamellar mesoporous silica materials, as shown in
the Figure 1.1. In 1995, thermodynamic investigation of MCM-41 was reported by
Navrotsky et al. [19].It was shown that the MCM-41 is only slightly less stable than
thermodynamically stable silica phase, which is α-quartz.
Figure 1.1 Illustration of mesoporous M41S materials: a) MCM-41, b) MCM-48, c) MCM-50
[24]

4
In a typical synthesis of M41S family, an appropriate amount of cationic
surfactant, cetyltrimetyl ammonium bromide (CTAB), a liquid molecular silica source,
tetraethylorthosilicate (TEOS), a base (sodium hydroxide) and water were used in well
optimized concentrations. The solution is aged between 24 to 144 hours usually at
100°C. The resulting precipitate is filtered, washed, dried and then calcined at 500°C in
order to remove surfactants to produce mesoporous materials[18]. This synthesis
inspired scientists to produce new mesostructured and mesoporous silicates and non-
silicate materials[20-22].
Many mesoporous silica materials, by using many different synthesis strategies,
have been investigated with different meso-orders. Stucky et al. introduced the “acid
prepared mesostructures” or SBA family[20]. In the synthesis of this new family, the pH
of the reaction medium was kept at around 2. Instead of an electrostatic interaction
between the anionic silicate species (in basic media) and cationic surfactants, like in
M41S family, the cationic silicate species assemble with cationic surfactants, through
interaction of both silica and surfactant with a counter anion[20]. In 1998, Stucky et al.
also demonstrated the mesoporous silica materials, which were produced using nonionic
surfactants (CnH2n+1(OCH2CH2)mOH) and pluronics (triblock poly(ethylene oxide)-
poly(propylene oxide)-poly(ethylene oxide) (PEOn-PPOm-PEOn) polymers) in acidic
media.[23]. This method has enabled to produce mesoporous materials with pore size
range of 20 Ǻ to 300 Ǻ.
The SBA family has improved properties compared to the M41S family. One of
the well-known members of SBA family is SBA-15, which can be comparable with
5
MCM-41 because they both have 2D-hexagonal meso-orders. The SBA-15 samples
(with pore sizes of 31-64 Ǻ) are more stable than MCM-41 (10-15Ǻ) against
hydrothermal treatments, due to their thicker inorganic walls. The SBA-15 samples can
have pore size up to 300 Ǻ, pore volumes up to 2.2 cm3/g and BET surface areas up to
910 m2/g [24]. There were many contributions from different research groups in
synthesizing mesoporous silica materials. The Table 1.2 shows some of the examples of
mesoporous silica materials and their structural properties[24, 25].
The mesoporous silica materials can be produced in various morphologies;
powders[26], thin films[27], and monoliths[28] that may have different potential
applications; especially in catalysis[29-31] and gas sensing[32, 33]. They can also be
used as host materials. Modification of mesoporous silica materials by chemical vapor
deposition[34], impregnation[35], insertion of quantum dots[36] etc. produce new
functional materials that may be used as optical materials[37], cleaning materials[38],

6
media for the synthesis of nanocrystals with controlled size and shape [39.40], and in
drug delivery systems [39].
1.1.3 The Non-Siliceous Mesoporous Materials
The mesoporous and mesostructured non-siliceous materials such as metal oxides
[41-43], or metal sulfides [44-47] are often of greater interest than silicates, due to
potential applications in catalysis, photocatalysis, sensing, optics and energy conversion,
etc. However, the synthesis of these materials is more difficult than silicates. There are
mainly six difficulties to overcome, two of them are the same as in silicates; i) the
polymerization of inorganic building blocks should be comparably slow to assemble
using surfactant templating, ii) the charge of the inorganic species should be either (+) or
(-) so the reaction has to occur in basic media (pH~13) or in acidic media (pH~1).The
four additional challenges are: i) the metal oxide precursors are much more reactive than
silica-based precursors [48], ii) the transition metal oxides tend to form closo structures
instead of fractial objects that can be formed in the case of silica [43,44], iii)the redox
reactions, phase transformations and crystallization may occur upon thermal treatments
which cause to collapse the mesostructured framework [48], and iv) the
reproducibility[49].
The first mesostructured transition metal oxide (TMO) was synthesized using a
well-known mesoporous silica preparation method [20]. However, these materials either
collapse upon thermal treatment [20, 50] or the pore walls are amorphous [51, 52]. The
stable mesostructured TMO materials were first synthesized by using Evaporation
Induced Self Assembly (EISA), which is originally established by Brinker and

7
coworkers for the synthesis of mesostructured silicate films [53]. Later, the thin films,
monoliths and membranes of mesostructured TMOs have also been synthesized using
volatile solvents (usually ethanol or buthanol) [53, 54] instead of water, different from
the original EISA method.
Among all of the mesostructured TMOs, the mesostructured titania materials
have a special interest due to its well known bulk and nanocrystalline properties[55].
Therefore many synthesis methods have been invented in last decade to synthesize stable
mesostructured titania. In order to understand the synthesis of mesostructured titania
better, the sol-gel process of titania and EISA need to be discussed in detail.
1.1.3.1 Sol-Gel Process of Titania
A sol is a colloidal solid suspension of solid particles (~1-1000 nm) in a liquid,
where the polymerization of colloidal solids produces a gel phase. The sol-gel processing
is a wet-chemical method, which is widely used in material science and ceramic
chemistry. The final structure in this process depends on various factors, such as
concentration of reagents, type of solvent, temperature, and pH. Uniform nano, micro
sized particles, fibers, xerogels, xerogel films, dense films, aerogels and dense ceramics
can be produced by this approach[56]. The sol-gel process has been intensely used in the
synthesis of mesostructured and mesoporous materials, especially in transition metal
oxides and silica chemistry. In this process; titanium alkoxides (Ti(OCnH2n+1)4) or
titanium chloride (TiCl4) are the inorganic precursors for titania, and silicon alkoxides
(Si(OCnH2n+1)4) for silica

8
In order to produce highly ordered mesoporous titania, the polymerization of the
titania precursor is one of the key steps. The polymerization starts with the hydrolysis of
the titania precursor as it contacts with water, even ambient humidity has enough water
to form Ti(OH)x(OR)y (x+y=4) species. The Ti-O-Ti bonds are formed immediately as
the hydrolysis takes place, as condensation and oxolation reactions[57]. These reactions
are shown below, equation 1 to 3. The rate of condensation must be comparable to the
rate of assembly of surfactants for high degree of meso-orders in a synthesis method.
Ti(OR)4 + 4 H2O Ti(OH)4 + 4ROH (Hydrolysis) (eq 1.1)
Ti(OH)4 TiO2(s) + 2H2O (Condensation) (eq 1.2)
Ti-OH + Ti-OR Ti-O-Ti + ROH (Oxolation) (eq 1.3)
1.1.3.2 Evaporation Induced Self Assembly (EISA)
Attard et al. performed for the first time, the polymerization of silica in a
lyotropic liquid crystalline media and introduced an alternative synthesis method, which
is known to be true liquid crystal templating (TLCT) for synthesis of the mesoporous
silica materials[28]. This approach increases the importance of the phase diagrams of
water/silica/surfactant system at higher surfactant concentrations. The TLCT method has
been also applied for the synthesis of metallic[58], and semiconductor[59] mesoporous
materials. The major drawback of this method is the inhomogeneity by either inadequate
diffusion of inorganic precursors, or uncontrolled phase separation of organic/inorganic
phases[60]. However, with the help of EISA, the TLCT becomes an important method in
9
synthesizing mesostructured TMO materials[20,49] and mesostructured and mesoporous
metals[61-63].
The EISA is another alternative synthesis method, where the initial concentration
of surfactant is much lower than critical micelle concentration. Throughout, the
evaporation of the solvent in the media, a controlled inorganic polymerization reaction
takes place, at the same time liquid crystalline phase also forms. This results an
accumulation of inorganic material in the hydrophilic domains of the liquid crystalline
phase, which dictates well-defined mesostructured materials. Figure 1.2a shows a
schematic representation of the formation of the mesostructure throughout ageing,
further Figure 1.2b shows the formation of the mesostructure in titania-F127 samples by
high resolution Small Angle X-ray Scattering (SAXS). Moreover, Figure 1.2c displays
the evaporation of the solvent throughout ageing process. The resulting materials are
quite flexible due to incomplete inorganic precursor polymerization; an additional
condensation step is needed to obtain a stable mesostructure.
The EISA is a milestone in the synthesis of mesostructured TMO materials.
Stucky’s group employed this approach by using ethanolic solutions of MCln metal
precursors (not salts) and pluronic surfactants (PEOn-PPOm-PEOn) as templates[64, 65].
The addition of metal chlorides to ethanol solution generates in situ HCl and metal
chloroalkoxy species in the solution. The generated HCl controls the high reactivity of
the metal precursors and stabilize the solution phase for slow condensation of
inorganics[41, 65]. The condensation of inorganic precursors prevailed by moisture or
impurities[66] during the EISA process. Again, this method is improved by replacing

10
highly reactive metal chlorides with less reactive metal alkoxides[64] and addition of
HCl to the media. With modification of the EISA methods, thin films, membranes and
monoliths have been produced[49, 64].
Figure 1.2 a) Schematically representing the stages of film formation by the EISA method. b)
Thickness evolution with time of mesostructured TiO2-F127 film; corresponding 2D-SAXS in
situ images are also shown. c) Evolution of the volatile species as determined by mass
spectrometer for the same conditions[60].
1.1.4 The Mesostructured Titania Materials
One of the most important mesostructured TMOs is mesostructured titania (TiO2)
due its unique electronic and optical properties, which provides potential applications in

11
energy conversion, chemical sensing, catalysis and photocatalysis[55]. Grätzel and
coworkers introduced nanocrystalline titania thin film electrodes that have thousand fold
increased photochemical response in photoelectrochemical cells due to increased surface
area[67, 68]. This fact attracted much attention on the synthesis of mesostructured titania
materials. In 1995, Ying and coworkers documented first titania-based mesoporous
materials(TMS-1) by using Ti(OR)4-n (acetylacetonate)n complex and anionic phosphate
surfactants in slightly acidic conditions (pH~3-6)[52]. Phosphate free wormlike
mesoporous titania materials were produced by using the same method and other organic
bidentate[69, 70] and even tridentate ligands[71]. The milestone for producing highly
ordered mesostructured titania materials is the application of a modified EISA to the
TMO system.
In a simple synthesis route, there are mainly six variables to deal with to achieve
highly ordered mesostructured titania materials: i) the choice of the template, ii) the
template/metal ion mole ratio, iii) the amount of water in the solution, iv) the solution
acidity, v) the temperatures during deposition and aging, and vi) the humidity of the
reaction medium[72]. Sanchez et al. introduced the importance of controlling relative
humidity(RH), which almost solves the reproducibility problem in mesostructured titania
materials[72]. Chmelka et al. introduced a volumetric fraction approach, which is very
beneficial in producing the mesostructure; lamellar, cubic or hexagonal silica and titania
materials, by controlling the volume fraction (Φ), which is defined as the ratio of
polymer volume to total of polymer and inorganic volume. Moreover, for P123
surfactant if the volume fraction is in between 0.61 and 0.75, lamellar, between 0.38 and

12
0.55, hexagonal, and between 0.29 and 0.36, the mesostructure is cubic[64]. Notice that
this is an increasing inorganic component of the mixture.
There are also different approaches to synthesize mesostructured titania materials
such that; Dag and coworkers introduced the solventless and acid free synthesis of
mesostructured titania with non-ionic ethylene oxide (C12EO10) surfactants. However
even the meso-order obtained in this approach, that can be further improved by
controlling the relative humidity of the media [73]. One of the milestones, in the
synthesis of mesostructured and mesoporous titania materials comes from the Ozin’s
group [49]. They have introduced buthanol as a solvent for the EISA process. The
buthanol instead of ethanol in the EISA, positively affects the micellization of P123 [74-
76] and contributes to the mesostructural organization at low P123/Ti ratios. The long
alkyl chain alcohols easily penetrate into the cores of micelles, poly(propylene oxide)
(PPO), because of its relatively high hydrophobic characters. The polar end of the
alcohol locate at the hydrophilic-hydrophobic interphase and swell the hydrophobic core
of the micelles, which also cause an increase in pore size of the mesostructure [77].
Moreover, 1-buthanol also provides extra stabilization to the titania precursors, upon
ageing the film samples, at 80% RH and 20°C; a hexagonal well ordered mesostructured
titania can be successfully synthesized. Calcinations of the film samples at 400°C with a
heating rate of 1°C/min yields thermally stable hexagonal mesoporous titania material

13
with crystalline pore-walls[49]. There are many contributions from many different
groups to mesostructured titania materials with different mesoorders:
hexagonal[49,64,78,79], cubic[64,80,81] and lamellar[64,79] within last 5 years. The
surfactant molecules can also be removed from the mesopores of these mesostructured
materials by: calcinations[42,49,80], solvent extraction[82, 83], or using photocatalytic
properties of titania by exciting titania with UV-light[82].
The as-synthesized mesostructured titania materials, which have amorphous
titania pore walls is not as interesting as the other crystalline phases of titania that are
anatase, rutile and brookite. The anatase phase has large band gap energy and it has
suitable redox potentials for photocatalysis and photoelectronic applications[84-86].
Moreover, the rutile phase has high dielectric constant and high electrical resistance,
which has applications in electronics industry in power circuits, capacitors, and
temperature compensating condensers[87-89]. The macrocrystalline rutile is more stable
than the other phases, however; the nanoparticles below ca. 14 nm, the anatase phase is
more stable than rutile, because the thermodynamic stability is a particle size dependent
property[90, 91]. Therefore, in most of the mesoporous titania materials with crystalline
walls have anatase phase rather than rutile or brookite[90, 91].
Many different approaches have been employed to synthesize mesoporous
titania materials with crystalline walls. The major methods are direct calcination over
350°C under an air flow[49,64,78-81], NH3 treatment during calcination[92], super
critical CO2 and silica treated calcination[93], etc. In the calcination step, the heating

14
rate must be around 1°C/min in order to control crystallization of titania and to eliminate
the possibility of collapsing the mesoorder[49].
1.2 Liquid Crystalline Templating (LCT) Approach
There is another state of matter different from well-known solid, liquid and gas
phases, which has some properties of both liquid and solid states is called Liquid
Crystalline (LC) state. The molecules in the LC phase don’t have positional order in all
direction but have some orientational order[94, 95]. The LC are divided into two
categories due to formational properties; the thermotropic LCs, which are formed by
heating certain solid organics and inorganic compounds and the lyotropic liquid crystals
(LLC), which are formed as mixtures of a polar solvent and a kind of surfactant
molecule, which can be classified as anionic, cationic, amphoteric, and non-ionic based
on their head groups. Figure 1.3 shows examples of various surfactants.
Figure 1.3 Various types of surfactants.

15
The surfactant molecules consist of hydrophilic and hydrophobic parts, upon
dissolving in a polar solvent; the hydrophobic parts tend to stay away from polar solvent.
As increasing the concentration, the surfactant molecules assemble due to weak
intermolecular forces such as van der Waals, dipole-dipole interactions and hydrogen
bonding in order to form micelles. This concentration is also known as critical micelle
concentration. Further increasing surfactant concentration cause formation of other
mesophases such as; 2-D and 3-D hexagonal, cubic and lamellar phases[96], known as
LLC phases. The mesophases also response to changes in temperature, pH and salt ions
content[96-98] of the media.
After Attard and coworkers introduced the TLCT approach[28], the importance
of surfactant-water[76,100,101], surfactant-alcohol [101] binary and water-oil-surfactant
[77, 101] ternary phase diagrams has increased its importance. Because the silica
polymerization takes place in the hydrophilic domains of the LLC phase and transfers
the structure in the LLC into solid material[28]. This concept has been proved using a
mixture of 50 w/w % non-ionic surfactant (CnEOm) in water (2D hexagonal mesophase)
and tetrametylorthosilicate (TMOS, as a silica source) that form LLC phase in early
stage of the silica polymerization. Upon further polymerization of the silica in the media
resulted MCM-41 type hexagonal silica monoliths [28]. In this type of synthesis the
surfactant LLC media act as a mold, where the inorganic network polymerizes in the
aqueous domains of the mold.
The LLC mesophases can also be formed by aqua complexes of transition metal
salts with[97] or without a solvent[98,99]. In 2001, Dag et al. introduced a new LLC

16
phase from oligo(ethylene oxide) surfactants and [M(H2O)n]Xm transition metal
complexes[98]. The LLC phase forms by the hydrogen bonding between the coordinated
water molecules and oxygens of ethoxy groups of the oligo (ethyleneoxide) surfactants.
Figure1.4 shows a schematic representation of a micelle and hydrogen bonding network.
A large amount of transition metal salt can be dissolved in the new LLC phases, such
that the samples are stable for months up to 3.0 salt/surfactant mole ratios[98].
Figure 1.4 a) Non-ionic surfactant micelle, b) pluronic surfactant micelle, c) Coordinated water
molecules of metal cations interacting with the etoxy groups of the surfactant molecules through
H-bonding.
Dag et al. also showed that the new LLC phase exists for Pluronic surfactants
(PEOn-PPOm-PEOn)[104] with various transition metal aqua complexes [M(H2O)n]Xm

17
(where M= Co2+
, Ni2+
, Cd2+
, Zn2+
and Mn2+
and X= NO3-, Cl
-, ClO4
-)[97-99, 102-104].
The anions of the salts known as electrolytes also affect the structure of the LLC[105-
107]. The electrolytes affect the solubility of the surfactants and it is known as
Hofmeister’s effect. Hofmeister constituted a series with known ions according to the
effect on solubility of proteins. This effect is also valid for the solubility of
surfactants[108]. Anions on the left hand side of this series (shown below) are lyotropic
and make surfactant molecules more hydrophobic whereas; the anions on the right hand
side are hydrotropic and make surfactant molecules more hydrophilic. This means that
metal salts of lyotropic ions are less soluble in surfactant. Dag et al. show that the
Hofmeister’s series is not the only effective parameter in the solubility of transition
metal salt aqua complexes in the LLC mesophase by showing the transition metal nitrate
salts are more soluble than perchlorate salts, which contradicts with the series[102].This
deviation originates from the coordination of nitrate ion to metal ion center that plays an
important role in this behavior.
SO42-
>HPO42-
>CrO4->CO3
2->Cl
->Br
->NO3
->I
->ClO4
->SCN
-
1.2.1 Nitrate Ion and Coordination of Nitrate
The anion effect is not the only effect on the solubility of surfactants in presence
of transition metal salt aqua complexes. There is also coordination effect that is due to
the coordination of anions to the transition metal cations. Upon coordination, the ionic
strength of the solution and the ion density decreases that cause an increase in the
solubility of salts. The coordination interaction of NO3- ion causes equilibrium as
following. At low water concentrations, the equilibrium shifts to right and more nitrate
18
ions coordinate to the metal ion center. On the other hand, the perchlorate ion cannot
coordinate to transition metal ions, so it has higher ionic strength and lowers solubility in
the surfactants media or LLC phase[102].
[M(H2O)4]2+
+ 2NO3- [M(H2O)3(ONO2)]
+ +H2O + NO3
- (eq1.4)
The nitrate ions can be found in two different forms free or coordinated in the
media. The coordination of nitrate ion reduces the symmetry of the free NO3- ion from
D3h to C2v and Cs see Figure 1.5. This can be demonstrated using FT-IR spectroscopy
technique. A splitting occurs in the doubly degenerate asymmetric stretching mode of
NO3- ion upon coordination to a metal center[109]. The NO3
- ion can coordinate in 3
different ways, which are: monodentate, bidentate, and bridged. In the free ion, or in the
crystalline salt the asymmetric stretching mode is doubly degenerate and observed at
around 1360 cm-1
as a single peak. The splitting energy is between 120 and 160 cm-1
in
monodentate, between 160 and 210 cm-1
in bidentate, and above 210 cm-1
in bridge
coordinated nitrate ions in the LLC media[109]. Moreover, these coordinations can also
be monitored using Raman spectroscopy. The symmetric stretching mode of nitrate,
shifts from 1050 cm-1
to 1010-1030 cm-1
range upon coordination[109].

19
Figure 1.5 a) Free nitrate, b) monodentate coordination, b) bidentate coordination, c) bridge
coordination of nitrate ion.(where N refers to nitrogen, O refers to oxygen and M refers to a
metal center)
1.3 Nanoparticles
Nanoparticles exhibit physical and chemical properties different than its bulk
form. Therefore, the synthesis and characterization of nanoparticles enhance its
importance in both academic and industrial studies. There are two main properties of
nanoparticles: i) the high surface to volume ratio and ii) the quantum confinement effect.
The coordination of surface atoms in the nanoparticles are different than in bulk, because
of fewer nearest neighbors. The surface atoms have dangling bonds or unsaturated bonds
exposed to surface, which lead reactions. In bulk materials, the surface to volume ratio is
very small however, when 1.0 nm particles are considered, %30 of the atoms are on the
surface and %15 for 10 nm particles.
The quantum confinement effect (QCE) is another important property of
nanoparticles and it is observed, when the particle size is comparable with the
wavelength of electron wave function (exciton Bohr radius). Due to this effect, the
optical and electronic properties of nanoparticles change with size. The QCE is observed

20
in quantum dots, zero dimensional (0D), quantum wires (1D), and quantum sheets (2D).
The 1D quantum wires, where the size of 2 directions have a magnitude of exciton Bohr
radius whereas the third direction is free to move for the electrons, and 2D quantum
sheets, where only one direction is confined, if the size in this direction is smaller than
the exciton Bohr radius, where the other 2 directions are free, and 0D quantum dots,
where all directions are smaller than exciton Bohr radius, have the QCE due to potential
wells for electrons and excitons in all direction. The QCE for semiconductor
materials[110], and enhanced local field effect for metals[111] are observed in the
electronic properties of the nanoparticles.
The physical properties of nanocrystalline semiconductors are strongly
dependent on size and surface states. The most notable size effect is the blue shift in the
electronic emission and absorption spectra with decreasing particle size[113-116]. For
example, CdSe nanoparticles with different nanosizes have different colours, it is red in
color for 3.3 nm, orange for 2.9 nm, green for 2.0 nm and blue for 1.7 nm nanoparticles.
The bulk CdSe has a band gap of 1.75 eV that decreases with decreasing size of the
particles starting from around 11.2 nm (electron Bohr radius of CdSe). Moreover, the
melting point of the nanoparticles are also strongly dependent on the particle size and it
is lower than bulk[117].
Despite the new properties of nanoparticles there are still challenges to
overcome; i) the difficulties in controlling particle size and achieving uniform size
distributions, ii) the difficulties in controlling morphology and aggregation of
nanoparticles. iii) the high surface energy to overcome as a result of large surface to

21
volume ratio. Fortunately, covering nanoparticles with protective layers prevents
aggregation and stabilizes the high surface energy. Micro-emulsions[118],
polymers[119] and mono[120] or multilayer[121] films have been used for covering
nanoparticles. Another method is producing the nanoparticles in a confined space of a
solid matrix. The mesoporous materials are unique for the synthesis of nanoparticles in
the pores, which serve as “nano-sized chemical laboratories”[13, 34-36].
1.3.1 The CdS and CdSe semiconductors in mesoporous titania system
The mesoporous titania material with anatase crystalline walls has 3.2 eV band
gap and absorbs only the UV region of the sun light. In order to increase the absorption
efficiency of titania in the visible region, which is crucial in photocatalytic
applications[122], nanocrystals of semiconductor that absorb in the visible region can be
assembled together with the titania. The CdS and CdSe nanoparticles are the best
candidates for improving efficiency of visible light absorption, because the bulk band
gaps of both CdS and CdSe are in the visible region, 2.42 eV and 1.75 eV, respectively.
When the CdS and CdSe nanocrystals grow in mesopores of titania materials, an
electronic communication between nanocrystals and titania becomes possible[123]. The
electron transfer between the nanoparticles and titania are shown schematically in Fig
1.6.

22
Figure 1.6 Schematic representation of electron transfer from CdS and CdSe nanoparticles to
titania.(VB refers to valance band, CB refers to conduction band, λ1, λ2, λ3 are the wavelengths
of the light(energy) that is needed to produce an electron-hole pair).
There are mainly two ways of introducing nanoparticles in mesoporous systems.
One of them is nanocrystal growth in the mesopores, and the other one is first
synthesizing nanocrystals and immobilization into pores of the host materials. Stucky
and coworkers showed one pot synthesis of mesoporous titania and nanocrystalline CdS
and CdSe. They have demonstrated an increase in the visible light efficiency[124].In the
synthesis, the CdCl2 salt was used for Cd2+
ion source. The maximum amount of CdS
and CdSe produced is 10% mole ratio to tiania. Zhang et al. introduced a rapid
immobilization method for the incorporation of ca. 4.2 nm CdSe quantum dots into
mesoporous titania materials[125], where the yield of CdSe is only 3% mole ratio.
Therefore, the first approach yields higher loading of nanoparticles into the pores of the
host material[124].

23
In this thesis, we investigated the phase behavior of titania together with the
cadmium(II) nitrate tetrahydrate salt. In this system, the nitrate ions play important roles
by coordinations to both Cd2+
ions and titania clusters. Moreover, in higher titania
concentrations, by calcination of the samples, a rigid mesoporous material can be
synthesized in presence of much higher salt concentrations. Furthermore, H2S reactions
produce mesoporous CdS-titania thin films. The maximum amount of CdS in the
samples can be 25% mole ratio, which is a record amount in the literature. The phase
properties as a function of titania and [Cd(H2O)4](NO3)2 salts and the H2S reactions have
been investigated using X-ray diffraction(XRD), energy dispersive x-ray
spectrostrcopy(EDS), scanning electron microscopy(SEM), Fourier transform infrared
(FT-IR) spectroscopy, Raman spectroscopy, UV-Vis absorption spectroscopy, polarized
optical microscopy (POM), and transmission electron microscopy (TEM).

24
2. EXPERIMENTAL
2.1 Materials
All chemicals and solvents were reagent grade and used as received without any
further purifications or treatments.
The surfactant used throughout this study is P123, which is a triblock copolymer
PEO20-PPO70-PEO20 (PEO) = (CH2CH2O-, 30% w/w) and (PPO) = (CH(CH3)CH2O-,
70% w/w) with a molecular weight of 5750 g/mol. It is generously donated by BASF
Corp.
Other chemicals used in this thesis are: Cadmium(II) nitrate tetrahydrate
[Cd(H2O)4](NO3)2 (%98 Aldrich), titanium butoxide (Ti(OC4H9)4 (%98 Aldrich),
hydrogen sulfide (H2S, %99.5 Aldrich), hydrochloric acid (HCl, %37 Reidel-de Haën),
nitric acid (HNO3, %65 Reidel-de Haën) and 1-buthanol (C4H9OH, %99 Fluka).
2.2 Synthesis
2.2.1 Preparation of titania cadmium(II) samples for phase behavior
A desired amount of (between 0 to 0.55 g) [Cd(H2O)4](NO3)2 salt was dissolved
in 6 g of 1-butanol. 0.65g P123 was added to the solution that was stirred until all
surfactants are dissolved. The mixture is acidified with 0.37 g concentrated HNO3 and
then cooled in an ice-bath for 1.5 minutes. A desired amount of (between 0 to 3.04 g)
Ti(OC4H9)4 is added to the solution. The solutions were kept for 3 hours by constant

25
stirring in closed vials. The Ti(IV)/P123 (between 5 and 80) and Cd(II)/P123 (between 0
and 15) mole ratio have been changed over hundreds of samples to investigate the phase
properties of the thin films and monoliths
The thin film samples were prepared on soda-lime glass and silicon (100)
substrates by spin coating first at 500 rpm for 5 seconds then at 1500 rpm for 20
seconds. Monoliths were prepared by spreading 3 ml of above aged solution on plastic
trays. The samples were kept at ambient conditions at RT.
2.2.2 Synthesis of Cd(II) modified rigid mesostructured titania films
A desired amount of (0.07 g, 0.175 g, 0.35 g, 0.455 g, and 0.525 g)
[Cd(H2O)4](NO3)2 salt is dissolved in 6.0 g of 1-butanol. 0.65g P123 is added to the
above solution that is stirred until all surfactants are completely dissolved. Upon addition
of 1.0 g concentrated HNO3 to the solutions, they were cooled in an ice-bath for 1.5
minutes. Then, a desired amount of (1.52 g, 2.28 g, 3.04 g) a titania precursor,
Ti(OC4H9)4 is added to the mixture. The solutions were aged for 6 hours by constant
stirring in closed vials. The Ti(IV)/P123 mole ratios of the final products are 40, 60 or
80 and the Cd(II)/P123 mole ratios are 2, 5, 10, 13,and 15 in order to produce rigid
mesostructured films.
The film samples were prepared either by spin coating of a 1 ml of a desired
solution on a substrate first at 500 rpm for 5 seconds then at 1500 rpm for 20 seconds or
dip coating on a substrate with a speed of 0.4 mm/sec. The substrates are quartz, glass,
and silicon (100), depending on the measurement technique. After preparation of the
26
films, immediately, the samples were further aged first at 30°C in a 50% humidity oven
for 12 hours and then at a 130°C for 4 hours in a regular oven.
2.2.3 Synthesis of CdS Nanoparticles in Mesostructured Titania
The film samples were exposed and kept under 200 torr H2S for 5 minutes for 3
times at room temperature for CdS synthesis in an evacuated vacuum chamber. Then the
reaction chamber was evacuated by pumping using a rotary pump for 5 minutes. These
samples were named as meso-xCdS-yTiO2, where x and y are the initial Cd(II)/P123 and
Ti(IV)P123 mole ratios.
2.3 Instrumentation
2.3.1 X-Ray Diffraction (XRD)
The XRD patterns were obtained on Rigaku Miniflex diffractometer using a high
power Cu Kα source operating at 30kV/15 mA (generating 1.5405Å x-rays) and a
Scintillator NaI (T1) detector with a Be window. The samples are prepared on glass and
quartz substrates for the XRD measurement, which is carried at low and high angle
regions in order to observe both the mesophase in small angles between 0.5 and 6, 2θ
range with a 1°/minute scan rate and the nanocrystalline phase in high angles between
15 and 60, 2θ range with the same scan rate.
2.3.2 FT-IR Spectroscopy
The FT-IR spectra were recorded using a Bruker Tensor 27 model FT-IR
spectrometer. A DigiTectTM DLATGS detector was used with a resolution of 4 cm-1

27
and 128 scans in 400-4000 cm-1
range for all the samples. The thin films on silicon(100)
wafers were used for the FTIR measurements.
2.3.3 Raman Spectroscopy
The micro Raman spectra were recorded on a LabRam Model confocal Raman
microscope with a 300 mm focal length. The spectrometer is equipped with both HeNe
laser operated at 20 mW, polarized 500:1 with a wavelength of 632.817 nm, and dipole-
pumped solid state laser operated at 50mW, polarized 100:1 with a wavelength of 532.1
nm, and a 1024 x 256 element CCD camera. The signal collected is transmitted via a
fiber optic cable into a spectrometer with 600 g/mm grating. The spectra were collected
by manually placing the probe tip near the desired point of the sample on a silicon wafer.
2.3.4 UV-Vis Spectroscopy
The UV-Vis Spectra were recorded using a Varian Cary 5 double beam
spectrophotometer with a 200 nm/min or 100 nm/min speed and a resolution of 2 nm
over a wavelength range from 800 to 200 nm in transmittance mode. The UV-Vis
absorption spectroscopy was used for characterization and also to obtain information
about the electronic properties of mesostructured meso-TiO2, , meso-Cd(II)-TiO2, and
meso-CdS-TiO2 thin films. The samples were prepared on quartz or glass substrates as
thin films using dip or spin coating techniques.

28
2.3.5 Scanning Electron Microscopy (SEM) and Energy Dispersive X-Ray
Spectroscopy (EDS)
The SEM images were recorded using ZEISS EVO-40, operated at 15kV and a
Bruker AXS XFlash detector 4010 attached to the same microscope. The samples were
prepared on silicon wafers that were attached to aluminum sample holders using
conductive carbon adhesive tabs. The EDS data were collected using the same SEM and
the samples using a Bruker AXS XFlash detector 4010. The EDS spectra were also
collected at 15kV and at an optimum working distance of 15 mm.
2.3.6 Transmission Electron Microscopy (TEM)
The TEM images were recorded on FEI Technai G2 F30, operated at 200kV. The
samples were prepared using spin coating of thin films, which were calcined at 250, 300,
or 350°C. The films were scratched from the substrates and grinded well in a morter,
then dispersed in absolute ethanol. 50 μl of the solution is dropped on a TEM grid and
then dried for 24 hours at 50°C before the measurements.
2.3.7 Polarized Electron Microscope (POM)
The POM images were recorded on ZEISS AXIO Scope A1 with transmitted
light illumination, using convergent white light between the parallel and crossed
polarizers. The samples were prepared on glass, quartz or silicon(100) substrates. The
POM images have been used to characterize the mesophases formed from salt:
surfactant: titania system.

29
3. RESULTS AND DISCUSSION
CHAPTER 1
3.1.1 The Phase Behavior of the [Cd(H2O)4](NO3)2 / Titania / P123 system
The transition metal salts and nonionic or pluronic surfactants with [97] and/or
without a solvent [98,99] produce lyotropic liquid crystalline (LLC) mesophases. If a
salt-surfactant solution is evaporated, first micellization occurs as the surfactant
concentration increases with the evaporation of the solvent. Then with further
evaporation of the solvent, an LC phase is formed. Moreover, without a solvent, the
transition metal salts can be dissolved in nonionic surfactant to produce LLC phase. In
both cases, the amount of metal salts introduced into the LLC phase is limited. The salt-
surfactant LLC phases have been used to synthesize mesostructured transition metal
sulfides [44-47, 97] and metals[61-63]. Moreover, introducing silica or titania precursors
to the LLC phase, rigid mesostructured materials can be synthesized [18, 20, 23, 28].
It is worth to mention a few properties of the LC mesophases; one of them is its
sensitivity to temperature changes. The LLC mesophase responds to heating and cooling
processes, such that upon heating either the mesophase undergoes a phase change and
then melts or directly melts (becomes disordered). Further, as the disordered phase is
cooled down, the mesoorder forms back. This is a reversible process and have been
observed in many LC phases[94,95]. The heating/cooling behavior is almost the same in
lyotropic liquid crystalline phase produced by the transition metal aqua complexes and

30
non-ionic surfactant[98, 99]. This behavior of the liquid crystals will be used to
investigate the phase behavior of the samples prepared in this thesis.
The LLC phase and rigid mesostructured or mesoporous materials are well
known and have been widely investigated, in the literature
[18,20,25,28,41,49,80,98,99,102,103]. The main differences between these two
substances are the nature of the inorganic precursors added to the surfactant media
(whether it is a salt (non-polymerizing) or inorganic monomer (polymerizing)), and the
amount of monomeric inorganic substances in the samples. The LLC phases form rigid
mesophases as the ratio of polymerizing inorganic substance to surfactant exceeds
certain concentration in the synthesis media. The region between the LLC phase and
mesostructured solid substances is not yet investigated to understand the formation of
mesostructured materials. The physical behavior of this region might be interesting; the
transition of LC phase to rigid materials needs to be introduced to this field. In this
thesis, we have investigated the mesophases by changing both titania/P123 and
Cd(II)/P123 mole ratios in a series of samples.
. The samples, which were optimized to investigate the phase behavior of the
[Cd(H2O)4](NO3)2/Titania/P123 system were prepared according to surfactant mole
ratios of individual inorganic components. The titania component has been investigated
between 0 and 80 mole ratios to P123 surfactant (especially at 0, 5, 8, 10, 12, 15, 16, 20,
24, 25, 28, 30, 35, 40, 50, 60, 80 mole ratios). Moreover, the [Cd(H2O)4](NO3)2
component is investigated between 0 and 15 mole ratios (especially at 0, 2, 4, 5, 6, 8, 10,
12, 13, 15 mole ratios). Samples were prepared in two different ways; one is the thin

31
film samples prepared by spin coating in two steps by spinning first at 500 rpm for 5 sec.
and then at 1500 rpm for 25 sec., the other one is for thick samples, where 3 ml of
solutions were spreaded on plastic trays and aged for at least 3 days. Both coatings were
carried out under ambient conditions. The samples were denoted as meso–xCd(II)–
yTiO2, where x is the Cd(II)/P123 surfactant mole ratio and y is the titania/P123
surfactant mole ratio. For example, a sample prepared with 5 Cd(II)/P123 and 20
TiO2/P123 is denoted as meso–5Cd(II)–20TiO2 for the samples prepared using nitric
acid. The samples prepared using HCl were denoted as meso-xCdCl2-yTiO2.
The phase behavior studies were first performed using HCl as the acid source,
because the mesostructured and mesoporous titania synthesis has been established using
HCl or by in-situ productions of HCl by the hydrolysis of titanium chloride
precursor[20,41,60], in order to control high reactivity of the titania precursors towards
hydrolysis and condensation reactions[57]. However the samples, prepared using HCl,
undergo phase separation and crystallization of salt on the surface of the films. Figure
3.1.1A displays a series of small angle XRD patterns of the fresh meso-xCdCl2-20TiO2,
prepared using HCl and different amount of Cd(II). The diffraction lines are sharp at 2
Cd(II)/P123 mole ratio, however as the amount of Cd(II) increased, the intensities get
smaller and almost disappear, as the Cd(II) mole ratios reaches to 10. The samples,
meso-2Cd(II)-20TiO2 and meso-5Cd(II)-20TiO2, display diffraction lines at 0.77, 1.52,
2.28 and 3.04, 2θ, with corresponding d-spacing of 114.9, 58.0, 38.7, 29Å, respectively.
However, meso-10Cd(II)-20TiO2 displays only 2 broad lines at 1.78 and 2.56, 2θ. A
limited amount of [Cd(H2O)4]Cl2 salt can be incorporated into the mesostructured titania

32
with a salt/P123 mole ratios of up to 10. However the sample with a 10 mole ratio Cd(II)
is disordered and the crystallization of the salt ions is observed, see Figure 3.1.1B
Figure 3.1.1 A) A series of XRD patterns of fresh samples of the a) meso–0CdCl2-20TiO2, b)
meso–5CdCl2-20TiO2, and c) meso–10CdCl2-20TiO2. B) The XRD patterns, at high angles of
the a) fresh meso–10CdCl2-20TiO2, and b) 5 days aged meso–10Cd(II)-20TiO2.
20 25 30 35 40 45 50
(33
1)
(13
1)
(22
0)
b)
Re
l. I
nte
ns
ity
(c
ps
)
2
a)
B)
(20
0)
30
0
0,6 0,9 2 3 4
c)
b)
x5
x5
2
x0.1
x5
a)
A)
10
00
0R
el.
In
ten
sit
y (
cp
s)

33
The samples, prepared using HCl, are highly sensitive to ageing. Figure 3.1.1.B
displays high angle XRD patterns of fresh and 1week aged thin films of meso-10CdCl2-
20TiO2. The 1 week old samples display 3 intense diffraction lines at 23.1, 34.8 and
44.05°, 2θ. These sharp diffraction lines at high angles are due to salt crystals. It means
that the salt species crystallize out of the pores and form at least micron sized dendrite
like crystalline domains on the surface of the thin films, see Figure 3.1.2.
5 μm 1 μm 5 μm
Figure 3.1.2 The POM images of the meso–10CdCl2-20TiO2 a) fresh, b) 1day aged, and c) 1
week aged thin film samples.
The elemental analysis, using EDS, shows that these crystals are cadmium
chloride (CdCl2). Therefore HCl may not be a good choice of acid source in this
investigation. Throughout the solvent evaporation step and ageing steps, solvated Cd2+
ions precipitate out as CdCl2 crystals (ICDD card number 00-001-0161). The
crystallization can also be monitored by recording the POM images throughout ageing.
Figure 3.1.2 displays the POM images of the thin films of meso-10CdCl2-20TiO2
throughout ageing process. The film samples are isotropic, where the image is dark
between crossed polarizers. However the crystals of CdCl2 are anisotropic. The
crystalline parts are bright between the crossed polarizers. To overcome crystallization

34
problem, further investigation has been carried using HNO3 acid as the acid and
cadmium nitrate salt as the Cd(II) ion sources. Changing the acid source from HCl to
HNO3 was crucial to overcome the solubility problem of the transition metal salts, (the
nitrate salts are more soluble than chloride salts). Therefore higher amount of Cd(II) ions
can be incorporated into the media and into the mesostructured titania. Moreover, the
NO3- ion has some additional advantages to the system; it decreases the high reactivity
of titania clusters towards condensation reaction (see text later).
Figure 3.1.3 The small angle XRD patterns of the a) meso–5Cd(II) –10TiO2, b) meso–8Cd(II)–
10TiO2, c) meso–10Cd(II)–10TiO2, d) meso–13Cd(II –10TiO2, e) meso–15Cd(II)–10TiO2, and
f) meso–18Cd(II)–10TiO2.
The upper limit of the [Cd(H2O)4](NO3)2/P123 mole ratio that can be
incorporated to the media and as a result to the mesostructured titania is about 15. The
samples become almost disordered over 13 Cd(II)/P123 mole ratios, see Figure 3.1.3.
Similar behavior have also been observed in the binary [Cd(H2O)4](NO3)2 and P123
0.8 1.0 2 3 4
x5
x5
x5
x5
x5
x5
f)
e)
d)
c)
b)
2
a)
x0.1
10
00
0R
el.
In
ten
sit
y (
cp
s)
35
LLC mesophases (not shown). Figure 3.1.3 displays the small angle XRD patterns of the
fresh meso-xCd(II)-10TiO2 samples; with increasing Cd(II)/P123 mole ratios. The
samples, above 13 Cd(II)/P123 demonstrate broad diffraction at 2.09°, 2θ. However, the
samples, below 13Cd(II)/P123 displays diffraction lines at 0.95 and 1.77°, 2θ. The XRD
patterns are characteristic for a lamella mesostructure with a repeating distance of 9.3
nm. A similar trend has also been observed at other titania amounts; the solubility
behavior of the salts are very similar, almost no change in the trends.
Figure 3.1.4 The small angle XRD patterns of the thin films of the a) fresh meso-0Cd(II)-
15TiO2, b) 1 week aged meso-0Cd(II)-15TiO2, c) fresh meso-0Cd(II)10TiO2, and d) 1 week aged
meso-0Cd(II)-10TiO2.
The samples, prepared with no or very small amount of Cd(II) (up to 2 mole
ratios) and low titania content (up to 15 mole ratios) undergo phase transformation upon
aging. Figure 3.1.4 displays the small angle XRD patterns of the fresh and 1 week aged
samples of meso-0Cd(II)-15TiO2 and meso-0Cd(II)-10TiO2. The diffraction lines of
0,8 1,0 2 3 4
d)
c)
b)
2
a)
x0.1
10
00
0R
el. In
ten
sity (
cp
s)

36
both fresh samples are observed at 0.92, 1.8 and 2.7°, 2θ, corresponding to the (100),
(200), and (300) planes of the phase, and the first signals have shoulders which may be
due to a phase separation in the film samples . The mesostructure of the fresh samples
are lamella. Upon ageing, the sharp diffraction lines become broad and shift to higher
angles, to 1.45 and 2.17°, 2θ. The samples loose the lamella mesoorder upon ageing for
1 week under ambient conditions; these samples also undergo phase separation. The
meso-0Cd(II)-5TiO2 sample does not have any mesoorder under any circumstances. The
phase separation is most likely due to lack of enough inorganics in the hydrophilic
domains of the mesophase. The limited amount of titania species in the hydrophilic
domains of the surfactant molecules diffuse out from the LC phase, where some parts of
the sample become titania and some parts become surfactant rich.
Figure 3.1.5 The small angle XRD patterns of fresh samples of the a) meso-2Cd(II)–12TiO2, b)
meso-4Cd(II)–12TiO2, c) meso-6Cd(II)–12TiO2, d) meso-8Cd(II)–12TiO2, e) meso-10Cd(II)–
12TiO2,and, f) meso-12Cd(II)–12TiO2.
0,6 0,9 2 3 4
x5
x5
x5
x5
x5
x5
f)
e)
d)
c)
b)
Re
l. I
nte
ns
ity
(c
ps
)
2
a)
x0.1
10
00
00

37
The samples prepared up to 15 mole ratio of titania/P123 and between 2 and 13
mole ratios of Cd(II)/P123 have LC like behaviors. These samples have gel-like
appearance. The thicker film samples are soft and satisfy the characteristic properties of
an LC mesophase. For example, if the sample is scratched, the mobile LC phase repairs
the scratched area in a short time; and the sample becomes as prepared. Another asset of
the LC phase is its responses to heating and cooling cycles; the LC phase becomes
disordered and liquid as the sample is heated (melting) and it is recovered upon cooling.
However, our samples undergo phase separation with heating; there is no recovery of the
mesophase. This is because the titania clusters agglomerate to each other and grow into
larger domains that cannot be reorganized into the LC mesophase. The heating/cooling
cycle is not reversible in this system. Figure 3.1.5 display a series of diffraction patterns
of meso-xCd(II)-12TiO2 (where x is 2, 4, 6, 8, 10 and 12). The samples in this region
have lamella mesophase. The sharp diffraction lines become broad at higher Cd(II)/P123
mole ratios. At low Cd(II) mole ratios (up to 6), 3 diffractions lines are observed at 0.91,
1.78 and 2.63°, 2θ. The first diffraction line of the samples with low Cd(II) content has
millions of counts. However at higher Cd(II)/P123 mole ratios (8-12), 2 broad
diffraction lines are observed at 0.98 and 1.87, 2θ. Changing the titania/P123 mole ratios
from 5 to 15 and the Cd(II)/P123 mole ratios from 2 to 13 doesn’t affect the mesoorder,
but as the Cd(II) amount increased the intensities of the diffraction lines decreases and
also shifts to higher angles. There is a 7.5% shrinkage, indicating that the samples loose
the orientation and form a curling pattern on the surface of the substrate (see later TEM
section).

38
A)
B)
Figure 3.1.6 A) The photo of thick film sample of meso-4Cd(II)-28TiO2. B) The small angle
XRD patterns of the a) meso-2Cd(II)–24TiO2, b) meso-4Cd(II)–24TiO2, c) meso-8Cd(II)–
24TiO2, d) meso-10Cd(II)–24TiO2, and e) meso-12Cd(II)–24TiO2.
0,8 1,0 2 3 4
x5
x5
x5
x5
x5e)
d)
c)
b)
Re
l. I
nte
ns
ity
(c
ps
)
2
a)
x0.1
50
00

39
As the titania mole ratios increased to higher than 20 mole ratios, the thicker film
samples become like a plastic. These samples could be removed from the substrate. They
are flexible and behave like plastic. These type of materials are referred as soft materials
in this thesis. The thick soft materials don’t lose their plastic like properties for months.
Figure 3.1.6A displays a representative photo of thick film sample of meso-4Cd(II)-
28TiO2. Figure 3.1.6B displays the small angle XRD patterns of a series of meso-
xCd(II)-24TiO2 samples (where x: 2, 4, 8, 10, 12). The XRD patterns are very similar to
the LC like materials except the peak intensities of the samples; at small Cd(II)/P123
mole ratios (2-6), 4 diffraction lines can be resolved at 0.97, 1.85, 2.76 and 3.66°, 2θ, at
medium Cd(II) mole ratios (8-10); 3 diffraction lines at 1.00, 1.96 and 2.90°, 2θ; and at
higher Cd(II) mole ratios (x>10) only a broad diffraction line is observed at 2.05°, 2θ.
Moreover, with increasing the amount of Cd(II) in the synthesis media, the number of
diffraction lines decreases, shifts to higher angles and get broader. All samples in this
region have characteristic (100), (200), (300) diffraction lines. Figure 3.1.7 displays the
POM images of a fresh thin film sample and scratched sample of meso-4Cd(II)-24TiO2.
The fresh sample is dark under cross polarizers due to isotropic nature, however, the
scratched sample, in the sctarched region, appears bright between the crossed polarizers.
It means that the samples are not lamella, rather it is highly oriented on the substrate.
Therefore, only the oriented planes and its higher order diffraction lines are observed.
The other evidence is the calcination of rigid samples, the lamella mesostructure always
collapses upon calcination, however the rigid mesostructured samples never collapse
(will be discussed later), indicating that the structure is oriented hexagonal (2D or 3D).

40
5 μm 1 μm
Figure 3.1.7 The POM images of the meso–4Cd(II)-24TiO2 a) fresh, b) scratched sample. The
inset displays a closer view of the scratched sample.
The mesostructure became disordered as the amount of titania in the samples
increased to higher contents. The XRD patterns, in Figure 3.1.8, clearly shows that the
samples (with Ti/P123 mole ratio of 35) loose their order with increasing Cd(II) in the
media. The as prepared thin film sample of meso-5Cd(II)-35TiO2 has mesoorder but
within a day of ageing, the sample becomes disordered. The order deceive throughout
aging can be showing a sign of phase separation of organic and inorganic species in the
mesostructured material. The “as prepared” samples with 35 titania mole ratio and
higher than 5 Cd(II) mole ratios do not have small angle diffraction lines, see Figure
3.1.8. Figure 3.1.8 (a) to (c) show the XRD patterns of the meso-5Cd(II)-35TiO2 sample
with ageing. The fresh sample has diffraction lines at 0.97, 2.00, and 3.00°, 2θ,
corresponding to the (100), (200), (300) planes. These lines loose their intensities upon
aging and totally disappear in a week, indicating that with further condensation and
diffusion of the titania particles in the mesostructure lead to a complete phase separation.

41
The titania and Cd(II) concentrations are still low to fully mimic the mesophase into
mesostructure. The likely origin of the phase separation is the low inorganic density to
fill up all the space in the hydrophilic domains of the mesophase. Therefore, much
higher titania or if possible, higher metal ion density is needed to fully mimic the
mesophase (soft, LC like fresh samples) to solid mesostructured film samples. Notice
that at higher Cd(II) ratios, there is even no mesoorder in the fresh samples, Figure 3.1.8
d and e.
Figure 3.1.8 The small angle XRD diffraction patterns of the thin film sample of the a) fresh
meso-5Cd(II)–35TiO2, b) 1 day aged meso-5Cd(II)–35TiO2, c) 1 week aged meso-5Cd(II)-
35TiO2, d) fresh meso-8Cd(II)–35TiO2, and e) fresh meso-10Cd(II)–35TiO2.
There were mainly 4 different regions in the phase diagram of meso-xCd(II)-
yTiO2; i) a phase separation region, where both the amounts of titania and Cd(II) metal
ions were very low and throughout aging a phase separation occurs, ii) the LC like
0,8 1,0 2 3 4
x5
Re
l. I
nte
ns
ity
(c
ps
)
2
a)
b)
c)
x0.1
x5
e)d)
50
00

42
region, where the samples have properties of LC mesophase, iii) the soft materials
region, where the samples are plastic like, and iv) the rigit materials region, where at this
preparation conditions the samples are disordered, see Figure 3.1.9. The phase diagram,
in Figure 3.1.9, shows that increasing titania content of the samples, the sample undergo
LC like matter to soft matter to rigid solid mater transformations. However, with
increasing Cd(II) in the media, keeping the titania ratio constant, the material property
does not change much, but the order/disorder is a function of Cd(II) species in the media.
This is a reasonable observation, because the titania is the polymerizing component of
the mesophase, therefore increasing its content in the media will likely rigidify the
structure. However Cd(II) ions are mobile and they are always together with their
counter ions in the media. Therefore, these ions will influence the organization of the
surfactant, micellar species in the media. However, above 15 Cd(II)/P123 mole ratios,
the mesophase never form and those materials above 15Cd(II)/P123 mole ratio are
always disordered under our reaction conditions. Further studies are needed to improve
the metal ion uptake of these structures.

43
Figure 3.1.9 The phase diagram of Cd(II), titania and p123 surfactant.
3.1.2 Rigid Mesostructured Titania Materials
The ordered mesostructures can be obtained up to 35 titania/P123 mole ratios,
see the phase diagram of meso-xCd(II)-yTiO2 under ambient synthesis conditions,
Figure 3.1.9. However, this limit can be extended by controlling the polymerization of
titania species. In the literature, the rigid mesostructured titania materials have been
synthesized under controlled humidity conditions[49, 60]. Due to high sensitivity of
titania precursor towards water, the reaction conditions must be controlled carefully. The
other reason may be the lack of a sufficient acid source; in a typical synthesis of a meso-
xCd(II)-yTiO2, the reaction medium is acidified by 0.37 g HNO3. Due to increased
amount of titania, more acid may be needed. Therefore in the synthesis of rigid
mesostructured titania, 1 g of 65% HNO3 acid has been used.

44
The synthesis conditions were optimized to prepare rigid mesostructured titania
materials; the Cd(II)/P123 mole ratios were kept the same as before (2, 4, 6, 8, 10, and
13) but the titania/P123 mole ratios were changed between 40 and 80 (40, 50, 60, and
80). At very high acid amounts, due to the water content of the acid sources HNO3
(65%) , the solutions turns cloudy, where the titania source may precipitate. Second, the
synthesis has been carried under controlled humidity. These samples were also denoted
as meso-xCd(II)-yTiO2, where x is the Cd(II)/P123 and y is Ti(IV)/P123 mole ratios.
The effect of the humidity and temperature on the mesoorder of meso-xCd(II)-
yTiO2 can be investigated using XRD patterns of the samples that were prepared under
ambient conditions at RT and under %50 humidity (12 hours) at 30°C. Figure 3.1.10
displays the small angle XRD pattern of the meso-4Cd(II)-60TiO2 sample prepared
under those two conditions. The sample prepared under ambient conditions do not
display any diffraction line at small angles but the sample prepared under 50% humidity
displays 3 diffraction lines at 0.95, 1.84, and a less intense line at 2,73°, 2θ. The same
sample under controlled humidity and temperature has mesoorder, whereas the other
sample does not have any mesooder. This disorder-order transition is due to controlled
condensation of titania under controlled humidity and temperature. Controlling the
humidity enables to produce mesostructured titania materials.

45
Figure 3.1.10 The small angle XRD patterns of the a) meso–4Cd(II) –60TiO2 aged at ambient
conditions at RT, and b) meso–4Cd(II)–60TiO2 aged at 30°C and %50 humidity for 12 hours.
The rigid mesostructured titania materials have similar diffraction patterns to
that of mesoordered regions in the phase diagram of meso-xCd(II)-yTiO2 at low titania
contents. The XRD patterns of the as prepared samples of 60 titania/P123 and different
Cd(II)/P123 mole ratios are shown in Figure 3.1.11, as the representative samples to
investigate this region of the phase diagram. There is a change in the number of
observed diffraction lines upon addition of [Cd(H2O)4](NO3)2 into the media. The unit
cell almost remains the same upon salt addition, but the high order in the salt free
samples, is lost with the addition of cadmium nitrate. Typically 2 diffraction lines are
observed at around 0.96 and 1.85°, 2θ in the salt containing samples. The advantages of
salt addition to the samples will be discussed later.
0,6 0,9 2 3 4
X 10
Re
l. I
nte
ns
ity
(c
ps
)
2
a)
b)
X 0.1
10
00
0
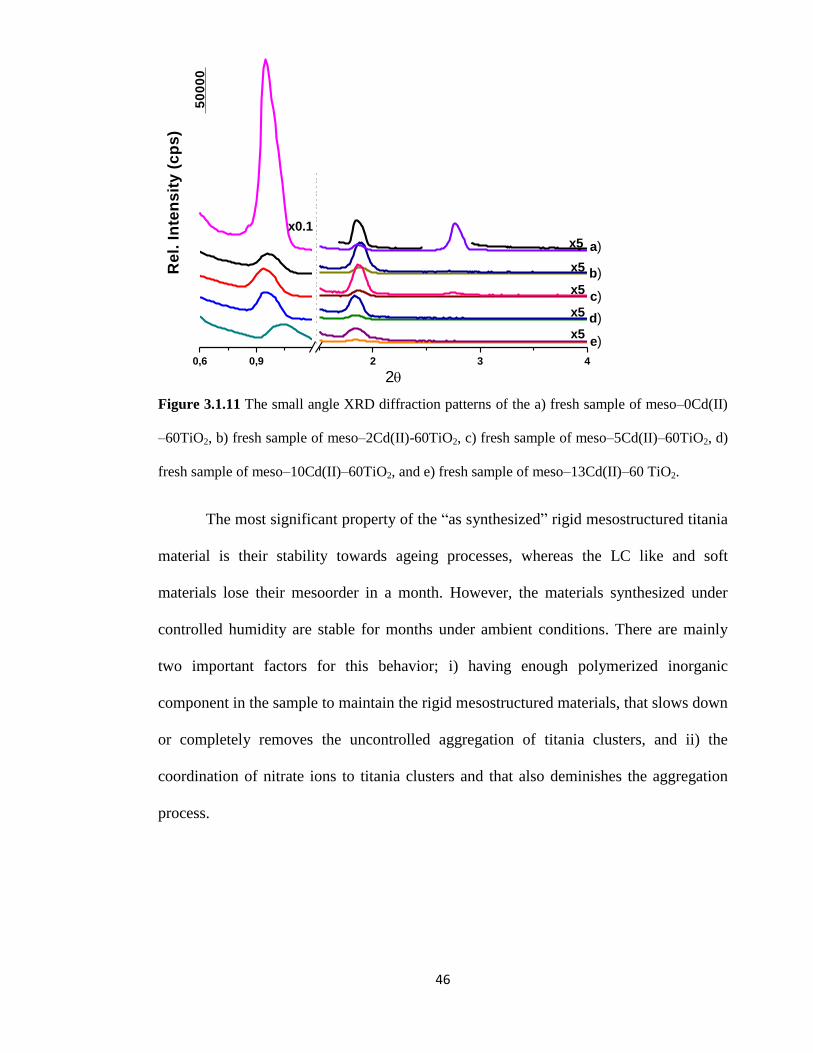
46
Figure 3.1.11 The small angle XRD diffraction patterns of the a) fresh sample of meso–0Cd(II)
–60TiO2, b) fresh sample of meso–2Cd(II)-60TiO2, c) fresh sample of meso–5Cd(II)–60TiO2, d)
fresh sample of meso–10Cd(II)–60TiO2, and e) fresh sample of meso–13Cd(II)–60 TiO2.
The most significant property of the “as synthesized” rigid mesostructured titania
material is their stability towards ageing processes, whereas the LC like and soft
materials lose their mesoorder in a month. However, the materials synthesized under
controlled humidity are stable for months under ambient conditions. There are mainly
two important factors for this behavior; i) having enough polymerized inorganic
component in the sample to maintain the rigid mesostructured materials, that slows down
or completely removes the uncontrolled aggregation of titania clusters, and ii) the
coordination of nitrate ions to titania clusters and that also deminishes the aggregation
process.
0,6 0,9 2 3 4
e)
d)
c)
b)
x5
x5
x5
x5
x5
Re
l. I
nte
ns
ity
(c
ps
)
2
x0.1
a)
50
00
0
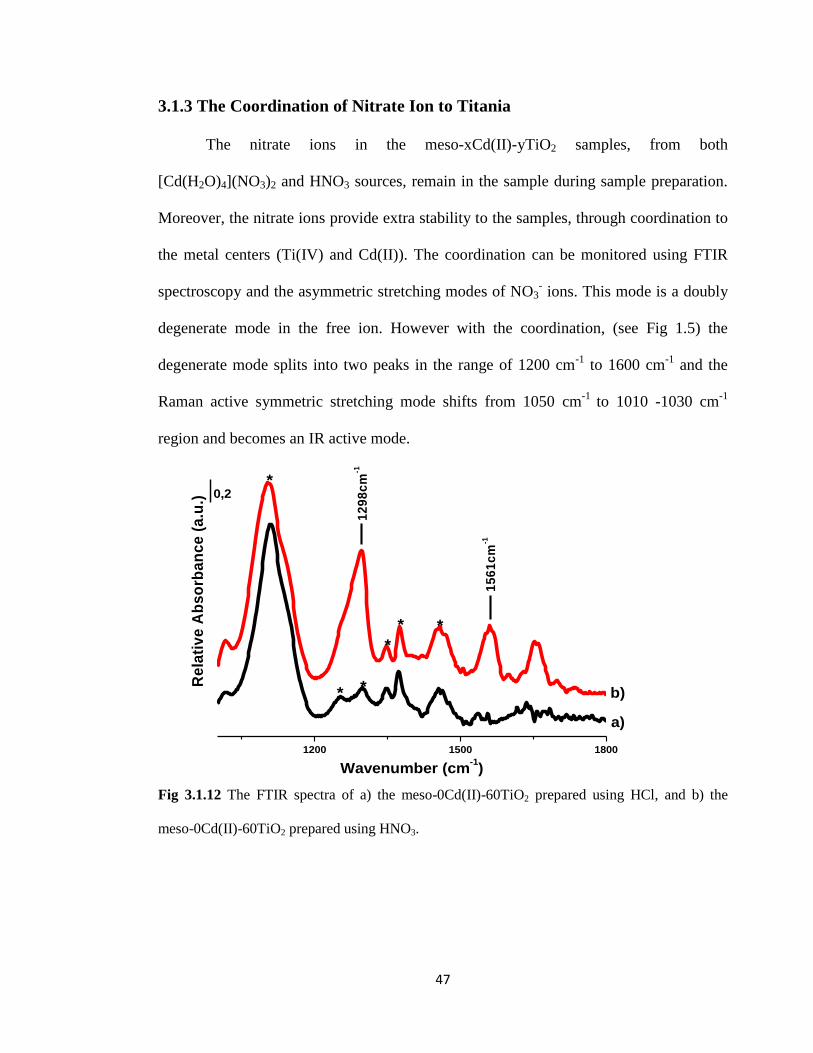
47
3.1.3 The Coordination of Nitrate Ion to Titania
The nitrate ions in the meso-xCd(II)-yTiO2 samples, from both
[Cd(H2O)4](NO3)2 and HNO3 sources, remain in the sample during sample preparation.
Moreover, the nitrate ions provide extra stability to the samples, through coordination to
the metal centers (Ti(IV) and Cd(II)). The coordination can be monitored using FTIR
spectroscopy and the asymmetric stretching modes of NO3- ions. This mode is a doubly
degenerate mode in the free ion. However with the coordination, (see Fig 1.5) the
degenerate mode splits into two peaks in the range of 1200 cm-1
to 1600 cm-1
and the
Raman active symmetric stretching mode shifts from 1050 cm-1
to 1010 -1030 cm-1
region and becomes an IR active mode.
Fig 3.1.12 The FTIR spectra of a) the meso-0Cd(II)-60TiO2 prepared using HCl, and b) the
meso-0Cd(II)-60TiO2 prepared using HNO3.
1200 1500 1800
**
*
**
b)
Re
lati
ve
Ab
so
rba
nc
e (
a.u
.)
Wavenumber (cm-1)
a)
*
12
98
cm
-1
15
61
cm
-1
0,2

48
The coordination can be investigated using FT-IR spectra of two different
mesostructured titania materials, one is prepared using HNO3, whereas the other one is
prepared using HCl. There is no signal due to Ti-Cl in the samples, prepared using HCl,
therefore all the peaks, between 900 and 1800 cm-1
region, are due to surfactant
molecules. In both samples, the surfactant signals are almost the same due to similar
titania surfactant interactions. The differences between the two FT-IR spectra are due to
Ti4+
NO3- interactions. The peaks at 1108 cm
-1, 1250 cm
-1, 1300 cm
-1, 1348 cm
-1, 1455
cm-1
are due to surfactants, which are indicated with asterisks in Figure 3.1.12.
Moreover, the peak at 1653 cm-1
is caused by the water in the samples. In the spectrum
of mesostructured titania prepared using HNO3 displays two additional peaks at 1298
cm-1
and 1561 cm-1
due to splitting of degenerate asymmetric stretching mode of
coordinated nitrate. Moreover, the symmetric stretching mode of nitrate became IR
active and observed at 1018 cm-1
due to nitrate-Ti4+
coordination, see Figure 3.1.12. The
splitting energy of the asymmetric stretching mode is 263 cm-1
, which indicates that
NO3- ions are bridge coordinated to titania clusters (see Fig 1.5).

49
Figure 3.1.13 The FT-IR spectra of the a) mesostructured titania prepared with HCl, b) meso-
2Cd(II)–60TiO2, c) meso–5Cd(II)–60TiO2, d) meso–10Cd(II)-60TiO2, and e) meso–13Cd(II)–60
TiO2 samples.
Various amount of [Cd(H2O)4](NO3)2 salt is added to the rigid meso-xCd(II)-
yTiO2 samples. Figure 3.1.13 displays a series FTIR spectra of meso-xCd(II)-yTiO2 and
a meso-TiO2 prepared using HCl for comparison purpose. The coordination of nitrate
ions to Cd2+
ion as well as Ti4+
are demostrated using these samples. The peaks at 1290
cm-1
and 1475 cm-1
are due to nitrate ion-cadmium ion coordination, where the splitting
energy of the asymmetric stretching mode is 186 cm-1
. This splitting corresponds to
bidentate coordination of NO3-[103,104,109]. Furthermore, as the amount of Cd
2+ ions
increases in the samples, the absorbance of the peaks due to nitrate coordinated to
cadmium ion also increases (both symmetric and asymmetric stretching) while the
intensity of the Ti4+
coordinated nitrate remains the same, see Figure 3.1.13. Similar
behavior can also be observed in the peak intensity of the titania-nitrate, Figure 3.1.14,
1200 1500 1800
e)
d)
c)
b)
a)
Re
l. A
bs
orb
an
ce
(a
.u.)
Wavenumber (cm-1)
0,2

50
as the titania/P123 ratios are increased in the samples. The intensity of the signal at 1290
cm-1
due to both Cd(II) and titania nitrate coordinations also increases with increasing
titania and/or Cd(II). The peak at 1474 cm-1
remains the same, if the Cd(II) content kept
constant, in all samples, ensuring that the Cd(II) nitrate coordination remains the same
Figure 3.1.14 FT-IR spectra of the a) meso–2Cd(II)–40TiO2, b) meso–2Cd(II)–60TiO2, and c)
meso–2Cd(II)–80TiO2.
The appearance and the amount of NO3- ions can also be monitored using UV-
Vis spectroscopy. A mixture of P123 and HCl was used as blank sample in order to find
out the absorbance due to NO3- ion. The mixture of HNO3 and P123 shows an
absorbance at 204 nm different from the blank sample. Moreover, with increasing the
mole ratios of [Cd(H2O)4](NO3)2/P123 in the samples a rapid increase in the absorbance
at the NO3- region was observed. Figure 3.1.15A shows a series of UV-Vis absorption
spectra of meso-xCd(II)-0TiO2 samples (titania free), a mixture of HCl and P123, and a
1200 1500 1800
c)
b)
Re
l. A
bs
orb
an
ce
(a
.u.)
Wavenumber (cm-1)
a)
0,15

51
mixture of HNO3 and P123. Figure 3.1.15B displays a series of UV-Vis absorption
spectra of the meso-0Cd(II)-yTiO2 samples (Cd(II) free), a mixture of HCl and P123,
and a mixture of HNO3 and P123. Furthermore, with increasing the mole ratio of titania
in a series of samples, the nitrate peak doesn’t change, but another band at 290 nm is
observed, due to the titania species, see Figure 3.1.15B.
Figure 3.1.15 The UV-Vis spectrum of A) a) HCl-P123 mixture, b) HNO3-P123 mixture, c)
meso–5Cd(II)–0TiO2, d) meso–10Cd(II)–0TiO2, and e) meso–15Cd(II)–0TiO2, B) a) HCl-P123
mixture, b) HNO3- P123 mixture, c) meso–0Cd(II)–5TiO2, and d) meso–0Cd(II)–15TiO2.
The coordination of nitrate to titania clusters provides extra stability to the meso-
xCd(II)-yTiO2 samples by controlling the condensation and aggregation of titania
species. However, throughout ageing, the coordination of nitrate with titania slightly
decreases. This indicates the growth of the titania species and/or decomposition of
nitrate species (see later). Figure 3.1.16 displays FT-IR spectra of a meso-0Cd(II)-
20TiO2 sample at different ageing times. The signals due to titania-nitrate coordination
200 300 400
e)
d)
c)
b)
Re
l. A
bs
orb
an
ce
(a
.u.)
Wavelength (nm)
a)
A)
0,5
200 300 400 500 600
d)
c)
b)
Re
l. A
bs
orb
an
ce
(a
.u.)
Wavelength (nm)
a)
B)
0,6

52
lose intensity with increasing ageing time; the peak at 1295 cm-1
and 1560 cm-1
lose their
intensities. Moreover, a broad peak at around 540 cm-1
upon further condensation and
polymerization of titania species is observed with ageing. These observations
collectively indicate that the coordinated nitrate ions to the surface of titania clusters are
eliminated and the titania particles further condense to each other. The coordinated
nitrate ions control the aggregation and condensation (growth) of the titania species. This
observation also shows that the nitrate ions can be eliminated from the sample by simply
ageing the samples.
Figure 3.1.16 The FT-IR spectra of the a) fresh sample of meso-0Cd(II)–20TiO2, b) 1day aged
sample, and c) 10 days aged sample.
The coordinated nitrates can be removed much faster under a controlled humidity
environment. Removal of the coordinated nitrate has been monitored using a meso-
2Cd(II)-50TiO2 sample, see Figure 3.1.17. It means that the nitrate species are less, if the
600 900 1200 1500 1800
Re
l. A
bs
orb
an
ce
(a
.u.)
Wavenumber (cm-1)
a)
b)
c)
0,4

53
samples are prepared under controlled humidity. However, the intensity of the peak at
1560 cm-1
doesn’t decrease after the film becomes rigid, see Figure 3.1.17. This
observation may also explain the role of the humidity on the stability of mesoordered
titania samples. Notice that in order to have mesoordered silica materials, the rate of
condensation of silica precursors must be comparable with the rate of self assembly of
the surfactant molecules[47]. The meso-2Cd(II)-50TiO2 sample, prepared under ambient
condition, is disordered, where the coordination of nitrate may reduce the growth of
titania species into stable mesostructured titania. However, the other sample, under 50%
humidity, the titania species grow into mesostructures, see Figure 3.1.10 and 3.1.17.
Notice that the coordinated nitrate signal at 1560 cm-1
is much more intense in the
sample prepared under ambient conditions than the samples under 50% humidity. This
observation is also consistent with our above proposal.

54
Figure 3.1.17 The FT-IR spectra of the a) meso-2Cd(II)-50TiO2 under room humidity and room
temperature for 12 hours, b) meso-2Cd(II)-50TiO2 under %50 humidity at 30°C for 12 hours,
and c) meso-2Cd(II)-50TiO2 under %50 humidity at 30°C for 24 hours.
3.1.4 The Thermal Stability and Calcination
Calcination is one of the important steps in synthesizing mesoporous materials.
Mesostructured materials that have thermal stability until 300°C are named as
mesoporous materials due to removal of the surfactant molecules, as a result of this
process the mesopores become empty in the structure. The rigid mesostructured titania
materials behave differently from the other mesoordered regions in the phase diagram
(LC like, soft materials) during thermal treatments.
600 900 1200 1500 1800
c)
b)Re
l. A
bs
orb
an
ce
(a
.u.)
Wavenumber (cm-1)
a)
0,3

55
Figure 3.1.18 A) The small angle XRD diffraction patterns of the A) meso-0Cd(II)-40TiO2
heated at a) fresh, b) 100°C, c) 200°C, and d) 300°C; B) meso-10Cd(II)-40TiO2 heated at a)
fresh, b) 100°C, c) 200°C, and d) 300°C.
The meso-xCd(II)-yTiO2 samples, which has smaller than 40 titania/P123 mole
ratio are sensitive to heat treatments. Figure 3.1.18 A and B display the small angle XRD
patterns of the meso-0Cd(II)-40TiO2 and meso-10Cd(II)-40TiO2 throughout calcination
process, respectively. The meso-0Cd(II)-40TiO2 sample has 4 sharp diffraction lines at
0.90, 1.74, 2.59 and 3.44°, 2θ, which corresponds to the (100), (200), (300), and (400)
planes of the mesoorder. There is about 4% shrinkage upon heating the sample to 100°C.
All the diffraction lines disappear and only a diffraction line at 2.55°, 2θ remains upon
calcination at 200°C. Moreover, the diffraction lines disappear completely by calcination
at 300°C, indicating the mesostructure is lamella in these ratios. However, the meso-
10Cd(II)-40TiO2 sample has 2 diffraction lines at 0.93, 1.74°, 2θ, which also
corresponds to (100) and (200) lines. Heating the sample to 100°C causes 5.4%
shrinkage in the structure. Calcination of the sample to 200°C and 300°C, only a broad
0,6 0,9 2 3 4
x5
x5
x5
x5d)
c)
b)
Re
l. I
nte
ns
ity
(c
ps
)
2
a)x0.1
A)2
00
00
0,6 0,9 2 3 4
d)
c)
b)
x5
x5
x5
x5
Re
l. I
nte
ns
ity
(c
ps
)
2
x0.1
a)
B)
20
00
0

56
diffraction line remains at 2.07 and 2.63°, 2θ, respectively, compare Figure 3.1.18 A and
B. The mesoorder disappears in the meso-0Cd(II)-40TiO2 sample at 300°C, whereas the
meso-10Cd(II)-40TiO2 sample still has a broad diffraction at 2.63°, 2θ. Moreover, the
shrinkage is also less in the 10 Cd(II)/P123 mole ratio sample, upon calcination at
200°C, indicating that the mesostructure is likely hexagonal, which is typically observed
for these materials.
Figure 3.1.19 The small angle XRD diffraction patterns of the A) meso-0Cd(II)-60TiO2 heated
at a) fresh, b) 100°C, c) 200°C, and d) 300°C; B) meso-10Cd(II)-60TiO2 heated at a) fresh, b)
100°C, c) 200°C, and d) 300°C.
The samples, prepared using 60 Ti/P123 mole ratio, seem to have highest
stability against thermal treatments. Figure 3.1.19 A and B display the small angle XRD
patterns of the meso-0Cd(II)-60TiO2 and meso-10Cd(II)-60TiO2 throughout calcination
process, respectively. The fresh meso-0Cd(II)-60TiO2 has 3 diffraction lines at 0.96,
1.85 and 2.73, 2θ. Upon heating to 100°C, a 5.5% shrinkage occurs in the sample.
Calcination to 200°C and 300°C, only a broad diffraction line remains at 1.91 and 2.91,
Re
l. I
nte
ns
ity
(c
ps
)
0,6 0,9 2 3 4
x5
x5
x5
d)
c)
b)
2
a)
x0.1x5
A)
40
00
0
0,6 0,9 1,2 2 3 4
x5
x5
x5
d)
c)
b)
Re
l. I
nte
ns
ity
(c
ps
)
2
a)x0.1
x5
B)
10
00
0

57
2θ, respectively. The fresh meso-10Cd(II)-60TiO2 sample has 2 diffraction lines at 0.96
and 1.77°, 2θ. Heating this sample to 100°C cause a 8.7% shrinkage. The calcination to
200°C and 300°C, the sharp diffraction lines disappear and only a broad line remains at
1.74 and 2.45, 2θ, respectively. The shrinkage at 300°C calcination is about 12%.
These results indicate that increasing the amounts of Cd(II) and titania makes
these materials stable to thermal treatments, due to increasing inorganic components in a
sample. Addition of titania increases the polymeric substance in the sample. Moreover,
the Cd(II) ions cannot stay as ions in the samples upon calcination, species like CdO or
Cd(OH)2 are produced. These species also becomes part of the inorganic building blocks
like titania and increases the thermal stability of the material. The shrinkage in the
sample upon heating at 100°C increases with increasing the amount of the Cd(II) ions in
both 40 and 60 titania/P123 mole ratio samples, most likely due to production of CdO or
Cd(OH)2 species. Further, the final shrinkage percentage with calcination at 300°C is
inversely proportional to the amount of inorganic in the sample, which means, addition
of more inorganic decreses the percent shrinkage, because more inorganic materials
build and stabilize the walls of mesopores.

58
Figure 3.1.20 The FT-IR spectra of meso-4Cd(II)-60TiO2 sample throughout calcination
process; a) fresh, b) 100°C, c) 200°C, and d) 250°C.
The calcination of the surfactant can also be monitored using FT-IR
spectroscopy. Figure 3.1.20 displays the FT- IR spectra of meso-4Cd(II)-60TiO2 at
different calcination temperatures. The peaks at 1106 cm-1
, 1380 cm-1
, and all the peaks
in the range of 2840 to 3010 cm-1
(indicated with asterisk in Figure 3.1.20) are due to
surfactant molecules, and disappear upon calcination at 250°C. It means that the
calcination temperature for P123 surfactant is around 250°C. The XRD pattern and the
FT-IR spectrum of the meso-xCd(II)-60TiO2 sample indicates that calcination to 300°C
produce mesoporous CdO or Cd(OH)2 incorporated titania materials, where the
mesoorder is maintained to heat treatments until 300°C, see Figure 3.1.19 and Figure
3.1.21, and the surfactant molecules burn out at around 250°, see Figure 3.1.20.
1000 1100 1200 1300 1400 1500 2700 3000 3300 3600 3900
**
d)
c)
b)
Re
l. A
bs
orb
an
ce
(a
.u.)
Wavenumber (cm-1)
a)
*0,2

59
Figure 3.1.21 The TEM images of meso-10Cd(II)-60TiO2 sample a)calcinated to 200°C (scale
bar is 10 nm), b) calcinated to 300°C (scale bar is 50 nm).
The TEM images of the as prepared samples cannot be recorded due to high
sensitivity to the electron beam and the difficulties in sample preparations of fresh
samples. However the calcinated samples can easily be imaged. Figure 3.1.21 displays
the TEM images of meso-10Cd(II)-60TiO2 sample, calcinated at 200°C and 300°C, has a
scale bars 10 nm and 50 nm, respectively. The mesoorder can easily be seen in the
images, which has curling patterns. The d-spacing of the calcinated samples at 200°C
and 300°C are 9.5 nm and 8 nm, respectively. However, the d-spacing due to the broad
XRD patterns of these samples (Figure 3.1.19) are 5.0 nm and 3.6 nm, respectively
(from Bragg’s law). Most likely, the diffraction lines are due to (200) or high order
planes. The XRD patterns and TEM images together shows that, the order in these
samples are not lamella. Note also that the lamella structures have no thermal stability,
60
they collapse upon heating. Moreover, the small angle (100) line must be at around 1.0°,
2θ, therefore it is not observed but the (200) line at around 1.7°, 2θ is visible in the XRD
pattern. The d-spacing obtained from the XRD patterns and the spacing measured using
TEM images are consistent with each other.
The reason, one can observe the (100) line in the “as synthesized” samples, but
not in the calcined samples can be due to loss of long range order. The as-synthesized
films are oriented, but this orientation is lost upon calcination at high temperature,
through either curling of the pores (as observed in the TEM images) or cracking of the
film samples. The nature of the sample and intensity of (100) line at around 1.0°, 2θ is
very important to observe this line. Usually, the fresh samples display this line at around
1.0°, 2θ with very high intensity. The background intensity can reach up to a few tens of
thousand in this region. Therefore, to observe (100) line, the intensity of this line must
be comparable or higher than the background signal. However, the TEM images clearly
shows that the repeating distances are in the 8 to 10 nm range, which is consistant if we
assign the diffraction line, observed at around 2°, 2θ upon calcination, to (200) or higher
order lines.
3.1.5 X-Ray Analysis
X-Ray diffraction (XRD) method has been used to identify the structure and
degree of order in crystalline, mesostructured, mesoporous materials and LC
mesophases. The importance of this technique is it ability to analyze the phases in either
crystalline or mesoordered samples. The technique works by collecting the number of x-
rays that is reflected from the parallel lattice planes having repeating d-spacing, therefore

61
a diffraction line in a pattern resulted by the constructive interference of the reflected X-
rays, which was formulated as Bragg’s law, see equation 3.1.1.
nλ= 2dsinθ (eq 3.1)
where λ is the wavelength of the X-ray, d is d-spacing between the repeating units, θ is
half of the angle of the diffraction line.
The d-spacing of mesophases are between 2 - 50 nm, therefore the diffraction
lines of mesophase are at the range of 0.3° – 10°, 2θ values.The XRD patterns also
provide valuable information about the particle size of the crystalline particles on the
walls. The width of the diffraction line become broader as the particle size is reduced to
nanoscale ( smaller than about 200 nm), which is formulated as Scherrer’s formula, see
equation 3.1.2.
D=0.9λ/Bcosθ (eq 3.1)
where λ is the wavelength of the X-ray, B is the correlated full width half maximum in
radian, θ is half of the angle of the diffraction line.
The d-spacing of meso-xCd(II)-yTiO2 samples may respond to changes in the
amount of ingredient and reaction conditions, like humidity. Table 3.1.1 displays the
first 3 XRD patterns and the corresponding d-spacing of the meso-xCd(II)-yTiO2
samples prepared at ambient conditions. The d-spacing of the (100) plane of the meso-
2Cd(II)-yTiO2 (where y is 12, 20, and 28) samples decreases with increasing titania
amount in the samples. The d-spacing of the meso-xCd(II)-12TiO2 (where x is 2, 4, 6, 8,
10) samples also decrease with increasing Cd(II) content of the samples. Increasing the

62
inorganic components, titania and Cd(II) species, decreases the unit cell of the
mesophase and/or mesostructured films. This must be due to better packing of organic
and inorganic in the mesostructure. The LC like to soft material to rigid mesostructured
titania transitions have the same origin. The inorganic-organic interaction can be
monitored using FT-IR spectroscopy. Figure 3.1.22 displays the FT-IR spectra of the
meso-xCd(II)-12TiO2 samples (where x is 2, 6, and 10). In these spectra, the surfactant
peak at 1106 cm-1
due to υ(C-O) shifts to 1080 cm-1
with increasing Cd(II) mole ratio in
the sample. This shift is due to hydrogen bonding between the ethylene oxide unit of the
surfactant and the coordinated water molecules or the M-OH sites of the framework.
Therefore the shrinkage in the mesostructure can be due to changes on the shell of the
templating micellar P123, which shrinks due to above interactions.
Table 3.1.1 The first three diffraction lines and corresponding d- spacing of sample
prepared at ambient conditions.
1st line (2θ)
d-spacing (Å)
2nd line (2θ)
d-spacing (Å)
3rd line (2θ)
d-spacing (Å)
meso-2Cd(II)-12TiO2 0,91° 97 1,76° 50,1 2,62° 33,7
meso-2Cd(II)-20TiO2 0,94° 93,9 1,79° 49,3
meso-2Cd(II)-28TiO2 1,02° 86,5 1,95° 45,2
meso-2Cd(II)-12TiO2 0,91° 97 1,76° 50,1 2,62° 33,7
meso-4Cd(II)-12TiO2 0,91° 97 1,77° 49,9
meso-6Cd(II)-12TiO2 0,91° 97 1,75° 50,4
meso-8Cd(II)-12TiO2 0,98° 90 1,84° 47,9
meso-10Cd(II)-12TiO2 0,99° 89,1 1,87° 47,2
meso-12Cd(II)-12TiO2 0,99° 89 1,93° 45,7

63
Figure 3.1.22 The FT-IR spectrum of the samples a) meso-2Cd(II)-12TiO2, b) meso-6Cd(II)-
12TiO2, c) meso-10Cd(II)-12TiO2. The inset is a FT-IR spectra of the same sample in the 1050-
1150 cm-1
region.
Humidity of the reaction medium also affects the d-spacing of the meso-xCd(II)-
yTiO2 samples. Table 3.1.2 displays the first 3 XRD lines and the corresponding d-
spacing of the meso-xCd(II)-yTiO2 samples prepared under 50% humidity at 30°C. The
meso-2Cd(II)-yTiO2 (where y is 12, 20, 28, 40, 60, and 80) samples shrink as the titania
amount in the sample increases up to 40 mole ratio (also the limit of rigid
mesostructured titania). Above this titania mole ratio, further increasing both titania and
cadmium amounts don’t change the d-spacing of the as-synthesized mesostructures, see
Table 3.1.2. This behavior is likely due to the fact that at small titania amounts the
materials are LC like and soft (not fully polymerized, not connected), so the humidity
can increases the size of the ethylene oxide domains by absorption of water to the
1000 1200 1400 1600
0,0
0,6
1,2
1,8
c)
b)
Ab
so
rba
nc
e (
a.u
.)
Wavenumber (cm-1)
a)1050 1100 1150
0,8
1,0
1,2
c) b)
Ab
so
rba
nc
e (
a.u
.)
Wavenumber (cm-1)
a)

64
hydrophilic parts. However, as the titania amount increases, the titania polymerization
and aggregation determines the d-spacing, 9.2 nm, and remains unaltered.
Table 3.1.2 The first three diffraction lines and corresponding d- spacing of samples
prepared under controlled 50% humidity at 30°.
1st line d-spacing 2nd line d-spacing 3rd line d-spacing
meso-2Cd(II)-12TiO2 0,79 111,7 1,57 56,22 2,39 37
meso-2Cd(II)-20TiO2 0,85 103,8 1,65 53,4 2,47 35,7
meso-2Cd(II)-28TiO2 0,86 102,6 1,69 52,23 2,53 34,8
meso-2Cd(II)-40TiO2 0,83 106,3 1,63 54,15 2,43 36,3
meso-2Cd(II)-60TiO2 0,96 92 1,88 46,9
meso-2Cd(II)-80TiO2 0,96 92 1,84 47,9
meso-0Cd(II)-60TiO2 0,96 92 1,86 47,4 2,77 31,9
meso-2Cd(II)-60TiO2 0,96 92 1,88 46,9
meso-5Cd(II)-60TiO2 0,95 92,9 1,83 48,2
meso-10Cd(II)-60TiO2 0,96 92 1,84 48
meso-13Cd(II)-60TiO2 0,97 91 1,84 48
65
CHAPTER 2
3.2.1 Synthesis of meso-CdS-TiO2 Couples
The materials consist of two semiconductors may have unique properties. The
materials synthesized in this thesis have a potential of having two coupled
semiconductors, one with a large band gap titania and the other with a band gap in the
visible region of the electromagnetic spectrum, namely CdS or CdSe. The synthesis of
CdS nanoparticles in silica matrix[47] or directly in a mesophase of Cd(II) have been
successfully demonstrated[97]. The synthesis of CdS nanoparticles both in the LC
mesophase and mesoporous silica has been carried by exposing the Cd(II) containing
samples to H2S that can also be employed for the synthesis of meso-CdS-TiO2.
The optimized H2S reactions have been carried in a vacuum chamber by first
evacuating the chamber, where the samples were exposed to 200 torr H2S for 5 minutes
at room temperature. The product is denoted as meso-xCdS-yTiO2 (where x and y are the
same as the prepared samples of meso-xCd(II)-yTiO2) after the H2S reaction. The CdS
nanoparticles can be characterized using UV-Vis spectroscopy. The bulk CdS has a band
gap of 2.42eV, which correspond to an absorption edge at 512 nm. As the particle size of
the CdS particles get smaller, the absorption edge blue shifts to smaller wavelengths.
Moreover, the sharpness of the absorption edge is an indication of uniform size
distribution. The particle size and the band-gap of the nanoparticles can be determined
from the UV-Vis absorption spectra[126-128]. In this thesis we have used Sarma et al.’s
approach[128] to calculate the particle size of the CdS particles. This approach uses the

66
tight-binding (TB) model to evaluate the electronic structure of II-IV semiconductors in
real space, developed for bulk II-IV semiconductors. The equation 3.2.1 is an empirical
formula to calculate the band gap shifts due to particle size. The values of a1, b1, a2, b2
for CdS nanoparticles are 2.83, 8.22, 1.96, 18.07, respectively[128]. Figure 3.2.1 shows
a plot of band gap shift (ΔEg) versus d (particle diameter) using the empirical formula.
ΔEg=a1e-d/b1
+ a2e –d/b2
(eq 3.2.1)
Figure 3.2.1 Plot of band gap shift (ΔEg) of CdS, obtained from equation 3.2.1, versus particle
size (Å). The inset is the same plot showing the regions used in this thesis.
10 20 30 40 50 60 70 80
0,0
0,5
1,0
1,5
2,0
Ba
nd
Ga
p S
hif
t (e
V)
Particle Size(A)
30 35 40 45 50
0,10
0,15
0,20
0,25
0,30
0,35
0,40
0,45
0,50
0,55
0,60
Ba
nd
Ga
p S
hif
t (e
V)
Particle Size (A)

67
Figure 3.2.2 A) The small angle XRD patterns of the a) fresh meso-5Cd(II)-5TiO2, b) fresh
meso-5CdS-5TiO2, c) fresh meso-10CdS-5TiO2, and d) fresh meso-10CdS-5TiO2. B) The UV-
Vis spectrum of the a) fresh meso-5Cd(II)-5TiO2 and fresh meso-5CdS-5TiO2, b) fresh meso-
10CdS-5TiO2 and fresh meso-10CdS-5TiO2.
The samples, obtained from the mesoordered regions (LC like, soft, and rigid
materials) of meso-xCd(II)-yTiO2 are exposed to a H2S atmosphere to produce meso-
xCdS-yTiO2, The amounts of titania and Cd(II) in the sample decide the mesostructure is
maintained or collapsed upon H2S reaction. Figure 3.2.2A displays the small angle XRD
patterns of the meso-5Cd(II)-5TiO2 and meso-10Cd(II)-5TiO2 before and after H2S
reaction. The fresh meso-5Cd(II)-5TiO2 sample has 2 sharp diffraction lines at 0.87 and
1.67°, 2θ. However, after the reaction only a very broad diffraction remains at 1.71, 2θ.
However the fresh meso-10Cd(II)-5TiO2 sample has 3 diffractions at 0.85, 1.68 and
2.53°, 2θ, and upon H2S reaction all the diffraction lines disappear and the mesoorder
collapses. Figure 3.2.2B displays the UV-Vis absorption spectra of the meso-5Cd(II)-
5TiO2 and meso-10Cd(II)-5TiO2 samples before and after H2S reaction. The bands at
0,6 0,9 2 3 4
x5
x5
x5
d)
c)
Re
l. I
nte
ns
ity
(c
ps
)
2
a)
b)
x0.1
x5
20
00
0
200 300 400 500 600
a)
Re
l. A
bs
orb
an
ce
(a
.u.)
Wavelength (nm)
b)
CdS(Bulk)
0.2

68
204 nm, 290 nm and 480 nm can be assigned to nitrate, titania and CdS, respectively.
The meso-xCd(II)-5 TiO2 samples collapses upon H2S reaction, which is due to lack of
enough inorganic components (titania) in the samples.
The fresh samples are mesostructured due to Cd(II) with its coordinated water
spheres that disappear with H2S reaction. The amount of CdS and TiO2 is too low to
keep the mesostructure. The particle size were determined using UV-Vis absorption
spectra, where the spectra are plotted using a direct band gap relation (A2 x hυ
2 versus
hυ, not shown). The band gap energy was obtained by extrapolating the linear region of
the band-edge to zero. The CdS particles are typically around 4.1 nm in the LC like and
soft material region of the phase diagram.
Figure 3.2.3 The small angle XRD diffraction lines of as prepared (top) and after H2S reaction
(bottom) of the samples a) meso-2Cd(II)-12TiO2, b) meso-4Cd(II)-12TiO2, c) meso-6Cd(II)-
12TiO2, d) meso-8Cd(II)-12TiO2, e) meso-10Cd(II)-12TiO2.
0,9 2 3 4
x5
x5
x5
x5
e)
d)
c)
b)
Re
l. I
nte
ns
ity
(c
ps
)
2
x0.1
a)
as prepared
H2S
x5
20
00
0

69
Figure 3.2.4 The UV-Vis spectra of the samples a) meso-2CdS-12TiO2, b) meso-4CdS-12TiO2,
c) meso-6CdS-12TiO2, d) meso-8CdS-12TiO2, and e) meso-10CdS-12TiO2. The inset displays
the UV-Vis spectra of the a) meso-0Cd(II)-12TiO2, b) meso-2CdS-12TiO2, c) meso-4CdS-
12TiO2, d) meso-6CdS-12TiO2, and e) meso-8CdS-12TiO2.
The mesostructure, upon H2S reaction, can be maintained as the mole ratio of
titania/P123 increases in the samples. Figure 3.2.3 displays the small angle XRD
diffraction patterns of the samples before and after the H2S reaction of the meso-xCd(II)-
12TiO2 samples. The fresh meso-2Cd(II)-12TiO2 and meso-4Cd(II)-12TiO2 samples
have 3 diffraction lines at 0.95, 1.79 and 2,67°, 2θ, which shift to higher angles after H2S
reaction. The meso-6Cd(II)-12TiO2, meso-8Cd(II)-12TiO2 and meso-10Cd(II)-12TiO2
samples have 2 diffractions at 0.96 and 1.84°, 2θ. The mesoorder, is maintained after the
200 300 400 500 600
0,0
0,5
1,0
1,5
2,0
2,5
3,0
3,5
e)
d)
c)
b)
Ab
so
rba
nc
e (
a.u
.)
Wavelength (nm)
a)
350 400 450 500 550
0,0
0,1
0,2
0,3
e)
d)
c)
b)A
bs
orb
an
ce
(a
.u.)
Wavelength (nm)
a)

70
H2S reaction at small Cd(II) contents (2, 4, 6 Cd(II)/P123 mole ratio). Moreover, the
mesostructure almost collapse (diffraction lines become broader) at high (8, 10)
Cd(II)/P123 mole ratios in the low titania side of the phase diagram. Figure 3.2.4
displays the UV-Vis spectra of a series of meso-xCdS-12TiO2 samples ( where x is 2, 4,
6, 8 and 10). The inset shows the absorption edge of the Cds particles in the meso-xCdS-
12TiO2 samples.The upper titania region of the LC like materials maintain the
mesoorder through H2S reaction, different from the low titania region. Only the samples
with higher content (8, 10 Cd(II)/P123 mole ratio) of Cd(II), almost loose the
mesoorder.
The soft materials behave a little bit different from LC like materials in terms of
mesoorder, and same in terms of particle size and UV-Vis absorptions. Figure 3.2.5
displays the small angle XRD patterns of the meso-xCd(II)-24TiO2 samples before and
after H2S reactions. The meso-2Cd(II)-24TiO2 sample has 2 diffraction lines at 0.94 and
1.83°, 2θ, after H2S reaction with a 2% enlargement of the mesostructure and a third
diffraction appears at 2.73° , 2θ. As the amount of titania reaches considerably high
amounts, the mesostructure is maintained after H2S reaction. Additionally, in the soft
material region of the phase diagram, the H2S reaction increases the mesoorder.
Furthermore, as the titania amounts further increased, the CdS nanoparticles also behave
as the building blocks in or on the pore walls, where the intensity of the diffraction lines
increases and the d-spacing increases about 2%. The CdS particle size is almost the same
in all samples ( 4.0 nm).

71
Figure 3.2.5 The small angle XRD diffraction lines of the samples fresh (top) and after reaction
(bottom) a) meso-2Cd(II)-24TiO2, b) meso-4Cd(II)-24TiO2, c) meso-6Cd(II)-24TiO2, d) meso-
8Cd(II)-24TiO2, e) meso-10Cd(II)-24TiO2.
The meso-xCdS-yTiO2 samples have reasonable amounts of CdS nanoparticles
incorporated in the film, however ageing chemically decompose the CdS nanoparticles.
Previous attempts in our group show that exposing H2S gas directly to the as prepared
meso-xCd(II)-yTiO2 samples might be problematic. Because the H2S produces extensive
amount of HNO3 acid that react with the CdS nanoparticles and decompose the particles
back to Cd(II) and NO3- ions and H2S in the mesoporous silica[47], see equation 3.2.2.
Figure 3.2.6 displays the UV-Vis spectra of the meso-10CdS-20TiO2 sample with
ageing; the absorption edge due to CdS loose intensity throughout ageing. It means that
the nitrate ions, before H2S reaction, or HNO3 acid, after H2S reaction, need to be
0,9 1,2 2 3 4
x5
x5
x5
x5
e)
d)
c)
b)
Re
l. I
nte
ns
ity
(c
ps
)
2
x0.1a)
x5
20
00
0

72
removed from the samples to stabilize the CdS particles in the pore walls of meso-CdS-
TiO2 films.
[Cd(H2O)2](NO3)2 + H2S CdS + 2 HNO3 + 2H2O (eq
3.2)
Figure 3.2.6. The UV-Vis spectra of the meso-10CdS-20TiO2 sample throughout ageing; a) as-
synthesized, b) aged 2 days, c) aged 1 week, and d) a fresh meso-10Cd(II)-20TiO2 sample.
3.2.2 Removal of the NO3- ions from meso-Cd(II)-TiO2 samples
The nitrate ions have very beneficial properties in stabilizing highly reactive
titania particle and also it positively affects the micellization of the surfactant molecules
and organization of metal species. Further, they behave as counter ions of the Cd2+
ions.
However, the HNO3 acid that forms upon H2S attacks to the nanocrystalline CdS
particles in the matrix. Washing the titania samples, due to high reactivity of titania
320 360 400 440 480 520
0,0
0,2
0,4
0,6
0,8
d)
c)
b)
Ab
so
rba
nc
e (
a.u
.)
Wavelength (nm)
a)

73
towards condensation reaction under aqueous media, destroys the mesostructure.
Therefore washing the sample is not an appropriate method for the titania case.
Figure 3.2.7 The FT-IR spectra of A) the meso-2Cd(II)-20TiO2 heated to different temperatures;
a) as prepared, b) 50°C, c) 100°C, and d) 150°C, B) the meso-10Cd(II)-20TiO2 heated to
different temperatures; a) as prepared, b) 50°C, c) 100°C, and d) 150°C, C) the meso-2Cd(II)-
60TiO2 heated to different temperatures; a) as prepared, b) 50°C, c) 100°C, and d) 150°C, and D)
the meso-10Cd(II)-60TiO2, heated to different temperatures; a) as prepared, b) 50°C, c) 100°C,
and d) 150°C.
600 900 1200 1500 1800
d)
c)
b)a)
Re
l. A
bs
orb
an
ce
(a
.u.)
Wavenumber (cm-1)
A)
0.2
600 900 1200 1500 1800
Re
l. A
bs
orb
an
ce
(a
.u.)
Wavenumber (cm-1)
a)
b)
c)
d)
B)
0.2
600 900 1200 1500 1800
d)
c)
b)Re
l. A
bs
orb
an
ce
(a
.u.)
Wavenumber (cm-1)
a)
c)
0.2
600 900 1200 1500 1800
d)
c)
b)Re
l. A
bs
orb
an
ce
(a
.u.)
Wavenumber (cm-1)
a)
D)
0.2

74
The other methods might be applied to eliminate the nitrate ion other than
washing the samples with water; one of them is heating the samples to decompose the
nitrates into NOx species or directly evaporating as nitric acid. This method seems to
work, but the heating temperature must be less than 150°C, because the pluronic
surfactant starts to decompose from the propoxides (PPO) at around 150°C[82]. Figure
3.2.7 A, B, C, and D display the FT-IR spectra of the meso-2Cd(II)-20TiO2, meso-
10Cd(II)-20TiO2, meso-2Cd(II)-60TiO2, and meso-10Cd(II)-60TiO2 samples throughout
heating processes. The peaks at 1019 cm-1
, 1288 cm-1
, 1473 cm-1
and 1561 cm-1
in each
figure are due to nitrate ions coordinated to Cd2+
metal center and titania. Throughout
heating process, the intensity of these peaks decreases and at around 150°C, they almost
disappear, in both soft like and rigid mesostructured titania materials. However at 150°C,
the decomposition of surfactant may also start, so the samples were heated at 130°C for
4 hours to remove nitrates. Titania plays an important role in the decomposition of
nitrates (discussed later). Moreover in all the spectra in Figure 3.2.7, the polymerization
of titania can also be observed from the broad peak at around 540 cm-1
; the absorbance
of this peak increases by increasing the heating temperature. Removing nitrates from
titania sites enhances the polymerization and growth of titania species.

75
Figure 3.2.8 The small angle XRD patterns of the a) as prepared meso-2Cd(II)-20TiO2, b) meso-
2Cd(II)-20TiO2 heated at 130°C, c) as prepared meso-2Cd(II)-60TiO2, d) meso-2Cd(II)-60TiO2
heated at 130°C, e) as prepared meso-10Cd(II)-60TiO2, and f) meso-10Cd(II)-60TiO2 heated at
130°C.
However eliminating nitrates directly by heating at 130°C has some drawbacks at
low titania/P123 mole ratios. The mesoorder of the samples in the LC like and soft
materials regions collapses upon heating at 130°C. Therefore this method can only be
used for rigid mesostructured titania materials. Figure 3.2.8 displays the small angle
XRD patterns of the as prepared and heated (at 130°C) samples of meso-2Cd(II)-20TiO2,
meso-2Cd(II)-60TiO2 and meso-10Cd(II)-60TiO2. The meso-2Cd(II)-20TiO2 sample has
4 diffraction lines at 0.94, 1.78, 2.66, and 3.52°, 2θ. After heating the sample at 130°C
all diffraction lines disappear. The as prepared meso-2Cd(II)-60TiO2 sample has only 2
sharp diffraction lines at 0.95 and 1.84°, 2θ, only a diffraction at 1.23, 2θ, remains after
0,6 0,9 1,2 2 3 4
f)e)
d)c)
b)
Re
l. I
nte
ns
ity
(c
ps
)
2
a)
20
00
0

76
heating process. The samples of LC like and soft materials due to lack of enough titania
and the rapid polymerization of titania, collapse upon removal of nitrate ions, see Figure
3.2.7A and Figure 3.2.7B. Only rigid mesostructured materials are stable in this heating
process and removal of nitrate species.
Figure 3.2.9 The UV-Vis spectra of the meso-2Cd(II)-60TiO2 throughout heating process a) as
prepared, b) heated 2 hours at 130°C, and c) heated 4 hours at 130°C. The inset is a UV-Vis
spectra of the same sample in the 200-300 nm region.
The removal of nitrate ion can also be monitored using UV-Vis spectroscopy.
Figure 3.2.9 displays the UV-Vis spectra of the meso-2Cd(II)-60TiO2 upon ageing at
130°C, the inset also shows the same spectra with a closer view of nitrate region. The
absorption band at 204 nm is due to nitrate and the broad shoulder at around 250 nm,
which tails down to 330 nm is due to titania. Throughout ageing, the band at 204 nm
loses intensity, an isosbestic point at 230 nm forms and a red shift of titania band is
200 300 400 500 600
c)b)
Re
l. A
bs
orb
an
ce
(a
.u.)
Wavelength (nm)
a)
0,4
200 250 300 350
1,5
2,0
2,5
3,0
3,5
c)b)
Ab
so
rba
nc
e (
a.u
.)
Wavelength (nm)
a)230 nm
77
observed. These collectively indicate that a single step decomposition of the nitrate from
the media and a further polymerization of titania occur. These results are also consistent
with the observation in the FT-IR spectra of the same sample, see Figure 3.2.7C.
3.2.3 Stabilized meso-CdS-TiO2 samples
The rigid mesostructured titania materials are suitable for synthesizing stable
meso-xCdS-yTiO2 materials, and among them 60 titania/P123 mole ratio works the best
in this system. The stable CdS nanoparticles are produced by exposing the samples to
H2S gas for 5 minutes, 3 times, in an evacuated vacuum chamber, upon aging the sample
at 130°C for 4 hours. Figure 3.2.10 displays a series of small angle XRD patterns of the
as prepared (top), aged 130°C for 4 hours (middle) and after H2S reacted (down) samples
of meso-xCd(II)-60TiO2 (where x is 2,5,10,13). The diffraction lines of all the samples
shift to higher angles, corresponding to shrinkage of 15% to 20% upon ageing at 130°C.
Further, a small enlargement (about 2%) in the mesoorder occurs upon H2S reaction.
These collectively indicate that the mesoorder in the samples is maintained throughout
the ageing and H2S treatments. The ageing causes 15 to 20% shrinkages due to
condensation of titania, the peak at around 540 cm-1
also proves this proposal, see Figure
3.2.7C and Figure 3.2.7D.
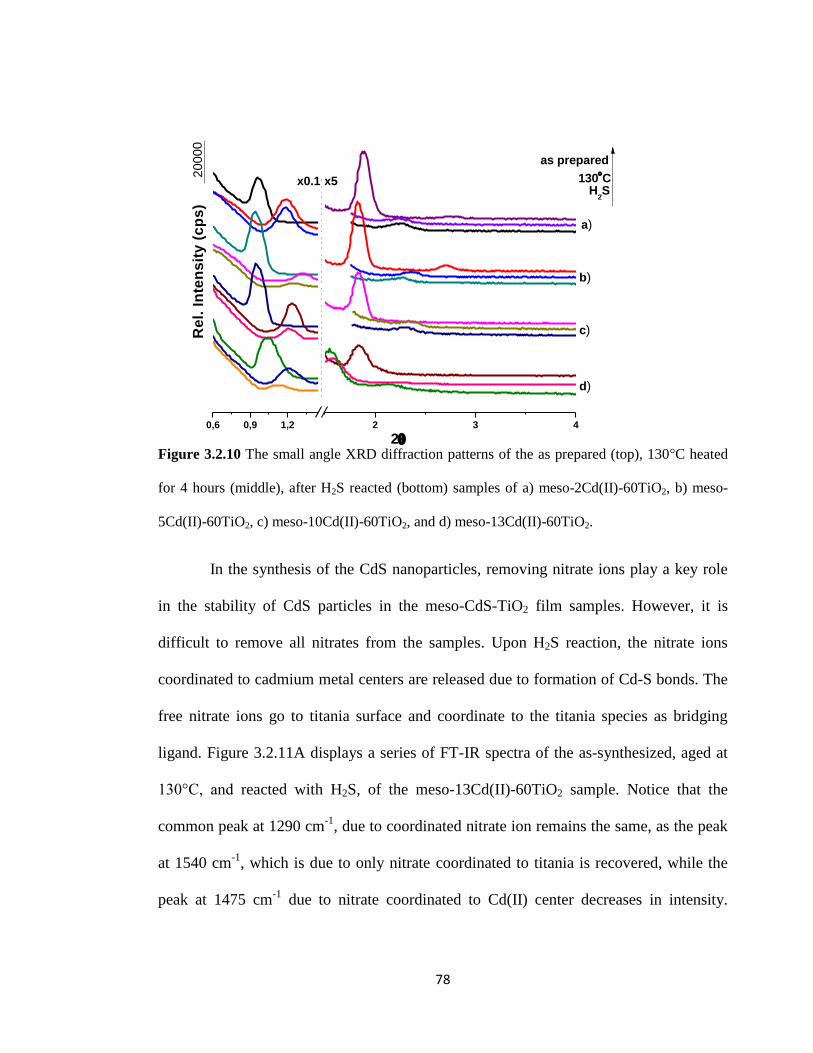
78
Figure 3.2.10 The small angle XRD diffraction patterns of the as prepared (top), 130°C heated
for 4 hours (middle), after H2S reacted (bottom) samples of a) meso-2Cd(II)-60TiO2, b) meso-
5Cd(II)-60TiO2, c) meso-10Cd(II)-60TiO2, and d) meso-13Cd(II)-60TiO2.
In the synthesis of the CdS nanoparticles, removing nitrate ions play a key role
in the stability of CdS particles in the meso-CdS-TiO2 film samples. However, it is
difficult to remove all nitrates from the samples. Upon H2S reaction, the nitrate ions
coordinated to cadmium metal centers are released due to formation of Cd-S bonds. The
free nitrate ions go to titania surface and coordinate to the titania species as bridging
ligand. Figure 3.2.11A displays a series of FT-IR spectra of the as-synthesized, aged at
130°C, and reacted with H2S, of the meso-13Cd(II)-60TiO2 sample. Notice that the
common peak at 1290 cm-1
, due to coordinated nitrate ion remains the same, as the peak
at 1540 cm-1
, which is due to only nitrate coordinated to titania is recovered, while the
peak at 1475 cm-1
due to nitrate coordinated to Cd(II) center decreases in intensity.
0,6 0,9 1,2 2 3 4
d)
c)
b)
Re
l. I
nte
ns
ity
(c
ps
)
2
a)
x0.1 x5
as prepared
130C
H2S
20
00
0

79
These indicate that the nitrate ions coordinated to Cd(II) are replaced by Cd-S bonds and
the liberated nitrate ions coordinate to titania surface. Figure 3.2.11B displays a series of
FT-IR spectra of the meso-13CdS-60TiO2 sample throughout ageing process. The signal
at 1540 cm-1
totally disappears upon 6 days of ageing.
Figure 3.2.11 The FT-IR spectrum of the A) meso-13Cd(II)-60TiO2 a) as-synthesized, b) aged at
130°C, c) after H2S reactions; and B) meso-13CdS-60TiO2 sample throughout ageing at ambient
conditions at room temperature after H2S reaction a) fresh, b) 1day aged, c) 3 days aged, d) 6
days aged.
The first question is: does all the cadmium source (Cd(II), CdO, Cd(OH)2) react
and form CdS? This is investigated using the EDS data. Figure 3.2.12 displays a series
of EDS spectra of the meso-xCdS-60TiO2 samples and the EDS of a reference bulk CdS.
The intensity ratio of Cd/S is around 1 in the bulk CdS. The ratio in the meso-xCdS-
60TiO2 samples is also 1.0. Moreover, Figure 3.2.12B displays a plot of the mole ratio of
the Cd/Ti in the sample versus the EDS intensity ratio of S/Ti. All the points are on a
1000 1200 1400 1600 1800
c)
Wavenumber (cm-1)
a)
b)
A)0.3
Re
l. A
bso
rba
nce
(a
.u.)
400 800 1200 1600
d)
c)
b)
Re
l. A
bs
orb
an
ce
(a
.u.)
Wavenumber (cm-1)
a)
B)0.2

80
straight line, indicating that the amount of S in the sample is proportional to the amount
of Cd(II) in the sample, further this linear correlation also shows that the CdS
nanoparticles are homogeneously distributed in the films samples. Note that each point is
obtained using an average of 3 measurements.
Figure 3.2.12 A) The EDS spectra of the a) bulk CdS, b) meso-2CdS-60TiO2, c) meso-5CdS-
60TiO2, d) meso-10CdS-60TiO2, and e) meso-13CdS-60TiO2; B) The plot of the Cd/Ti mole
ratios versus the S/Ti intensity ratios.
The nanocrystalline CdS in meso-xCdS-yTiO2 samples can also be detected
using high angle XRD patterns. The diffraction lines are very broad due to the nature of
CdS particles, which are nanocrystalline. Figure 3.2.13A displays the high angle XRD
diffraction pattern of the meso-13CdS-60TiO2 thick sample. The broad diffraction lines
at 26.17, 43.62, 52.23°, 2θ are characteristic for (111), (200), (311) planes of the zinc
blend CdS nanoparticles (ICDD[00-001-0647]). Figure 3.2.13B displays the UV-Vis
Spectrum of the meso-13CdS-60TiO2 thick sample. The absorbtion edge at 480 nm is
due to CdS nanoparticles. The particle size of the nanoparticles calculated using
Scherre’s formula from the high angle XRD data is 3.8 nm. This value is also consistent
1,5 3,0 4,5 6,0
0
2000
4000
6000
8000
e)
d)
c)
b)Re
l. I
nte
ns
ity
(c
ps
)
Energy (ev)
a)
Si
S Cd
Ti
0,00 0,05 0,10 0,15 0,20 0,25
0,0
0,1
0,2
0,3
0,4
0,5
S/T
i E
DS
In
te
ns
ity
Ra
tio
Cd/Ti Mole Ratio

81
with the value obtained from Sharma’s empirical formula using the UV-Vis data. The
TEM images of these samples show the maintenance of the mesoorder and some
crystalline features in the pore walls of the structrure. Figure 3.2.14 displays the TEM
images of the meso-10CdS-60TiO2 sample, which is calcined at 300°C. The red circles
show crystalline domains of the samples. These regions might be due to both anatase
titania and CdS nanoparticles. Collecting high resolution HR-TEM images of the sample
is problematic, because the samples are very sensitive to electron beam. Therefore the
samples were calcinated at 300°C. At this temperature, the amourphous titania can be
crystallized to anatase phase. Therefore it is difficult to assign these nanocrystalline
domains to either titania or CdS.
Figure 3.2.13 A) The high angle XRD diffraction pattern of meso-13CdS-60TiO2 thick sample.
B) The UV-Vis spectrum of the meso-13CdS-60TiO2 thick sample.
10 20 30 40 50 60
200
300
400
500
600
700
800
(20
0)
(31
1)
Inte
ns
ity
(c
ps
)
2
(11
1)A)
350 400 450 500 550
0,0
0,5
1,0
1,5
Ab
so
rb
an
ce
(a
.u.)
Wavelength (nm)
B)

82
Figure 3.2.14 The TEM images of the as-synthesized meso-10CdS-60TiO2 sample aged at
300°C with different resolutions; a) scale bar is 50 nm, b) scale bar is 5 nm, and c) scale bar is 5
nm (red circles show crystalline domains)

83
4. CONCLUSION
In this thesis, the phase behavior of the mesostructured Cd(II) ion modified
titania thin films has been investigated by changing two components of the structure;
namely the [Cd(H2O)4](NO3)2 salt and Ti(OC4H9)4. The film samples can be obtained by
spin coating of a butanol solution of [Cd(H2O)4](NO3)2, P123, nitric acid and
Ti(OC4H9)4, denoted as meso-xCd(II)-yTiO2, where x is Cd(II)/P123 and y is TiO2/P123
mole ratios. The mesostructure is ordered in the range of 2 to 13 Cd(II)/P123 mole ratios
and up to 35 TiO2/P123 mole ratios. At very small titania and transition metal salt
contents (x<5 and y<2), the mesophase doesn’t form. Moreover, a phase separation
occurs at very small Cd(II) (x<2) and small titania ratios (y<15). At low titania (x<20)
and in the range of 2 to 13 Cd(II)/P123 mole ratios, the material behaves like liquid
crystal, but the mesophase collapses upon melting (irreversible thermal behavior). As the
amount of titania is increased in the media, the physical behavior of the film samples
change; the LC like materials transform to soft materials, which can be formed in the
range of 20 to 35 titania/P123, and up to 13 Cd(II)/P123 mole ratios. The soft material
region is in between rigid mesostructured materials and the LC like materials and
behaves like plastic: the film samples are very flexible. Further increases in the
titania/P123 mole ratio produces rigid mesostructured titania materials but due to high
resistivity of titania precursors towards humidity, the materials have to be produced

84
under controlled humidity. The rigid mesostructured materials can be produced up to 80
titania/P123 mole ratios.
The nitrate ions coordinates to both Cd(II) ions and TiO2 clusters, and gives extra
stability to titania walls. The coordination is as bidentate ligand in the case of Cd(II) and
bridged in the titania site.
The meso-xCd(II)-yTiO2 film samples are good candidates in order to produce
coupled semiconductors. Through H2S reaction, the Cd(II) ion can be converted into
CdS nanoparticles to form meso-CdS-TiO2 thin films. However, the mesoorder in the
LC like materials almost collapses upon H2S reaction, due to lack of enough inorganic
components. The small-angle XRD diffraction patterns of the soft and rigid materials do
not change upon H2S reaction, indicating that these two regions can be used to produce
meso-CdS-TiO2 films. However, upon H2S reaction excessive amount of nitric acid
forms that attacks and decomposes the CdS nanoparticles back to Cd(II), NO3- and H2S.
Therefore, the nitrate ions need to be eliminated from the film samples before H2S
reaction. The NO3- ion can be eliminated by heating the film samples at 130
◦C for 4
hours. This step ensures to remove almost 90% of the nitrate ions from the media.
However, the mesoorder in the LC like and soft materials collapse upon this heat
treatment; in which only the rigid materials remain mesostructured. Therefore, the H2S
reaction produces stable CdS nanoparticles on/in the titania walls of the rigid samples,
where the CdS particle size is between 3.8 and 4.1 nm. The film samples have electronic
absorption-edge at around 480 nm and displays broad diffraction lines due to zinc blend

85
structure of CdS nanoparticles. The TEM images also indicate that the CdS nanoparticles
are in the pores and/or on the walls of mesostructured titania.
The two components of meso-Cd(II)-TiO2 investigated in this thesis, namely
Cd(II) and titania have different effects on the mesostructure of the film samples.
Increasing titania (polymerizing component) in the media enhances the mechanical
properties of the mesostructure, whereas the non-polymerizing component, Cd(II) ion
influences the surfactant molecules, and as a result the structural properties of the meso-
Cd(II)-TiO2 film samples. The nitrate ions or any other anion in the films must be
eliminated before H2S to obtain stable mesostructured coupled semiconductors, meso-
CdS-TiO2. Film samples can also be reacted with H2Se to form meso-CdSe-TiO2 or
reacted with a reducing agent to produce metal containing mesostructured titania
materials. Therefore the method developed in this thesis is general to couple two
different materials (two semiconductors, or metal-semiconductor) on the pore walls of
mesostructured titania.

86
5. REFERENCES
[1] IUPAC Manual of Symbols and Terminology, Appendix 2, Part 1, Colloidal and
Surface Chemistry 31, 578, 1972.
[2] Behrens, P., Mesoporous Inorganic Solids. Advanced Materials 1993, 5, (2), 127-
132.
[3] Imhof,A.; Pine, D. J., Ordered macroporous materials by emulsion templating.
Nature 1997, 389, (6654), 948-951.
[4] Antonelli, D. M. Synthesis of macro-mesoporous niobium oxide molcular sieves by a
ligand-assisted vesicle templating strategy. Microporous and Mesoporous Materials.
1999, 33, (1-3), 209-214.
[5] Sepulveda, P.; Binner, J. G. P.Processing of cellular ceramics by foaming and in situ
polymerization of organic monomers. Journal.of European Ceramic Society 1999, 19,
(19), 2059-2066.
[6] Velev, O. D.;Jede, T. A.; Lobo, R. F.; Lenhoff, A. M., Porous silica via colloidal
crystallization. Nature 1997, 389, (6650), 447-448.
[7] Holland, B. T.; Blanford, C. F.; Stein, A., Synthesis of macroporous minerals with
highly ordered three-dimensional arrays of spheroidal voids. Science 1998, 281, (5376),
538-540.
[8] Wilson, S. T.; Lok, B. M.; Messina, C. A.; Cannan, T. R.; Flanigen, E. M.
Aluminophosphate Molecular-Sieves- a New Class of Microporous Crystalline
Inorganic Solids. Journal of American Chemical Society 1982, 104, (4), 1146-1147.
[9] Wilson, S. T.; Lok, B. M.; Flanigen, E. M. U.S. Patent 4,320,440; 1982.

87
[10] Cheetham, A. K.; Ferey, G.; Loiseau, T., Open-framework inorganic materials.
Angewandte Chemie-International Edition 1999, 38, (22), 3268-3292.
[11] Izumi, Y.; Urabe K.; Onaka, M. Zeolite Clay and Heteropoly Acid in Organic
Reactions, Kodansha, 1992.
[12] Weller, M. T. Inorganic Materials Chemistry, Oxford Press, 1994.
[13] Thomas, J. M.; Catlow, C. R. A.; Sankar, G. Determining the structure of active
sites, transition states and intermediates in heterogeneously catalysed reactions Chemical
Communications 2002, (24), 2921-2925.
[14] Vaughan, D. E. W, Lussier, R. J. In Proceedings of the 5th
International Conference
on Zeolites, 1980.
[15] Meier, W. M.; Zeolites and Zeolite-Like Materials. Pure and Applied Chemistry
1986, 58, (10), 1323-1328.
[16] Davis, M. E.; Saldarriaga C.; Montes, C.; Garces, J.; Crowder, C. A Molecular-
Sieve with 18-Membered Rings. Nature 1988, 331, (6158), 698-699.
[17] Estermann, M.; McCusker, L. B.; Baerlochcr, C.; Merrouche, A.; Kessler, H. A
Synthetic Gallophosohate Molecular-Sieve with a 20-Tetrahedral-Atom Pore Opening.
Nature 1991, 352, (6333), 320-323.
[18] Kresge, C.T.; Leonowicz, M.E.; Roth, W.J.; Vartuli, J.C.; Beck, J.S., Ordered
Mesoporous Molcular-Sieves Synthesized by a Liquid-Crystal Template Mechanism.
Nature 1992, 359, (6397), 710-712.
[19] Navrotsky, A.; Petrovic, I.; Hu, Y; Chen, C.Y.; Davis, M. E. In Energrtics of
Microporous Materials, 6th
International Conference on the Strucutre of Non-Crysalline
Material, 1994.

88
[20] Huo, Q. S.; Margolese, D. I.; Ciesla, U.; Feng, P. Y..; Gier, T. E.; Sieger, P.; Leon,
R.; Petroff, P. M.; Schuth, F.; Stucky, G. D., Generalized Synthesis of Periodic
Surfactant Inorganic Composite-Materials. Nature 1994, 368, (6469), 317-321.
[21] Li, W. Z.; Xie, S. S.; Qian, L. X.; Chang, B. H.; Zou, B. S.; Zhou, W. Y.; Zhao, R.
A.; Wang, G.; Large-scale synthesis of aligned carbon nanotubes. Science 1996, 274,
(5293), 1701-1703.
[22] Bagshaw, S. A.; Prouzet, E.; Pinnavaia, T. J., Templating of Mesoporous
Molecular-Sieves by Nonionic Polyethylene Oxide Surfactants. Science 1995, 269,
(5228), 1242-1244.
[23] Zhao, D.; Feng, J.; Huo, Q.; Chmelka, B.F.; Stucky G.D. Nonionic triblock and star
diblock copymer and oligomeric surfactant syntheses of highly ordered, hydrothermally
stable, mesoporous silica strucutres. Journal of the American Chemical Society 1998,
120, (24), 6024-6036.
[24] Ying, J. Y.; Mehnert, C.P.; Wong, M.S. Synthesis and application of
supramolecular-templated mesoporous materials. Angewandte Chemie-International
Edition. 1999, 38, (1-2), 56-77.
[25] Wan. Y.; Shi, Y. F.; Zhao, D. Y., Designed synthesis of mesoporous solids via
nonionic-surfactant-templating approach. Chemical Communications 2007, (9), 897-926.
[26] Yang, H.; Coombs, N.; Ozin, G.A. Morphogensis of shapes and surface patterns in
mesoporous silica. Nature 1997, 386, (6626), 692-695.
[27] Yang, H.; Kuperman, A.; Coombs, N.; Mamiche, S.; Ozin, G.A. Synthesis of
oriented films of mesoporous silica on mica. Nature 1996, 379, (6567), 703-705.
[28] Attard, G.S.; Glyde, J.C.; Goltner, C.G. Liquid-Crystalline Phases as Templates for
the Synthesis of Mesoporous Silica. Nature 1995, 378, (6555), 366-368.

89
[29] Morey, M. S.; Davidson, A.; Stucky, G. D., Silica-based, cubic mesostrucutres,
Synthesis, characterization and relevance for catalysis. Journal of Porous Materials
1998, 5, (3-4), 195-204.
[30] Maschmeyer, T.; Rey, F.; Sankar, G.; Thomas, J. M., Heterogeneous Catalysts
Obtained by Grafting Metallocene Complexes onto Mesoporous Silica. Nature 1995,
378, (6553), 159-162.
[31] Dag, Ö.; Ozin, G. A.; Yang, H.; Reber, C.; Bussiere, G., Photoluminescent silicon
clusters in oriented hexagola mesoporous silica film. Advanced Materials 1999, 11, (6),
474-+.
[32] Yamada, T.; Zhou, H. S.; Uchida, H.; Tomita, M.; Ueno, Y.; Honma, I; Asai, K.;
Katsube, T., Application of a cubic-like mesoporous silica film to a surface photovoltage
gas sensing system. Microporous and Mesoporous Materials 2002, 54, (3), 269-276.
[33] Yamada, T.; Zhou, H. S.; Uchida, H.; Honma, I.; Katsube, T., Experimental and
theoretical NQ, physisorption analyses of mesoporous film (SBA-15 and SBA-16)
constructed surface photo voltage (SPV) sensor. Journal of Physical Chemstry B 2004,
108, (35), 13341-13346.
[34] Zhang, W.H.; Shi, J.L.; Chen, H.R.; Yan, D.S. Synthesis and characterization of
nanosized ZnS confined in ordered mesoporous silica. Chemistry of Materials 2001, 13,
(2), 648-654.
[35] Besson, S.; Gacoin, T.; Ricolleau, C.; Boilot, J.P. 3D quantum dot lattice inside
mesoporous silica films. Nano Letters 2002, 2, (4), 409-414.
[36] Dag, Ö.; Samarskaya, O.; Coombs, N.; Ozin, G.A. The synthesis of mesostrucutred
silica films and monliths functionalised by noble metal nanoparticles. Journal of
Materials Chemistry 2003, 13, (2), 328-334.

90
[37] Sanchez, C.; Lebeau, B.; Chaput, F.; Boilot, J. P., Optical properties of functional
hybrid organic-inorganic nanocomposites. Advanced Materials 2003, 15, (23), 1969-
1994.
[38] Feng, X.; Fryxell, G.E.; Wang, L.Q.; Kim, A. Y.; Kemner, K.M. Functionalized
monolayers on ordered mesoporous supports. Science 1997, 276, (5314), 923-926.
[39] Lai, C.Y.; Trewyn, B.G.; Jeftinija, D.M.; Jeftinija K.; Xu, S, Jeftinija, S.; Lin,
V.S.Y. A mesoporous silica nanosphere-based carrier system with chemically removable
CdS nanoparticle caps for stimuli-responsive controlled release of neurotransmitters and
drug molecules. Journal of the American Chemical Society 2003, 125, (15), 4451-4459.
[40] Scott, B.J.; Wirnsberger, G.; McGehee, M. D.; Chmelka, B. F.; Stucky, G.D. Dye-
doped mesostrucutred silica as a distributed feedback laser fabricated by soft
lithography. Advanced Materials 2001, 13, (16), 1231-1234.
[41] Yang, P. D.; Zhao, D. Y.; Margolese, D. I.; Chmelka, B. F.; Stucky, G. D.,
Generalized synthesis of large-pore mesoporous metal oxides with semicrystalline
frameworks. Nature 1998, 396, (6707), 152-155.
[42] Ciesla, U.; Demuth, D.; Leon, R.; Petroff, P.; Stucky, G. D.; Unger, K.; Schuth, F.,
Surfactant Controlled Preparation of Mesostructured Transition-Metal Oxide
Compounds. Journal of the Chemical Society-Chemical Communications 1994, (11),
1387-1388.
[43] Ciesla, U.; Schacht, S.; Stucky, G. D.; Unger, K. K.; Schuth, F., Formation of a
porous zirconium oxo phosphate with a high surface area by a surfactant-assisted
synthesis. Angewandte Chemie-International Edition 1996, 35, (5), 541-543.
[44] Besson, S.; Gacoin, T.; Ricolleau, C.; Jacquiod, C.; Boilot, J. P., 3D quantum dot
lattice inside mesoporous silica films. Nano Letters 2002, 2, (4), 409-414.

91
[45] Zhang, W. H.; Shi, J. L.; Chen, H. R.; Hua, Z. L.; Yan, D. S., Synthesis and
characterization of nanosized ZnS confined in ordered mesoporous silica. Chemistry of
Materials 2001, 13, (2), 648-654.
[46] Tura, C.; Coombs, N.; Dag, Ö., One pot synthesis of CdS nanoparticles in the
channels of mesostrucutred silca films and monoliths. Chemistry of Materials 2005, 17,
(3), 573-579.
[47] Akdoğan, Y.; Üzüm, Ç.; Dag, Ö.; Coombs, N.; Synthesis of solid solution of Cd1-
xZnxS nanocrystals in the channels of mesostructured silica films. Journal of Materials
Chemistry 2006, 16, (21), 20048-2055.
[48] Boettcher, S. W.; Fan, J.; Tsung, C. K.; Shi, Q. H.; Stucky, G. D., Harnessing the
sol-gel process for the assembly of non-silicate mesostrucutred oxide materials.
Accounts of Chemical Research 2007, 40, (9), 784-792.
[49] Choi, S. Y.; Mamak, M.; Coombs, N.; Chopra, N.; Ozin, G. A., Thermally stable
two-dimensional hexagonal mesoporous nanocrystalline anatase, meso-nc-TiO2: Bulk
and crack-free thin film morphologies. Advanced Functional Materials 2004, 14, (4),
335-344.
[50] Bagshaw, S. A.; Pinnavaia, T. J., Mesoporous alumina molecular sieves.
Angewandte Chemie-International Edition 1996, 35, (10), 1102-1105.
[51] Antonelli, D. M., Ying, J. Y., Synthesis of a stable hexagonally packed mesoporous
niobium molecular sieve through a novel ligand-assisted templating mechanism.
Angewandte Chemie-International Edition 1996, 35, (4), 426-430.
[52] Antonelli, D. M.; Ying, J. Y., Synthesis of Hexagonally Packed Mesoporous TiO2
by a Modified Sol-Gel Method. Angewandte Chemie-Internation Edition 1995, 34,(18),
2014-2017.
[53] Brinker, C. J.; Lu, Y. F.; Sellinger, A.; Fan, H. Y., Evaporation-induced self-
assembly: Nanostructures made easy. Advanced Materials 1999,11, (7), 579-+.
92
[54] Grosso, D.; Cagnol, F.; Soler-Illia, G.;Crepaldi, E. L.; Amenitsch, H.; Brunet-
Bruneau, A.; Bourgeois, A.; Sanchez, C., Fundamentals of mesostructuring through
evaporation-induced self-assembly. Advanced Functional Materials 2004, 14, (4), 309-
322.
[55] Hagfeldt, A.; Gratzel, M., Light-Induced Redox Reactions in Nanocrystalline
Systems. Chemical Reviews 1995, 95, (1), 49-68.
[56] Brinker C. J.; Scherer G. W., Sol-Gel Science: The Physics and Chemistry of Sol-
Gel Processing, Academic Press, Inc. 1990.
[57] Velasco, M. J.; Rubio, F., Rubio, J.; Oteo, J. L., Hydrolysis of titanium
tetrabutoxide. Study by FT-IR spectroscopy. Spectroscopy Letters 1999, 32, (2), 289-
304.
[58] Attard, G.S.; Barlett, P. N.; Coleman, N. R. B.; Elliott, J.M.; Owen, J. R.; Wang, J.
H., Mesoporous platinum films from lyotropic liquid crystaline phases. Science 1997,
278, (5339), 838-840.
[59] Templin, M.; Franck, A.; DuChesne, A.; Leist, H.; Zhang, Y. M.; Ulrich, R.;
Schadler, V.; Wiesner, U., Organically modified aluminosilicate mesostructures from
block coplymer phases. Science 1997, 278, (5344), 1795-1798.
[60] Soler-Illia, G.; Crepaldi, E. L.; Grosso, D.; Sanchez, C., Block coplymer-templated
mesoporous oxides. Current Opinion in colloid & Interface Science 2003, 8, (1), 109-
126.
[61] Yamauchi, Y.; Kuroda, K., Rational design of mesoporous metals and related
nanomaterials by a soft-template approach. Chemistry-an Asian Journal 2008,3, (4),
664-676.
[62] Shin, H. J.; Ryoo, R.l Liu, Z.; Terssaki, O., Template synthesis of asymmetrically
mesostrucutred platinum networks. Journal of the American Chemical Society 2001,
123, (6), 1246-1247.

93
[63] Liu, Z.; Sakamoto, Y.; Ohsuna, T.; Hiraga. K.; Terasaki, O.; Ko, C. H.; Shin, H. J.;
Ryoo, R., TEM studies of platinum nanowires fabricated in mesoporous silica MCM-41.
Angewandte Chemie-International Edition 2000, 39, (17), 3107-3110.
[64] Alberius, P.C.A.; Frindell, K. L.; Hayward, R. C.; Kramer, E. J.; Stucky, G. D.;
Chemalka, B. F., General predictive styntheses of cubic, hexagonal, and lamellar silca
and titania mesostrucutred thin films. Chemistry of Materials 2002, 14, (8), 3284-3294.
[65] Yang, P. D.; Zhao, D. Y.; Margolese, D. I.; Chmelka, B. F.; Stucky, G. D., Block
coplymer tempating syntheses of mesoporous metal oxides with large ordering lenghts
and semicrystalline framework. Chemistry of Materials 1999, 11, (10), 2813-2826.
[66] Soler-Illia, G.; Sanchez, C., Interactions between poly(ethylene oxide)-based
surfactants and transition metal alkoxides: their role in the templated construction of
mesostrucutred hybrid organic-inorganic composites. New Journal of Chemistry 2000,
24, (7), 493-499.
[67] Oregan, B.; Gratzel, M., A Low-Cost, High-Efficiency Solar-Cell Based on Dye-
Sensitized Colloidal TiO2 Films. Nature 1991, 353, (6346), 737-740.
[68] Nazeeruddin, M.K.; Kay, A.; Rodcio, I. Humphrybaker, R.; Muller, E.; Liska, P.;
Vlachopoulos, N.; Gratzel, M., Conversion of Light to Electricity by Cis-x2bis(2,2’-
Bipyridyl-4,4’-Dicarboxylate)Ruthenium(II) Charge-Transfer Sensitizers (X = Cl-, Br-,
I-, CN-, SCN-) on Nanocrystalline TiO2 Electrodes. Journal of American Chemical
Society 1993, 115,(14), 6382-6390.
[69] Froba, M.; Muth, O.; Reller, A. In Mesostrucutred TiO2: ligand-stabilized synthesis
and characterization, Solid State Ionics 1997, 249, 101-103.
[70] Khushalani, D.; Dag, Ö.; Ozin, G. A.; Kupermann, A., Glycometallate surfactants.
Part 2: non-aqueous synthesis of mesoporous titanium, zirconium and niobium oxides.
Journal of Materials Chemistry 1999, 9, (10), 2715-2715.

94
[71] Cabrera, S.; El Haskouri, J.; Beltran-Porter, A.; Beltran-Porter, D.; Marcos, M. D.;
Amoros, P. Enhanced surface area in thermally stable pure mesoporous TiO2. Solid
State Sciences 2000, 2, (5), 513-518.
[72] Crepaldi, E. L.; Soler-Illia, G.; Grosso, D.; Cagnol, F.; Ribot, F.; Sanchez, C.,
Controlled formation of highly organized mesoporous titania thin films: From
mesostrucutred hybribs to mesoporous nanoanatase TiO2. Journal of the American
Chemical Society 2003, 125, (32), 9770-9786.
[73] Dag, Ö.; Soten, I.; Çelik, Ö.; Polarz, S.; Coombs, N.; Ozin, G. A., Solventless acid-
free synthesis of mesostructured titania; Nanovessels for metal complexes and metal
nanoclusters. Advanced Functional Materials 2003, 13, (1), 30-36.
[74] Zana, R., Aqueous Surfactant-Alcohol Systems-a Review. Advances in Colloid and
Interface Science 1995, 57, 1-64.
[75] Armstrong, J.; Chowdhry, B.; Mitchell, J.; Beezer, A.; Leharne, S., Effect of
cosolvent and cosolutes upon aggregation transitions in aqueous solutions of poloxamer
F87 (Poloxamer P237): A high sensitivity differential scanning calorimetry study.
Journal of Physical Chemistry 1996, 100, (5), 1738-1745.
[76] Su, Y. L.; Wei, X. F.; Liu, H. Z., Influence of 1-pentanol on the micellization of
(polyetyleneoxide-polypropylene oxide-polyethylene oxide) block copolymers in
aqueous solutions Langmuir 2003, 19, (7), 2995-3000.
[77] Holmqvist, P.; Alexandridis, P.; Lindman, B., Modification of microstrucutre in
blockcoplymer-water-“oil” system by varying the copolymer composition and the “oil”
type: Small angle X-ray scattering and deuterium-NMR investigation. Journal of
Physical Chemistry B 1998, 102, (7), 1149-1158.
[78] Grosso, D.; Soler-Illia, G.; Babonneau, F.; Sanchez, C.; Albouy, P. A.; Brunet-
Bruneau, A.; Balkenende, A. R., Highly organized mesoporus titania thin films showing
mono-oriented 2D hexagonal channels. Advanced Materials 2001, 13, (14), 1085-+.
95
[79] On, D. T., A simple route for the synthesis of mesostructured lamellar and
hexagonal phosphorus-free titania (TiO2). Langmuir 1999, 15, (25), 8561-8564.
[80] Grosso, D.; Soler-Illia, G.; Crepaldi, E. L.; Cagnol, F.; Sinturel, C.; Bourgeois, A.;
Brunet-Bruneau, A.; Amenitsch, H.; Albouy, P. A.; Sanchez, C., Highly porous TiO2
anatase optical thin films with cubic mesostructure stabilized at 700 degrees C.
Chemistry of Materials 2003, 15, (24), 4562-4570.
[81] Smarsly, B.; Grosso, D.; Brezesinski, T.; Pinna, N.; Boissiere, C.; Antonietti, M.;
Sanchez, C., Highly crystalline cubic mesoporous TiO2 with 10-nm pore diameter made
with a new block copolymer template. Chemistry of Materials 2004, 16, (15), 2948-
2952.
[82] Haseloh, S.; Choi, S. Y.; Mamak, M.; Coombs, N.; Petrov, S.; Chopra, N.; Ozin, G.
A., Towards flexible inorganic “mesomaterials”: one-pot low temperature synthesis of
mesostructured nanocrystalline titania. Chemical Communications 2004, (13), 1460-
1461.
[83] Zhao, L. L.; Yu, Y.; Song, L. X.; Ruan, M. L.; Hu, X. F.; Larbot, A., Preperation of
mesoporous titania film using nonionic triblock coplymer as surfactant template. Applied
Catalysis a-General 2004, 263, (2), 171-177.
[84] Carp, O.; Huisman, C. L.; Reller, A., Photoinduced reactivity of titanium dioxide.
Progress in Solid State Chemistry 2004, 32, (1-2), 33-177.
[85] Maira, A. J.; Yeung, K.L.; Lee, C. Y.; Yue, P. L.; Chan, C.K., Size effects in gas-
phase photo-oxidation of trichloroetylene using nanometer-sized TiO2 catalysis. Journal
of Catalysis 2000, 192, (1), 185-196.
[86] Sclafami, A.; Hermann, J. M., Comparison of the photoelectronic and
photocatalytic activities of various anatase and rutile forms of titania in pure liquid
organic phases and in aqueous solutions. Journal of Physical Chemistry 1996, 100, (32),
13655-13661.
96
[87] Fotou, G.P.; Pratsinis, S. E., Photocatalytic destruction of phenol and salicylic acid
with aerosol-made and commercial titania powders. Chemical Engineering
Communications 1996, 151, 251-269.
[88] Abe, R.; Sayama, K.; Domen, K.; Arakawa, H., A new type of water splitting
system composed of two different TiO2 photocatalysts (anatase, rutile) and a IO3-/I-
shuttle redox mediator. Chemical Physics Letters 2001, 344, (3-4), 339-344.
[89] Yu, J. C.; Yu, J. G.; Ho, W. K.; Zhang, L. Z., Preparation of highly photocatalytic
active nano-sized TiO2 particles via ultrasonic irradiation. Chemical Communiations
2001, (19), 1942-1943.
[90] Zhang, H. Z.; Banfield, J. F., Thermodynamically analysis of phase stability of
nanocrystalline titania. Journal of Materials Chemistry 1998, 8,(9), 2073-2076.
[91] Zhang, H. Z.; Banfield, J. F., Understanding polymorphic phase transformation
behavior during growth of nanocrystalline aggregates: Insights TiO2. Journal of Physical
Chemistry B 2000, 104, (15), 3481-3487.
[92] Cassiers, K.; Linssen, T.; Meynen, V.; Van der Voort, P.; Cool, P.; Vansant, E. F.,
A new strategy towards ultra stable mesoporous titania with nanosized anatase walls.
Chemical Communications 2003, (10), 1178-1179.
[93] Wang, K. X.; Morris, M. A.; Holmes, J. D., Prepearation of mesoporous titania thin
films with remarkably high thermal stability. Chemistry of Materials 2005, 17, (6),
1269-+.
[94] Collings, J., Liquid Crystals, Princeton University Press, 1990
[95] Collings, P. J.; Hired, M., Introduction to Liquid Crystals, Taylor&Francis, 1997.
[96] Raman, N. K.; Anderson, M. T.; Brinker, C. J., Template-based approaches to the
preperation of amorphous, nanoporous silicas. Chemistry of Materials 1996, 8, (8),
1682-1701.
97
[97] Türker, Y.; Dag, Ö.; Synthesis of mesostructured metal sulfide films using
[M(H2O)n](NO3)2: P85 (M= Cd(II) and Zn(II)) liquid crystalline mesophases. Journal of
Materials Chemistry 2008, 18, (29), 3467-3473.
[98] Çelik, Ö.; Dag, Ö., A new lyotropic liquid crystalline system: Oligo(ethylene oxide)
surfactant with [M(H2O)n]Xm transition metal complexes. Angewandte Chemie-
International Edition 2001, 40, (20), 3800-+
[99] Dag, Ö.; Alayoglu, S.; Tura, C.; Çelik, Ö., Lyotropic liquid-crystalline phase of
oligo(etylene oxide) surfactant/transition metal salt and the synthesis of mesostrucutred
cadmium sulfide. Chemistry of Materials 2003, 15, (14), 2711-2717.
[100] Brinks, B. P.; Lumsdon, S. O., Catastropic phase inversion of water-in-oil
emulsions stabilized by hydrophobic silica. Langmuir 2000, 16, (6), 2539-2547.
[101] Binks, B. P., Particles as surfactant-similarities and differences. Current Opinion
in Colloid & Interface Science 2002, 7, (1-2), 21-41.
[102] Dag, Ö; Alayoglu, S.; Uysal, İ., Effect of ions on the liquid crystalline mesophase
of transition-metal salt: surfactant (CnEOm). Journal of Physical Chemistry B 2004, 108,
(24), 8439-8446.
[103] Dag, Ö; Samarskaya, O. Tura, C.; Gunay, A,; Çelik, Ö., Spectroscopic
investigation of nitrate-metal and metal-surfactant interactions in the solid
AgNO3/C12EO10 and liquid-crystalline [M(H2O)n](NO3)2/C12EO10 system. Langmuir
2003, 19, (9), 3671-3676.
[104] Demirörs, A. F.; Eser, B. E.; Dag, Ö., Liquid crystalline mesophases of pluronics
(L64, P65 and P123) and transition metal nitrate salts [M(H2O)6](NO3)2. Langmuir 2005,
21, (9), 4156-4162.
[105] Attard, G. S; Fuller, S.; Tiddy, G. J. T., Influence of added electrolyte on the
lyotropic phase behavior of triethylammoniodecycloxycyanobiphenyl bromide (OCB-
C10NEt3Br). Journal of Physical Chemistry B 2000, 104, (44), 10426-10436.

98
[106] Schott, H., Effect of inorganic additives on solutions of nonionic surfactants. 15.
Effect of transition metal salts on cloud point of octoxynol 9 (Triton X-100). Journal of
Colloid and Interface Science 1997, 192, (2), 458-462.
[107] Washington, C.; King, S. M., Effect of electrolytes and temperature on the
strucutre of a poly(etylene oxide) poly(propylene oxide) poly(ethylene oxide) block
coplymer adsorbed to a perfluorocarbon emulsion. Langmuir 1997, 13, (17), 4545-4550.
[108] F. Hofmeister, Arch. Exp. Pathol. Pharmakol., vol 24, p247, 1888.
[109] Nakamoto, K., Infrared and Raman Spectra of Inorganic and Coordination
Compounds. Part-A John Wiley & Sons, Inc. 1997.
[110] Shiang, J. J.; Kadavanich, A. V.; Grubbs, R. K.; Alivisatos, A. P., Symmetry of
annealed Wurtzite CdSe nanocrystals: Assignment to the C-3V point group. Journal of
Physical Chemistry 1996, 100, (32), 13886-13886.
[111] Flytanis, C.; Hache, F.; Klein, M. C.; Richard, D.; Roussignol, P., Nonlinear
Optics in Composite-Materials. 1.Semiconductor and Metal Crystallites in Dielectrics.
Progress in Optics 1991, 29, 321-411.
[112] Brus, L.E., Electron Electron and Electron-Hole Inreaction in Small
Semiconductor Crystallites- the size Dependence of the Lowest Excited Electric State.
Journal of Chemical Physics 1984, 80, (9), 4403-4409.
[113] Rossetti, R.; Ellison, J. L.; Gibson, J. M.; Brus, L. E., Size Effects in the Excited
Electronic States of Colloidal CdS Crystallites. Journal of Chemical Physics 1984, 80,
(9), 4464-4469.
[114] Fendler, J. H.; Meldrum, F. C., The Colloid-Chemical Approach to Nanostructered
Materials. Advanced Materials 1995, 7, (7), 607-632.
[115] Alivisatos, A. P., Semiconductor clusters, nanocrystals, and quantum dots. Science
1996, 271, (5251), 933-937.

99
[116] Zhang, J. Z., Ultrafast studies of electron dynamics in semiconductor and metal
colloidal nanoparticles: Effects of size and surface. Accounts of Chemical Research
1997, 30, (10), 423-429.
[117] Goldstein, A. N.; Echer, C. M.; Alivisatos, A. P., Melting in Semiconductor
Nanocrystals. Science 1992, 256, (5062), 1425-1427.
[118] Yin, Y. D.; Xu, X. L.; Ge, X. W.; Xia, C. J.; Zhang, Z. C., Synthesis of cadmium
sulfide nanoparticles in situ using gamma-radiation. Chemical Communications 1998,
(16), 1641-1642.
[119] Castro, C.; Ramos, J.; Milan, A. Gonzalez-Calbet, J.; Palacio, F., Production of
magnetic nanoparticles in imine polymer matrixes. Chemistry of Materials 2000, 12,
(12), 3681-3688.
[120] Akamatsu, K.; Deki, S., In Nanoscale metal particles dispersed in polymer matrix,
Symposium on Nanomaterials at the 4th
International Union of Materials Research
Societies International Conference, Chiba, Japan, Sep 16-18, Pergoman-Elsevier 1997.
[121] Fernandes, N. E.; Fisher, S. M.; Poshusta, J. C.; Vlachos, D. G.; Tsapatsis, M.;
Watkins, J. J., Reactive deposition of metal thin films within porous supports from
supercritical fluids. Chemistry of Materials 2001, 13, (6), 2023-2031.
[122] Davis, M. E., Ordered porous materials for emerging applications. Nature 2002,
417, (6891), 813-821.
[123] Piris, J.; Ferguson. A. J.; Blackburn, J. L.; Norman, A. G.; Rumbles, G.;
Selmarten, D. C.; Kopidakis, N., Efficient photoinduced charge injection from chemical
bath deposited CdS into mesoporous TiO2 probed with time-resolved microwave
conductivity. Journal of Physical Chemistry C 2008, 112, (20), 7742-7749.
[124] Bartl, M. H.; Puls, S. P.; Tang, J.; Lichtenegger, H. C.; Stucky, G. D., Cubic
mesoporous frameworks with a mixed semiconductor nanocrystalline wall strucutre and
100
enhanced sensitivity to visible light. Angewandte Chemie-International Edition 2004,
43, (23), 3037-3040.
[125] Shen, Y.; Bao, J.; Dai, N.; Wu, J.; Gu, F.; Tao, J. C.; Zhang, J. C., Speedy
photoelectric excahnge of CdSe quantum dots/mesoporous titania composite system.
Applied Surface Science 2009, 255, (6), 3908-3911.
[126] Brus, L. E., A Simple-Model for the Ionization-Potential, Electron-Affinity, and
Aqueous Redox Potentials of Small Semiconductor Crystallites. Journal of Chemical
Physics 1983, 79, (11), 5566-5571.
[127] Sapra, S.; Sarma, D. D., Evolution of the electronic structure with size in II-VI
semiconductor nanocrystals. Physical Review B 2004, 69, (12), 7.
[128] Sapra,S; Shanthi, N.; Sarma, D. D., Realistic tight-binding model for the electronic
structure of II-VI semiconductors. Physical Review B 2002, 66, (20), 8.