the phosphorus rule - impact on lab testing · the phosphorus rule - impact on lab testing rick...
TRANSCRIPT

The Phosphorus Rule -Impact on Lab Testing
Rick MealyProgram Chemist
George BowmanContract Auditor
• What’s the issue?• What have we done to date?
• Survey March 2011• Commission State Lab of Hygiene Study• Statistical Analysis
• What problems do we face ?• Contamination• Calibration concerns• Dealing with blanks• Determining an LOD correctly
• What potential solutions exist?• Major• Minor
• Summary/recommendations
Phosphorus Rule Impacts

A turbulent year for Phosphorus…
This guidance document was made available to key externals for comment. Comments should be submitted to the Department by September 30th at which point we will review and respond to comments, and edit the guidance document as appropriate.

WQC
75 ug/L100 ug/L
40 ug/L30 ug/L
7 ug/L 5 ug/L
15-40 ug/L
Sampling and Testing ProceduresSampling and laboratory testing procedures shall be performed in accordance with Chapters NR 218 and NR 219, Wis. Adm. Code and shall be performed by a laboratory certified or registered in accordance with the requirements of ch. NR 149, Wis. Adm. Code. The analytical methodologies used shall enable the laboratory to quantitate all substances for which monitoring is required at levels below the effluent limitation. Again, the Department recommends a level of detection at 30 ug/L and a level of quantitation at 90 ug/L. If the required level cannot be met by any of the methods available in NR 219, Wis. Adm. Code, then the method with the lowest limit of detection shall be selected. Additional testprocedures may be specified in this permit.
Pg 112 of 149

LOD…Why Haven’t We Cared?
Historically, permit limits for Total P have been 1.0 mg/L
the highest an LOQ could be would be 1.0 mg/L
Generally, the LOQ is about 3.3 times the LOD
the highest an LOD could be is about 0.3 mg/L
…and no lab has had trouble obtaining an LOD < 0.3 mg/L
Lab LODs < 0.3 ppm < 1.0 mg/L Permit Limit
LODs Relative to Existing Permit Limits
Reported LODs (mg/L)
00.10.20.30.40.50.60.70.80.9
1
1 9 16 23 30 37 44 51 58 65 72 79 86 93 100
107
114
Lab #
LOD (mg/L)
Reported LODs (mg/L)
00.10.20.30.40.50.60.70.80.9
1
1 9 16 23 30 37 44 51 58 65 72 79 86 93 100
107
114
Lab #
LOD (mg/L)
Permit Limit 1.0 mg/L
Permit Limit 0.1 mg/L
How does the picture look if…

Reported LODs (mg/L)
0
0.1
0.2
1 8 14 20 26 32 38 44 50 56 62 68 74 80 86 92 98 104
110
Lab #
LO
D (
mg
/L)
Zooming in a little …
Reported LODs (mg/L)
0
0.02
0.04
0.06
0.08
0.1
0.12
0.14
0.16
0.18
0.2
1 8 14 20 26 32 38 44 50 56 62 68 74 80 86 92 98 104
110
Lab #
LO
D (
mg
/L)
If the Permit Limit is 0.1, then…
…the required LOD would be about 0.03 mg/L…
… and so we decided to conduct a little
survey

Time to Revisit the LOD?
• Unless you’ve been hiding under a rock for the last year, you know the Department has enacted major revisions to Phosphorus rules.
• The new rules require LODs for Total P to be reported on DMRs and are a point of concern.
• During the winter of 2011 LabCert conducted a survey of Total P LODs.
• The results were disconcerting.
What did we learn?Who’s using what (all labs submitting results)?
TNT AC HP FIA DACommercial 2 0 3 4 3Public Health - - - 2 -Industrial 5 1 3 - -Large WWTP 1 5 2 2 1small WWTP 26 27 23 - -
TNT = Test ‘N Tube HP= HotPlate AC= AutoclaveFIA= Flow Injection Analyzer DA= Discrete Analyzer
34 33 31 8 4

Ability to Meet A Specific Total Phosphorus LOD
0.01 mg/L 0.02 mg/L 0.03 mg/LCommercial 1 of 11 labs 6 of 11 6 of 11 55%Public Health 2 of 2 2 of 2 2 of 2 100%Industrial 1 of 10 3 of 10 5 of 10 50%Lg WWTP 2 of 11 7 of 11 7 of 11 64%Sm WWTP 7 of 77 18 of 77 29 of 77 38%Total 13 of 111 36 of 111 49 of 111
12% 32% 44%
Note: The numbers of labs that can meet 0.02 mg/L include those that can meet 0.01 mg/L. Similarly, the numbers of labs that can meet 0.03 mg/L include those that can meet 0.01 and those that can meet 0.02 mg/L.
Based on data as reported
Ability to Meet Specific Total Phosphorus LODBy Technique
0.01 mg/L 0.02 mg/L 0.03 mg/LTest N’ Tube 3 13 15 (of 34)Hot Plate 8 17 25 (of 31)Autoclave 17 24 25 (of 33)Flow Injection 5 6 6 (of 8)Discrete Analyzer 2 2 2 (of 4)Total 35 62 73 (of 111)
Note: The numbers are cumulative! The numbers of labs that can meet 0.02 mg/L include those that can meet 0.01 mg/L. Similarly, the numbers of labs that can meet 0.03 mg/L include those that can meet 0.01 and those that can meet 0.02 mg/L.
# labs which could meet a specific LODNOTE: These data are based on LODs reported on the survey

Ability to Meet Specific Total Phosphorus LODBy Technique
0.01 mg/L 0.02 mg/L 0.03 mg/LTest N’ Tube 0 labs 2 labs 2 labs (of 25)Hot Plate 1 lab 8 labs 17 labs (of 28)Autoclave 8 labs 16 labs 20 labs (of 26)Flow Injection 3 labs 6 labs 6 labs (of 8)Discrete Analyzer 0 labs 2 labs 2 labs (of 3)Total 12 labs 34 labs 47 labs (of 90)
Note: The numbers are cumulative! The numbers of labs that can meet 0.02 mg/L include those that can meet 0.01 mg/L. Similarly, the numbers of labs that can meet 0.03 mg/L include those that can meet 0.01 and those that can meet 0.02 mg/L.
NOTE: These data are based on adjusted “realistic” LODs
ValidLOD
QuestionableLOD
InvalidLOD
47 (42%) 47 (42%) 18 (16%)
Commercial 6 of 12 labs
Public Health 2 of 2 labs
Industrial 3 of 10 labs
Lg WWTP 4 of 11 labs
Sm WWTP 32 of 77 labs
3 of 12 labs
-------------
6 of 10 labs
6 of 11 labs
32 of 77 labs
3 of 12 labs
--------------
1 of 10 labs
1 of 11 labs
13 of 77 labs
Valid LOD: defined here as meeting the EPA’s required acceptance criteria
Invalid LOD: defined here as unacceptable due to failure to meet one or more of the EPA’s required acceptance criteria
Questionable LOD: defined here as one that meets the EPA’s designated acceptance criteria, but that LOD reported cannot be substantiated when reviewed against blank data as being “significantly different” from a blank. It is possible for us to make a decision regarding what level of LOD can be supported.
Surveyed: 173 labsResponses: 112Return rate: 65%
Quality of Total Phosphorus LOD Data

More Than 1 in 3 Can’t MeetNew LOD Requirements
0.000
0.010
0.020
0.030
0.040
0.050
0.060
0.070
0.080
0.090
0.100
Raw Data: 41 labs ( 37% ) have LODs outside of 0.02 to 0.03 ppm
x (0.13)
x (0.20)
Tell Me Whyyyyyyyy…
• …so many labs are having trouble with determining an LOD?
• …so many labs cannot achieve the required LOD of 0.03 ppm?
• …Test ‘N Tube (TNT) seems to be the most challenging?

Problem # 1:Test ‘N Tube is the most popular method yet less
than 10% of “TNT” labs can meet the required LODs.
Really?......... Are LODs obtained using
Test ‘N Tube really different from other methods?
Solving Problem # 1:
To answer this, we need to do a little statistics.

"Statistics show: every two minutes another statistic is created."
-Anonymous
Statistics 101
Some statistical terms to know and love
• The “Student’s” t-test: one of the most commonly used techniques for testing a hypothesis on the basis of a difference between sample means.
• Null hypothesis: generally represents the default position in a t-test. “Null” mean “no”, so the null hypothesis often is that there is no relationship (difference) between two measurements.
• t-value: the score obtained from a t-Test. It represents the difference between the means of two groups, while taking into account any variation in measurements.
• p-value: the probability of obtaining a test statistic at least as extreme as the one calculated, assuming that the null hypothesis is true. Usually one "rejects the null hypothesis" when the p-value is less than the significance level α which is often 0.05 or 0.01. Rejecting the null hypothesis means the result is statistically significant.

Probability in 30 seconds
• You can flip a coin 10 times and get “heads” each of the 10 times.
• But there is a probability associated with that.
• The probability in this case is 1 in 1024 “sets” of 10 coin flips.
• Or about 0.1% likelihood that any single set of 10 coin flips will produce heads each time.
• In our world, p= 0.001
t-values and statistical significancet-Test Values Required to Reject the Null Hypthothesis (H0).
20 2.09 2.8525 2.06 2.7930 2.04 2.7535 2.03 2.7240 2.02 2.7145 2.01 2.7050 2.01 2.6855 2.00 2.6760 2.00 2.6665 2.00 2.6670 2.00 2.6575 1.99 2.64100 1.98 2.63
1.96 2.58∞
(df) α=.05 α=.01
H0= There is no difference between LODs of two techniques.
If t > 2.00 then we can “reject H0” and declare the LODs to be significantly different with less than a 5% chance of making the wrong decision.
If t > 2.70 then we can “reject H0” and declare the LODs to be significantly different with less than a 1% chance of making the wrong decision.

Minding your p’s and t’s
• You compare a t-value to a table to determine whether or not your difference is significant at a given level of confidence…usually 95% (0.05) or 99% (0.01).
• A p-value gives you the absolute level of confidence at which the difference is (statistically) significant.
• So…if t-value is 2.5 and the t-table criterion for the degrees of freedom is 2.0 at α=0.05, then the difference is significant at the 95% confidence level.
• A p-value of 0.0008 means there is a 0.08% chance that you could be making the wrong assessment.
• So….if p < 0.05 there is technically less than a 5% chance of making an incorrect assessment.
Student’s t-values for t-test of means
1.413.57
1.49
All data as reported
t=3.436.72
2.49
Only Validated LODs
t=
A t-value greater than 2.00 means there is a significant difference between sample data at the 95% confidence level. “t” > 2.70 = 99% confidence
Answers: Are these LODs significantly different?
Test ‘N TubeMean LOD= 0.038
AutoclaveMean LOD= 0.021
HotplateMean LOD= 0.030
Test ‘N TubeMean LOD= 0.069
AutoclaveMean LOD= 0.025
HotplateMean LOD= 0.041

Only Validated LODs
p=
All data as reported
p=
P-values: Are LODs significantly different?
Test ‘N TubeMean LOD= 0.038
AutoclaveMean LOD= 0.021
0.19520.0008
0.1270
0.0014<0.00001
0.0184
Random sampling of Test ‘n Tube v. Autoclave would lead to a smaller difference in means in 0.08% of studies
HotplateMean LOD= 0.030
Random sampling of Hotplate v. Autoclave would lead to a smaller difference in means in 1.84% of studies
“p” here represents the probability that the difference is coincidence
Test ‘N TubeMean LOD= 0.069
AutoclaveMean LOD= 0.025
HotplateMean LOD= 0.041
Bottom line on validated LODs
• LODs for the 3 main techniques are different• You are most likely to meet new
recommended LODs using Autoclave• …but there are reasons for that• …and our evaluation is based on the data
received and our assessment of it
• Test N Tube is different• But we’re not saying it’s “no good”• We will be talking about ways you can
improve the sensitivity of Test N Tube AND the other techniques

Problem # 2:Labs are having
trouble just determining an LOD
correctly
Solving Problem # 2:Back 2 Basics:
How to correctly determine an
LOD

LOD “Limit of detection” or “LOD” means the lowest
concentration or amount of analyte that can be identified, measured, and reported with confidence that the concentration is not a false positive value.
For DNR purposes, the LOD approximates the MDL
LOQ “Limit of quantitation” of “LOQ” means the lowest
concentration or amount of an analyte for which quantitative results can be obtained.
Formerly defined in code as 10/3 times the LOD (i.e. 3.33 x LOD)
NR 149 now requires labs to “ have procedures to relate the LOD to the LOQ ”
Revisiting Old Friends: LOD & LOQ
LOD is about Signal: Noise Ratio [S:N]
S/N ~10 S/N ~3
Closer to an LOQ than an LOD Right on the edge for an LOD
“Signal” =analyte response; “Noise” =blank response.
LOD typically viewed as 3:1 Signal: Noise (S:N) LOQ is generally considered to be S:N of 10:1
Signal
Noise
Low Signal-to-Noise Ratio(High System Noise)

LOD-equivalent signal “in the weeds”
This lab submitted LOD results in which the theoretical response at the LOD level is well below that of blanks
Abs
orba
nce
Is this lab’s LOD of 0.02 mg/L “real”?Response at LOD
LOD signal well above S/N ratio
Is this lab’s LOD of 0.02 mg/L “real”?
Res
pons
e at
LO
D

What does a “good” LOD look like?
Lab# 29• Hotplate• Spike: 0.1 ppm• Spike Abs: 0.073• Low std: 0.1 ppm• Low std Abs: 0.076• LOD: 0.021 ppm• LOD Equiv Abs: 0.016• Blank mg/L: -0.014 ppm• Blank Abs: 0.0013
Which lab can substantiate an LOD of 0.02 ppm?
Equivalent absorbance calculated based on response factor from low standard or LOD spike. [0.076 Abs/0.1 ppm = 0.76 ABS/PPM x 0.021 ppm== 0.016
Lab# 78• Test n’ Tube• Spike: 0.2 ppm• Spike Abs: 0.160• Low std: 0.1 ppm• Low std Abs: 0.119• LOD: 0.02 ppm• LOD Equiv Abs: 0.024• Blank mg/L: -0.003 ppm• Blank Abs : 0.0531
If your LOD is “in the weeds” it really isn’t realistic.
You can’t really“see” it

1. Determine a spike concentration (close to the expected LOD)
2. Prepare at least 7 spiked replicates of reagent water at this spike level
Let’s review…EPA procedure for determining LOD
3. Calculate the mean (X) and standard deviation (SD)
4. Obtain the “t”-value associated with the number of replicates
5. Calculate the LOD: SD times t6. Perform “5-point check” of the LOD
Mandatory checks (EPA)
1. Is LOD greater than 10% of the spike level?If you spike LOD replicates at 0.1, LOD must be no less than 0.01Otherwise, re-peat at lower spike level
2. Is the spike level greater than the LOD?Common sense: if LOD > spike level, couldn’t detect it
3. Is the LOD below any relevant permit limit?TP Permit limits eventually likely to be = 0.075 to 0.10 mg/L
LOD Evaluation: The 5 -point check
Additional (strongly encouraged) checks
+ 1
4. Is the signal-to-noise ratio (S/N) between 2.5 and 10?S/N est = mean/std dev.
5. Is mean recovery within reasonably expected limits? Mean recovery= mean/spike level x 100 Expect 80 to 120%
6. Is average response of blank < 3 times response at LODIf not, your LOD is probably not “real”

LOD DOs and DON’Ts• DO use reagent water• DO follow the 5-point check• DO repeat at a lower/higher level if needed• DO compare LOD signal to blank signal• DO ask your auditor about a “realistic” LOD
• DON’T use absorbance (response) to calculate.
• DON’T use less than 7 replicates
• DON’T ignore blank response relative to LOD
What does YOUR LOD “look” like?
• There is value in preparing a “standard” at a concentration equal to (or very close to) your calculated LOD and one at the LOQ (use 3x LOD).
• Compare the signal at your LOD (and LOQ) to a typical method blank.
• Is your LOD “in the weeds”? Your LOQ?• If so you have two options:
1. “Trim” the weeds (i.e., reduce background “noise”)
2. Raise your LOD until it rises clearly above the weeds.
3. Re-set your LOQ

Problem # 3:Labs will have trouble meeting the new LODs.
What else can we do to improve LODs?
Solving Problem # 3
Option 1: Purchase a fancy instrumentOption 2: Bench level changes
- calibration errors WILL affect LOD- know thine opponent - proper care and feeding of cuvettes- you’re not re-using TNT vials…right?
Option 3: Effecting real change- The State Lab helps prove a theory- using the right cuvette
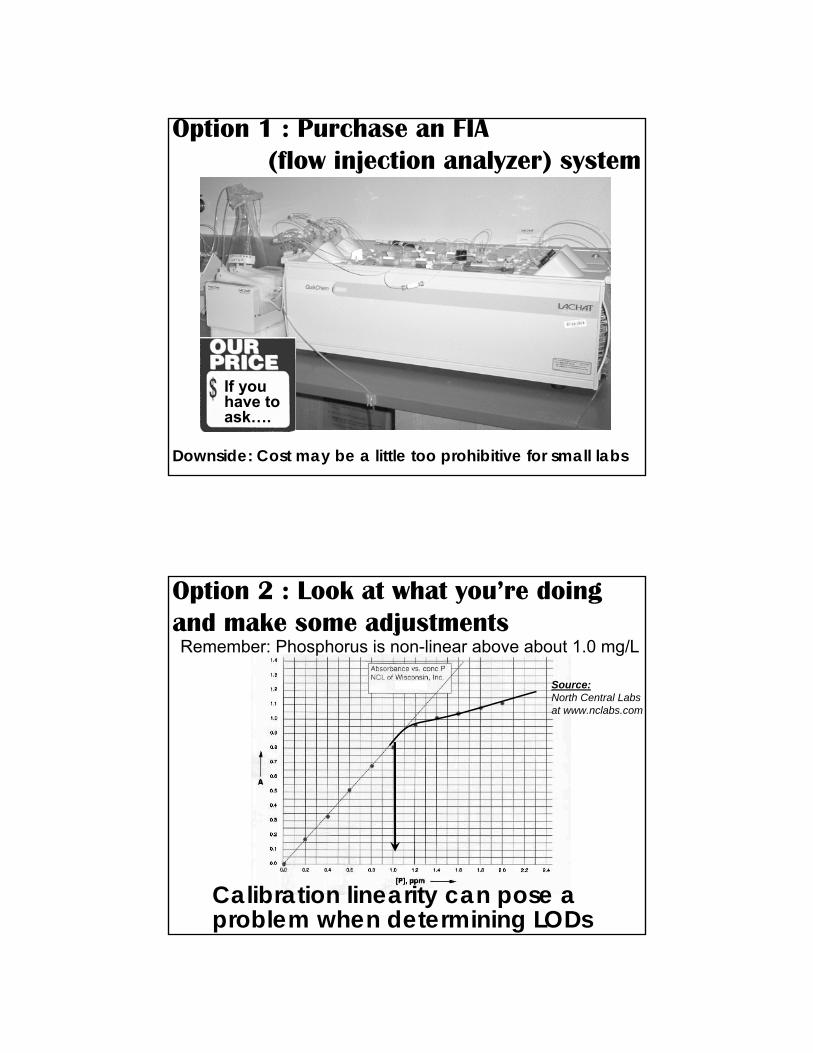
Option 1 : Purchase an FIA (flow injection analyzer) system
Downside: Cost may be a little too prohibitive for small labs
If you have to ask….
Remember: Phosphorus is non-linear above about 1.0 mg/L
Source:North Central Labs at www.nclabs.com
Option 2 : Look at what you’re doing and make some adjustments
Calibration linearity can pose a problem when determining LODs

Linear Calibration
Is your Y-intercept creeping up?Getting “negative” blanks?
How does calibration affect the LOD?
Calibrations, Non-linearity, & Negative Blanks• As the upper end of the calibration “drops” the
linear regression line “teeters” and the low end rises
• The Y-intercept increases…• Translating to increasing negative values for a 0
response (i.e. blanks)• This can be caused by exceeding the linear range• …poorly prepared standards…• …or a diminished spectrophotometer bulb• …optics getting coated with HCl

Calibrations, Non-linearity, & Negative Blanks
y = 0.8279x + 0.0052
R2 = 0.9985
0
0.2
0.4
0.6
0.8
1
1.2
0 0.2 0.4 0.6 0.8 1 1.2 1.4 1.6
y = 0.8279x + 0.0052
R2 = 0.9985r= 0.999250
-0.1
-0.08
-0.06
-0.04
-0.02
0
0.02
0.04
0.06
-0.1 -0.05 0 0.05 0.1Linear
Intercept=0
y = 0.8071x + 0.0121
R2 = 0.9979r= 0.998949
-0.1
-0.08
-0.06
-0.04
-0.02
0
0.02
0.04
0.06
-0.1 0 0.1
y = 0.8071x + 0.0121
R2 = 0.9979
0
0.2
0.4
0.6
0.8
1
1.2
0 0.2 0.4 0.6 0.8 1 1.2 1.4 1.6
Still linearIntercept 0 abs - 0.01
y = 0.7563x + 0.0325
R2 = 0.9895r= 0.994736
-0.1
-0.08
-0.06
-0.04
-0.02
0
0.02
0.04
0.06
-0.1 -0.05 0 0.05 0.1
y = 0.7563x + 0.0325
R2 = 0.9895
0
0.2
0.4
0.6
0.8
1
1.2
0 0.2 0.4 0.6 0.8 1 1.2 1.4 1.6
Still linearIntercept
0 abs - 0.05
Not buying it? Here’s some real data
• Response factors (RF) look good,• Y-intercept is effectively zero• Correlation is “3 Nines” plus• Life is good
WWTP "X" 1/13/10
Hotplate abs read in disposable mg/L Abs @ 880 nm RF
0 0.0010.1 0.064 0.6400.3 0.191 0.6370.5 0.317 0.6340.7 0.439 0.6271 0.644 0.644
slope= 0.639112intercept= -0.000949r= 0.999834
y = 0.6391x - 0.0009
R2 = 0.9997
-0.1
0
0.1
0.2
0.3
0.4
0.5
0.6
0.7
0 0.2 0.4 0.6 0.8 1 1.2
y = 0.6391x - 0.0009
R2 = 0.9997
-0.1
-0.08
-0.06
-0.04
-0.02
0
0.02
0.04
0.06
0.08
0.1
-0.1 -0.05 0 0.05 0.1
cuvette

What a difference a year makes!Would you notice this? DO anything?WWTP "X" 1/20/11
Hotplate abs read in disposable mg/L Abs @ 880 nm RF
0 0.0010.1 0.067 0.6700.3 0.194 0.6470.5 0.316 0.6320.7 0.441 0.6301 0.565 0.565
slope= 0.575047intercept= 0.014813r= 0.996567
cuvette
y = 0.575x + 0.0148
R2 = 0.9931
0
0.1
0.2
0.3
0.4
0.5
0.6
0.7
0 0.2 0.4 0.6 0.8 1 1.2
y = 0.575x + 0.0148R2 = 0.9931
-0.1
-0.08
-0.06
-0.04
-0.02
0
0.02
0.04
0.06
0.08
0.1
-0.1 -0.05 0 0.05 0.1
• Response factor for 1 ppm drops• Y-intercept now approaching 0.020• Correlation is OK but “2 Nines”& 6• 0 response now = negative mg/L• Something happened• How would this affect LOD?
To Follow NR149 or Follow the MethodThat is the question
Zero Blank (no Color reagent)True Sample ID mg/L Abs
0 Zero Blk 0.00 0.000
0 Method Blk 0.03 0.032
0.5 ppm LCS/CCV 0.56 0.326 112%
0.5 ppm LCS/CCV 0.53 0.308 106%
0.05 ppm LOD 1 0.08 0.058 160%
0.05 ppm LOD 2 0.07 0.054 140%
0.05 ppm LOD 3 0.09 0.064 180%
0.05 ppm LOD 4 0.10 0.068 200%
0.05 ppm LOD 5 0.08 0.060 160%
Method blankConc. Abs
0.00 - 0.032
0.00 0.000
0.50 0.294 100%
0.48 0.279 96%
0.02 0.020 40%
0.02 0.022 40%
0.03 0.032 60%
0.04 0.034 80%
0.02 0.027 40%
Results obtained using Test ‘N Tube
Spectrophotometer zeroed with:

Know Thine Opponent The Facts of [Test ‘N Tube] Life• Test ‘N Tube is
convenient…but it IS different• Instead of using a single,
optical quality cuvette for measurements, EACH TUBE is its own cuvette
• Are they lined up properly?• The same optical quality?• Smudge-free?• Micro-scratch free?• and what about that powder?
Know thine opponentKnow thine self
Source: HACH Method 8190
So it is said that if you know your opponent and know yourself, you can win a hundred battles without a single loss..-- Sun Tzu, “The Art of War”

Newer instruments help mitigate the problems
1. Barcode Recognition: Simply drop in the vial and get results immediately with automatic method detection.
2. Reference Detector: Monitors and compensates for optical fluctuations.
3. 10X Measurement and Outlier Elimination: Dirty, scratched, or flawed glassware, including fingerprints, is no longer an issue -instrument averages 10 readings and rejects outliers.
4. Self-Contained Packaging -Reagents Inside Sealed Cap: Reduces exposure to chemicals -no need to open pillows or clean glassware.
Contamination!• Wash glassware well, using a non-phosphate detergent• Rinse with dilute (1-10%) hydrochloric acid• Never re-use HCl solution to wash glassware
•Used acid soon becomes contaminated contaminates all of your glassware.
• Even new glassware needs to be washed• DO NOT touch inside glassware with bare hands!• DO NOT smoke or use air fresheners in the laboratory.• Cover samples if you use autoclave for digestion• Segregate glassware for TP
Combined (color) reagent• Make your Combined Reagent fresh daily • It should be a light straw or light yellow color.
Sample pHNot at proper pH prior to adding the Combined Reagent.
Reviewing Common TP Issues

Other considerations –Optimizing Spectrophotometer Performance• Clean up spills• Periodically clean cell compartment-wipe out with
soft damp cloth• Avoid exposing instrument to corrosive environment
• acid vapors, dust and moisture can coat optics and degrade performance
• Consider changing lamp/bulb annually (and before doing new calibration curve)
• Recalibrate anytime major maintenance is performed.
• Track absorbance of CCV to ensure sensitivity does not degrade over time
• May wish to have wavelength accuracy and performance checked by outside vendor every few years
It’s Hip to be Square
• Square cuvettes, or cells will be found to be most precise since the parameters of pathlength and parallelism are easier to maintain during manufacture. Round cuvettes have the advantage of being less expensive.
--Spectrometry Principles
• Square cuvettes gave the most accurate results, compared to round glass test tubes and UVettes. The square geometry also made it easier to calculate the effect of refraction.
--UCSD 2010 “Dynamic Light Scattering”
• Inexpensive cuvettes are round and look similar to test tubes. Disposable plastic cuvettes are often used in fast spectroscopic assays, where speed is more important than high accuracy.
--Swarthmore College Chemistry Dept.
Cuvette shape matters• Square cuvettes, or cells will be found to be most
precise since the parameters of pathlength and parallelism are easier to maintain during manufacture. Round cuvettes have the advantage of being less expensive.
--Spectrometry Principles
• Square cuvettes gave the most accurate results, compared to round glass test tubes and UVettes. The square geometry also made it easier to calculate the effect of refraction.
--UCSD 2010 “Dynamic Light Scattering”
• Inexpensive cuvettes are round and look similar to test tubes. Disposable plastic cuvettes are often used in fast spectroscopic assays, where speed is more important than high accuracy.
--Swarthmore College Chemistry Dept.

Light diffraction and cuvette shapeDetectors see the difference between light going in and coming out as absorption
• This “scatter” is viewed by the detector as sample absorbance, resulting in slight high bias
DETECTOR
DETECTOR
S AM
PL
E
SA
MP
LE
• There is some diffraction of light by round cuvettes
Cuvette Care and Feeding
• Anything that hinders light passage through the cuvette will produce abnormally high absorbance readings. For example, scratches on the cuvette are a major problem.
• To avoid scratches, cuvettes should always be hand-washed (the jostling that occurs in the glassware tubs is damaging) using a cotton swab dipped in a soap solution.
• After the cuvette is scrubbed inside and out, the soap should be removed by rinsing with tap water and then distilled water.
Would you treat your eyeglasses like you do cuvettes?

RE-USED Test n TubesNEW Test n Tubes
Don’t Re-use Test ‘n Tubes!
‘nuff said?
…and so we worked with the State Lab of Hygiene to come up with some
options
So…Clearly we have some problems

SLH Study – A Tale of Two Techniques
Perform TNT analysis of TP as directed
Perform TNT analysis of TP with a twist
• Prepare a calibration curve• On each of 4 separate days, prep/analyze:
• A QCS (CCV)• A method blank• 2-3 LOD spikes
all measurements taken using a single,
high quality 2.5 cm cuvette
Calculate LOD Calculate LOD COMPARE
measurements taken in individual~13 mm TNT vials
SLH Study Notes
• Hach method 8190 followed.• Single wave length user program at 880 nm.• Cuvette used Hach cat # 249502 2.5 cm round
glass.• Vortexer used for mixing.• Potassium persulfate did not completely dissolve
until cooked. Likely not an issue but duly noted.• PhosVer 3 color reagent did not completely dissolve
as stated.• Incompletely dissolved color reagent could have
effect on LOD determination. Did not observe any significant sticking of it on cuvette walls. It seemed to settle to bottom in both TNT and cuvette.

Calibration differences: TNT vs. single cuvette
Curve using TNT Tubes
y = 0.5487x + 0.0129
R2 = 0.9997
0
0.2
0.4
0.6
0.8
1
1.2
0 0.2 0.4 0.6 0.8 1
Curve using a single 2.5cm Cuvette
y = 0.97x + 0.0246
R2 = 0.9998
0
0.2
0.4
0.6
0.8
1
1.2
0 0.2 0.4 0.6 0.8 1
1. Longer path length = greater absorbance response2. Slope doubles….but so does Y-intercept
Calibration differences: TNT vs. single cuvette
Abs read in tubemg/L Abs @ 880 nm RF0 0.009 0.1 0.067 0.6700.2 0.125 0.6250.4 0.234 0.5850.6 0.348 0.5800.8 0.448 0.5601 0.56 0.560slope= 0.548703 intercept= 0.01286 correlation 0.999849
Abs read in 2.5 cm Cuvettemg/L Abs @ 880 nm RF0 0.0220.1 0.127 1.2700.2 0.217 1.0850.4 0.416 1.0400.6 0.598 0.9970.8 0.802 1.0031 0.997 0.997slope= 0.970034intercept= 0.02456correlation 0.999916
NOTE: “RF” = “Response Factor” = Response Concentration

Compare: LOD data and final LODs
LOD spike=0.1 mg/L• 0.099• 0.121• 0.123• 0.100• 0.102• 0.111• 0.115• 0.095• 0.115• 0.125• 0.120
LOD spike=0.1 mg/L• 0.090• 0.090• 0.092• 0.085• 0.089• 0.099• 0.095• 0.097• 0.088• 0.095• 0.096
Mean= 0.111Range: 0.095 to 0.125 (0.030)Std Deviation= 0.01074LOD= 0.0297 mg/L
Test ‘n Tube (read in tubes) Test ‘n Tube (2.5 cm cell)
Mean= 0.092Range= 0.085 to 0.099 (0.014)Std Deviation= 0.00439LOD= 0.01215 mg/L
t-value = 5.3454P-value = < .00001
Data Observations – the 411
• Data obtained using a single cell were much “tighter” than those obtained from individual TNT tubes. Single tube vs. many = lower stdev
• “Tighter” (higher precision) values yield a lower LOD
• Concentrations obtained from the analyses performed using a single 2.5 cm cuvette are about 20% less than those obtained using standard TNT tubes. Hmmmmm
• Yet, responses are about twice as high due to the longer path length

Product #: 2401906 USD Price: $36.75
Product #: 2427606 USD Price: $24.75
Product #: 122800USD Price: $6.45
Product #: 2665908USD Price: $470.00
Some cuvette options
25 cm 25 cm
25 cm
25 cm
pkg of 6 set of 8; 4 matched pairs
What have we learned?
• Labs in general need to revisit LOD protocols.• Don’t just do the minimum to meet EPA
requirements for LOD…obtain a valid LOD.• You will need to obtain a valid LOD of at
least 0.03 mg/L• That will be very difficult using Test ‘N Tube
(without making adjustments)• We strongly recommend TNT users adopt the
single quality cuvette approach.NOTE: We have not evaluated the LOD using the TNT-Plus method and the “rotational measurement" technology“. Early indications suggest these to be important enhancements
Less & More
Talk doesn't cook rice.~Chinese Proverb
Talking Doing
Thanks for having us!
Any questions?
AcknowledgementsThanks go to:•Pat Gorski and Graham Anderson of the State Lab for analytical support.
•Jim Burke of Hach Co. for providing an instrument and supplies for the Test ‘N Tube. •Labs that responded to our survey.