the potential of prognostics for preventative maintenance of
TRANSCRIPT
The Potential of Prognostics for Preventative Maintenance of Electrical Wiring
Dr. Cynthia Furse1
LiveWire Test Labs, Inc. and the University of Utah Salt Lake City, Utah 84112
Shang Wu2
Hill Air Force Base and the University of Utah Salt Lake City, Utah 84112
Michael Diamond3
LiveWire Test Labs, Inc. Salt Lake City, Utah 84117
David Mih4
Jet Propulsion Laboratory Pasadena, California
Dr. Chet Lo5
University of Utah Salt Lake City, Utah 84112
Dr. Paul Smith6
LiveWire Test Labs, Inc. Salt Lake City, Utah 84117
Abstract
Aging electrical wiring is among the most expensive and frustrating systems to maintain on aircraft. Electrical faults generally occur with no apparent warning, often grounding the aircraft and requiring immediate attention, or potentially causing catastrophic failure. A prognostic fault location test that can predict when and where a fault will occur to enable preventative maintenance during scheduled down times would be of tremendous benefit. Prognosis is the ability to predict a fault before it impacts the aircraft electrical system. Fault location can be considered prognostic (predictive) rather than diagnostic (finding the fault after something has gone wrong in the aircraft) if the fault can be found before aircraft “symptoms” are observed. Some of the existing symptoms that lead 1 Chief Scientist (LiveWire Test Labs) and Professor and Director, Center of Excellence for Smart Sensors, Department of Electrical and Computer Engineering, 50 S Campus Drive, Salt Lake City, Utah 84112, ph (801) 585-7234, fax (801) 581-5281 [email protected], www.ece.utah.edu/~cfurse 2 PhD Candidate, Department of Electrical and Computer Engineering, 50 S Campus Drive, Salt Lake City, Utah 84112, ph (801) 585-7234, fax (801) 581-5281 , [email protected] 3 Engineer, 5330 S. 900 E. , Suite 150, Salt Lake City, Utah 84117, ph 801 293 8300 , fax 801 293 8301, [email protected], www.livewiretest.com 4 [email protected] 5 Research Assistant Professor, Department of Electrical and Computer Engineering, 50 S Campus Drive, Salt Lake City, Utah 84112, ph (801) 232-0411, fax (801) 581-5281 [email protected] 6 President, 5330 S. 900 E. , Suite 150, Salt Lake City, Utah 84117, ph 801 293 8300 , fax 801 293 8301, [email protected]

to diagnostic fault location are malfunction of some part of the aircraft, draining of a battery, tripping of a circuit breaker, flickering of lights, etc. Prognostics would seek to identify and locate faults before other symptoms are observed on the aircraft. This paper describes the potential for a prognostic wire fault location system using emerging reflectometry methods that can test the wire while it is live and operational. The potential for location of intermittent faults prior to symptomatic electrical problems is evaluated for both wet and dry arc faults. The possibility of locating regions of excessive vibration or chafing is also evaluated.
Several emerging reflectometry methods can be used to locate intermittent electrical open and short circuits while the electrical system is operational. Methods such as spread spectrum reflectometry (S/SSTDR) work by sending a very low power signal down the wire and measuring the reflection that returns from an electrical fault. The signal can be low enough in magnitude and/or sufficiently out of the band of the existing aircraft operating range so it does not interfere with the aircraft, thus enabling testing while the system is in operation, either on the ground or in flight.
Laboratory tests on a vibrating system with loose clamps, missing clamps, wires with damaged insulation, and other common installation problems are described. These anomalies affect the impedance of the wire so minutely that they are virtually impossible to measure with conventional static reflectometry methods. The use of dynamic reflectometry tests to measure gradual or sudden (intermittent) impedance anomalies on the wire is evaluated. The ability to monitor this impedance over time while the aircraft is in flight offers a possibility for the system to identify many types of pre-emergent electrical faults or their precursors before they could eventually lead to wire failure.
Water drips across cracks in insulation that produce intermittent wet arcs are also evaluated to determine conditions under which a dynamic reflectometry system could locate the faults before the system experiences symptoms of electrical malfunction. The potential for predictive fault location is found to depend on the level of insulation damage, the conductivity (dirtiness) of the water, the number of repeated drips, and how close the system is running to its maximum current draw. It is observed that unless the system is running very close to its maximum capacity, most electrical faults can be detected by dynamic electrical test methods prior to producing a notable symptom in the aircraft system.
Although this research is at an early stage, the potential for prognostic fault location using dynamic reflectometry test methods appears very promising.
I. Introduction
Diagnostics vs. Prognostics
Aging electrical wiring has been identified as one of the most problematic system to maintain on aging aircraft. The majority of electrical faults occur with no apparent warning, often grounding the aircraft and requiring immediate attention, or potentially causing catastrophic failure. A prognostic fault location test that can predict when and locate where a fault will occur to enable preventative maintenance during scheduled down times would be of tremendous benefit. Table 1 gives a comparison between a diagnostic and prognostic system. Prognosis is the ability to predict a fault before it impacts the aircraft electrical system. Fault location can be considered prognostic (predictive) rather than diagnostic (finding the fault after something has gone wrong in the aircraft) if the fault can be found before aircraft “symptoms” are observed. Some of the existing symptoms that lead to diagnostic fault location are malfunction of some part of the aircraft, draining of a battery, tripping of a circuit breaker, flickering of lights, etc. Prognostics would seek to identify and locate faults before other symptoms are observed on the aircraft.
Chafes leading to short circuit have been identified as the major source of faults on aircraft. [1] While it might be tempting to look for and replace every piece of wire with a small bit of insulation damage (a chafe), this is neither practical nor possible. It has been shown that existing aircraft have literally thousands of such small problems, the vast majority of which will never cause any problem with the aircraft. As will be discussed below in more detail, the electrical response of a chafe is so small that normal variability in a system (distance between wires or the wires and ground plane, vibration, moisture, etc.) is larger than this change. This normal physical “noise” precludes detection and location of the fault. Chafes are impossible to locate with reflectometry in a realistic environment, but there are fortunately fault precursors that are easier to find. Like all electrical systems, those in aircraft are designed to be relatively robust to noise and hardware variability, and are designed with a certain margin of error. Larger, intermittent faults are relatively easy to detect and locate, and their intermittent electrical impact is an excellent precursor to later system failure. This paper assesses electrical wire precursors in relationship to aircraft system symptoms and what level of precursor can or cannot be found using reflectometry methods. The
potential for location of intermittent faults prior to symptomatic electrical problems is evaluated for both wet and dry arc faults. The possibility of locating regions of excessive vibration or chafing is also evaluated.
Table 1: Comparison of Diagnostic and Prognostic Systems
Diagnostics Prognostics
A problem exists today, FIND it. A problem is being created, FIND it before the aircraft does.
Aircraft experiences a “symptom” (circuit breaker trips, pilot reports a problem, built in test systems report a failure, aircraft fails).
Aircraft experiences no known problem.
Unscheduled maintenance. Scheduled maintenance. Higher risk of aircraft failures. Lower risk of aircraft failures. Lower or no risk of false positives. Higher risk of false positives. Off or On board test systems can be used. Probably requires On board system.
Reflectometry
Reflectometry methods have been used to locate faults on wires for decades. These methods send a high frequency signal down the line, which reflects back at impedance discontinuities such as open or short circuits. The difference (time delay or phase shift) between the incident and reflected signal is used to locate the fault on the wire. The nature of the input signal is used to classify each type of reflectometry. Time Domain Reflectometry (TDR) uses a fast rise time pulse [7]. Frequency Domain Reflectometry (FDR) (including Phase Detection Reflectometry (PD-FDR) [8],[9], Mixed Signal Reflectometry (MSR) [10], and Standing Wave Reflectometry (SWR) [10]) uses sine wave signals to locate the fault on the wire. Multicarrier Reflectometry (MCR) uses a combination of sine waves with random phases [11]. Noise Domain Reflectometry utilizes the high frequency signals and./or noise already on the wire to locate faults. [14]Spectral Time Domain Reflectometry (STDR) uses a pseudo noise (PN) code, and Spread Spectrum Time Domain Reflectometry (SSTDR) uses a sine-wave-modulated PN code [15]. STDR and SSTDR have been shown to be effective for location of intermittent faults on both analog (400 Hz) and digital (MilStd 1553) systems [16]. S/SSTDR will be used for the evaluation in this paper. A comparison of reflectometry methods and a discussion of their accuracy can be found in [17]. What Controls Impedance Changes The magnitude of the reflection that is received by all reflectometry methods is controlled by the reflection coefficient [18]
Lo
Lo
incident
reflected
ZZZZ
VV
+−
==Γ (1)
where Zo is the characteristic impedance of the transmission line (values for typical aircraft cables range from about 60 to 160 ohms [17]), and ZL is the impedance of the discontinuity. For instance, the reflection coefficient for an open circuit (ZL = infinity) is 1, and the reflection coefficient for a short circuit (ZL = 0) is -1. A junction of two branched wires (ZL = Zo / 2) has a reflection coefficient of -1/3. Hard faults (open and short) are observable by reflectometry, but soft faults (damaged insulation, etc.) are generally not. Figure 1 shows the measured spread spectrum reflectometry (SSTDR) response for load impedances ranging from 20 to 2000 ohms for RG58 coax with characteristic impedance 52 ohms. (Other reflectometry methods will have the same relative peak heights, but different shapes.) The height of the peak relative to the maximum peak gives the reflection coefficient. Impedance discontinuities that are greater than 10 ohms different than the characteristic impedance (reflection coefficients greater than 10%) are relatively easy to identify and locate. Impedance differences below 10% become progressively more difficult to identify, as their response is much smaller, and eventually the peaks from the reflection are smaller than the measurement error. Often the peaks from changes of interest (damaged insulation, for instance) are lower than peaks from “normal” changes (such as water on the wire or changes due to wire movement). These normal changes would then cause false positives, if a system was tuned to be sufficiently sensitive to identify very small faults.

Figure 1 Spread Spectrum Time Domain Reflectometry (SSTDR) responses for different load impedances. The correlation amplitude is proportion to reflection coefficient. Other reflectometry methods will have the same relative peak magnitudes, but different shapes of the pulses. Chafes and Frays
Finding the small anomalies of frayed wire before they become hard open or short circuits is of significant interest; however it is an extremely difficult problem. Chafing insulation from the conductor results in a very small change in the wire impedance. Since the reflection obtained by reflectometry depends on the impedance discontinuity, this results in a very small reflection that may be lost in the noise of the measurements. This problem is further exacerbated
Some authors have reported success locating frays in a controlled laboratory environment. In [2], TDR is used to detect bends, heating, and compression in coaxial and unshielded wiring, in a controlled setting where the wire is not allowed to move around, is isolated from other wires, and from the physical structure of the plane. In [3] and [4] the authors observed that frays are more observable at high frequencies than low frequencies, which could potentially be used to distinguish them from the normal wire. In [5] a method for using a sliding correlator to locate the signature of the fray from within the other noise on the wire was shown to be effective even for very small faults in a highly controlled setting. With these early analyses, there could be some hope for location of frays, however it should be noted that these tests were done in a very controlled laboratory environments. The wire is normally taped to a table or other surface to prevent movement and vibration (which create impedance changes), and carefully measured with no additional signal on the line and minimal measurement noise. The fray is then made, which generally results in a reflection too small to see in the raw data. The frayed and unfrayed signatures are subtracted, giving a response that may then show the fray. This baseline or differential approach is a natural fit for finding small changes such as frays. Unfortunately, obtaining a perfect baseline in a realistic environment is not easy. Even if you could baseline all wires on a plane, when the plane flies, the wires vibrate and move enough that the changes in the baseline may outweigh the changes due to the fray, making fray location impossible. The magnitude of reflections from the fray
Mismatch betweenSSTDR and Wire

compared to likely changes in the baseline was reported in [6], reproduced in Figure 2. The values (vertical axis) are relative values measured using a TDR for different amounts of damage to the insulation and conductor, water on the wire, movement (vibration) of the wire. The hardware noise is also given. This is the noise margin of the specific TDR unit used. The open and short circuit clearly dominate the response. The movement noise and variation from water on undamaged insulation could be considered “normal” variation in the wiring environment and give reflections that are larger than those observed for damage to either insulation or conductor. The hardware noise depends on the specific hardware used, and can also be reduced by averaging over a longer time and other signal processing techniques. The results observed here apply to all reflectometry methods including TDR, STDR, SSTDR, FDR, SWR, etc.
Figure 2: Peak values for different frays. (1) Hardware Noise, (2) Movement noise, (3) 0.15 mm cut from top, (4) 0.45 mm cut from top, (5) 0.76 mm cut from top, (6) 0.15 mm cut from side, (7) 0.45 mm cut from side, (8) 0.75 mm cut from side, (9) insulation removed from single side, (10) water on good wire, (11) ¼ conductor damaged, (12) water on cable with insulation removed, (13) Open Circuit, (14) Short Circuit. From [6]. Summary of this Paper
Predicting faults before the system experiences any symptoms from them (“prognostics”) is a promising method to utilize on board fault location hardware to reduce the amount of unscheduled maintenance that must be devoted to finding and repairing faulty electrical wiring. This paper describes tests on a vibrating wiring harness and how they may be used to locate some types of small faults. An assessment of wet arcs and their association with changes in the electrical system is also presented. These tests show that a system capable of locating faults when they are small and intermittent has good promise for use as a prognostic test tool.
II. Methods: Vibration Test Setup To simulate the way a wire reacts in flight, a vibration setup was established. This setup has sixteen wire
harnesses mounted on two different light weight aluminum test panels. The connectors for the panels were fixed mounted to the respective panels. Four vibration motor and an accelerometer were mounted to the panels and controlled using a Labworks VibeLab system. Using the VibeLab setup a random vibration profile was created to

allow for a strong enough vibration to simulate what happens to wires on an aircraft. The random vibration shakes the setup at many different frequencies, so that vibration harmonics were not created and sustained on the wires.
To achieve the largest vibration on the wires as possible the test panels were suspended by elastomeric cords to allow for the panels to shake freely. The cords are supported from an upside down table to allow for portability and flexibility of the testing. Figure 3 demonstrates the location of the motors, accelerometer and how the panels are mounted to achieve proper vibrations.
Figure 3 – Shaker table setup with motors and accelerometer.
Each panel has eight mounted wire harnesses (four on each side). Four properly run harnesses are run on
one side, and four harnesses with different wiring anomalies are run on the other side. Figure 4 is a photo showing the properly run wires. The wires use the proper clamps and have no other problems.
Figure 4 – Test panel showing properly run harnesses.
Eight different types of anomalies were included, four on each panel. These anomalies were selected to approximate problems in wiring on actual aircraft. The first four anomalies were created on panel 1 (see Figure 13) and the second four mounted on panel 2 (see Figure 14.) The eight anomalies are as follows:
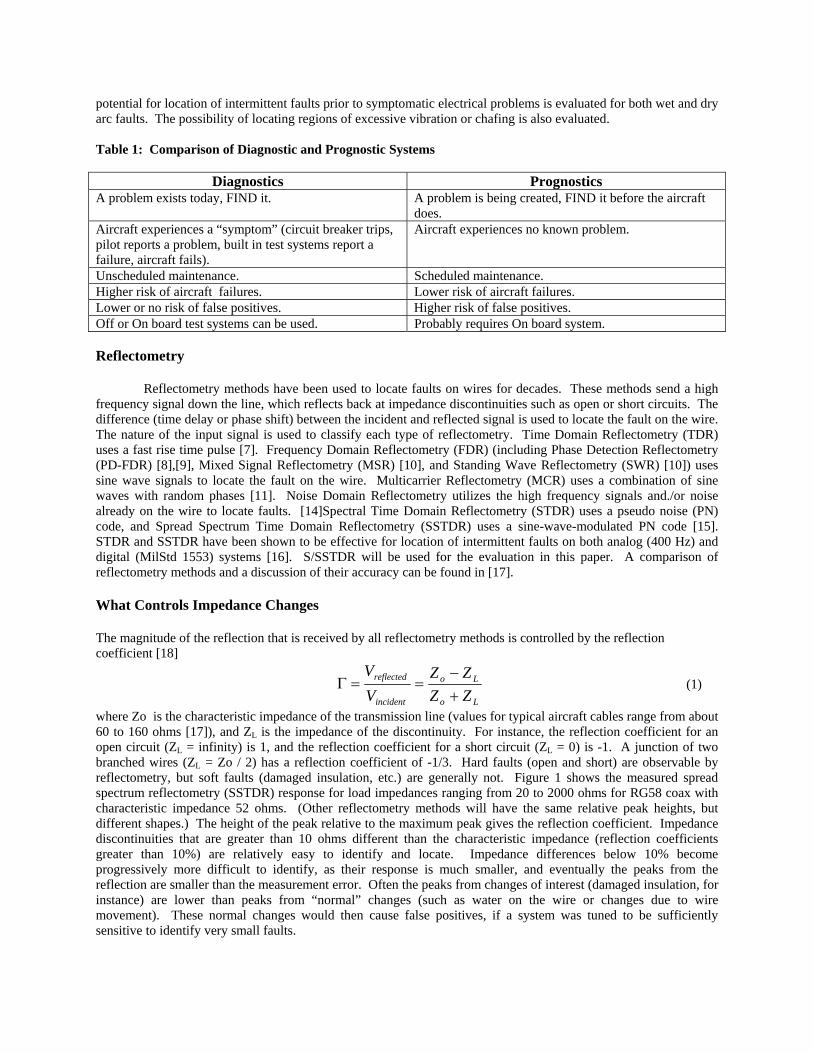
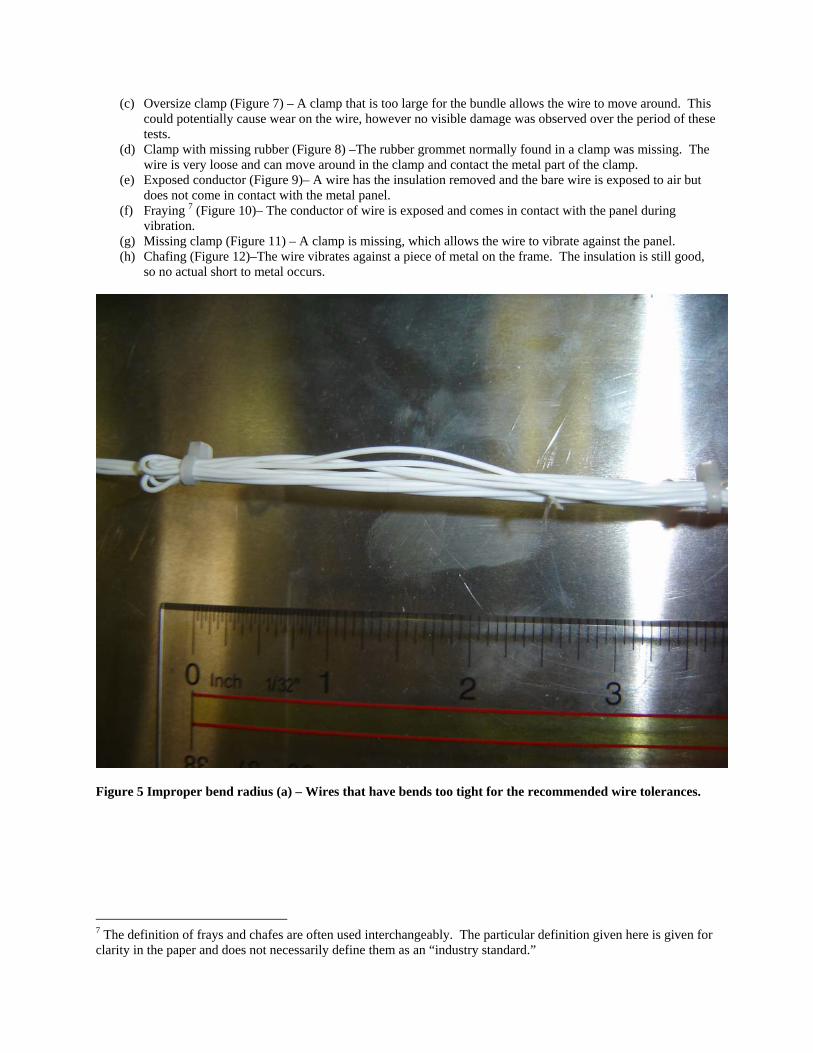
(a) Improper bend radius (Figure 5) – Wires that have bends too tight for the recommended wire tolerances. (b) Sharp corner(Figure 6) –The wire is run across a sharp peace of metal that puts strain on the wire, and can
cause wear on the wire. The insulation did not show visible wear over the course of these tests.
Accelerometer
Motors
(c) Oversize clamp (Figure 7) – A clamp that is too large for the bundle allows the wire to move around. This could potentially cause wear on the wire, however no visible damage was observed over the period of these tests.
(d) Clamp with missing rubber (Figure 8) –The rubber grommet normally found in a clamp was missing. The wire is very loose and can move around in the clamp and contact the metal part of the clamp.
(e) Exposed conductor (Figure 9)– A wire has the insulation removed and the bare wire is exposed to air but does not come in contact with the metal panel.
(f) Fraying 7 (Figure 10)– The conductor of wire is exposed and comes in contact with the panel during vibration.
(g) Missing clamp (Figure 11) – A clamp is missing, which allows the wire to vibrate against the panel. (h) Chafing (Figure 12)–The wire vibrates against a piece of metal on the frame. The insulation is still good,
so no actual short to metal occurs.
Figure 5 Improper bend radius (a) – Wires that have bends too tight for the recommended wire tolerances.
7 The definition of frays and chafes are often used interchangeably. The particular definition given here is given for clarity in the paper and does not necessarily define them as an “industry standard.”
Figure 6 Sharp corner (b) –The wire is run across a sharp peace of metal that puts strain on the wire, and can cause wear on the wire. The insulation did not show visible wear over the course of these tests.

Figure 7 Oversize clamp (c) – A clamp that is too large for the bundle allows the wire to move around. This could potentially cause wear on the wire, however no visible damage was observed over the period of these tests.
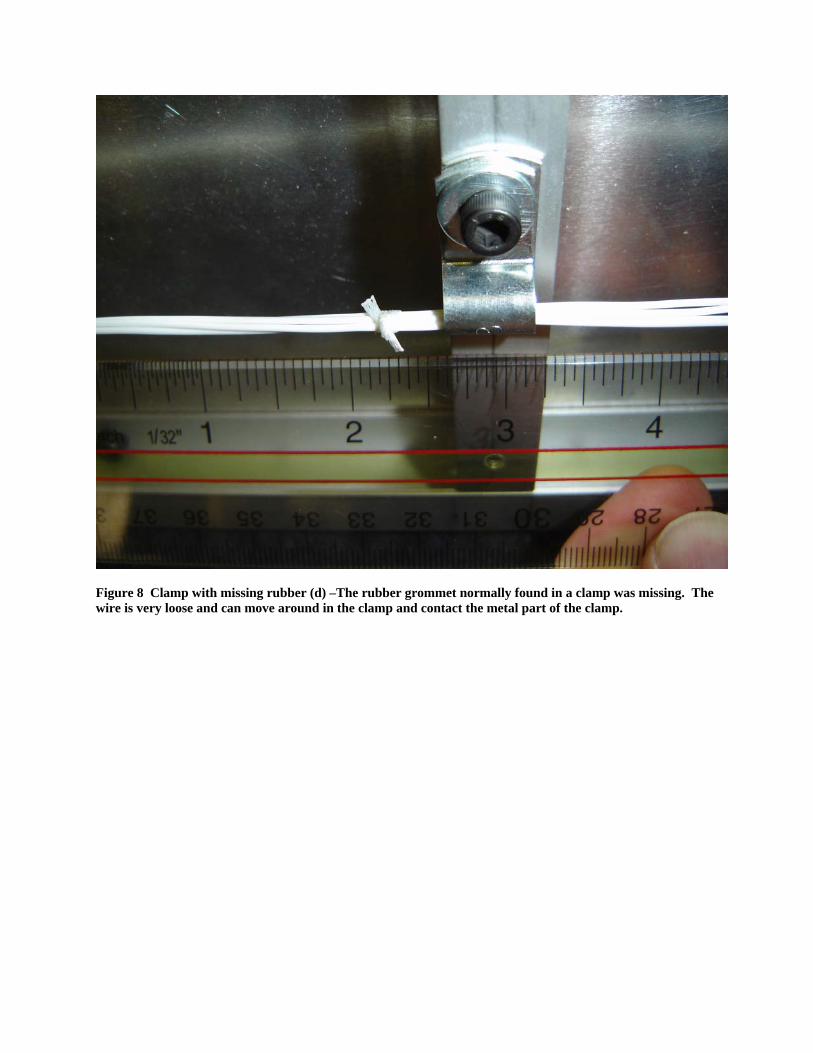
Figure 8 Clamp with missing rubber (d) –The rubber grommet normally found in a clamp was missing. The wire is very loose and can move around in the clamp and contact the metal part of the clamp.

Figure 9 – Exposed conductor (e). A wire has the insulation removed and the bare wire is exposed to air but does not come in contact with the metal panel.
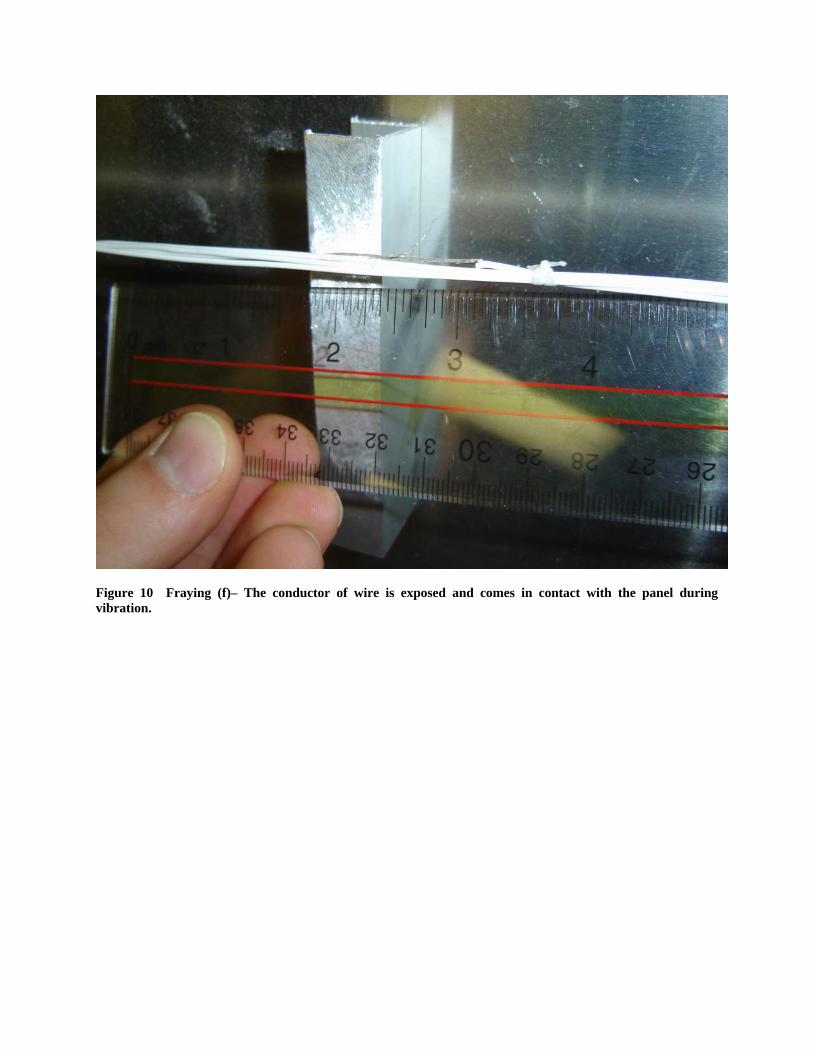
Figure 10 Fraying (f)– The conductor of wire is exposed and comes in contact with the panel during vibration.
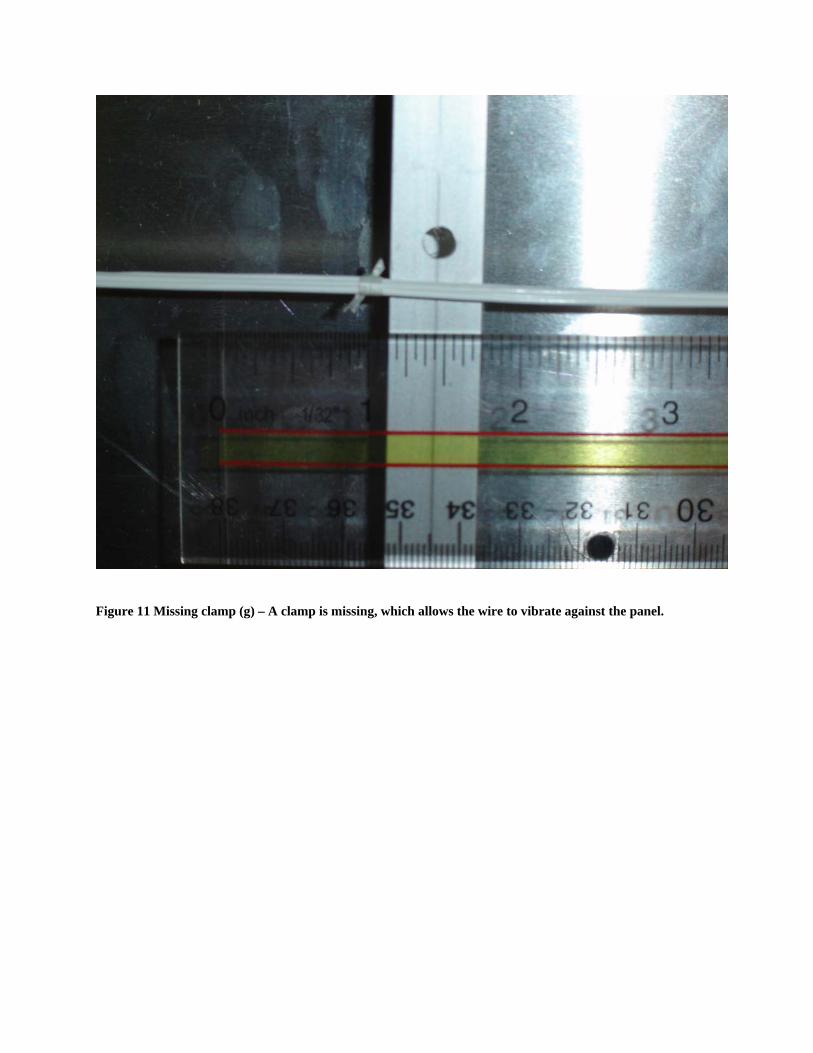
Figure 11 Missing clamp (g) – A clamp is missing, which allows the wire to vibrate against the panel.
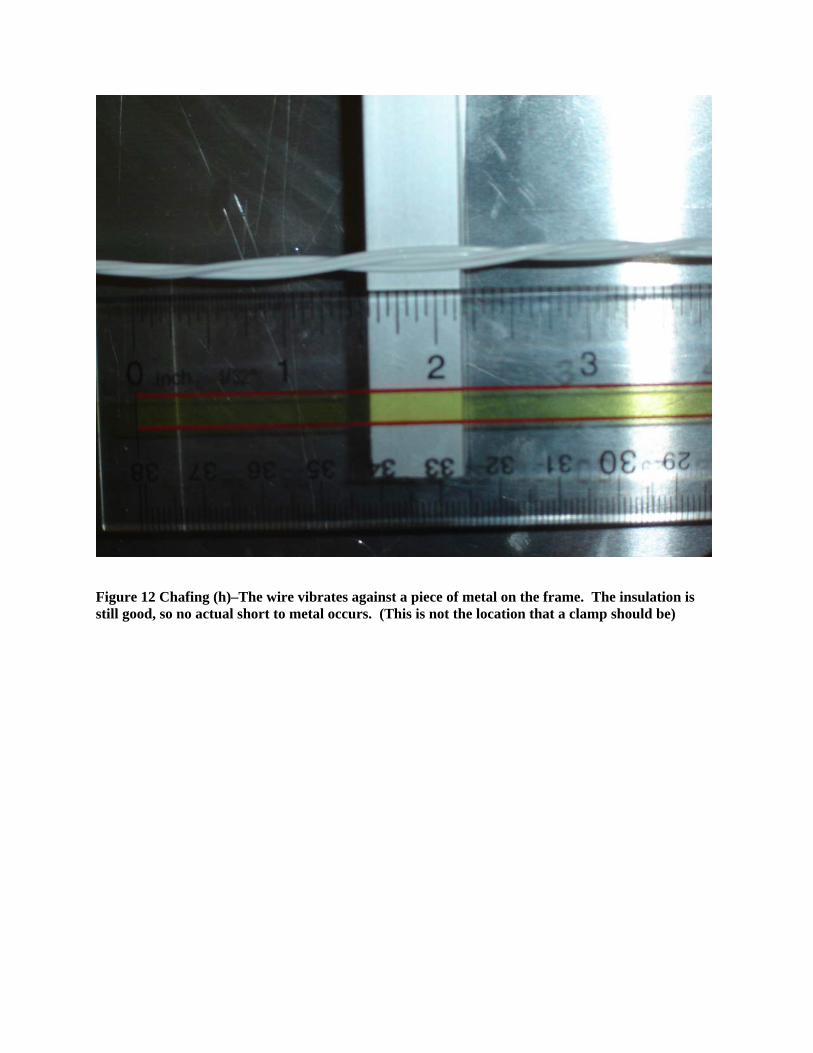
Figure 12 Chafing (h)–The wire vibrates against a piece of metal on the frame. The insulation is still good, so no actual short to metal occurs. (This is not the location that a clamp should be)

Figure 13 – Test panel 1 harness anomalies.
Figure 14 – Test panel 2 harness anomalies.
Data Collection
Using the VibeLab vibration profile shown in Figure 15, a Livewire sequence time domain reflectometry (STDR) system was used to collect the reflection signature from each harness over time. The STDR hardware contains switching and interface hardware that allows the tester to collect reflection data from four wires with a single test setup. All of the test data was taken for that 900 ms duration in 1ms increments.
Improper Bend Radii
Oversize Clamp
Clamp with Missing Rubber
Sharp Corner
Missing Clamp Chaffing
Fraying
Exposed conductor

Figure 15 – Screen capture of vibration profile used during tests. A sensor was placed in the center of the test panels close to a metallic support to monitor the vibration of the panel as a whole. The feedback from the sensor was fed into the program to adjust drive levels until the above-displayed vibration profile was achieved.
III. Vibration Test Data Analysis
After all of the STDR waveforms were collected, they were statistically evaluated to determine if the impedance changes from these faults could be detected. The raw data from the STDR device are shown in Figure 16 . The only fault that is visible from the raw data is (f) where exposed conductor comes in contact with the metal panel.
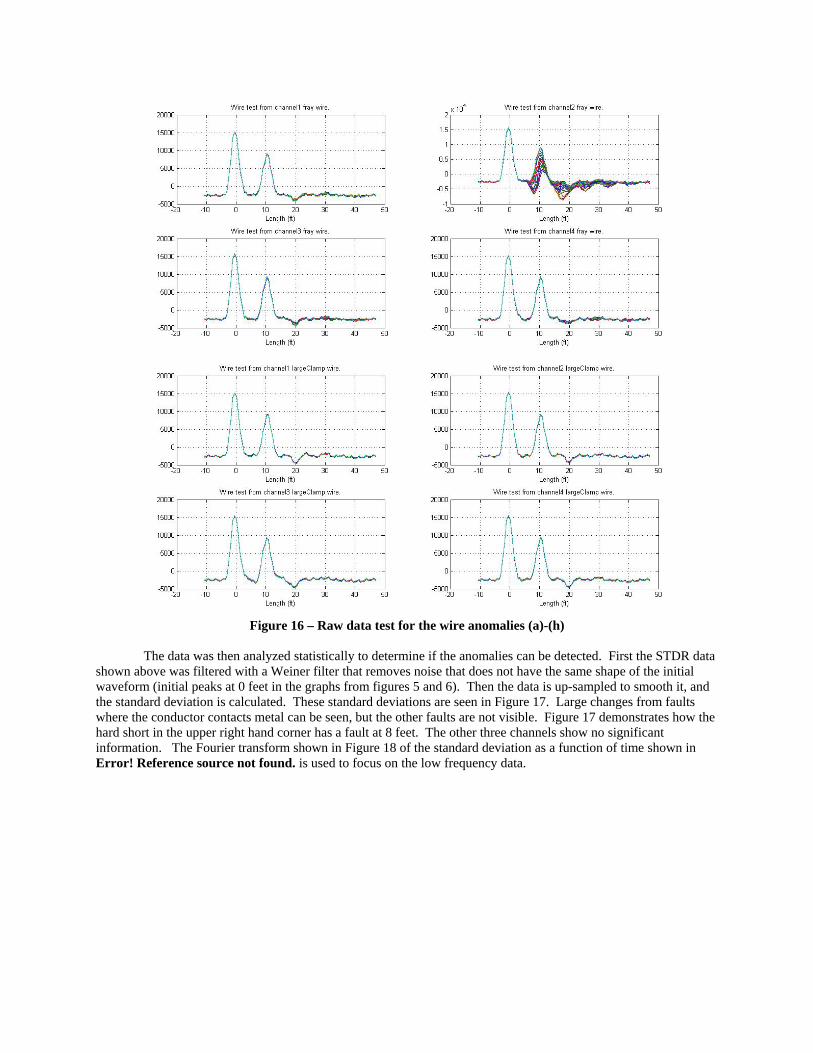
Figure 16 – Raw data test for the wire anomalies (a)-(h)
The data was then analyzed statistically to determine if the anomalies can be detected. First the STDR data
shown above was filtered with a Weiner filter that removes noise that does not have the same shape of the initial waveform (initial peaks at 0 feet in the graphs from figures 5 and 6). Then the data is up-sampled to smooth it, and the standard deviation is calculated. These standard deviations are seen in Figure 17. Large changes from faults where the conductor contacts metal can be seen, but the other faults are not visible. Figure 17 demonstrates how the hard short in the upper right hand corner has a fault at 8 feet. The other three channels show no significant information. The Fourier transform shown in Figure 18 of the standard deviation as a function of time shown in Error! Reference source not found. is used to focus on the low frequency data.
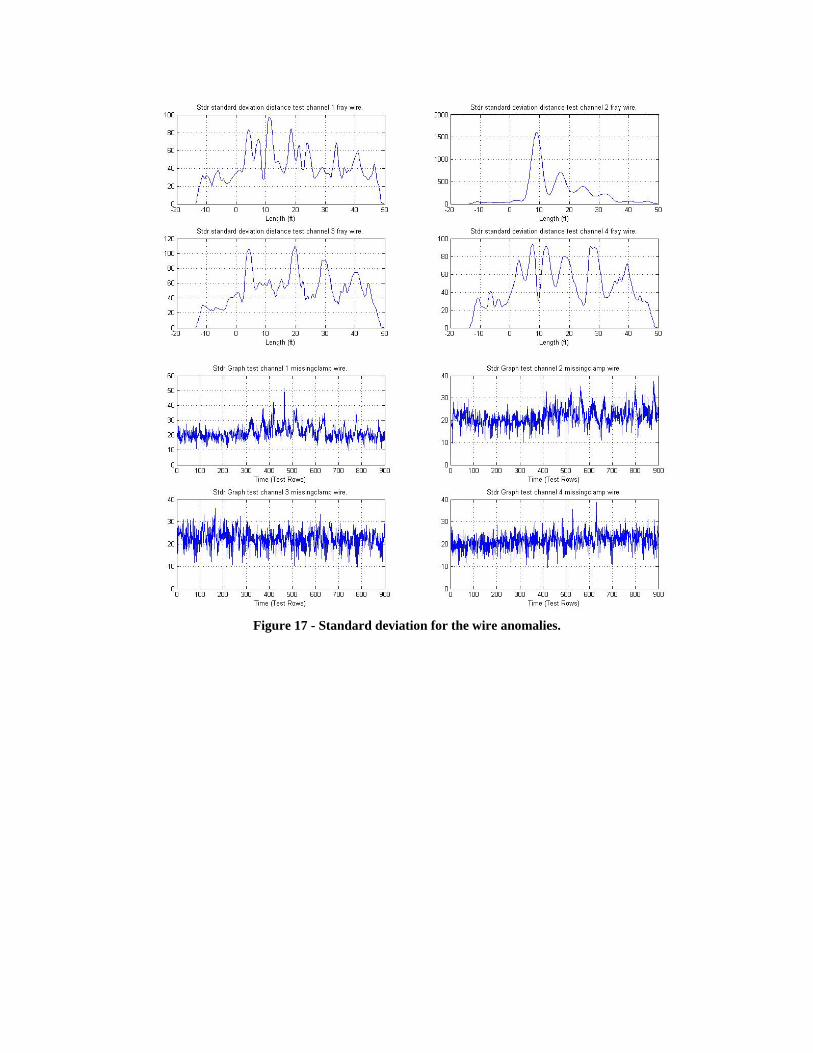
Figure 17 - Standard deviation for the wire anomalies.

Figure 18 – Fourier transform of Error! Reference source not found. for the wire anomalies.
Figure 19 – Fourier Transform of a properly run wire.

Ability to Detect Fault Precursors The majority of the faults could not be distinguished from changes in the normal wire bundles from the data above. Intermittent metal-to-metal contact could be detected with high certainty. Vibration of wire against relatively large metal areas could be detected with moderate success. Faults that involved significant variation in the distance between the metal panel or nearby clamp and the wiring conductor could be detected with moderate success. The fray anomaly (f) where the exposed wire conductor comes in intermittent contact with the metal panel is the easiest to detect. This can be detected and located with excellent success. This is not a precursor but an actual wire fault caused by some of the other anomaly conditions. It could be a precursor to system failure, however, and was clearly determined repeatedly under vibration. The oversize clamp anomaly (c) is a precursor that can potentially be seen by the above methods. It has enough surface area that the wire comes in contact with to be able to see the impedance changes. The clamp with missing rubber anomaly (d) is very similar to the oversize clamp in that the distance between the wire and nearby metal (the inside of the clamp) varies sufficiently, so the precursor can be determined with moderate success. The missing clamp anomaly (g) impedance change can be determined, because the wire is loose and comes in contact with a large surface area of metal. The chafing anomaly (h) (with no metal to metal contact) is very similar to the missing clamp anomaly, but the wire bundle is not loose, and so the impedance change is smaller but the precursor can be found with moderate success.
Small faults that could not be detected included the improper bend radii, wire vibrating against a sharp corner, and an exposed conductor that was not in contact with other metal. The improper bend radii (a) anomaly had very small impedance changes, and the above methods were unable to determine the precursor. The sharp corner anomaly (b) had very small changes in impedance. It was very close but not sufficient to being able to distinguish the precursor from variation in normal wire. This is probably because the surface area of the metal that the wire is intermittently in contact with is very small which makes the impedance change also very small. The exposed conductor (that does not come in contact with the metal panel) anomaly (e) had very small changes, and the above methods were unable to determine the precursor. This is due to the fact that there was no other exposed conductive material in the vicinity of the exposed conductor.
IV. Prognosis of Wet Arcs
This section explores the potential of reflectometry systems to locate wet arcs before the system experiences
any symptoms. A wet arcs occurs when a drop of water bridges damaged insulation, typically between two wires in a bundle. The water creates a current path, and an arc is created. After multiple arcs, the insulation may carbonize, causing a large flashover, severe wire damage, and possible fire and/or system failure. Arc fault circuit breakers have been developed to detect the noise in the current signature caused by these arcs. Typically many (often 20 or more) drips of saline are required before the system experiences flashover. The arc fault circuit breaker typically trips after several drips have occurred, and before flashover. The arc fault circuit breaker is relying on detection of the noise in the current signature caused by arcing. One of the challenges inhibiting widespread adopting of the arc fault circuit breaker is the challenge of locating and repairing the fault after the breaker has tripped. The fault left behind after the breaker trips is so small that it is impossible to locate with traditional ground based maintenance tools. The SSTDR system was developed specifically to solve this problem. Reflectometry locates (and detects) faults using a different method than the arc fault circuit breakers. Instead of looking for noise in the current signature, reflectometry looks for impedance changes on the wire such as the low impedance partial short caused by the conductive water path of the wet arc. Reflectometry methods (such as S/SSTDR) that can be run while the system is live can locate the wet arc without interfering with the system. [16] The prognostic capability of a reflectometry system depends on the ability to locate the wet arc (which depends on the salinity of the water bridging a gap in the insulation) before the system experiences any symptoms (which depends on the sensitivity of the arc fault circuit breaker or other system components.
The test system for wet arcs is shown in Figure 20. A 1.5cm insulation breach was created on a pair of wires, which were connected to a 28V power supply with a 1A limiter and an aircraft lamp. Saline water was dripped on the damaged insulation, and the STDR signatures were collected using a digitizing scope for convenience. The magnitude of the fault depends on the salinity of the water, as shown in Figure 21. The system response also depends on the salinity of the water, as shown by the current in Figure 22. The current spike may or may not be detected by an arc fault circuit breaker. Typically these breakers do not trip on a single saline drip, so it is unlikely that the breaker would have detected this single wet arc. The reflectometry system, however, had
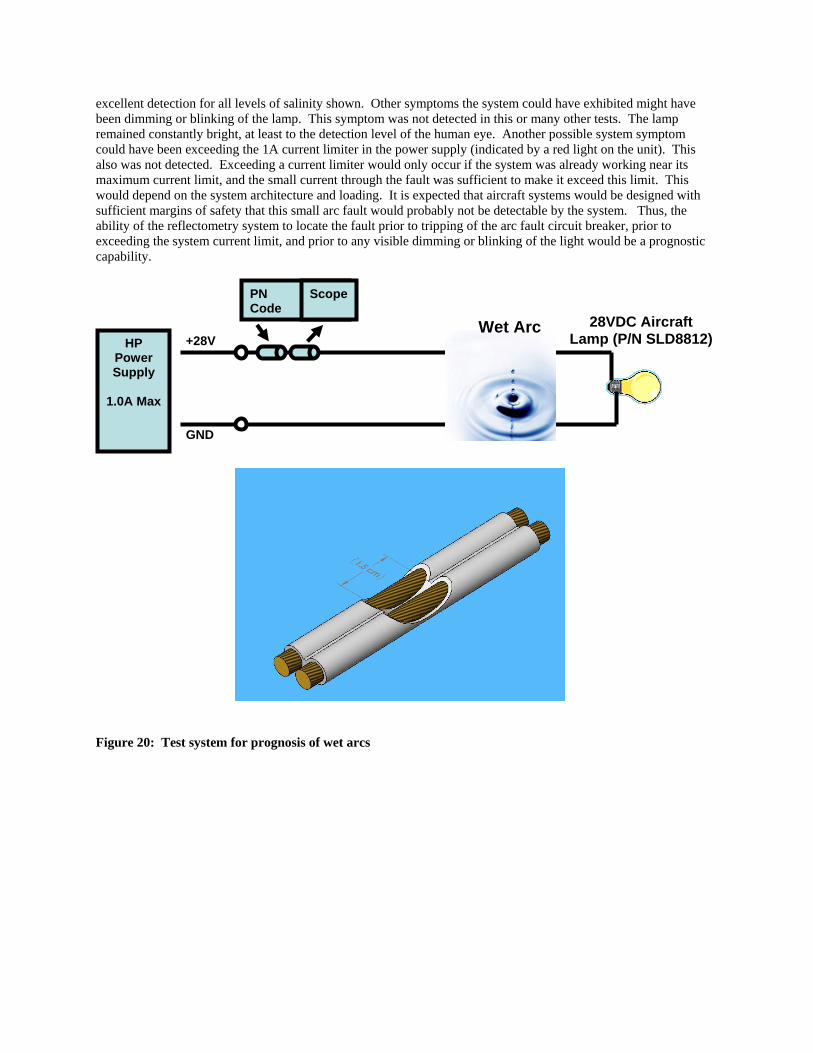
excellent detection for all levels of salinity shown. Other symptoms the system could have exhibited might have been dimming or blinking of the lamp. This symptom was not detected in this or many other tests. The lamp remained constantly bright, at least to the detection level of the human eye. Another possible system symptom could have been exceeding the 1A current limiter in the power supply (indicated by a red light on the unit). This also was not detected. Exceeding a current limiter would only occur if the system was already working near its maximum current limit, and the small current through the fault was sufficient to make it exceed this limit. This would depend on the system architecture and loading. It is expected that aircraft systems would be designed with sufficient margins of safety that this small arc fault would probably not be detectable by the system. Thus, the ability of the reflectometry system to locate the fault prior to tripping of the arc fault circuit breaker, prior to exceeding the system current limit, and prior to any visible dimming or blinking of the light would be a prognostic capability.
Figure 20: Test system for prognosis of wet arcs
HP Power Supply
1.0A Max
+28V
PN Code
Scope
28VDC Aircraft Lamp (P/N SLD8812)
GND
Wet Arc

Figure 21 Magnitude of the fault observed by STDR as a function of salinity of the water drip
0 20 40 60 80 100 120 140 160 180 20010
15
20
25
30
35
Time (x 10ms)
Cur
rent
(mA
)
Current Change at Fault
1000ppm5000ppm10000ppm30000ppm50000ppm
0 10 20 30 40 50 60-0.4
-0.2
0
0.2
0.4
0.6
0.8
1
Wire Length (ft)
Nor
mal
ized
Cor
rela
tion
Am
plitu
de
Fault @ 15ft
No Fault1000ppm5000ppm10000ppm30000ppm50000ppm
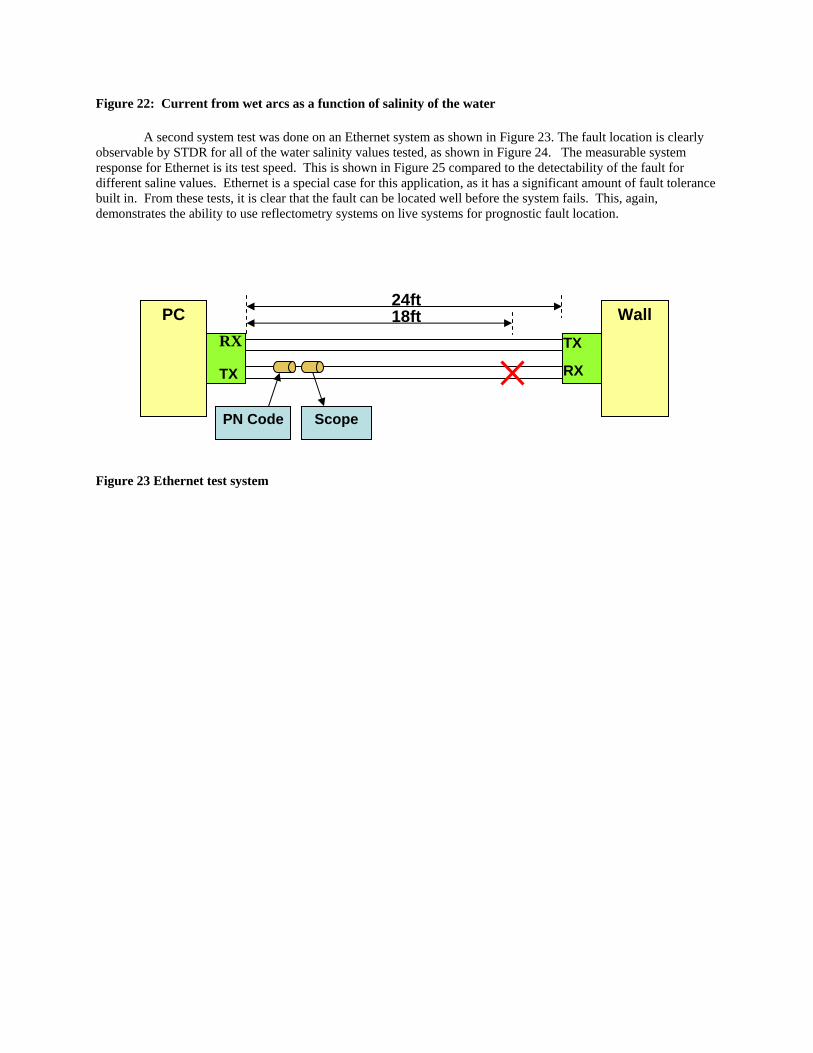
Figure 22: Current from wet arcs as a function of salinity of the water A second system test was done on an Ethernet system as shown in Figure 23. The fault location is clearly observable by STDR for all of the water salinity values tested, as shown in Figure 24. The measurable system response for Ethernet is its test speed. This is shown in Figure 25 compared to the detectability of the fault for different saline values. Ethernet is a special case for this application, as it has a significant amount of fault tolerance built in. From these tests, it is clear that the fault can be located well before the system fails. This, again, demonstrates the ability to use reflectometry systems on live systems for prognostic fault location.
Figure 23 Ethernet test system
PC
Wall
TX
RX
RX
TX
PN Code Scope
24ft18ft
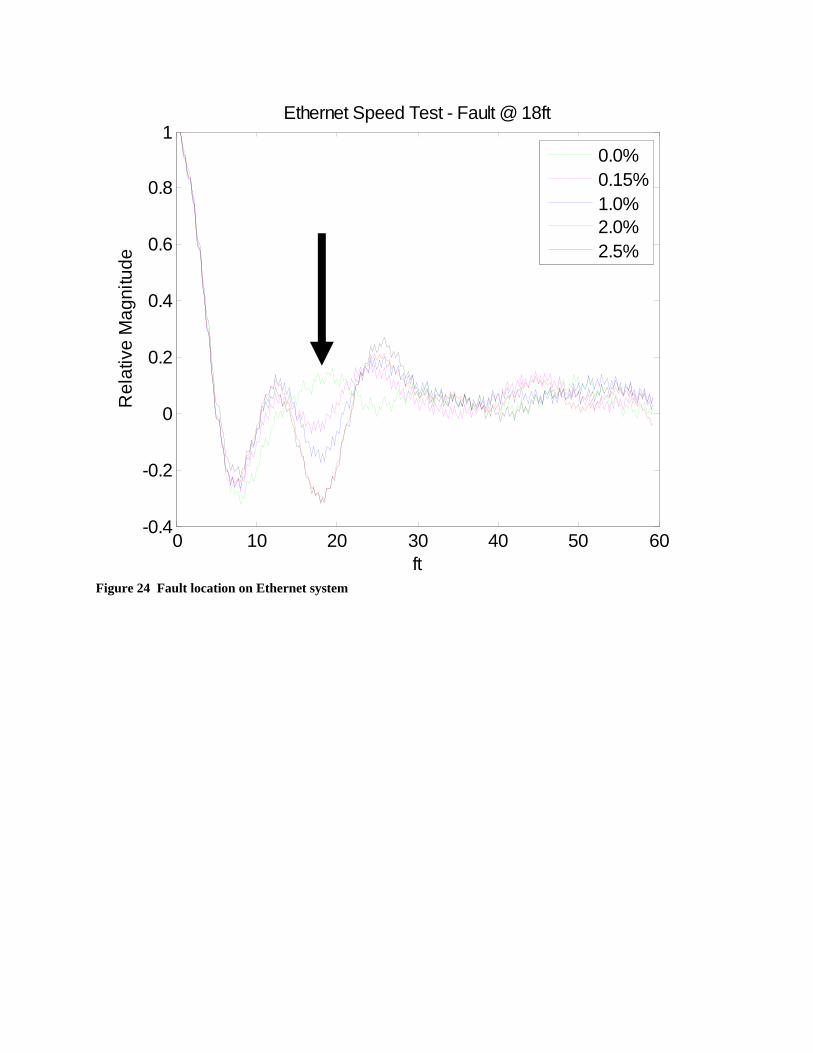
Figure 24 Fault location on Ethernet system
0 10 20 30 40 50 60-0.4
-0.2
0
0.2
0.4
0.6
0.8
1Ethernet Speed Test - Fault @ 18ft
ft
Rel
ativ
e M
agni
tude
0.0%0.15%1.0%2.0%2.5%

Figure 25 System response vs. fault location for Ethernet test system
Conclusion
The ability to locate faults on aircraft wiring before the system experiences symptoms is strongly desired. This ability to predict (prognose) a problem in advance can enable maintenance crews to locate and fix the problem during scheduled maintenance. A vibrating test bed was used to examine the ability of a reflectometry system working live to locate small anomalies in a wiring sytem. The majority of the faults could not be distinguished from changes in the normal wire bundles caused by vibration. Intermittent metal-to-metal contact could be detected with high certainty. Vibration of wire against relatively large metal areas could be detected with moderate success. Other variations (removal of insulation or vibration against small metal areas) could not be detected. Faults that involved significant variation in the distance between the metal panel or nearby clamp and the wiring conductor could be detected with moderate success. The fray anomaly (f) where the exposed wire conductor comes in intermittent contact with the metal panel is the easiest to detect. This can be detected and located with excellent success. This is not a precursor but an actual wire fault caused by some of the other anomaly conditions. It could be a precursor to system failure, however, and was clearly determined repeatedly under vibration. The oversize clamp anomaly (c) is a precursor that can potentially be seen by the above methods. It has enough surface area that the wire comes in contact with to be able to see the impedance changes. The clamp with missing rubber anomaly (d) is very similar to the oversize clamp in that the distance between the wire and nearby metal (the inside of the clamp) varies sufficiently, so the precursor can be determined with moderate success. The missing clamp anomaly (g) impedance change can be determined, because the wire is loose and comes in contact with a large surface area of metal. The chafing anomaly (h) (with no metal to metal contact) is very similar to the missing clamp anomaly, but the wire bundle is not loose, and so the impedance change is smaller but the precursor can be found with moderate success.
0 0.25 0.5 0.75 1 1.25 1.5 1.75 2 2.25 2.50
0.1
0.2
0.3
0.4
0.5
0.6
0.7
0.8
0.9
1
1.1
1.2Salt vs. Ethernet Speed
Nor
mal
ized
Mag
nitu
de
Salt (%)
SpeedReflection
System Response Fault Can Be Located
Small faults that could not be detected included the improper bend radii, wire vibrating against a sharp corner, and an exposed conductor that was not in contact with other metal. The improper bend radii (a) anomaly had very small impedance changes, and the above methods were unable to determine the precursor. The sharp corner anomaly (b) had very small changes in impedance. It was very close but not sufficient to being able to distinguish the precursor from variation in normal wire. This is probably because the surface area of the metal that the wire is intermittently in contact with is very small which makes the impedance change also very small. The exposed conductor (that does not come in contact with the metal panel) anomaly (e) had very small changes, and the above methods were unable to determine the precursor. This is due to the fact that there was no other exposed conductive material in the vicinity of the exposed conductor.
In addition, two systems (28VDC and Ethernet) were tested to determine the ability of a live reflectometry system such as STDR or SSTDR to locate wet arcs. It was observed that the salinity of the water creating the wet arc has a significant effect on the size of the reflected signal and thus the ability of the system to detect and locate the fault. This also had an impact on the symptoms observed in the system. For both systems, it was observed that the wet arc can be located well before the system expresses an observable symptom. Exceptions to this would be when the system is running so near its maximum power handling capability that the wet arc immediately causes system response. This indicates that a live fault location system has high promise for prognostic capability.
Some important aspects of a live fault location system are that it needs to be built into the aircraft and must be testing the wires when the intermittent faults, particularly wet arcs occur.
Acknowledgements This work was supported by JPL Research & Development under Subcontract No. 1285506 and the Air
Force Research Laboratory.
References
[1] J. Collins,G. Edwards, “NAVAIR Aircraft Wiring Diagnostic Support Equipment for Multiple Maintenance Levels,” Aging Aircraft Conference 2005, Palm Springs, CA, April 2005, Source: Navy Safety Center Hazardous Incident Data
[2] J.P. Steiner, W.L. Weeks, Time-Domain Reflectometry for Monitoring Cable Changes: Feasibility Study, EPRI GS-6642, February 1990
[3] Brent Waddoups, Cynthia Furse, Mark Schmidt, Analysis of Reflectometry for Detection of Chafed Aircraft Wiring Insulation, 5th Joint NASA/FAA/DoD Conference on Aging Aircraft Sept. 10-13, 2001, Orlando, Florida
[4] Brent Waddoups, “Analysis of reflectometry for detection of chafed aircraft wiring insulation.” Masters Thesis, Utah State University, 2001. (available from http://wwwlib.umi.com/dissertations/)
[5] Alok Jani, “Location of Small Frays using TDR,” Masters Thesis,Utah State University, Logan, Utah, 2003. [6] Lance Griffiths, Rohit Parakh, Cynthia Furse, Brittany Baker, “The Invisible Fray: A Critical Analysis of the
Use of Reflectometry for Fray Location,” IEEE Journal of Sensors, Volume 6, Issue 3, June 2006 Page(s):697 [7] Mark Schmidt, “Use of TDR for Cable Testing “ MS Thesis, Utah State University, Logan,Utah, 2002. [8] Y Chung, C. Furse, Jeremy Pruitt “Application of Phase Detection Frequency Domain Reflectometry for
Locating Faults in an F-18 Flight Control Harness ,” IEEE Trans. Electromagnetic Compatibility, vol. 47, No. 2, pp.327-334, May 2005.
[9] Cynthia Furse, You Chung Chung, Rakesh Dangol, Marc Nielsen, Glen Mabey, Raymond Woodward, “Frequency Domain Reflectometery for On Board Testing of Aging Aircraft Wiring,” IEEE Trans. Electromagnetic Compatibility, vol. 45, No. 2, , pp. 306-315, May 2003.
[10] P. Tsai, Y. Chung, C. Lo, C.Furse, ,”Mixed Signal Reflectometer Hardware Implementation for Wire Fault Location,” IEEE Journal of Sensors, vol. 5, Issue 6, pp. 1479-1482, Dec. 2005.
[11] Suketu Naik, Cynthia M. Furse and Behrouz Farhang-Boroujeny, “Multicarrier Reflectometry,” accepted to IEEE Journal of Sensors
[12] Brent Waddoups, “Analysis of reflectometry for detection of chafed aircraft wiring insulation,” MS Thesis, Utah State University, Logan, Utah, 2001.
[13] Alok Jani, “Location of Small Frays using TDR,” MS Thesis, Utah State University, Logan,Utah, 2003. [14] C.Lo, C.Furse, “Noise Domain Reflectometry for Wire Fault Location,” IEEE Trans. EMC, Vol. 47, No. 1, Feb.
2005, pp.97-104
[15] P. Smith, C.Furse, J.Gunther, “Analysis of Spread Spectrum Time Domain Reflectometry for Wire Fault Location,” IEEE Journal of Sensors, Volume 5, Issue6, Dec. 2005 Page(s):1445-1450.
[16] C.Furse, P.Smith, M. Safavi, C. Lo,” Feasibility of Spread Spectrum Reflectometry for Location of Arcs on Live Wires,” IEEE Journal of Sensors, Vol.5, No. 6, Dec 2005, pp.1445-1450
[17] Cynthia Furse, You Chung Chung, Chet, Lo, Praveen Pendayala, “A Critical Comparison of Reflectometry Methods for Location of Wiring Faults,” Smart Structures and Systems, Vol. 2, No.1, 2006, pp. 25-46
[18] Iskander MF, Electromagnetic Fields and Waves. Englewood Cliffs, NJ: Prentice Hall, 1992.