the potential role of carbon pricing in thailand's power
TRANSCRIPT

The Potential Role of Carbon Pricingin Thailand’sPower Sector
March 2021

The Potential Role of Carbon Pricing in Thailand's Power Sector Abstract
PAGE | 2
Abstract
Thailand is committed to playing its part in the international efforts aimed at addressing climate issues. As it is for most countries, the power sector in Thailand is among the largest emitters, accounting for 38% of energy-related CO2 emissions. Hence, reducing the emissions from this sector is fundamental in reducing the country’s total emissions. This report explores the potential role of carbon pricing in driving emissions reduction in power generation and supporting a clean energy transition in the country. Building on the understanding of the current power market structure and future development plans, this report leverages on the results from in-depth 2030 power production cost modelling to assess the potential impacts of carbon pricing on power generation dispatch and investment, and the resulting implications on emissions and costs. The recommendations arising from the assessment suggest that carbon pricing can play an active role in reducing the emissions from Thailand's power sector, with measures to mitigate the potential costs and distributional impacts.

The Potential Role of Carbon Pricing in Thailand's Power Sector Acknowledgements
PAGE | 3
Acknowledgements, contributors and credits
This report was prepared by the Environment and Climate Change Unit (ECC) in the Energy Environment Division (EED) of the International Energy Agency (IEA) in co-operation with the Thailand Greenhouse Gas Management Organization (Public Organization) (TGO).
Cyril Cassisa and Ermi Miao coordinated the project. The main authors of the report were Cyril Cassisa, Xiushan Chen, Luca Lo Re and Ermi Miao from the IEA, and Wongkot Wongsapai from Chiang Mai University. Peerapat Vithayasrichareon and Craig Hart from the Renewables Integration and Secure Electricity (RISE) unit of the IEA implemented the optimised production cost modelling for Thailand's power sector. Nopparat Phrom-in from the TGO provided valuable inputs and co-ordinated collaboration and engagement with government stakeholders in Thailand.
Sara Moarif, Unit Head of the ECC, Tom Howes, Division Head of the EED, and Mechthild Wörsdörfer, Director for Sustainability, Technology and Outlooks (STO) from the IEA, and Pongvipa Lohsomboon, Deputy Executive Director of the TGO provided valuable feedback and overall guidance to the project.
Valuable contributions and feedback were also given by other colleagues: César Alejandro Hernandez, Kieran Clarke, Nathaniel Lewis-George, Peter Fraser, Randi Kristiansen and Stefan Lorenczik.
The authors are also grateful for valuable comments and feedback from Thai stakeholders and external experts, including: Malin Ahlberg (BMU), Saharath Boonpotipukdee (TGO), Unnada Chewpreecha (Cameco), Zhang Da (Tsinghua University), Martin Gauss (Kommunalkredit Public Consulting), Sascha Oppowa (GIZ Thailand), Sukamol Prakobchat (DEDE), Ingo Puhl (South Pole), Betz Regina (ZHAW), Tortrakul Saengchan (EGAT), Anothai Sangthong (TGO), Marissa Santikarn (World Bank), Sumon Sumetchoengprochya (TGO), Kannika Thampanichvong (TDRI), Pradeep Tharakan (ADB), Hiripong Thepsiriamnuay (TGO), Pongpan Vorasayan (DEDE), Matthew Wittenstein (UNESCAP) and Zulfikar Yurnaidi (ASEAN Centre for Energy).

The Potential Role of Carbon Pricing in Thailand's Power Sector Acknowledgements
PAGE | 4
This analysis was carried out with the support of the IEA Clean Energy Transitions Programme (UK Funding).
Elspeth Thomson edited the report. The authors would also like to thank the IEA Communication and Digital Office (CDO) for providing valuable editorial and publishing support, particularly Astrid Dumond and Therese Walsh.

The Potential Role of Carbon Pricing in Thailand's Power Sector Table of contents
PAGE | 5
Table of contents
Executive summary ......................................................................................................................... 6
Key findings ................................................................................................................................... 7 Policy insights .............................................................................................................................. 11
Chapter 1. Background ................................................................................................................. 13 Carbon pricing in the power sector .............................................................................................. 13 Thailand power sector overview .................................................................................................. 22
Chapter 2. Modelling Methodology .............................................................................................. 32 Approach and assumptions ......................................................................................................... 32 Scenario design ........................................................................................................................... 35 Goals and limitations ................................................................................................................... 37
Chapter 3. Analysis of Results ..................................................................................................... 38 PDP Scenario with no carbon price ............................................................................................. 38 Flex scenario with no carbon price .............................................................................................. 42 Effect of carbon pricing ................................................................................................................ 46 Economic implications of carbon pricing in power dispatch ........................................................ 53 Economic impact of carbon pricing on VRE investment .............................................................. 59
References ..................................................................................................................................... 64 Acronyms and abbreviations ....................................................................................................... 67

The Potential Role of Carbon Pricing in Thailand's Power Sector Executive summary
PAGE | 6
Executive summary
Thailand relies heavily on fossil fuels to generate its electricity. However, it has committed to play its part in the international efforts to mitigate GHG emissions through its nationally determined contribution (NDC) and NDC roadmap. Thailand is currently preparing its first Climate Change Act. The introduction of a carbon price could help accelerate a transition to low-carbon energy, particularly in the power sector. Internalising the cost of carbon could provide incentives for a shift away from fossil fuel-based electricity. Based on an understanding of Thailand's regulated power market structure and key policies, this report assesses the potential role of carbon pricing in Thailand's power sector in reducing CO2 emissions and promoting a shift towards cleaner generating sources. It also explores the potential implications of carbon pricing with respect to operating costs and electricity prices. This report is part of IEA support to the Thailand Greenhouse Gas Management Organisation (TGO) on policy design for clean energy transition and climate change mitigation in Thailand.
The analysis builds on the results of an in-depth production cost modelling exercise1, the purpose of which was to study the effect of carbon pricing on generation dispatch in Thailand in 2030. It examines two scenarios for Thailand's power system in 2030, with each scenario comprising four cases of different carbon price level selected on the basis of international studies and Thailand's internal assessment on carbon pricing: USD 0/t CO2, USD 10/t CO2
(THB 320/t CO2), USD 30/t CO2 (THB 960/t CO2), and USD 40/t CO2
(THB 1 280/t CO2). The first scenario is called the PDP scenario, representing Thailand's power sector in 2030 based on the current Power Development Plan produced by the Ministry of Energy (PDP2018 Revision 1). The second scenario is called the Flex scenario, representing a more progressive vision for Thailand's power sector in 2030 with higher renewable penetration and more technical and contractual flexibility in the power system.
1 IEA (forthcoming), Thailand Power System Flexibility Study.
The Potential Role of Carbon Pricing in Thailand's Power Sector Executive summary
PAGE | 7
Key findings
A sufficient carbon price can effectively reduce emissions by triggering fuel switching in power generation
The modelling results demonstrate that a carbon price can incentivise CO2 emission reductions in Thailand's power sector by shifting the generation from more carbon-intensive plants to plants with lower emission intensity. The carbon price imposes a higher cost for carbon-intensive plants to operate, increasing their variable costs and pushing them further down in the merit order under economic dispatch decisions.
Under the pre-determined power capacity mix composed of existing and planned power plants, a carbon price set at a moderate level would be able to initiate a dispatch shift from coal-to-gas generation and deliver effective emission reductions while still maintaining contractual obligations and system reliability. The modelling results shows that a carbon price of around USD 30/t CO2 in 2030 could trigger a shift from coal to gas. Coal power plants have the lowest fuel price and the highest emissions intensity. By comparison, natural gas plants have a higher fuel price but a much lower emissions intensity. A USD 40/t CO2 carbon price could incentivise a shift of 23 TWh of coal to gas and reduce carbon emissions from electricity generation by 11% (13 Mt CO2) in 2030 under the PDP scenario compared with the PDP scenario without a carbon price.
The overall coal plant capacity factor would decrease as generation shifts from coal to gas. This implies that current coal power purchase agreements (PPA) may need to be revised. Retrofitting, repurposing or early retirement could potentially be cost-effective measures for some coal power plants, especially since Thailand is forecasted to continue having a high reserve margin relative to the international standard.

The Potential Role of Carbon Pricing in Thailand's Power Sector Executive summary
PAGE | 8
IEA. All rights reserved.
With a stable price signal, carbon pricing could enable additional deployment of renewables to displace coal
Combining a moderate carbon price of USD 30/t CO2 or more with more variable renewable energy (VRE) capacity and system flexibility would enable an effective shift from coal to VRE, which enables further emission abatement and drives a deeper transformation of Thailand's power sector.
In the Flex scenario without a carbon price, having more VRE capacity than under the PDP2018 Revision 1 and more technical and contractual flexibility in the system could reduce power sector emissions by 11 Mt CO2 in 2030. However, due to the relatively higher operating costs of natural gas, which in 2030 would be mainly in the form of combined cycle gas turbine plants (CCGT), the modelling results show that new additions of VRE capacity in the existing power system without a carbon price would trigger a shift in generation from natural gas to VRE with a limited impact on coal.
Introducing carbon pricing in tandem with VRE additions could bridge the cost gap between natural gas and coal, leading to an effective shift from coal to VRE, and reducing the generation of emission-intensive coal power. A USD 40/t CO2 carbon price combined with an additional 15 GW of VRE capacity and a more flexible power system could reduce total emissions from the power sector by 26 Mt CO2 compared with the PDP no carbon price scenario in 2030. Meanwhile, compared with a USD 40/t CO2 carbon price in the PDP scenario, the emission abatement impact of carbon pricing is amplified in a more flexible power system with
116 116 114 103
-
20
40
60
80
100
120
-
100
200
300
400
PDP PDP USD10 PDP USD30 PDP USD40
Emis
sion
s (M
tCO
2)
Gen
erat
ion
(TW
h)
Wind
Solar
Bioenergy
ImportedHydropowerDomesticHydropowerOil
Natural gas
Coal
Emissions

The Potential Role of Carbon Pricing in Thailand's Power Sector Executive summary
PAGE | 9
additional VRE capacity, delivering more emission reductions at the same carbon price level due to a higher decline in fossil fuel generation.
IEA. All rights reserved.
On a levelised cost of energy (LCOE) basis, wind and solar could become price competitive in Thailand's power system around mid-2020. If implemented today, a moderate carbon price could accelerate the price parity point between these technologies and fossil fuel power plants by 2022. In addition to changing the competitiveness of wind and solar vis-à-vis new fossil fuel capacity, a carbon price above USD 20/t CO2 could potentially make investing in new VRE more cost-competitive than maintaining and operating an existing fossil fuel power plant by 2030. Any revenues from a carbon pricing mechanism could also support VRE technology development and accelerate a clean energy transition.
The LCOE is not the only element to consider in the adoption of VRE because thermal plants can provide flexibility, peak demand capacity and other necessary services to support the grid. Nevertheless, previous IEA studies have shown that Thailand can accommodate more VRE penetration as planned in the PDP with additional technical and contractual flexibility. 2 Given Thailand's centralised planning process for power sector development, the introduction of a shadow carbon price within the integrated planning process could expand VRE in the next round of target-setting during the power development plan update.
2 IEA (2018), Thailand Renewable Grid Integration Assessment--Partner Country Series.
116 105
90
-
20
40
60
80
100
120
-
100
200
300
400
PDP Flex Flex USD40
Emis
sion
s (M
tCO
2)
Gen
erat
ion
(TW
h)
Wind
Solar
Bioenergy
ImportedHydropowerDomesticHydropowerOil
Natural gas
Coal
Emissions

The Potential Role of Carbon Pricing in Thailand's Power Sector Executive summary
PAGE | 10
Adapted carbon pricing design has the potential to deliver emission reductions without a significant cost increase
While delivering considerable emission reductions, a carbon price of USD 30 or USD 40/t CO2 might lead to a notable increase in the total power sector operating cost3 compared to the 2019 level. However, due to fuel cost savings, the adoption of a larger renewable component in the power mix would lead to the total operating cost decreasing from THB 0.97/kWh in 2019 to THB 0.86/kWh in 2030 under the PDP scenario without any carbon price. When a carbon price is applied, the overall electricity generation cost increases due to an increase in operating costs and carbon pricing liability. With a USD 40 carbon price, the PDP scenario's operating cost and carbon price liability combined reach THB 1.33/kWh by 2030. The operating cost increases by only THB 0.06/kWh from the PDP scenario without a carbon price as a result of the shift from coal to more expensive natural gas generation. The carbon pricing liability is THB 0.41/kWh, representing 87% of the total cost increase.
If all of the operating cost increase and carbon liability were passed through to consumers, the end-use electricity price would increase. However, this cost impact could be mitigated by carefully designing and adapting a carbon pricing mechanism for Thailand’s power sector. An important observation is that most of the cost increase is from the carbon liability, while the operating cost change remains relatively marginal even with a USD 40/t CO2 carbon price.
One option is to focus on effectively recycling and relocating the revenue from the carbon pricing to help limit the cost impact on consumers and to provide a revenue stream for clean energy deployment in the long term. Design features such as restructuring the current tax components on electricity and adapting the allocation scheme could also be considered.
Considering Thailand's power sector structure, another potential policy option would be for the Electricity Generating Authority of Thailand (EGAT) to apply an implicit shadow carbon price for dispatch decisions in parallel with an explicit carbon price set at a limited level. A shadow carbon price is a hypothetical cost used during the planning process that helps businesses internalise the cost of carbon when making investment and operational decisions without actually paying for the carbon cost liability. Introducing a shadow carbon price could help reduce
3 The total power sector operating cost includes fuel and variable O&M costs such as the ramping cost, and start-up and shutdown costs.

The Potential Role of Carbon Pricing in Thailand's Power Sector Executive summary
PAGE | 11
the potential economic impact of a sudden high carbon pricing liability and give businesses time to transition to and better prepare for a clean energy transition. A significant disadvantage of the shadow carbon price, however, is that it cannot generate additional revenue for the government with which to address climate-related issues.
Policy insights Thailand has already had diverse experience with carbon pricing mechanisms from many pilot and voluntary programmes. Carbon pricing can help internalise the cost of CO2 emissions. It can also leverage market forces to optimise decision making and thereby help mitigate the overall cost impacts for society and contribute to the sustainable development of Thailand’s emitting sectors. While carbon pricing in the power sector could deliver considerable emission reductions from the country's largest emitting sector, in order to ensure its effectiveness and mitigate the associated costs and distributional impacts, its design needs to take into account the power system's specific features.
Thailand's power sector has the following key characteristics that are relevant to carbon pricing design:
• a regulated, enhanced single buyer model with limited competition
• the dominance of natural gas, a considerable share of which must be imported, giving rise to energy security concerns
• a flexible grid with the technical capability to support renewable integration
• a high reserve margin indicating potential over-capacity.
Considering the specificities of Thailand's power system and that no single policy measure will be sufficient to meet the sustainability goals, the following policy elements would be necessary when introducing a coherent carbon pricing package.
• Setting a carbon price at a sufficient level to shift generation away from coal and encourage investment in renewable energy could help accelerate power sector decarbonisation in Thailand.
• Designing the carbon pricing mechanism with new measures that address the cost concerns for electricity consumers and the social-economic impacts, particularly to vulnerable groups.
• Introduce more flexibility in electricity pricing, contracting and services. Additional flexibility measures can significantly reduce system operating costs,

The Potential Role of Carbon Pricing in Thailand's Power Sector Executive summary
PAGE | 12
mitigating some of the cost impacts of implementing a carbon price and providing needed system support for VRE adoption and integration.
• Effectively use carbon revenues to accelerate a clean energy transition and reduce the impact on the economy of carbon pricing. Carbon revenues could be redistributed back to consumers in personal and corporate tax cuts, especially for low-income households or small businesses. They could also fund technology development and mitigation measures to lower the long-term clean energy transition costs. Mechanisms to transfer the revenues from the carbon pricing to the population would also allow faster and less politically challenging carbon pricing scheme implementation.
• Introduce a shadow carbon price in the power plant dispatch rules to complement a lower explicit carbon price to mitigate concerns over high carbon cost liability for the power sector. A shadow carbon price in dispatch decisions could help optimise the generation profiles by accounting for the emissions intensity of different generation sources without actually paying for the cost of carbon. A gradual transition from a shadow to an explicit carbon price could help manage total power system operating costs.
• Designing the carbon pricing mechanism alongside changes to power system planning, operation and regulation to improve the effectiveness of carbon pricing instruments and assist in a clean energy transition.
• Value the electricity generation provided by dispatchable fossil fuel plants for flexibility and ancillary services. With a moderate carbon price signal, existing coal-fired power plants would see their running hours decrease sharply. Ancillary services could guarantee system reliability while reducing emissions by running fewer coal power plants. This could also encourage retrofitting and economical coal phase-out strategies.
• The government could consider elevating aspirations in the PDP to help shape investment. The PDP acts as a roadmap for future power sector development, sending a strong political and policy signal. Including a shadow carbon price in the next PDP revision process could help accelerate Thailand's overall renewable energy ambitions and cost-effectively prepare for VRE energy adoption. An integrated planning process that considers supply and demand, transmission and distribution, VRE location and generation patterns, and investment would maintain system reliability with an adequate expansion of VRE and gas-fired power capacity.

The Potential Role of Carbon Pricing in Thailand's Power Sector Chapter 1. Background
PAGE | 13
Chapter 1. Background
Carbon pricing in the power sector Governments around the world are implementing policy packages designed to decarbonise the power sector as part of a broader effort to achieve clean energy transitions. There is no silver bullet policy that allows for full and effective decarbonisation in any given situation, as each jurisdiction's particular policy mix depends not only on national policy objectives and constraints, but also local power market structures.
Examples of policies being implemented by governments in the power sector include fuel taxes, energy efficiency and renewable support measures as well as ancillary services, system flexibility and storage. An increasing number of countries and jurisdictions are also introducing carbon pricing instruments as a means to limit and reduce emissions (World Bank, 2020).
Carbon pricing instruments comprise carbon taxes, emissions trading systems (ETS) or hybrids of these two. With carbon taxes, the price of emissions is fixed, but not the quantity. With emissions trading systems, the quantity of emissions is fixed, but not the price. Other types of hybrid and intensity-based systems can combine quantity and/or price certainty in different ways. Distribution of emissions allowances under a trading system can also be done freely or through auctions, or a mix of both, while carbon tax systems can also provide for tax exemptions of various levels and coverage (IEA, 2020a).
By the end of 2020, 64 carbon pricing instruments were at various stages of implementation, of which 33 were carbon taxes and 31 were emissions trading systems (World Bank, 2020). These are implemented at different jurisdictional levels, from supranational (e.g. the EU Emissions Trading System) and national/federal (e.g. Sweden’s carbon tax) to subnational (e.g. California’s Cap-and-Trade Program). In the ASEAN region, there is increased interest in carbon pricing. Singapore launched its carbon tax in 2019, and Thailand, Indonesia, Viet Nam, Brunei and many others have started exploring carbon pricing as an option for addressing climate change issues.
In addition to carbon tax and emissions trading systems, some corporations have adopted internal carbon pricing as a strategy to manage the business risks associated with climate change or the policy risks associated with future tightening

The Potential Role of Carbon Pricing in Thailand's Power Sector Chapter 1. Background
PAGE | 14
of climate policies. Internal carbon pricing can be mainly in the form of a shadow carbon price used in planning or an internal carbon fee (I4CE, 2016).
The power sector is included in the overwhelming majority of carbon pricing instruments. This widespread uptake can be due to the power sector’s almost unique composition of characteristics, including the generally high emissions from the sector in most countries, the commercial availability of low-carbon power technology solutions and the availability of historical data on emissions. This composition makes it easier to apply a carbon tax or establish sectoral emission caps or benchmark levels.
In the power sector, carbon pricing introduces a price signal for the cost of carbon emissions that has two main impacts from the supply side. First, it impacts the merit order of electricity dispatch, which can lead to a shift from high- to lower-carbon generation sources. Second, it provides a signal for investment decisions.
Given historical energy competitiveness or affordability concerns, power markets are regulated to various degrees in ways that can impact the desired effect of carbon pricing (IEA, 2020a). The degree and form of carbon pricing effects will vary in different market contexts; for example, the effects on dispatch will be strongest where there is economic dispatch and liquid wholesale markets. In the United Kingdom, the introduction of a carbon price floor in addition to the EU emissions trading systems allowance price has substantially contributed to the reduction of the share of coal-fired power generation from 39% in 2012 to only 5% in 2018 (ICAP, 2020). However, in regulated wholesale markets, the carbon price may not be reflected in the merit-order rules. This limits the shift to low-carbon generation. In highly regulated retail markets, there is a risk that the carbon price cannot be passed on to provide a signal to consumers. Both are the case, for instance, in the Korean ETS and Chinese Pilot ETS, where the carbon price does not affect the dispatch order, and is not passed through to consumers as prices are regulated. To address this issue, Korea’s and China's Pilot have responded by expanding the coverage of both direct and indirect emissions from the electricity sector in its emissions trading systems, providing a clearer price signal on the demand side as well. If a carbon price is implemented alongside fossil fuel subsidies, the carbon price signal is reduced and this mix could delay the shift in investments towards low-carbon generation sources. South Africa and Tunisia both implemented a carbon tax in their regulated electricity markets, and are exploring alternative ways to leverage carbon pricing and reduce emissions, such as using performance benchmarks to incentivise efficiency improvements, or carbon tax revenues for clean energy investment.

The Potential Role of Carbon Pricing in Thailand's Power Sector Chapter 1. Background
PAGE | 15
On the demand side, a higher electricity price should incentivise consumers, particularly commercial and industrial consumers, to reduce their consumption through energy efficiency measures. However, raising consumer electricity prices or placing additional costs on power plant operations to reflect the carbon price can be politically challenging. Especially in the current economic slowdown caused by Covid-19, maintaining the affordability of electricity has become ever more essential. Finding a balance between reducing emissions and ensuring both electricity security and affordability is a common challenge for policy makers. Fortunately, innovative solutions are becoming increasingly available. For instance, California's Cap-and-Trade Program introduced a way to manage this challenge by building a revenue stream through an emissions permits auctioning mechanism that is used to compensate electricity consumers for price increases.
As systems mature, improved data and changes in business practices in turn lead to adjustments in carbon pricing systems. In the European Union, Californian and Korean systems, allowances for the power sector have moved towards greater shares of auctioning, rather than being mostly freely allocated. The reasons for this include reducing "windfall profits", providing stronger mitigation incentives and using auctioning revenue to meet environmental and social objectives (C2ES, 2020; Dechezleprêtre, Nachtigall and Venmans, 2018; European Union, 2015).
Thailand's climate policies Thailand falls within the category of countries that are highly vulnerable to the adverse impacts of climate change (Eckstein, Hutfils and Winges, 2018). As such, the government makes taking collective responsibility for addressing climate change a high priority. In order to promote and support activities covering all policy dimensions and economic sectors (ONEP, 2020a), it has established multi-level strategies and policies related to GHG emission reductions at both the national and ministry levels, and is now planning to legislate its first Climate Change Act.
Thailand's GHG emissions in 2018 were around 420 Mt CO2e, equivalent to 0.85% of global emissions (ClimateWatch, 2020). According to the government’s Third Biennial update report to the UNFCCC, the energy sector is the largest contributor. Its emissions have increased steadily since 1990 driven by power and transport, reaching 254 Mt CO2 (ONEP, 2020b) in 2006 and accounting for 71% of the country’s total emissions. Within the energy sector, electricity and heat production in 2016 were the main sources of emissions, amounting to a combined 97 Mt CO2
or 38% of the total CO2 emissions from the energy sector (compared to the transport and industrial sectors’ 25% and 19%, respectively (ONEP, 2020b).

The Potential Role of Carbon Pricing in Thailand's Power Sector Chapter 1. Background
PAGE | 16
Therefore, much of the government’s climate change mitigation action is focused on reducing the power sector’s emissions.
Climate considerations have been incorporated into Thailand’s national economic and social development plans since 2007 (ONEP, 2020a). At present, the country has over 30 national and regional policies which address energy and climate change issues. These span the different levels of government, including the highest political level of the National Strategy (2018-2037) to the Climate Change Master Plan (2015-2050). The "Integrated Energy Blueprint" is the principal energy-related policy aimed at reducing GHG emissions. A “Long-Term Low Greenhouse Gas Emission Development Strategy (LT-LEDS)” is currently being prepared.
The governance of climate and energy-related policies in Thailand is relatively complex, with 25 public bodies responsible for drafting, implementing and enforcing these policies. The Office of Natural Resources and Environmental Policy and Planning (ONEP) is responsible for allocating the various tasks relating to climate change mitigation work to various agencies, including the Ministry of Industry, Ministry of Natural Resources and Environment, Ministry of Transport and Ministry of Energy. Energy-related policies are mainly under the responsibility of the Ministry of Energy and the National Energy Policy Council.

The Potential Role of Carbon Pricing in Thailand's Power Sector Chapter 1. Background
PAGE | 17
IEA. All rights reserved.
Note: Due to the development plan context, the NDC Roadmap 2021-2030 is based on the PDP, EEP and AEDP (2015 version). However, in this study, the authors applied the PDP2018 Rev1 for the most up-to-date results
Thailand's mitigation actions: from nationally appropriate mitigation actions (NAMA) to its nationally determined contribution (NDC)
NAMA is the first voluntary attempt from the energy and transport sectors to address climate issues
Thailand has undertaken strong commitments and greenhouse gas mitigation actions. It submitted its nationally appropriate mitigation actions (NAMA) in 2014, pledging to reduce its GHG emissions in the energy and transport sectors by 7% below the business-as-usual level or 20% with international support by 2020 (MoNRE, 2014).

The Potential Role of Carbon Pricing in Thailand's Power Sector Chapter 1. Background
PAGE | 18
In 2018, Thailand's measures under NAMA achieved a reduction of 57.8 Mt CO2 equivalent 1 (or 15.7% below the 2020 business-as-usual level), already surpassing its original 7% target (ONEP, 2020b). The power sector accounted for a 23 Mt CO2 emissions reduction from the business-as-usual level mainly through the deployment of renewable forms of energy as well as energy efficiency measures.
Economy-wide transition from NAMA to NDC On 1 October 2015, Thailand submitted its first Nationally Determined Contribution (NDC) to the United Nations Framework Convention on Climate Change (UNFCCC) (ONEP, 2015). The mitigation component included a commitment to reduce the country’s GHG emissions by 20% from the projected business-as-usual level by 2030. A conditional component of the NDC indicated the possibility of increasing the target to 25%, subject to receiving an adequate level of international technical, financial and capacity building support. In its first NDC, Thailand also recognised the important role of carbon market mechanisms to ensure the cost-effectiveness of mitigation actions, and signalled its openness to explore voluntary co-operative approaches.
On 20th October 2020, Thailand submitted its updated NDC (ONEP, 2020a). In this revised version, the country reaffirmed its commitment to meet by 2030 the mitigation goals fixed in 2015. It also provided additional information to enhance clarity, transparency and understanding. For example, it gave a more detailed explanation of the metrics used in its methodological approach, and the specification of the GHG inventory methodology used to calculate emissions. The updated submission also refers to the development of a LT-LEDS, which will be used as a strategic guide and serve as the basis for enhancing any subsequent NDCs. Thailand also reaffirmed its views on the role of market-based mechanisms to help drive emissions down in a cost-effective manner.
1 All emissions reductions from Thailand’s NAMA in the energy and transport sectors are relative compared to the business-as-usual level by 2020. This business-as-usual level was based on several national plans including PDP 2010.

The Potential Role of Carbon Pricing in Thailand's Power Sector Chapter 1. Background
PAGE | 19
IEA. All rights reserved.
Source: Thailand's Nationally Determined Contribution Roadmap on Mitigation 2021-2030 (ONEP, 2017).
The updated NDC also specifies the policies through which Thailand intends to implement its mitigation target. For the energy sector, the Power Development Plan (PDP), Alternative Energy Development Plan (AEDP), Energy Efficiency Plan (EEP) and the Environmental Sustainable Transport System Plan are listed as key planning tools to reduce emissions. The policies pertaining to the power sector also prioritise the need to maintain an efficient, secure and reliable supply of electricity. This translates into a medium-term focus on gradually reducing the role of coal in the power mix while increasing the role of natural gas and renewable forms of energy, though Thailand recognises that support for the development of renewables is key for long-term emissions reduction. This is well reflected in the revised 2018 PDP, which outlines the country's strategy to improve the power system’s reliability by reducing dependence on coal, increasing the share of gas and decreasing the share of imported hydropower in favour of increasing the shares of non-hydropower renewables.
Development of carbon pricing instruments in Thailand from CDM to domestic schemes
Thailand has focused on carbon pricing since the Kyoto Protocol was put into effect in 2005. The Clean Development Mechanism (CDM) was among the first steps towards carbon pricing in Thailand as one of the international offsetting mechanisms under the Kyoto Protocol to support developed countries in Annex I of the UNFCCC achieve their GHG emissions reduction targets.
Industry, 43
Transport, 41
Power generation, 24
Buildings and Households, 5
0
20
40
60
80
100
120
Reduction Potential in Energy Sector
MtC
O2
Waste1.7%
IPPU0.5%
Energy Sector97.8%

The Potential Role of Carbon Pricing in Thailand's Power Sector Chapter 1. Background
PAGE | 20
The Thailand Greenhouse Gas Management Organization (TGO), established in 2007 mainly for participating in the CDM, is an autonomous governmental organisation tasked with reducing GHG emissions, reviewing CDM projects for approval, and performing its role as the Designated National Authority for the CDM in Thailand. CDM-project development in Thailand must function in accordance with the TGO guidelines, as well as with its sustainable-development criteria (TGO, 2021).
In October 2013, the TGO launched a domestic carbon reduction scheme, the Thailand Voluntary Emission Reduction Scheme (T-VER) and the Thailand Carbon Offsetting Program (T-COP). Conceptually similar to the CDM, but with lower upfront and operating costs, T-VER uses a results-based payment mechanism and voluntary cancellation of emission reductions, creating a domestic carbon credit market in Thailand. There are six types of T-VER: renewable energy, energy efficiency, waste management, transport management, forest projects, agricultural projects and other projects. There are three categories by size: microscale, small scale and large scale. Until now, most of the registered T-VER projects have been renewable energy power generation, energy efficiency and waste projects, though some forestry projects were registered from both the public and private sectors. As of October 2020, the total emissions reduction from the overall scheme was 5.8 Mt CO2-eq from 153 registered projects.
Another significant carbon pricing programme is the Thailand Voluntary Emissions Trading Scheme (Thailand V-ETS). It was first conceptualised in 2013 and the first pilot project was launched in 2015, with a cap-and-trade system for CO2 emissions with free allowance allocation. The first phase (2015-2017) was aimed at testing the measurement, reporting and verification (MRV) system of four industrial sectors: cement, pulp and paper, iron and steel, and petrochemicals. It also involved setting caps for facilities' Scope 1 and 2 emissions, and allocating allowances for covered facilities. The second pilot phase (2018-2020) tested the MRV and the registry and trading platform for an additional five industrial sectors: petroleum refining, glass, plastic, food and feed, and ceramics. Another four-sectors (textile, beverage, sugar and flat glass) participated in 2019.
The formulation of emissions trading systems legislation was also examined for consideration at the policy level under the World Bank's Partnership for Market Readiness (PMR) Program, the initial aim of which was to establish the data reporting and verification system for target facilities. This was done in parallel with Thailand's first Climate Change Act which is planned to be passed in 2021.

The Potential Role of Carbon Pricing in Thailand's Power Sector Chapter 1. Background
PAGE | 21
Thailand thus has good experience with carbon pricing initiatives which form a sound basis for greenhouse gas mitigation action. However, there are some critical challenges and gaps that have had to be addressed, such as a lack of capacity and knowledge by covered entities in the Thailand Voluntary Emission Trading Scheme. To remedy this situation, an assessment of technology needs was undertaken, emissions trading system workshops and training sessions were held and a review of several case studies was made before initiating the carbon pricing pilot programme. These steps greatly enhanced mutual understanding and acceptance of emissions trading systems and other carbon pricing schemes proposed by relevant stakeholders in Thailand.
The power generation sector remains an important player in the T-VER projects. Some77% of the issued carbon credits have been from the renewable energy sector and from waste management for green power generation. The power generation sector may continue to play an important role in any future “project-based” mitigation mechanisms.
The sector's involvement in V-ETS is quite different. The power sector did participate in the first year of the pilot V-ETS, but then left the programme. The V-ETS faced challenges setting up plant-based baselines and caps for fossil fuel power plants due to disclosure issues. The operators expressed concerns over their limited flexibility to respond to economic signals from the carbon price due to the regulated nature of the power sector. Nevertheless, as Thailand's largest CO2 emitter (IEA, 2020), the power sector is particularly important to include in future carbon pricing programmes.
Even on a voluntary basis, the baseline- and target-setting of each power plant unit remains a major issue. It is imperative that the relationships between the heat rate, power purchasing agreements (PPA), availability payments, reliability indicators and MRV guidelines be considered. One of the biggest challenges is physical PPAs with guaranteed must-take conditions. The sharing of knowledge and experience among the relevant stakeholders is crucial to learning what kind of policy would lead to effective mitigation outcomes within the Thai context. Past experience should therefore be kept in mind when building on current explicit carbon pricing initiatives. Thailand might consider mandatory carbon pricing schemes as part of the upcoming Climate Change Act.

The Potential Role of Carbon Pricing in Thailand's Power Sector Chapter 1. Background
PAGE | 22
IEA. All rights reserved.
Thailand power sector overview Electricity was first introduced in Bangkok in 1884. By 2016, the entire population had access to electricity (World Bank, 2020). Today the Thai power industry’s priority is the provision of reliable electricity with higher efficiency, with the ultimate goal of achieving sustainable energy development. Technological improvements alongside national energy policies and strategies that enable the power sector to adapt and evolve will be essential to adequately address the environmental and climate challenges.
The Potential Role of Carbon Pricing in Thailand's Power Sector Chapter 1. Background
PAGE | 23
Thailand's power sector – current status
The operation and regulation of Thailand’s power sector Thailand’s power structure follows the Enhanced Single Buyer Model, which authorises the state-owned Electricity Generating Authority of Thailand (EGAT) to be the largest supplier of electricity and the sole buyer of it. EGAT is responsible for generating, transmitting and wholesaling electricity to extensive facilities. It also serves as the Transmission System Operator, which controls the dispatch of power plants, oversees the balance of supply and demand in the system and connects generation with its transmission lines and substations. EGAT is responsible for the construction of all transmission networks. Though the Energy Industry Act (ERC, 2011) allows other applicants to obtain an electricity transmission licence, to this date, only EGAT has received one. Besides EGAT, two retail distributors are responsible for distributing and providing low-voltage electricity to end-users: the Metropolitan Electricity Authority (MEA) and the Provincial Electricity Authority (PEA).
The Ministry of Energy's Energy Policy and Planning Office (EPPO), is responsible for national energy policies and plans, including the development of the PDP which is the long-term national plan for the industry. Approved in October 2020, the current PDP2018 projects power industry development until 2037. The next PDP and AEDP updates, both approved by the National Energy Policy Council, are planned for 2022. The National Energy Policy Council also approves other energy-related plans such as the Draft Energy Efficiency Plan (EEP 2018) and the Draft Gas Plan.
The Potential Role of Carbon Pricing in Thailand's Power Sector Chapter 1. Background
PAGE | 24
IEA. All rights reserved.
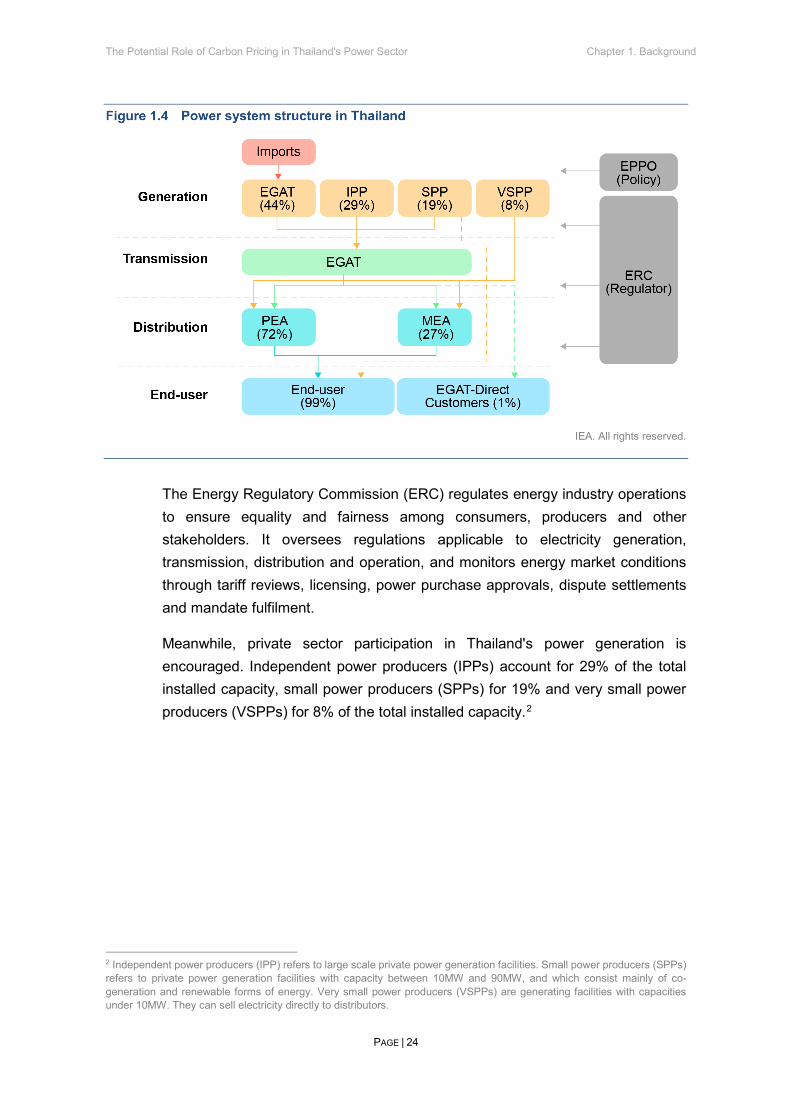
The Energy Regulatory Commission (ERC) regulates energy industry operations to ensure equality and fairness among consumers, producers and other stakeholders. It oversees regulations applicable to electricity generation, transmission, distribution and operation, and monitors energy market conditions through tariff reviews, licensing, power purchase approvals, dispute settlements and mandate fulfilment.
Meanwhile, private sector participation in Thailand's power generation is encouraged. Independent power producers (IPPs) account for 29% of the total installed capacity, small power producers (SPPs) for 19% and very small power producers (VSPPs) for 8% of the total installed capacity.2
2 Independent power producers (IPP) refers to large scale private power generation facilities. Small power producers (SPPs) refers to private power generation facilities with capacity between 10MW and 90MW, and which consist mainly of co-generation and renewable forms of energy. Very small power producers (VSPPs) are generating facilities with capacities under 10MW. They can sell electricity directly to distributors.

The Potential Role of Carbon Pricing in Thailand's Power Sector Chapter 1. Background
PAGE | 25
IEA. All rights reserved.
Source: (EPPO, 2020a).
Thai power sector: Generation and emissions As of August 2020, Thailand’s total installed capacity was 49,597 MW with a 30,342 MW peak. Natural gas was the main source of energy at 56%, followed by coal at 18%. Generation from renewable energy accounted for 13% of total generation, making Thailand a VRE leader in ASEAN (EPPO, 2020a). Imports, including imported hydropower, represented 13% of the generation.
In the foreseeable future, natural gas will continue to be the dominant fuel in Thailand's power sector. Much of it, including LNG, is imported. The continued reliance on natural gas in power generation may exacerbate the country's dependency on imported energy in the long run.
According to the PDP2018, the total power generation from natural gas will increase from 120 707 GWh in 2020 to 189 433 GWh in 2030, and to 196 216 GWh in 2037. The share of electricity from natural gas is to decrease from 62.5% in 2030 to 53.4% in 2037 due to the rise of renewable forms of energy, mainly solar and bioenergy.
The power sector is the country's largest GHG emitter, responsible for an estimated 96.3 Mt CO2 equivalent of emissions. The carbon intensity of generated electricity, expressed in CO2 per unit of electricity generated, was 0.439 kg CO2 per kWh in 2019, 26% below 2000 levels (EPPO, 2020a). This drop was driven by a rapid shift towards gas and renewables and a corresponding decrease in the share of coal.
0
10
20
30
40
50
2016 2017 2018 2019 2020
Inst
alle
d C
apac
ity (G
W)
EGAT IPPs SPPs Imports VSPPs
Installed Capacity Jan-Aug 2020

The Potential Role of Carbon Pricing in Thailand's Power Sector Chapter 1. Background
PAGE | 26
IEA. All rights reserved.
Source: (EPPO, 2020a).
Like everywhere else, Thailand's power sector is undergoing long-term technical, economic and market transformations under disruptive technologies. A major challenge for Thailand's power system is to integrate high shares of VRE, particularly wind and solar. Key to this is the concept of flexibility, which refers to balancing VRE sources with dispatchable fossil fuel power generation while keeping the power supply stable (Martinot, 2016). Hence, Thailand needs to consider how to incorporate "more flexibility" into the power system. On the supply side, flexibility comes from changing operation or flexibility innovations in coal and gas power plants, energy storage and renewables along with flexible transmission and distribution networks, grid operations and market designs. On the demand side, demand response and electric vehicles can contribute to increased flexibility. The challenges for Thailand relate to technology, economics, policy and planning with reliable operations. In all of these aspects, the country would benefit from further understanding and learning from other countries’ experiences (IEA, n.d.).
Generation dispatch in Thailand is based on the merit-order dispatch subject to operational and contractual constraints. The operational constraints are based on the operational characteristics of the dispatchable power plants and the condition of the power system. The contractual constraints are related to the Power Purchase Agreement (PPA) with private producers and fuel purchase contracts with the fuel suppliers (IEA, 2018). These contractual constraints are the main barriers to greater fossil fuel plant operational flexibility, and would also limit the carbon price signal incentive to switch generation to less carbon intensive sources.
0
50
100
150
200
250
2013 2014 2015 2016 2017 2018 2019
Gen
erat
ion
(TW
h)
Natural gas Coal Oil Domestic Hydropower Import Other Renewable
Generation Jan-Aug 2020

The Potential Role of Carbon Pricing in Thailand's Power Sector Chapter 1. Background
PAGE | 27
The tariff structure in Thailand Thailand’s electricity tariff structure was set up under the following six principles. It (i) must reflect true costs, (ii) must have separation between fixed investment and variable costs, (iii) must anticipate future costs, (iv) must include a reconciliation mechanism, (v) must incorporate policy costs such as a feed-in-tariff for renewable energy or free electricity to low-income households, and (vi) the tariffs must be uniform across the country.
Hence, the retail tariff rates are designed to collect two broad components of power system costs:
• Base cost component or "Base Tariff which is updated based on planned investments, every two to five years.
• Automatic tariff adjustment component which balances the gap between EGAT's fuel and power purchase price and the level of the base tariff, and is updated approximately every four months.
The base cost component comprises fixed costs associated with generation, transmission and distribution, as well as an estimate of expected variable costs for the rate period. The variable automatic tariff adjustment component includes deviations in fuel costs from the ex-ante estimate in the Base Tariff; purchases from IPPs, SPPs and VSPPs; and specific policy expenses, as mentioned in principle (v) above. Specific policy expenses encompass costs for the PDP, a cross-subsidy mechanism between utilities primarily aimed at redistributing income from EGAT and MEA to PEA. This cross-subsidy occurs because Thailand has a uniform retail tariff policy, meaning that retail tariffs remain equal across the country for a given customer class (i.e. MEA and PEA tariffs are equal).
Thai utility revenues are determined by rate-of-return regulation, which is reflected in the base component of the tariff. This part includes EGAT's total costs for generation and transmission, MEA and PEA's distribution and retail expansion cost, as well as operations and maintenance (O&M) costs, and return on invested capital (ROIC) of the three network owning entities. In the case of the power industry, the breakdown of the cost components within the retail tariff consists of around 80% from power generation, 5% from transmission, 13% from distribution and only 2% from the retail margin (IEA, 2018). The carbon price effect on the cost of power generation would thus be reflected in the retail tariff.

The Potential Role of Carbon Pricing in Thailand's Power Sector Chapter 1. Background
PAGE | 28
Thailand's power sector – future development
Thai power sector development plans The EPPO has been developing long-term master plans (PDPs) for the power sector since 1992. Over the past 28 years there have been 19 PDPs, each reflecting the power industry in a specific period.
In the current PDP2018 (Revision 1) (EPPO, 2020b), the major principles focus on energy security and economy and ecology which include (1) coping with the increasing power demand in line with the National Economic and Social Development Plan and taking into account fuel diversification; (2) maintaining an appropriate cost of power generation for long-term economic competitiveness; and (3) reducing the carbon dioxide footprint of power generation and focusing on renewable energy sources.
The current PDP2018 (Revision 1) demand projection assumptions for Thailand are based on the growth of two main factors: GDP and population. Growth assumptions are taken from the National Economic and Social Development Council with 3.8% for the annual average growth rate of GDP and 0.02% for the Thai population from 2017 to 2037. The urbanisation rate and electricity demand from the major industrial sectors are also considered in the demand projection. Demand is forecasted by using an end-use and econometric model from which the capacity expansion plan is generated. The PDP is regularly adjusted based on historical data, following frequent monitoring.
The PDP aims to diversify the current fuel mix of power generation from coal and natural gas to various forms of renewable energy in order to improve energy security and reduce dependence on fuel imports in the future. The highlights of PDP2018 include new load demand assumptions, promotion of least cost electricity generation for greater benefit to the people, regional level planning, and consideration of independent power supplies, smart grids, grid flexibility for VRE and community-based power plants, and introduction of the demand response. However, the PDP does not take externality costs into account. While the current Covid-19 pandemic has impacted demand profiles and may have both short and long-term economic impacts, these were not considered in the PDP 2018 revision, and will likely need to be accommodated in future PDP revisions.
It should be noted here that there are no changes between PDP2018 and PDP2018 (Revision 1) for the MW (peak) and electricity demand. Only expansion of generation capacity and the mix of different technologies were changed. However, when compared with PDP2015 (covering 2015-2036), there are some

The Potential Role of Carbon Pricing in Thailand's Power Sector Chapter 1. Background
PAGE | 29
significant changes from 2018 to 2027 due to the adjusted load demand and the expanded renewable generation capacity.
Thailand’s Alternative Energy Development Plan (AEDP2018) (DEDE, 2020) covers three main renewable energy components: RE for power generation, RE for heat generation and biofuels with the target of 30% of renewable energy in final energy consumption by 2037. The electricity demand forecast from the PDP was also used to set the target for the AEDP. The differences in renewable targets between the AEDP2015 (DEDE, 2015) and PDP2018 (Revision 1) in both installed capacity and electricity generation are shown in Table “Future renewable generation in AEDP2015 and AEDP2018”.
The AEDP states a target for installed capacity of renewable energy at around 30 GW by 2037, up from 12 GW in August 2020, representing almost a threefold increase in two decades, as shown in Table “Future renewable generation in AEDP2015 and AEDP2018”. The 2037 target is driven mainly from solar and biomass energy with a much higher biogas target. Floating solar PV installations, planned for lakes and the water surfaces of the big dams, present a new opportunity for modernising renewable energy systems in Thailand.

The Potential Role of Carbon Pricing in Thailand's Power Sector Chapter 1. Background
PAGE | 30
Future renewable generation in AEDP2015 and AEDP2018
Fuel type
Renewable energy capacity targets (MW)
AEDP2015 AEDP2018
(1) 2036
AEDP2015 Target
(2) Contract
(3) 2037
PDP2018 target
(4) Total
1. Solar
6 000
2 849
9 290
12 139
2. Solar floating
-
-
2 725
2 725
3. Biomass
5 570
2 290
3 500
5 790
4. Wind
3 002
1 504
1 485
2 989
5. Biogas
1 280
382
1 183
1 565
6. Municipal waste
500
500
400
900
7. Industrial waste
50
31
44
75
8. Small hydro
376
239
69
308
9. Large hydro
2 906
2 920
-
2 920
Total installed capacity (MW)
19 684
10 715
18 696
29 411
Electricity from renewable energy per capacity (%)
20.11
10.04
21.14
34.23
Electricity from renewable energy per final energy consumption (%)
4.27
2.13
3.55
5.75
Source: Thailand's Alternative Energy Development Plan 2018-2037 (AEDP2018).
Thai capacity expansion is strongly guided by the PDP, which directly influences the future generation mix. The development of the Thai power sector in terms of capacity and generation is thus dependant on the methodology used to formulate the PDP, which indirectly impacts the tariff rate and reserve margin. The tariff rate is updated every four-months. This has been done on the same basis for many years, mainly in response to factors such as exchange rate, fuel price and renewable energy expansion. Overall, incorporating the externality costs associated with the environmental and climate impacts of power generation (e.g. social cost of carbon) into the total cost of independent generation could support faster power decarbonisation, while ensuring electricity security and affordability.

The Potential Role of Carbon Pricing in Thailand's Power Sector Chapter 1. Background
PAGE | 31
Reflecting the carbon cost in the power system raises the challenge of controlling the effects on electricity prices in terms of financial management and carbon revenue recycling, but could encourage and support investment in low carbon technology, and the phase-down of existing inefficient coal-fired power plants. The potential implications for carbon pricing effectiveness are analysed below in terms of the impacts on generation, emissions, cost and future investment.

The Potential Role of Carbon Pricing in Thailand's Power Sector Chapter 2. Modelling Methodology
PAGE | 32
Chapter 2. Modelling Methodology
Approach and assumptions This report's analysis relies on modelling performed using the PLEXOS© Integrated Energy Model, an industry-standard power system modelling tool that enables detailed production cost modelling. The model allows for the simulation of the optimal operation of Thailand's power system in 2030 to evaluate both the impact of carbon pricing on the power system mix, emissions and costs, and its interactions with various levels of system flexibility and renewables integration.
A temporal resolution of 30 minutes is used for forecasted demand profiles, the techno-economic characteristics of power plants (including imports), hydropower energy constraints, transmission lines and VRE generation profiles.
Data inputs on demand profiles, generation capacity, plant operating patterns and costs, and transmission capacity are mainly based on EGAT data and the 2018 PDP, except for future wind and solar PV generation profiles that are modelled based on the Thailand Renewable Grid Integration Assessment (IEA, 2018), and adjustments for certain plant technology operation parameters using international data. The load profile in 2030 is modelled based on the 2017 profile.

The Potential Role of Carbon Pricing in Thailand's Power Sector Chapter 2. Modelling Methodology
PAGE | 33
Table 2.1 Thailand's power system modelling setup
Generator Transmission network Demand
• Key operating parameters are ramp rates, minimumstable level (MSL), contracted generation capacity,average heat rates, minimum up/down times
• EGAT and IPP power plants are dispatchable subject togenerator, fuel and system constraints
• Non/semi-dispatchable power plants (SPPs, VSPPs) aremodelled as fixed dispatch based on historical operatingpatterns
• Gas supply sources for power plants are categorisedbased on gas obligation. LNG is assumed for futurepower plants. Gas constraints based on the DailyContracted Quantity (DCQ)
• Hydro energy constraints are based on monthlyrequirements (2019 data)
• Wind & solar time series for representative locations forthe future scenarios, are modelled based on the ThailandRenewable Grid Integration Assessment study. DPVlocations are based on the largest population centers
• 7 node (region)representation of thesystem according toEGAT's operationalprocedures: CentralEast (CAC-E),Central North(CAC-N), CentralWest (CAC-W),Metropolitan (MAC),Northern (NAC),North-Eastern(NEC) and Southern(SAC)
• Transmission flowlimits for 115V,230V and 500kVregionalinterconnections
• 30-minute demandprofiles areprojected for 2030based on 2017profiles
• Future demandprofiles are subjectto the projectedregional peakdemand and energyin the PDP
Source: IEA (forthcoming), Thailand Power System Flexibility Study.
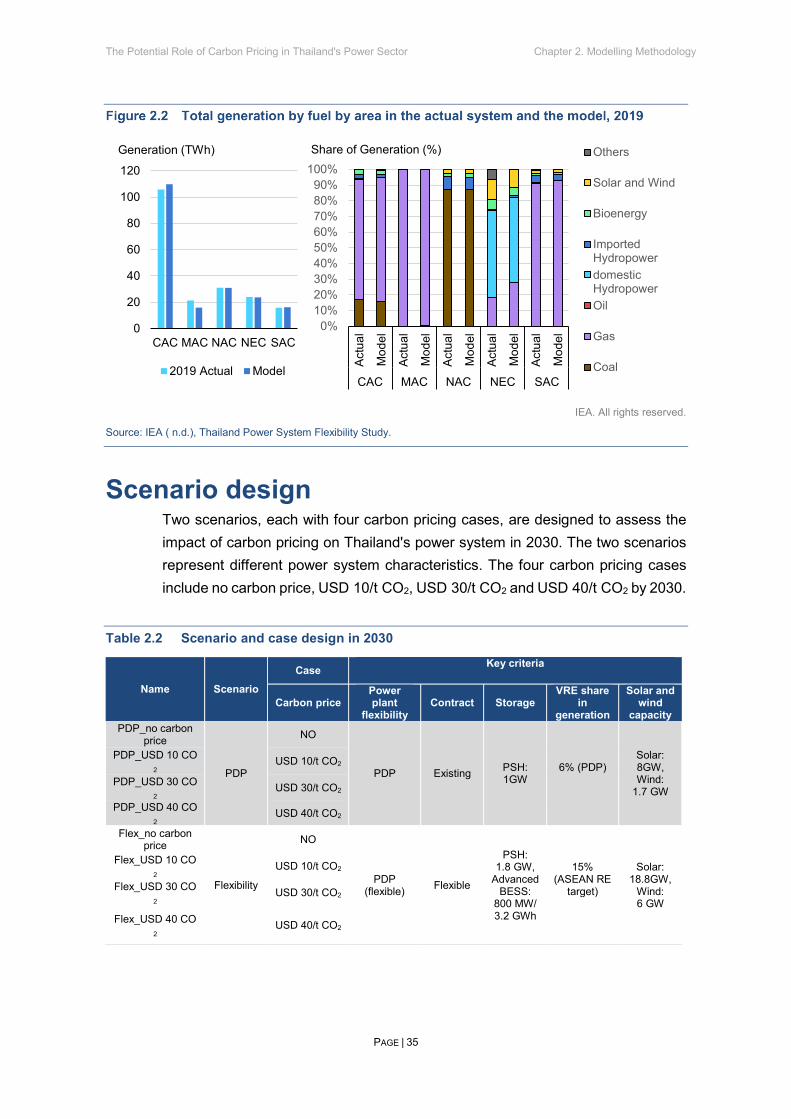
The production cost modelling calibration was validated against actual operation statistics from Thailand's power system in 2019 (IEA, n.d.). Thailand's power system is represented in seven control areas according to EGAT's operational procedures that have been grouped into five areas for this analysis: Central Area (CAC) which includes Central East, Central North and Central West, Metropolitan Area (MAC), Northern Area (NAC), North-Eastern area (NEC) and Southern Area (SAC).
The Potential Role of Carbon Pricing in Thailand's Power Sector Chapter 2. Modelling Methodology
PAGE | 34
IEA. All rights reserved
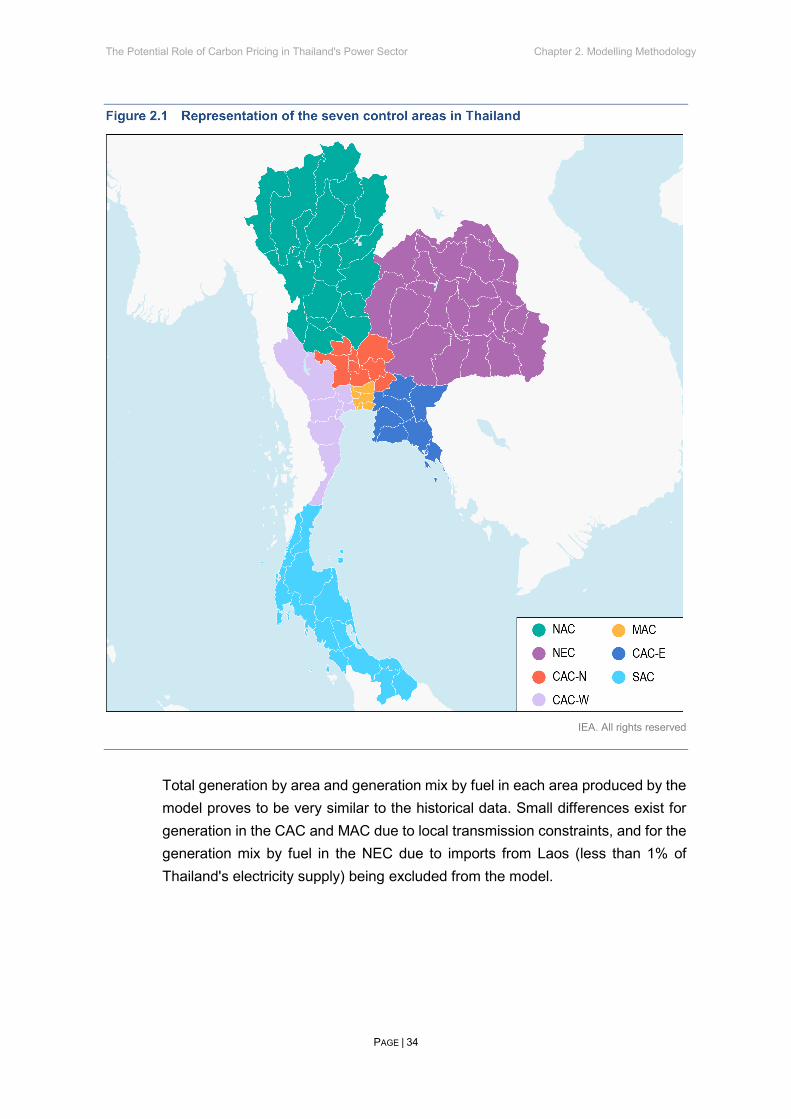
Total generation by area and generation mix by fuel in each area produced by the model proves to be very similar to the historical data. Small differences exist for generation in the CAC and MAC due to local transmission constraints, and for the generation mix by fuel in the NEC due to imports from Laos (less than 1% of Thailand's electricity supply) being excluded from the model.
The Potential Role of Carbon Pricing in Thailand's Power Sector Chapter 2. Modelling Methodology
PAGE | 35
IEA. All rights reserved.
Source: IEA ( n.d.), Thailand Power System Flexibility Study.
Scenario design Two scenarios, each with four carbon pricing cases, are designed to assess the impact of carbon pricing on Thailand's power system in 2030. The two scenarios represent different power system characteristics. The four carbon pricing cases include no carbon price, USD 10/t CO2, USD 30/t CO2 and USD 40/t CO2 by 2030.
Table 2.2 Scenario and case design in 2030
Name Scenario Case Key criteria
Carbon price Power plant
flexibility Contract Storage
VRE share in
generation
Solar and wind
capacity PDP_no carbon
price
PDP
NO
PDP Existing PSH: 1GW
6% (PDP)
Solar: 8GW, Wind:
1.7 GW
PDP_USD 10 CO2
USD 10/t CO2
PDP_USD 30 CO2
USD 30/t CO2
PDP_USD 40 CO2
USD 40/t CO2
Flex_no carbon price
Flexibility
NO
PDP (flexible) Flexible
PSH: 1.8 GW,
Advanced BESS:
800 MW/ 3.2 GWh
15% (ASEAN RE
target)
Solar: 18.8GW,
Wind: 6 GW
Flex_USD 10 CO2
USD 10/t CO2
Flex_USD 30 CO2
USD 30/t CO2
Flex_USD 40 CO2
USD 40/t CO2
0
20
40
60
80
100
120
CAC MAC NAC NEC SAC
2019 Actual Model
Generation (TWh)
0%10%20%30%40%50%60%70%80%90%
100%
Actu
al
Mod
el
Actu
al
Mod
el
Actu
al
Mod
el
Actu
al
Mod
el
Actu
al
Mod
el
CAC MAC NAC NEC SAC
Others
Solar and Wind
Bioenergy
ImportedHydropowerdomesticHydropowerOil
Gas
Coal
Share of Generation (%)

The Potential Role of Carbon Pricing in Thailand's Power Sector Chapter 2. Modelling Methodology
PAGE | 36
The PDP and Flex scenarios are developed to represent the power system with varying degrees of system flexibility and VRE penetration. The main flexibility criteria include operating characteristics of power plants, storage options and flexibility of fuel supply contracts and power purchase agreements (PPAs). The average capacity factors of the solar and wind plants are around 18% and 28%, respectively.
The PDP scenario integrates the PDP 2018 (Revision 1) considering the current plant flexibility, grid, storage and capacity expansion by 2030. The existing gas take-or-pay requirement in the fuel supply contract and constraint in the power purchase agreement is applied. The share of VRE generation is expected to reach 6% in 2030 with an installed capacity of 8GW of solar PV and 1.7GW of wind.
The Flex scenario is designed with increased power system flexibility and VRE capacity. All existing coal-fired and CCGT power plants are assumed to be retrofitted for increased technical flexibility by 2030, and new plants are assumed to be built with enhanced flexibility (as seen in Table “Average operating characteristics of conventional power plants by technology”). Additional storage options, including advanced battery energy storage systems (BESS) and higher pumped storage hydropower (PSH) capacity are integrated. More contract flexibility is allowed: power purchase agreement and fuel supply obligations with the daily contracted quantity are removed for all conventional plants, while the hydro import obligations remain constrained and carry-forward gas is not included. A higher share of VRE is considered as a possible contribution from Thailand to a more ambitious ASEAN renewable target. This target consists of 15% generation from VRE in 2040 based on the ASEAN Interconnector Masterplan Study III. This results in a total of 18.8GW solar PV and 6GW wind capacity for Thailand; the assumptions regarding coal, oil, natural gas and other renewables’ capacity in 2030 remain the same as in the PDP scenario.
For each scenario, four cases of carbon price by 2030 are developed to evaluate the effect of different carbon price levels (as seen in Table “Scenario and case design in 2030”):
• The no carbon price case serves as reference to compare the effects of other carbon price cases
• The USD 10/t CO2 case represents an estimate of the carbon price level from previous studies (TGO, n.d.).
• The USD 30/t CO2 case provides for a price level that enables a coal-to-gas switch in the power sector estimated on the basis of analysis of the 2030 fuel price.

The Potential Role of Carbon Pricing in Thailand's Power Sector Chapter 2. Modelling Methodology
PAGE | 37
• The USD 40/t CO2 case aligns with the lower end international estimates of the level of the social costs of carbon.
Table 2.3 Average operating characteristics of conventional power plants by technology
CCGT CCGT (single shaft) Coal
Existing Flexible Existing Flexible Existing Flexible
MSL (% of capacity) 60% 30% 60% 30% 45% 20%
Ramp rate (MW/min) ~30 MW/min ~60 MW/min ~25 MW/min ~50 MW/min ~10 MW/min ~30 MW/min
Start-up time (hours) ~3 hours ~1.5 hours ~4 hours ~2 hours ~6 hours ~2 hours
Goals and limitations The primary goal of this modelling exercise is to demonstrate the implications of carbon pricing on fossil fuel generation dispatch and the resulting changes in operating costs and CO2 emissions in 2030. Modelling scenarios are designed with different inputs of capacity mix, power sector technical and contractual characteristics and carbon pricing levels to represent the range of future possibilities of Thailand's power sector.
The modelling exercise has several limitations. In addition to the generation dispatch implication, carbon pricing could also impact supply investment and demand. The capacity mix is an input to the model based on existing policy targets. Therefore, the model will not show the implications of carbon pricing on investment. A separate analysis is conducted outside the model in order to address this limitation. Demand is also an input to the model based on the PDP. Hence, the impact of carbon pricing on demand is not modelled.
The carbon pricing scenarios are modelled for only one target year, 2030, and for a single sector, the power sector. The model does not define nor simulate the trajectory for a gradual introduction of carbon price between now and 2030. The impact of carbon pricing on other sectors tightly linked with the power sector, such as in the industrial or transport sectors, is also not analysed in this report.
This report does not aim to compare carbon tax with emissions trading systems. This analysis could be extrapolated for the analysis of a carbon tax without exemption or an emissions trading system with full allowance auctioning in 2030. Further study is necessary to understand whether a carbon tax or an emissions trading system would be more suitable for Thailand.
The production cost modelling output includes various operating costs, including fuel cost, ramping cost, start and shut down cost and operational and maintenance costs. The investment cost for new generation, transmission and distribution costs and various other system costs related to VRE adoption are not included in the modelling.

The Potential Role of Carbon Pricing in Thailand's Power Sector Chapter 3. Analysis of Results
PAGE | 38
Chapter 3. Analysis of Results
This chapter examines the potential role of carbon pricing in supporting power sector decarbonisation in Thailand. The in-depth production cost modelling provides insights into the potential impact of carbon pricing in different scenarios across four main aspects of Thailand's power sector: generation, CO2 emissions, cost and future investment. This chapter also explores carbon pricing design options adapted to Thailand's power sector.
PDP Scenario with no carbon price With a rapidly growing economy, electricity consumption in Thailand increased almost fourfold between 1990 and 2018. This growth is expected to continue. Based on Thailand's updated 2018 Power Development Plan (PDP18 Revision 1), annual power generation is projected to increase by over 50% from 198 TWh to 303 TWh between 2019 and 2030. In the PDP scenario, the supply-side growth is driven mainly by the increase in natural gas generation and renewables, while coal continues to decrease by 9 TWh by 2030. The share of coal in the generation mix will decrease from 23% in 2019 to only 12% in 2030. In that year, natural gas will remain the largest source of electricity generation, accounting for 65% of total generation. Generation from renewables will continue to grow by 43 TWh and in 2030 renewables will account for 24% of total generation, up from 15% in 2019.

The Potential Role of Carbon Pricing in Thailand's Power Sector Chapter 3. Analysis of Results
PAGE | 39
IEA. All rights reserved.
The generation mix is determined by a simulated economic dispatch in 2030. To balance the supply and demand, resources are dispatched economically by the system operator, EGAT, within the constraint of the technical, contractual and transmission requirements following the merit order. On the left of the merit order chart are the SPPs, VSPPs and VRE, which will be used to supply demand first. For this specific model, fossil fuel power plants built by the SPPs and VSPPs are all modelled according to the historical generation pattern where the profiles were fixed to meet yearly capacity factor targets. The variable renewable forms of energy are non-dispatchable resources, meaning that electricity will be generated on the basis of nature regardless of system needs at the moment. The intermediate load is portrayed in the middle of the chart. Intermediate load refers to dispatchable fossil fuel power plants and renewables, such as hydropower and bioenergy. The intermediate load plants can generate and be dispatched economically based on operating costs and demand at the time. Operating costs vary significantly among individual fossil fuel plants ranging from around THB 550 (USD 17.85)/MWh, mostly coal power plants, to almost THB 3 000 (USD 93.75)/MWh for diesel oil generators. Renewables along with fossil-fuelled SPPs and VSPPs are modelled without an operating cost.
0
50
100
150
200
250
300
350
400
2019 2019 - 2030Increase
2019 - 2030Decrease
2030 PDP
Wind
Storage
Solar
Imported Hydropower
Domestic Hydropower
Bioenergy
Oil
Natural gas
Coal
Generation (TWh)

The Potential Role of Carbon Pricing in Thailand's Power Sector Chapter 3. Analysis of Results
PAGE | 40
IEA. All rights reserved.
Note: "Renewables and fixed dispatch" include VRE, hydropower, bioenergy, SPPs and VSPPs.
The increase in electricity generation from renewables is driven by hydropower, bioenergy, solar and wind. Compared with 2019, solar and wind, which are both forms of VRE, have grown the fastest. VRE is characterised by its variable, non-dispatchable and partially unpredictable output. Its penetration is quite low today: in 2019, only around 2% of Thailand’s total power generation came from VRE. Based on IEA analysis, Thailand is still in the first phase in its renewable development. This means that initial deployment of VRE has started but it is still insignificant at the system level (IEA, 2018). In the PDP scenario, the share of VRE will increase to 6% of the total power generation in 2030. With more VRE added into the system, Thailand will be likely to approach or enter the next phase of the VRE deployment. In phase 2, changes to the system are noticeable, but Thailand's power system should still be able to absorb this level of VRE penetration using the existing flexibility from dispatchable plants. Relaxing the PPAs would be a first step to integrate more VRE. Then in a longer-term and in higher VRE deployment phases, some less efficient thermal plants might be kept in the system purely to balance the intermittent generation of VRE, provide ramping and peaking needs and maintain reliability for firm capacity requirement (IEA, n.d.).
The planned increase in renewables and decrease in coal generation in the PDPs is not enough to offset the growth in CO2 emissions from increased natural gas generation. Under the PDP scenario, the CO2 emissions from Thailand's power sector are projected to grow by 21% from around 96 Mt in 2019 to 116 Mt in 2030.
0
500
1000
1500
2000
2500
3000
3500
4000
0 20 40 60 80Total Capacity (GW)
Renewables andNon-dispatchableCoal
Natural Gas
Oil
Marginal Short Run Cost (THB/MWh)

The Potential Role of Carbon Pricing in Thailand's Power Sector Chapter 3. Analysis of Results
PAGE | 41
IEA. All rights reserved.
Note: In this analysis, only PDP2018 (Revision 1) is taken into account. The effects of Covid-19 have not been considered.
Demand and generation capacity are not evenly distributed among the country. The CAC has the highest share of both power generation and power demand in Thailand. Natural gas, coal, hydro and other renewables are all available in this area. Power generation in the MAC is significantly below the power demand in the MAC, which means that much of the electricity needs to be imported from other areas. Generation in the MAC is dominated by natural gas. The NAC has the lowest power demand and supply among the five areas. It has the most coal generation in the country and is also the only area without a natural gas power plant. It would be disproportionally affected by any measures to reduce coal generation. All of Thailand's imported hydropower comes in from the NEC and hydropower will remain an important technology to assist the clean energy transition. All the areas are inter-connected and the imbalance in supply and demand highlights the need for inter-regional transmission. The SAC is partially geographically isolated from the rest of the country and its power system can only connect with the CAC. The transmission lines connecting the CAC and SAC play a key role in maintaining system reliability in the SAC (IEA, 2018).
0
20
40
60
80
100
120
14020
0020
0220
0420
0620
0820
1020
1220
1420
1620
1820
2020
2220
2420
2620
2820
30
Emis
sion
s (M
tCO
2)
IEA HistoricalEmissionsEmissionsProjection PDP

The Potential Role of Carbon Pricing in Thailand's Power Sector Chapter 3. Analysis of Results
PAGE | 42
IEA. All rights reserved.
Note: Central area (CAC) includes Central East, Central North and Central West.
Flex scenario with no carbon price The Flex scenario is designed to have 15 GW more VRE compared with the PDP scenario in 2030, and more flexibility for conventional power plants. The assumption for additional VRE was extrapolated from the 2040 ASEAN renewable energy target. The Flex scenario has a total of almost 25 GW of VRE, which accounts for 32% of the total available generation capacity. The total share of VRE capacity in the Flex scenario is more than double compared to its share in the PDP scenario. With the significant increase in VRE, the combined capacity from renewables and storage accounts for over half of the total generation capacity in the 2030 flex scenario.
020406080
100120140160180
CAC MAC NAC NEC SAC
Wind
Storage
Solar
Imported Hydropower
Domestic Hydropower
Bioenergy
Oil
Natural gas
Coal
Load
Generation and Load (TWh)

The Potential Role of Carbon Pricing in Thailand's Power Sector Chapter 3. Analysis of Results
PAGE | 43
IEA. All rights reserved.
Comparing the generation profile of the PDP and Flex scenarios, 15 GW of additional VRE will lead to 29 TWh of additional generation from VRE. By 2030, the share of VRE in total generation will increase from 6% in the PDP scenario to 15% in the Flex scenario. With the share of VRE generation amounting to 15% in the Flex scenario, additional flexibility measures might be desirable.
Without carbon pricing or any other policy instrument to mandate the generation mix, additional VRE is projected to replace the generation mainly from natural gas plants due to their relatively high operating costs. Over 28 TWh of generation from natural gas will be replaced with VRE, while other resources are barely impacted with less than 0.05 TWh generation from coal generation replaced with VRE.
0
20
40
60
80
PDP Difference Flex
Wind
Storage
Solar
Imported Hydropower
Domestic Hydropower
Bioenergy
Oil
Natural gas
Coal
Total Capacity (GW)

The Potential Role of Carbon Pricing in Thailand's Power Sector Chapter 3. Analysis of Results
PAGE | 44
IEA. All rights reserved.
VRE capacity addition will replace natural gas generation because coal is more cost-competitive compared with natural gas in the power plant dispatch merit order. Coal has lower operating costs compared to natural gas in general, mainly due to its lower cost. When new capacity is introduced, the generation addition will first replace the generation from the most expensive units and gradually move down the merit order.
IEA. All rights reserved.
Changes in generation (TWh)
0
500
1000
1500
2000
2500
3000
3500
4000
0 20 40 60 80Total Capacity (GW)
Renewables andNon-dispatchableCoal
Natural Gas
Oil
Marginal Short Run Cost (THB/MWh)

The Potential Role of Carbon Pricing in Thailand's Power Sector Chapter 3. Analysis of Results
PAGE | 45
Though many technical characteristics, such as ramping speed and transmission constraints, are taken into account when deciding on and managing power plant dispatch to maintain reliable and affordable electricity, the merit order is a key aspect and is relevant in understanding the potential role of carbon pricing in economic dispatch. Comparing the merit order between the PDP and Flex scenarios, additional VRE will prolong the supply curve of renewables and fixed dispatch and consequently lower the supply curve from dispatchable resources as the demand stays the same. Due to the low cost of coal, power plants fired by coal are the cheapest to run amongst the dispatchable fossil fuel- fired plants. Hence, coal takes priority in the dispatch decision among all the dispatchable resources. Coal capacity is followed by natural gas which has significantly more capacity availability and a wider range of operating costs. As a result of the elongated supply curve for renewables and fixed dispatch resources, generation from the most expensive natural gas plant in the tail end of the supply curve will be reduced compared to the PDP scenario. Oil is the most expensive dispatchable resource. However, since some diesel generators are used for peaking or supplying energy when other forms of power supply are unavailable, they will potentially continue to generate despite the high prices.
The modelling results show that the economic dispatch pattern does not follow the intended development trend of Thailand’s power sector, namely, to reduce the generation from coal-fired power plants. Coal-fired generation is at least two times more emissions-intensive than natural gas generation. It could therefore, from an emissions mitigation perspective, be desirable to introduce policies which incentivise a shift in the merit order so as to allow natural gas to take priority in the dispatch decision.
The lower generation from natural gas and the higher generation from VRE are not evenly distributed across the country. The shift from natural gas to VRE affects mainly the CAC) and NEC due the fixed potential locations of VRE resources, which are largely solar PV (both distributed and utility-scale solar PV). 74% of the natural gas reduction is in the CAC, followed by the SAC and MAC areas. Natural gas generation in the NEC is barely affected since it utilises domestic gas resources. This area sees one of the highest increases in generation from VRE, accounting for a third of the total VRE generation increase in the Flex scenario. As a result, there is a net increase of TWh in the NEC’s generation, which raises its share in total generation from 16% to 19%. VRE generation in the CAC is expected to increase by around 10 TWh, but it is not enough to compensate for the generation reduction from natural gas. As a result, total generation in the CAC falls by over 10 TWh in the Flex scenario. Though the CAC is still the

The Potential Role of Carbon Pricing in Thailand's Power Sector Chapter 3. Analysis of Results
PAGE | 46
area with the highest share of power generation, the gas-to- VRE shift reduces its share in total generation to 47% from 50%.
IEA. All rights reserved.
Note: The Central area (CAC) includes the Central East, Central North and Central West; the other four areas are the Metropolitan (MAC); Northern (NAC); North-Eastern (NEC) and Southern (SAC).
Effect of carbon pricing A carbon price signal in Thailand's power sector could play a major role in driving CO2 emission reductions by incentivising a shift from higher to lower emissions-intensive generation. Depending on the carbon price levels, three types of generation dispatch shifts are observed and analysed:
• The coal-to-gas switch occurs with an effective carbon price level, as observed in the USD 30/t CO2 and USD 40/t CO2 cases;
• The shift within the natural gas generation mix occurs under a moderate carbon price, as seen in the USD 10/t CO2 cases; and
• The coal-to-VRE switch occurs when effective carbon pricing is combined with additional VRE capacity and system flexibility. The analysis focuses on the PDP scenario with a USD 30/t CO2 carbon price and the Flex scenario with a USD 40/t CO2 carbon price case comparison.
-25-20-15-10-505
10152025
MAC NAC NEC SAC CAC
VRE
Natural Gas
Generation Shift (TWh)

The Potential Role of Carbon Pricing in Thailand's Power Sector Chapter 3. Analysis of Results
PAGE | 47
An effective carbon price could incentivise a coal-to-gas switch in the dispatch
Based on the current PDP, fossil fuel generators will continue to dominate Thailand’s electricity production. There is potential for large emission reductions in the fossil fuel mix. Implementing a carbon price would reduce emissions through coal-to-gas switches in the dispatch. A USD 30/t CO2 carbon price could incentivise a 5 TWh generation shift from coal to natural gas and a USD 40/t CO2 carbon price could incentivise over 23 TWh of generation shift from coal to natural gas in 2030. As a result of the generation shift, a USD 30/t CO2 carbon price could lead to a 2 Mt CO2 emissions reduction and a USD 40/t CO2 carbon price could lead to a 13 Mt CO2 emissions reduction in 2030, representing an 11% reduction from the PDP scenario. Generation from other resources is not impacted by the introduction of a carbon price.
IEA. All rights reserved.
Coal-to-gas switches could lead to noticeable emission reductions because coal power generation is significantly more emissions intensive than natural gas. Based on IPCC 2006 guidelines, the emissions factor for bituminous coal is 94.6 kg/GJ and 101 kg/GJ for lignite while the emissions factor for liquid natural gas is 64.2 kg/GJ and only 56.1 kg/GJ for natural gas. In addition to the fuel emissions factor, the natural gas plants in Thailand are more efficient than coal power plants. Combining both factors, for each unit of electricity generated, the CO2 emissions of from a coal-fired power plant are estimated be more than double those from a natural gas-fired power plant. The average emissions intensity from electricity
116 114 103
-
20
40
60
80
100
120
-
100
200
300
400
PDP PDP USD30 PDP USD40
Emis
sion
s (M
tCO
2)
Gen
erat
ion
(TW
h)
Wind
Storage
Solar
Bioenergy
ImportedHydropowerDomesticHydropowerOil
Natural gas
Coal
Emissions

The Potential Role of Carbon Pricing in Thailand's Power Sector Chapter 3. Analysis of Results
PAGE | 48
generation by 2030 could thus be reduced to 0.340 t CO2/MWh in the PDP scenario with a USD 40/t CO2 carbon price compared to 0.383 t CO2/MWh in the PDP with no carbon price case.
Carbon pricing incentivises a switch from coal to gas by changing the operation costs for coal and gas power plants. The differences in fuel type and fuel source location are considered in the fuel price. As coal generation faces a higher carbon cost per unit of generation due to its higher CO2 emissions intensity, carbon pricing consequently shifts the dispatch merit order. Due to the existing operational price gap between natural gas and coal power generation, a coal-to-gas shift could be initiated at a carbon price level of around USD 30/t CO2. The PDP scenario with a 30/t-CO2 carbon price case shows that 5 TWh of coal generation could be replaced by natural gas under this carbon price level, which is equivalent to 15% of the coal generation expected in the 2030 PDP generation. A higher carbon price of USD 40/t CO2 could yield a much stronger fuel switch effect, resulting in 23 TWh, or 65% of the coal generation being replaced with natural gas generation under the PDP projection. On average, a USD 40/t CO2 carbon price would be equivalent to over THB 1 200 (USD 37.5)/MWh for a coal power plant, but only around THB 500 (USD 15.6)/MWh for a natural gas power plant. This would effectively prompt several natural gas units to become more cost-effective than the less efficient coal power plants.
IEA. All rights reserved.
Coal-to-gas shifts could have strong distributional effects across the country. Coal generation is concentrated in the CAC and NAC, which account for almost all of
0
500
1000
1500
2000
2500
3000
3500
4000
0 20 40 60 80Total Capacity (GW)
Renewables andNon-dispatchableCoal
Natural Gas
Oil
Marginal Short Run Cost (THB/MWh)

The Potential Role of Carbon Pricing in Thailand's Power Sector Chapter 3. Analysis of Results
PAGE | 49
Thailand’s total coal generation. Natural gas generation is available in every area except for the NAC. Consequently, total generation in the NAC will see the largest net reduction under the coal-to-gas switch in the PDP scenario with the carbon price set at USD 40/t CO2, while the CAC will experience the largest coal generation reduction as well as the strongest increase in natural gas generation. Decreasing the use of coal power plants would lead to decreasing their overall capacity factor, with a sharper drop expected to occur for the coal plants situated in the CAC due to the higher cost of the bituminous coal used there, and compared to the lignite used in the NAC. Ancillary services could provide the right price signal to existing coal-fired power plants to run less while they progressively invest in retrofits, repurposing and even de-commissioning. This would also allow fossil fuel plants, including coal- and gas-fired power generation, to ensure system reliability and flexibility to integrate a higher share of VRE.
Coal-to-gas shifts will also lead to generation increases in the SAC. This will expand the utilisation of the transmission interface between the CAC and SAC. The SAC is geographically isolated, and politically-motivated incidents affecting the transmission lines between the CAC and SAC continue to pose serious electricity supply concerns for the SAC. Potential increased dependence on the CAC-SAC transmission interface should be further analysed, particularly during high demand and low variable renewables output periods.
IEA. All rights reserved.
Note: The CAC includes the Central East, Central North and Central West.
-15
-10
-5
0
5
10
15
20
MAC NAC NEC SAC CAC
Coal-to-Gas Shift by Area PDP to PDP USD40
Coal Natural Gas
Change in generation (TWh)
0%
20%
40%
60%
80%
100%
CAC NAC
Coal Capacity Factor PDP and PDP USD40
PDP PDP_$40CO2

The Potential Role of Carbon Pricing in Thailand's Power Sector Chapter 3. Analysis of Results
PAGE | 50
A modest carbon price would drive changes in the natural gas generation mix
When the carbon price is below the effective level to incentivise the coal-to-gas shift, the carbon price could still assist the transformation of the power sector by changing the generation mix of the existing natural gas fleet of plants, though the impact on emissions is marginal. A USD 10/t CO2 carbon price can lead to a 32-kt CO2 emissions reduction in the PDP scenario. With more system flexibility and more available capacity, the same USD 10/t CO2 carbon price can have a stronger effect, leading to a 123 kt CO2 emissions reduction in the Flex scenario. The emission reductions in the USD 10/t CO2 carbon price scenarios are due to the generation shift from higher emissions intensive to lower emissions intensive natural gas plants. Most of the shifts are from LNG plants to natural gas plants.
IEA. All rights reserved.
The emissions intensity of individual natural gas plants depends on the fuel emissions factor and plants’ efficiency. The fuel emissions factor differs mostly between LNG- and other natural gas-fired plants, and mainly because of the technology and age of the plant. Based on the IPCC guidelines, LNG has a higher fuel emissions factor than natural gas. As a result, LNG plants generally have the highest emissions intensity among the various types of natural gas plants. Considering the range in CCGT plant efficiency, the CO2
02468
10121416
Emissions Intensity (tCO2/MWh)
Capacity by efficiency (%) for natural gas fleet
Capacity (GW)
020406080
100120
0.37 0.39 0.41 0.43Emissions Intensity (tCO2/MWh)
Generation by emissions intensity for natural gas fleet
Flex Flex $10
Generation (TWh)

The Potential Role of Carbon Pricing in Thailand's Power Sector Chapter 3. Analysis of Results
PAGE | 51
emissions intensity of natural gas plants analysed in the model ranges between 0.37 t CO2/MWh and 0.43 t CO2/MWh.
In the Flex scenario with a 10/t CO2 carbon price, 2 TWh of generation are shifted mainly from the LNG- to natural gas-fired plants. However, the impact on system-wide emission reductions remains insignificant because the difference between the maximum and minimum emissions intensity in natural gas plants is small, and technical, contractual and generation availability constraints also prevent a larger shift in generation. Nevertheless, a low carbon price level can still benefit the power system by helping to optimise the generation among the existing natural gas plants and demonstrate the potential gains from carrying out retrofits.
Carbon price leads coal-to- VRE shift in combination with additional VRE capacity
A coal-to-VRE shift can be observed when additional VRE capacity is added to the system in combination with carbon pricing. Introducing a carbon price in the Flex scenario leads to new VRE additions replacing primarily coal generation instead of natural gas generation. With a USD 40/t CO2 carbon price, of the total 29 TWh new VRE generation, 26 TWh (or 91%) replaces generation from coal, and less than 3 TWh replaces generation from natural gas. This doubles the emissions reduction benefits from the same VRE capacity additions.
IEA. All rights reserved.
Changes in generation (TWh)

The Potential Role of Carbon Pricing in Thailand's Power Sector Chapter 3. Analysis of Results
PAGE | 52
As a result of the generation shift, a USD 40/t CO2 carbon price combined with VRE additions and improved flexibility reduces total emissions from the power sector by 26Mt from the PDP scenario in 2030. Compared with the PDP USD 40/t CO2 carbon price case, at the same carbon price, the Flex scenario with a 40/t CO2 carbon price case reduces CO2 emissions by a further 13Mt because VRE additions cause the carbon price to incentivise a generation shift from coal to VRE, which is emission free, rather than a shift from coal to natural gas.
IEA. All rights reserved.
Coal generation is concentrated in the CAC and NAC, while most of the VRE generation additions are expected to be located in the CAC and NEC. As a result, the NAC experiences the most net generation reduction while the NEC experiences the most net generation gain. Generation from the NAC will be reduced from 10% of the total generation to only 7%, while the share of generation from the NEC will increase from 16% to 19%.
Among the two areas with coal capacity, coal power plant generation in the CAC will reduce sharply from close to 16 TWh in the PDP scenario to 1 TWh, with an overall capacity factor of only 6% in the Flex scenario at a 40/t CO2 carbon price. Though the coal power plants in the CAC are relatively more efficient, they have much higher operating costs than the coal power plants in the NAC, resulting in a greater decrease in electricity generation from coal in the CAC. Carbon pricing will provide more incentives to repurpose or decommission more coal-fired plants in the CAC than in the NAC.
116103 105
90
0
20
40
60
80
100
120
PDP PDP USD40 Flex Flex USD40
Emissions (MtCO2)
-13MtCO2-15MtCO2

The Potential Role of Carbon Pricing in Thailand's Power Sector Chapter 3. Analysis of Results
PAGE | 53
IEA. All rights reserved.
Economic implications of carbon pricing in power dispatch
An effective carbon price in Thailand can deliver emissions reduction benefits cost effectively, but would also increase the power systems’ costs.1 This impact would therefore need to be addressed. These cost increases could be limited through coordination with other policies, or through adjustments in the carbon pricing policy design.
Lower fuel costs in 2030 can help reduce the impact of the carbon price on the price of electricity
Compared to the operating cost in 2019 of a fossil fuel power plant,2 the operating cost in the PDP scenario is projected to increase from THB 145 billion (USD 4.5 billion) to THB 225 billion (USD 7.0 billion), driven mainly by the growth of electricity demand. Between 2019 and 2030, the total operating cost could increase by 36% while the total demand increases by over 50%. As such, the 2030 PDP scenario has a lower operating cost per unit of electricity generation compared with 2019. The operating cost in 2019 is THB 0.97/kWh and it
1 Power system cost in this report refers to all the fixed and variable costs needed to operate and maintain a secure and reliable power system that can sufficiently meet demand, including but not limited to capital investment, power plant operational cost, taxes and fees, and transmission and distribution costs. 2 The operational costs of a power plant consist mainly of the fuel costs and O&M cost, which include start-up cost, ramping cost and variable operating and maintenance costs (VOM). Due to data constraints, the costs for hydro imports, and small and very small power plants are not included.
-20
-15
-10
-5
0
5
10
15
MAC NAC NEC SAC CAC
Coal and Gas to VRE Shift
Natural Gas Coal VRE
Generation Changes (TWh)
0%
20%
40%
60%
80%
100%
CAC NAC
Coal Capacity Factor (%) Comparison Flex and Flex $40
Flex Flex_USD40

The Potential Role of Carbon Pricing in Thailand's Power Sector Chapter 3. Analysis of Results
PAGE | 54
decreases to THB 0.86/kWh in 2030 without any carbon price. The saving is driven by the reduction in fuel costs due to the continued clean energy transition and increased adoption of renewable forms of energy. As the share of renewables gradually increases in the power generation mix, the total fuel cost per unit of electricity generated continues to decrease over the years.
IEA. All rights reserved.
The lower 2030 operating cost in the PDP scenario could partially mitigate the impact of cost increases associated with the introduction of a carbon price. The total operational and carbon cost in 2030 with a USD 10/t CO2 carbon price would still be comparable to the operating cost in 2019. With a higher carbon price, the operating cost and carbon cost combined would surpass the level in 2019 before the introduction of a carbon price. At a USD 30/t CO2 carbon price, the total operational and carbon cost will increase by THB 0.25/kWh. A USD 40/t CO2 will increase the total operational and carbon cost by THB 0.37/kWh from the 2019 level.
The electricity tariffs could be quite different for different customers due to various usage patterns. The energy charge portion of the electricity tariff ranged between THB 2/kWh and THB 6/kWh in 2016. Based on the IEA World Electricity Prices database, the average electricity tariff in 2018 was around THB 3.9/kWh for Thailand’s residential and commercial sector, and THB 3.5/kWh for its industrial sector. . Between 2005 and 2018, the electricity tariff for all customer segments increased around 2% per year. Assuming the same rate of increase, Thailand’s electricity tariff in 2030 is estimated to be between THB 4.5/kWh and THB 5.0/kWh
0.000.200.400.600.801.001.201.401.60
2019 PDP PDPUSD10
PDPUSD30
PDPUSD40
Ope
ratio
nal C
ost (
THB/
kWh)
Carbon CostO&M CostFuel Cost

The Potential Role of Carbon Pricing in Thailand's Power Sector Chapter 3. Analysis of Results
PAGE | 55
without the introduction of a carbon price. The operational and carbon cost increases in the USD 30/t CO2 and 40/t CO2 carbon price scenario could represent a 5% to 8% increase compared to the estimated electricity tariff, depending on the customer class. Changes in the generation mix will also affect the transport and distribution patterns of electricity, and thus the power system cost impacts on the tariff. More in-depth analysis is needed to better understand the effects of carbon pricing on Thailand’s electricity tariffs.
Carbon prices at different levels lead to a wide range of abatement costs
The modelling results suggest that emissions reduction is not linearly proportional to the operating cost change as a result of shifts in the generation mix and carbon price at different levels. The carbon abatement cost is calculated by dividing the total emissions reduction compared to a no-carbon price scenario by the change in total operational and carbon costs. When emissions reduction is high, but the cost increase is limited, the resulting carbon abatement cost will be low. On the other hand, if a significant cost increase fails to lead to sufficient emissions reduction, the resulting carbon abatement cost will be high and the carbon price level will be regarded as less effective in delivering the emissions reduction objective.
Applying a carbon price that is below the necessary level to incentivise coal-to-gas shifts will lead only to additional costs without delivering much benefit in either emissions reduction or clean energy transition. A USD 10/t CO2 carbon price by 2030 is not sufficient to incentivise significant change to the power mix. Hence there would be very limited emission reductions. Applying such a carbon price would result in a staggering abatement cost per tonne of CO2 emissions reduction: THB 331 000 (USD 10 343) for the PDP with a USD 10/t CO2 scenario. The USD 30/t CO2 and USD 40/t CO2 carbon prices are both sufficient to initiate coal-to-gas transitions. They can therefore incentivise emission reductions with a much lower abatement cost. The carbon abatement cost per tonne for the PDP scenario with USD 30/t CO2 and USD 40/t CO2 carbon price are THB 37 000 (USD 1 156)/t CO2 and THB 9 000 (USD 281)/t CO2, respectively. A USD 40/t CO2 carbon price has a lower abatement cost compared with the USD 30/t CO2 carbon price because USD 30/t CO2 is sufficient to start the coal-to-gas switch, but not enough to spur substantial changes in the generation profile.
Integrating the carbon price signal in the capacity expansion planning would encourage investment in low carbon power technologies that would help to further

The Potential Role of Carbon Pricing in Thailand's Power Sector Chapter 3. Analysis of Results
PAGE | 56
reduce the carbon abatement cost. For example, the additional VRE capacity in the Flex scenario by 2030 could have been in part the result of a carbon price signal in the investment decisions. In the Flex scenario with a USD 30/t CO2 and USD 40/t CO2 carbon price, the abatement costs per tonne would be reduced to THB 5 500 (USD 172)/t CO2 and THB 4 000 (USD 125)/t CO2, respectively, compared to the PDP scenario.
IEA. All rights reserved.
Further study is needed to identify the optimal carbon price to deliver emission reductions in Thailand’s power sector. Nonetheless, this analysis shows that an effective carbon price would need to at least ensure sufficient incentives for power plant operators to shift from coal to gas. The effects of carbon pricing on the total system cost could be in part mitigated by: a) adapted carbon pricing design; and b) complementary policies addressing equity with respect to targeted vulnerable groups.
Co-ordinate policies to address the impact of a carbon price on electricity consumers
A carbon price could increase both the base cost component and the automatic tariff adjustment component of the electricity tariff. Under the current structure, both PEA/MEA and EGAT are able to recover the change in the uncontrolled cost related to fuel costs and power purchase via an automatic adjustment mechanism that adjusts electricity rates to maintain a target rate of return (IEA, 2018). Therefore, the deviation from the cost estimate, due to dispatch changes which
331,242
36,592
9,282 5,493 4,0440
1000020000300004000050000
300000310000320000330000340000
PDP USD10 PDP USD30 PDP USD40 Flex USD30 Flex USD40
Carbon Abatement Cost (THB/tCO2)
The Potential Role of Carbon Pricing in Thailand's Power Sector Chapter 3. Analysis of Results
PAGE | 57
are incentivised by a carbon pricing signal, could also be considered in the tariff via the automatic tariff adjustment component. The cost increase would therefore be ultimately allocated to consumers and it is important to consider and address the associated socio-economic impacts.
Based on Thailand’s tariff structure in 2016, the tariff per unit of electricity consumption increases as usage increases. For residential customers, the first 15 kWh of electricity consumed each month costs THB 2.35/kWh with usage above 400 kWh charged at THB 4.42/kWh. As low-income households generally consume less electricity per month, it is necessary to limit the impact of carbon-price-led electricity price increases for them. One way could be to apply the carbon tax only to usage above their basic daily needs, or to scale it upwards as usage increases, similarly to the current electricity tariff.
Revenue collected from the carbon price can also be used to address socio-economic impacts. In addition to the potential increases in electricity prices, the clean energy transition may unevenly affect the workforce of some industries, such as the fossil fuel industry. Concomitantly, it could also affect the economies of some areas more than others, such as those whose modernisation has depended almost solely on the fossil fuel industry. The revenue from the carbon price could help to provide relief or transition support to smooth out the introduction and implementation of carbon pricing policies. One example is the carbon tax system adopted by British Columbia, Canada in 2008, which aimed to be revenue neutral in the initial phase. A revenue-neutral approach means that revenues collected from British Columbia’s carbon tax are redistributed back to tax-payers through personal and corporate tax cuts. Studies have shown that British Columbia’s carbon tax has led to emission reductions with no significant effects on economic growth. It has garnered high public approval ratings (World Bank, 2019). Thailand could adopt a similar revenue-neutral approach, especially in the initial phase to ease the transition into carbon pricing. In addition to tax cuts, some of the revenue from the carbon price could also be converted into direct energy subsidies for low-income households, small businesses or sectors that need additional support in their clean energy transitions.
Adapting carbon pricing design to Thailand’s power sector
Given the regulatory structure of Thailand’s power sector, alternative forms of carbon pricing could be explored to mitigate the cost impacts of carbon pricing while still delivering considerable benefits and providing signals for emission reductions and the energy transition.

The Potential Role of Carbon Pricing in Thailand's Power Sector Chapter 3. Analysis of Results
PAGE | 58
One option could be to combine a “shadow” carbon price 3 used in dispatch decisions, with a moderate explicit carbon price in the form of a carbon tax or emissions trading system. Under Thailand’s Enhanced Single Buyer Model, the adoption of an effective shadow carbon price by EGAT in the dispatch decision-making process could allow the cost of carbon to be reflected in power dispatch, driving the generation shift without significantly increasing operating costs. Generation sources with high emissions intensity would rank lower in the merit order, as the dispatch decision procedure would include a shadow carbon cost in the optimisation process.
For example, with a shadow carbon price of USD 40/t CO2 in the dispatch decision, the generation shift from coal to gas could occur as demonstrated in the PDP USD 40/t CO2 carbon price scenario, since economic dispatch internalises the carbon cost and shifts the merit order of coal- and natural gas-fired power plants. A shadow carbon price of USD 40/t CO2 would increase the total operating cost by only around THB 0.06/kWh in 2030 compared to the PDP scenario, and it would still be THB 0.05/kWh below the 2019 level. The cost increase would be associated with a generation shift from cheaper coal to more expensive gas plants. Consequently, the shadow carbon price would yield a 13Mt CO2 reduction in the PDP scenario, which is the same amount as with an explicit carbon price of USD 40/t CO2, while lowering the total operating cost by 88%. It is important to note, however, that without an explicit carbon price, there will not be any additional revenue that could potentially be used to mitigate the cost impacts, accelerate clean technology investment and deployment, and address other issues associated with the clean energy transition.
A shadow carbon price can moderately impact the economics of emissions-intensive power plants by reducing their running hours. Yet, the introduction of a shadow carbon price in the dispatch decision alone would not be sufficient to shift the economics among generation sources because emissions-intensive power plants do not actually bear the carbon cost and a shadow price would have but a marginal impact on investment decisions.
Gradually phasing in a moderate explicit carbon price, such as in the form of a carbon tax or emissions trading system, with the support of a shadow carbon price provide a transparent and effective price signal to drive structural transformation of the power sector while managing total power system operating costs.
3 Power producers would not need to pay the carbon cost directly associated with their generation, thus limiting the impact on their production costs.

The Potential Role of Carbon Pricing in Thailand's Power Sector Chapter 3. Analysis of Results
PAGE | 59
Economic impact of carbon pricing on VRE investment
Carbon pricing has the ability to incentivise investment in the power sector’s less carbon-intensive technologies by improving the price competitiveness of low carbon resources. It could also generate additional revenues that can be used for technology innovation, grid investment and tax incentives for low carbon resources. In addition, Thailand has a centralised capacity expansion process. Adopting an integrated resource planning process with the inclusion of a shadow carbon price could not only expand Thailand’s ambitions with respect to renewable energy target-setting and send a positive policy signal for renewable investment. It could also adjust the planning of fossil-fuel capacity expansion to avoid overcapacity, and maintain power supply reliability and affordability.
VRE and flexibility measures could offset the incurred investment cost by reducing the operating costs
As demonstrated by the Flex scenario, in addition to providing emission reductions, renewables and flexibility measures can also lead to lower operating costs. In the Flex scenario, 16GW additional solar, wind and storage in 2030 will result in an estimated THB 361 billion (USD 11.3 billion) in investment for new generation assets and an additional THB 7 billion (USD 218.7 million) for the retrofitting of existing assets. The total annualised investment cost, including operational and maintenance costs, is equivalent to almost THB 40 billion (USD 1.3 billion) per year. As a result, the total investment cost will raise the electricity cost in 2030 by THB 0.15/kWh compared to the PDP scenario. However, VRE and flexibility measures can both also lead to a reduction in operating costs. The adoption of VRE could help reduce fuel costs by reducing the amount of generation from fossil fuel power plants, while flexibility measures can reduce both the fuel and O&M costs by managing the conventional fleet more cost effectively. Adding 16 GW of VRE and storage capacity along with technical and contractual flexibility, as in the Flex scenario, can also reduce operating costs by THB 0.15/kWh. In total, the investment cost increase will be offset by the operating cost reduction, so that the cost increase for the Flex scenario would be around only THB 0.001/kWh compared to the PDP scenario, while delivering a considerable 12 Mt CO2 of emission reductions. Though there are many more additional components in the total system cost, the investment and operating costs are two of the biggest cost components. The Flex scenario illustrates that the clean energy transition can be done cost effectively.

The Potential Role of Carbon Pricing in Thailand's Power Sector Chapter 3. Analysis of Results
PAGE | 60
IEA. All rights reserved.
Carbon pricing could further accelerate the clean energy transition by incentivising VRE investment
In 2019, when comparing the total levelised cost of energy (LCOE), coal and natural gas were still cheaper than solar and wind. The LCOE represents the average lifetime cost of energy generation for different technologies. The investment costs of solar and wind are still much more expensive than for coal and gas, but the operating cost is much lower because there is no fuel cost for VRE. In addition, as a previous IEA study highlights, over the long term, VRE offers value to the system by reducing the need to build large-scale and capital-intensive fossil fuel power plants for capacity needs (IEA, 2018).
As the learning curve for VRE is projected to continue to accelerate over the next decade, the capital investment for solar and wind, are both expected to fall by 40% between now and 2030 (IEA, 2020b). Solar and wind are expected to achieve price parity with coal and gas before 2030. Currently in Thailand, solar and wind are projected to reach price parity with fossil fuel generation around mid-2020, and a carbon price could push it even earlier. With a USD 40/t CO2 carbon price, the LCOE for solar and wind will be cheaper than the LCOE for both coal and gas by early 2020, and increase the price gap over the years. This, in turn, could accelerate VRE investment.
-0.20
-0.15
-0.10
-0.05
0.00
0.05
0.10
0.15
0.20
Cos
t (TH
B/kW
h)
Annualised InvestmentCostO&M Cost
Fuel Cost
Retrofit Cost

The Potential Role of Carbon Pricing in Thailand's Power Sector Chapter 3. Analysis of Results
PAGE | 61
IEA. All rights reserved.
Source: IEA (2020b), World Energy Outlook 2020.
As demonstrated by the LCOE comparison, investing in new solar and wind capacity is projected to be cheaper than investing in new natural gas and coal-fired power plants. However, to replace the existing assets, VRE needs additional push. Even in 2030, investment in new VRE will still be more expensive than just maintaining an existing fossil fuel power plant, especially a coal-fired power plant that has low fuel costs. From a LCOE perspective, a carbon price of at least USD 15 - USD 20/t CO2 would be needed for solar and wind to replace the existing coal fired power plants in 2030.
In addition to the LCOE calculation, conventional fossil fuel power plants provide many benefits to the overall system to ensure reliability, including meeting the requirement of peaking and ramping, maintaining a minimum reserve margin and providing frequency and inertia support. The need for VRE to compensate for these benefits could mean additional system costs on top of the investment and operational components. The 2018 IEA report on assessing renewable integration in Thailand evaluated additional system costs such as the cost of additional balancing reserve, the cost to connect VRE to the power network and the cost of back-up technology or changing operations at conventional power plants so that they can respond to increasing VRE integration (IEA, 2018). As demonstrated between the Flex and PDP scenario comparison in the previous section, any savings in operating costs alone cannot fully offset the investment costs of VRE in 2030, even with additional technical and contractual flexibility when the full system is considered.
0.00
0.50
1.00
1.50
2.00
2.50
3.00
2019
2020
2021
2022
2023
2024
2025
2026
2027
2028
2029
2030
LCOE without carbon price
Natural Gas Coal Solar Wind
THB/KWh
0.00
0.50
1.00
1.50
2.00
2.50
3.00
2019
2020
2021
2022
2023
2024
2025
2026
2027
2028
2029
2030
LCOE with progressive carbon price reaching USD40 by 2030THB/KWh

The Potential Role of Carbon Pricing in Thailand's Power Sector Chapter 3. Analysis of Results
PAGE | 62
A carbon price could help to bridge the price gap between VRE and fossil fuel power plants by increasing the operating costs of fossil fuel power plants. Furthermore, carbon pricing is not only a cost to polluters, but it is also a revenue stream for the clean energy transition. California’s cap-and-trade programme manages the auction revenue through its Greenhouse Gas Reduction Fund (GGRF) which allocates revenues to programmes that focus on clean transportation, sustainable community, wildfire prevention and other infrastructure projects aimed at long-term development. As for the European Union’s ETS, 80% of the revenues are returned to member states to be used for climate-related projects (World Bank, 2019). A positive feedback loop for the adoption of VRE in Thailand could be established through a similar mechanism whereby revenue generated from the carbon price could be allocated to provide tax incentives for VRE investment, or funding for clean technology innovation and grid modernisation. Other complementary policies that incentivise technical and contractual flexibility could also help reduce the system reliability impacts of VRE.
An integrated planning process, including a carbon price, could lead to cost-effective emission reductions
As shown in the previous section, from a market point of view, VRE has the potential to help Thailand achieve cost-efficient emission reductions. Carbon pricing along with other measures could help provide additional incentives to accelerate the adoption of VRE and help provide the support needed to address system reliability issues. Thailand’s power sector relies on a centralised process to set capacity expansion targets for fossil fuel power plants and renewable power plants. However, this process might hinder a full leveraging of the benefits of renewable forms of energy and achieving a clean energy transition in the most cost-effective manner.
Thailand’s power sector planning has traditionally focused on developing supply-side resources and infrastructure to meet demand. However, renewable energy, especially VRE, has very much altered the power sector landscape, requiring changes in the current planning process (IEA, 2018). There are significant differences between VRE and conventional fossil fuel power plants, in terms of generation and transmission. The relative costs of these factors must be taken into consideration in the planning process. One planning approach that considers the particular characteristics of VRE is called the renewable-energy-zone approach, which customises the transmission planning and development of renewable projects in geographical areas that are known to have high renewable potential and strong developer interest (IEA, 2018).

The Potential Role of Carbon Pricing in Thailand's Power Sector Chapter 3. Analysis of Results
PAGE | 63
To date, Thailand has not yet integrated the social cost of carbon. One way would be to represent it as a shadow carbon price in a power planning model that permits the overall damage cost of CO2 emissions to society at large to be considered in the least cost optimisation, including renewable characteristics on transmission planning and renewable project development. Thailand could adopt a fully integrated planning process comprised of VRE capacity expansion using the renewable-energy-zone approach, conventional capacity expansion and network development that includes a shadow carbon price to reflect the social cost of carbon and support a least cost decarbonisation of the power sector.

The Potential Role of Carbon Pricing in Thailand's Power Sector References
PAGE | 64
References
C2ES ( 2020), California Cap and Trade, Center for Climate and Energy Solutions, Arlington, VA, https://www.c2es.org/content/california-cap-and-trade/ (accessed 23 November 2020).
ClimateWatch ( 2020), Climate Watch Data - World & Thailand: Total Greenhouse Gas (GHG) Emissions including LUCF, World Resources Institute, Washington, DC, https://www.climatewatchdata.org/ghg-emissions?breakBy=regions-ABSOLUTE_VALUE&end_year=2016®ions=THA%2CWORLD&start_year=1990 (accessed 9 December 2020).
CPLC (2017), Report of the High-Level Commission on Carbon Prices, Carbon Pricing Leadership Coalition, www.carbonpricingleadership.org. (accessed 10 December 2020).
Dechezleprêtre, A., D. Nachtigall and F. Venmans (2018), The joint impact of the European Union emissions trading system on carbon emissions and economic performance, Organisation for Economic Co-operation and Development, www.oecd.org/eco/workingpapers. (accessed 23 November 2020).
DEDE (2020), Alternative Energy Development Plan 2018 (AEDP2018) (in Thai), Department of Alternative Energy Development and Efficiency, Bangkok.
DEDE (2015), Alternative Energy Development Plan 2018 (AEDP2018) (in Thai), Department of Alternative Energy Development and Efficiency, Bangkok.
Eckstein, D., M.-L. Hutfils and M. Winges (2018), Global Climate Risk Index 2019, Germanwatch,
www.germanwatch.org (accessed December 9, 2020).
EPPO (2020a), Energy Statistics, Energy Policy and Planning Office, Bangkok, http://www.eppo.go.th/index.php/en/en-energystatistics/summary-statistic?orders[publishUp]=publishUp&issearch=1#.
EPPO (2020b), Power Development Plan 2018 (revision 1) (in Thai), Energy Policy and Planning Office, Bangkok.
EPPO (2018), Power Development Plan 2018 (in Thai), Energy Policy and Planning Office, Bangkok.
ERC (2011), Energy Industry Act 2007, Energy Regulatory Commission, Bangkok, https://www.erc.or.th/ERCWeb2/Upload/Document/Enery Act (unoffical Translation 2012) FINAL.pdf (accessed 10 December 2020).
European Union (2015), EU ETS Handbook, European Union, Brussels, https://ec.europa.eu/clima/sites/clima/files/docs/ets_handbook_en.pdf (accessed 23 November 2020).
I4CE (Institute for Climate Economies). (2016), Internal carbon pricing, a growing corporate practice, Paris, https://www.i4ce.org/wp-core/wp-content/uploads/2016/09/internal-carbon-pricing-november-2016-ENG.pdf
ICAP (2020), Emissions Trading Worldwide: Status Report 2020, International Carbon Action Partnership, Berlin, https://icapcarbonaction.com/en/icap-status-report-2020.

The Potential Role of Carbon Pricing in Thailand's Power Sector References
PAGE | 65
IEA (2020a), Implementing Effective Emissions Trading Systems: Lessons from International Experiences, IEA, Paris, https://webstore.iea.org/download/direct/4037?fileName=Implementing_Effective_Emissions_Trading_Systems.pdf.
IEA (2020b), World Energy Outlook 2020, IEA, Paris, https://www.iea.org/reports/world-energy-outlook-2020 (accessed 11 December 2020).
IEA (2018), Partner Country Series - Thailand Renewable Grid Integration Assessment, IEA, Paris, https://webstore.iea.org/partner-country-series-thailand-renewable-grid-integration-assessment (accessed 10 December 2020).
IEA (n.d.), Thailand Power System Flexibility Study (draft), IEA, Paris.
IMF (2019), Global Fossil Fuel Subsidies Remain Large: An Update Based on Country-Level Estimates, International Monetary Fund, Washington, DC, https://www.imf.org/en/Publications/WP/Issues/2019/05/02/Global-Fossil-Fuel-Subsidies-Remain-Large-An-Update-Based-on-Country-Level-Estimates-46509 (accessed 11 December 2020).
Martinot, E. (2016), "Grid integration of renewable energy: Flexibility, innovation, and experience", Annual Review of Environment and Resources, Vol. 41/1, pp. 223–251, Annual Reviews Inc., Palo Alto, CA, https://doi.org/10.1146/annurev-environ-110615-085725.
MoNRE (2014), Communication on Thailand’s Nationally Appropriate Mitigation Actions (NAMAs), Ministry of Natural Resources and Environment, Bangkok, https://unfccc.int/files/meetings/cop_15/copenhagen_accord/application/pdf/thailandcphaccord_app2.pdf (accessed 10 December 2020).
OECD (2018), Effective Carbon Rates 2018: Pricing Carbon Emissions Through Taxes and Emissions Trading, OECD, Paris, http://www.oecd.org/tax/effective-carbon-rates-2018-9789264305304-en.htm.
OECD (2016), Technical Support Document: - Technical Update of the Social Cost of Carbon for Regulatory Impact Analysis - Under Executive Order 12866, OECD, Paris, https://www.epa.gov/sites/production/files/2016-12/documents/sc_co2_tsd_august_2016.pdf (accessed 11 December 2020).
ONEP (2020a), Thailand’s Updated Nationally Determined Contribution, ONEP, Bangkok, https://www4.unfccc.int/sites/ndcstaging/PublishedDocuments/Thailand First/Thailand Updated NDC.pdf (accessed 23 November 2020).
ONEP (2020b), Thailand third biennial update report, ONEP, Bangkok.
ONEP (2017), Thailand’s Nationally Determined Contribution Roadmap on Mitigation 2021 - 2030. (In Thai), ONEP, Bangkok, http://www.oic.go.th/FILEWEB/CABINFOCENTER38/DRAWER027/GENERAL/DATA0000/00000853.PDF (accessed 10 December 2020).
ONEP (2015), Thailand Intended Nationally Determined Contribution and Relevant Information, ONEP, Bangkok, https://www4.unfccc.int/sites/ndcstaging/PublishedDocuments/Thailand First/Thailand_INDC.pdf (accessed 23 November 2020).
Ricke, K. et al. (2018), "Country-level social cost of carbon", Nature Climate Change, Vol. 8/10, pp. 895–900, https://doi.org/10.1038/s41558-018-0282-y.
TGO (n.d.), ศกึษาความเป็นไปไดใ้นการใชภ้าษีคารบ์อน เพือ่เป็นแรงจงูใจเชงิเศรษฐศาสตรใ์นการลดการปล่อยกา๊ซเรอืนกระจก (Feasibility Study of Using a Carbon Tax as an Economic Incentive to Reduce Greenhouse Gas Emissions), Thailand Greenhouse Gas Management Organization, Bangkok.

The Potential Role of Carbon Pricing in Thailand's Power Sector References
PAGE | 66
World Bank (2020), State and Trends of Carbon Pricing 2020, World Bank, Washington, DC, https://doi.org/10.1596/978-1-4648-1586-7
World Bank (2019), Using Carbon Revenues. Partnership for Market Readiness Technical Note: No. 16, World Bank, Washington, DC. https://openknowledge.worldbank.org/handle/10986/32247

The Potential Role of Carbon Pricing in Thailand's Power Sector Acronyms and abbreviations
PAGE | 67
Acronyms and abbreviations ASEAN Association of Southeast Asian Nations CCGT combined cycle gas turbine CDM Clean Development Mechanism EGAT Electricity Generating Authority of Thailand EPPO Energy Policy and Planning Office ETS emission trading scheme EU European Union GHG greenhouse gas IEA International Energy Agency IPCC Intergovernmental Panel on Climate Change IPP independent power producer LCOE levelised cost of energy LT-LEDS Long-Term Low Greenhouse Gas Emission Development Strategy MEA Metropolitan Electricity Authority MRV measurement, reporting and verification NAMA Nationally Appropriate Mitigation Actions NDC Nationally Determined Contribution O&M operations and maintenance ONEP Office of Natural Resources and Environmental Policy and Planning PDP Power Development Plan PEA Provincial Electricity Authority PPA power purchase agreement SPP small power producer TGO Thailand Greenhouse Gas Organisation T-COP Thailand Carbon Offsetting Program THB Thai Bhat T-VER Thailand Voluntary Emission Reduction scheme UNFCCC United Nations Framework Convention on Climate Change USD United States dollar V-ETS Thailand Voluntary Emission Trading Scheme VRE variable renewable energy VSPP very small power producers WEO World Energy Outlook
Units of measure CO2 carbon dioxide t CO2 tonne of carbon dioxide t CO2/MWh tonne of carbon dioxide per megawatt hour GJ gigajoule GW gigawatt kg CO2 kilogram of carbon dioxide kWh kilowatt hour Mt CO2 million tonnes carbon dioxide MW megawatt MWh megawatt hour TWh terawatt hour

The IEA examines the full spectrum of energy issues including oil, gas and coal supply and demand, renewable energy technologies, electricity markets, energy efficiency, access to energy, demand side management and much more. Through its work, the IEA advocates policies that will enhance the reliability, affordability and sustainability of energy in its 30 member countries, 8 association countries and beyond.
Please note that this publication is subject to specific restrictions that limit its use and distribution. The terms and conditions are available online at www.iea.org/t&c/
Source: IEA. All rights reserved.International Energy Agency Website: www.iea.org
IEA member countries:
Australia Austria BelgiumCanadaCzech Republic DenmarkEstoniaFinland France Germany Greece HungaryIreland ItalyJapanKorea Luxembourg Mexico Netherlands New Zealand NorwayPoland Portugal Slovak Republic Spain Sweden Switzerland Turkey United Kingdom United States
The European Commission also participates in the work of the IEA
IEA association countries:
BrazilChinaIndiaIndonesiaMoroccoSingaporeSouth AfricaThailand
INTERNATIONAL ENERGYAGENCY

This publication reflects the views of the IEA Secretariat but does not necessarily reflect those of individual IEA member countries. The IEA makes no representation or warranty, express or implied, in respect of the publication’s contents (including its completeness or accuracy) and shall not be responsible for any use of, or reliance on, the publication. Unless otherwise indicated, all material presented in figures and tables is derived from IEA data and analysis.
This publication and any map included herein are without prejudice to the status of or sovereignty over any territory, to the delimitation of international frontiers and boundaries and to the name of any territory, city or area.
IEA. All rights reserved.IEA PublicationsInternational Energy Agency Website: www.iea.orgContact information: www.iea.org/about/contact
Typeset in France by IEA - April 2021Cover design: IEAPhoto credits: © shutterstock
