the process of choice in guessing games
TRANSCRIPT

THE PROCESS OF CHOICE IN GUESSING
GAMES∗
Marina Agranov† Andrew Caplin‡ Chloe Tergiman§
October 2011
Abstract
We introduce a new experimental protocol to gain insight into non-
equilibrium theories focused on strategic sophistication. We elicit from
each player not only their final choice in a game, but also their entire
sequence of time-constrained choices. We find that early choices provide
a clear window into level zero play. We also identify an increasing pattern
of average strategic sophistication as contemplation time increases, as well
as important individual differences in how strategic decisions evolve over
time. In addition to strategic sophistication, our experimental protocol
may shed light on other strategically relevant forces that evolve over time,
such as emotions toward other players in the game.
∗We thank Jim Andreoni, Colin Camerer, Vince Crawford, Mark Dean, John Duffy, MartinDufwenberg, Guillaume Frechette, Daniel Friedman, Sen Geng, P.J. Healy, Daniel Martin,Rosemarie Nagel, Andy Schotter, Roberto Weber, as well as seminar participants at NYU,Stanford, UCLA, UCSD and at the Sauder School of Business at UBC for their input andguidance.†California Institute of Technology.‡New York University.§University of British Columbia.
1
1 Introduction
The predictions of equilibrium theory frequently fail when players interact in
unfamiliar economic environments. For that reason, non-equilibrium theories
focused on strategic sophistication are of growing interest. These theories rest
on assumptions concerning the choices of strategically unsophisticated (“L0”)
players that are hard to test, since such players are few and far between in
practice.1 Even if many players have unsophisticated first instincts, there is
little evidence of this in their final play.
Given the limited window that standard choice data provide into strategic
sophistication, there is increasing interest in enriched observations. 2 We in-
troduce an experimental design in which we elicit from one individual not only
their final choice in an unfamiliar game, but also their strategic first instincts
and their entire sequence of time-constrained choices. We incentivize and observe
the provisional choices of inexperienced players in the three minute period after
1The paradigm case is the 2/3 guessing game in which players select an integer between 1and 100 (or 0 and 100 if subjects can choose any real number), with the reward going to theindividual closest to 2/3 of the group average (Nagel (1995), Stahl and Wilson (1995), Stahl(1996), Duffy and Nagel (1997), Ho, Camerer, and Weigelt (1998), Camerer, Ho and Chong(2004), Grosskopf and Nagel (2008)). In this game the standard theory is that L0 playersmake choices that are uniformly distributed over the range [0,100], hence averaging 50 (see,for instance, Nagel (1995), Stahl and Wilson (1995) and Camerer, Ho and Chong (2004)). Yetfew in fact choose 50: the theory is instead supported by the prevalence of L1 and L2 typesselecting numbers close to 33 and 22.
2One question that has guided research on the guessing game is whether choice (say) of 33is a sophisticated response to a fully reasoned belief that others will average 50 or a reflec-tion of bounds on rationality (see Crawford (2008), Grosskopf and Nagel (2008) and Coricelliand Nagel (2009)). In trying to understand this, various researchers have begun to explorenon-standard data that may aid in the interpretation of choices. For example, Costa-Gomes,Crawford and Broseta (2001) and Costa-Gomes and Crawford (2006) examined data on in-formation search behavior recorded using MouseLab. Costa-Gomes and Crawford (2006) usedMouseLab to study cognition via information search in a rich class of two-person guessinggames. They provide compelling evidence that patterns of search as well as of choice canbe well explained by Lk and cognitive hierarchy models (Bosch-Domenech, Montalvo, Nageland Satorra (2002) reach similar conclusions). Other papers estimate subjects’ levels of rea-soning by analyzing verbal data associated with their choices (see Sbriglia (2004), Burchardiand Penczynski (2010)). Coricelli and Nagel (2009) used fMRI techniques to explore levelsof reasoning in a game in which subjects play against computers. They uncover systematicdifferences in the neurological responses of the players at different levels of strategic sophisti-cation. Chen, Huang and Wang (2010) used eye-tracking data to complement choice data in amodified 2/3 guessing game played spatially on a two-dimensional plane.
2

the structure of an unfamiliar game (we use the 2/3 guessing game) is conveyed
to them. The resulting “strategic choice process” (SCP) data capture in pure
form how internal reflection on the structure of the game causes the perceived
optimal decision to change.3 Unlike other forms of non-standard data designed
to provide insight into strategic choice, SCP data come in the familiar form of
choices, albeit indexed by time.4
There are five main findings.
1. Time-Constrained Games. We find a striking match between SCP data
and choices in standard games (where only final choice matters) with corre-
sponding time constraints. By definition, a subject can play an unfamiliar
game one and only one time. This poses a challenge for those seeking to
understand how the contemplation period interacts with the final decision.
The standard procedure (between subject design) requires the use of sepa-
rate pools of subjects for each time constraint (since by definition, the same
player cannot be used twice). This does not easily and cost-effectively al-
low the identification of individual learning differences.5 The SCP design
by contrast provides information on multiple time-constrained plays of an
unfamiliar game by one and the same player.6
3To sharpen the focus on internal reflection the experiment is designed so that the contem-plation of others is irrelevant: all other payoff-relevant actions were settled in a prior interactionas detailed in Section 2.
4Caplin and Dean (2010) and Caplin, Dean, and Martin (forthcoming) introduced choiceprocess to analyze information search. Unlike in the search theoretic context, in the strategiccase there is no external information to gather that would motivate changing one’s mind inthe pre-decision period.
5At the very least, it requires a large sample to adequately control for individual differences.6The area in which decision time has been most closely studied is that of repeated inter-
actions. Friedman and Oprera (2009) have shown that allowing players to change their mindsin continuous fashion greatly enhances cooperation in the repeated prisoners’ dilemna game.Weber (2003) had subjects play the guessing game ten times in a row, providing them withno feedback on their performance until all ten trials had been completed. While choice in thefirst round was entirely as in the standard game, by round ten the average choice had fallensignificantly. In the repeated game context, decisions may change not only due to internalreflection on the structure of the game, but also because the decisions of others are expected tochange. In contrast, any changes in our SCP experiment result exclusively from the evolutionof strategic understanding.
3

2. Strategic First Instincts and Level Zero Play. Early choices in the
SCP experiment shed new light on L0 play. Given its importance and the
difficulty of making inferences based on final choices alone, there is interest
in using non-standard data on choice procedures to gain additional insight
into L0 play.7 For the guessing game itself, we find that the mean of these
early choices is very close to 50 and the median is precisely 50, in line with
the standard assumption.
3. Contemplation Time and Strategic Sophistication. We identify an
increasing pattern of average strategic sophistication (and average payoffs)
as contemplation time increases.
4. Simple Best Response Dynamics. The simplest form of introspec-
tive reasoning by which a subject may advance in type is based on best-
responding to own past decision. We rarely observe such a simple pattern.
While there are example of such decision making, it is far from the domi-
nant feature of the data.
5. Individual Differences. There are fascinating individual differences in
how choices evolve over the contemplation period. We uncover sugges-
tive evidence that those whose strategic sophistication grows most in the
guessing game may also perform better at a separate learning task involving
Bayesian updating.8
Our experiment opens up to observation the process by which subjects learn
7In a recent example of such non-choice based inference, Burchardi and Penczynski (2010)use a novel design in which players in the guessing game are divided into teams, with eachmember being allowed to pass both their individually preferred choice and a persuasive messageto their partner concerning how best to play the game. Burchardi and Penczynski (2010)classify these arguments according to level of strategic sophistication in a manner that turnsout to align well with the associated choices. In particular, for those classified in this manner asbeing L0 types, the mean action was 58. While intriguing, the approach adopted by Burchardiand Penczynski (2010) rests on a large number of intermediate hypotheses and on a novelversion of the guessing game. The method that we outline in this section is considerably easierto implement, and does not rely on subjective interpretations of verbal responses.
8The learning task we study is a variant of the “Monty Hall” game of Nalebuff (1987),Friedman (1998) and Avishalom and Bazerman (2003).
4

to play unfamiliar games by turning their structure over in their mind, as in the
Goeree and Holt (2004) model of “noisy introspection.” While economists have
studied many forms of learning, such as Bayesian updating, learning by doing,
and reinforcement learning, the SCP provides insight into a quite distinct form of
learning that involves no new external stimulus: “learning by thinking.” As such,
we see the experimental design as potentially informative whenever contempla-
tion time impacts play of the game. Grimm and Mengel (2010) have recently
shown that giving decision-makers additional time to decide in the ultimatum
game greatly lowers the rate of rejection of small offers.9 Dufwenberg, Sundaram
and Butler (2010) have studied games in which a moment of “epiphany” is needed
to identify a dominant strategy. The SCP methodology may provide insight in
many such settings in which strategic understanding evolves with contemplation
time.
2 Experimental Design
All of the experiments were run at the laboratory of the Center for Experimental
Social Science (CESS) at New York University. Subjects were drawn from the
general undergraduate population in the university by email solicitations. The
guessing game experiments themselves lasted about 10 minutes. Subjects in the
SCP treatment participated in an additional series of tasks, as detailed below.
Average payoffs were between 10 and 15 dollars.
In all treatments, subjects were first seated at their computer terminals, and
then given the experimental instructions, face down. Once all subjects received
their instructions, they were instructed that they could turn the sheets over
and the instructions were read out loud. Subjects did not communicate with one
another during the experiments. There was only a single play of the 2/3 guessing
9One possible reason for this is that the emotional effects of a disappointing offer are feltless sharply once they are internalized. This is a case in which the passage of time may changethe decision maker’s utility function.
5

game in each experiment. The precise experimental instructions differed across
treatments as indicated below.10
2.1 Standard Guessing Games
A key question is how play in the SCP treatment compares with that in time
constrained games of different durations. Unfortunately there are no definitive
results in the prior literature, so that our first experimental task was to analyze
play in such time constrained games.11 We therefore conducted standard guessing
games of 30 seconds and 180 seconds durations. In these games only the final
choice of each subject mattered for payment. The longer time of 180 seconds
was chosen since prior work suggests that it is enough time for most subjects to
reason through the game, while the shorter time was chosen to cut short such
reasoning. These Standard Experiments were included not only to gauge the
importance of decision time in the outcome of the game, but also to provide
benchmarks with which to compare the SCP treatment.
The rules of the game and the task were described as follows:
RULES OF THE GAME: A few days ago 8 undergraduate students like
yourselves played the following game. Each of the 8 students had 180
10Given our interest in how learning takes place in a novel one shot game, we droppedsubjects who reported being familiar with the game, whether in a lab, in a classroom or in anyother context. This familiarity was assessed in a questionnaire at the end of each session. Some25% of subjects had either played the game or heard of it. The remaining sample consists of188 subjects.
11Ho, Camerer and Weigelt (1998) set an experimental time limit of 2 minutes. Howeverthis was the maximum allowed time and not the time it took for subjects to actually respond.Bosch-Domenech, Montalvo, Nagel and Satorra (2002) report results of a five minute laboratoryexperiment, and of other experiments conducted more remotely (e.g. via newspaper) withresponse times of up to two weeks. Kocher and Sutter (2006) examined the effects of timepressure and incentive schemes on choices in repeated plays of the guessing game. Surprisingly,they did not find much difference in first round play for different time constraints. This maybe due to the fact that their subjects knew that they would repeat the game several times,and so would be able to change their decisions in later plays of the game. Using a distinctdesign, Rubinstein (2007) explored the connection between contemplation time and choice inthe context of an online version of the guessing game. There was no maximum time, but aserver recorded the time a subject took to submit the answer. He found that the focal L1 andL2 responses of 33 and 22 respectively took longer on average than other choices.
6

seconds to choose an integer between 1 and 100 inclusive, which they
wrote on a piece of paper. After 180 seconds, we collected the papers.
The winner was the person whose number was closest to two thirds of
the average of everyone’s numbers. That is, the 8 students played among
themselves and their goal was to guess two thirds of the average of every-
one’s numbers. The winner won $10 and in case of a tie the prize was split.
YOUR TASK: You will have 180(30) seconds to choose an integer be-
tween 1 and 100 inclusive. You win $10 if you are “better than” those 8
students at determining two thirds of the average of their numbers. That
is, you win $10 if your number is the closest to two thirds of the average
of the numbers in the past game.
The screen displayed 100 buttons, each representing an integer between 1
and 100 inclusive.12 Once the game started, subjects could select any number by
clicking on the button displaying it. Subjects could change their selected number
as many times as they wanted. Subjects could end the game earlier by clicking
on a “Finish” button. There was no difference between choosing a number and
staying with that number until the end of the game or instead clicking the Finish
button. In the Standard Experiment, it was only their final choice (at 30 seconds
or 180 seconds as specified in the instructions) that determined the participant’s
payoff from the game.13
Note that our experiment has the feature that a subject’s number is not
included in the average. This ensures that the corresponding SCP treatment
does not have additional equilibria. In technical terms, this makes the game
12It is common to allow also the choice of zero. Having the minimum choice be 1 simplifiesmatters in that the unique Nash equilibrium, identifiable by iterated elimination of dominatedstrategies, is for all to select 1. In contrast, when zero is included as an option, there aremultiple equilibria. It is also common to allow subjects to choose any real number, as opposedto integers. Our experimental apparatus - displaying all the possible choices on the screen- makes the restriction to integers a necessary one. The equilibrium is unchanged by thismodification.
13There was no incentive to finish early, since the game lasted the same amount of timeregardless.
7
analogous to a standard guessing game with a large number of participants (see
Bosch-Domenech et al. (2002)).14
2.2 SCP Treatment
While there was no change in the described rules of the game, what deter-
mined the subject’s payment in the SCP treatment was the subject’s choice at
a random time: in this treatment, it was the choice of a subject at a random
second that was compared to the choices of the 8 subjects that had played the
game previous to the experiment.
We took measures to ensure that subjects participating in SCP treatments
properly understood the incentive structure. Hence when they arrived in the lab
we described the experimental methodology to them before introducing them
to the guessing game. Appendix A contains the complete instructions for these
SCP sessions.
An important feature of the design was that failure to pick an option would
result in a certain payoff of zero. Hence subjects in the SCP treatment were
incentivized to make a quick and intuitive first estimate of two-thirds of the
average final number picked by the group that had played previously. Whenever
further reflection causes this best estimate to change, they were incentivized
immediately to make the corresponding change in their guess.15
After completing the 2/3rds guessing game, subjects in the SCP treatment
also played a series of other games: risk aversion elicitation, numeracy questions
and Cognitive Reflection Test as well as the Monty Hall game (all instructions
are in Appendix B).
14Formally: suppose the group size is n and a subject believes the average of the otherparticipants is x̄. If that subject’s number is counted in the average then that subject should
choose 2(n−1)x̄3n−2 so that as the group size gets larger and larger, this choice converges to (2/3)x̄,
which is what the subject should choose if his/her number were not counted in the average.15Because it was their choice at a random second that determined their payment, subjects
had the incentive to modify their choices as soon as they changed their mind.
8

3 Results
1: Time-Constrained Games
Table 1 and Figure 1 present the comparison between Standard and SCP exper-
iments. They strongly argue for the validity of SCP data as a measure of play
in multiple time-constrained games.
Figure 1: Histogram of Final Choices in the Standard and SCP Experiments
0.02
.04
.06
.08
.1.12
.14
Fraction
0 10 20 30 40 50 60 70 80 90 100Choice
(a) Standard Experiment - Choice at 30 Sec-onds
0.02
.04
.06
.08
.1.12
.14
Fraction
0 10 20 30 40 50 60 70 80 90 100Choice
(b) Standard Experiment - Choice at 180 Sec-onds
0.02
.04
.06
.08
.1.12
.14
Fraction
0 10 20 30 40 50 60 70 80 90 100Choice
(c) SCP Experiment - Choice at 30 Seconds
0.02
.04
.06
.08
.1.12
.14
Fraction
0 10 20 30 40 50 60 70 80 90 100Choice
(d) SCP Experiment - Choice at 180 Seconds
The final choices in the SCP treatments and standard guessing games of
equivalent horizons (at 30 and at 180 seconds) have strong similarities. A two-
sample Wilcoxon Ranksum (Mann-Whitney) test comparing the full distribution
9

of 30 second choices in the SCP and in the Standard Experiment shows that we
cannot reject the hypothesis that the two samples are from the same distribution
(p > 0.10). The same holds true when comparing the 180 second choices in the
SCP and Standard Experiments.16
Further, the results at 180 seconds in the SCP treatment and in the 180 sec-
ond standard treatment are similar to those reported in Nagel (1995) and Ho,
Camerer and Weigelt (1998).17 In Table 1 we report the measure of strategic
sophistication from the cognitive hierarchy model developed by Camerer, Ho and
Chong (2004).18
Table 1: Summary statistics of choices in Standard and SCP treatments. Comparisonwith Nagel (1995) and Ho, Camerer and Weigelt (1998).
# obs Mean Std. Dev. τBootstrap90% C.I.
30 second treatment 66 42.83 20.13 0.5 [0, 0.25]SCP at 30 seconds 60 41.68 19.95 0.6 [0, 0.31]
180 second treatment 62 36.35 20.24 1.1 [0.41, 1.33]SCP at 180 seconds 60 36.73 18.34 1.06 [0.45, 1.72]
Ho, Camererand Weigelt (’98) p = 0.7
69 38.9 NA 1 [0.5, 1.6]
Nagel (’95) p = 23
66 37.2 NA 1.1 [0.7, 1.5]
Conclusion 1: Play in the SCP experiment closely matches play from the cor-
responding time-constrained games.
16We get the same results when using a two-sample Kolmogorov-Smirnov test for equalityof distribution functions (p > 0.10).
17See Appendix D for more on the similarity in the data.18The process begins with Level 0 players, who are assumed to play according to a uni-
form distribution. Level k thinkers assume that the other players are distributed accordinga normalized Poisson distribution (with parameter τ) from Level 0 to Level k-1. Hence theycorrectly predict the relative frequencies of Levels 0 through k-1, but may incorrectly believethat they are the only player of Level k and that there are no players more sophisticated thanthey are. The estimation of τ involves finding the value of τ that minimizes the differencebetween the observed sample mean and the mean implied by τ . In Table 1 we report the bestfitting estimate of τ parameter as well as the 90% confidence interval for τ from a random-ized resampling (with replacement) bootstrap procedure, as done in Camerer, Ho and Chong(2004).
10

2: Strategic First Instincts and L0 Play
The SCP treatment was designed to provide us with information on each partic-
ipant’s strategic first thoughts. There were incentives for players to make quick
and instinctive choices as soon as the structure of the game was conveyed to
them. As described in section 2, they were introduced to the choice process in-
centive scheme before they learned the rules of the guessing game. Hence they
knew that failure to make an immediate choice was a dominated strategy. It was
made clear in the instructions that if they failed to make any selection at the
random stopping time their payoff would be set to zero. As a result, they had
every incentive to make a quick first choice rather than delaying to think more
deeply through the structure of the game.
Most subjects followed the SCP incentive and made their first choice in short
order. The median (and mode) first choice time was 6 seconds. By the 10th
second, 85% of our subjects had made a first choice.
One possible way to investigate L0 play is to look at subjects’ very first
choices. However, it is possible that the first choice may not indicate L0 play
but instead be a random “panicked” choice generated by our incentives to choose
a number quickly. Hence we consider two other measures of the first choice:
• We measure the Modified First Choice as the first choice if a subject stayed
on that number for at least five seconds, and otherwise the second choice,
which may, in this situation, be a better indication of L0 play.19
• We measure the First Non-Incentivized Choice of subjects in the Standard
Experiment with the 180 seconds time constraint. The advantage of using
this measure is that only the final choice of these subjects mattered for
payment, removing any grounds for making a thoughtless first selection.
Precisely because subjects had no incentive to record their first thoughts,
we only look at the first choices of those subjects that made their choice
19Application of a 10 second cutoff does not change the findings described below.
11

relatively early (within the first 20 seconds), since we are interested in the
initial thoughts rather than thought-through choices. There are 28 out of
62 such subjects (45% of our population).
Figure 2: Histogram of First Choices.
0.02
.04
.06
.08
.1.12
.14
Fraction
0 10 20 30 40 50 60 70 80 90 100Choice
(a) First Choice
0.02
.04
.06
.08
.1.12
.14
Fraction
0 10 20 30 40 50 60 70 80 90 100Choice
(b) Modified First Choice
0.02
.04
.06
.08
.1.12
.14
Fraction
0 10 20 30 40 50 60 70 80 90 100Choice
(c) First Non-Incentivized Choice
Figure 2 presents three histograms: the very first choices of subjects in the
SCP treatment, the Modified First Choices from the SCP treatment and the
First Non-Incentivized Choice from the 180 second Standard Experiment. Table
2 presents key statistics concerning these three measures of L0 play. Average play
is similar between all these three measures, though the significant difference in
the size of the spike at 100 between panels (a) and (b) suggests that it apparently
takes little time for most to realize that this is not the best choice.
As Table 2 and Figure 2 show, L0 choices are approximately uniform (in all
12

Table 2: Summary Statistics of First and Modified First Choices.
Mean Median St.Dev.Time of the Choice
mean (st dev)
First Choice 53.1 50 25.57 7.2 (4.75)
First ChoiceModified
50 50.9 21.9 8.1 (4.8)
First ChoiceNon-Incetivized
50.39 50 26.25 11.29 (4.61)
three measures), albeit with a noticeable spike at 50.20 The mean L0 choice is
close to 50,21 as are the median and mode. To a first approximation, our SCP
experiment provides support for the standard assumption that L0 types average
50.22
Conclusion 2: SCP data provides a new window into L0 play. In the 2/3
guessing game, L0 play averages 50.
3: Contemplation Time and Strategic Sophistication
Given that the SCP elicits subjects’ choices for the entire duration of the game,
it is well suited to study the dynamics of choices over time. Indeed, unlike other
methods (for example a series of standard one-shot games with various time
contraints) it produces data that has a panel structure.
Table 1 shows that average choices are significantly lower at 180 seconds
than at 30 seconds, both in the SCP and Standard Experiments (confirmed by
estimates of the τ parameter of Camerer, Ho, and Chong (2004)). According
to current theories, this implies that on average subjects advance in strategic
level as they have more time to think about the game. Figure 3 generalizes
20Figure 3(a) also has a spike at 100. While the number of subjects choosing 100 declines toalmost zero after three minutes, there are quite a few subjects who choose 50 even after thefull 3 minutes.
21A random sampling with replacement bootstrap procedure gives a mean first choice of 49.4and a 95% Confidence Interval for the mean of [42.5, 56.2].
22Our standard 180 second experiment provides further support for the identification ofaverage L0 choice as 50. Indeed, the average and median first choices in that experiment, forthose choices made within 30 seconds of the start of the game, are both close to 50.
13

Figure 3: Average Choices Over Time: Raw Data and Regressions35
45
55
Avera
ge C
hoic
e
0 50 100 150 200Time
95% CI Linear Reg.
Frac. Polynomial Reg. Average (Data)
(a) Average Choices Over Time
35
45
55
Avera
ge C
hoic
e
0 50 100 150 200Time
95% CI Linear Reg.
Frac. Polynomial Reg. Cummulative Average (Data)
(b) Cumulative Average Choices Over Time
this finding by plotting (1) average choices and (2) cumulative average choice
(average over current and past choices23) as a function of consideration time
in the SCP treatment. Regression analyses using both linear and fractional-
polynomial formulations confirm that average choices display diminishing time
trends. While Lk theory does not explicitly incorporate time, those with higher
cognitive levels are treated as reasoning further through the game. Hence one
might expect their choices to decrease over time.24 Note also that, in terms of
their performance in the guessing game, the students that played the game before
the Standard and SCP experiments had an average of 38, which makes 25 the
best choice in our SCP treatment. Hence average payoffs were increasing with
contemplation time along with strategic sophistication.
Conclusion 3: At the population level average choice decreases over time and
average payoffs increase. According to current theories, this suggests an increase
in average strategic sophistication with contemplation time.
23Recall that in the SCP treatment each of the 180 seconds has the same probability of beingchosen for payment. Therefore, the participant who chooses the same number X in all 180seconds can be seen as choosing X 180 times.
24The decreasing pattern is also present in the Standard 180 second experiment, despite thefact that in that treatment subjects were not incentivized to reveal intermediate thoughts.
14

4: Simple Best Response Dynamics
The simplest form of introspective reasoning by which a subject may advance in
type is based on best-responding to own past decision, which results in selecting
precisely 2/3 of the previous choice (a rapid learner might pick some power of
2/3 by skipping levels of reasoning). One subject (subject 31, see Figure 4) fit
this pattern precisely, moving from 50 to 33 to 22, and retaining this choice for
the remainder of the 180 seconds. In total, 8 out of 60 subjects at some point
display such two thirds thinking. Even though the percentage of such adjust-
ments is non-negligible, it is far from the dominant feature of our data.25
Figure 4: Two-thirds thinker - Subject 31.
020
40
60
80
100
Choice
0 50 100 150200Time
Conclusion 4: Simple best response dynamics is not a dominant feature of the
data.
5: Individual Differences
The existing experimental literature on the guessing game suggests that there
is little correlation in level classifications across games when classifications are
based only on final choices. There is some evidence that at the population level
25All paths of choices are in Appendix F.
15
the distribution of types across games may be stable (see for example Camerer,
Ho and Chong (2004)). At the individual level, Georganas, Healy and Weber
(2010) find that though there is a correlation of levels within guessing games,
choices in the guessing games fail to correlate with behavior outside the guessing
game family. Burchardi and Penczynski (2010) reach similar conclusions.
One possible reason for the failure of types defined by level of reasoning to
generalize is that they do not adequately summarize strategies, particularly when
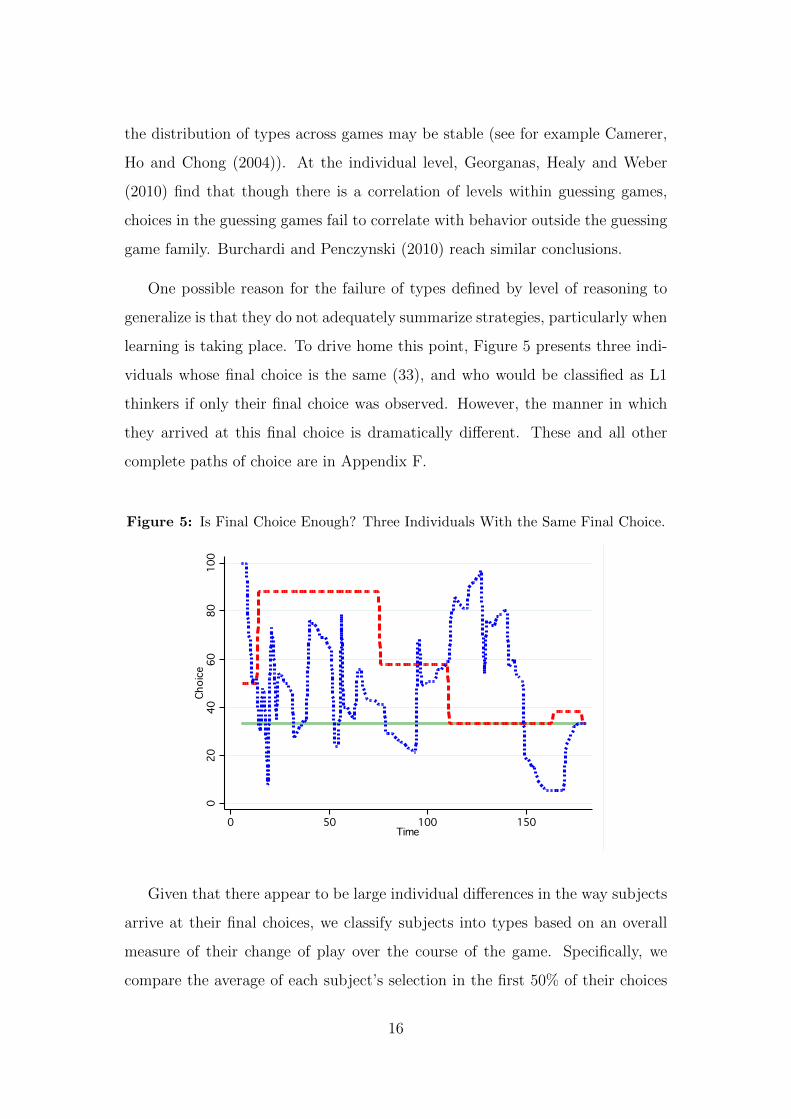
learning is taking place. To drive home this point, Figure 5 presents three indi-
viduals whose final choice is the same (33), and who would be classified as L1
thinkers if only their final choice was observed. However, the manner in which
they arrived at this final choice is dramatically different. These and all other
complete paths of choice are in Appendix F.
Figure 5: Is Final Choice Enough? Three Individuals With the Same Final Choice.
020
40
60
80
100
Choice
0 50 100 150200Time
Given that there appear to be large individual differences in the way subjects
arrive at their final choices, we classify subjects into types based on an overall
measure of their change of play over the course of the game. Specifically, we
compare the average of each subject’s selection in the first 50% of their choices
16

with the corresponding average over their remaining choices.26 We use this com-
parison to define three behavioral types, as follows:
• Constant: Those for whom the 2nd half average is within 20% of the 1st
half average: there are 34 such subjects (56.7% of the population).27
• Decreasing: Those for whom the 2nd half average is 20% or more below
the 1st half average: there are 18 such subjects (30% of the population).
• Increasing: Those for whom the 2nd half average is 20% or more above
the 1st half average: there are 8 such subjects (13.3% of the population).
Table 3: Summary Statistics for the three behavioral types.
Constant Decreasing Increasing
Time of first choice 7.73 sec 6.72 sec 6 sec
First choice (mean) 50.88 56.61 54.75
1st half average 43.51 50.36 41.92
2nd half average 44.08 25.40 60.11
Last choice (mean) 38.68 24.1 57
Note that early choices differ little across these behavioral types.28 As a result,
the average final choices are lowest for the Decreasing types, while those for the
increasing types are highest. Statistical tests on the final choices of the Constant,
Decreasing and Increasing types shows that pairwise these behavioral types are
statistically different.29 Given that the players in the prior game averaged 38,
26This prescription is exact for an individual who makes an odd number of switches, for whomwe compare the average number associated with the first half with the corresponding averagein the second half, weighting by the amount of time spent on each number. With an evennumber of switches we arbitrarily assign the additional choice to the first half (this distinctionis irrelevant in practice). Normalizing the change in average play by the standard deviation ofchoices to incorporate a measure of the volatility of play generate the same qualitative results.
27The qualitative results do not change if we use cutoffs of 10, 15, 25 or 30% instead of 20%.28Further, types do not differ in their risk attitudes, their numeracy abilities or scores on
the CRT test. See Appendix C for more details.29The ranksum test p-values are 0.0019 for the test on the Decreasing type versus Constant,
0.0007 for Decreasing versus Increasing and 0.0292 for Constant versus Increasing. The p-values are similar for the Kolmogorov-Smirnov test. Thus we can reject the null that thepairwise comparison come from identical distributions.
17

table 3 shows the Decreasing group performed better than others in the SCP
treatment.30
Our experiment provides intriguing evidence suggesting that these behavioral
types may be informative concerning broader learning abilities. In the Monty
Hall game, appropriate updating implies that the respondent should switch
doors, yet it is intuitively plausible that it is equally good to stick with the
initial choice. In our data some 44% of the Decreasing type switch door, while
fewer than 20% of those who are not Decreasing types so switch.31 In intuitive
terms, this suggests that Decreasing types may be better than others at incorpo-
rating new information, whether this information results from internal reflection
or a change in the information set on which to base a decision.32
Conclusion 5: Individual differences in learning during the process of contem-
plation may be more informative about choices in other settings than are differ-
ences in final choices.
4 Conclusions
We introduced a new experimental protocol to provide information on provisional
choices in games, and hence the process of strategic decision-making. We im-
plemented our SCP treatment in the 2/3 guessing game. We identified a strong
connection between time constrained play and play at the corresponding time
in the SCP experiment. We found first choices to average close to 50, match-
ing the standard assumption concerning L0 play. While average choices indicate
30Recall that at the population level, L0 play averages 50 and average choices decrease overtime, providing some support of Lk and CH models. However, at the individual level, whilenot negligible, only 30% of subjects show what would be increasing sophistication accordingto those theories. The decrease in choices at the population level is due to this 30% minority.
31A test of proportions confirms that this difference is significant. The two-sided p-value forthe test of proportion is 0.0415, rejecting the null that the probability of switching door is thesame for both the people in the Decreasing group and for those not in the Decreasing group.For more evidence see Appendix E.
32Final choice, on the other hand, does not predict behavior in the Monty Hall game. Formore evidence see Appendix E.
18

an increase in strategic sophistication as time progresses, we identified signifi-
cant individual heterogeneity in this regard. This heterogeneity appears to be
informative concerning the ability to update according to Bayes’ rule.
We conclude that SCP data provide significant insight into the process of
choice in unfamiliar games. While we have in the current paper focused on the
impact of contemplation time on strategic sophistication, there may be other
factors that impact strategic choice and that evolve over time, such as emotions
toward other players in the game. The SCP method can provide insight into
many situations of this form, capturing as it does the evolution of perceived
optimal decisions as time passes.
19
References
[1] Avishalom, Tor, and Max Bazerman. 2003. “ Focusing Failures in Compet-
itive Environments: Explaining Decision Errors in the Monty Hall Game,
the Acquiring a Company Problem, and Multi-Party Ultimatums.” Journal
of Behavioral Decision Making, 16: 353-374.
[2] Bosch-Domenech, Antoni, Montalvo, Jose, Nagel, Rosemarie, and Albert
Satorra. 2002. “ One, Two, (Three), Infinity, . . . : Newspaper and Lab
Beauty-Contest Experiments.” The American Economic Review, 92 (5):
1687-1701.
[3] Burchardi, Konrad, and Stefan Penczynski. 2010. “ Out of Your Mind:
Eliciting Individual Reasoning in One Shot Games.” Working Paper.
http://personal.lse.ac.uk/burchark/research/levelk 100413.pdf
[4] Burks, Stephen, Carpenter, Jeffrey, Gotte, Lorenz, Monaco, Kristen, Porter,
Kay, and Aldo Rustichini. 2008. “ Using Behavioral Economic Field Exper-
iments at a Firm: The Context and Design of the Truckers and Turnover
Project.” In The Analysis of Firms and Employees: Quantitative and Qual-
itative Approaches, ed. Bender, Lane, Shaw, Andersson, and Von Wachter.
NBER, University of Chicago Press.
[5] Camerer, Colin, Ho, Teck-Hua, and Juin-Kuan Chong. 2004. “ A Cognitive
Hierarchy Model of Games.” The Quarterly Journal of Economics, 119(3):
861-898.
[6] Caplin, Andrew, and Mark Dean. 2010 (forthcoming). “ Search, Choice, and
Revealed Preference.” Theoretical Economics.
[7] Caplin, Andrew, Dean, Mark, and Daniel Martin. 2010. “ Search and Sat-
isficing.” American Economic Review, forthcoming.
20

[8] Chen, Chun-Ting, Huang, Chen-Ying, and Joseph Wang. 2010. “ A Window
of Cognition: Eyetracking the Reasoning Process in Spatial Beauty Contest
Games.” Working Paper.
[9] Coricelli, Giorgio, and Rosemarie Nagel. 2009. “ Neural correlates of depth of
strategic reasoning in medial prefrontal cortex.” Proceedings of the National
Academy of Sciences (PNAS): Economic Sciences, 106(23): 9163-9168.
[10] Costa-Gomes, Miguel, Crawford, Vincent, and Bruno Broseta. 2001. “ Cog-
nition and Behavior in Normal-Form Games: An Experimental Study.”
Econometrica, 69(5): 1193-1235.
[11] Costa-Gomes, Miguel, and Vincent Crawford. 2006. “ Cognition and Behav-
ior in Two-Person Guessing Games: An Experimental Study.” The Ameri-
can Economic Review, 96(5): 1737-1768.
[12] Crawford, Vincent. 2008. “ Look-ups as the Windows of the Strategic Soul:
Studying Cognition via Information Search in Game Experiments.” In The
Foundations of Positive and Normative Economics, ed. Andrew Caplin and
Andrew Schotter. New York: Oxford University Press.
[13] Dickinson, David, and Todd McElroy. 2009. “ Naturally-occurring sleep
choice and time of day effects on p-beauty contest outcomes.” Working
Papers 09-03, Department of Economics, Appalachian State University.
[14] Duffy, John and Rosemarie Nagel. 1997. “ On the robustness of behavior in
d experimental beauty-contest games.” Economic Journal, 107: 1684-1700.
[15] Dufwenberg, Martin, Sundaram, Ramya and David J. Butler. 2010.
“Epiphany in the Game of 21.” Journal of Economic Behavior & Orga-
nization, 75: 132-143.
[16] Friedman, Daniel. 1998. “ Monty Hall’s Three Doors: Construction and
Deconstruction of a Choice Anomaly.” The American Economic Review,
88(4): 933-946.
21

[17] Friedman, Daniel and Ryan Oprera. 2009. “A Continuous Dilemma.” Work-
ing Paper.
[18] Georganas, Sotiris, Healy, Paul J. and Roberto Weber. 2010. “ On the per-
sistence of strategic sophistication.” Working Paper.
[19] Goeree, Jacob, and Charles Holt. 2004. “ A Model of Noisy Introspection.”
Games and Economic Behavior, 46(2): 365-382.
[20] Grimm, Veronika, and Friederike Mengel. 2010. “Let me sleep on it: Delay
reduces rejection rates in Ultimatum Games”. Working Paper.
[21] Grosskopf, Brit and Rosemarie Nagel. 2008. “The Two-Person Beauty Con-
test,” Games and Economic Behavior, 62 (2008) 93 DH 99.
[22] Holt, Charles, and Susan Laury. 2002. “ Risk Aversion and Incentive Effects”
The American Economic Review, 92: 1644-1655.
[23] Ho, Teck-Hua, Camerer, Colin, and Keith Weigelt. 1998. “ Iterated Dom-
inance and Iterated Best-response in p-Beauty Contests.” The American
Economic Review, 88: 947-969.
[24] Kahneman, Daniel, and Amos Tversky. 1972. “ Subjective probability: A
judgment of representativeness.” Cognitive Psychology 3: 430-454.
[25] Kocher, Martin, and Matthias Sutter. 2006. “ Time is money - Time pres-
sure, incentives, and the quality of decision-making.” Journal of Economic
Behavior and Organization, 61(3): 375-392.
[26] Nagel, Rosemarie. 1995. “ Unraveling in Guessing Games: An Experimental
Study.” The American Economic Review, 85(5): 1313-1326.
[27] Nalebuff, Barry. 1987. “ Puzzles: Choose a Curtain, Duel-ity, Two Point
Conversions, and More.” The Journal of Economic Perspectives, 1(2): 157-
163.
22

[28] Rubinstein, Ariel. 2007. “ Instinctive and Cognitive Reasoning: A Study of
Response Times.” Economic Journal, 117: 1243-1259.
[29] Samuelson, William, and Richard Zeckhauser. 1988. “ Status Quo Bias in
Decision Making.” Journal of Risk and Uncertainty, 1: 7-59.
[30] Sbriglia, Patrizia. 2004. “Revealing the depth of reasoning in p-beauty con-
test games.” Working Paper.
[31] Stahl, Dale. 1996. “ Boundedly Rational Rule Learning in a Guessing
Game.” Games and Economic Behavior, 16: 303-330.
[32] Stahl, Dale, and Paul Wilson. 1995. “ On Players Models of Other Players:
Theory and Experimental Evidence.” Games and Economic Behavior, 10(1):
218-254.
[33] Weber, Roberto. 2003. “ Learning with no feedback in a competitive guessing
game.” Games and Economic Behavior, 44(1): 134-144.
23

A Instructions for the Choice Process Experi-
ment
We will start with a brief instruction period. If you have any questions during
this period, raise your hand. Experiment consists of two parts. You will be
given instructions for the next part of the experiment once you finished this
part. Anything you earn in the experiment will be added to your show-up fee of
$7.
PART I
We will start by describing what kinds of decisions you will be making
in this game. We will then describe the rules of the game and the
payments in this game.
Your task in this game is to choose a number from those presented on the
screen.
The game lasts 180 seconds. At the top right corner of the screen you can see
how many seconds are left. At the bottom right corner of the screen there is
a “Finished” button. The rest of the screen is filled with buttons representing
integer numbers between 1 and 100. They are arranged in decreasing order.
When the game starts, you can select the number by clicking on the button
displaying the number that you want. You may click when you want, however
many times you want.
The computer will record all the numbers you click on, as well as when
you clicked on them.
After 180 seconds, or when you click the finish button, the round will come to an
end and you won’t be able to change your choice anymore. Just to make clear, if
you choose a number and then stay with that number until the end, or instead
decide to click on the “Finish” button, it will make no difference.
24

Only one of the numbers you selected will matter for payment. To determine
which one, the computer will randomly choose a second between 0 and 180, each
second is equally likely to be chosen. The number you selected at that time will
be the one that matters. We will call this number “Your Number.” Below are
two examples.
Example 1
Suppose you chose the button 100 for seconds 0 to 180. Suppose the computer
randomly selects second 13 to be the random second.
Since at second 13 you were at button 100, 100 is “Your Number”.
Example 2
Suppose that after 10 seconds you selected the button 62. Suppose then that
at second 55 you switched to button 40. Suppose that then at second 90 you
switched to button 89 and then clicked on the Finish button.
In this case “Your Number” would be:
• if the computer randomly chooses a number between 0 and 9 seconds: none.
• if the computer randomly chooses a number between 10 and 54 seconds:
62
• if the computer randomly chooses a number between 55 and 89 seconds:
50
• if the computer randomly chooses a number between 90 and 180 seconds:
89
These examples are completely random and do not represent a hint at what you
ought to do in this experiment. Note: once a button is clicked on, it becomes
highlighted and you do not need to click on it again as it is already selected.
25
If you have not yet made a selection at the random second the computer chooses,
then you cannot win this game.
Also, understand that if at any point you prefer a different number to the one
you currently have selected, you should change the button you selected as this
would reduce the chances of the less preferred number being recorded as “Your
Number.”
The Structure of the Game
A few days ago 8 undergraduate students like yourselves played a game. Your
payoff is tied to the choices made by those 8 students, so you need to understand
the game they played. We will now distribute the rules of the game these 8
students played and the rules of the game you will be playing.
Your payoff will not depend on the choices made by the people in this room. It
depends only on your choice and the choices these 8 students made a few days
ago.
[Distribute the second set of instructions face down now. Wait for all
to receive a copy. Read it out loud.]
The PAST game the 8 people played:
Each of the 8 students had 180 seconds to choose an integer between 1 and 100
inclusive, which they wrote on a piece of paper. After 180 seconds, we collected
the papers. The winner was the person whose number was closest to two thirds
of the average of everyone’s numbers. That is, the 8 students played among
themselves and their goal was to guess two thirds of the average of everyone’s
numbers.
The winner won $10 and in case of a tie the prize was split.
The game YOU will be playing now:
You will have 180 seconds to choose an integer between 1 and 100 inclusive. You
26

win $10 if you are ”better than” those 8 students at determining two thirds of
the average of their numbers. That is, you win $10 if Your Number is the
closest to two thirds of the average of the numbers in the past game.
At any point, it is in your best interest to select the button correspond-
ing to what you think is two thirds of the average of the numbers in
the past game.
[Game starts right away.]
27
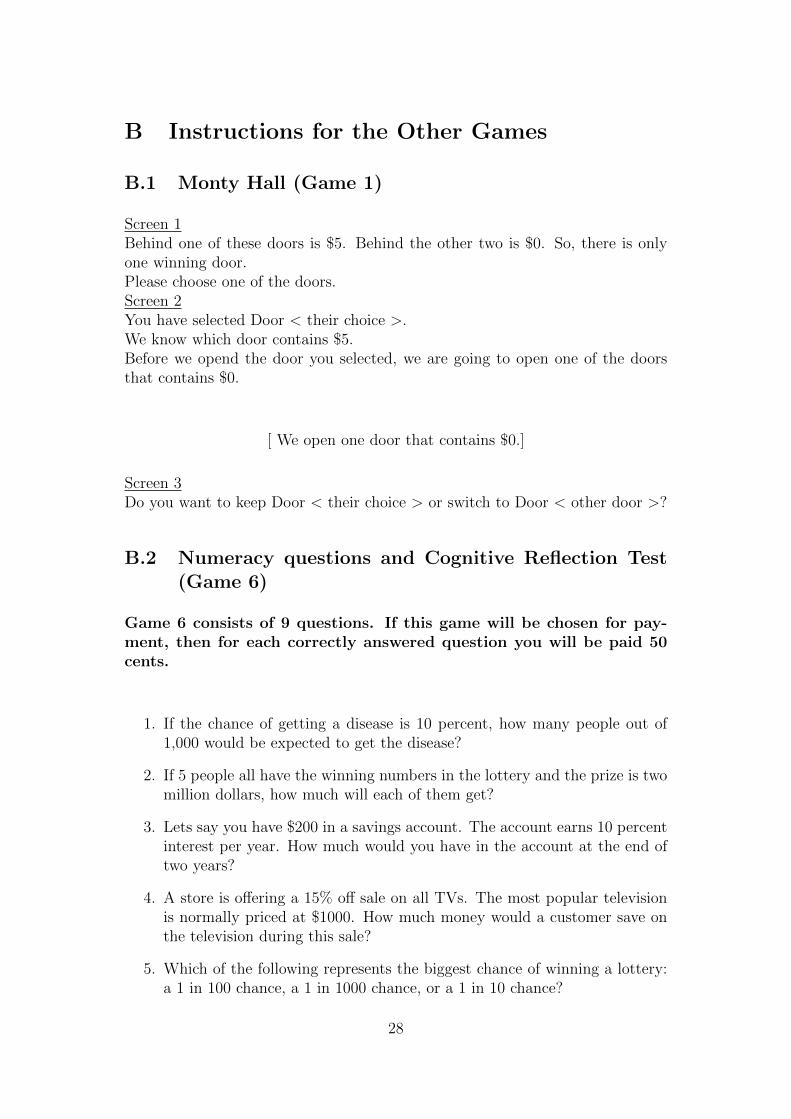
B Instructions for the Other Games
B.1 Monty Hall (Game 1)
Screen 1Behind one of these doors is $5. Behind the other two is $0. So, there is onlyone winning door.Please choose one of the doors.Screen 2You have selected Door < their choice >.We know which door contains $5.Before we opend the door you selected, we are going to open one of the doorsthat contains $0.
[ We open one door that contains $0.]
Screen 3Do you want to keep Door < their choice > or switch to Door < other door >?
B.2 Numeracy questions and Cognitive Reflection Test(Game 6)
Game 6 consists of 9 questions. If this game will be chosen for pay-ment, then for each correctly answered question you will be paid 50cents.
1. If the chance of getting a disease is 10 percent, how many people out of1,000 would be expected to get the disease?
2. If 5 people all have the winning numbers in the lottery and the prize is twomillion dollars, how much will each of them get?
3. Lets say you have $200 in a savings account. The account earns 10 percentinterest per year. How much would you have in the account at the end oftwo years?
4. A store is offering a 15% off sale on all TVs. The most popular televisionis normally priced at $1000. How much money would a customer save onthe television during this sale?
5. Which of the following represents the biggest chance of winning a lottery:a 1 in 100 chance, a 1 in 1000 chance, or a 1 in 10 chance?
28

6. If a customer saved $10 off a $1000 chair, what percent would the customerhave saved off the original price?
7. A bat and a ball cost $1.10 in total. The bat costs $1.00 more than theball. How much does the ball cost?
8. If it takes 5 machines 5 minutes to make 5 widgets, how long would it take100 machines to make 100 widgets?
9. In a lake, there is a patch of lily pads. Every day, the patch doubles in size.If it takes 48 days for the patch to cover the entire lake, how long would ittake for the patch to cover half of the lake?
B.3 Risk Attitudes (Game 7)
In game 7 you will have 10 questions. In each question (row), youwill be asked to choose Lottery A or Lottery B. If this Game will bechosen for payment, then one of the questions (rows) will be chosenat random and the Lottery that you chose will be played out for you.
Option A Option B Your Choice
1/10 of $2 and 9/10 of $1.60 1/10 of $3.85 and 9/10 of $0.102/10 of $2 and 8/10 of $1.60 2/10 of $3.85 and 8/10 of $0.103/10 of $2 and 7/10 of $1.60 3/10 of $3.85 and 7/10 of $0.104/10 of $2 and 6/10 of $1.60 4/10 of $3.85 and 6/10 of $0.105/10 of $2 and 5/10 of $1.60 5/10 of $3.85 and 5/10 of $0.106/10 of $2 and 4/10 of $1.60 6/10 of $3.85 and 4/10 of $0.107/10 of $2 and 3/10 of $1.60 7/10 of $3.85 and 3/10 of $0.108/10 of $2 and 2/10 of $1.60 8/10 of $3.85 and 2/10 of $0.109/10 of $2 and 1/10 of $1.60 9/10 of $3.85 and 1/10 of $0.1010/10 of $2 and 0/10 of $1.60 10/10 of $3.85 and 0/10 of $0.10
29
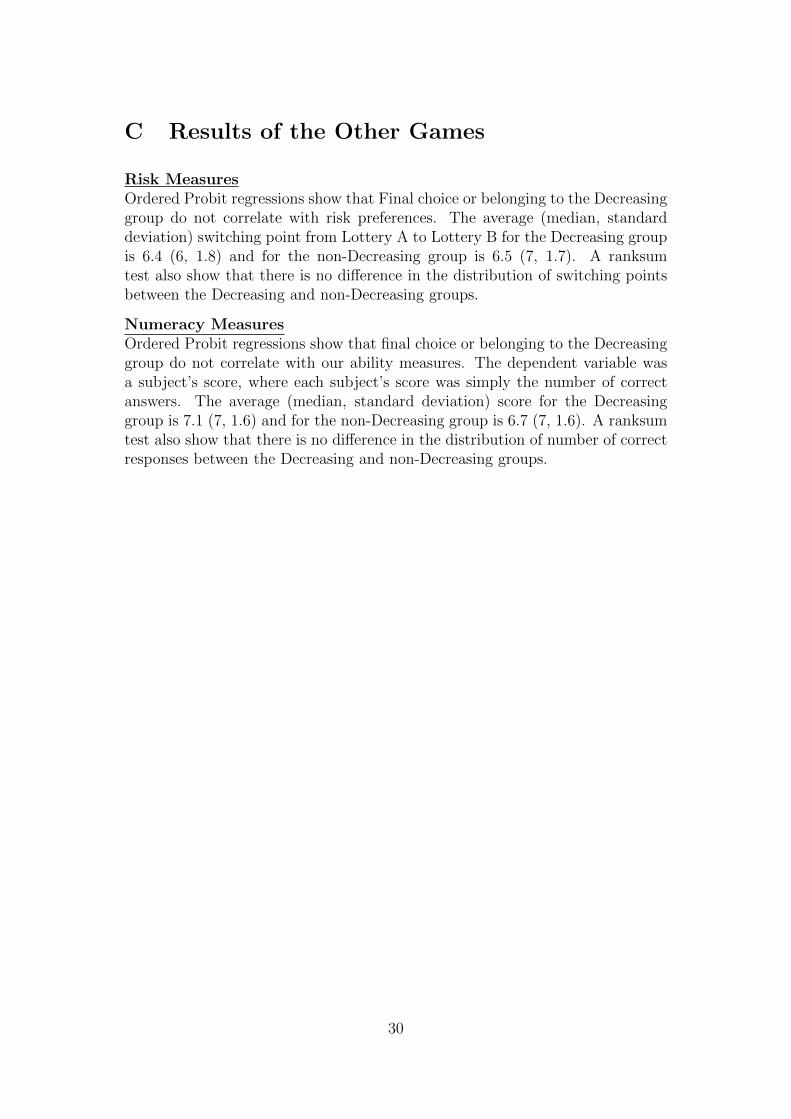
C Results of the Other Games
Risk MeasuresOrdered Probit regressions show that Final choice or belonging to the Decreasinggroup do not correlate with risk preferences. The average (median, standarddeviation) switching point from Lottery A to Lottery B for the Decreasing groupis 6.4 (6, 1.8) and for the non-Decreasing group is 6.5 (7, 1.7). A ranksumtest also show that there is no difference in the distribution of switching pointsbetween the Decreasing and non-Decreasing groups.
Numeracy MeasuresOrdered Probit regressions show that final choice or belonging to the Decreasinggroup do not correlate with our ability measures. The dependent variable wasa subject’s score, where each subject’s score was simply the number of correctanswers. The average (median, standard deviation) score for the Decreasinggroup is 7.1 (7, 1.6) and for the non-Decreasing group is 6.7 (7, 1.6). A ranksumtest also show that there is no difference in the distribution of number of correctresponses between the Decreasing and non-Decreasing groups.
30

D Additional Results on the Comparison Be-
tween the Standard Experiments and Nagel
(1995) and Ho, Camerer and Weiglet (1998)
In Table 4 we report summary statistics for the 30 and 180 second treatments ofthe standard 2/3 guessing game experiments. We include corresponding statisticsfrom the classical experiments of Nagel (1995) and Ho, Camerer and Weiglet(1998).
mean choice st deviation # of obs
Standard Experiment30 sec. treatment
42.83 20.13 66
Standard Experiment180 sec. treatment
36.35 20.24 62
Nagel (1995) 37.2 20 66
Ho, Camerer & Weiglet (1998) 38.9 24.7 69
Table 4: Summary Statistics of the final choices in the Standard Experiment
As Table 4 shows, the results for the Standard Experiment 180 second treat-ment are close to standard results from previous experiments. However theresults for the Standard Experiment 30 second treatment are substantially dif-ferent, as further indicated by the histograms in Figures 2(a) and 2(b). Theaverage and median choices are higher in the 30 second treatment than in the180 second treatment.
We measure strategic sophistication in our Standard Experiments using twodistinct techniques: that of Nagel (1995) and that of Camerer, Ho and Chong(2004). In Table 5 we report the classification of final choices according to Nagel’stechnique in the 30 and 180 seconds treatments and compare it to that obtainedby Nagel (1995) in her original experiments.33 The results show that the dis-tribution of types after 180 seconds is very similar to the distribution of typesobtained by Nagel (1995), while the distribution of types after 30 and after 180seconds is significantly different, with more sophisticated choices observed in thelonger treatment (180 seconds).
Note that when there is more time to decide, more subjects are captured bythe Nagel classification. This supports the claim that choices are more sophisti-cated as time goes by: being closer to uniform, many early choices fall outsidethe relevant intervals.34
33The estimates from Camerer, Ho and Chong (2004) are in Table 1.34Nagel’s classification starts from the premise that Level 0 players choose 50. Nagel then
constructs neighborhood intervals of 50pn, where p is the multiplier used in the game (p = 23 in
our case) and n represents the level of reasoning (n = 0, 1, 2, ...). The numbers that fall betweentwo neighborhood intervals of 50pn+1 and 50pn are called interim intervals. To determine the
31

Standard Experiment30 sec. treatment
Standard Experiment180 sec. treatment
5 minutesNagel (1995)
L0 15.2% 9.7 % 7.5%L1 13.6% 25.8% 26%L2 10.6% 17.7% 24%L3 4.6% 8.1% 2%
% capturedby L0-L3 definition
43.9% 63.3% 59.9%
Table 5: Distribution of types (Nagel) in the Standard and Nagel (1995) Experiments.
E Monty Hall: Probit and Marginal Effects Re-
gressions
Regression 1 Regression 2 Regression 3 Regression 4
Decreasing −0.7364∗∗(0.371) −2.8739∗∗∗ (1.087)Dec. × Final Choice 0.0899∗∗ (0.0427)Final choice 0.0128(0.009) -0.0054 (0.0117)Level 1 (Nagel) 0.4745(0.682)Level 2 (Nagel) −0.6980(0.572)Constant 0.1680(0.366) 0.9085∗∗(0.440) 0.8761∗∗(0.223) 1.108∗∗ (.5541)
# of obs 60 35 60 60Log Likelihood −33.8016 −16.8079 −32.8156 -29.4435Pseudo R2 0.0285 0.1066 0.0569 .1538
Coefficient and standard deviation is reported in the parenthesis∗∗ - significant at 5% ∗∗∗ - significant at 1%
Table 6: Predicting behavior in the Monty Hall Game.
Regression 3 x̄ Regression 4 x̄
Decreasing −0.2540∗∗(0.132) .3 −.846∗∗∗ (.165) .3Dec. × Final Choice 0.028∗∗ (0.0132) 7.21Final choice -0.0017 (0.004) 36.73
Coefficient and standard deviation is reported in the parenthesis∗∗ − significant at 5% ∗∗∗ − significant at 1%
Table 7: Predicting behavior in the Monty Hall Game.
Table 6 below presents the results of four Probit regressions from the Monty
boundaries of adjacent intervals a geometric mean is used. Thus the neighborhood interval of50pn have boundaries of 50pn+ 1
4 and 50pn−14 rounded to the nearest integers. The exception is
Level 0, which is truncated at 50. Nagel classifies as Level 0 choices between 45 and 50, Level1 those between 30 and 37, Level 2 between 20 and 25, and Level 3 those between 13 and 16.
32

Hall game. The dependent variable yi equals 1 if participant i kept the initially
chosen door and 0 otherwise. Regression 1 and 2 use final choice and Nagel’s
types as independent variables, respectively.35 In Regression 3, the independent
variable is a dummy equal to 1 if a subject is classified as a Decreasing type. In
Regression 4, we add the interaction between final choice and Decreasing type
as an independent variable.36
Table 6 clearly shows that the regressions that uses our behavioral types
as predictors have statistically significant coefficients. In other words, the final
choice of subjects in the guessing game does not correlate with behavior in the
Monty Hall game. However, as apparent from Regression 3, belonging to the
Decreasing type is a predictor of play in the Monty Hall game. Further, in-
dividuals who belong to that category are more than twice as likely to switch
doors after they receive new information on which door does not contain the
prize money.37 Regression 4 shows that adding the interaction term does not
change the significance or the sign of the coefficient in front of the “Decreasing”
dummy. The positive sign of the coefficient of the interaction term shows that
among those who are in the decreasing group, those who end up with a lower fi-
nal choice are also more likely to switch door. Marginal effects probit regressions
(for Regressions 3 and 4) are in Table 7.
35Regression 2 uses dummy variables for the L1 and L2 types as defined by Nagel (1995),leaving the L0 type as the control group. There was only one subject in the L3 category. Thisobservation was dropped from the analysis. See Appendix D for more on the Nagel (1995)types.
36As mentioned in Section 3, using a definition for decreasing in which the change in averagechoice is normalized by the standard deviation of choices yields the same results. This is alsotrue if we use a 10, 15, 20 or 30% cutoff for the definition of Decreasing. In addition, using thecontinuous measure of the percentage average change over the two halves of the game confirmsthe significance of the path rather than the final choice in explaining behavior in the MontyHall game. All of these results are available from the authors upon request.
37In the data, some 44% of those who belong to the Decreasing type switch door, whilefewer than 20% of those who do not belong to the Decreasing group switch door. A test ofproportions confirms that this difference is significant. The two-sided p-value for the test ofproportion is 0.0415, rejecting the null that the probability of switching door is the same forboth the people in the Decreasing group and for those not in the Decreasing group.
33

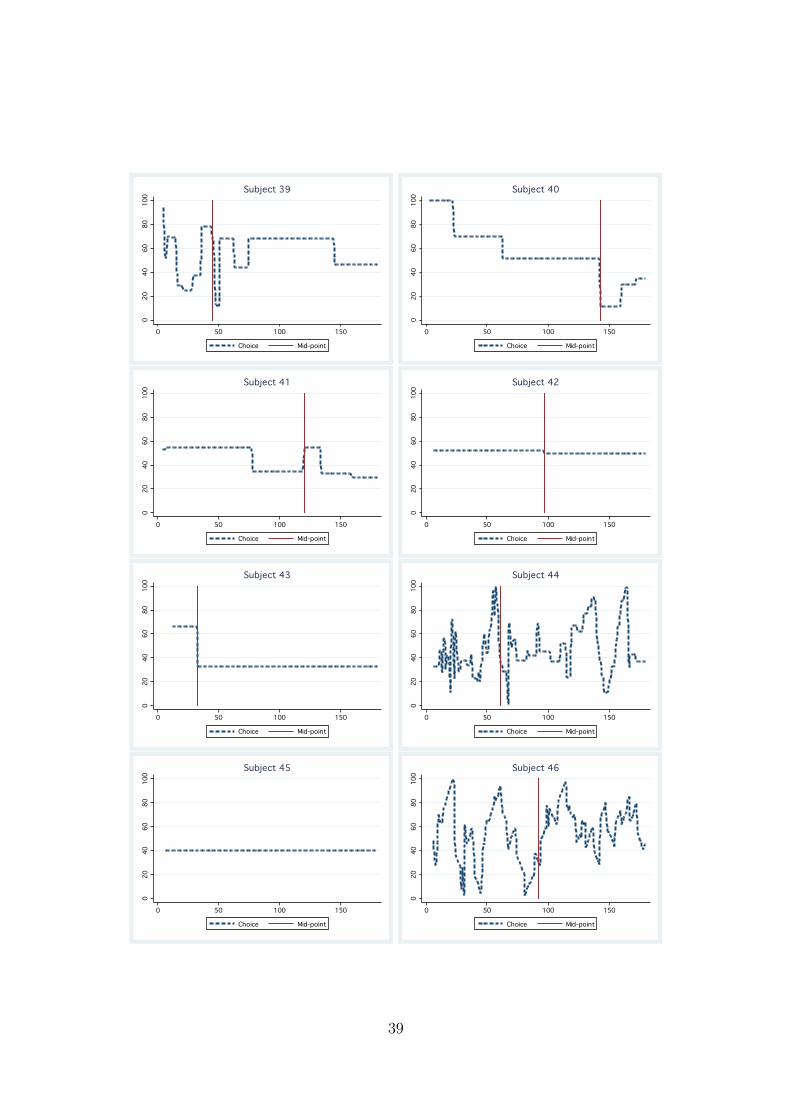
F Individual Paths0
20
40
60
80
100
0 50 100 150200
Choice Mid-point
Subject 1
020
40
60
80
100
0 50 100 150200
Choice Mid-point
Subject 2
020
40
60
80
100
0 50 100 150200
Choice Mid-point
Subject 30
20
40
60
80
100
0 50 100 150200
Choice Mid-point
Subject 4
020
40
60
80
100
0 50 100 150200
Choice Mid-point
Subject 5
020
40
60
80
100
0 50 100 150200
Choice Mid-point
Subject 6
34

020
40
60
80
100
0 50 100 150200
Choice Mid-point
Subject 7
020
40
60
80
100
0 50 100 150200
Choice Mid-point
Subject 8
020
40
60
80
100
0 50 100 150200
Choice Mid-point
Subject 9
020
40
60
80
100
0 50 100 150200
Choice Mid-point
Subject 10
020
40
60
80
100
0 50 100 150200
Choice Mid-point
Subject 11
020
40
60
80
100
0 50 100 150200
Choice Mid-point
Subject 12
020
40
60
80
100
0 50 100 150200
Choice Mid-point
Subject 13
020
40
60
80
100
0 50 100 150200
Choice Mid-point
Subject 14
35

020
40
60
80
100
0 50 100 150200
Choice Mid-point
Subject 15
020
40
60
80
100
0 50 100 150200
Choice Mid-point
Subject 16
020
40
60
80
100
0 50 100 150200
Choice Mid-point
Subject 17
020
40
60
80
100
0 50 100 150200
Choice Mid-point
Subject 18
020
40
60
80
100
0 50 100 150200
Choice Mid-point
Subject 19
020
40
60
80
100
0 50 100 150200
Choice Mid-point
Subject 20
020
40
60
80
100
0 50 100 150200
Choice Mid-point
Subject 21
020
40
60
80
100
0 50 100 150200
Choice Mid-point
Subject 22
36

020
40
60
80
100
0 50 100 150200
Choice Mid-point
Subject 23
020
40
60
80
100
0 50 100 150200
Choice Mid-point
Subject 24
020
40
60
80
100
0 50 100 150200
Choice Mid-point
Subject 25
020
40
60
80
100
0 50 100 150200
Choice Mid-point
Subject 26
020
40
60
80
100
0 50 100 150200
Choice Mid-point
Subject 27
020
40
60
80
100
0 50 100 150200
Choice Mid-point
Subject 28
020
40
60
80
100
0 50 100 150200
Choice Mid-point
Subject 29
020
40
60
80
100
0 50 100 150200
Choice Mid-point
Subject 30
37

020
40
60
80
100
0 50 100 150200
Choice Mid-point
Subject 31
020
40
60
80
100
0 50 100 150200
Choice Mid-point
Subject 32
020
40
60
80
100
0 50 100 150200
Choice Mid-point
Subject 33
020
40
60
80
100
0 50 100 150200
Choice Mid-point
Subject 34
020
40
60
80
100
0 50 100 150200
Choice Mid-point
Subject 35
020
40
60
80
100
0 50 100 150200
Choice Mid-point
Subject 36
020
40
60
80
100
0 50 100 150200
Choice Mid-point
Subject 37
020
40
60
80
100
0 50 100 150200
Choice Mid-point
Subject 38
38
020
40
60
80
100
0 50 100 150200
Choice Mid-point
Subject 39
020
40
60
80
100
0 50 100 150200
Choice Mid-point
Subject 40
020
40
60
80
100
0 50 100 150200
Choice Mid-point
Subject 41
020
40
60
80
100
0 50 100 150200
Choice Mid-point
Subject 42
020
40
60
80
100
0 50 100 150200
Choice Mid-point
Subject 43
020
40
60
80
100
0 50 100 150200
Choice Mid-point
Subject 44
020
40
60
80
100
0 50 100 150200
Choice Mid-point
Subject 45
020
40
60
80
100
0 50 100 150200
Choice Mid-point
Subject 46
39

020
40
60
80
100
0 50 100 150200
Choice Mid-point
Subject 47
020
40
60
80
100
0 50 100 150200
Choice Mid-point
Subject 48
020
40
60
80
100
0 50 100 150200
Choice Mid-point
Subject 49
020
40
60
80
100
0 50 100 150200
Choice Mid-point
Subject 50
020
40
60
80
100
0 50 100 150200
Choice Mid-point
Subject 51
020
40
60
80
100
0 50 100 150200
Choice Mid-point
Subject 52
020
40
60
80
100
0 50 100 150200
Choice Mid-point
Subject 53
020
40
60
80
100
0 50 100 150200
Choice Mid-point
Subject 54
40

020
40
60
80
100
0 50 100 150200
Choice Mid-point
Subject 55
020
40
60
80
100
0 50 100 150200
Choice Mid-point
Subject 56
020
40
60
80
100
0 50 100 150200
Choice Mid-point
Subject 57
020
40
60
80
100
0 50 100 150200
Choice Mid-point
Subject 58
020
40
60
80
100
0 50 100 150200
Choice Mid-point
Subject 59
020
40
60
80
100
0 50 100 150200
Choice Mid-point
Subject 60
Figure 6: Individual time paths: Choices over time with mid-point.
41