the profitability of growing cannabis under high intensity
TRANSCRIPT
The Profitability of Growing Cannabis Under High Intensity Light
James Eaves Department of Management
Pavillon Palasis-Prince, Office 0525 2325 Rue de l'Université, Québec, QC, Canada G1V 0A6 418 656-2131, ext 3679
Stephen Eaves VoltServer
42 Ladd St, East Greenwich, RI 02818, USA [email protected] Chad Morphy
Greenseal Cannabis Company, Innovation Group 530 Wright Boulevard Stratford ON N4Z 1H3,
Canada Chris Murray
Greenseal Cannabis Company, Innovation Group 530 Wright Boulevard Stratford ON N4Z 1H3,
Canada Abstract. The purpose of this study was to ask if cannabis growers could increase profitability by increasing light intensity far above conventional levels. We also look for evidence that the premium paid for specialty grow lights is worth it when compared to much cheaper, general application, broad-spectrum (white) lights. Then, we discuss the return on investment associated with using more electricity in order to increase light intensity and yields. Finally, when comparing lighting options, we argue that growers and policy makers should focus on $/µmols not $/watts. The experiment includes hundreds of cannabis plants. As far as we know, this research represents the first university study of its kind, and the results challenge industry conventions. We find that yields increase linearly with light intensity up to at least 1500 μmols/ m2· s, which is at least twice the intensity that is most commonly used by cannabis growers. We also find no evidence that spectrum variations across our sample of specialty horticulture lights significantly affect yields versus general purpose broad-spectrum lights. Finally, the value of the gain in yields from increasing light intensity far exceeds the cost of additional electricity for all the intensity ranges that we considered. Keywords: cannabis, lighting, profits Introduction
Electronic copy available at: https://ssrn.com/abstract=3310456

Because cannabis only recently became legal in a few regions of the world, it is common to see
cannabis growers, even large commercial growers, embracing production strategies that have
not been validated through rigorous scientific experiments. Rather, many conventions have
been transmitted across the industry by means like word-of-mouth and internet forums.
Lighting is an important example. Most cannabis growers believe that the double-ended, high-
pressure sodium (HPS) light is the optimal lighting for growing cannabis during the plant’s
flowering phase. A Canada regional sales manager for one of the world’s largest sellers of both
HPS and LED horticulture lights estimates that 90% of Canadian cannabis growers use HPS
lights. A survey published in a leading cannabis trade journal reports that 62% of North
American growers use HPS while 85% use lights that provide around the same or less light
intensity as an HPS (CBT Staff, 2016).
Most of the LED alternatives to HPS lights are marketed as “HPS replacements.” Specifically,
they are designed to provide the same light intensity as an HPS light while consuming less
electricity.1 This suggests that the market has determined that HPS lights provide an intensity
and spectrum that maximizes the profitability of cannabis production, though this hypothesis
has never actually been tested in a peer-reviewed study.
This is not surprising since prohibition, which has only recently started to end, prevented the
vast majority of researchers from considering such topics. Nonetheless, one result from the
scant research that does exists suggests that cannabis growers may be under powering their
1 See CREE (2016) for an example of this mindset.
Electronic copy available at: https://ssrn.com/abstract=3310456
plants, and thus reducing profitability. In particular, Chandra et al. (2008) analyze the
photosynthetic response of 20 cannabis plants and find that for some varieties, under certain
conditions, net photosynthesis increases at light intensities up to 2000 µmol/m2· s. Although
no survey data exists on the topic, any industry insider would agree that the most common
lighting strategy for cannabis is placing a 1060W double ended high pressure sodium bulb (HPS)
at least 76 cm above 1.48 m2 of plants. At one meter from the canopy height, this strategy
typically delivers around 400 µmol/m2· s of light to the canopy (CREE, 2016). Our own field
measurements show that that level can be significantly higher (up to 700 µmol/m2· s) at certain
locations in a grow room that receive substantial spill-over light from neighboring tables. Even
so, the results of Chandra et al. (2008) imply cannabis growers could potentially significantly
increase yields by increasing light intensity. Nonetheless, measurements of leaf photosynthetic
rates alone are a poor predictor of final yields (Evans, 1997). Instead, the economic
implications of lighting choices must consider the actual weight of the plant’s dried flower,
harvested at peak ripeness.
For this study, we grew hundreds of cannabis plants under several different LED and HPS lights,
all with different spectrums and light intensities, and compared final yields. We also use the
analysis to look for evidence that horticulture LEDs, with proprietary spectrum designs, impact
the relationship between light intensity and yields compared to general purpose, broad-
spectrum LEDs. More specifically, cannabis growers have two choices when it comes to
lighting: They can buy a general-purpose, broad-spectrum LED (e.g., a flood light used for
lighting streets or warehouses) or they can buy an LED light with a spectrum that has been
Electronic copy available at: https://ssrn.com/abstract=3310456

“tuned” specifically for horticulture applications. For growers that use LEDs, it is much more
common for them to use a horticulture LED since there is a belief that the tuned spectrum adds
value either through increased yields or an improved chemical profile. Nonetheless, these
lights are often more than three-times as expensive per µmol of light compared to a general-
purpose, broad-spectrum LED. Research on other plants does show that spectrum differences
across tuned-spectrum lights impacts yields. For instance, Kim et al. (2008) found that adding
green light to an LED that otherwise only emits red and blue increased lettuce growth and
biomass. But the question we are asking here is if the tuned spectrums of specialty horticulture
lights increase yields compared to broad-spectrum, general purpose lights that, in essence,
allow the plant to “choose” the wavelengths it wants.
A quick history of the HPS-LED debate
Cannabis growers often have very strong opinions regarding the relative performance of HPS
and LED lights. Thus, it is important to quickly summarize the source of the debate.
Traditionally, LEDs have been marketed as a means of reducing energy costs, since producing
and directing a photon to the plant canopy using an LED requires about 40% less energy than an
HPS bulb. Despite this, many growers have come to believe that LEDs have lower canopy-
penetration capacity, resulting in lower yields. This perception can be explained by how LED
companies initially marketed their lights to growers. In particular, to produce the same yield as
a 1060 W HPS bulb, the LED would need to draw approximately 600 W. But even just a few
years ago, the cost of a 600 W LED was at least 5-times that of a 1060 W HPS. So many LED
providers incorrectly claimed that 200 to 300 W LEDs were “replacements” for HPS lights. This
Electronic copy available at: https://ssrn.com/abstract=3310456

marketing strategy did lasting damage to the LED industry, as many growers tried these LED
fixtures and found they produced significantly lower yields compared to HPS. This negative
perception still persists today, even though the efficiency of LEDs has increased to a point
where true HPS equivalent LEDs are affordable.
As LED prices have declined rapidly, broad-spectrum LEDs have become financially viable. As a
result, horticulture lighting companies are increasingly marketing broad-spectrum (or white)
lights and differentiating themselves from their competition by manipulating the particular
ratios of wavelengths in order to develop proprietary spectrums. These manipulations add
significant cost to the lights, above, say, a broad-spectrum street light that uses commoditized
diodes.
Methods
Research location
Our experiment took place inside an approximately 2,800 m2 cannabis facility, Greenseal
Cannabis Company, in Stratford, Ontario. The company grows cannabis in an indoor vertical
farm, using several types of lighting, including LED and HPS lighting. The growing environment
is highly controlled by an automated building control system, which has resulted in very low
yield variability across harvests since the company started production.
At the time of the experiment, Greenseal did not have space dedicated to R&D (e.g. growth
chambers), so the experiment was run inside a normal production room. Moreover, the
Electronic copy available at: https://ssrn.com/abstract=3310456
average retail price of cannabis in 2018 was around 7$/gram (Statistics Canada, 2018). Thus,
given the large number of plants included in the experiment, Greenseal agreed to participate
with the understanding that the master grower could make modifications to the experiment if
it appeared those modifications would prevent a significant loss in yields. For example, during
the first run of the experiment, the master grower noticed a magnesium deficiency and decided
to change the nutrient recipe for the second and third run of the experiment, which caused
yields for those runs to be much higher. The harvest date for the third experiment coincided
with a particularly large general harvest. The company did not have the staff to properly
manage all the experimental plots. So, a decision was made to only keep 5 out of 9 treatments
separate from the general harvest. The other 4 treatments are not included in the final results.
Light intensity and spectrum
We varied both spectrum and intensity by using seven different commercially available models
of LED lighting fixtures, as well as 1060W double ended high-pressure sodium fixtures (HPS).
We used six tuned-spectrum LED models that are marketed as horticulture LEDs, one broad-
spectrum (white) model that was designed for general lighting, and one “pink” tuned-spectrum
model. The pink light was tuned to have most of its energy concentrated in the blue (400-500
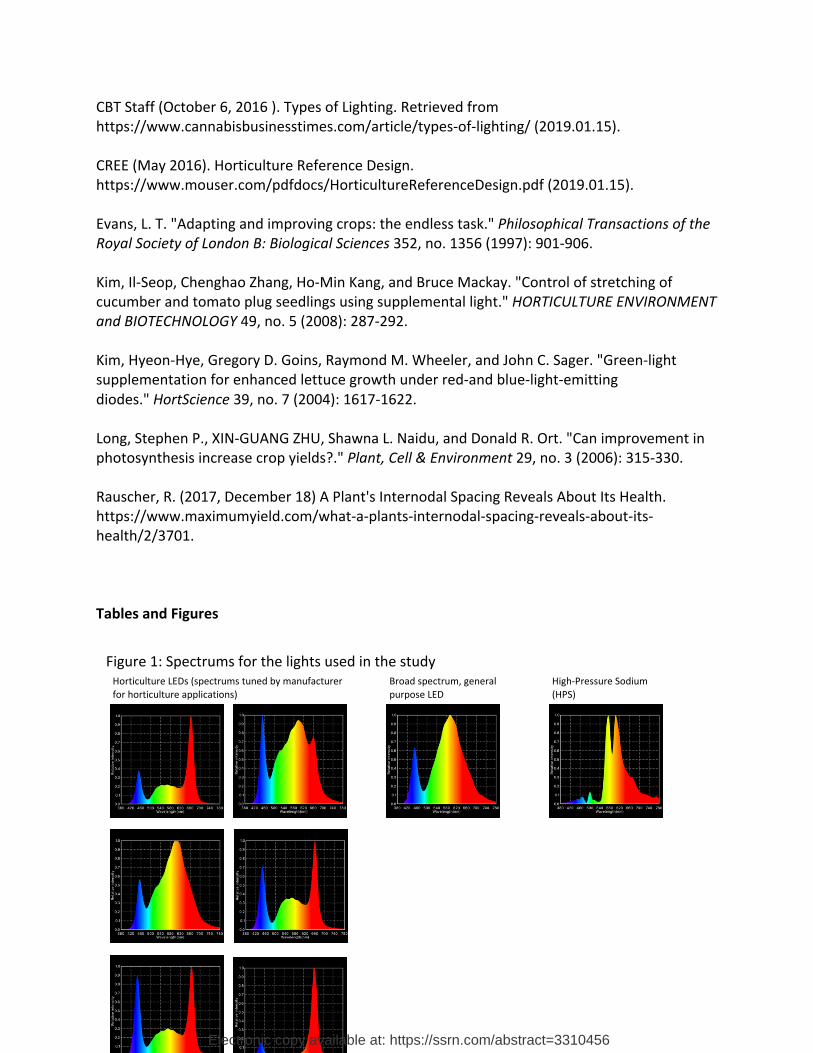
nm) and red (600-700 nm) wavelength regions. Figure 1 shows the spectrums for each fixture.
After the first experiment, we lowered some of the fixtures slightly, which increased light
intensity for those plots.
Electronic copy available at: https://ssrn.com/abstract=3310456
We ran the experiment 3 times. For each run, there were two replicates for each light
treatment. Each light was placed over a 1.49 m2 table. Each table contained 16 plants. The
location of the replicates inside the room was randomly selected, and panda film was used to
reduce spill-over lighting from neighboring tables. The first two runs included 256 plants, while
the third run included 160 plants.
Each experiment started by placing Cannabis sativa L. cuttings of cultivar “Green Crack” into
aeroponic cloning machines. The clones were grown under T8 fluorescent lights for
approximately 2 weeks until roots were approximately 3 inches long. The light intensity during
this period was approximately 110 μmols/ m2· s measured with a Spectrometer (Asensetek
Passport Pro). The clones where then transplanted into 11-liter pots filled with a peat-based
medium (PRO-MIX HP with MYCORRHIZAE).
The plants were randomly assigned to each treatment. All treatments were placed in the same
room. Lights-on temperature, relative humidity, and CO2 levels were kept constant at 25 ± 2%
C, 50 ± 5%, and 1400 ± 25 ppm respectively. Lightsoff temperature, relative humidity, and CO2
levels were kept constant at 18 ± 2% C, 50 ± 5%, and 1400 ± 25 ppm respectively. The plants
were grown for 60 days and then harvested. The harvested plant shoots were dried until
flower samples registered a humidity level of 12%. Finally, the dried flower was weighed and
averaged for each treatment and each run.
RESULTS
Electronic copy available at: https://ssrn.com/abstract=3310456
Morphology observations
At harvest, the plants grown under the higher intensity LEDs had more narrow internodes (3.91
vs 5.04 cm), and shoots that where noticeably stronger and an average of 2 inches shorter than
the HPS treatment and the lower intensity LEDs. Evidently, lower light levels caused plants to
stretch towards the light, an effect that has been observed for other container plants (Kim et
al., 2008). Moreover, growers reported that the highest intensity LED treatments had flowers
that were noticeably denser. These two morphological characteristics have important
implications for profitability since narrow internodes and denser flowers are generally believed
to increase the value of yields (e.g., Rauscher, 2017). Finally, all the LED treatments reached
maturity 5 days sooner than the HPS treatment. This is also a significant result since it implies
the possibility of adding an additional harvest over a two-year period. Nonetheless, for our
experiment, we decided to harvest all plants when the master grower deemed the HPS plants
ready, at day 60.
Yields
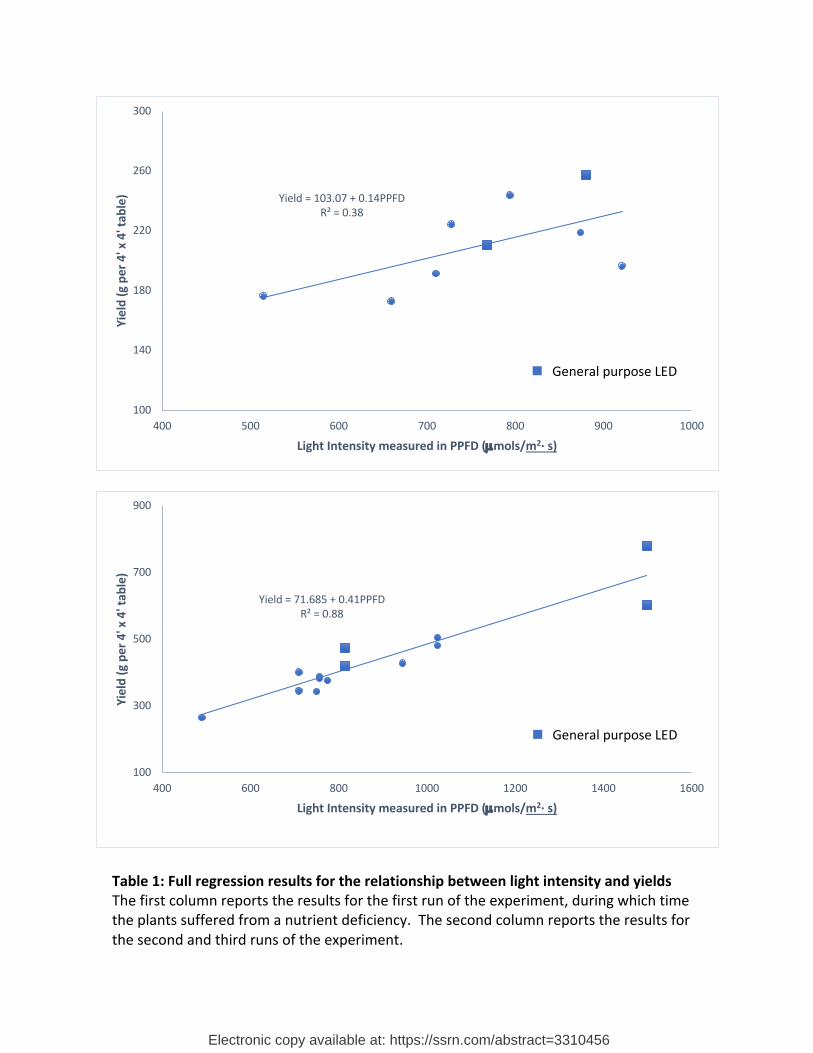
The relationship between yields and light intensity differed substantially between the first and
last two runs of the experiment because of the nutrient deficiency during the first run. Figure 2
plots final yields, measured in grams of dried flower, against light intensity for run 1 and runs 2
and 3. The full regression results are reported in Table 1. The results show a positive, linear
relationship between yields and light intensity. The strength of the relationship, measure by
the R2, is weaker for the first run (0.38) and very strong for the second two runs (0.88). The
difference is likely explained by the magnesium deficiency during the first run which damaged
Electronic copy available at: https://ssrn.com/abstract=3310456
the plants’ leaves and thus stunted growth. The regression results for runs 2 and 3 also show
that nearly all the variability is explained by light intensity alone. This suggests that tuning the
spectrum of lights is not an important factor for yields. It is possible that tuning spectrum could
still impact the chemical profile of the plant and increase yield value that way. We did test the
chemical profile and found variations, but we only had enough funds to test one sample per
treatment, resulting in a sample size that was too small to justify reporting the results.
Is the additional electricity cost worth it?
We find that yields increase with light intensity at least up to 1500 µmols/ m2· s, which is more
than two times the intensity provided by a 1060W HPS light. This suggests that growers could
substantially increase yields compared to the status quo. But a reasonable question is whether
or not the additional light intensity and resulting yields justify spending more money on
electricity. Using our regression results for runs 2 and 3, we see that for every µmol/m2· s
increase in PPFD, yields increase by 0.41 grams, which has a retail value of about CAN $3.07.2
So the next question is how much does it cost in electricity to increase PPFD by 1 µmol/m2·s.
Power and light measurements performed during our testing confirmed that LED lights produce
around 2.0 µmol/m2· s of PPFD using 1 watt of electricity.3 Thus, it takes about 0.5W to
produce 1 µmol/m2· s. In the case of our experiment, plants were grown for 60 days and the
lights were on 12 hours a day, or a total of 720 hours. So, the additional 0.5 watts would
2 https://www150.statcan.gc.ca/n1/daily-quotidien/181004/cg-a001-eng.htm 3 http://flor.hrt.msu.edu/assets/Uploads/Lighting-efficacy.pdf
Electronic copy available at: https://ssrn.com/abstract=3310456

generate an additional 0.36 kWh of electricity. Assuming electricity is $0.14, the additional
watts required to produce an additional $3.07 of cannabis would cost about $0.05.
The right policy and profit metric is $/µmols not $/watts
Growers often create performance metrics based on power in watts when evaluating their
lighting strategies. For instance, one of the most common ways to compare different lighting
options is the $/watt cost of each option. Similarly, there are a number of government
incentive programs in Canada that pay growers to reduce the total number of watts their
facilities draw by switching to more efficient lights, like LEDs. However, at least in the case of
efficiently growing plants, especially cannabis where the country is currently suffering from
severe and persistent shortages of supply, it is more effective to focus on µmols rather than
watts. We can use our result to illustrate this point.
A double ended HPS lighting fixture costs around 700 CAD in high quantities, and it draws
around 1,060W. Considering the general-purpose LED light we used in our experiment, it
would cost around 900 CAD to build a 960W fixture. On a $/watt basis, the HPS light performs
far better, and that explains why most growers still buy HPS lights over LEDs. Similarly, from a
policy maker’s point of view, both lights are drawing a similar quantity of electricity, so there
would be little point to pay a grower to switch to the LED. That is also why there is currently a
strong incentive for horticulture LED producers to continue to market LED fixtures that are
approximately 600W, since this allows their clients to benefit from some of these incentive
Electronic copy available at: https://ssrn.com/abstract=3310456
programs. But the end result is that the producer is producing less cannabis, less efficiently, at
least for cultivars similar to the one we considered.
In particular, during the second two runs of our experiment, the high intensity LED treatment
produced around 0.77 grams/watt compared to just 0.35 for the HPS, illustrating that the
efficiency levels are much higher than they appear when we just look at total watts. The
difference is explained by the fact that the LED is more efficient at directing photons to the
plants. First, LEDs direct photons more accurately, thus a much higher proportion hit the plants
versus the walls and floor. Second, since the LED emits far less radiant heat, the grower can
place the lights much closer to the plants. This is extremely important because the decrease in
usable photons decreases exponentially with the distance between a light and the plant.4 As a
result of these characteristics, a much more useful metric when evaluating the efficiency with
which growers use lights is the efficiency at which the light produces usable photons and the
cost of producing each µmol of light.
Conclusion
Our results provide evidence that cannabis growers could substantially increase profits by using
light intensity levels that are much higher than is the convention today. The positive,
apparently linear relationship between intensity and yields continues to at least 1500
µmols/m2· s, which is over twice the level provided by an HPS fixture in a grow configuration,
which is currently the industry standard. Moreover, holding light intensity constant, we find no
4 This relationship is described by the “inverse-square law.”
Electronic copy available at: https://ssrn.com/abstract=3310456
evidence that the various tuned spectrums offered by specialty horticulture LED lights increase
yields compared to the much less expensive, general-purpose, broad-spectrum LED lights. It
took less time for the LED treatments to reach peak ripeness, and the resulting morphology of
plants grown under high-intensity LEDs is more desirable from a profitability perspective.
These results are important for two reasons: First, many horticulture LED lights are tuned-
spectrum varieties that justify a significant price premium above commoditized broad-spectrum
LEDs by arguing that their proprietary spectrum increases the value of a grower’s yields. It is
possible that spectrum tuning may improve the cannabinoid profile substantially enough to
justify a price premium, but our results provide no evidence that spectrum tuning increases
yields. Rather, the more profitable strategy would be to buy commoditized, high-intensity,
broad-spectrum LEDs (like flood lights), which are about one-third the cost per watt of
horticulture LEDs. The second reason these results are important is that the vast majority of
growers use HPS lights. Those who use LED lights are using lights that were designed to use less
electricity while providing the same light intensity as an HPS. Our results suggest that both
these strategies reduce the grower’s expected profits, since both provide less light than is
optimal when trying to maximize yields. The electricity saving offered by lower powered LEDs
are far smaller than the yield value lost by reducing light intensity.
References Chandra, Suman, Hemant Lata, Ikhlas A. Khan, and Mahmoud A. Elsohly. "Photosynthetic response of Cannabis sativa L. to variations in photosynthetic photon flux densities, temperature and CO2 conditions." Physiology and Molecular Biology of Plants 14, no. 4 (2008): 299-306.
Electronic copy available at: https://ssrn.com/abstract=3310456
CBT Staff (October 6, 2016 ). Types of Lighting. Retrieved from https://www.cannabisbusinesstimes.com/article/types-of-lighting/ (2019.01.15). CREE (May 2016). Horticulture Reference Design. https://www.mouser.com/pdfdocs/HorticultureReferenceDesign.pdf (2019.01.15). Evans, L. T. "Adapting and improving crops: the endless task." Philosophical Transactions of the Royal Society of London B: Biological Sciences 352, no. 1356 (1997): 901-906. Kim, Il-Seop, Chenghao Zhang, Ho-Min Kang, and Bruce Mackay. "Control of stretching of cucumber and tomato plug seedlings using supplemental light." HORTICULTURE ENVIRONMENT and BIOTECHNOLOGY 49, no. 5 (2008): 287-292. Kim, Hyeon-Hye, Gregory D. Goins, Raymond M. Wheeler, and John C. Sager. "Green-light supplementation for enhanced lettuce growth under red-and blue-light-emitting diodes." HortScience 39, no. 7 (2004): 1617-1622. Long, Stephen P., XIN-GUANG ZHU, Shawna L. Naidu, and Donald R. Ort. "Can improvement in photosynthesis increase crop yields?." Plant, Cell & Environment 29, no. 3 (2006): 315-330. Rauscher, R. (2017, December 18) A Plant's Internodal Spacing Reveals About Its Health. https://www.maximumyield.com/what-a-plants-internodal-spacing-reveals-about-its-health/2/3701. Tables and Figures
Figure 1: Spectrums for the lights used in the study
Horticulture LEDs (spectrums tuned by manufacturer for horticulture applications)
Broad spectrum, general purpose LED
High-Pressure Sodium (HPS)
Electronic copy available at: https://ssrn.com/abstract=3310456
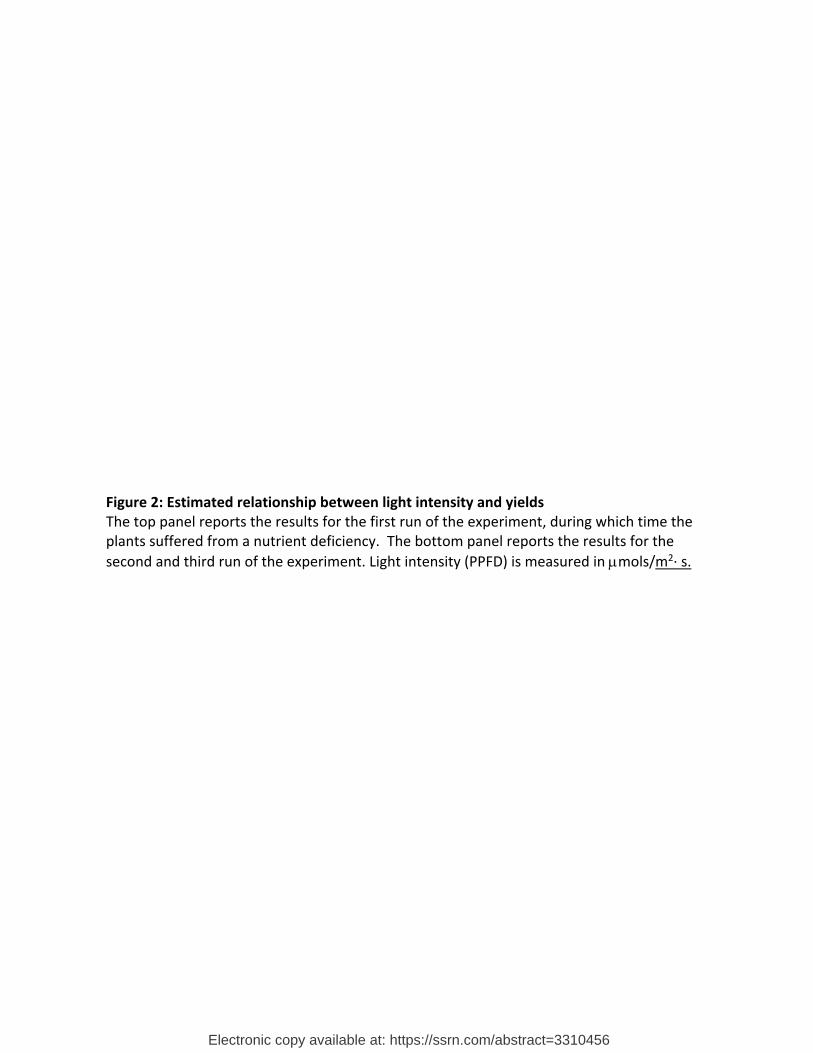
Figure 2: Estimated relationship between light intensity and yields The top panel reports the results for the first run of the experiment, during which time the plants suffered from a nutrient deficiency. The bottom panel reports the results for the second and third run of the experiment. Light intensity (PPFD) is measured in µmols/m2· s.
Electronic copy available at: https://ssrn.com/abstract=3310456
Yield = 103.07 + 0.14PPFDR² = 0.38
100
140
180
220
260
300
400 500 600 700 800 900 1000
Yiel
d (g
per
4' x
4' t
able
)
Light Intensity measured in PPFD (µmols/m2· s)
Yield = 71.685 + 0.41PPFD R² = 0.88
100
300
500
700
900
400 600 800 1000 1200 1400 1600
Yiel
d (g
per
4' x
4' t
able
)
Light Intensity measured in PPFD (µmols/m2· s)
Table 1: Full regression results for the relationship between light intensity and yields The first column reports the results for the first run of the experiment, during which time the plants suffered from a nutrient deficiency. The second column reports the results for the second and third runs of the experiment. µmols/m2· s)
General purpose LED
General purpose LED
Electronic copy available at: https://ssrn.com/abstract=3310456

Dependentvariable: Yield(grams) Run1 Run2and3
Lightintensity(PPFD) 0.141* 0.413***
(0.068) (0.044)
Constant 103.074* 71.685 (52.435) (41.194)
Observations 9 14R2 0.380 0.881AdjustedR2 0.291 0.871ResidualStd.Error 24.397(df=7) 45.607(df=12)
FStatistic 4.288*(df=1;7) 88.659***(df=1;12)Note: *p<0.1;**p<0.05;***p<0.01
Electronic copy available at: https://ssrn.com/abstract=3310456