the psychophysiology of real-time financial risk
TRANSCRIPT

NBER WORKING PAPER SERIES
THE PSYCHOPHYSIOLOGY OF REAL-TIME FINANCIAL RISK PROCESSING
Andrew W. LoDmitry V. Repin
Working Paper 8508http://www.nber.org/papers/w8508
NATIONAL BUREAU OF ECONOMIC RESEARCH1050 Massachusetts Avenue
Cambridge, MA 02138October 2001
Research support from the MIT Laboratory for Financial Engineering is gratefully acknowledged. We thank J.C.Mercier for helpful comments and discussion. The views expressed herein are those of the authors and notnecessarily those of the National Bureau of Economic Research.
© 2001 by Andrew W. Lo and Dmitry V. Repin. All rights reserved. Short sections of text, not to exceed twoparagraphs, may be quoted without explicit permission provided that full credit, including © notice, is given to thesource.

The Psychophysiology of Real-Time Financial Risk ProcessingAndrew W. Lo and Dmitry V. RepinNBER Working Paper No. 8508October 2001JEL No. G10, G14, C91, C93
ABSTRACT
A longstanding controversy in economics and finance is whether financial markets are governed
by rational forces or by emotional responses. We study the importance of emotion in the decisionmaking
process of professional securities traders by measuring their physiological characteristics, e.g., skin
conductance, blood volume pulse, etc., during live trading sessions while simultaneously capturing
real-time prices from which market events can be defined. In a sample of 10 traders, we find significant
correlation between electrodermal responses and transient market events, and between changes in
cardiovascular variables and market volatility. We also observe differences in these correlations among
the 10 traders which may be systematically related to the traders' levels of experience.
Andrew W. Lo Dmitry V. RepinMIT Sloan School of Management Boston University50 Memorial Drive Department of Cognitive and Neural SystemsE52-432 677 Beacon StreetCambridge, MA 02142 Boston, MA 02215and NBER [email protected]@mit.edu

The spectacular rise of US stock-market prices in the technology sector over the past
few years and the even more spectacular crash last year has intensified the well-worn con-
troversy surrounding the rationality of investors. Most financial economists are advocates
of the “Efficient Markets Hypothesis” (Samuelson, 1965) in which prices are determined by
the competitive trading of many self-interested investors, and such trading eliminates any
informational advantages that might exist among any members of the investment commu-
nity. The result is a market in which prices “fully reflect all available information” and are
therefore unforecastable.
Critics of the Efficient Markets Hypothesis argue that investors are often—if not always—
irrational, exhibiting predictable and financially ruinous biases such as overconfidence (Fischoff
& Slovic, 1980; Barber & Odean, 2001; Gervais & Odean, 2001), overreaction (DeBondt &
Thaler, 1986), loss aversion (Kahneman & Tversky, 1979; Shefrin & Statman, 1985; Odean,
1998), herding (Huberman & Regev, 2001), psychological accounting (Tversky & Kahne-
man, 1981), mis-calibration of probabilities (Lichtenstein, Fischoff, & Phillips, 1982), and
regret (Bell, 1982; Clarke, Krase, & Statman, 1994). The sources of these irrationalities
are often attributed to psychological factors—fear, greed, and other emotional responses to
price fluctuations and dramatic changes in an investor’s wealth. Although no clear alterna-
tive to the Efficient Markets Hypothesis has yet emerged, a growing number of economists,
psychologists, and financial-industry professionals have begun to use the terms “behavioral
economics” and “behavioral finance” to differentiate themselves from the standard ortho-
doxy. The fact that the current value of the Nasdaq Composite Index, a bellwether indicator
of the technology sector, is 1687.70 (September 7, 2001)—only 33.4% of its historical high of
5048.62 (March 10, 2000) reached less than two years ago—lends credence to the critics of
market rationality. Such critics argue that either the earlier run-up in the technology sector
was driven by unbridled greed and optimism, or that the precipitous drop in value of such a
significant portion of US economy must be due to irrational fears and pessimism.
However, recent research in the cognitive sciences and financial economics suggest an
important link between rationality in decisionmaking and emotion (Grossberg & Gutowski,
1987; Damasio, 1994; Elster, 1998; Lo, 1999), implying that the two notions are not anti-
thetical, but in fact complementary.
In this study, we attempt to verify this link experimentally by measuring the real-
1

time psychophysiological characteristics—skin conductance, blood volume pulse, heart rate,
electromyographical signals, respiration, and body temperature—of professional securities
traders during live trading sessions. Using portable biofeedback equipment, we are able to
measure these physiological characteristics in a trader’s natural environment without disrupt-
ing his workflow while simultaneously capturing real-time financial pricing data from which
market events can be defined. By correlating these events with the traders’ psychophysio-
logical responses, we are able to determine the relation between financial-risk measures and
emotional states and dynamics. In a pilot sample of 10 traders, we find significant correla-
tion between electrodermal responses and transient market events, and between changes in
cardiovascular variables and market volatility. We also observe differences in these correla-
tions among the 10 traders which may be systematically related to the amount of trading
experience.
In studying the link between emotion and rational decisionmaking in the face of uncer-
tainty, financial securities traders are ideal subjects for several reasons. Because the basic
functions of securities trading involve frequent decisions concerning risk/reward trade-offs,
traders are almost continuously engaged in the activity that we wish to study. This allows us
to conduct our study in vivo and with minimal interference to and, therefore, contamination
of the subjects’ natural motives and behavior. Traders are typically provided with signifi-
cant economic incentives to avoid many of the biases that are often associated with irrational
investment practices. Moreover, they are highly paid professionals that have undergone a
variety of training exercises, apprenticeships, and trial periods through which their skills
have been finely honed. Therefore, they are likely to be among the most rational decision-
makers in the general population, hence ideal subjects for examining the role of emotion in
rational decisionmaking processes. Finally, due to the real-time nature of most professional
trading operations, it is possible to construct accurate real-time records of the environment
in which traders make their decisions, i.e., the fluctuations of market prices of the securi-
ties they trade. With such real-time records, we are able to correlate market events such
as periods of high price-volatility with synchronous real-time measurements of physiological
characteristics.
To measure the emotional responses of our subjects during their trading activities, we fo-
cus on indirect manifestations through the responses of the autonomic nervous system (ANS)
2
(Cacioppo, Tassinary, & Bernt, 2000). The ANS innervates the viscera and is responsible for
regulation of internal states that are mediated by internal bodily as well as emotional and
cognitive processes. ANS responses are relatively easy to measure since many of them can
be measured non-invasively from external body sites without interfering with cognitive tasks
performed by the subject. ANS responses occur on the scale of seconds, which is essential
for investigation of real-time risk-processing.
Previous studies have focused primarily on time-averaged (over hours or tens of minutes)
levels of autonomic activity as a function of task complexity or mental strain. For example
some experiments have considered the link between autonomic activity and driving conditions
and road familiarity for non-professional drivers (Brown & Huffman, 1972), and the stage of
flight (take-off, steady flight, landing) in a jetfighter flight simulator (Lindholm & Cheatham,
1983). Recently, the focus of research has started to shift towards finer temporal scales
(seconds) of autonomic responses associated with cognitive and emotional processes. Perhaps
the most influential set of experiments in this area was conducted in the broad context of
an investigation of the role of emotion in decisionmaking processes (Damasio, 1994). In one
of these experiments, skin conductance responses were measured in subjects involved in a
gambling task (Bechara et al., 1997). The results indicated that the anticipation of the more
risky outcomes led to more skin conductance responses than of the less risky ones. The
brain circuitry involved in anticipating monetary rewards has also been localized (Breiter et
al., 2001). Another study (Frederikson et al., 1998) reported neuroanatomical correlates of
skin conductance activity with the brain regions that also support anticipation, affect, and
cognitively or emotionally mediated motor preparation. Recent experiments (Critchley et
al., 1999) support the significance of autonomic responses during risk-taking and reward-
related behavior. They provide more details on brain activation correlates of peripheral
autonomic responses, and also claim the possibility of discriminating the activity patterns
related to changing versus continuing the behavior based on the immediate gain/loss history
in a gambling task.
We focus on five types of physiological characteristics in our study: skin conductance,
cardiovascular data (blood volume pulse and heart rate), electromyographic data, respiration
rate, and body temperature.
Skin conductance response (SCR) is measured by the voltage drop between two electrodes
3

placed on the skin surface a few centimeters apart. Changes in skin conductance occur when
eccrine sweat glands, that are innervated by the sympathetic ANS fibers receives a signal
from a certain part of the brain. Three distinct “brain-information systems” can potentially
elicit SCR signals (Boucsein, 1992). The affect arousal system is capable of generating a
phasic (on the scale of seconds) response that is associated directly with the sensory input
indicating attention focusing or defense response, and the amygdala is the primary brain
region involved. The emotional response to a novel or highly complex is an example of affect
arousal. Another system that can initiate a phasic SCR centers on the basal ganglia and
is related to a preparatory activation, mediated by internal cognitive processes. The body
exhibits increased perceptual and motor readiness, and high attention levels. Expectation
of an event or preparation to an important action illustrates the operation of this system.
The third system, often called the “effort system”, produces tonic changes in the level of
skin conductance and is related to the long-term changes of a general emotional (“hedonic”)
state or attitude, indicating a nonspecific increase inattention or arousal. Hippocampal
information-processing is believed to be behind this system, which is associated with a higher
degree of conscious awareness, while the first two are mostly attributed to subconscious
processes.
The cardiovascular system consists of the heart and all the blood vessels, and the variables
of particular interest are blood volume pulse (BVP) and heart rate (HR). BVP is the rate of
flow of blood through a particular blood vessel, and is related to both blood pressure and the
diameter of the vessel. Constriction or dilation of the vessels is controlled by the sympathetic
branch of the ANS, and along with electrodermal activity, has been shown to be related to
information processing and decisionmaking (Papillo & Shapiro, 1990). HR refers to the
frequency of the contractions of the heart muscle or myocardium. Specialized neurons—
the so-called “pacemaker” cells—initiate the contraction of myocardium, and the output of
the pacemakers is controlled by both parasympathetic (HR decrease) and sympathetic (HR
increase) ANS branches. BVP and HR track each other closely, so that HR deceleration
usually causes an increase in BVP. Compared to SCR arousal indications that refer mostly
to cognitive processes, changes in cardiovascular variables register higher levels of arousal
which are often somatically mediated. These variables may provide supplemental information
for interpreting high SCR signals—elevated SCR accompanied by an increase in HR may be
4
an indication of extreme significance of the task or stimulus or, alternatively, simply indicate
that some physical activity is being performed simultaneously (Boucsein, 1992).
Electromyographic (EMG) measurements are based on the electrical signals generated by
the contraction process of striated muscles. Muscle action potentials travel along the muscle
and some portion of the electrical activity leaks to the skin surface where it can be detected
with the help of surface electrodes. The activation of particular muscles reflects different
types of actions. For example, activation of the facial muscle (i.e., the “masseter” muscle)
indicates ongoing speech; activation of the forearm muscle group (i.e., the “flexor digitorum”
group) corresponds to finger movements such as typing on a keyboard. In addition to
their role in motor activity, certain muscle groups exhibit strong correlations with emotional
states. Most of the research in this literature has focused on facial muscles since facial
expressions have been linked to emotional states (Ekman, 1982). For example, an increase
in EMG activity over the forehead is associated with anxiety and tension, and an increase
in activity over the brow accompanied by a slight decrease in activity over the cheek often
corresponds to unpleasant sensory stimuli (Cacioppo, Tassinary, & Bernt, 2000). Therefore,
EMG measurements can capture very subtle changes in muscle activity that can differentiate
otherwise indistinguishable response patterns. However, in our current implementation,
the role of EMG measurements is limited to identifying and eliminating anomalous sensor
readings caused by certain physical motions of a subject.
Respiration influences the heart rate through vascular receptors (Lorig & Schwartz, 1990),
and although this variable is usually is not of primary psychological importance, it is a
reliable indicator of physically demanding activities undertaken by the subject, e.g., speaking
or coughing, which can often yield anomalous sensor readings if not properly taken into
account. Respiration can be measured by placing a sensor that monitors chest expansion
and compression.
Finally, body temperature regulation involves the integration of autonomic, motor and
endocrine responses, and several studies have related the temperatures of different parts of
the body to certain cognitive and emotional contents of the task or stimuli. For example,
forehead temperature (a proxy for brain temperature) increases while experiencing negative
emotions; cooling enhances positive affect, while warming depresses it (McIntosh et al., 1997).
Another study reports hand skin temperature increases with positive affect, and decreases
5
with threatening and unpleasant tasks (Rimm-Kaufman & Kagan, 1996).
Results
Our sample of subjects consisted of 10 professional traders employed by the foreign-exchange
and interest-rate derivatives business unit of a major global financial institution based in
Boston, Massachusetts. This institution provides banking and other financial services to
clients ranging from small regional startups to Fortune 500 multinational corporations. The
foreign-exchange and interest-rate derivatives business unit employs approximately 90 pro-
fessionals, of which two thirds specializes in the trading of foreign exchange and related
instruments, and one third specializes in the trading of interest-rate derivative securities. In
a typical day, this business unit engages in 1,000 to 1,200 trades, with an average size of $3
million to $5 million per trade. Approximately 80% of the trades are executed on behalf of
the clients of the financial institution, with the remaining 20% motivated by the financial
institution’s market-making activities.
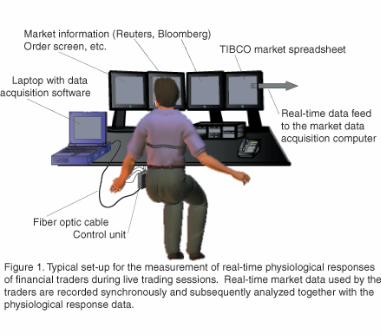
For each of the 10 subjects, five physiological variables were monitored in real time
during the entire duration of each session while the subjects sat at their trading consoles
(see Figure 1). Six sensors were used: skin conductance response (SCR), blood volume pulse
(BVP), body temperature (TMP), respiration (RSP), and two electromyographic sensors
(facial and forearm EMG).
The benefits of acquiring real-time physiological measurements in vivo must be balanced
against the cost of measurement error, spurious signals, and other statistical artifacts which,
if left untreated, can obscure and confound any genuine signals in the data. To eliminate
as many artifacts as possible while maximizing the informational content of the data, each
of the five physiological variables were preprocessed with filters calibrated to each variable
individually, and adaptive time-windows were used in place of fixed-length windows to match
the event-driven nature of the market variables.
After pre-processing, the following 8 features were extracted from SCR, BVP, tempera-
ture, and respiration signals:
1. times of onset of SCR responses
2. amplitudes of SCR responses
6

3. average heart rates (every three-second interval)
4. BVP signal amplitudes
5. respiration rates (every five-second interval)
6. respiration amplitudes
7. temperature changes (from the 10-second lag)
These features were selected to reflect the different properties and different information
contained in the raw physiological variables. Skin conductance responses were characterized
by smooth “bumps”, with a relatively fast onset and slow decay, hence the number of such
bumps and their relative strength are excellent summary measures of the SCR signal. Three-
and five-second intervals for heart and respiration rates were chosen as a compromise between
the need for finer time slices to distinguish the onset and completion of physiological and
market events and the necessity of a sufficient number of heartbeats and respiration cycles
within each interval to compute an average. Under normal conditions, a typical subject will
exhibit an average of three to four heartbeats per three-second interval and approximately
three breaths per five-second interval. Temperature was the most slow-varying physiological
signal, and the 10-second interval to register its change reflected the maximum possible
interval in our analysis.
For each session, real-time market data for key financial instruments actively traded
or monitored by the subject were collected synchronously with the physiological data. In
particular, across the 10 subjects, a total of 15 instruments were considered, 13 foreign
currencies and two futures contracts: the euro (EUR), the Japanese yen (JPY), the British
pound (GBP), the Canadian dollar (CAD), the Swiss franc (CHF), the Australian dollar
(AUD), the New Zealand dollar (NZD), the Mexican peso (MXP), the Brazilian real (BRL),
the Argentinian peso (ARS), the Colombian peso (COP), the Venezuelan bolivar (VEB),
the Chilean peso (CLP), S&P 500 futures (SPU), and eurodollar futures (EDU). For each
security, four time series were monitored: (1) the bid price P bt ; (2) the ask price P a
t ; (3)
the bid/ask spread Xt ≡ P bt − P a
t ; and (4) the net return Rt ≡ (Pt − Pt−1)/Pt−1, where Pt
denotes the price at time t, and prices were sampled every second.
For each of the financial time series, we identified three classes of market events: de-
viations, trend reversals, and volatility events. These events are often cited by traders as
7

significant developments that require heightened attention, potentially signaling a shift in
market dynamics and risk exposures. With these definitions and calibrations in hand, we
implemented an automatic procedure for detecting deviations, trend reversals, and volatility
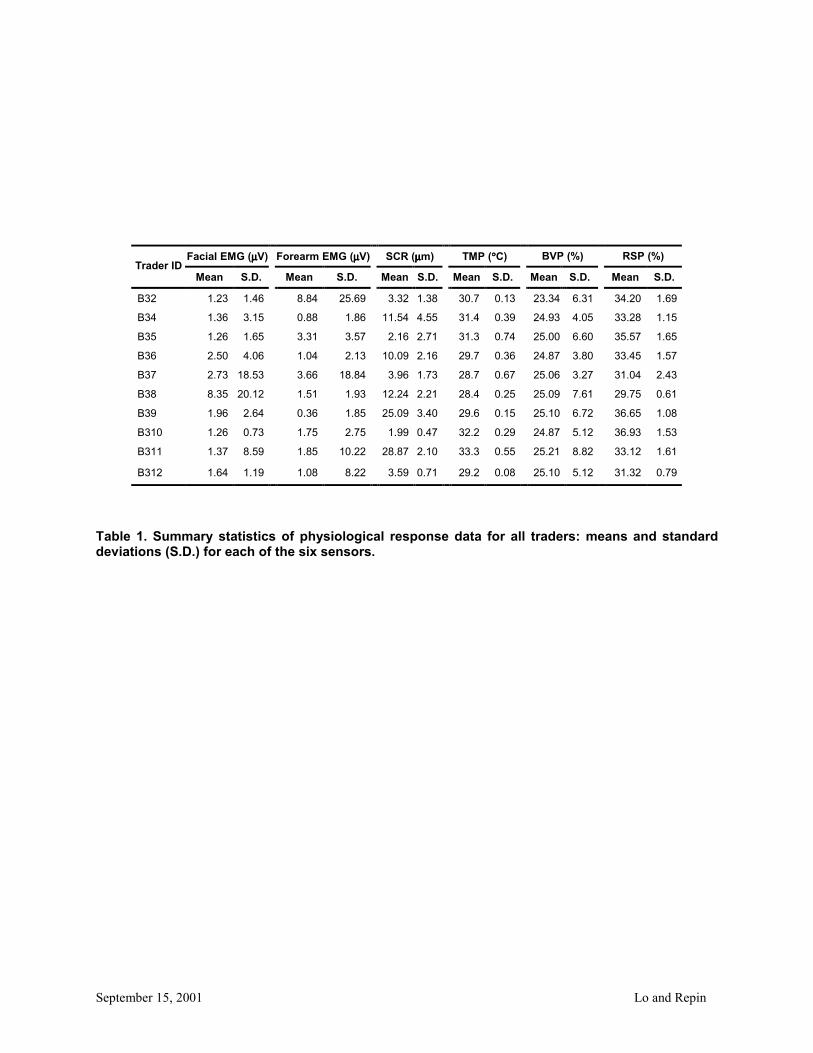
events for all the relevant time series in each session. Table 1 reports event counts for the
financial time series monitored for each subject. Feature vectors were then constructed for
all detected market events in all time series for all subjects, and a set of control feature-
vectors was generated by applying the same feature-extraction process to randomly selected
windows containing no events of any kind. One set of control feature-vectors were con-
structed for deviation and trend-reversal events (10-second intervals), and a second set was
constructed for volatility-type events (five-minute intervals). A two-sided t-test was applied
to each component of the each feature vector and the corresponding control vector to test the
null hypothesis that the feature vectors were statistically indistinguishable from the control
feature-vectors.
For volatility events which, by definition, occurred in five-minute intervals (“event win-
dows”), we constructed feature vectors containing the following information for the duration
of the event window:
1. number of SCR responses
2. mean SCR amplitude
3. mean heart rate
4. mean ratio of the BVP amplitude to local baseline
5. mean ratio of the BVP amplitude to global baseline
6. number of temperature changes exceeding 0.1oF
7. mean respiration rate
8. mean respiration amplitude
where the local baseline for the BVP signal is the average level during the event window and
the global baseline is the average over the entire recording session for each trader. Control
feature vectors were constructed by applying the feature-extraction process to randomly se-
lected 5-minute windows containing no events of any kind. For the other two types of market
events—deviations and trend-reversals—“pre-event” and “post-event” feature-vectors were
constructed before and after each market event using the same variables, where features were
8

aggregated over 10-second windows immediately preceding and following the event. Control
feature vectors were generated for these cases as well.
The motivation for the post-event feature-vector was to capture the subject’s reaction
to the event, with the pre-event feature-vector as a benchmark from which to measure the
magnitude of the reaction. A comparison between the pre-event feature vector and a control
feature-vector may provide an indication of a subject’s anticipation of the event. Latencies
of the autonomic responses reported in previous studies were on the time scale of one to
10 seconds (see Cacioppo, Tassinary, & Bernt, 2000), hence 10-second event windows were
judged to be long enough for event-related autonomic responses to occur and, at the same
time, short enough to minimize the likelihood of overlaps with other events or anomalies.
Five-minute windows were used for volatility events because 10-second intervals were simply
insufficient for meaningful volatility calculations. For all of the financial time series used in
this study, and for most financial time series in general, there are few volatility events that
occur in any 10-second interval, except, of course, under extreme conditions, e.g., the stock
market crash of October 19, 1987 (no such conditions prevailed during any of our sessions).
The statistical analysis of the physiology and market data was motivated by four ob-
jectives: (1) to identify particular classes of events with statistically significant differences
in autonomic responses before or after an event, as compared to the no-event control; (2)
to identify particular traders or groups of traders based on experience or other personal
characteristics that demonstrate significant correlation between market events and auto-
nomic responses; (3) to identify particular financial instruments or groups of instruments
that exhibit significant correlations with autonomic responses; and (4) to identify particular
physiological variables that demonstrate significant response levels immediately following the
event or during the event-anticipation period, as compared to the no-event control
To address the first objective, a total of eight types of events were used for each of the
time series:
1. price deviations
2. spread deviations
3. return deviations
4. price trend-reversals
9

5. spread trend-reversals
6. maximum volatility
7. price volatility
8. return volatility
and for each type of event, a two-sided t-test was performed for the pooled sample of all
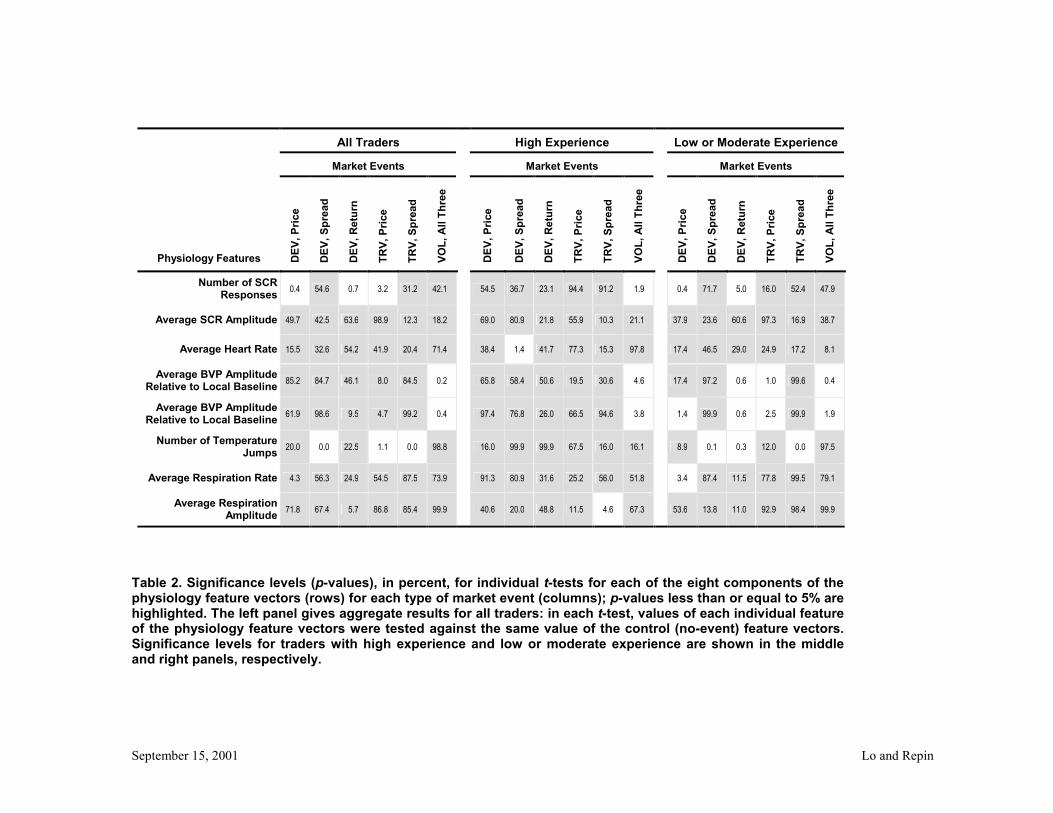
subjects and all time series. The results—“p-values” or significance levels of the tests—are
summarized in the left sub-panel of Table 2, labelled “All Traders”. The p-value of a statistic
is defined as the smallest level of significance for which the null hypothesis can be rejected
based on the statistic’s value (Bickel & Doksum, 1977, Chapter 5.2.B). Therefore, smaller
p-values indicate stronger evidence against the null hypothesis, and larger p-values indicate
stronger evidence in favor of the null. p-values are often reported instead of test statistics
because they are easier to interpret (to interpret a test statistic, one must compare it to the
critical values of the appropriate distribution; this comparison is performed in computing the
p-value). For deviations and trend-reversals, only the number of SCRs reached statistically
significant level for four (price and return deviations, price and spread trend-reversals) out
of the five event-types. Volatility events were highly correlated with BVP amplitude-related
features—significance levels less than 1% were obtained for both BVP amplitude features for
all three types of volatility events. Because the results were so similar across the three types
of volatility events (maximum volatility, price volatility, and return volatility), we averaged
the p-values over the three types of events in Table 2. Such patterns of autonomic responses
may indicate the presence of transient emotional responses to deviations and trend-reversal
events that occur within 10-second windows, while volatility events, defined in 5-minute
windows, elicited a tonic response in BVP.
To explore potential differences between experienced and less experienced traders, sample
of 10 traders was divided into two groups, each consisting of five traders, the first containing
highly experienced traders, and the second containing traders with low or moderate expe-
rience (see Table 5). The results for each of the two groups are reported in the two right
subpanels of Table 2, labelled “High Experience” and “Low or Moderate Experience”. The
experienced traders exhibited low correlations for deviations and trend-reversal events for
experienced traders. However, SCR responses exhibited as high correlation with volatility
10

events as did BVP amplitude. Less experienced traders showed a much higher number of sig-
nificant correlations between deviations and trend-reversals and the number of SCRs, BVP
amplitude, and even the number of temperature increases. In particular, Table 2 shows that
sessions with low- and moderate-experience traders yielded 11 p-values less than 5%, while
sessions with high-experience traders yielded only two p-values less than 5%. Volatility events
exhibited a common pattern of high correlation with BVP amplitude. The difference in cor-
relation patterns for deviations and trend-reversals observed in the fourth testing paradigm
indicate that less experienced traders may be more sensitive to short-term changes in the
market variables than their more experienced colleagues.
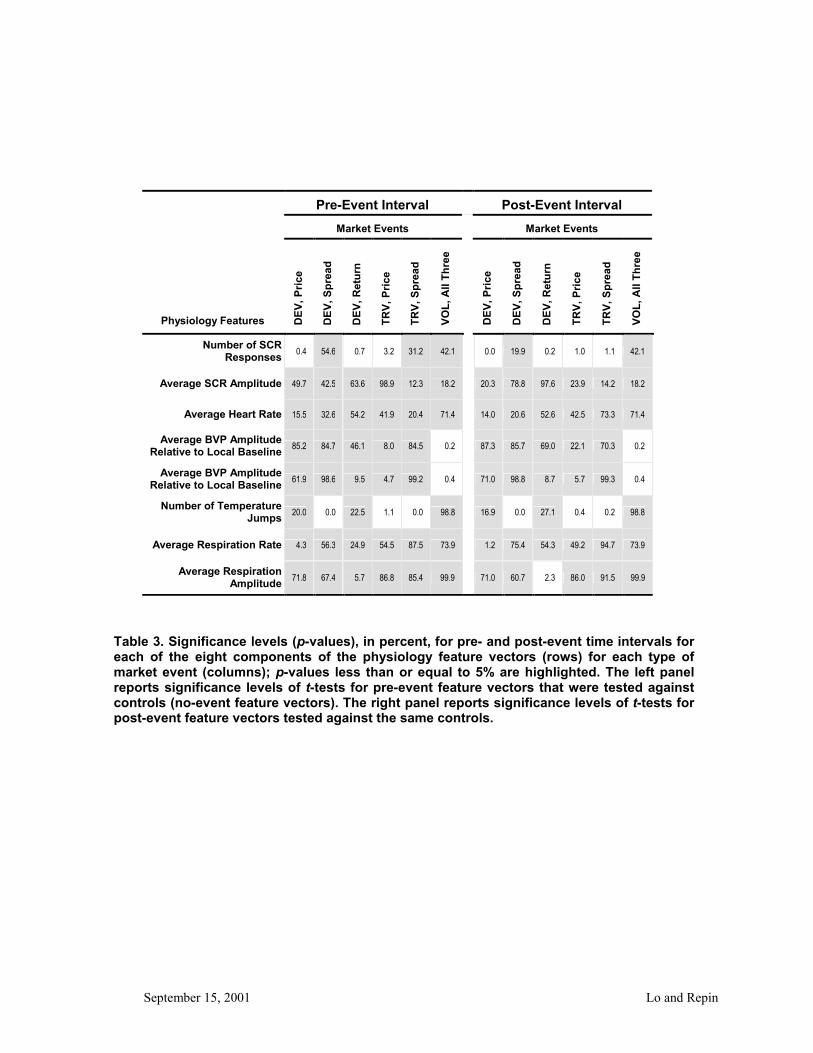
To address the third objective, 10-second intervals immediately preceding and imme-
diately following each deviation and trend-reversal event were compared to control (i.e.,
no-event) time intervals. Two separate t-tests were conducted—one for pre- and another
for post-event time intervals—for each of three types of deviations and two types of trend-
reversals. Because the objective is to detect differences in how pre- and post-event feature
vectors differed from the control, we used the same control feature vectors for both sets of
t-tests. In all cases, the t-tests were designed to test the null hypothesis that both pre- and
post-event feature vectors are statistically indistinguishable from the control feature vec-
tor. Surprisingly, these two sets of t-tests yielded very similar results, reported in Table 3,
implying that none of the physiological variables were predictors of anticipatory emotional
responses. These findings may be at least partly explained by the how the events were de-
fined. In particular, the definitions of deviation and trend-reversal events are those instances
where the time series achieved a prespecified deviation from the time-series mean and its
moving average, respectively. In the absence of large jumps, the values of the time series
near an event defined in this way are likely to be comparable to the event itself. There-
fore, the traders may be responding to market conditions occurring throughout the pre- and
post-event period, not just at the exact time of the event, hence the similarity between the
two periods. More complex definitions of events may allow us to discriminate between pre-
and post-event physiological responses, and we are exploring several alternatives in ongoing
research.
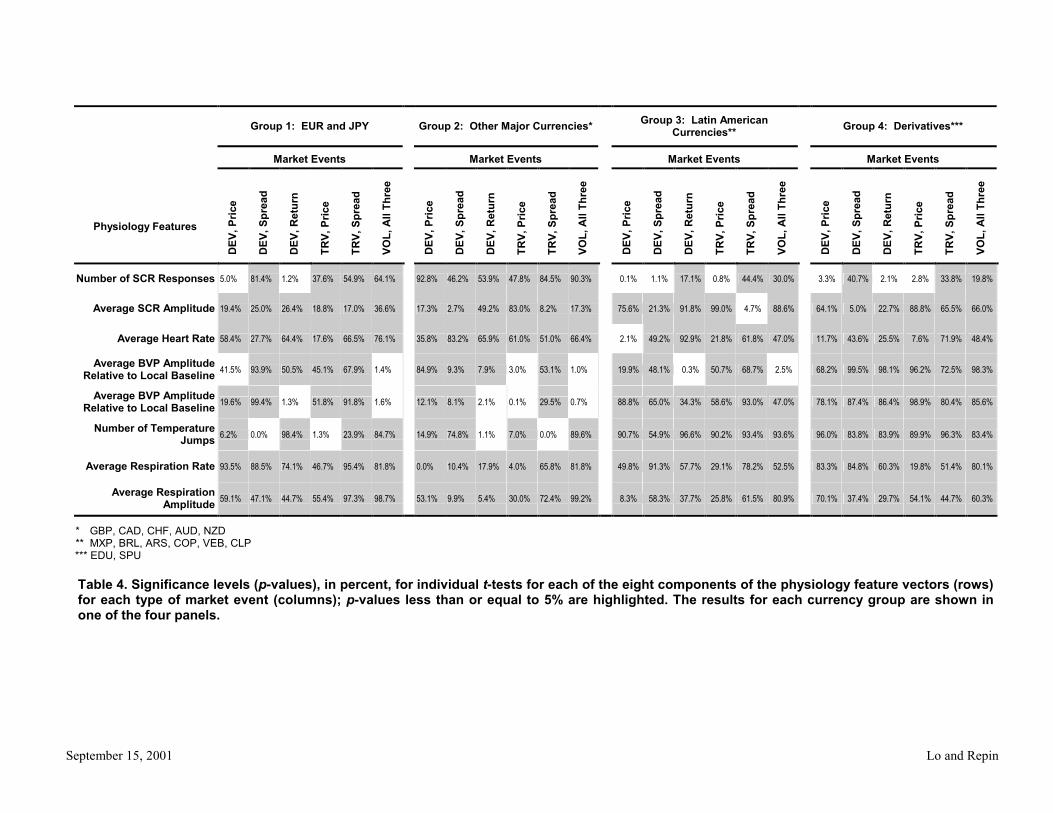
Finally, to address the fourth objective, the following four groups of financial instruments
were formed on the basis of similarity in their statistical characteristics:
11

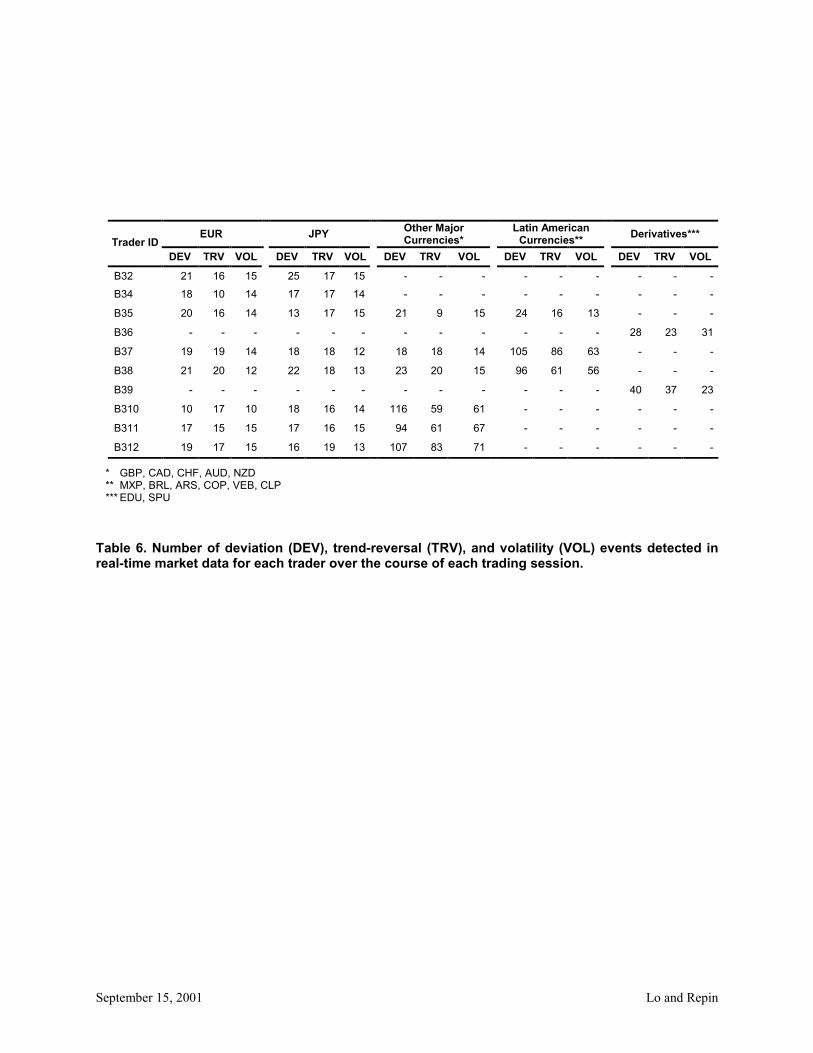
• Group 1: EUR, JPY
• Group 2: GBP, CAD, CHF, AUD, NZD (other major currencies)
• Group 3: MXP, BRL, ARS, COP, VEB, CLP (Latin American currencies)
• Group 4: SPU, EDU (derivatives)
Table 4 shows that for the major currencies (Groups 1 and 2), none of the physiological
features reached a significant level for deviations and trend-reversals. The correlation of
BVP amplitude and volatility events stayed reliably high. Latin American currencies (Group
3) exhibited correlation patterns very similar to first two testing paradigms for all types of
events. Derivatives (Group 4) demonstrated the same correlations for deviations and trend-
reversals as in the first two paradigms, but ceased to show any correlation between BVP
amplitude and volatility. The latter could be due to insufficient number of volatility events
available for derivatives time series (11 to 13 events of each type of volatility only).
Discussion
Our findings suggest that emotional responses are a significant factor in the real-time pro-
cessing of financial risks. Contrary to the common belief that emotions have no place in
rational financial decisionmaking processes, physiological variables associated with the auto-
nomic nervous system are highly correlated with market events even for highly experienced
professional traders. Moreover, the correlation patterns among variables and events differed
in important ways for less experienced traders, suggesting the possibility of relating trading
skills to certain physiological characteristics that can be measured.
More generally, our experiments demonstrate the feasibility of relating real-time quan-
titative changes in cognitive inputs (financial information) to corresponding quantitative
changes in physiological responses in a complex field environment. Despite the challenges of
such measurements, a wealth of information can be obtained regarding high-pressure deci-
sionmaking under uncertainty. Financial traders operate in a controlled environment where
the inputs and outputs of the decisions are carefully recorded, and where the subjects are
highly trained and provided with great economic incentives to make rational trading deci-
sions. Therefore, in vivo experiments in the securities trading context are likely to become
an important part of the empirical analysis of individual risk preferences and decisionmaking
12

processes. In particular, there is considerable anecdotal evidence that subjects involved in
professional trading activities perform very differently depending on whether actual gains
and losses are involved or if they are trading only with “play” money. Such distinctions have
been documented in other contexts; for example, it has been shown that different brain re-
gions are activated during a subject’s naturally occurring smile and a forced smile (Damasio,
1994). For this reason, measuring subjects while they are making decisions in their natural
environment is essential for any truly unbiased study of financial decisionmaking processes.
In capturing relations between cognitive inputs and affective reactions that are often
subconscious and of which subjects are not fully aware, our findings may be viewed more
generally as a study of cognitive-emotional interactions and the genesis of “intuition”. De-
cision processes based on intuition are characterized by low levels of cognitive control, low
conscious awareness, rapid processing rates, and a lack of clear organizing principles. When
intuitive judgments are formed, large numbers of cues are processed simultaneously, and the
task is not decomposed into subtasks (Hammond et al., 1987). Experts’ judgments are often
based on intuition, not on explicit analytical processing, making it almost impossible to fully
explain or replicate the process of how that judgment has been formed. This is particularly
germane to financial traders—as a group, they are unusually heterogeneous with respect to
educational background and formal analytical skills, yet the most successful traders seem to
trade based on their intuition about price swings and market dynamics, often without the
ability (or the need) to articulate a precise quantitative algorithm for making these complex
decisions (Schwager, 1989, 1991; Niederhoffer, 1997). Their intuitive trading “rules” are
based on the associations and relations between various information tokens that are formed
on a subconscious level, and our findings, and those in the extant cognitive sciences literature
suggest that decisions based on the intuitive judgments require not only cognitive but also
emotional mechanisms. A natural conjecture is that such emotional mechanisms are at least
partly responsible for the ability to form intuitive judgments and for those judgments to be
incorporated into a rational decisionmaking process.
Our findings may surprise some financial economists because of the apparent inconsis-
tency with market rationality, but a more sophisticated view of the role of emotion in human
cognition (Rolls, 1990, 1994, 1999) can reconcile any contradiction in a complete and intel-
lectually satisfying manner. Emotion is the basis for a reward-and-punishment system that
13
facilitates the selection of advantageous behavioral actions, providing the numeraire for ani-
mals to engage in a “cost-benefit analysis” of the various actions open to them (Rolls, 1999,
Chapter 10.3). From an evolutionary perspective, emotion is a powerful adaptation that
dramatically improves the efficiency with which animals learn from their environment and
their past.
These evolutionary underpinnings are more than simple speculation in the context of fi-
nancial traders. The extraordinary degree of competitiveness of global financial markets and
the outsize rewards that accrue to the “fittest” traders suggest that Darwinian selection—
financial selection, to be specific—is at work in determining the typical profile of the suc-
cessful trader. After all, unsuccessful traders are generally “eliminated” from the population
after suffering a certain level of losses. Our results indicate that emotion is a significant
determinant of the evolutionary fitness of financial traders. We hope to investigate this
conjecture more formally in the future in several ways: a comparison between traders and
a control group of subjects without trading experience or with unsuccessful trading experi-
ences; a more fundamental analysis of the neural basis of emotion in traders, aimed at the
function of the amygdala and the orbitofrontal cortex (Rolls, 1992; 1999, Chapters 4.4–4.5);
and a direct mapping of the neural centers for trading activity through functional magnetic
resonance imaging (Breiter et al., 2001).
It should be emphasized that because of the small sample size of 10 subjects, our findings
are, at best, suggestive and promising, not conclusive. A more comprehensive study with a
much larger sample, a more diverse set of events and subjects, and a broader set of controls
is necessary before coming to any firm conclusions regarding the precise mechanisms of the
psychophysiology of financial risk-processing.
Methods
Subjects
The 10 subjects’ descriptive characteristics are summarized in Table 5. Based on discussions
with their supervisors, the traders were categorized into three levels of experience: low,
moderate, and high. Five traders specialized in handling client order flow (“Retail”), three
specialized in trading foreign exchange (“FX”), and two specialized in interest-rate derivative
14

securities (“Derivatives”). The durations of the sessions ranged from 49 minutes to 83
minutes and all sessions were held during live trading hours, typically between 8am and
5pm, eastern daylight time.
Physiological Data Collection
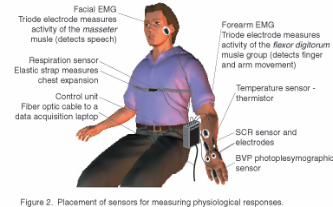
A ProComp+ data-acquisition unit and Biograph (Version 1.2) biofeedback software from
Thought Technologies, Ltd. were used to measure physiological data for all subjects. All
six sensors were connected to a small control unit with a battery power supply, which was
placed on each subject’s belt and from which a fiber-optic connection led to a laptop computer
equipped with real-time data acquisition software (see Figure 2). Each sensor was equipped
with a built-in notch filter at 60 Hz for automatic elimination of external power line noise, and
standard AgCl triode and single electrodes were used for SCR and EMG sensors, respectively.
The sampling rate for all data collection was fixed at 32 Hz. All physiological data except
for respiration and facial EMG were collected from each subject’s non-dominant arm. SCR
electrodes were placed on the palmar sites, the BVP photoplesymographic sensor was placed
on the inside of the ring or middle finger, the arm EMG triode electrode was placed on the
inside surface of the forearm, over the flexor digitorum muscle group, and the temperature
sensor was inserted between the elastic band placed around the wrist and the skin surface.
The facial EMG electrode was placed on a masseter muscle, which controls jaw movement
and is active during speech or any other activity involving the jaw. The respiration signal was
measured by chest expansion using a sensor attached to an elastic band placed around the
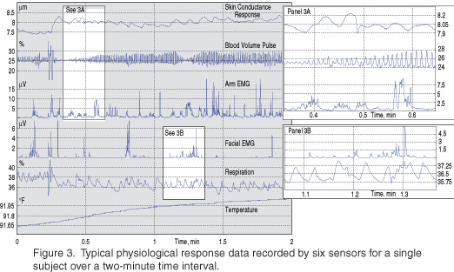
subject’s chest. An example of the real-time physiological data collected over a two-minute
interval for one subject is given in Figure 3.
The entire procedure of outfitting each subject with sensors and connecting the sensors
to the laptop required approximately five minutes, and was often performed either before the
trading day began or during relatively calm trading periods. Subjects indicated that presence
of the sensors, wires, and a control unit did not compromise or influence their trading in any
significant manner, and that their workflow was not impaired in any way. This was verified
not only by the subject, but also by their supervisors. Given the magnitudes of the financial
transactions that were being processed, and the economic and legal responsibilities that
the subjects and their supervisors bore, even the slightest interference with the subjects’
15
workflow or performance standards would have caused the supervisors or the subjects to
terminate the sessions immediately. None of the sessions were terminated prematurely.
Physiological Data Feature Extraction
An initial smoothing of the raw EMG signals (sampled at 32 Hz) was performed with a
moving-average filter of order 23. If the level of the filtered forearm EMG signal exceeded
a threshold of 0.75mV, both SCR and BVP readings at this time were discarded because
of the high probability of artifacts, e.g., typing, grasping telephone handsets, or inadvertent
physical disturbances to the sensors. Similarly, if the level of the filtered facial EMG signal
exceeded 0.75mV, the respiration signal at this time was excluded from further processing.
A very small spatial displacement of the sensor or the electrode was able to produce a
different kind of artifact—an abrupt change in the signal, of the order of 10 to 20 standard
deviations within 1/32 of a second. Such jumps did not have any physiological meaning,
hence they were excluded from further analysis via adaptive thresholding. Specifically, our
adaptive thresholding procedure involved marking all observations that differed by more
than 10 standard deviations from a local average (with both standard deviation and local
average computed over the most recent 30 seconds of data which, at a sampling rate of 32
Hz, yields 960 observations) and replacing these outliers with the immediately preceding
values. This procedure was then repeated until all such artifacts were eliminated. Finally,
irrelevant high-frequency signal components and noise were eliminated through a low-pass
filter that was individually designed for each of the physiological variables. The relatively
smooth nature of the SCR signals permitted the elimination of all harmonics above 1.5 Hz,
while the periodic structure of the BVP signals pushed the cut-off frequency to 4.5 Hz. Table
6 reports the means and standard deviations of the signals measured by the six sensors for
each of the 10 subjects. After pre-processing, feature vectors were constructed from SCR,
BVP, temperature, and respiration signals.
Financial Data Collection
At the start of each session, a common time-marker was set in the biofeedback unit and in
the subject’s trading console (a networked PC or workstation with real-time datafeeds such
as Bloomberg and Reuters) and software installed on the trading console (MarketSheet, by
16
Tibco, Inc.) stored all market data for the key financial instruments in an Excel spread-
sheet, time-stamped to the nearest second. The initial time-markers and time-stamped
spreadsheets allowed us to align the market and physiological data to within 0.5 seconds of
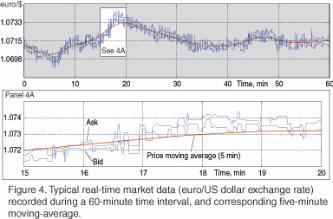
accuracy. Figure 4 displays an example of the real-time financial data—the euro/US-dollar
exchange rate—collected over a 60-minute interval.
Financial Data Feature Extraction
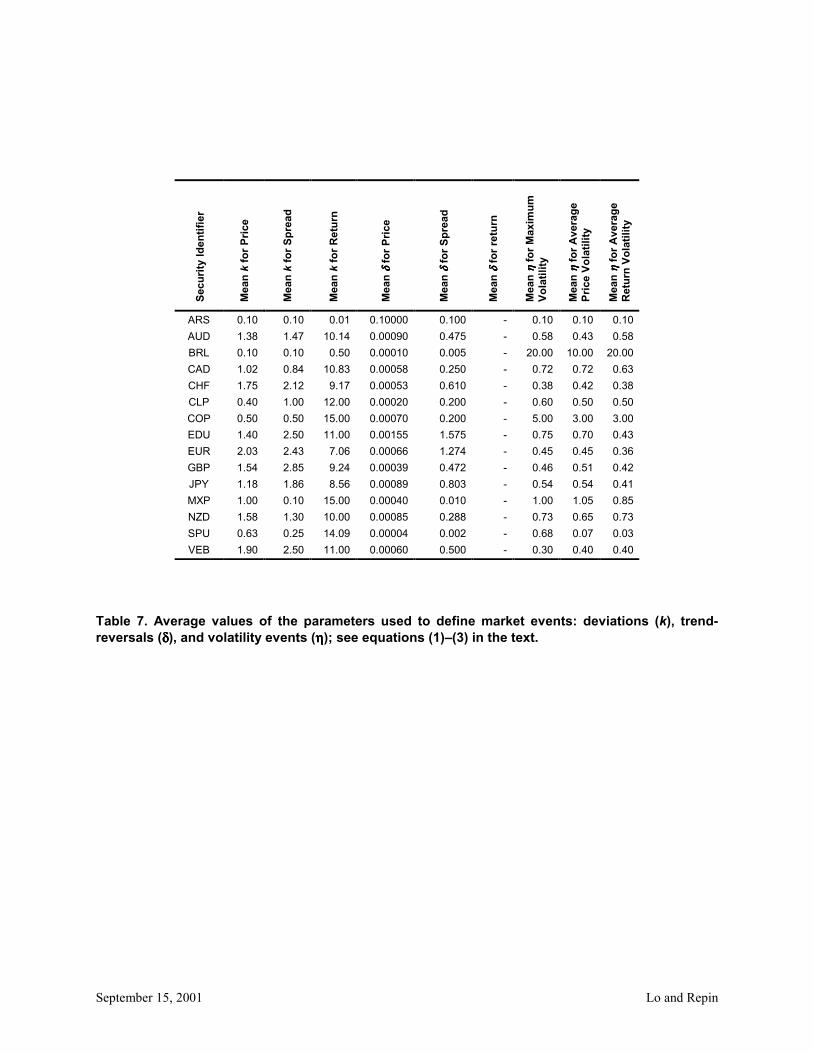
Deviations of a time series {Zt} were defined as those observations that deviated from the
series mean by a certain threshold, where the threshold was defined as a multiple k of
the standard deviation σz of the time series. Positive deviations were defined as those
observations Zt such that Zt > Z + kσz, and negative deviations were defined as those
observations Zt such that Zt < Z−kσz. The value of the multiplier k varied with the
particular series and session, and was calibrated to yield approximately five to 10 events per
session. Because the volatility of financial time series can vary across instruments and over
time, a single value of k for all subjects and instruments is clearly inappropriate. However, the
sole objective in our calibration procedure was to maintain an approximately equal number of
events for each time series in each session. Deviation events were defined for prices, spreads,
and returns. Table 7 reports the average values of k for each of the 15 financial instruments
in our study, which range from 0.10 for ARS and BRL (the Argentinian peso and Brazilian
real) to 2.03 for EUR (the euro) for price deviations, 0.10 for ARS, BRL, and MXP (the
Argentine peso, Brazilian real, and Mexican peso) to 2.85 for GBP (the British pound) for
spread deviations, and 0.01 for ARS (the Argentine peso) to 15.00 for COP and MXP (the
Colombian and Mexican peso) for return deviations.
Trend-reversal events were defined as instances when a time series {Zt} intersected its
five-minute moving-average MA5 min(Zt) (see, for example, Figure 4, Panel 4A). Positive
and negative trend-reversals were defined as those observations Zt such that Zt > (1 + δ) ·
MA5 min(Zt) and Zt < (1 − δ) ·MA5 min(Zt), respectively. The parameter δ also varied with
the particular series and session (see Table 7), ranging from an average of 0.0001 to 0.1 for
price series and 0.005 to 1.575 for spreads. Due to the high-frequency sampling rate (one
second), prices did not vary often from one observation to the next, hence most of the return
values were zero, making it difficult to define trends in returns. Therefore, we defined trend
17

reversals only for prices and spreads, excluding returns from this event category.
Three types of volatility events were defined for 5-minute time intervals, indexed by j,
based on the following statistics:
σ1
j =maxtj−300<τ≤tj Pτ −mintj−300<τ≤tj Pτ
1
2(maxtj−300<τ≤tj Pτ +mintj−300<τ≤tj Pτ )
(1)
σ2
j =
√
√
√
√
1
300
∑
tj−300<τ≤tj
(Pτ − Ptj)2 (2)
σ3
j =
√
√
√
√
1
300
∑
tj−300<τ≤tj
R2τ (3)
where P tj denotes the average price in the interval tj−300 to tj, and R2
τ is the squared
return between τ−1 and τ . We refer to σ1
j as “maximum volatility” since it is the difference
between the maximum and minimum prices as a fraction of their average, and σ2
j and σ3
j are
the standard deviations of prices and returns, respectively. “Plus” and “minus” volatility
events were then defined as those instances when
σlj > (1 + η) · σl
j−1(Plus Event) (4)
σlj < (1− η) · σl
j−1(Minus Event) (5)
for l = 1, 2, 3. The parameter η was calibrated to yield five or less volatility events per
session, and ranged from an average of 0.10 to 20.0 (see Table 7). For volatility events,
we calibrated the threshold to yield five or fewer events to ensure that the combined time
intervals containing volatility events comprised less than 50% of the total session time.
18

References
Barber, B., & Odean, T. (2001). Boys will be boys: gender, overconfidence, and commonstock investment. Quarterly Journal of Economics, 116, 261–29
Bechara, A., Damasio, H., Tranel, D., & Damasio, A.R. (1997). Deciding advantageouslybefore knowing the advantageous strategy. Science, 275, 1293–1294.
Bell, D. (1982). Risk premiums for decision regret. Management Science, 29, 1156–1166.
Bickel, P., & Doksum, K. (1977). Mathematical statistics: Basic ideas and selected topics.San Francisco, CA: Holden-Day, Inc.
Boucsein, W. (1992). Electrodermal activity. New York: Plenum Press.
Breiter, H., Aharon, I., Kahneman, D., Dale, A., & Shizgal, P. (2001). Functional imagingof neural responses to expectancy and experience of monetary gains and losses. Neuron,30, 619–639.
Brown, J.D. and Huffman, W.J. (1972). Psychophysiological measures of drivers under theactual driving conditions. Journal of Safety Research, 4, 172–178.
Cacioppo, J.T., Tassinary, L.G., & Bernt, G. (Eds.) (2000). Handbook of psychophysiology.Cambridge, UK: Cambridge University Press.
Cacioppo, J.T., Tassinary, L.G., & Fridlund, A. J. (1990). The skeletomotor system. InJ.T. Cacioppo,& L.G. Tassinary (Eds.), Principles of psychophysiology: physical, so-
cial, and inferential elements. Cambridge, UK: Cambridge University Press.
Clarke, R., Krase, S., & Statman, M. (1994). Tracking errors, regret, and tactical assetallocation. Journal of Portfolio Management, 20, 16–24.
Critchley, H.D., Elliot, R., Mathias, C.J., & Dolan, R. (1999). Central correlates of pe-ripheral arousal during a gambling task. Abstracts of the 21st International Summer
School of Brain Research, Amsterdam.
Damasio, A.R. (1994). Descartes’ error: Emotion, reason and the human brain. New York:Avon Books.
DeBond, W., & Thaler, R. (1986). Does the stock market overreact? Journal of Finance,40, 793–807.
Ekman, P. (1982). Methods for measuring facial action. In K. Scherer & P. Ekman (Eds.),Handbook of methods in nonverbal behavior research. Cambridge, UK: CambridgeUniversity Press.
Elster, J. (1998). Emotions and economic theory. Journal of Economic Literature, 36,47–74.
19

Fischoff, B., & Slovic, P. (1980). A little learning. . .: Confidence in multicue judgmenttasks. In R. Nickerson (Ed.), Attention and performance, VIII. Hillsdale, NJ: Erlbaum.
Frederikson, M., Furmark, T., Olsson, M.T., Fischer, H., Andersson, J., and Langstrom,B. (1998). Functional neuroanatomical correlates of electrodermal activity: A positronemission tomographic study. Psychophysiology, 35, 179–185.
Gervais, S., & Odean, T. (2001), Learning to be overconfident. Review of Financial Studies,14, 1–27.
Grossberg, S., & Gutowski, W. (1987). Neural dynamics of decision making under risk:Affective balance and cognitive-emotional interactions. Psychological Review, 94, 300–318.
Hammond, K.R., Hamm, R.M., Grassia, J., & Pearson, T. (1987). Direct comparison of theefficacy of intuitive and analytical cognition in expert judgment. IEEE Transactions
on Systems, Man, and Cybernetics, SMC-17, 753–770.
Huberman, G., & Regev, T. (2001). Contagious speculation and a cure for cancer: Anonevent that made stock prices soar. Journal of Finance, 56, 387–396.
Kahneman, D., & Tversky, A. (1979). Prospect theory: An analysis of decision makingunder risk. Econometrica, 47, 263–291.
Lichtenstein, S., Fischoff, B., & Phillips, L.D. (1982). Calibration of probabilities: The stateof the art to 1980. In D. Kahneman, P. Slovic, & A. Tversky (Eds.), Judgment underuncertainty: Heuristics and biases. Cambridge, UK: Cambridge University Press.
Lindholm, E., & Cheatham, C.M. (1983). Autonomic activity and workload during learn-ing of a simulated aircraft carrier landing task. Aviation, Space, and Environmental
Medicine, 54, 435–439.
Lo, A. W., 1999, The three P’s of total risk management. Financial Analysts Journal, 55,12–20.
Lorig, T. S., & Schwartz, G.E. (1990). The pulmonary system. In J.T. Cacioppo &L.G. Tassinary (Eds.), Principles of psychophysiology: Physical, social, and inferentialelements. Cambridge, UK: Cambridge University Press.
McIntosh, D.N., Zajonc, R.B., Vig, P.S., & Emerick, S.W. (1997). Facial movement, breath-ing, temperature, and affect: Implication of the vascular theory of emotional efference.Cognition and Emotion, 11, 171–195.
Niederhoffer, V. (1997). Education of a speculator. New York: John Wiley & Sons.
Odean, T. (1998). Are investors reluctant to realize their losses? Journal of Finance, 53,1775–1798.
Papillo, J.F., & Shapiro, D. (1990). The cardiovascular system. In J.T. Cacioppo &L.G. Tassinary (Eds.), Principles of psychophysiology: Physical, social, and inferentialelements. Cambridge, UK: Cambridge University Press.
20

Rimm-Kaufman, S.E., & Kagan, J. (1996). The psychological significance of changes inskin temperature. Motivation and Emotion, 20, 63–78.
Rolls, E. (1990). A theory of emotion, and its application to understanding the neural basisof emotion. Cognition and Emotion, 4, 161–190.
Rolls, E. (1992). Neurophysiology and functions of the primate amygdala. In J.P. Aggel-ton (Ed.), The amygdala: Neurobiological aspects of emotion, memory, and mental
dysfunction (pp. 143–166). New York: Wiley–Liss.
Rolls, E. (1994). A theory of emotion and consciousness, and its application to understand-ing the neural basis of emotion. In M.S. Gazzaniga (Ed.), The Cognitive Neurosciences,pp 1091–1106.
Rolls, E. (1999). The Brain and Emotion. Oxford, UK: Oxford University Press.
Samuelson, P.A.S. (1965). Proof that properly anticipated prices fluctuate randomly. In-dustrial Management Review, 6, 41–49.
Schwager, J.D. (1989). Market wizards: Interviews with top traders. New York: New YorkInstitute of Finance.
Schwager, J.D. (1992). The new market wizards: Conversations with America’s top traders.New York: HarperBusiness.
Shefrin, M., & Statman, M. (1985). The disposition to sell winners too early and ride loserstoo long: Theory and evidence. Journal of Finance 40, 777-790.
Shefrin, H. (2000). Beyond greed and fear: Understanding the behavioral finance and the
psychology of investing. Boston, MA: Harvard Business School Press.
Shefrin, H. (2001). Behavioral finance. Cheltenham, UK: Edward Elgar Publishing, Ltd.
Tversky, A., & Kahneman, D. (1981). The framing of decisions and the psychology ofchoice. Science, 211, 453–458.
21
September 15, 2001 Lo and Repin
Table 1. Summary statistics of physiological response data for all traders: means and standard deviations (S.D.) for each of the six sensors.
Facial EMG (µµµµV) Forearm EMG (µµµµV) SCR (µµµµm) TMP (°°°°C) BVP (%) RSP (%) Trader ID
Mean S.D. Mean S.D. Mean S.D. Mean S.D. Mean S.D. Mean S.D.
B32 1.23 1.46 8.84 25.69 3.32 1.38 30.7 0.13 23.34 6.31 34.20 1.69
B34 1.36 3.15 0.88 1.86 11.54 4.55 31.4 0.39 24.93 4.05 33.28 1.15
B35 1.26 1.65 3.31 3.57 2.16 2.71 31.3 0.74 25.00 6.60 35.57 1.65
B36 2.50 4.06 1.04 2.13 10.09 2.16 29.7 0.36 24.87 3.80 33.45 1.57
B37 2.73 18.53 3.66 18.84 3.96 1.73 28.7 0.67 25.06 3.27 31.04 2.43
B38 8.35 20.12 1.51 1.93 12.24 2.21 28.4 0.25 25.09 7.61 29.75 0.61
B39 1.96 2.64 0.36 1.85 25.09 3.40 29.6 0.15 25.10 6.72 36.65 1.08
B310 1.26 0.73 1.75 2.75 1.99 0.47 32.2 0.29 24.87 5.12 36.93 1.53
B311 1.37 8.59 1.85 10.22 28.87 2.10 33.3 0.55 25.21 8.82 33.12 1.61
B312 1.64 1.19 1.08 8.22 3.59 0.71 29.2 0.08 25.10 5.12 31.32 0.79
September 15, 2001 Lo and Repin
Table 2. Significance levels (p-values), in percent, for individual t-tests for each of the eight components of the physiology feature vectors (rows) for each type of market event (columns); p-values less than or equal to 5% are highlighted. The left panel gives aggregate results for all traders: in each t-test, values of each individual feature of the physiology feature vectors were tested against the same value of the control (no-event) feature vectors. Significance levels for traders with high experience and low or moderate experience are shown in the middle and right panels, respectively.
All Traders High Experience Low or Moderate Experience
Market Events Market Events Market Events
Physiology Features DEV
, Pric
e
DEV
, Spr
ead
DEV
, Ret
urn
TRV,
Pric
e
TRV,
Spr
ead
VOL,
All
Thre
e
DEV
, Pric
e
DEV
, Spr
ead
DEV
, Ret
urn
TRV,
Pric
e
TRV,
Spr
ead
VOL,
All
Thre
e
DEV
, Pric
e
DEV
, Spr
ead
DEV
, Ret
urn
TRV,
Pric
e
TRV,
Spr
ead
VOL,
All
Thre
e
Number of SCR Responses 0.4 54.6 0.7 3.2 31.2 42.1 54.5 36.7 23.1 94.4 91.2 1.9 0.4 71.7 5.0 16.0 52.4 47.9
Average SCR Amplitude 49.7 42.5 63.6 98.9 12.3 18.2 69.0 80.9 21.8 55.9 10.3 21.1 37.9 23.6 60.6 97.3 16.9 38.7
Average Heart Rate 15.5 32.6 54.2 41.9 20.4 71.4 38.4 1.4 41.7 77.3 15.3 97.8 17.4 46.5 29.0 24.9 17.2 8.1
Average BVP Amplitude Relative to Local Baseline 85.2 84.7 46.1 8.0 84.5 0.2 65.8 58.4 50.6 19.5 30.6 4.6 17.4 97.2 0.6 1.0 99.6 0.4
Average BVP Amplitude Relative to Local Baseline 61.9 98.6 9.5 4.7 99.2 0.4 97.4 76.8 26.0 66.5 94.6 3.8 1.4 99.9 0.6 2.5 99.9 1.9
Number of Temperature Jumps 20.0 0.0 22.5 1.1 0.0 98.8 16.0 99.9 99.9 67.5 16.0 16.1 8.9 0.1 0.3 12.0 0.0 97.5
Average Respiration Rate 4.3 56.3 24.9 54.5 87.5 73.9 91.3 80.9 31.6 25.2 56.0 51.8 3.4 87.4 11.5 77.8 99.5 79.1
Average Respiration Amplitude 71.8 67.4 5.7 86.8 85.4 99.9 40.6 20.0 48.8 11.5 4.6 67.3 53.6 13.8 11.0 92.9 98.4 99.9
September 15, 2001 Lo and Repin
Table 3. Significance levels (p-values), in percent, for pre- and post-event time intervals for each of the eight components of the physiology feature vectors (rows) for each type of market event (columns); p-values less than or equal to 5% are highlighted. The left panel reports significance levels of t-tests for pre-event feature vectors that were tested against controls (no-event feature vectors). The right panel reports significance levels of t-tests for post-event feature vectors tested against the same controls.
Pre-Event Interval Post-Event Interval Market Events Market Events
Physiology Features DEV
, Pric
e
DEV
, Spr
ead
DEV
, Ret
urn
TRV,
Pric
e
TRV,
Spr
ead
VOL,
All
Thre
e
DEV
, Pric
e
DEV
, Spr
ead
DEV
, Ret
urn
TRV,
Pric
e
TRV,
Spr
ead
VOL,
All
Thre
e
Number of SCR Responses 0.4 54.6 0.7 3.2 31.2 42.1 0.0 19.9 0.2 1.0 1.1 42.1
Average SCR Amplitude 49.7 42.5 63.6 98.9 12.3 18.2 20.3 78.8 97.6 23.9 14.2 18.2
Average Heart Rate 15.5 32.6 54.2 41.9 20.4 71.4 14.0 20.6 52.6 42.5 73.3 71.4
Average BVP Amplitude Relative to Local Baseline 85.2 84.7 46.1 8.0 84.5 0.2 87.3 85.7 69.0 22.1 70.3 0.2
Average BVP Amplitude Relative to Local Baseline 61.9 98.6 9.5 4.7 99.2 0.4 71.0 98.8 8.7 5.7 99.3 0.4
Number of Temperature Jumps 20.0 0.0 22.5 1.1 0.0 98.8 16.9 0.0 27.1 0.4 0.2 98.8
Average Respiration Rate 4.3 56.3 24.9 54.5 87.5 73.9 1.2 75.4 54.3 49.2 94.7 73.9
Average Respiration Amplitude 71.8 67.4 5.7 86.8 85.4 99.9 71.0 60.7 2.3 86.0 91.5 99.9
September 15, 2001 Lo and Repin
Group 1: EUR and JPY Group 2: Other Major Currencies* Group 3: Latin American Currencies** Group 4: Derivatives***
Market Events Market Events Market Events Market Events
Physiology Features D
EV, P
rice
DEV
, Spr
ead
DEV
, Ret
urn
TRV,
Pric
e
TRV,
Spr
ead
VOL,
All
Thre
e
DEV
, Pric
e
DEV
, Spr
ead
DEV
, Ret
urn
TRV,
Pric
e
TRV,
Spr
ead
VOL,
All
Thre
e
DEV
, Pric
e
DEV
, Spr
ead
DEV
, Ret
urn
TRV,
Pric
e
TRV,
Spr
ead
VOL,
All
Thre
e
DEV
, Pric
e
DEV
, Spr
ead
DEV
, Ret
urn
TRV,
Pric
e
TRV,
Spr
ead
VOL,
All
Thre
e
Number of SCR Responses 5.0% 81.4% 1.2% 37.6% 54.9% 64.1% 92.8% 46.2% 53.9% 47.8% 84.5% 90.3% 0.1% 1.1% 17.1% 0.8% 44.4% 30.0% 3.3% 40.7% 2.1% 2.8% 33.8% 19.8%
Average SCR Amplitude 19.4% 25.0% 26.4% 18.8% 17.0% 36.6% 17.3% 2.7% 49.2% 83.0% 8.2% 17.3% 75.6% 21.3% 91.8% 99.0% 4.7% 88.6% 64.1% 5.0% 22.7% 88.8% 65.5% 66.0%
Average Heart Rate 58.4% 27.7% 64.4% 17.6% 66.5% 76.1% 35.8% 83.2% 65.9% 61.0% 51.0% 66.4% 2.1% 49.2% 92.9% 21.8% 61.8% 47.0% 11.7% 43.6% 25.5% 7.6% 71.9% 48.4%
Average BVP Amplitude Relative to Local Baseline 41.5% 93.9% 50.5% 45.1% 67.9% 1.4% 84.9% 9.3% 7.9% 3.0% 53.1% 1.0% 19.9% 48.1% 0.3% 50.7% 68.7% 2.5% 68.2% 99.5% 98.1% 96.2% 72.5% 98.3%
Average BVP Amplitude Relative to Local Baseline 19.6% 99.4% 1.3% 51.8% 91.8% 1.6% 12.1% 8.1% 2.1% 0.1% 29.5% 0.7% 88.8% 65.0% 34.3% 58.6% 93.0% 47.0% 78.1% 87.4% 86.4% 98.9% 80.4% 85.6%
Number of Temperature Jumps 6.2% 0.0% 98.4% 1.3% 23.9% 84.7% 14.9% 74.8% 1.1% 7.0% 0.0% 89.6% 90.7% 54.9% 96.6% 90.2% 93.4% 93.6% 96.0% 83.8% 83.9% 89.9% 96.3% 83.4%
Average Respiration Rate 93.5% 88.5% 74.1% 46.7% 95.4% 81.8% 0.0% 10.4% 17.9% 4.0% 65.8% 81.8% 49.8% 91.3% 57.7% 29.1% 78.2% 52.5% 83.3% 84.8% 60.3% 19.8% 51.4% 80.1%
Average Respiration Amplitude 59.1% 47.1% 44.7% 55.4% 97.3% 98.7% 53.1% 9.9% 5.4% 30.0% 72.4% 99.2% 8.3% 58.3% 37.7% 25.8% 61.5% 80.9% 70.1% 37.4% 29.7% 54.1% 44.7% 60.3%
* GBP, CAD, CHF, AUD, NZD ** MXP, BRL, ARS, COP, VEB, CLP *** EDU, SPU
Table 4. Significance levels (p-values), in percent, for individual t-tests for each of the eight components of the physiology feature vectors (rows) for each type of market event (columns); p-values less than or equal to 5% are highlighted. The results for each currency group are shown in one of the four panels.

September 15, 2001 Lo and Repin
Table 5. Summary statistics for all subjects: individual trader’s characteristics, specialty, type and number of market time-series collected during the session, session duration, and absolute time (Eastern standard time) of the start of the session.
Trad
er ID
Gen
der
Expe
rienc
e
Spec
ialty
Mar
ket D
ata
Ava
ilabl
e
Num
ber o
f Mar
ket
Tim
e Se
ries
Rec
orde
d
Sess
ion
Dur
atio
n,
Min
and
Sec
Sess
ion
Star
t Tim
e
B33 F high retail major currencies 2 49’30’’ 13:20
B34 M high FX major currencies 3 83’32’’ 08:56
B35 M high retail major currencies 4 66’30’’ 11:02
B36 M high derivatives S&P500 futures, eurodollar futures 3 79’16’’ 12:55
B37 M moderate FX Latin American, major currencies 9 70’06’’ 09:17
B38 M low FX Latin American, major currencies 3 72’12’’ 11:02
B39 M high derivatives S&P500 futures, eurodollar futures 9 62’03’’ 08:19
B310 M low retail major currencies 7 60’08’’ 09:47
B311 M moderate retail major currencies 7 54’25’’ 11:32
B312 M low retail major currencies 7 59’00’’ 09:10
September 15, 2001 Lo and Repin
* GBP, CAD, CHF, AUD, NZD ** MXP, BRL, ARS, COP, VEB, CLP *** EDU, SPU Table 6. Number of deviation (DEV), trend-reversal (TRV), and volatility (VOL) events detected in real-time market data for each trader over the course of each trading session.
EUR JPY Other Major Currencies*
Latin American Currencies** Derivatives***
Trader ID DEV TRV VOL DEV TRV VOL DEV TRV VOL DEV TRV VOL DEV TRV VOL
B32 21 16 15 25 17 15 - - - - - - - - -B34 18 10 14 17 17 14 - - - - - - - - -
B35 20 16 14 13 17 15 21 9 15 24 16 13 - - -
B36 - - - - - - - - - - - - 28 23 31
B37 19 19 14 18 18 12 18 18 14 105 86 63 - - -
B38 21 20 12 22 18 13 23 20 15 96 61 56 - - -
B39 - - - - - - - - - - - - 40 37 23
B310 10 17 10 18 16 14 116 59 61 - - - - - -
B311 17 15 15 17 16 15 94 61 67 - - - - - -
B312 19 17 15 16 19 13 107 83 71 - - - - - -
September 15, 2001 Lo and Repin
Table 7. Average values of the parameters used to define market events: deviations (k), trend-reversals (δδδδ), and volatility events (ηηηη); see equations (1)–(3) in the text.
Secu
rity
Iden
tifie
r
Mea
n k
for P
rice
Mea
n k
for S
prea
d
Mea
n k
for R
etur
n
Mea
n δδ δδ
for P
rice
Mea
n δδ δδ
for S
prea
d
Mea
n δδ δδ
for r
etur
n
Mea
n ηη ηη
for M
axim
um
Vola
tility
Mea
n ηη ηη
for A
vera
ge
Pric
e Vo
latil
ity
Mea
n ηη ηη
for A
vera
ge
Ret
urn
Vola
tility
ARS 0.10 0.10 0.01 0.10000 0.100 - 0.10 0.10 0.10 AUD 1.38 1.47 10.14 0.00090 0.475 - 0.58 0.43 0.58 BRL 0.10 0.10 0.50 0.00010 0.005 - 20.00 10.00 20.00 CAD 1.02 0.84 10.83 0.00058 0.250 - 0.72 0.72 0.63 CHF 1.75 2.12 9.17 0.00053 0.610 - 0.38 0.42 0.38 CLP 0.40 1.00 12.00 0.00020 0.200 - 0.60 0.50 0.50 COP 0.50 0.50 15.00 0.00070 0.200 - 5.00 3.00 3.00 EDU 1.40 2.50 11.00 0.00155 1.575 - 0.75 0.70 0.43 EUR 2.03 2.43 7.06 0.00066 1.274 - 0.45 0.45 0.36 GBP 1.54 2.85 9.24 0.00039 0.472 - 0.46 0.51 0.42 JPY 1.18 1.86 8.56 0.00089 0.803 - 0.54 0.54 0.41 MXP 1.00 0.10 15.00 0.00040 0.010 - 1.00 1.05 0.85 NZD 1.58 1.30 10.00 0.00085 0.288 - 0.73 0.65 0.73 SPU 0.63 0.25 14.09 0.00004 0.002 - 0.68 0.07 0.03 VEB 1.90 2.50 11.00 0.00060 0.500 - 0.30 0.40 0.40