the puzzle of the missing greek exports
TRANSCRIPT
8/9/2019 The Puzzle of the Missing Greek Exports
http://slidepdf.com/reader/full/the-puzzle-of-the-missing-greek-exports 1/40
!"#$%!&'!)$'$*+
!,-.-/0, %12345 678 9 :;.3 <=7>
!"#$#%&" ($)
Financial Afairs
?@@' 7A<6BC78A D-.E0.3F?@@' 7=7GB8=G= D240.HF
IJ3 %;KKE3 -L HJ3 *0550.M N433O !P2-4H5
"Q3 RSQ34T U150E0O0 *0,J-;T )J405H-2J ".M3434

8/9/2019 The Puzzle of the Missing Greek Exports
http://slidepdf.com/reader/full/the-puzzle-of-the-missing-greek-exports 2/40
!"#$#%&" ()*+,- !"# %"&''#( )* '+# ,'!-- .- '+# /&"#0'."!'#12#(#"!3 -." 40.(.5&0 !(6 7&(!(0&!3
8--!&",9 ." )* #:;#"', %."<&(= &( !,,.0&!'&.( %&'+ '+#5> ?+# @!;#", !"# &('#(6#6 '. &(0"#!,#
!%!"#(#,, .- '+# '#0+(&0!3 %."< )#&(= 6.(# )* ,'!-- !(6 '. ,##< 0.55#(', !(6 ,A==#,'&.(, -."
-A"'+#" !(!3*,&,> ?+# B&#%, #:;"#,,#6 !"# '+# !A'+."C, !3.(# !(6 6. (.' (#0#,,!"&3* 0.""#,;.(6 '.
'+.,# .- '+# 4A".;#!( D.55&,,&.(>
D.55#(', !(6 #(EA&"&#, ,+.A36 )# !66"#,,#6 '.F
4A".;#!( D.55&,,&.(
/&"#0'."!'#12#(#"!3 -." 40.(.5&0 !(6 7&(!(0&!3 8--!&",
G(&' D.55A(&0!'&.(
H1IJKL H"A,,#3,
H#3=&A5
415!&3F #0-&(1&(-.M#0>#A".;!>#A
.!/0. 12345!
N#&'+#" '+# 4A".;#!( D.55&,,&.( (." !(* ;#",.( !0'&(= .( &', )#+!3- 5!* )# +#36 "#,;.(,&)3# -."
'+# A,# %+&0+ 5!* )# 5!6# .- '+# &(-."5!'&.( 0.('!&(#6 &( '+&, ;A)3&0!'&.(9 ." -." !(* #"".",
%+&0+9 6#,;&'# 0!"#-A3 ;"#;!"!'&.( !(6 0+#0<&(=9 5!* !;;#!">
?+&, ;!;#" #:&,', &( 4(=3&,+ .(3* !(6 0!( )# 6.%(3.!6#6 -".5
+'';FOO#0>#A".;!>#AO#0.(.5*P-&(!(0#O;A)3&0!'&.(,O>
Q."# &(-."5!'&.( .( '+# 4A".;#!( G(&.( &, !B!&3!)3# .( +'';FOO#A".;!>#A>
RD18S1IK1TIU14N1N V.(3&(#W RD18S1IK1TIU14N1D V;"&('W
SXHN LYU1LZ1YL1[TI\Y1L V.(3&(#W SXHN LYU1LZ1YL1[\III1I V;"&('W
6.&FIJ>ZY\TOYJJ[T V.(3&(#W 6.&FIJ>ZY\TOYYTLZ V;"&('W
] 4A".;#!( G(&.(9 ZJIK
^#;".6A0'&.( &, !A'+."&,#6 ;".B&6#6 '+# ,.A"0# &, !0<(.%3#6=#6>
8/9/2019 The Puzzle of the Missing Greek Exports
http://slidepdf.com/reader/full/the-puzzle-of-the-missing-greek-exports 3/40
European Commission
Directorate-General for Economic and Financial Affairs
The Puzzle of the Missing GreekExports
Uwe Böwer, Vasiliki Michou and Christoph Ungerer
Abstract
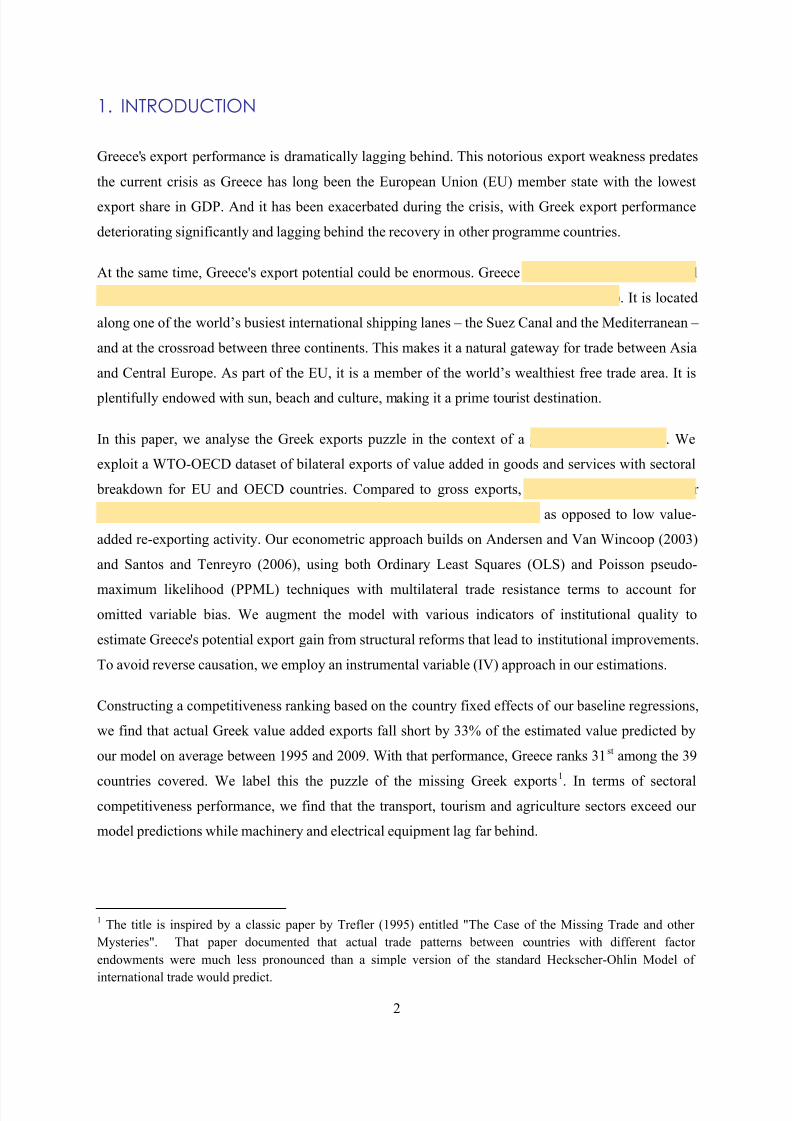
Why is Greece such a surprisingly closed economy? We employ a gravity model of trade to
explain the appallingly poor export performance of Greece and argue that weak institutional
quality accounts for a large part of this shortfall. Using a rich dataset of bilateral value-added
exports of goods and services of 39 exporters and 56 importers for 18 sectors, we first estimate that
Greece exports ⅓ less than what regular international trade patterns would predict on basis of
Greek GDP, the size of its trading partners and geographical distance. This ranks Greece at the
31st position out of 39 export countries in the competitiveness ranking we construct based on our
regressions. The most affected sectors include electrical equipment and machinery while
transport, tourism and agriculture perform relatively favourable. We then augment our model with
various measures of institutional quality and find that weak institutions can explain much of the
missing Greek exports puzzle. We estimate that structural reforms improving the Greek institutionalframework to the EU/OECD average level would close between ! and " of the Greek export
gap. These findings suggest that, while Greece has already achieved major improvements in cost
competitiveness since the start of the Greek adjustment programme, structural reforms must also
address non-cost competitiveness factors, such as the underlying institutional deficits, to unlock
Greece's export growth potential.
JEL Classification: C23; E02; F14
Keywords: Panel Data Models; Institutions and the Macroeconomy; Empirical Studies of Trade
Corresponding authors: Uwe Böwer ([email protected]), Vasiliki Michou
([email protected]), Christoph Ungerer ([email protected]) - European
Commission, Directorate General for Economic and Financial Affairs.
The paper has benefited from useful comments and suggestions by Servaas Deroose, Matthias Mors,
Jorge Duran Laguna, Gabriele Giudice, Mary McCarthy, Josefina Monteagudo, João Nogueira Martins,
Alessandro Turrini and Alessandra Tucci as well as seminar participants at DG ECFIN. All potential errors
are ours. The views presented in the paper are exclusively those of the authors and should not be
attributed to the European Commission.
EUROPEAN ECONOMY Economic Papers 518
8/9/2019 The Puzzle of the Missing Greek Exports
http://slidepdf.com/reader/full/the-puzzle-of-the-missing-greek-exports 4/40
2
1. INTRODUCTION
Greece's export performance is dramatically lagging behind. This notorious export weakness predates
the current crisis as Greece has long been the European Union (EU) member state with the lowest
export share in GDP. And it has been exacerbated during the crisis, with Greek export performance
deteriorating significantly and lagging behind the recovery in other programme countries.
At the same time, Greece's export potential could be enormous. Greece controls 16% of international
shipping, making it the world’s largest shipping nation (see BCG (2013), IOBE (2013)). It is located
along one of the world’s busiest international shipping lanes – the Suez Canal and the Mediterranean –
and at the crossroad between three continents. This makes it a natural gateway for trade between Asia
and Central Europe. As part of the EU, it is a member of the world’s wealthiest free trade area. It is
plentifully endowed with sun, beach and culture, making it a prime tourist destination.
In this paper, we analyse the Greek exports puzzle in the context of a gravity model of trade. We
exploit a WTO-OECD dataset of bilateral exports of value added in goods and services with sectoral
breakdown for EU and OECD countries. Compared to gross exports, this dataset ensures that our
analysis focuses on export activity that creates value and jobs in Greece, as opposed to low value-
added re-exporting activity. Our econometric approach builds on Andersen and Van Wincoop (2003)
and Santos and Tenreyro (2006), using both Ordinary Least Squares (OLS) and Poisson pseudo-
maximum likelihood (PPML) techniques with multilateral trade resistance terms to account for
omitted variable bias. We augment the model with various indicators of institutional quality to
estimate Greece's potential export gain from structural reforms that lead to institutional improvements.
To avoid reverse causation, we employ an instrumental variable (IV) approach in our estimations.
Constructing a competitiveness ranking based on the country fixed effects of our baseline regressions,
we find that actual Greek value added exports fall short by 33% of the estimated value predicted by
our model on average between 1995 and 2009. With that performance, Greece ranks 31 st among the 39
countries covered. We label this the puzzle of the missing Greek exports
1
. In terms of sectoralcompetitiveness performance, we find that the transport, tourism and agriculture sectors exceed our
model predictions while machinery and electrical equipment lag far behind.
1 The title is inspired by a classic paper by Trefler (1995) entitled "The Case of the Missing Trade and other
Mysteries". That paper documented that actual trade patterns between countries with different factor
endowments were much less pronounced than a simple version of the standard Heckscher-Ohlin Model of
international trade would predict.
8/9/2019 The Puzzle of the Missing Greek Exports
http://slidepdf.com/reader/full/the-puzzle-of-the-missing-greek-exports 5/40
3
Augmented with institutional quality indicators, our gravity model shows that weak institutions can
explain much of this weak Greek export performance. For Greece, we find that structural reforms that
improve the institutional framework to the average level of our EU-OECD country sample have the
potential to close the exports gap – the difference between actual export performance and gravity
model prediction - by between 54% and 78%, depending on the choice of the institutional indicator.
The remainder of this paper is organised as follows. Section 2 presents some stylised facts of Greece's
export performance in perspective. Section 3 puts our gravity model analysis in the context of the
existing literature and the overall methodology. Section 4 describes our dataset and specifies our
empirical approach. The results are presented in Section 5, showing that institutional quality explains
large parts of the Greek exports gap. Section 6 offers a concluding discussion on the results and
highlights some policy implications.
2. STYLISED FACTS: GREEK EXPORT PERFORMANCE IN PERSPECTIVE
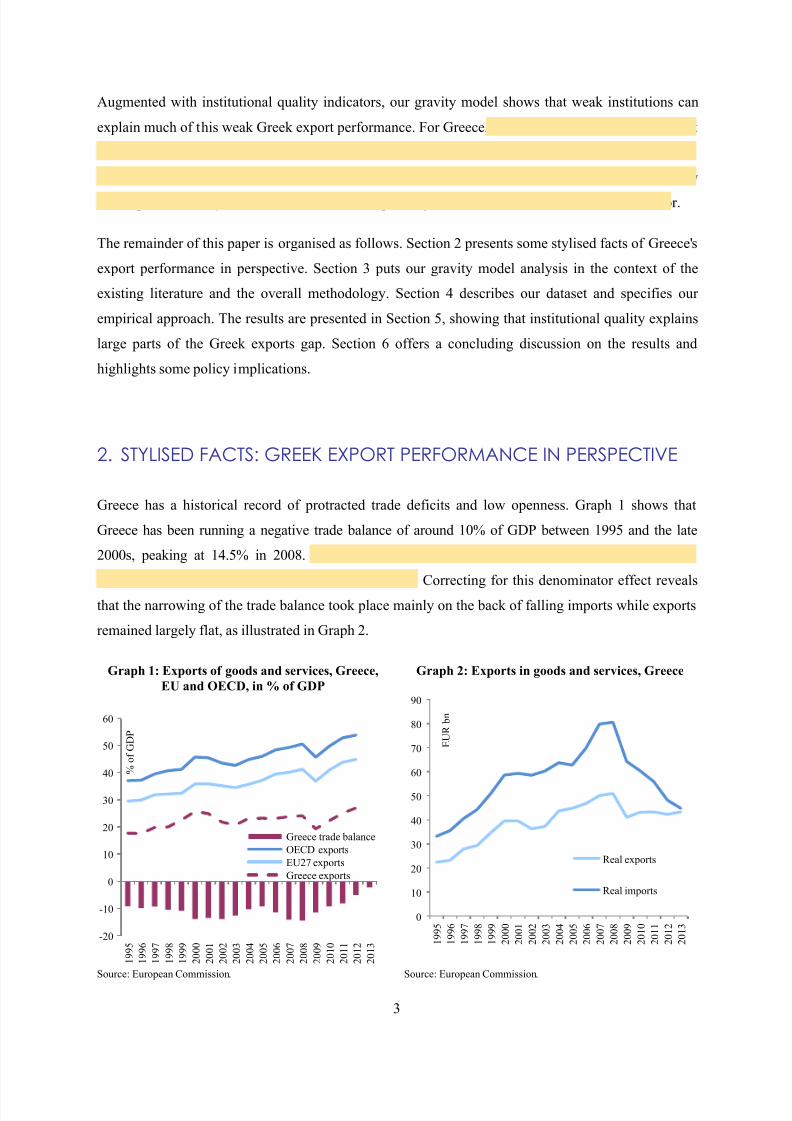
Greece has a historical record of protracted trade deficits and low openness. Graph 1 shows that
Greece has been running a negative trade balance of around 10% of GDP between 1995 and the late
2000s, peaking at 14.5% in 2008. Since then, the gap has been closing. However, the increasing
export-to-GDP ratio masks the effect of falling GDP. Correcting for this denominator effect reveals
that the narrowing of the trade balance took place mainly on the back of falling imports while exports
remained largely flat, as illustrated in Graph 2.
Graph 1: Exports of goods and services, Greece,
EU and OECD, in % of GDP
Graph 2: Exports in goods and services, Greece
Source: European Commission. Source: European Commission.
-20
-10
0
10
20
30
40
50
60
1 9 9 5
1 9 9 6
1 9 9 7
1 9 9 8
1 9 9 9
2 0 0 0
2 0 0 1
2 0 0 2
2 0 0 3
2 0 0 4
2 0 0 5
2 0 0 6
2 0 0 7
2 0 0 8
2 0 0 9
2 0 1 0
2 0 1 1
2 0 1 2
2 0 1 3
% o f G D P
Greece trade balance
OECD exports
EU27 exports
Greece exports
0
10
20
30
40
50
60
70
80
90
1 9 9 5
1 9 9 6
1 9 9 7
1 9 9 8
1 9 9 9
2 0 0 0
2 0 0 1
2 0 0 2
2 0 0 3
2 0 0 4
2 0 0 5
2 0 0 6
2 0 0 7
2 0 0 8
2 0 0 9
2 0 1 0
2 0 1 1
2 0 1 2
2 0 1 3
E U R b n
Real exports
Real imports
8/9/2019 The Puzzle of the Missing Greek Exports
http://slidepdf.com/reader/full/the-puzzle-of-the-missing-greek-exports 6/40
4
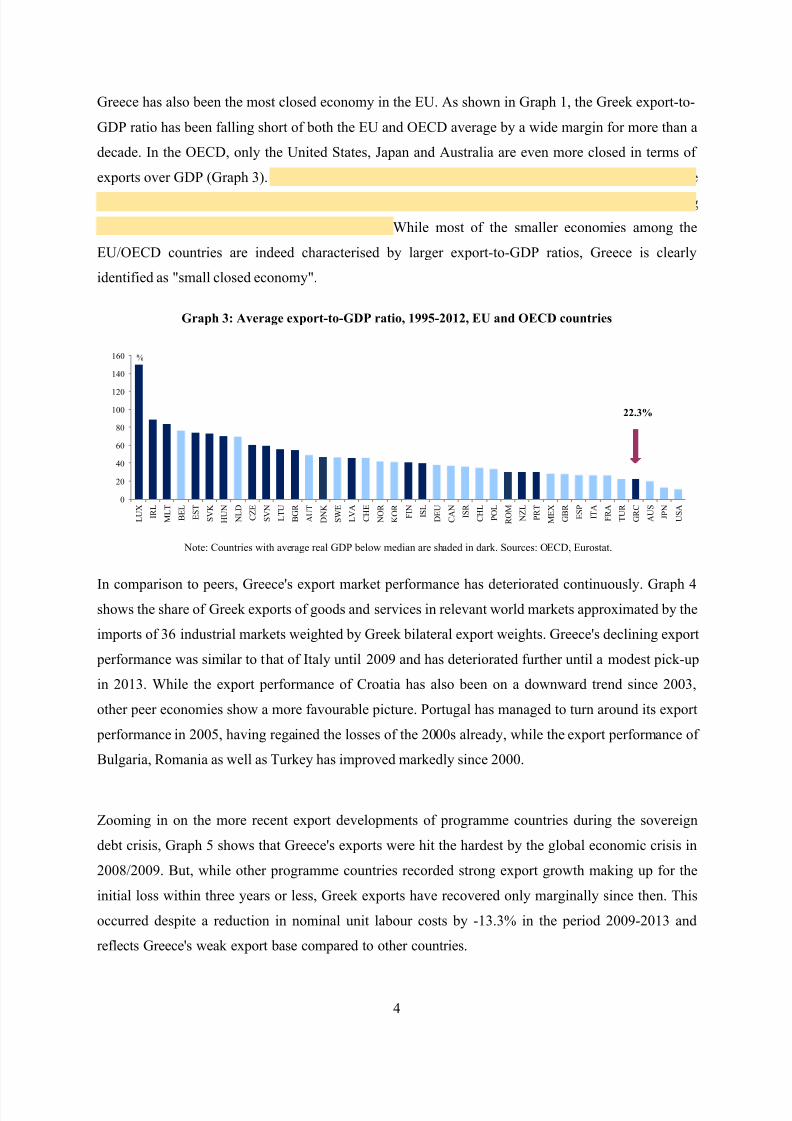
Greece has also been the most closed economy in the EU. As shown in Graph 1, the Greek export-to-
GDP ratio has been falling short of both the EU and OECD average by a wide margin for more than a
decade. In the OECD, only the United States, Japan and Australia are even more closed in terms of
exports over GDP (Graph 3). Greece's lack of openness stands out even more when controlling for the
size of the economy. Small economies are typically more open, which is reflected in Graph 3 showing
below-median-sized economies shaded in dark. While most of the smaller economies among the
EU/OECD countries are indeed characterised by larger export-to-GDP ratios, Greece is clearly
identified as "small closed economy".
Graph 3: Average export-to-GDP ratio, 1995-2012, EU and OECD countries
Note: Countries with average real GDP below median are shaded in dark. Sources: OECD, Eurostat.
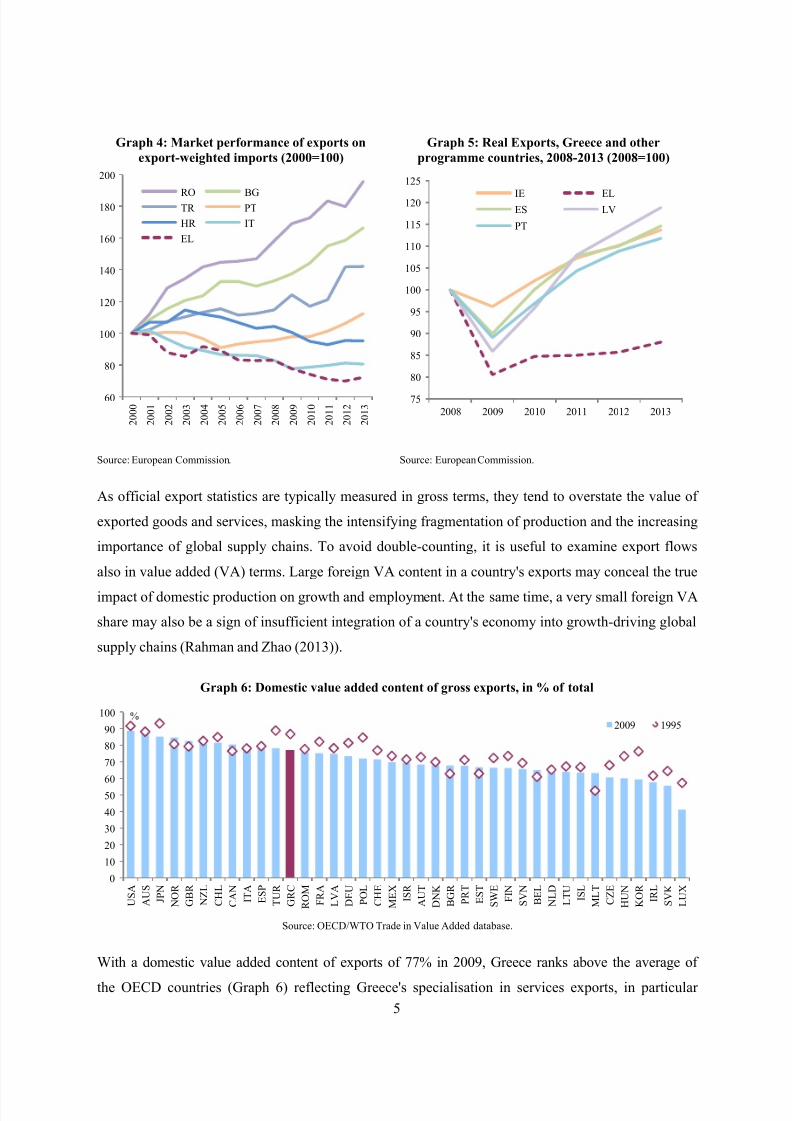
In comparison to peers, Greece's export market performance has deteriorated continuously. Graph 4shows the share of Greek exports of goods and services in relevant world markets approximated by the
imports of 36 industrial markets weighted by Greek bilateral export weights. Greece's declining export
performance was similar to that of Italy until 2009 and has deteriorated further until a modest pick-up
in 2013. While the export performance of Croatia has also been on a downward trend since 2003,
other peer economies show a more favourable picture. Portugal has managed to turn around its export
performance in 2005, having regained the losses of the 2000s already, while the export performance of
Bulgaria, Romania as well as Turkey has improved markedly since 2000.
Zooming in on the more recent export developments of programme countries during the sovereign
debt crisis, Graph 5 shows that Greece's exports were hit the hardest by the global economic crisis in
2008/2009. But, while other programme countries recorded strong export growth making up for the
initial loss within three years or less, Greek exports have recovered only marginally since then. This
occurred despite a reduction in nominal unit labour costs by -13.3% in the period 2009-2013 and
reflects Greece's weak export base compared to other countries.
0
20
40
60
80
100
120
140
160
L U X
I R L
M L T
B E L
E S T
S V K
H U N
N L D
C Z E
S V N
L T U
B G R
A U T
D N K
S W E
L V A
C H E
N O R
K O R
F I N I S
L
D E U
C A N
I S R
C H L
P O L
R O M
N Z L
P R T
M E X
G B R
E S P
I T A
F R A
T U R
G R C
A U S
J P N
U S A
%
22.3%
8/9/2019 The Puzzle of the Missing Greek Exports
http://slidepdf.com/reader/full/the-puzzle-of-the-missing-greek-exports 7/40
5
Graph 4: Market performance of exports on
export-weighted imports (2000=100)
Graph 5: Real Exports, Greece and other
programme countries, 2008-2013 (2008=100)
Source: European Commission. Source: European Commission.
As official export statistics are typically measured in gross terms, they tend to overstate the value of
exported goods and services, masking the intensifying fragmentation of production and the increasing
importance of global supply chains. To avoid double-counting, it is useful to examine export flows
also in value added (VA) terms. Large foreign VA content in a country's exports may conceal the true
impact of domestic production on growth and employment. At the same time, a very small foreign VA
share may also be a sign of insufficient integration of a country's economy into growth-driving global
supply chains (Rahman and Zhao (2013)).
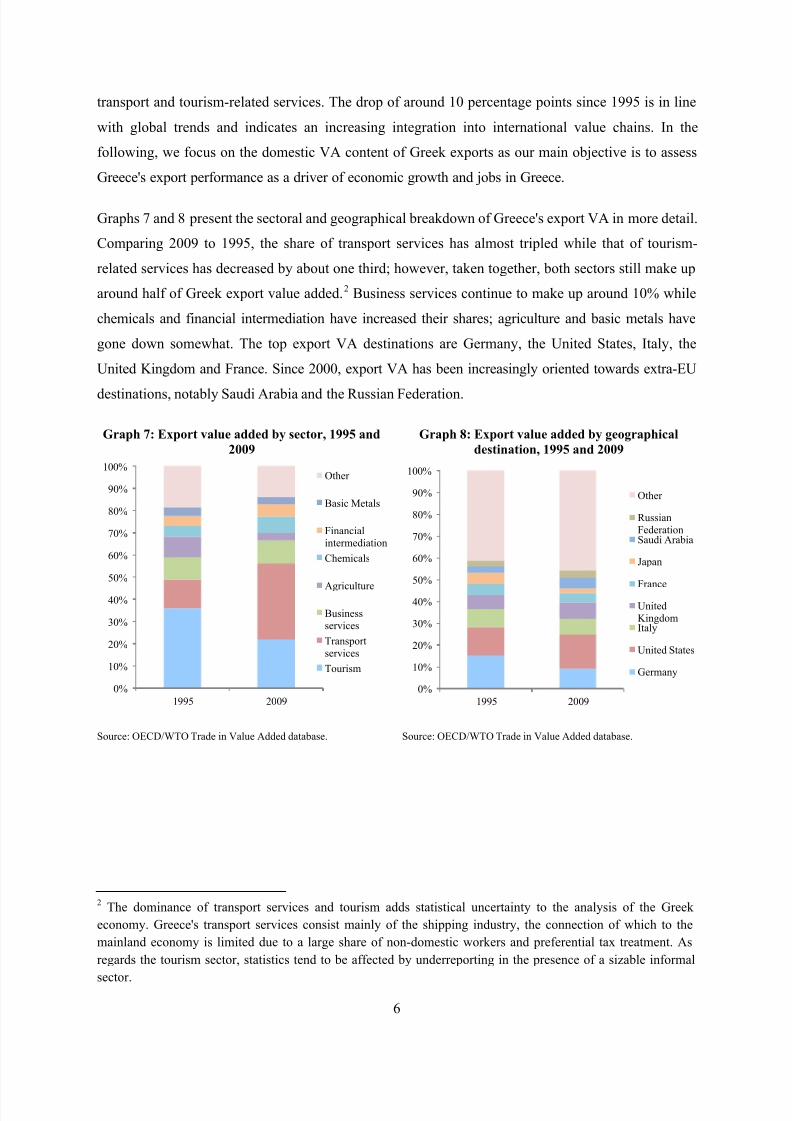
Graph 6: Domestic value added content of gross exports, in % of total
Source: OECD/WTO Trade in Value Added database.
With a domestic value added content of exports of 77% in 2009, Greece ranks above the average of
the OECD countries (Graph 6) reflecting Greece's specialisation in services exports, in particular
60
80
100
120
140
160
180
200
2 0 0 0
2 0 0 1
2 0 0 2
2 0 0 3
2 0 0 4
2 0 0 5
2 0 0 6
2 0 0 7
2 0 0 8
2 0 0 9
2 0 1 0
2 0 1 1
2 0 1 2
2 0 1 3
RO BGTR PT
HR IT
EL
75
80
85
90
95
100
105
110
115
120
125
2008 2009 2010 2011 2012 2013
IE ELES LV
PT
0
10
20
30
40
50
60
70
80
90
100
U S A
A U S
J P N
N O R
G B R
N Z L
C H L
C A N
I T A
E S P
T U R
G R C
R O M
F R A
L V A
D E U
P O L
C H E
M E X
I S R
A U T
D N K
B G R
P R T
E S T
S W E
F I N
S V N
B E L
N L D
L T U
I S L
M L T
C Z E
H U N
K O R
I R L
S V K
L U X
%2009 1995
8/9/2019 The Puzzle of the Missing Greek Exports
http://slidepdf.com/reader/full/the-puzzle-of-the-missing-greek-exports 8/40
6
transport and tourism-related services. The drop of around 10 percentage points since 1995 is in line
with global trends and indicates an increasing integration into international value chains. In the
following, we focus on the domestic VA content of Greek exports as our main objective is to assess
Greece's export performance as a driver of economic growth and jobs in Greece.
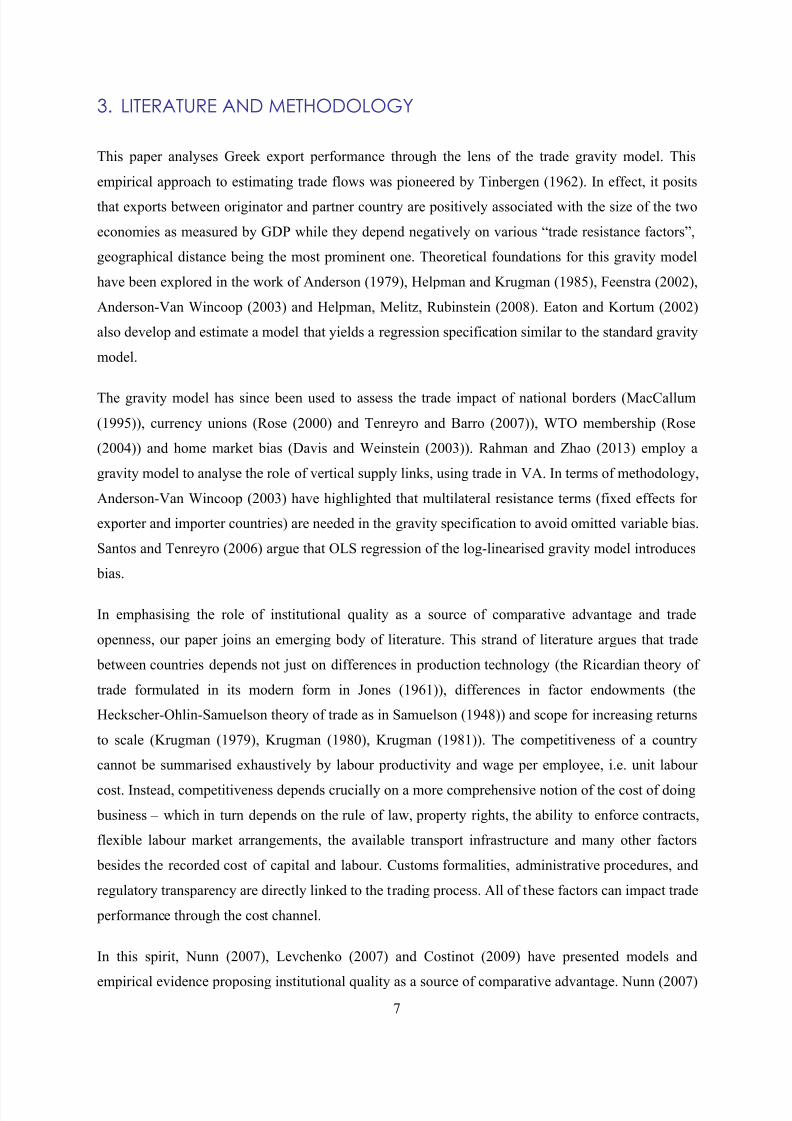
Graphs 7 and 8 present the sectoral and geographical breakdown of Greece's export VA in more detail.
Comparing 2009 to 1995, the share of transport services has almost tripled while that of tourism-
related services has decreased by about one third; however, taken together, both sectors still make up
around half of Greek export value added.2 Business services continue to make up around 10% while
chemicals and financial intermediation have increased their shares; agriculture and basic metals have
gone down somewhat. The top export VA destinations are Germany, the United States, Italy, the
United Kingdom and France. Since 2000, export VA has been increasingly oriented towards extra-EU
destinations, notably Saudi Arabia and the Russian Federation.
Graph 7: Export value added by sector, 1995 and
2009
Graph 8: Export value added by geographical
destination, 1995 and 2009
Source: OECD/WTO Trade in Value Added database. Source: OECD/WTO Trade in Value Added database.
2 The dominance of transport services and tourism adds statistical uncertainty to the analysis of the Greek
economy. Greece's transport services consist mainly of the shipping industry, the connection of which to the
mainland economy is limited due to a large share of non-domestic workers and preferential tax treatment. As
regards the tourism sector, statistics tend to be affected by underreporting in the presence of a sizable informal
sector.
0%
10%
20%
30%
40%
50%
60%
70%
80%
90%
100%
1995 2009
Other
Basic Metals
Financial
intermediation
Chemicals
Agriculture
Business
services
Transport
services
Tourism
0%
10%
20%
30%
40%
50%
60%
70%
80%
90%
100%
1995 2009
Other
Russian
FederationSaudi Arabia
Japan
France
United
KingdomItaly
United States
Germany
8/9/2019 The Puzzle of the Missing Greek Exports
http://slidepdf.com/reader/full/the-puzzle-of-the-missing-greek-exports 9/40
7
3. LITERATURE AND METHODOLOGY
This paper analyses Greek export performance through the lens of the trade gravity model. This
empirical approach to estimating trade flows was pioneered by Tinbergen (1962). In effect, it posits
that exports between originator and partner country are positively associated with the size of the two
economies as measured by GDP while they depend negatively on various “trade resistance factors”,
geographical distance being the most prominent one. Theoretical foundations for this gravity model
have been explored in the work of Anderson (1979), Helpman and Krugman (1985), Feenstra (2002),
Anderson-Van Wincoop (2003) and Helpman, Melitz, Rubinstein (2008). Eaton and Kortum (2002)
also develop and estimate a model that yields a regression specification similar to the standard gravity
model.
The gravity model has since been used to assess the trade impact of national borders (MacCallum
(1995)), currency unions (Rose (2000) and Tenreyro and Barro (2007)), WTO membership (Rose
(2004)) and home market bias (Davis and Weinstein (2003)). Rahman and Zhao (2013) employ a
gravity model to analyse the role of vertical supply links, using trade in VA. In terms of methodology,
Anderson-Van Wincoop (2003) have highlighted that multilateral resistance terms (fixed effects for
exporter and importer countries) are needed in the gravity specification to avoid omitted variable bias.
Santos and Tenreyro (2006) argue that OLS regression of the log-linearised gravity model introduces
bias.
In emphasising the role of institutional quality as a source of comparative advantage and trade
openness, our paper joins an emerging body of literature. This strand of literature argues that trade
between countries depends not just on differences in production technology (the Ricardian theory of
trade formulated in its modern form in Jones (1961)), differences in factor endowments (the
Heckscher-Ohlin-Samuelson theory of trade as in Samuelson (1948)) and scope for increasing returns
to scale (Krugman (1979), Krugman (1980), Krugman (1981)). The competitiveness of a country
cannot be summarised exhaustively by labour productivity and wage per employee, i.e. unit labour
cost. Instead, competitiveness depends crucially on a more comprehensive notion of the cost of doing
business – which in turn depends on the rule of law, property rights, the ability to enforce contracts,
flexible labour market arrangements, the available transport infrastructure and many other factors
besides the recorded cost of capital and labour. Customs formalities, administrative procedures, and
regulatory transparency are directly linked to the trading process. All of these factors can impact trade
performance through the cost channel.
In this spirit, Nunn (2007), Levchenko (2007) and Costinot (2009) have presented models and
empirical evidence proposing institutional quality as a source of comparative advantage. Nunn (2007)
8/9/2019 The Puzzle of the Missing Greek Exports
http://slidepdf.com/reader/full/the-puzzle-of-the-missing-greek-exports 10/40
8
concentrates on one channel through which contract enforcement affects the pattern of trade, which is
the under-investment in relationship-specific capital, and shows that contract enforcement explains
more of the global pattern of trade than countries’ endowments of capital and skilled labor combined.
Countries that specialise in contract intensive industries may have a greater incentive to develop and
maintain a good contracting environment. Levchenko (2007) supports that institutions matter because
they facilitate transactions between self-interested economic parties and shows that institutional
differences are in fact a significant determinant of trade flows, as countries with better institutions
specialise in goods that are institutionally dependent. Costinot (2009) develops a model where
complexity is the main source of institutional dependence across industries and better institutions and
higher levels of education are complementary sources of comparative advantage. He shows that
countries with better institutions and/or more human capital per worker will produce and export more
in the more complex industries.
Empirical studies that have augmented the gravity trade model with institutional quality indicators
include Anderson & Marcoullier (2002), de Groot, Linders, Rietveld and Subramanian (2004), Ranjan
and Lee (2007) and Shepherd and Wilson (2008). Anderson and Marcouiller (2002) use the gravity
model to demonstrate that bilateral trade is significantly affected by the trading countries’ institutional
quality, with better institutions leading to larger trade volumes. They contend that trade is reduced by
hidden transactions costs associated with the insecurity of international exchange: contracts may not
be enforceable across jurisdictional boundaries, bribes may be extorted by customs officials, and
shipments may even be hijacked. De Groot et al (2004) find that institutional quality as well as similar
quality of governance has a significant, positive and substantial impact on bilateral trade flows –
increasing the overall quality of institutions one standard deviation above its mean level would raise
bilateral exports by 44% and bilateral imports by 30%. They support that poor governance entails
negative externalities for private transactions, and consequently raises transaction costs with negative
effects on international trade. A low quality of governance increases the transaction costs that are
incurred in exchange. Moreover, the quality of formal rules affects the informal norms and procedures
of doing business that are devised to cope with transactional uncertainty. This creates the possibility
that countries with similar levels of institutional quality may be familiar with each other's business
practices, and thus transaction costs are reduced. Ranjan and Lee (2007) support that understanding
the determinants of actual, rather than potential, trade requires institutional analysis. They show that
measures of contract enforcement in importing and exporting countries affect bilateral trade in all
types of goods, having a larger impact on the trade in differentiated goods compared with
homogeneous goods. Shepherd and Wilson (2008) use a gravity model for ASEAN countries and find
that trade flows in Southeast Asia are particularly sensitive to transport infrastructure and information
communications.
8/9/2019 The Puzzle of the Missing Greek Exports
http://slidepdf.com/reader/full/the-puzzle-of-the-missing-greek-exports 11/40
9
Furthermore, Greece-specific empirical studies have contributed to the body of literature related to
competitiveness. Athanasoglou and Bardaka (2008) develop a demand function for Greece's exports of
manufactures and show – among others – that non-price competitiveness approximated with capital
stock plays a vital role in explaining export performance in the long run as well as in the short run.
Papazoglou (2007) also approaches Greece's potential exports through a gravity model and finds that
potential sizes exceed actual ones and their differential considerably widens over time. He attributes
this to the Greek economy's chronic structural weaknesses, which are the root cause of the low
competitiveness of domestic products.
4. OUR EMPIRICAL APPROACH: DATA AND MODEL SPECIFICATION
To analyse the performance of the Greek exporting industry in an estimated gravity model, we employ
the joint OECD/WTO Trade in Value Added (TiVA) dataset.3 Using this dataset instead of exports
from the national accounts allows us to study not only the overall bilateral export VA in goods and
services but also to break down our analysis into 18 different industry sectors of the economy.4 To
ensure relative homogeneity in our dataset, we restrict the sample of 39 exporter countries which are
either members of the EU or the OECD, excluding exporters with very different factor endowments,
such as Saudi-Arabia (oil) and China (labour). For the bilateral export destination countries, we use a
larger dataset of up to 56 countries with includes also emerging market economies.5 The overall
dataset covers the years 1995, 2000, 2005, 2008 and 2009, yielding up to 10,450 bilateral export
observations. We take GDP data from the IMF World Economic Outlook dataset. We use the bilateral
country-pair distance variable and additional trade resistance factors as provided by the CEPII gravity
project.6
Towards explaining the puzzle of the missing Greek exports, we augment the basic gravity model with
four different institutional quality indicators.
• Global Competitiveness Indicator (GCI) from the World Economic Forum. This indicator
ranges from 1 to 7 and is available starting in 2006.• World Bank Doing Business Distance to Frontier indicator (DB). This scores countries from
0-100 starting in 2006.
3 OECD/WTO Trade in Value Added dataset can be found on http://www.oecd.org/industry/ind/measuringtradeinvalue-
addedanoecd-wtojointinitiative.htm "
4 The appendix shows that the main result of the paper, underperformance of Greek exports in the traditional trade gravity
model, holds also if we analyse gross exports.
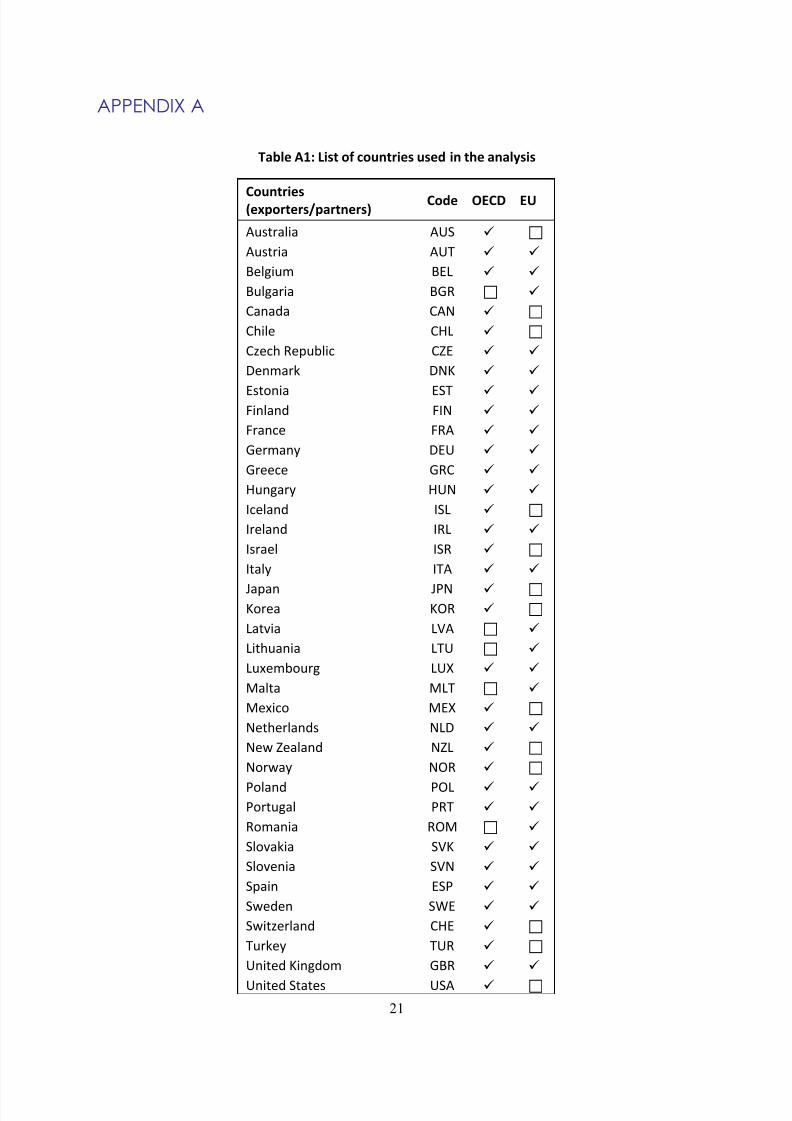
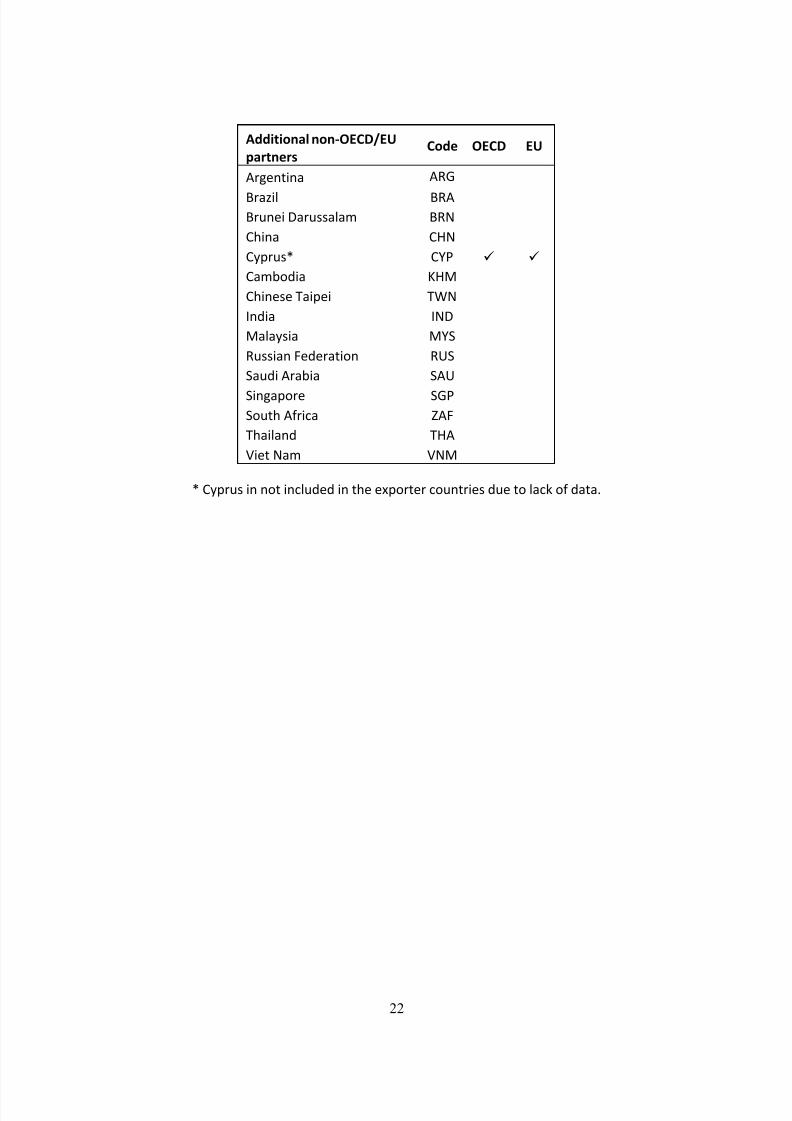
5 The full list of countries can be found in the Appendix.
#
CEPII gravity project can be found on http://www.cepii.fr/CEPII/en/bdd_modele/presentation.asp?id=8.
8/9/2019 The Puzzle of the Missing Greek Exports
http://slidepdf.com/reader/full/the-puzzle-of-the-missing-greek-exports 12/40
10
• World Bank Worldwide Governance Indicators (WGI).7 The score ranges from -2.5 to 2.5 and
is available since 1996.
• OECD Sustainable Governance Indicator (SGI). This gives a score from 0-10 and is available
only for 2009 and 2011.
Our baseline specification includes the standard components, explaining bilateral exports ( )
between exporter country i and partner country j for sector k at time t, by GDP of exporter and partner
country ( !"# ) as well as a vector of "trade resistance factors" (), including geographical
distance between the two countries and dummy variables for countries that share a common land
border, that were in a colonial relationship, that share a common official language and that have a
regional trade agreement in force. is the error term. In line with the literature, a logarithmic
functional relation is posited.
% 01
23 (Equation 1)
We then augment our model by adding measures of institutional quality in the exporter and partner
country, ( ) and ( ).
% 01
2 3
4 5 (Equation 2)
We estimate the basic gravity model using Ordinary Least Squares (OLS) and add country fixedeffects to the regression, yielding the classic gravity model specification proposed by Anderson-Van
Wincoop (2003). This controls for unobserved country fixed effects that determine the exporting
performance of the country besides its size, the size of trading partners and standard “trade resistance
factors”. We interpret this country fixed effect as an estimate of a country’s export competitiveness.
To address the concern of Santos and Tenreyro (2006) on bias in gravity model OLS regressions, we
also estimate the Anderson-van Wincoop specification without log-linearisation, using the Poisson
pseudo-maximum likelihood technique (PPML). Intuitively, Santos and Tenreyro (2006) report
heteroscedasticity in the disturbance term which increases in the GDP-size of trading partners.
Estimating the model in log-linearised form then introduces positive correlation between the GDP
statistics and the unobserved disturbance term of the transformed model, leading to biased OLS
estimates. The PPML approach they propose instead is robust to this issue.
The augmented gravity model includes indicators of institutional quality. To assess the causal impact
of institutional improvements on the export performance, however, we need to deal with the problem
$ Since no summary indicator for the Worldwide Governance Indicators is published, we use an equal-weighted average of
sub-indicators in the main regressions in table 2.
8/9/2019 The Puzzle of the Missing Greek Exports
http://slidepdf.com/reader/full/the-puzzle-of-the-missing-greek-exports 13/40
11
of reverse causality. For example, strong economic growth and export performance could generate the
fiscal resources necessary to sustain an improved institutional setting. In this case, we would see
positive correlation between export performance and institutional quality which would have little to do
with the economic gains generated by better institutions. We therefore resort to an instrumental
variable (IV) approach as in, for example, Nunn (2007), to estimate the causal effect of institutions on
exports. Intuitively, we determine the variation in today’s institutional quality that can be attributed to
legal origin (English, French, German etc). We then use only this part of the variation to analyse the
trade impact of better institutions. This avoids reverse causality in so far that strong economic
performance today cannot cause a change in the historical legal origin of a country – which was
determined, in most cases, centuries ago. In other words, the instrument (legal origin) is correlated
with the dependent variable (export VA) only through its influence on the regressor (the institutional
quality indicator).
5. RESULTS
5.1. BASELINE SPECIFICATION: ESTIMATING THE GREEK COMPETITIVENESS GAP
Regression results for estimating the overall Greek competitiveness gap, the first step of our analysis,
are presented in Table 1. At this stage, we restrict the dataset to aggregate export VA flows, excluding
export VA by sector for the moment. Specification 1 estimates the basic gravity model using OLS
regression. The results show significant coefficients with signs in line with expectations: larger GDPs
and lower distances are associated with higher export VA. Specification 2 controls for other "trade
resistance factors", namely shared border, shared colonial history, common official language and
membership in the same regional trade agreement (RTA) as well as time fixed effects. Their
coefficients are significant and positive, except for RTA which is negative but of small magnitude.
The coefficients of our key gravity variables remain virtually unchanged. In specification 3, we
employ country fixed effects as multilateral resistance terms to account for omitted variable bias.
Results do not change fundamentally, except for the RTA coefficient which turns positive but with
weaker significance. Specification 4 adopts the Anderson-van Wincoop approach using the Poisson
pseudo-maximum likelihood technique (PPML) without log-linearisation. As explained in Section 4,
this estimation approach is robust to heteroscedasticity in the trade gravity model and therefore
represents our preferred specification. Overall results remain similar although key coefficients tend to
be somewhat smaller and shared colonial history turns negative. The overall explanatory power of the
gravity model in this dataset is high as measured by the R-squared. This replicates the finding of many
8/9/2019 The Puzzle of the Missing Greek Exports
http://slidepdf.com/reader/full/the-puzzle-of-the-missing-greek-exports 14/40
12
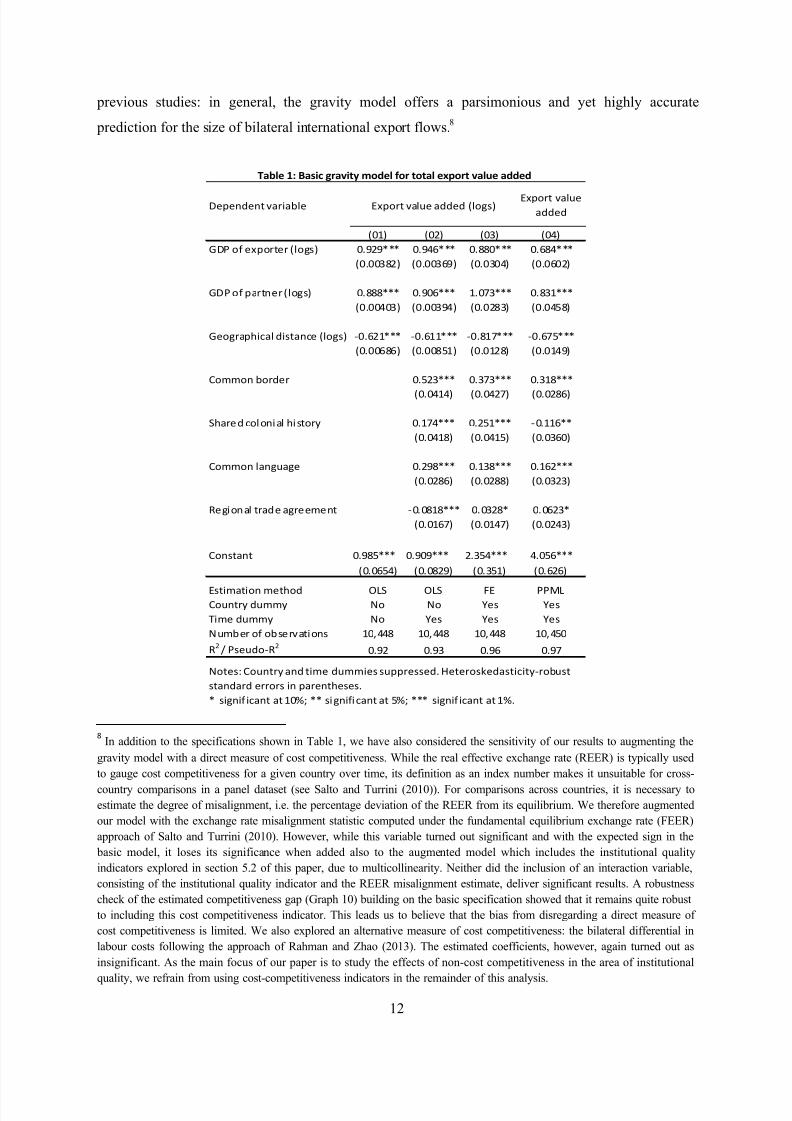
previous studies: in general, the gravity model offers a parsimonious and yet highly accurate
prediction for the size of bilateral international export flows.8
% In addition to the specifications shown in Table 1, we have also considered the sensitivity of our results to augmenting the
gravity model with a direct measure of cost competitiveness. While the real effective exchange rate (REER) is typically used
to gauge cost competitiveness for a given country over time, its definition as an index number makes it unsuitable for cross-
country comparisons in a panel dataset (see Salto and Turrini (2010)). For comparisons across countries, it is necessary to
estimate the degree of misalignment, i.e. the percentage deviation of the REER from its equilibrium. We therefore augmented
our model with the exchange rate misalignment statistic computed under the fundamental equilibrium exchange rate (FEER)
approach of Salto and Turrini (2010). However, while this variable turned out significant and with the expected sign in the
basic model, it loses its significance when added also to the augmented model which includes the institutional quality
indicators explored in section 5.2 of this paper, due to multicollinearity. Neither did the inclusion of an interaction variable,
consisting of the institutional quality indicator and the REER misalignment estimate, deliver significant results. A robustness
check of the estimated competitiveness gap (Graph 10) building on the basic specification showed that it remains quite robust
to including this cost competitiveness indicator. This leads us to believe that the bias from disregarding a direct measure of
cost competitiveness is limited. We also explored an alternative measure of cost competitiveness: the bilateral differential in
labour costs following the approach of Rahman and Zhao (2013). The estimated coefficients, however, again turned out as
insignificant. As the main focus of our paper is to study the effects of non-cost competitiveness in the area of institutional
quality, we refrain from using cost-competitiveness indicators in the remainder of this analysis.
&'(')*')+ ,-./-01'
2345 2365 2375 2385
9&: ;< '=(;.+'. 21;>?5 3"@6@AAA 3"@8#AAA 3"%%3AAA 3"#%8AAA
23"337%65 23"337#@5 23"37385 23"3#365
9&: ;< (-.+)'. 21;>?5 3"%%%AAA 3"@3#AAA 4"3$7AAA 3"%74AAA
23"338375 23"337@85 23"36%75 23"38B%5
9';>.-(C/D-1 */?+-)D' 21;>?5 E3"#64AAA E3"#44AAA E3"%4$AAA E3"#$BAAA
23"33#%#5 23"33%B45 23"346%5 23"348@5
F;GG;) 0;.*'. 3"B67AAA 3"7$7AAA 3"74%AAA
23"38485 23"386$5 23"36%#5
HC-.'* D;1;)/-1 C/?+;.I 3"4$8AAA 3"6B4AAA E3"44#AA
23"384%5 23"384B5 23"37#35
F;GG;) 1-)>J->' 3"6@%AAA 3"47%AAA 3"4#6AAA
23"36%#5 23"36%%5 23"37675
K'>/;)-1 +.-*' ->.''G')+ E3"3%4%AAA 3"376%A 3"3#67A
23"34#$5 23"348$5 23"36875
F;)?+-)+ 3"@%BAAA 3"@3@AAA 6"7B8AAA 8"3B#AAA
23"3#B85 23"3%6@5 23"7B45 23"#6#5
L?+/G-+/;) G'+C;* MNH MNH OL ::PNF;J)+.I *JGGI Q; Q; R'? R'?
S/G' *JGGI Q; R'? R'? R'?
QJG0'. ;< ;0?'.,-+/;)? 43T88% 43T88% 43T88% 43T8B3
K6
U :?'J*;EK6
3"@6 3"@7 3"@# 3"@$
A ?/>)/< /D-)+ -+ 43VW AA ?/>)/</ D-)+ -+ BVW AAA ?/>)/< /D-)+ -+ 4V"
Q;+'?X F;J)+.I -)* +/G' *JGG/'? ?J((.'??'*" Y'+'.;?Z'*-?+/D/+IE.;0J?+
?+-)*-.* '..;.? /) (-.')+C'?'?"
"#$%& '( )#*+, -.#/+01 234&% 53. 030#% &673.0 /#%8& #44&4
L=(;.+ ,-1J' -**'* 21;>?5L=(;.+ ,-1J'
-**'*
8/9/2019 The Puzzle of the Missing Greek Exports
http://slidepdf.com/reader/full/the-puzzle-of-the-missing-greek-exports 15/40
13
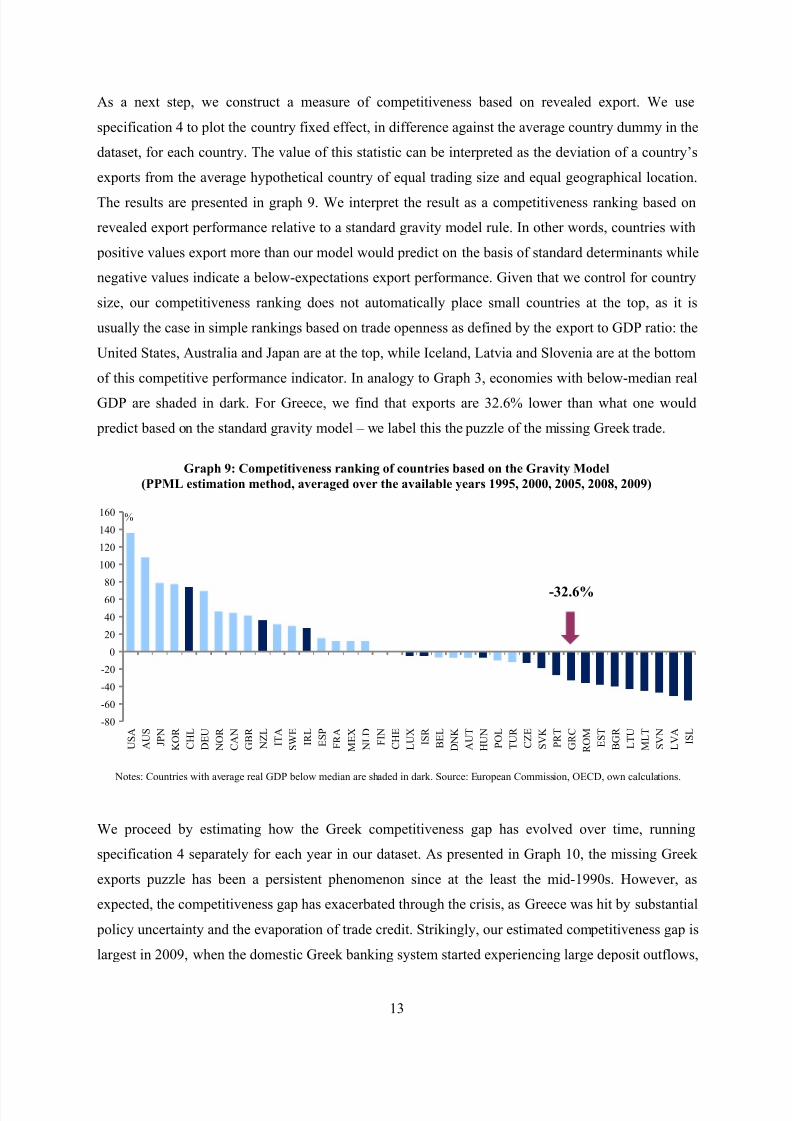
As a next step, we construct a measure of competitiveness based on revealed export. We use
specification 4 to plot the country fixed effect, in difference against the average country dummy in the
dataset, for each country. The value of this statistic can be interpreted as the deviation of a country’s
exports from the average hypothetical country of equal trading size and equal geographical location.
The results are presented in graph 9. We interpret the result as a competitiveness ranking based on
revealed export performance relative to a standard gravity model rule. In other words, countries with
positive values export more than our model would predict on the basis of standard determinants while
negative values indicate a below-expectations export performance. Given that we control for country
size, our competitiveness ranking does not automatically place small countries at the top, as it is
usually the case in simple rankings based on trade openness as defined by the export to GDP ratio: the
United States, Australia and Japan are at the top, while Iceland, Latvia and Slovenia are at the bottom
of this competitive performance indicator. In analogy to Graph 3, economies with below-median real
GDP are shaded in dark. For Greece, we find that exports are 32.6% lower than what one would
predict based on the standard gravity model – we label this the puzzle of the missing Greek trade.
Graph 9: Competitiveness ranking of countries based on the Gravity Model
(PPML estimation method, averaged over the available years 1995, 2000, 2005, 2008, 2009)
Notes: Countries with average real GDP below median are shaded in dark. Source: European Commission, OECD, own calculations.
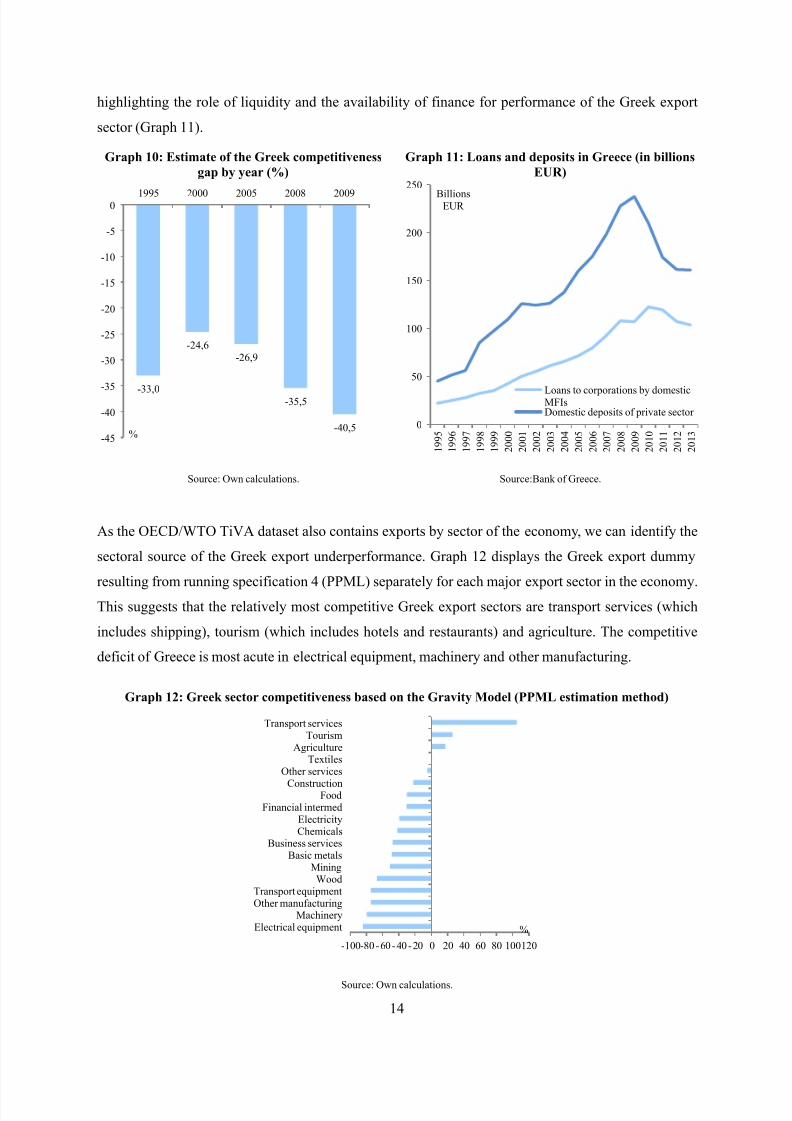
We proceed by estimating how the Greek competitiveness gap has evolved over time, running
specification 4 separately for each year in our dataset. As presented in Graph 10, the missing Greek
exports puzzle has been a persistent phenomenon since at the least the mid-1990s. However, as
expected, the competitiveness gap has exacerbated through the crisis, as Greece was hit by substantial
policy uncertainty and the evaporation of trade credit. Strikingly, our estimated competitiveness gap is
largest in 2009, when the domestic Greek banking system started experiencing large deposit outflows,
-80
-60
-40
-20
0
20
40
60
80
100
120
140
160
U S A
A U S
J P N
K O R
C H L
D E U
N O R
C A N
G B R
N Z L
I T A
S W E
I R L
E S P
F R A
M E X
N L D
F I N
C H E
L U X
I S R
B E L
D N K
A U T
H U N
P O L
T U R
C Z E
S V K
P R T
G R C
R O M
E S T
B G R
L T U
M L T
S V N
L V A
I S L
%
-32.6%
8/9/2019 The Puzzle of the Missing Greek Exports
http://slidepdf.com/reader/full/the-puzzle-of-the-missing-greek-exports 16/40
14
highlighting the role of liquidity and the availability of finance for performance of the Greek export
sector (Graph 11).
Graph 10: Estimate of the Greek competitiveness
gap by year (%)
Graph 11: Loans and deposits in Greece (in billions
EUR)
Source: Own calculations. Source:Bank of Greece.
As the OECD/WTO TiVA dataset also contains exports by sector of the economy, we can identify the
sectoral source of the Greek export underperformance. Graph 12 displays the Greek export dummy
resulting from running specification 4 (PPML) separately for each major export sector in the economy.
This suggests that the relatively most competitive Greek export sectors are transport services (which
includes shipping), tourism (which includes hotels and restaurants) and agriculture. The competitive
deficit of Greece is most acute in electrical equipment, machinery and other manufacturing.
Graph 12: Greek sector competitiveness based on the Gravity Model (PPML estimation method)
Source: Own calculations.
-33,0
-24,6
-26,9
-35,5
-40,5-45
-40
-35
-30
-25
-20
-15
-10
-5
01995 2000 2005 2008 2009
%0
50
100
150
200
250
1 9 9 5
1 9 9 6
1 9 9 7
1 9 9 8
1 9 9 9
2 0 0 0
2 0 0 1
2 0 0 2
2 0 0 3
2 0 0 4
2 0 0 5
2 0 0 6
2 0 0 7
2 0 0 8
2 0 0 9
2 0 1 0
2 0 1 1
2 0 1 2
2 0 1 3
BillionsEUR
Loans to corporations by domesticMFIsDomestic deposits of private sector
-100-80-60-40-20 0 20 40 60 80 100120
Electrical equipmentMachinery
Other manufacturingTransport equipment
WoodMining
Basic metalsBusiness services
ChemicalsElectricity
Financial intermedFood
Construction
Other servicesTextiles
AgricultureTourism
Transport services
%
8/9/2019 The Puzzle of the Missing Greek Exports
http://slidepdf.com/reader/full/the-puzzle-of-the-missing-greek-exports 17/40
15
5.2. AUGMENTED SPECIFICATION: THE ROLE OF INSTITUTIONS
High and increasing labour costs during the boom of the 2000s are a common narrative to explain the
Greek trade deficits accumulated before the crisis. Indeed, the Greek real effective exchange rate (in
terms of unit labour costs) increased by 19.4% between 2000-2009 relative to 37 other industrialised
countries. However, Graph 10 shows that the puzzle of the missing Greek exports goes back beyond
the 2000s. Furthermore, despite a sharp improvement in cost competitiveness since the start of the
Greek adjustment programme, Greek export performance has continued to lag behind so far.
This section therefore explores whether non-cost competitiveness factors, specifically the intrinsic
Greek institutional deficit, can help explain the puzzle of the missing Greek exports. Intuitively, we
expect that weak public institutions raise the effective cost of doing business, and in particular, the
cost of engaging in export activities. This could explain why, after controlling for basic geographicand political properties, some countries are more closed than others even over long horizons. For
example, public institutions are required to ensure effective and efficient access to network industries
(such as rail and motorway, but also electricity and water). Rule of law is required for contract
enforcement and the willingness of banks to provide trade credit. Sophisticated exports rely on access
to the international value chain and the ability to import – requiring light customs procedures.
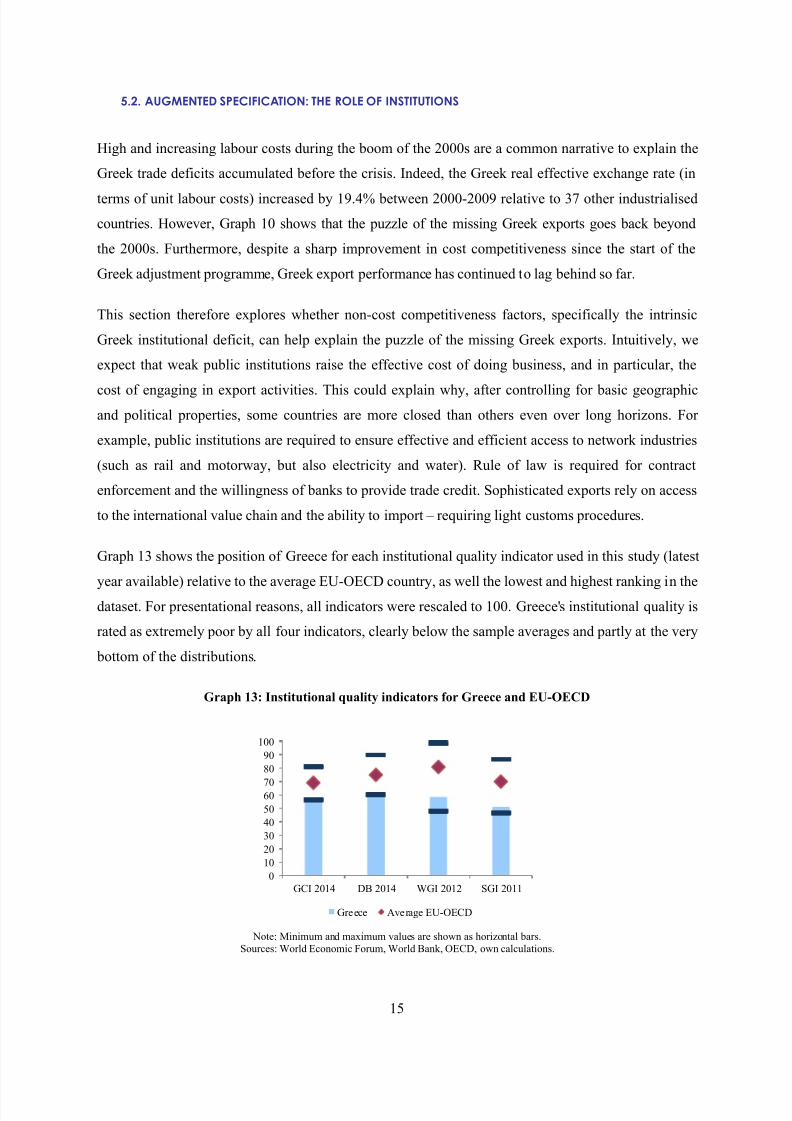
Graph 13 shows the position of Greece for each institutional quality indicator used in this study (latest
year available) relative to the average EU-OECD country, as well the lowest and highest ranking in the
dataset. For presentational reasons, all indicators were rescaled to 100. Greece's institutional quality is
rated as extremely poor by all four indicators, clearly below the sample averages and partly at the very
bottom of the distributions.
Graph 13: Institutional quality indicators for Greece and EU-OECD
Note: Minimum and maximum values are shown as horizontal bars.
Sources: World Economic Forum, World Bank, OECD, own calculations.
0
10
20
30
40
50
6070
80
90
100
GCI 2014 DB 2014 WGI 2012 SGI 2011
Greece Average EU-OECD
8/9/2019 The Puzzle of the Missing Greek Exports
http://slidepdf.com/reader/full/the-puzzle-of-the-missing-greek-exports 18/40
16
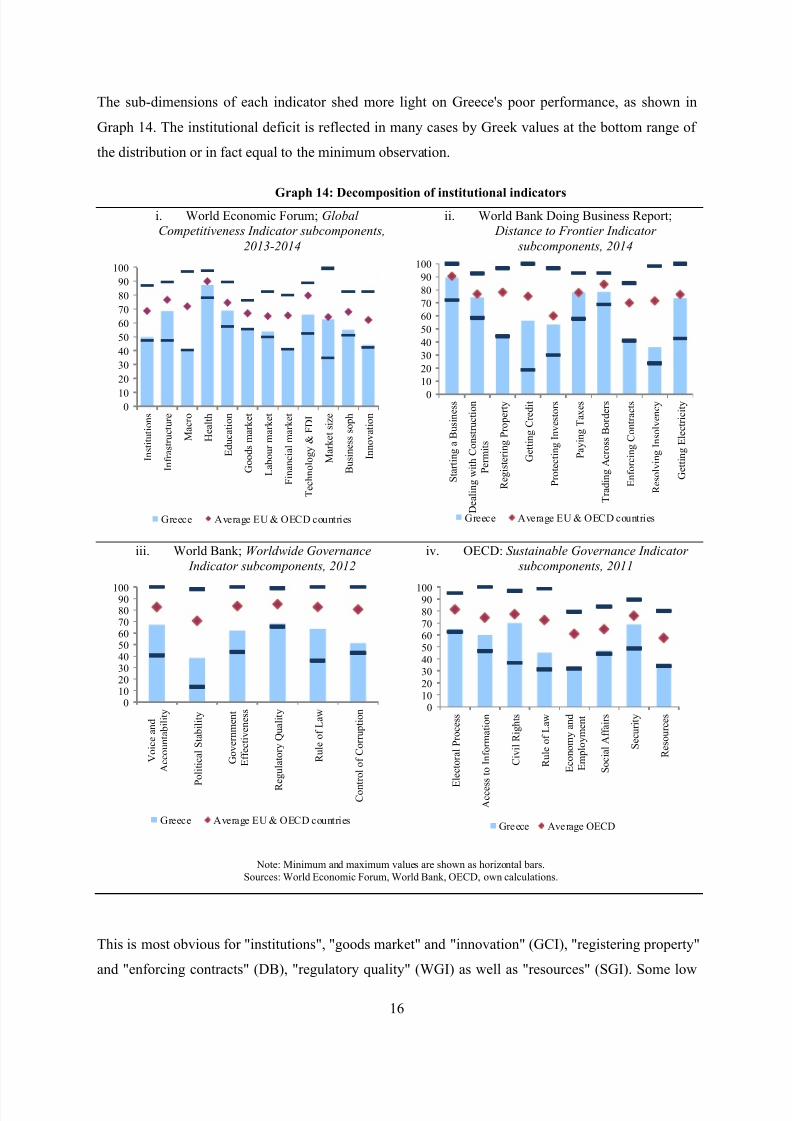
The sub-dimensions of each indicator shed more light on Greece's poor performance, as shown in
Graph 14. The institutional deficit is reflected in many cases by Greek values at the bottom range of
the distribution or in fact equal to the minimum observation.
Graph 14: Decomposition of institutional indicatorsi. World Economic Forum; GlobalCompetitiveness Indicator subcomponents,
2013-2014
ii. World Bank Doing Business Report; Distance to Frontier Indicator
subcomponents, 2014
iii. World Bank; Worldwide Governance
Indicator subcomponents, 2012
iv. OECD: Sustainable Governance Indicator
subcomponents, 2011
Note: Minimum and maximum values are shown as horizontal bars.
Sources: World Economic Forum, World Bank, OECD, own calculations.
This is most obvious for "institutions", "goods market" and "innovation" (GCI), "registering property"
and "enforcing contracts" (DB), "regulatory quality" (WGI) as well as "resources" (SGI). Some low
010
20
30
40
50
60
70
80
90
100
I n s t i t u t i o n s
I n f r a s t r u c t u r e
M a c r o
H e a l t h
E d u c a t i o n
G o o d s m a r k e t
L a b o u r m a r k e t
F i n a n c i a l m a r k e t
T e c h n o l o g y & F D I
M a r k e t s i z e
B u s i n e s s s o p h
I n n o v a t i o n
Greece Average EU & OECD countries
0
10
20
30
40
50
60
70
80
90
100
S t a r t i n g a B u s i n e s s
D e a l i n g w i t h C o n s t r u c t i o n
P e r m i t s
R e g i s t e r i n g P r o p e r t y
G e t t i n g C r e d i t
P r o t e c t i n g I n v e s t o r s
P a y i n g T a x e s
T r a d i n g A c r o s s B o r d e r s
E n f o r c i n g C o n t r a c t s
R e s o l v i n g I n s o l v e n c y
G e t t i n g E l e c t r i c i t y
Greece Average EU & OECD countries
0102030405060708090
100
V o i c e a n d
A c c o u n t a b i l i t y
P o l i t i c a l S t a b i l i t y
G o v e r n m e n t
E f f e c t i v e n e s s
R e g u l a t o r y Q u a l i t y
R u l e o f L a w
C o n t r o l o f C o r r u p t i o n
Greece Average EU & OECD countries
0102030405060708090
100
E
l e c t o r a l P r o c e s s
A c c e s
s t o I n f o r m a t i o n
C i v i l R i g h t s
R u l e o f L a w
E c o n o m y a n d
E m p l o y m e n t
S o c i a l A f f a i r s
S e c u r i t y
R e s o u r c e s
Greece Average OECD
8/9/2019 The Puzzle of the Missing Greek Exports
http://slidepdf.com/reader/full/the-puzzle-of-the-missing-greek-exports 19/40
17
values, however, can be rather attributed to the consequences of the economic crisis, such as "macro"
and "financial market" (GCI) or "economy and employment" and "social affairs"(SGI). On the side of
better-performing dimensions, "health" (GCI) reflects the relatively well-developed, although rather
unequal, Greek healthcare system. The favourable "market size" (GCI) score is due to membership in
the EU single market. Some DB indicators reflect recent progress on several fronts, e.g. in "starting a
business" and "paying taxes" where Greece has already caught up to EU/OECD average. Overall,
however, the underperformance of Greece's institutional set-up is obvious and still offers plenty of
room for improvement.
&'(')*')+ ,-./-01'X
9&: ;< '=(;.+'. 21;>?5 3"$%$AAA 3"%4@AAA 3"%87AAA 3"%#@AAA
23"347B5 23"343B5 23"33%#@5 23"36465
9&: ;< (-.+)'. 21;>?5 3"%8@AAA 3"%B8AAA 3"%#3AAA 3"@3BAAA
23"34835 23"346@5 23"344B5 23"364$5
9';>.-(C/D-1 */?+-)D' 21;>?5 E3"B3@AAA E3"B4#AAA E3"B6@AAA E3"B$@AAA
23"36635 23"34@#5 23"34%75 23"37$45
F;GG;) 0;.*'. 3"63$AA 3"76BAAA 3"4@3AAA 3"473
23"3$765 23"3#7$5 23"3B#B5 23"44#5
HC-.'* D;1;)/-1 C/?+;.I E3"3$84 E3"4B#AA E3"3%8%A E3"48@
23"3BB85 23"3B675 23"38745 23"3%4B5
F;GG;) 1-)>-J>' 3"7$8AAA 3"6@#AAA 3"837AAA 3"83$AAA
23"3#765 23"3BBB5 23"38@@5 23"4335
K'>/;)-1 +.-*' ->.''G')+ 3"3B@3 E3"34%@ 3"33$7@ E3"373$
23"3#3$5 23"38%65 23"3B3#5 23"3%775
[)?+/+J+/;)-1 \J-1/+I ;< '=(;.+'. 3"7BBAAA 3"34#@AAA 3"76BAAA 3"47@AAA
23"38@%5 23"336875 23"37B65 23"37#$5
[)?+/+J+/;)-1 \J-1/+I ;< (-.+)'. 3"3743 3"33$$6AAA E3"34%# 3"3BB8
23"38465 23"334@35 23"363@5 23"36@45
F;)?+-)+ E3"%4%A E3"%B$AA 3"@33AAA E3"$4@
23"8335 23"74B5 23"6445 23"BBB5
L=(;.+'. D;J)+./'? MLF&EL] MLF&EL] MLF&EL] MLF& 2735
:-.+)'. D;J)+./'? ^11 2B#5 ^11 2B#5 ^11 2B#5 MLF& 2735
R'-.? 3%T 3@ 3%T 3@ 33T 3BT 3%T 3@ 3@
QJG0'. ;< ;0?'.,-+/;)? 8T4%3 7T%%B %T7#3 %46
K6
3"%% 3"@4 3"%% 3"@3
Q;+'?X S/G' *JGG/'? -)* /)?+.JG')+? ?J((.'??'*" Y'+'.;?Z'*-?+/D/+IE.;0J?+ ?+-)*-.* '..;.?"
/) (-.')+C'?'?" A ?/>)/</D-)+ -+ 43VW AA ?/>)/ </D-)+ -+ BVW AAA ?/>)/</D-)+ -+ 4V"
_9[2_`5
L=(;.+ ,-1J' -**'*
9F[2_LO5
&`2_`5
H9[2MLF&5
"#$%& 9( :8-2&;0&4 -.#/+01 234&% 53. 030#% &673.0 /#%8& #44&4< => ??@A &*0+2#0+3; 2&0B34
8/9/2019 The Puzzle of the Missing Greek Exports
http://slidepdf.com/reader/full/the-puzzle-of-the-missing-greek-exports 20/40
18
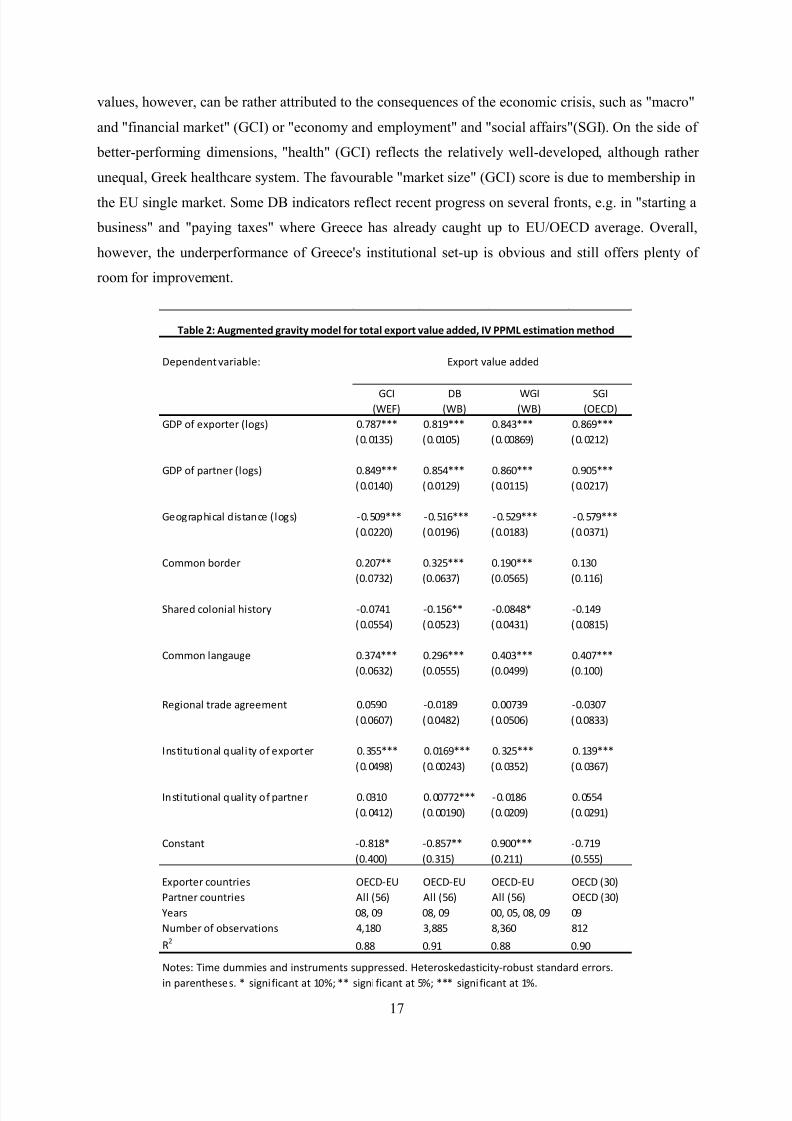
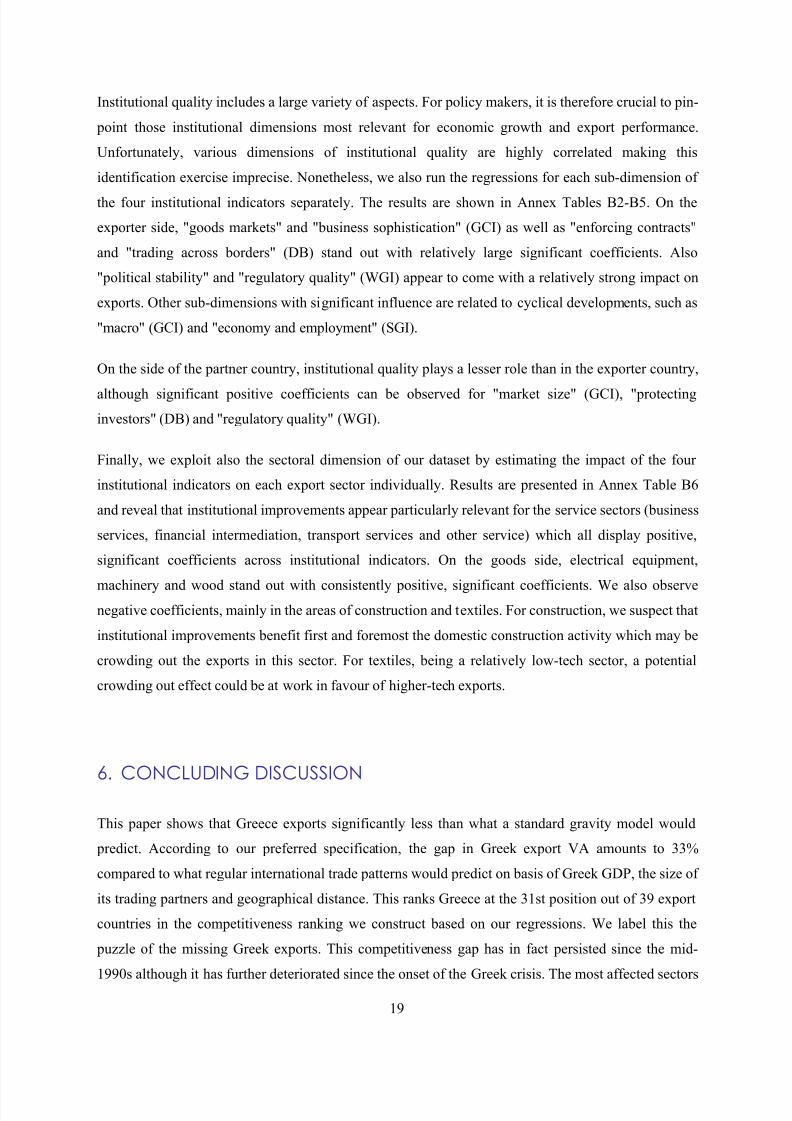
Table 2 presents the results of the augmented gravity model with measures of institutional quality in
exporter and partner country using our preferred methodology, i.e. instrumental variable Poisson
pseudo-maximum likelihood (IV PPML). The regression period under consideration is determined by
availability of trade data in the OECD/WTO TiVA database and the relevant institutional indicator.
The regressions establish the second key result of our paper: institutional quality of the exporter is
shown to be a highly significant factor in determining a country’s export performance. The
institutional quality of the partner country, however, shows only partially significant results, as
presumably fewer elements of institutional quality would be relevant regarding the destination country
than the origin country of an exporter. Relevant aspects in the partner country likely include contract
enforcement and investor protection.
To determine the quantitative role of institutions in explaining the Greek competitiveness puzzle, we
need however two additional pieces of information. First, we take account of the scale of the relevant
institutional quality variables. For example, given same economic significance, the coefficient on the
regression including the GCI indicator will be larger than the one involving the DB indicator, since the
former ranges from 0-7 while the latter ranges from 0-100. Second, we need to take into account the
scope for improvement for Greek institutions.
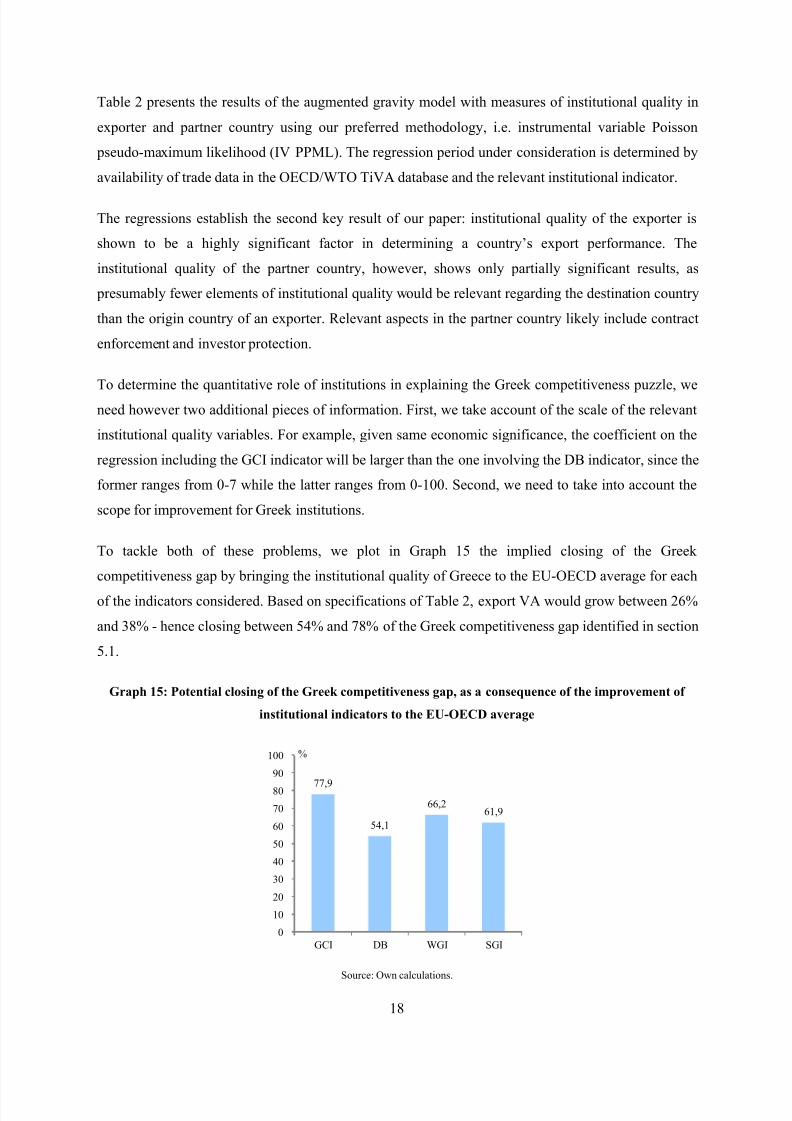
To tackle both of these problems, we plot in Graph 15 the implied closing of the Greek
competitiveness gap by bringing the institutional quality of Greece to the EU-OECD average for each
of the indicators considered. Based on specifications of Table 2, export VA would grow between 26%
and 38% - hence closing between 54% and 78% of the Greek competitiveness gap identified in section
5.1.
Graph 15: Potential closing of the Greek competitiveness gap, as a consequence of the improvement of
institutional indicators to the EU-OECD average
Source: Own calculations.
77,9
54,1
66,261,9
0
10
20
30
40
50
60
70
80
90
100
GCI DB WGI SGI
%
8/9/2019 The Puzzle of the Missing Greek Exports
http://slidepdf.com/reader/full/the-puzzle-of-the-missing-greek-exports 21/40
19
Institutional quality includes a large variety of aspects. For policy makers, it is therefore crucial to pin-
point those institutional dimensions most relevant for economic growth and export performance.
Unfortunately, various dimensions of institutional quality are highly correlated making this
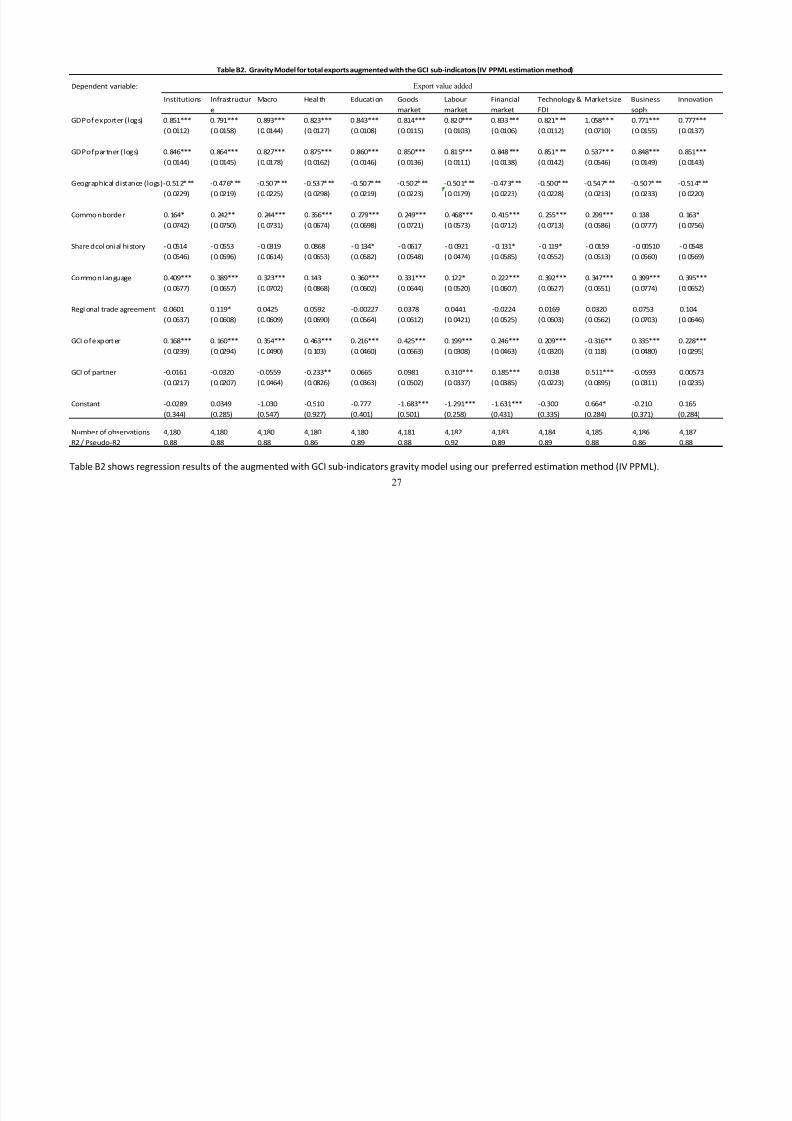
identification exercise imprecise. Nonetheless, we also run the regressions for each sub-dimension of
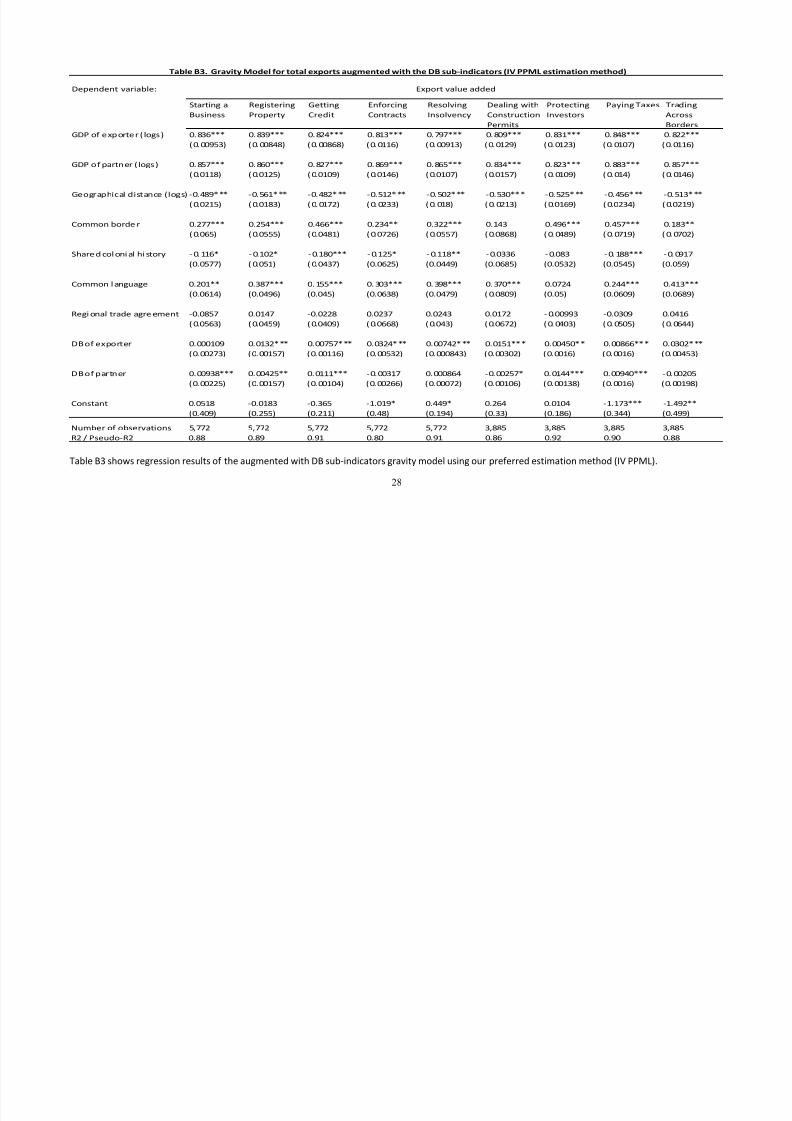
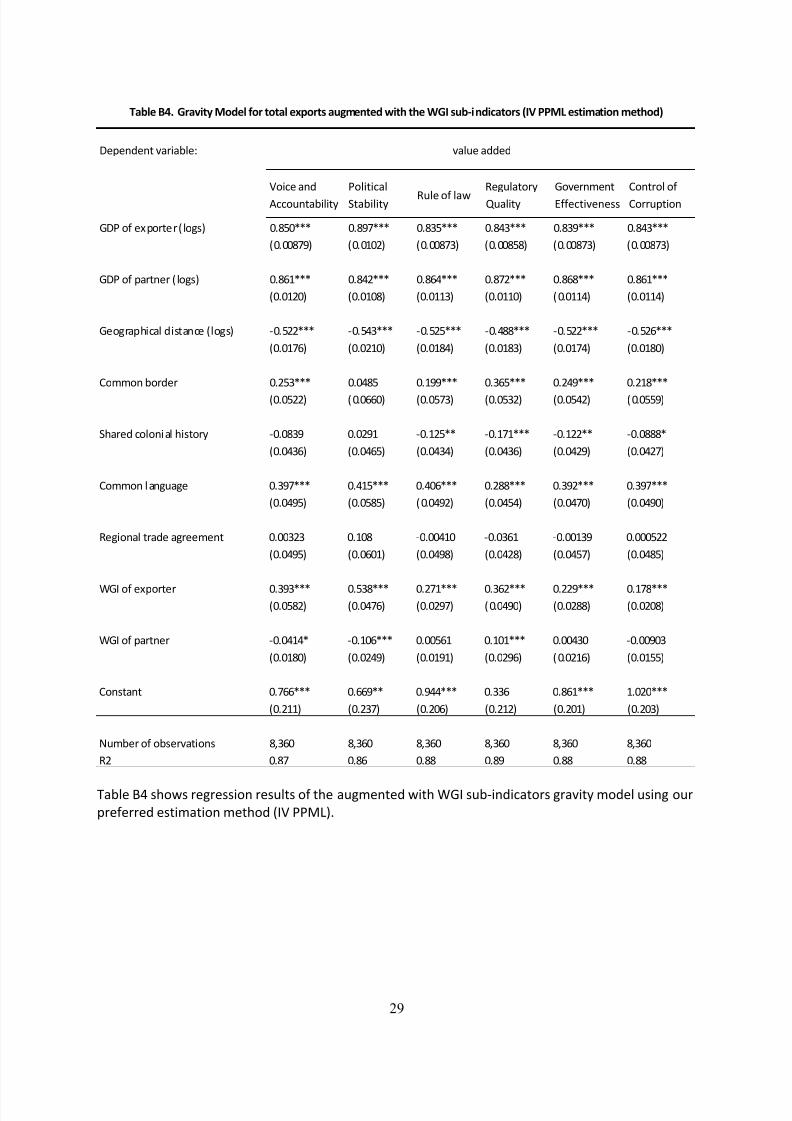
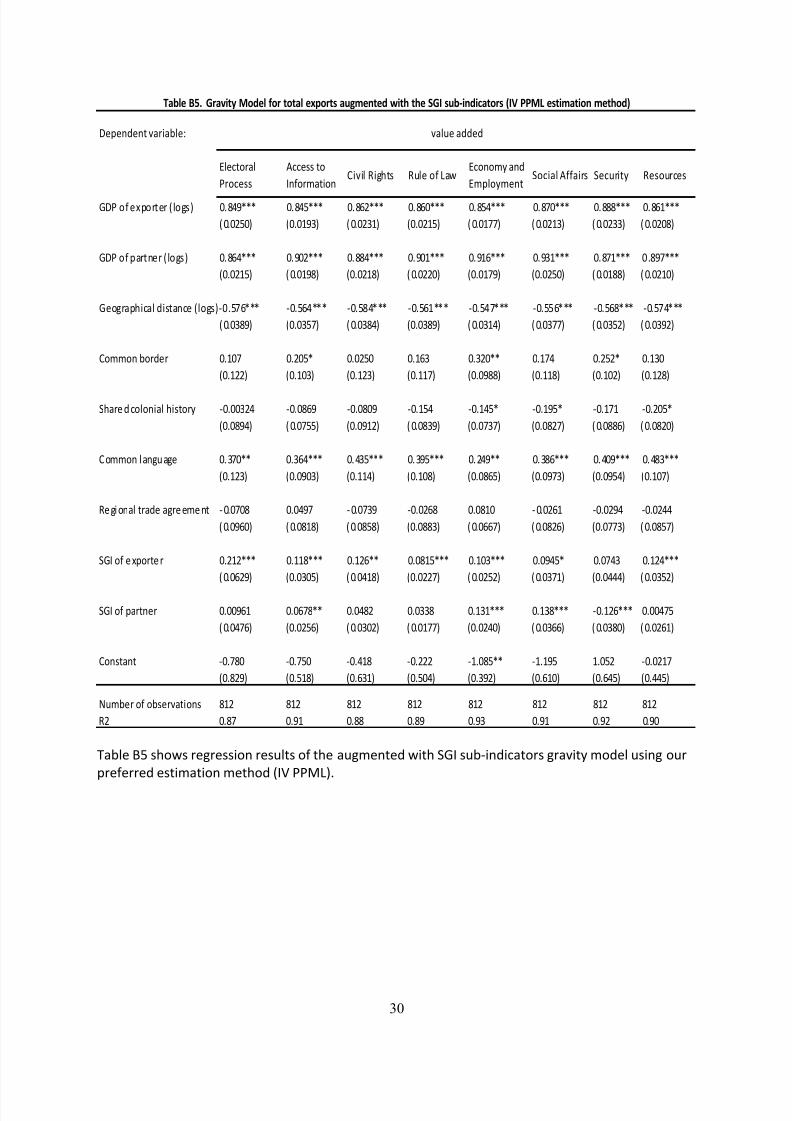
the four institutional indicators separately. The results are shown in Annex Tables B2-B5. On the
exporter side, "goods markets" and "business sophistication" (GCI) as well as "enforcing contracts"
and "trading across borders" (DB) stand out with relatively large significant coefficients. Also
"political stability" and "regulatory quality" (WGI) appear to come with a relatively strong impact on
exports. Other sub-dimensions with significant influence are related to cyclical developments, such as
"macro" (GCI) and "economy and employment" (SGI).
On the side of the partner country, institutional quality plays a lesser role than in the exporter country,
although significant positive coefficients can be observed for "market size" (GCI), "protecting
investors" (DB) and "regulatory quality" (WGI).
Finally, we exploit also the sectoral dimension of our dataset by estimating the impact of the four
institutional indicators on each export sector individually. Results are presented in Annex Table B6
and reveal that institutional improvements appear particularly relevant for the service sectors (business
services, financial intermediation, transport services and other service) which all display positive,
significant coefficients across institutional indicators. On the goods side, electrical equipment,
machinery and wood stand out with consistently positive, significant coefficients. We also observenegative coefficients, mainly in the areas of construction and textiles. For construction, we suspect that
institutional improvements benefit first and foremost the domestic construction activity which may be
crowding out the exports in this sector. For textiles, being a relatively low-tech sector, a potential
crowding out effect could be at work in favour of higher-tech exports.
6. CONCLUDING DISCUSSION
This paper shows that Greece exports significantly less than what a standard gravity model would
predict. According to our preferred specification, the gap in Greek export VA amounts to 33%
compared to what regular international trade patterns would predict on basis of Greek GDP, the size of
its trading partners and geographical distance. This ranks Greece at the 31st position out of 39 export
countries in the competitiveness ranking we construct based on our regressions. We label this the
puzzle of the missing Greek exports. This competitiveness gap has in fact persisted since the mid-
1990s although it has further deteriorated since the onset of the Greek crisis. The most affected sectors
8/9/2019 The Puzzle of the Missing Greek Exports
http://slidepdf.com/reader/full/the-puzzle-of-the-missing-greek-exports 22/40
20
include electrical equipment and machinery while transport, tourism and agriculture perform relatively
favourable.
Furthermore, we analyse in how far the Greek institutional deficit can explain the Greek
competitiveness gap. Our regression results suggest that an improvement in the quality of Greekinstitutions up to the EU/OECD average would close the Greek competitiveness gap by between 54%
and 78%, explaining large parts of the puzzle of the missing Greek exports.
These results suggest a range of issues for further research. First, our competitiveness gap measure
identifies the sectors in which Greece enjoys a comparative advantage (international shipping, tourism
and agriculture) and the sectors in which Greece is lagging behind (manufacturing). This opens
questions for the design of a growth strategy. Should Greece focus efforts on nurturing and expanding
its current competitive advantage, or should it focus efforts on laggards, thereby diversifying its
economy and possibly benefiting from quick reform gains and "low hanging fruits"?
Second, for policy action, it would be useful to identify more in depth exactly which specific
institutions are essential for export growth. Empirically, this will require tackling the strong
correlation between different sub-indicators of institutional quality we found in the data, which made
pin-pointing the role of any specific institutional dimension in export growth difficult.
Finally, a key question is how quickly Greece can tackle its institutional deficits and how quickly
reforms will translate to change on the ground. In the short run, cyclical factors such as heightened
economic uncertainty as well as tight trade credit during the Greek sovereign debt crisis have hurt
Greek exports. These temporary factors may have the effect of delaying the revival of the Greek
export industry in the context of the current major institutional reform effort under the Economic
Adjustment Programme for Greece, suggesting that once the economic cycle reverses, a stronger
rebound of exports may become visible, more clearly reflecting the reforms undertaken.
Significant progress has already been made in implementing structural reforms. According to the
World Bank Doing Business report for example, between 2010 and 2013, Greece reduced the steps
necessary to start a business from 15 to 5. While it took 20 days to get clearance for export activities in
2010, the Doing Business report 2013 reports that clearance can now be obtained in 16 days. In this
period, the number of days to gain a construction permit fell from 170 to 105. Further reforms have
been undertaken in 2014 which will increase Greece's ranking in cross-country structural reform
assessments further. These encouraging steps need to be followed up with resolute further policy
action. The results of this paper suggest that structural reforms can yield significant long-term rewards
in terms of opening up worldwide markets for Greek exporters.
8/9/2019 The Puzzle of the Missing Greek Exports
http://slidepdf.com/reader/full/the-puzzle-of-the-missing-greek-exports 23/40
21
APPENDIX A
"#$%& :'( A+*0 35 ,38;0.+&* 8*&4 +; 0B& #;#%1*+*
C38;0.+&*D&673.0&.*E7#.0;&.*F
C34& GHCI HJ
^J?+.-1/- ^]H
^J?+./- ^]S
`'1>/JG `LN
`J1>-./- `9K
F-)-*- F^Q
FC/1' FYN
Fa'DC K'(J01/D FbL
&')G-.Z &Qc
L?+;)/- LHS O/)1-)* O[Q
O.-)D' OK^
9'.G-)I &L]
9.''D' 9KF
YJ)>-.I Y]Q
[D'1-)* [HN
[.'1-)* [KN
[?.-'1 [HK
[+-1I [S^
d-(-) d:Q c;.'- cMK
N-+,/- Ne^
N/+CJ-)/- NS]
NJ='G0;J.> N]f
P-1+- PNS
P'=/D; PLf
Q'+C'.1-)*? QN&
Q'g b'-1-)* QbN
Q;.g-I QMK
:;1-)* :MN
:;.+J>-1 :KS
K;G-)/- KMP
H1;,-Z/- Hec
H1;,')/- HeQ
H(-/) LH:
Hg'*') H_L
Hg/+a'.1-)* FYL
SJ.Z'I S]K
])/+'* c/)>*;G 9`K
])/+'* H+-+'? ]H^
8/9/2019 The Puzzle of the Missing Greek Exports
http://slidepdf.com/reader/full/the-puzzle-of-the-missing-greek-exports 24/40
22
:44+0+3;#% ;3;KGHCIEHJ
7#.0;&.*C34& GHCI HJ
^.>')+/)- ^K9
`.-a/1 `K^`.J)'/ &-.J??-1-G `KQ
FC/)- FYQ
FI(.J?A FR:
F-G0;*/- cYP
FC/)'?' S-/('/ S_Q
[)*/- [Q&
P-1-I?/- PRH
KJ??/-) O'*'.-+/;) K]H
H-J*/ ^.-0/- H^]
H/)>-(;.' H9:
H;J+C ^<./D- b^O
SC-/1-)* SY^
e/'+ Q-G eQP
A FI(.J? /) );+ /)D1J*'* /) +C' '=(;.+'. D;J)+./'? *J' +; 1-DZ ;< *-+-"
8/9/2019 The Puzzle of the Missing Greek Exports
http://slidepdf.com/reader/full/the-puzzle-of-the-missing-greek-exports 25/40
23
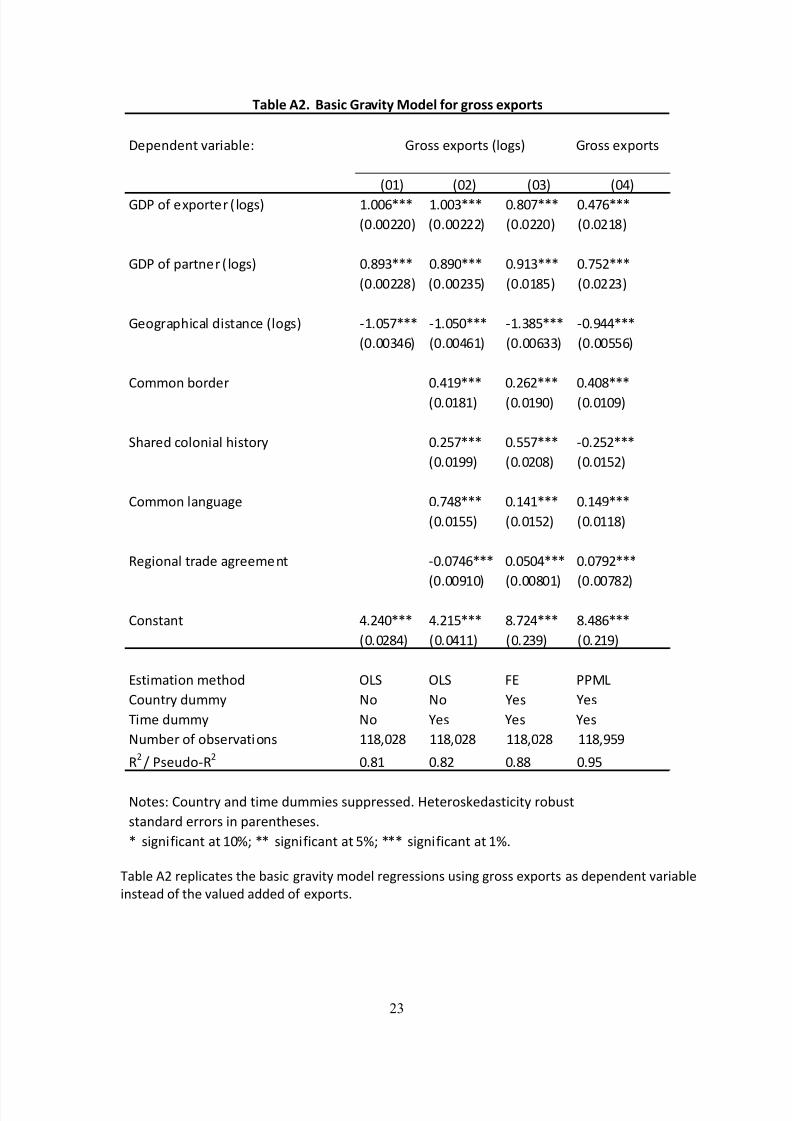
S-01' ^6 .'(1/D-+'? +C' 0-?/D >.-,/+I G;*'1 .'>.'??/;)? J?/)> >.;?? '=(;.+? -? *'(')*')+ ,-./-01'
/)?+'-* ;< +C' ,-1J'* -**'* ;< '=(;.+?"
&'(')*')+ ,-./-01'X 9.;?? '=(;.+?
2345 2365 2375 2385
9&: ;< '=(;.+'. 2 1;>?5 4"33#AAA 4"337AAA 3"%3$AAA 3"8$#AAA
23"336635 23"336665 23"36635 23"364%5
9&: ;< (-.+)'. 2 1;>?5 3"%@7AAA 3"%@3AAA 3"@47AAA 3"$B6AAA
23"3366%5 23"3367B5 23"34%B5 23"36675
9';>.-(C/D-1 */?+-)D' 21;>?5 E4"3B$AAA E4"3B3AAA E4"7%BAAA E3"@88AAA
23"3378#5 23"338#45 23"33#775 23"33BB#5
F;GG;) 0;.*'. 3"84@AAA 3"6#6AAA 3"83%AAA
23"34%45 23"34@35 23"343@5
HC-.'* D;1;)/-1 C/?+;.I 3"6B$AAA 3"BB$AAA E3"6B6AAA
23"34@@5 23"363%5 23"34B65
F;GG;) 1-)>J->' 3"$8%AAA 3"484AAA 3"48@AAA
23"34BB5 23"34B65 23"344%5
K'>/;)-1 +.-*' ->.''G')+ E3"3$8#AAA 3"3B38AAA 3"3$@6AAA
23"33@435 23"33%345 23"33$%65
F;)?+-)+ 8"683AAA 8"64BAAA %"$68AAA %"8%#AAA
23"36%85 23"38445 23"67@5 23"64@5
L?+/G-+/;) G'+C;* MNH MNH OL ::PN
F;J)+.I *JGGI Q; Q; R'? R'?
S/G' *JGGI Q; R'? R'? R'?
QJG0'. ;< ;0?'.,-+/;)? 44%T36% 44%T36% 44%T36% 44%T@B@
K6
U :?'J*;EK6
3"%4 3"%6 3"%% 3"@B
Q;+'?X F;J)+.I -)* +/G' *JGG/'? ?J((.'??'*" Y'+'.;?Z'*-?+/D/+I .;0J?+
?+-)*-.* '..;.? /) (-.')+C'?'?"
A ?/>)/</D-)+ -+ 43VW AA ?/>)/</D-)+ -+ BVW AAA ?/>)/</D-)+ -+ 4V"
"#$%& :9L )#*+, M.#/+01 @34&% 53. -.3** &673.0*
9.;?? '=(;.+? 21;>?5
8/9/2019 The Puzzle of the Missing Greek Exports
http://slidepdf.com/reader/full/the-puzzle-of-the-missing-greek-exports 26/40
24
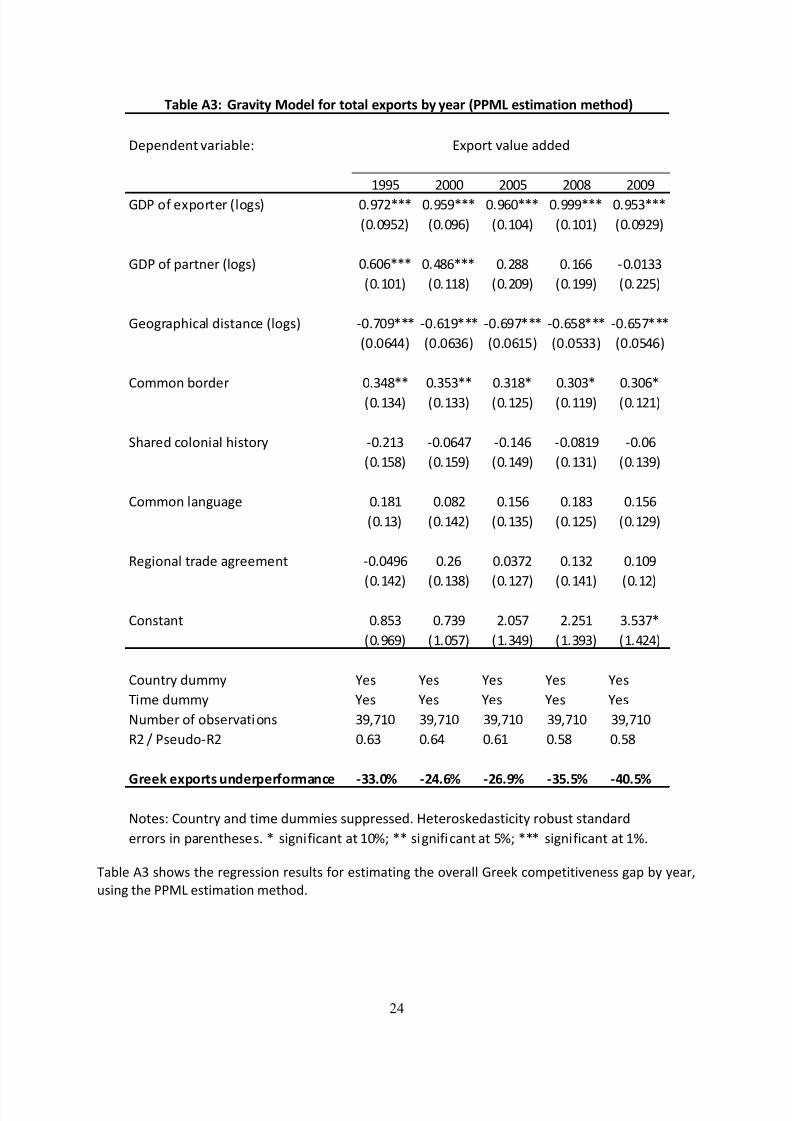
S-01' ^7 ?C;g? +C' .'>.'??/;) .'?J1+? <;. '?+/G-+/)> +C' ;,'.-11 9.''Z D;G('+/+/,')'?? >-( 0I I'-.T
J?/)> +C' ::PN '?+/G-+/;) G'+C;*"
&'(')*')+ ,-./-01'X
4@@B 6333 633B 633% 633@
9&: ;< '=(;.+'. 21;>?5 3"@$6AAA 3"@B@AAA 3"@#3AAA 3"@@@AAA 3"@B7AAA
23"3@B65 23"3@#5 23"4385 23"4345 23"3@6@5
9&: ;< (-.+)'. 21;>?5 3"#3#AAA 3"8%#AAA 3"6%% 3"4## E3"3477
23"4345 23"44%5 23"63@5 23"4@@5 23"66B5
9';>.-(C/D-1 */?+-)D' 21;>?5 E3"$3@AAA E3"#4@AAA E3"#@$AAA E3"#B%AAA E3"#B$AAA
23"3#885 23"3#7#5 23"3#4B5 23"3B775 23"3B8#5
F;GG;) 0;.*'. 3"78%AA 3"7B7AA 3"74%A 3"737A 3"73#A
23"4785 23"4775 23"46B5 23"44@5 23"4645
HC-.'* D;1;)/-1 C/?+;.I E3"647 E3"3#8$ E3"48# E3"3%4@ E3"3#
23"4B%5 23"4B@5 23"48@5 23"4745 23"47@5
F;GG;) 1-)>J->' 3"4%4 3"3%6 3"4B# 3"4%7 3"4B#
23"475 23"4865 23"47B5 23"46B5 23"46@5
K'>/;)-1 +.-*' ->.''G')+ E3"38@# 3"6# 3"37$6 3"476 3"43@
23"4865 23"47%5 23"46$5 23"4845 23"465
F;)?+-)+ 3"%B7 3"$7@ 6"3B$ 6"6B4 7"B7$A
23"@#@5 24"3B$5 24"78@5 24"7@75 24"8685
F;J)+.I *JGGI R'? R'? R'? R'? R'?
S/G' *JGGI R'? R'? R'? R'? R'?
QJG0'. ;< ;0?'.,-+/;)? 7@T$43 7@T$43 7@T$43 7@T$43 7@T$43
K6 U :?'J*;EK6 3"#7 3"#8 3"#4 3"B% 3"B%
M.&&N &673.0* 8;4&.7&.53.2#;,& KOOLPQ K9RLSQ K9SLTQ KOULUQ KRPLUQ
Q;+'?X F;J)+.I -)* +/G' *JGG/'? ?J((.'??'*" Y'+'.;?Z'*-?+/D/+I .;0J?+ ?+-)*-.*
'..;.? /) (-.')+C'?'?" A ?/>)/</D-)+ -+ 43VW AA ?/>)/</D-)+ -+ BVW AAA ?/>)/</D-)+ -+ 4V"
L=(;.+ ,-1J' -**'*
"#$%& :O( M.#/+01 @34&% 53. 030#% &673.0* $1 1&#. D??@A &*0+2#0+3; 2&0B34F
8/9/2019 The Puzzle of the Missing Greek Exports
http://slidepdf.com/reader/full/the-puzzle-of-the-missing-greek-exports 27/40
25
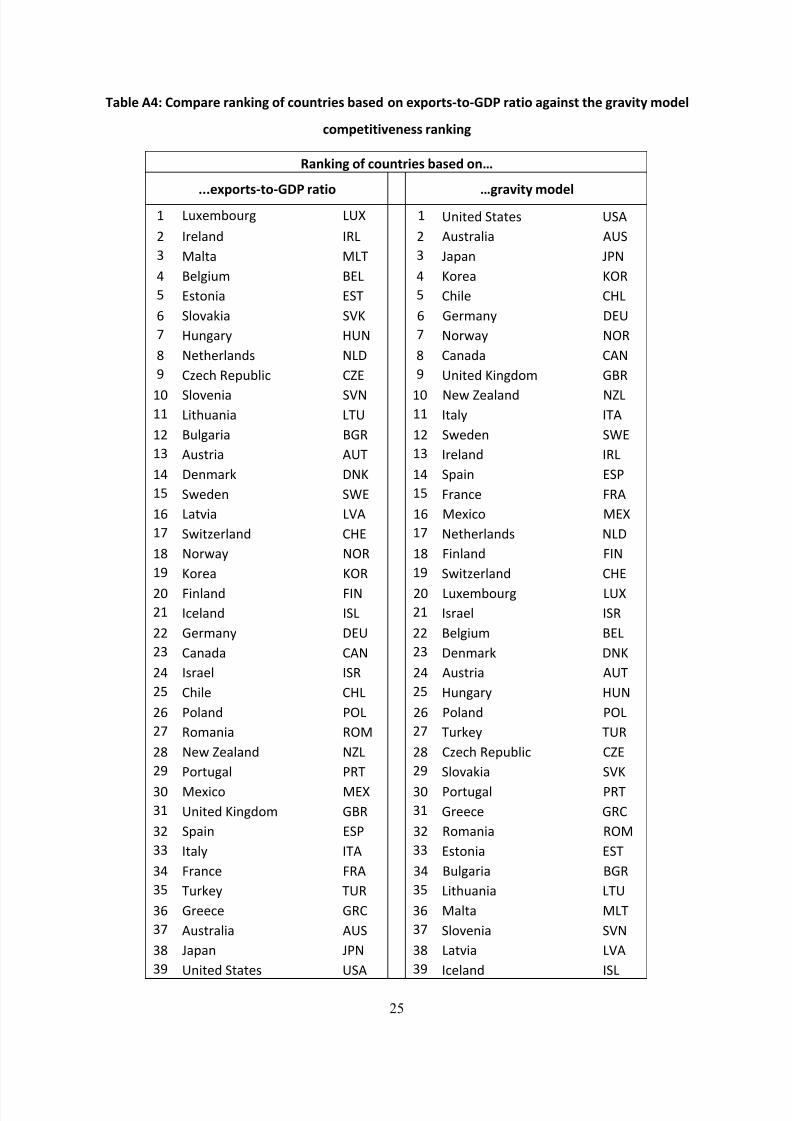
"#$%& :R( C327#.& .#;N+;- 35 ,38;0.+&* $#*&4 3; &673.0*K03KMI? .#0+3 #-#+;*0 0B& -.#/+01 234&%
,327&0+0+/&;&** .#;N+;-
V#;N+;- 35 ,38;0.+&* $#*&4 3;W
LLL&673.0*K03KMI? .#0+3 W-.#/+01 234&%4 NJ='G0;J.> N]f 4 ])/+'* H+-+'? ]H^
6 [.'1-)* [KN 6 ^J?+.-1/- ^]H
7 P-1+- PNS 7 d-(-) d:Q
8 `'1>/JG `LN 8 c;.'- cMK
B L?+;)/- LHS B FC/1' FYN
# H1;,-Z/- Hec # 9'.G-)I &L]
$ YJ)>-.I Y]Q $ Q;.g-I QMK
% Q'+C'.1-)*? QN& % F-)-*- F^Q
@ Fa'DC K'(J01/D FbL @ ])/+'* c/)>*;G 9`K
43 H1;,')/- HeQ 43 Q'g b'-1-)* QbN44 N/+CJ-)/- NS] 44 [+-1I [S^
46 `J1>-./- `9K 46 Hg'*') H_L
47 ^J?+./- ^]S 47 [.'1-)* [KN
48 &')G-.Z &Qc 48 H(-/) LH:
4B Hg'*') H_L 4B O.-)D' OK^
4# N-+,/- Ne^ 4# P'=/D; PLf
4$ Hg/+a'.1-)* FYL 4$ Q'+C'.1-)*? QN&
4% Q;.g-I QMK 4% O/)1-)* O[Q
4@ c;.'- cMK 4@ Hg/+a'.1-)* FYL
63 O/)1-)* O[Q 63 NJ='G0;J.> N]f
64 [D'1-)* [HN 64 [?.-'1 [HK
66 9'.G-)I &L] 66 `'1>/JG `LN
67 F-)-*- F^Q 67 &')G-.Z &Qc
68 [?.-'1 [HK 68 ^J?+./- ^]S
6B FC/1' FYN 6B YJ)>-.I Y]Q
6# :;1-)* :MN 6# :;1-)* :MN
6$ K;G-)/- KMP 6$ SJ.Z'I S]K
6% Q'g b'-1-)* QbN 6% Fa'DC K'(J01/D FbL
6@ :;.+J>-1 :KS 6@ H1;,-Z/- Hec
73 P'=/D; PLf 73 :;.+J>-1 :KS
74 ])/+'* c/)>*;G 9`K 74 9.''D' 9KF
76 H(-/) LH: 76 K;G-)/- KMP
77 [+-1I [S^ 77 L?+;)/- LHS
78 O.-)D' OK^ 78 `J1>-./- `9K
7B SJ.Z'I S]K 7B N/+CJ-)/- NS]
7# 9.''D' 9KF 7# P-1+- PNS
7$ ^J?+.-1/- ^]H 7$ H1;,')/- HeQ
7% d-(-) d:Q 7% N-+,/- Ne^
7@ ])/+'* H+-+'? ]H^ 7@ [D'1-)* [HN
8/9/2019 The Puzzle of the Missing Greek Exports
http://slidepdf.com/reader/full/the-puzzle-of-the-missing-greek-exports 28/40
26
APPENDIX B
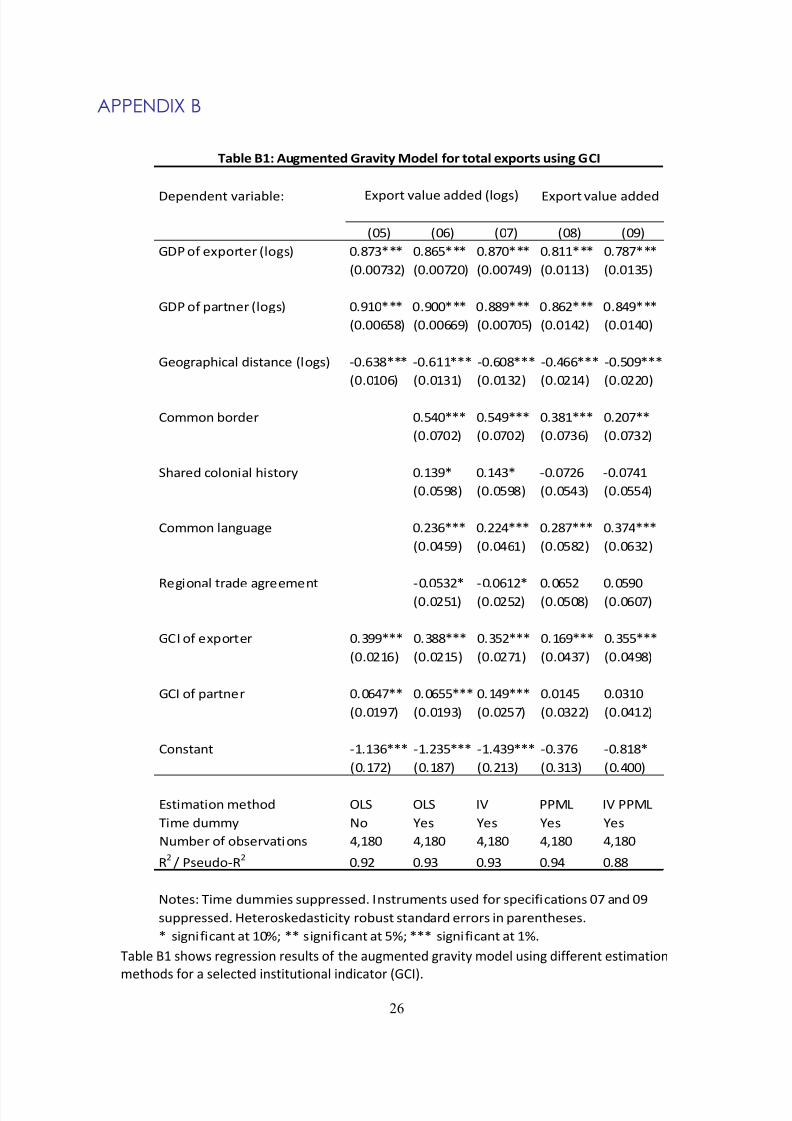
S-01' `4 ?C;g? .'>.'??/;) .'?J1+? ;< +C' -J>G')+'* >.-,/+I G;*'1 J?/)> */<<'.')+ '?+/G-+/;)
G'+C;*? <;. - ?'1'D+'* /)?+/+J+/;)-1 /)*/D-+;. 29F[5"
&'(')*')+ ,-./-01'X
23B5 23#5 23$5 23%5 23@5
9&: ;< '=(;.+'. 21;>?5 3"%$7AAA 3"%#BAAA 3"%$3AAA 3"%44AAA 3"$%$AAA
23"33$765 23"33$635 23"33$8@5 23"34475 23"347B5
9&: ;< (-.+)'. 21;>?5 3"@43AAA 3"@33AAA 3"%%@AAA 3"%#6AAA 3"%8@AAA
23"33#B%5 23"33##@5 23"33$3B5 23"34865 23"34835
9';>.-(C/D-1 */?+-)D' 21;>?5 E3"#7%AAA E3"#44AAA E3"#3%AAA E3"8##AAA E3"B3@AAA
23"343#5 23"34745 23"34765 23"36485 23"36635
F;GG;) 0;.*'. 3"B83AAA 3"B8@AAA 3"7%4AAA 3"63$AA
23"3$365 23"3$365 23"3$7#5 23"3$765
HC-.'* D;1;)/-1 C/?+;.I 3"47@A 3"487A E3"3$6# E3"3$84
23"3B@%5 23"3B@%5 23"3B875 23"3BB85
F;GG;) 1-)>J->' 3"67#AAA 3"668AAA 3"6%$AAA 3"7$8AAA
23"38B@5 23"38#45 23"3B%65 23"3#765
K'>/;)-1 +.-*' ->.''G')+ E3"3B76A E3"3#46A 3"3#B6 3"3B@323"36B45 23"36B65 23"3B3%5 23"3#3$5
9F[ ;< '=(;.+'. 3"7@@AAA 3"7%%AAA 3"7B6AAA 3"4#@AAA 3"7BBAAA
23"364#5 23"364B5 23"36$45 23"387$5 23"38@%5
9F[ ;< (-.+)'. 3"3#8$AA 3"3#BBAAA 3"48@AAA 3"348B 3"3743
23"34@$5 23"34@75 23"36B$5 23"37665 23"38465
F;)?+-)+ E4"47#AAA E4"67BAAA E4"87@AAA E3"7$# E3"%4%A
23"4$65 23"4%$5 23"6475 23"7475 23"8335
L?+/G-+/;) G'+C;* MNH MNH [e ::PN [e ::PN
S/G' *JGGI Q; R'? R'? R'? R'?
QJG0'. ;< ;0?'.,-+/;)? 8T4%3 8T4%3 8T4%3 8T4%3 8T4%3
K6
U :?'J*;EK6
3"@6 3"@7 3"@7 3"@8 3"%%
Q;+'?X S/G' *JGG/'? ?J((.'??'*" [)?+.JG')+? J?'* <;. ?('D/</D-+/;)? 3$ -)* 3@
?J((.'??'*" Y'+'.;?Z'*-?+/D/+I .;0J?+ ?+-)*-.* '..;.? /) (-.')+C'?'?"
A ?/>)/</D-)+ -+ 43VW AA ?/>)/</D-)+ -+ BVW AAA ?/>)/</D-)+ -+ 4V"
"#$%& )'( :8-2&;0&4 M.#/+01 @34&% 53. 030#% &673.0* 8*+;- MC=
L=(;.+ ,-1J' -**'* 21;>?5 L=(;.+ ,-1J' -**'*
8/9/2019 The Puzzle of the Missing Greek Exports
http://slidepdf.com/reader/full/the-puzzle-of-the-missing-greek-exports 29/40
27
S-01' ̀ 6 ?C;g? .'>.'??/;) .'?J1+? ;< +C' -J>G')+'* g/+C 9F[ ?J0E/)*/D-+;.? >.-,/+I G;*'1 J?/)> ;J. (.'<'..'* '?+/G-+/;) G'+C;* 2[e ::PN5"
&'(')*')+ ,-./-01'X
[)?+/+J+/;)? [)<.-?+.JD+J.
'
P-D.; Y'-1 +C L*JD-+/ ;) 9;;*?
G-.Z'+
N-0;J.
G-.Z'+
O/)-)D/-1
G-.Z'+
S'DC);1;>I h
O&[
P-.Z'+ ?/a' `J?/)'??
?;(C
[));,-+/;)
9&: ;< '=(;.+'. 21;>?5 3"%B4AAA 3"$@4AAA 3"%@7AAA 3"%67AAA 3"%87AAA 3"%48AAA 3"%63AAA 3"%77AAA 3"%64AAA 4"3B%AAA 3"$$4AAA 3"$$$AAA
23"34465 23"34B%5 23"34885 23"346$5 23"343%5 23"344B5 23"34375 23"343#5 23"34465 23"3$435 23"34BB5 23"347$5
9&: ;< (-.+)'. 21;>?5 3"%8#AAA 3"%#8AAA 3"%6$AAA 3"%$BAAA 3"%#3AAA 3"%B3AAA 3"%4BAAA 3"%8%AAA 3"%B4AAA 3"B7$AAA 3"%8%AAA 3"%B4AAA
23"34885 23"348B5 23"34$%5 23"34#65 23"348#5 23"347#5 23"34445 23"347%5 23"34865 23"3B8#5 23"348@5 23"34875
9';>.-(C/D-1 */?+-)D' 21;>?5E3"B46AAA E3"8$#AAA E3"B3$AAA E3"B7$AAA E3"B3$AAA E3"B36AAA E3"B34AAA E3"8$7AAA E3"B33AAA E3"B8$AAA E3"B3$AAA E3"B48AAA
23"366@5 23"364@5 23"366B5 23"36@%5 23"364@5 23"36675 23"34$@5 23"36675 23"366%5 23"36475 23"36775 23"36635
F;GG;) 0;.*'. 3"4#8A 3"686AA 3"688AAA 3"7B#AAA 3"6$@AAA 3"68@AAA 3"8#%AAA 3"84BAAA 3"6BBAAA 3"6@@AAA 3"47% 3"4#7A
23"3$865 23"3$B35 23"3$745 23"3#$85 23"3#@%5 23"3$645 23"3B$75 23"3$465 23"3$475 23"3B%#5 23"3$$$5 23"3$B#5
HC-.'* D;1;)/-1 C/?+;.I E3"3B48 E3"3BB7 E3"374@ 3"3%#% E3"478A E3"3#4$ E3"3@64 E3"474A E3"44@A E3"34B@ E3"33B43 E3"3B8%
23"3B8#5 23"3B@#5 23"3#485 23"3#B75 23"3B%65 23"3B8%5 23"38$85 23"3B%B5 23"3BB65 23"3B475 23"3B#35 23"3B#@5
F;GG;) 1-)>J->' 3"83@AAA 3"7%@AAA 3"767AAA 3"487 3"7#3AAA 3"774AAA 3"466A 3"666AAA 3"7@6AAA 3"78$AAA 3"7@@AAA 3"7@BAAA
23"3#$$5 23"3#B$5 23"3$365 23"3%#%5 23"3#365 23"3#885 23"3B635 23"3#3$5 23"3#6$5 23"3#B45 23"3$$85 23"3#B65
K'>/ ;)-1 +.-*' ->.''G')+ 3"3#34 3"44@A 3"386B 3"3B@6 E3"3366$ 3"37$% 3"3884 E3"3668 3"34#@ 3"3763 3"3$B7 3"438
23"3#7$5 23"3#3%5 23"3#3@5 23"3#@35 23"3B#85 23"3#465 23"38645 23"3B6B5 23"3#375 23"3B#65 23"3$375 23"3#8#5
9F[ ;< '=(;.+'. 3"4#%AAA 3"4#3AAA 3"7B8AAA 3"8#7AAA 3"64#AAA 3"86BAAA 3"4@@AAA 3"68#AAA 3"63@AAA E3"74#AA 3"77BAAA 3"66%AAA
2 3"367@5 2 3"36@85 2 3"38@35 2 3"4375 2 3"38#35 2 3"3##75 2 3"373%5 2 3"38#75 2 3"37635 2 3"44%5 2 3"38%35 2 3"36@B5
9F[ ;< (-.+)'. E3"34#4 E3"3763 E3"3BB@ E3"677AA 3"3##B 3"3@%4 3"743AAA 3"4%BAAA 3"347% 3"B44AAA E3"3B@7 3"33B$7
23"364$5 23"363$5 23"38#85 23"3%6#5 23"37#75 23"3B365 23"377$5 23"37%B5 23"36675 23"3%@B5 23"37445 23"367B5
F;)?+-)+ E3"36%@ 3"378@ E4"373 E3"B43 E3"$$$ E4"#%7AAA E4"6@4AAA E4"#74AAA E3"733 3"##8A E3"643 3"4#B
23"7885 23"6%B5 23"B8$5 23"@6$5 23"8345 23"B345 23"6B%5 23"8745 23"77B5 23"6%85 23"7$45 23"6%85
QJG0'. ;< ;0?'.,-+/;)? 8T4%3 8T4%3 8T4%3 8T4%3 8T4%3 8T4%4 8T4%6 8T4%7 8T4%8 8T4%B 8T4%# 8T4%$
K6 U :?'J*;EK6 3"%% 3"%% 3"%% 3"%# 3"%@ 3"%% 3"@6 3"%@ 3"%@ 3"%% 3"%# 3"%%
"#$%& )9L M.#/+01 @34&% 53. 030#% &673.0* #8-2&;0&4 X+0B 0B& MC= *8$K+;4+,#03.* D=> ??@A &*0+2#0+3; 2&0B34F
Export value added
8/9/2019 The Puzzle of the Missing Greek Exports
http://slidepdf.com/reader/full/the-puzzle-of-the-missing-greek-exports 30/40
28
S-01' ̀ 7 ?C;g? .'>.'??/;) .'?J1+? ;< +C' -J>G')+'* g/+C &` ?J0E/)*/D-+;.? >.-,/+I G;*'1 J?/)> ;J. (.'<'..'* '?+/G-+/;) G'+C;* 2[e ::PN5"
&'(')*')+ ,-./-01'X
H+-.+/)> -
`J?/)'??
K'>/?+'./)>
:.;('.+I
9'++/)>
F.'*/+
L)<;.D/)>
F;)+.-D+?
K'?;1,/)>
[)?;1,')DI
&'-1/)> g/+C
F;)?+.JD+/;)
:'.G/+?
:.;+'D+/)>
[),'?+;.?
:-I/)> S-='? S.-*/)>
^D.;??
`;.*'.?
9&: ;< '=(;.+'. 2 1;>?5 3"%7#AAA 3"%7@AAA 3"%68AAA 3"%47AAA 3"$@$AAA 3"%3@AAA 3"%74AAA 3"%8%AAA 3"%66AAA
23"33@B75 23"33%8%5 23"33%#%5 23"344#5 23"33@475 23"346@5 23"34675 23"343$5 23"344#5
9&: ;< (-.+)'. 2 1;>?5 3"%B$AAA 3"%#3AAA 3"%6$AAA 3"%#@AAA 3"%#BAAA 3"%78AAA 3"%67AAA 3"%%7AAA 3"%B$AAA
23"344%5 23"346B5 23"343@5 23"348#5 23"343$5 23"34B$5 23"343@5 23"3485 23"348#5
9';>.-(C/D-1 */?+-)D' 21;>?5 E3"8%@AAA E3"B#4AAA E3"8%6AAA E3"B46AAA E3"B36AAA E3"B73AAA E3"B6BAAA E3"8B#AAA E3"B47AAA23"364B5 23"34%75 23"34$65 23"36775 23"34%5 23"36475 23"34#@5 23"36785 23"364@5
F;GG;) 0;.*' . 3"6$$AAA 3"6B8AAA 3"8##AAA 3"678AA 3"766AAA 3"487 3"8@#AAA 3"8B$AAA 3"4%7AA
23"3#B5 23"3BBB5 23"38%45 23"3$6#5 23"3BB$5 23"3%#%5 23"38%@5 23"3$4@5 23"3$365
HC-.'* D;1;)/-1 C/?+;.I E3"44#A E3"436A E3"4%3AAA E3"46BA E3"44%AA E3"377# E3"3%7 E3"4%%AAA E3"3@4$
23"3B$$5 2 3"3B45 2 3"387$5 23"3#6B5 23"388@5 23"3#%B5 23"3B765 23"3B8B5 23"3B@5
F;GG;) 1-)>J->' 3"634AA 3"7%$AAA 3"4BBAAA 3"737AAA 3"7@%AAA 3"7$3AAA 3"3$68 3"688AAA 3"847AAA
23"3#485 23"38@#5 23"38B5 23"3#7%5 23"38$@5 2 3"3%3@5 23"3B5 23"3#3@5 23"3#%@5
K'>/;)-1 +.-*' ->.' 'G')+ E3"3%B$ 3"348$ E3"366% 3"367$ 3"3687 3"34$6 E 3"33@@7 E3"373@ 3"384#
23"3B#75 23"38B@5 23"383@5 23"3##%5 23"3875 23"3#$65 23"38375 23"3B3B5 23"3#885
&` ;< '=(;.+'. 3"33343@ 3"3476AAA 3"33$B$AAA 3"3768AAA 3"33$86AAA 3"34B4AAA 3"338B3AA 3"33%##AAA 3"3736AAA
23"336$75 23"334B$5 23"3344#5 23"33B765 23"333%875 23"337365 23"334#5 23"334#5 23"338B75
&` ;< (-.+)'. 3"33@7%AAA 3"3386BAA 3"3444AAA E3"3374$ 3"333%#8 E3"336B$A 3"3488AAA 3"33@83AAA E3"3363B
23"3366B5 23"334B$5 23"334385 23"336##5 23"333$65 23"3343#5 23"3347%5 23"334#5 23"334@%5
F;)?+-)+ 3"3B4% E3"34%7 E3"7#B E4"34@A 3"88@A 3"6#8 3"3438 E4"4$7AAA E4"8@6AA
23"83@5 23"6BB5 23"6445 23"8%5 23"4@85 23"775 23"4%#5 23"7885 23"8@@5
QJG0'. ;< ;0?'.,-+/;)? BT$$6 BT$$6 BT$$6 BT$$6 BT$$6 7T%%B 7T%%B 7T%%B 7T%%B
K6 U :?'J*;EK6 3"%% 3"%@ 3"@4 3"%3 3"@4 3"%# 3"@6 3"@3 3"%%
L=(;.+ ,-1J' -**'*
"#$%& )OL M.#/+01 @34&% 53. 030#% &673.0* #8-2&;0&4 X+0B 0B& I) *8$K+;4+,#03.* D=> ??@A &*0+2#0+3; 2&0B34F
8/9/2019 The Puzzle of the Missing Greek Exports
http://slidepdf.com/reader/full/the-puzzle-of-the-missing-greek-exports 31/40
29
S-01' `8 ?C;g? .'>.'??/;) .'?J1+? ;< +C' -J>G')+'* g/+C _9[ ?J0E/)*/D-+;.? >.-,/+I G;*'1 J?/)> ;J.
(.'<'..'* '?+/G-+/;) G'+C;* 2[e ::PN5"
&'(')*')+ ,-./-01'X
e;/D' -)*
^DD;J)+-0/1/+I
:;1/+/D-1
H+-0/1/+I KJ1' ;< 1-g
K'>J1-+;.I
iJ-1/+I
9;,'.)G')+
L<<'D+/,')'??
F;)+.;1 ;<
F;..J(+/;)
9&: ;< '=(;.+'. 2 1;>?5 3"%B3AAA 3"%@$AAA 3"%7BAAA 3"%87AAA 3"%7@AAA 3"%87AAA
23"33%$@5 23"34365 23"33%$75 23"33%B%5 23"33%$75 23"33%$75
9&: ;< (-.+)'. 2 1;>?5 3"%#4AAA 3"%86AAA 3"%#8AAA 3"%$6AAA 3"%#%AAA 3"%#4AAA
23"34635 23"343%5 23"34475 23"34435 23"34485 23"34485
9';>.-(C/D-1 */?+-)D' 21;>?5 E3"B66AAA E3"B87AAA E3"B6BAAA E3"8%%AAA E3"B66AAA E3"B6#AAA
23"34$#5 23"36435 23"34%85 23"34%75 23"34$85 23"34%35
F;GG;) 0;.*'. 3"6B7AAA 3"38%B 3"4@@AAA 3"7#BAAA 3"68@AAA 3"64%AAA
23"3B665 23"3##35 23"3B$75 23"3B765 23"3B865 23"3BB@5
HC-.'* D;1;)/-1 C/?+;.I E3"3%7@ 3"36@4 E3"46BAA E3"4$4AAA E3"466AA E3"3%%%A
23"387#5 23"38#B5 23"38785 23"387#5 23"386@5 23"386$5
F;GG;) 1-)>J->' 3"7@$AAA 3"84BAAA 3"83#AAA 3"6%%AAA 3"7@6AAA 3"7@$AAA
23"38@B5 23"3B%B5 23"38@65 23"38B85 23"38$35 23"38@35
K'>/;)-1 +.-*' ->.''G')+ 3"33767 3"43% E3"33843 E3"37#4 E3"3347@ 3"333B66
23"38@B5 23"3#345 23"38@%5 23"386%5 23"38B$5 23"38%B5
_9[ ;< '=(;.+'. 3"7@7AAA 3"B7%AAA 3"6$4AAA 3"7#6AAA 3"66@AAA 3"4$%AAA23"3B%65 23"38$#5 23"36@$5 23"38@35 23"36%%5 23"363%5
_9[ ;< (-.+)'. E3"3848A E3"43#AAA 3"33B#4 3"434AAA 3"33873 E3"33@37
23"34%35 23"368@5 23"34@45 23"36@#5 23"364#5 23"34BB5
F;)?+-)+ 3"$##AAA 3"##@AA 3"@88AAA 3"77# 3"%#4AAA 4"363AAA
23"6445 23"67$5 23"63#5 23"6465 23"6345 23"6375
QJG0'. ;< ;0?'.,-+/;)? %T7#3 %T7#3 %T7#3 %T7#3 %T7#3 %T7#3
K6 3"%$ 3"%# 3"%% 3"%@ 3"%% 3"%%
,-1J' -**'*
"#$%& )RL M.#/+01 @34&% 53. 030#% &673.0* #8-2&;0&4 X+0B 0B& YM= *8$K+;4+,#03.* D=> ??@A &*0+2#0+3; 2&0B34F
8/9/2019 The Puzzle of the Missing Greek Exports
http://slidepdf.com/reader/full/the-puzzle-of-the-missing-greek-exports 32/40
30
S-01' `B ?C;g? .'>.'??/;) .'?J1+? ;< +C' -J>G')+'* g/+C H9[ ?J0E/)*/D-+;.? >.-,/+I G;*'1 J?/)> ;J.
(.'<'..'* '?+/G-+/;) G'+C;* 2[e ::PN5"
&'(')*')+ ,-./-01'X
L1'D+;.-1
:.;D'??
^DD'?? +;
[)<;.G-+/;) F/,/1 K/>C+? KJ1' ;< N-g
LD;);GI -)*
LG(1;IG')+ H;D/-1 ̂ <<-/.? H'DJ./+I K'?;J.D'?
9&: ;< '=(;.+'. 2 1;>?5 3"%8@AAA 3"%8BAAA 3"%#6AAA 3"%#3AAA 3"%B8AAA 3"%$3AAA 3"%%%AAA 3"%#4AAA
2 3"36B35 23"34@75 2 3"36745 23"364B5 2 3"34$$5 2 3"36475 2 3"36775 2 3"363%5
9&: ;< (-.+)'. 2 1;>?5 3"%#8AAA 3"@36AAA 3"%%8AAA 3"@34AAA 3"@4#AAA 3"@74AAA 3"%$4AAA 3"%@$AAA
23"364B5 2 3"34@%5 23"364%5 2 3"36635 23"34$@5 23"36B35 2 3"34%%5 2 3"36435
9';>.-(C/D-1 */?+-)D' 21;>?5E3"B$#AAA E3"B#8AAA E3"B%8AAA E3"B#4AAA E3"B8$AAA E3"BB#AAA E3"B#%AAA E3"B$8AAA
2 3"37%@5 23"37B$5 2 3"37%85 23"37%@5 2 3"37485 2 3"37$$5 2 3"37B65 2 3"37@65
F;GG;) 0;.*'. 3"43$ 3"63BA 3"36B3 3"4#7 3"763AA 3"4$8 3"6B6A 3"473
23"4665 23"4375 23"4675 23"44$5 23"3@%%5 23"44%5 23"4365 23"46%5
HC-.' * D;1;)/-1 C/?+;.I E3"33768 E3"3%#@ E3"3%3@ E3"4B8 E3"48BA E3"4@BA E3"4$4 E3"63BA
23"3%@85 2 3"3$BB5 23"3@465 2 3"3%7@5 23"3$7$5 23"3%6$5 2 3"3%%#5 2 3"3%635
F;GG;) 1-)>J->' 3"7$3AA 3"7#8AAA 3"87BAAA 3"7@BAAA 3"68@AA 3"7%#AAA 3"83@AAA 3"8%7AAA
23"4675 23"3@375 23"4485 23"43%5 23"3%#B5 23"3@$75 23"3@B85 23"43$5
K' >/;)-1 +.-*' ->.' 'G' )+ E 3"3$3% 3"38@$ E 3"3$7@ E3"36#% 3"3%43 E 3"36#4 E3"36@8 E3"3688
2 3"3@#35 2 3"3%4%5 2 3"3%B%5 23"3%%75 2 3"3##$5 2 3"3%6#5 23"3$$75 2 3"3%B$5
H9[ ;< ' =(;.+' . 3"646AAA 3"44%AAA 3"46#AA 3"3%4BAAA 3"437AAA 3"3@8BA 3"3$87 3"468AAA
2 3"3#6@5 23"373B5 2 3"384%5 23"366$5 2 3"36B65 2 3"37$45 23"38885 2 3"37B65
H9[ ;< (-.+)'. 3"33@#4 3"3#$%AA 3"38%6 3"377% 3"474AAA 3"47%AAA E3"46#AAA 3"338$B
2 3"38$#5 23"36B#5 2 3"37365 2 3"34$$5 23"36835 2 3"37##5 2 3"37%35 2 3"36#45
F;)?+-)+ E3"$%3 E3"$B3 E3"84% E3"666 E4"3%BAA E4"4@B 4"3B6 E3"364$
23"%6@5 23"B4%5 23"#745 23"B385 23"7@65 23"#435 23"#8B5 23"88B5
QJG0'. ;< ;0?'.,-+/;)? %46 %46 %46 %46 %46 %46 %46 %46
K6 3"%$ 3"@4 3"%% 3"%@ 3"@7 3"@4 3"@6 3"@3
,-1J' -**'*
"#$%& )UL M.#/+01 @34&% 53. 030#% &673.0* #8-2&;0&4 X+0B 0B& ZM= *8$K+;4+,#03.* D=> ??@A &*0+2#0+3; 2&0B34F
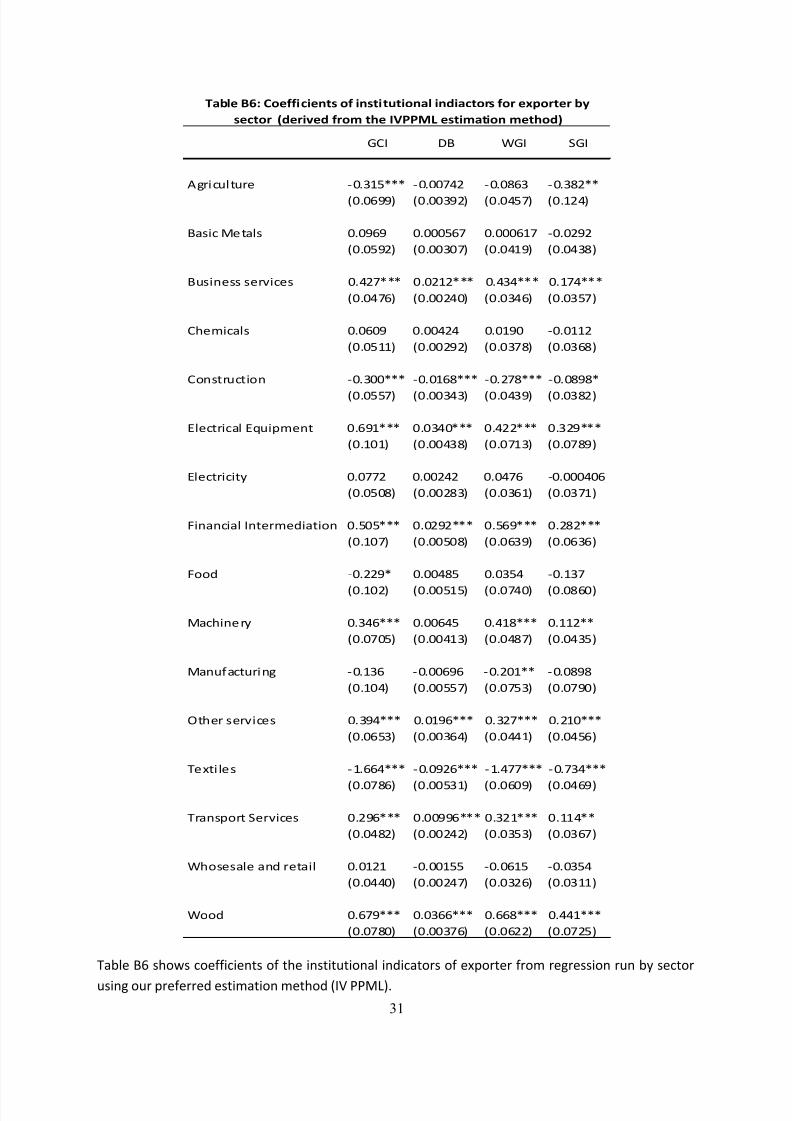
8/9/2019 The Puzzle of the Missing Greek Exports
http://slidepdf.com/reader/full/the-puzzle-of-the-missing-greek-exports 33/40
31
S-01' `# ?C;g? D;'<</D/')+? ;< +C' /)?+/+J+/;)-1 /)*/D-+;.? ;< '=(;.+'. <.;G .'>.'??/;) .J) 0I ?'D+;.
J?/)> ;J. (.'<'..'* '?+/G-+/;) G'+C;* 2[e ::PN5"
^>./DJ1+J.' E3"74BAAA E3"33$86 E3"3%#7 E3"7%6AA
23"3#@@5 23"337@65 23"38B$5 23"4685
`-?/D P'+-1? 3"3@#@ 3"333B#$ 3"333#4$ E3"36@6
23"3B@65 23"3373$5 23"384@5 23"387%5
`J?/)'?? ?'.,/D'? 3"86$AAA 3"3646AAA 3"878AAA 3"4$8AAA
23"38$#5 23"336835 23"378#5 23"37B$5
FC'G/D-1? 3"3#3@ 3"33868 3"34@3 E3"3446
23"3B445 23"336@65 23"37$%5 23"37#%5
F;)?+.JD+/;) E3"733AAA E3"34#%AAA E3"6$%AAA E3"3%@%A
23"3BB$5 23"337875 23"387@5 23"37%65
L1'D+./D-1 L\J/(G')+ 3"#@4AAA 3"3783AAA 3"866AAA 3"76@AAA
23"4345 23"3387%5 23"3$475 23"3$%@5
L1'D+./D/+I 3"3$$6 3"33686 3"38$# E3"33383#
23"3B3%5 23"336%75 23"37#45 23"37$45
O/)-)D/-1 [)+'.G'*/-+/;) 3"B3BAAA 3"36@6AAA 3"B#@AAA 3"6%6AAA
23"43$5 23"33B3%5 23"3#7@5 23"3#7#5
O;;* E3"66@A 3"338%B 3"37B8 E3"47$
23"4365 23"33B4B5 23"3$835 23"3%#35
P-DC/)'.I 3"78#AAA 3"33#8B 3"84%AAA 3"446AA
23"3$3B5 23"338475 23"38%$5 23"387B5
P-)J<-D+J./)> E3"47# E3"33#@# E3"634AA E3"3%@%
23"4385 23"33BB$5 23"3$B75 23"3$@35
M+C'. ?'.,/D'? 3"7@8AAA 3"34@#AAA 3"76$AAA 3"643AAA
23"3#B75 23"337#85 23"38845 23"38B#5
S'=+/ 1'? E4"##8AAA E3"3@6#AAA E4"8$$AAA E3"$78AAA
23"3$%#5 23"33B745 23"3#3@5 23"38#@5
S.-)?(;.+ H'.,/D'? 3"6@#AAA 3"33@@#AAA 3"764AAA 3"448AA
23"38%65 23"336865 23"37B75 23"37#$5
_C;?'?-1' -)* .'+-/1 3"3464 E3"334BB E3"3#4B E3"37B8
23"38835 23"3368$5 23"376#5 23"37445
_;;* 3"#$@AAA 3"37##AAA 3"##%AAA 3"884AAA
23"3$%35 23"337$#5 23"3#665 23"3$6B5
"#$%& )S( C3&55+,+&;0* 35 +;*0+080+3;#% +;4+#,03.* 53. &673.0&. $1
*&,03. D4&.+/&4 5.32 0B& =>??@A &*0+2#0+3; 2&0B34F
9F[ &` _9[ H9[
8/9/2019 The Puzzle of the Missing Greek Exports
http://slidepdf.com/reader/full/the-puzzle-of-the-missing-greek-exports 34/40
32
REFERENCES
Anderson, James E, 1979. "A Theoretical Foundation for the Gravity Equation," AmericanEconomic Review, American Economic Association, vol. 69(1), pages 106-16, March.
Anderson, James E. & Douglas Marcouiller, 2002. "Insecurity And The Pattern Of Trade: An
Empirical Investigation," The Review of Economics and Statistics, MIT Press, vol. 84(2), pages 342-352, May.
Anderson, James E. & Eric van Wincoop, 2003. "Gravity with Gravitas: A Solution to the Border
Puzzle," American Economic Review, American Economic Association, vol. 93(1), pages 170-192,
March.
Athanasoglou, Panayiotis & Ioanna Vardaka, 2008. " Price and non-price competitiveness os exportsof manufactures", Bank of Greece, Working Paper 69, April.
Barro, Robert & Silvana Tenreyro, 2007. "Economic Effects Of Currency Unions," EconomicInquiry, Western Economic Association International, vol. 45(1), pages 1-23, 01.
Boston Consulting Group Presentation, 2013, "Impact Assessment of the Shipping Cluster on theGreek Economy & Society"
Costinot, Arnaud, 2009. "On the origins of comparative advantage," Journal of International
Economics, Elsevier, vol. 77(2), pages 255-264, April.
Davis, Donald R. & Weinstein, David E., 2003. "Market access, economic geography and
comparative advantage: an empirical test," Journal of International Economics, Elsevier, vol. 59(1),
pages 1-23, January.
De Groot, Henri L. F. & Gert-Jan Linders & Piet Rietveld & Uma Subramanian, 2004. "The
Institutional Determinants of Bilateral Trade Patterns," Kyklos, Wiley Blackwell, vol. 57(1), pages 103-123, 02.
Eaton, Jonathan & Samuel Kortum, 2002. "Technology, Geography, and Trade," Econometrica, Econometric Society, vol. 70(5), pages 1741-1779, September.
Feenstra, Robert C, 2002. "Border Effects and the Gravity Equation: Consistent Methods for
Estimation," Scottish Journal of Political Economy, Scottish Economic Society, vol. 49(5), pages
491-506, December.
Helpman, Elhanan & Marc Melitz & Yona Rubinstein, 2008. "Estimating Trade Flows: Trading
Partners and Trading Volumes," The Quarterly Journal of Economics, MIT Press, vol. 123(2), pages441-487, 05.
Helpman, Elhanan & Paul Krugman, 1987. "Market Structure and Foreign Trade: Increasing
Returns, Imperfect Competition, and the International Economy," MIT Press Books, The MITPress, edition 1, volume 1, number 026258087x, December.
IOVE, 2013, "The Contribution of Ocean-going Shipping to the Greek Economy"
8/9/2019 The Puzzle of the Missing Greek Exports
http://slidepdf.com/reader/full/the-puzzle-of-the-missing-greek-exports 35/40
33
Jones, Ronald W., 1961. Comparative Advantage and the Theory of Tariffs: A Multi-Country, Multi-
Commodity Model Review of Economic Studies (1961) 28 (3): 161-175
Krugman, Paul R, 1981. "Intraindustry Specialization and the Gains from Trade," Journal ofPolitical Economy, University of Chicago Press, vol. 89(5), pages 959-73, October.
Krugman, Paul R., 1979. "Increasing returns, monopolistic competition, and international trade,"Journal of International Economics, Elsevier, vol. 9(4), pages 469-479, November.
Krugman, Paul, 1980. "Scale Economies, Product Differentiation, and the Pattern of Trade,"American Economic Review, American Economic Association, vol. 70(5), pages 950-59, December.
Levchenko, Andrei A., 2007. "Institutional Quality and International Trade," Review of EconomicStudies, Oxford University Press, vol. 74(3), pages 791-819.
McCallum, John, 1995. "National Borders Matter: Canada-U.S. Regional Trade Patterns,"American Economic Review, American Economic Association, vol. 85(3), pages 615-23, June.
Nunn, Nathan, 2007. "Relationship-Specificity, Incomplete Contracts, and the Pattern of Trade,"The Quarterly Journal of Economics, MIT Press, vol. 122(2), pages 569-600, 05.
Papazoglou, Christos, 2007. "Greece's potential trade flows: A gravity model approach", InternationalAdvances in Economic Research, Volume 13, Issue 4, pp 403-414, November.
Rahman, Jesmin & Tianli Zhao, 2013. "Export performance in Europe: The role of vertical supply
links," IMF Working Paper No. 13/62, March 2013.
Ranjan, Priya & Jae Young Lee, 2007. "Contract Enforcement And International Trade,"
Economics and Politics, Wiley Blackwell, vol. 19(2), pages 191-218, 07.
Rose, Andrew K., 2000. "One money, one market: the effect of common currencies on trade,"
Economic Policy, CEPR & CES & MSH, vol. 15(30), pages 7-46, 04.
Rose, Andrew K., 2004. "Do We Really Know That the WTO Increases Trade?," AmericanEconomic Review, American Economic Association, vol. 94(1), pages 98-114, March.
Salto, Matteo & Alessandro Turrini, 2010. " Comparing alternative methodologies for real exchangerate assessment", European Commission DG ECFIN Economic Paper No. 427.
Samuelson, Paul (1948): International Trade and the Equalisation of Factor Prices
Santos Silva, J. M. C. & Silvana Tenreyro, 2006. "The Log of Gravity," The Review of Economicsand Statistics, MIT Press, vol. 88(4), pages 641-658, November.
Shepherd, Ben & John Wilson, 2008. "Trade Facilitation in ASEAN member countries: Measuring
Progress and Assessing Priorities," World Bank, Policy Research Working Paper 4615, May 2008
Tinbergen Jan, 1962. "Shaping the World Economy; Suggestions for an International Economic
Policy", Twentieth Century Fund, New York.
Trefler Daniel, 1995. "The Case of the Missing Trade and Other Mysteries", The American Economic
Review, Vol. 85, No 5, December 1995, 1029-1046.

8/9/2019 The Puzzle of the Missing Greek Exports
http://slidepdf.com/reader/full/the-puzzle-of-the-missing-greek-exports 36/40

8/9/2019 The Puzzle of the Missing Greek Exports
http://slidepdf.com/reader/full/the-puzzle-of-the-missing-greek-exports 37/40
!"#$#%&" ()(!*+
!" $% &' ()*+ ,-$&$./- 01234" -1& 53 1--3""36 1&6 6$7&8$1636 %433 $% -914:3 1; ;93 %$88$7/&:
16643""< 9;;2<==3->3?4$21>3?=3-$&$.@A%/&1&-3=2?58/-1;/$&"=3-$&$./-A21234=/&63BA3&>9;.
!8;34&1;/C38@+ 9146 -$2/3" .1@ 53 $463436 C/1 ;93 D04/&;E$&E63.1&6F "34C/-3 $%%3436 5@ ;93 ,G
H$$I"9$2< 9;;2<==5$$I"9$2>3?4$21>3?>

8/9/2019 The Puzzle of the Missing Greek Exports
http://slidepdf.com/reader/full/the-puzzle-of-the-missing-greek-exports 38/40
8/9/2019 The Puzzle of the Missing Greek Exports
http://slidepdf.com/reader/full/the-puzzle-of-the-missing-greek-exports 39/40
!"# %" "&%'() *+ ,+&-(.'%(")/
0122 3456789:7;<=>
• "#$ %"&'(
)*+ ,- .""/01"& 2133&(445""/01"&6$78"&+6$79:
• ;"8$ 31+# "#$ %"&' "8 &"03$804;+&0(
<8"; 31$ ,78"&$+# -#*"#=0 8$&8$0$#3+3*"#0 2133&(44$%6$78"&+6$748$&8$0$#3>$#613;9:
<8"; 31$ ?$@$A+3*"#0 *# #"#B,- %"7#38*$0 2133&(44$$+06$78"&+6$74?$@$A+3*"#04*#?$C>$#613;9:
5' %"#3+%3*#A 31$ ,78"&$ D*8$%3 0$8)*%$ 2133&(44$78"&+6$74$78"&$?*8$%34*#?$C>$#613;9 "8
%+@@*#A EE FEE G H F I JE JJ 2<8$$&1"#$ #7;5$8 <8"; +#'K1$8$ *# 31$ ,-9 2L96
2L9 M1$ *#<"8;+3*"# A*)$# *0 <8$$N +0 +8$ ;"03 %+@@0 231"7A1 0";$ "&$8+3"80N &1"#$ 5"C$0 "8 1"3$@0 ;+' %1+8A$ '"796
,1782? 3456789:7;<=>
• )*+ ,- .""/01"& 2133&(445""/01"&6$78"&+6$796
,1782? =45=8173:7;<=>
• )*+ "#$ "< 31$ 0+@$0 +A$#30 "< 31$ O75@*%+3*"#0 P<<*%$ "< 31$ ,78"&$+# -#*"#
2133&(44&75@*%+3*"#06$78"&+6$74"31$804+A$#304*#?$C>$#613;96
8/9/2019 The Puzzle of the Missing Greek Exports
http://slidepdf.com/reader/full/the-puzzle-of-the-missing-greek-exports 40/40
! " #$ % #& ' # ( & ) #* + #+