the recent increase of methane from 10 years of ndacc … back up... · the recent increase of...
TRANSCRIPT
The recent increase of methanefrom 10 years of NDACC
ground-based FTIR observationsBader, W. et al., Ten years of atmospheric methane from ground-based NDACC FTIR observations, Atmos. Chem. Phys. Discuss.,
doi:10.5194/acp-2016-699, in review, 2016.
Logo EU
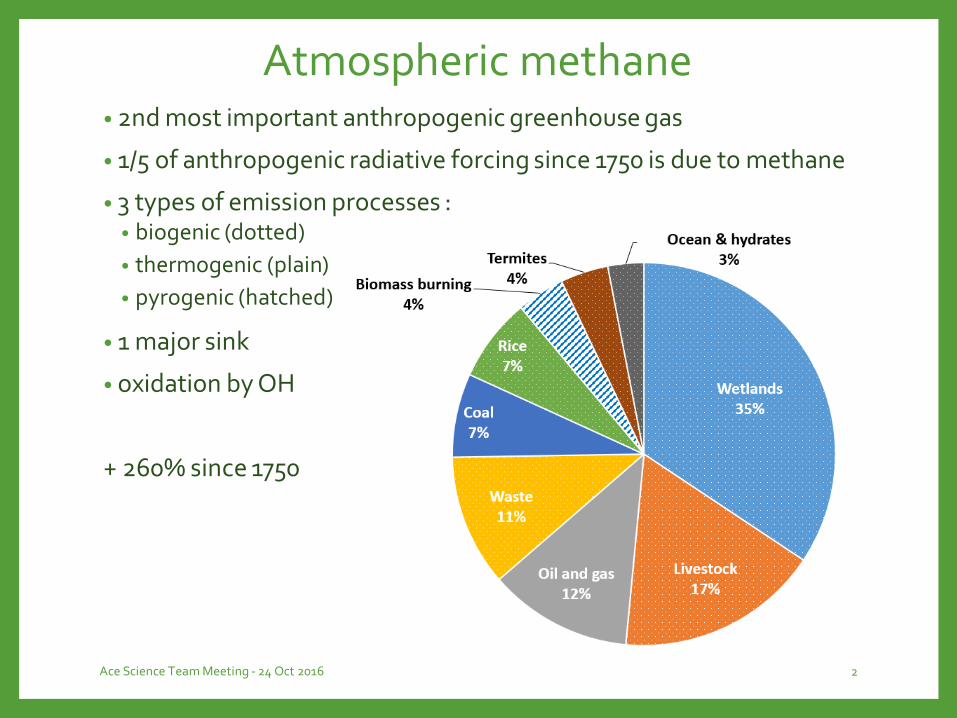
Atmospheric methane• 2nd most important anthropogenic greenhouse gas
• 1/5 of anthropogenic radiative forcing since 1750 is due to methane
• 3 types of emission processes :• biogenic (dotted)
• thermogenic (plain)
• pyrogenic (hatched)
• 1 major sink
• oxidation by OH
+ 260% since 1750
Ace Science Team Meeting - 24 Oct 2016 2
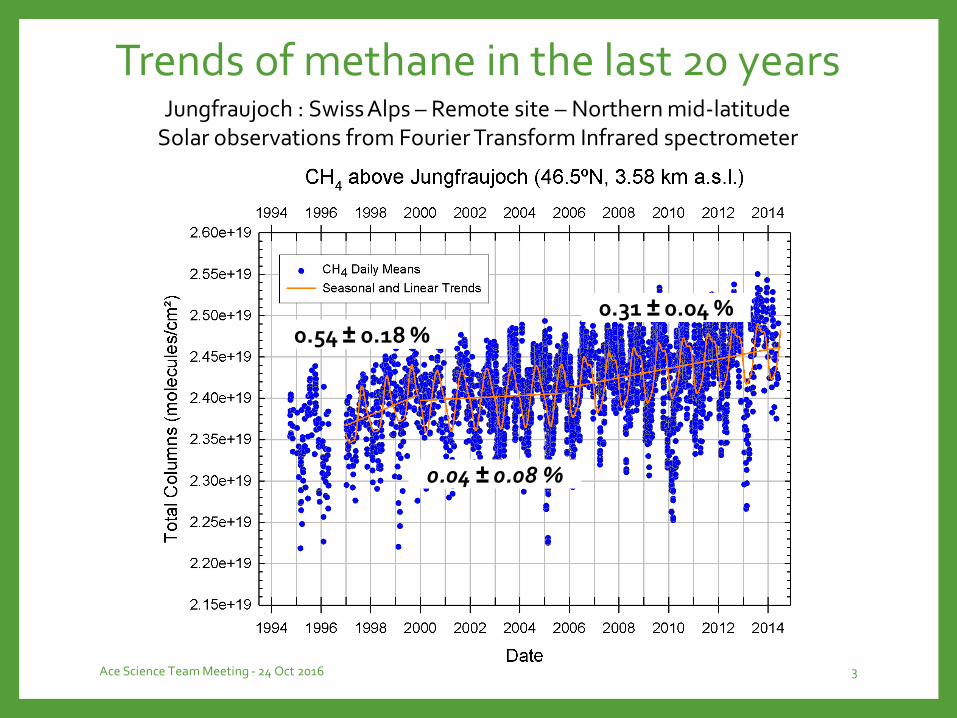
Trends of methane in the last 20 years
Ace Science Team Meeting - 24 Oct 2016 3
0.54 ± 0.18 %
0.04 ± 0.08 %
0.31 ± 0.04 %
Jungfraujoch : Swiss Alps – Remote site – Northern mid-latitudeSolar observations from Fourier Transform Infrared spectrometer

Unexplained increase since ~2005
Ace Science Team Meeting - 24 Oct 2016 4
0.54 ± 0.18 %
-0.04 ± 0.08 %
0.31 ± 0.04 %
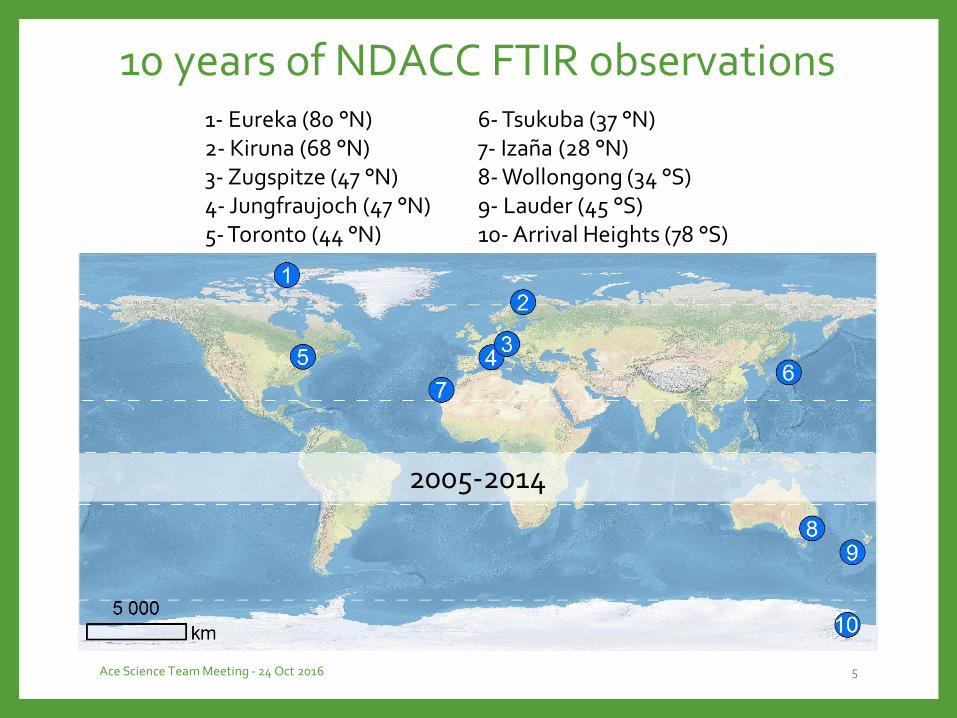
10 years of NDACC FTIR observations
Ace Science Team Meeting - 24 Oct 2016 5
1- Eureka (80 °N)2- Kiruna (68 °N)3- Zugspitze (47 °N)4- Jungfraujoch (47 °N)5- Toronto (44 °N)
6- Tsukuba (37 °N)7- Izaña (28 °N)8- Wollongong (34 °S)9- Lauder (45 °S)10- Arrival Heights (78 °S)
2005-2014

10 years of NDACC FTIR observations
Ace Science Team Meeting - 24 Oct 2016 6
> Anomaly with respect to 2005.0 Averaged increase : 0.31 ± 0.03 %/year
0.26 ± 0.02 %/year : Wollongong0.39 ± 0.09 %/year : Toronto
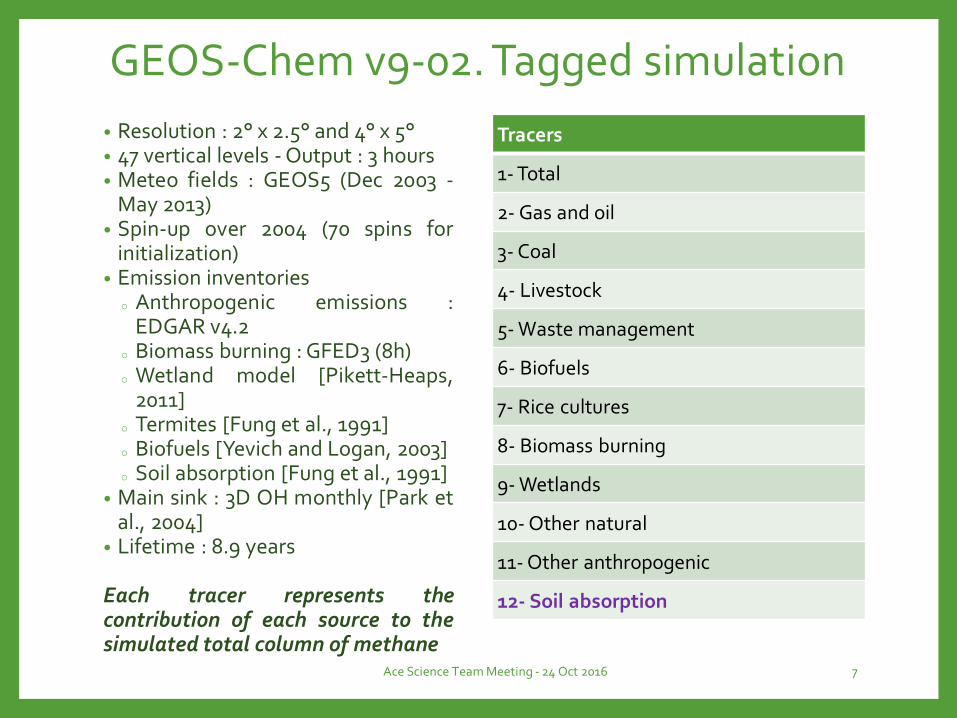
• Resolution : 2° x 2.5° and 4° x 5°• 47 vertical levels - Output : 3 hours• Meteo fields : GEOS5 (Dec 2003 -
May 2013)• Spin-up over 2004 (70 spins for
initialization)• Emission inventories
o Anthropogenic emissions :EDGAR v4.2
o Biomass burning : GFED3 (8h)o Wetland model [Pikett-Heaps,
2011]o Termites [Fung et al., 1991]o Biofuels [Yevich and Logan, 2003]o Soil absorption [Fung et al., 1991]
• Main sink : 3D OH monthly [Park etal., 2004]
• Lifetime : 8.9 years
Each tracer represents thecontribution of each source to thesimulated total column of methane
Tracers
1- Total
2- Gas and oil
3- Coal
4- Livestock
5- Waste management
6- Biofuels
7- Rice cultures
8- Biomass burning
9- Wetlands
10- Other natural
11- Other anthropogenic
12- Soil absorption
Ace Science Team Meeting - 24 Oct 2016 7
GEOS-Chem v9-02. Tagged simulation

FTIR vs GEOS-Chem
Ace Science Team Meeting - 24 Oct 2016 8
• Maximum bias 4.8 ± 3.5 % (Arrival Heights) ≈ FTIR systematic error
> Anomaly with respect to 2005.0
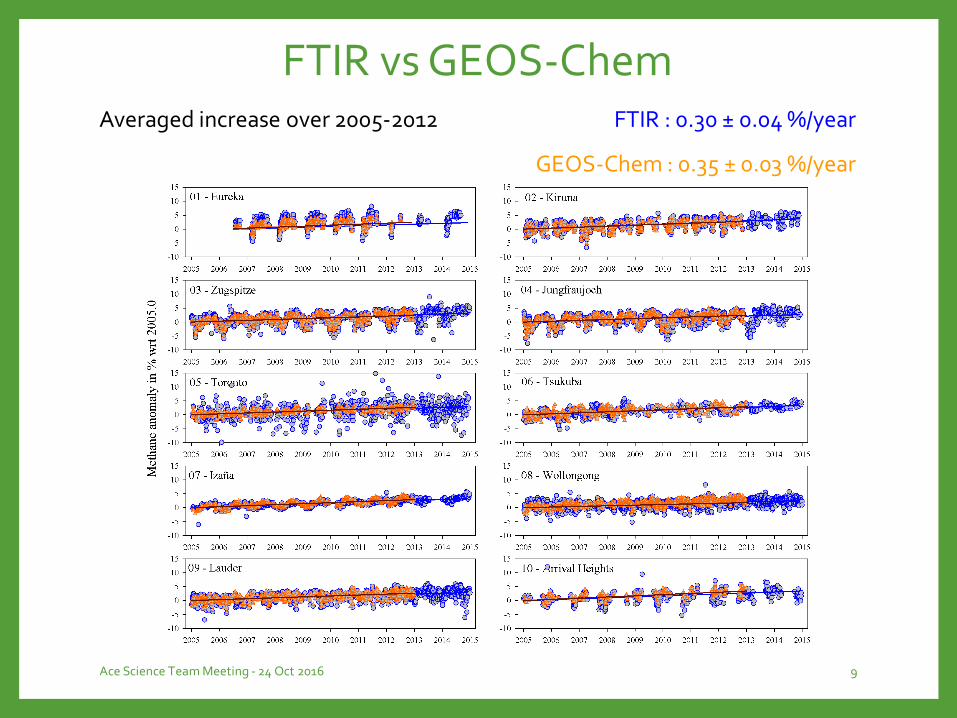
FTIR vs GEOS-Chem
Ace Science Team Meeting - 24 Oct 2016 9
Averaged increase over 2005-2012 FTIR : 0.30 ± 0.04 %/year
GEOS-Chem : 0.35 ± 0.03 %/year

Methane since 2005
Ace Science Team Meeting - 24 Oct 2016 10
GC tagged simulation : Analysis
Ace Science Team Meeting - 24 Oct 2016 11
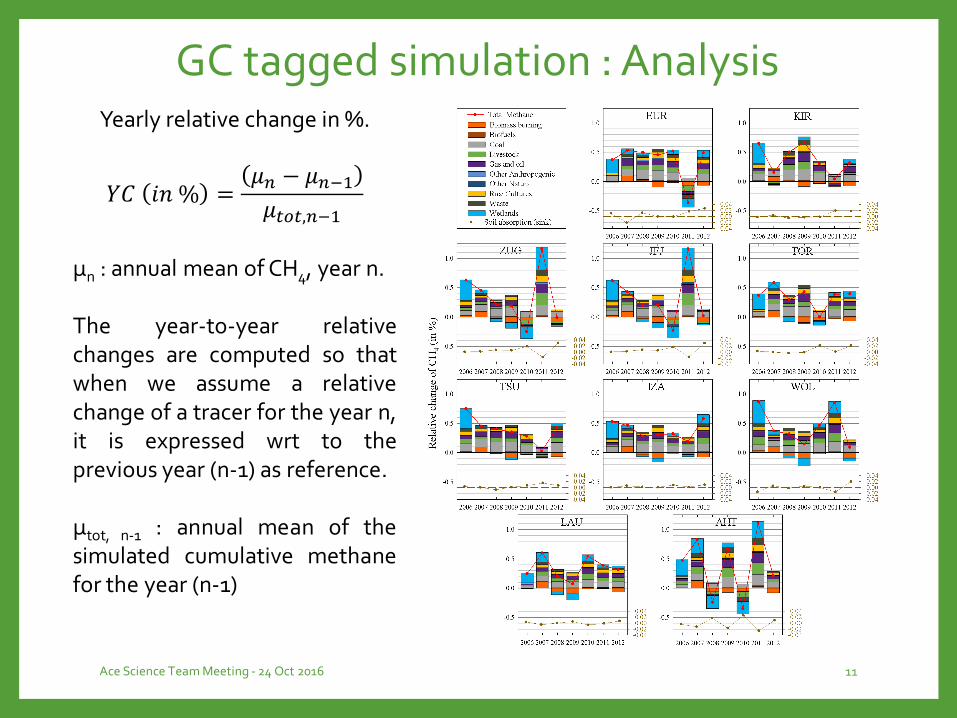
Yearly relative change in %.
𝑌𝐶 𝑖𝑛 % =𝜇𝑛 − 𝜇𝑛−1𝜇𝑡𝑜𝑡,𝑛−1
μn : annual mean of CH4, year n.
The year-to-year relativechanges are computed so thatwhen we assume a relativechange of a tracer for the year n,it is expressed wrt to theprevious year (n-1) as reference.
µtot, n-1 : annual mean of thesimulated cumulative methanefor the year (n-1)

GC tagged simulation : Analysis• Yearly relative change (%)
• Natural sources mainly responsible for the interannual variation
• e.g. Wollongong
Ace Science Team Meeting - 24 Oct 2016 12

GC tagged simulation : Analysis• Yearly relative change (%)
• Secondary contributors to the budget contribute to the increase
• e.g. Izaña
Ace Science Team Meeting - 24 Oct 2016 13
GC tagged simulation : Analysis
Ace Science Team Meeting - 24 Oct 2016 14
EUR KIR ZUG JFJ TOR TSU IZA WOL LAU AHT
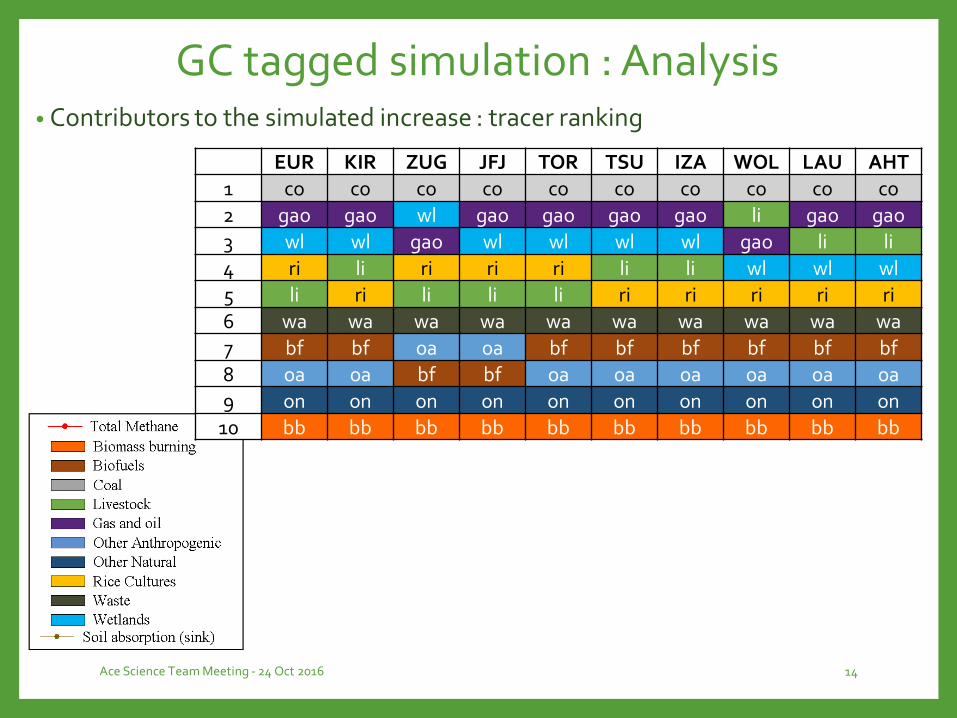
1 co co co co co co co co co co
2 gao gao wl gao gao gao gao li gao gao
3 wl wl gao wl wl wl wl gao li li
4 ri li ri ri ri li li wl wl wl
5 li ri li li li ri ri ri ri ri
6 wa wa wa wa wa wa wa wa wa wa
7 bf bf oa oa bf bf bf bf bf bf
8 oa oa bf bf oa oa oa oa oa oa
9 on on on on on on on on on on
10 bb bb bb bb bb bb bb bb bb bb
• Contributors to the simulated increase : tracer ranking

Methane increase : Discussion
Many studies…Rigby et al., 2008Ringeval et al., 2010Bloom et al., 2010
Aydin et al., 2011Dlugokencky et al., 2009Sussmann et al., 2012
Kirschke et al., 2013Nisbet et al., 2014Hausmann et al., 2016Schaefer et al., 2016
Ace Science Team Meeting - 24 Oct 2016 15
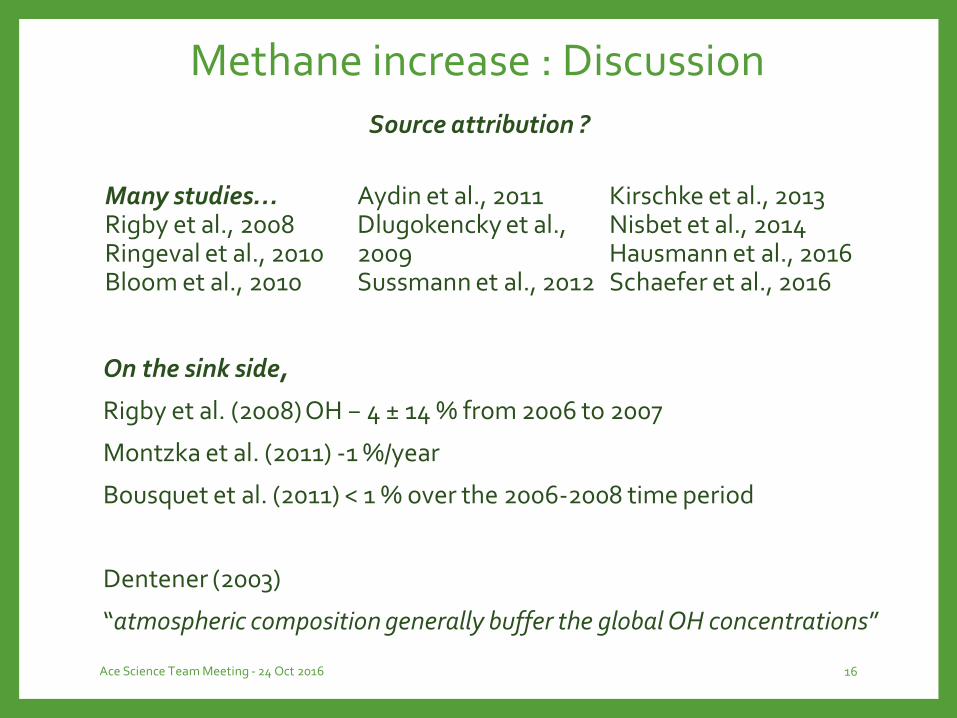
Source attribution ?
Methane increase : Discussion
Many studies…Rigby et al., 2008Ringeval et al., 2010Bloom et al., 2010
Aydin et al., 2011Dlugokencky et al., 2009Sussmann et al., 2012
Kirschke et al., 2013Nisbet et al., 2014Hausmann et al., 2016Schaefer et al., 2016
Ace Science Team Meeting - 24 Oct 2016 16
On the sink side,
Rigby et al. (2008) OH − 4 ± 14 % from 2006 to 2007
Montzka et al. (2011) -1 %/year
Bousquet et al. (2011) < 1 % over the 2006-2008 time period
Dentener (2003)
“atmospheric composition generally buffer the global OH concentrations”
Source attribution ?

Methane increase : Discussion
From GEOS-Chem tagged simulationSecondary contributors to the global budget of methane play amajor role in the increase of methane observed since 2005.→ coal mining, gas and oil transport and exploitation
Ace Science Team Meeting - 24 Oct 2016 17
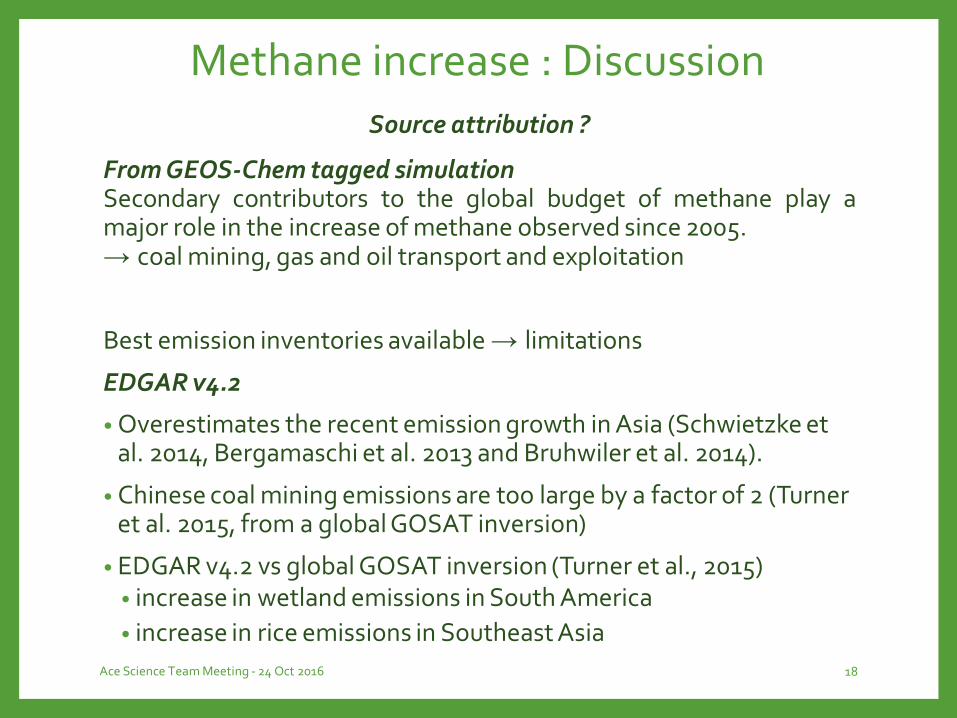
Source attribution ?
Methane increase : Discussion
From GEOS-Chem tagged simulationSecondary contributors to the global budget of methane play amajor role in the increase of methane observed since 2005.→ coal mining, gas and oil transport and exploitation
Best emission inventories available → limitations
EDGAR v4.2
• Overestimates the recent emission growth in Asia (Schwietzke et al. 2014, Bergamaschi et al. 2013 and Bruhwiler et al. 2014).
• Chinese coal mining emissions are too large by a factor of 2 (Turner et al. 2015, from a global GOSAT inversion)
• EDGAR v4.2 vs global GOSAT inversion (Turner et al., 2015)• increase in wetland emissions in South America
• increase in rice emissions in Southeast Asia
Ace Science Team Meeting - 24 Oct 2016 18
Source attribution ?

Methane increase : Discussion
Gas and oil use and exploitation (GAO)
underestimated by current emission inventories (incl. EDGAR)
Franco et al., 2015, 2016; Turner et al., 2015, 2016
Ace Science Team Meeting - 24 Oct 2016 19
Source attribution ?
Methane increase : Discussion
Gas and oil emissions : the use of C2H6 as a proxy
Production, transport and use of natural gas and the leakage associated to itamounts at ~ 62 % of ethane’s atmospheric budget (Logan et al., 1981;Rudolph, 1995)
Ace Science Team Meeting - 24 Oct 2016 20
Source attribution ?
Methane increase : Discussion
Gas and oil emissions : the use of C2H6 as a proxy
Production, transport and use of natural gas and the leakage associated to itamounts at ~ 62 % of ethane’s atmospheric budget (Logan et al., 1981;Rudolph, 1995)
Franco et al., 2016
• Observations : sharp increase of C2H6 since 2009
→ ~5 %/year at mid-latitudes, ~3 %/year at remote sites
• Massive growth of oil and gas exploitation in the North Americancontinent, confirmed by Helmig et al. 2016
Ace Science Team Meeting - 24 Oct 2016 21
Source attribution ?

Methane increase : Discussion
Gas and oil emissions : the use of C2H6 as a proxy
Production, transport and use of natural gas and the leakage associated to itamounts at ~ 62 % of ethane’s atmospheric budget (Logan et al., 1981;Rudolph, 1995)
Franco et al., 2016
• Observations : sharp increase of C2H6 since 2009
→ ~5 %/year at mid-latitudes, ~3 %/year at remote sites
• Massive growth of oil and gas exploitation in the North Americancontinent, confirmed by Helmig et al. 2016
Methane increase ? From C2H6/CH4 ratio derived from GOSATmeasurements
• → from 20 Tg in 2008, to 35 Tg in 2014
• Confirming the influence of GAO on the observed methane increase
Ace Science Team Meeting - 24 Oct 2016 22
Source attribution ?
Methane increase : Discussion
Gas and oil emissions : the use of C2H6 as a proxy
Production, transport and use of natural gas and the leakage associated to itamounts at ~ 62 % of ethane’s atmospheric budget (Logan et al., 1981;Rudolph, 1995)
Hausmann et al. 2016
C2H6/CH4 ratio derived from an atmospheric two-box model
GAO contribution of 39 % to the renewed methane in Zugspitze between2007 and 2014
Ace Science Team Meeting - 24 Oct 2016 23
Source attribution ?
Methane increase : Discussion
Gas and oil emissions : the use of C2H6 as a proxy
Production, transport and use of natural gas and the leakage associated to itamounts at ~ 62 % of ethane’s atmospheric budget (Logan et al., 1981;Rudolph, 1995)
Hausmann et al. 2016
C2H6/CH4 ratio derived from an atmospheric two-box model
GAO contribution of 39 % to the renewed methane in Zugspitze between2007 and 2014
BUT
The strength of the C2H6/CH4 relationship associated to GAO stronglydepends on the studied region and/or production basin
Variability rarely taken into account (Kort et al. 2016, Peischl et al. 2016)
Ace Science Team Meeting - 24 Oct 2016 24
Source attribution ?
Methane increase : Discussion
Gas and oil use and exploitation (GAO)
underestimated by current emission inventories (incl. EDGAR)
Franco et al., 2015, 2016; Turner et al., 2015, 2016
Ace Science Team Meeting - 24 Oct 2016 25
Source attribution ?

Methane increase : Discussion
Gas and oil use and exploitation (GAO)
underestimated by current emission inventories (incl. EDGAR)
Franco et al., 2015, 2016; Turner et al., 2015, 2016
Lyon et al. (2016) pointed out that emissions from GAO well pads may be missing from most bottom-up emission inventories.
Ace Science Team Meeting - 24 Oct 2016 26
Source attribution ?
A horizontal drilling rig for natural gas in the Marcellus formation in
eastern Lycoming County, Pennsylvania.

Methane increase : Discussion
Gas and oil use and exploitation (GAO)
underestimated by current emission inventories (incl. EDGAR)
Franco et al., 2015, 2016; Turner et al., 2015, 2016
Lyon et al. (2016) pointed out that emissions from GAO well pads may be missing from most bottom-up emission inventories.
Ace Science Team Meeting - 24 Oct 2016 27
Source attribution ?
Emissions differ from one well pad toanother and even within the samepad depending on the depth of theextraction.
e.g. Marcellus Basin that is actually two different overlapping basins. The depth of the well thus determines into which basin it’s drilling.

Conclusions
• CH4 change since 2005 from FTIR ground-based measurements
• 0.31 ± 0.03 %/year with respect to 2005.0
• Consistent with methane changes computed from in situ measurements
Source attribution ?
• GEOS-Chem tagged simulation : 11 tracers from 2005 to 2012
• 0.35 ± 0.03 %/year vs 0.30 ± 0.04 %/year (FTIR)
• Natural sources contribute to the inter-annual variability
• Anthropogenic sources, second contributors to the global budgetmethane, contribute to the observed increase• coal mining
• gas and oil exploitation
• livestock
Ace Science Team Meeting - 24 Oct 2016 28
Conclusions
• While we showed that GEOS-Chem agrees with our observations, therepartition between the different sources of methane would greatlybenefit from an improvement of the global emission inventories.
• EDGAR v4.2• US oil and gas and livestock are underestimated.
• Coal emissions are overestimated.
• Further attention has to be given to improved anthropogenic methaneinventories, such as emission inventories associated with fossil fuel andnatural gas production. This is essential in a context of the energytransition that includes the development of shale gas exploitation.
Ace Science Team Meeting - 24 Oct 2016 29
THANKYOU !
Bader, W. et al., Ten years of atmospheric methane from ground-based NDACC FTIR observations, Atmos. Chem. Phys. Discuss.,
doi:10.5194/acp-2016-699, in review, 2016.
The University of Liège’s involvement has primarily been supported by the PRODEX and SSD programs funded by theBelgian Federal Science Policy Office (Belspo), Brussels. W.B. has received support by a postdoctoral fellowship fromthe University of Toronto. This project has received funding from the European Union’s Horizon 2020 research andinnovation programme under the Marie Sklodowska-Curie grant agreement No 704951.