the recent state and variability of the carbonate system
TRANSCRIPT
Biogeosciences, 17, 3923–3942, 2020https://doi.org/10.5194/bg-17-3923-2020© Author(s) 2020. This work is distributed underthe Creative Commons Attribution 4.0 License.
The recent state and variability of the carbonate system of theCanadian Arctic Archipelago and adjacent basins in thecontext of ocean acidificationAlexis Beaupré-Laperrière1, Alfonso Mucci1, and Helmuth Thomas2,a
1GEOTOP and Department of Earth and Planetary Sciences, McGill University, 3450 University Street,Montréal, Quebec, H3A 0E8, Canada2Department of Oceanography, Dalhousie University, Halifax, Nova Scotia, B3H 4R2, Canadaanow at: Center for Materials and Coastal Research, Helmholtz-Zentrum Geesthacht, Geesthacht, Germany
Correspondence: Alexis Beaupré-Laperrière ([email protected])
Received: 29 January 2020 – Discussion started: 20 February 2020Revised: 10 June 2020 – Accepted: 24 June 2020 – Published: 31 July 2020
Abstract. Ocean acidification driven by the uptake of an-thropogenic CO2 by the surface oceans constitutes a poten-tial threat to the health of marine ecosystems around theglobe. The Arctic Ocean is particularly vulnerable to acid-ification and thus is an ideal region to study the progres-sion and effects of acidification before they become globallywidespread. The appearance of undersaturated surface wa-ters with respect to the carbonate mineral aragonite (�A<1),an important threshold beyond which the calcification andgrowth of some marine organisms might be hindered, has re-cently been documented in the Canada Basin and adjacentCanadian Arctic Archipelago (CAA), a dynamic region withan inherently strong variability in biogeochemical processes.Nonetheless, few of these observations were made in the last5 years and the spatial coverage in the latter region is poor.We use a dataset of carbonate system parameters measuredin the CAA and its adjacent basins (Canada Basin and Baf-fin Bay) from 2003 to 2016 to describe the recent state ofthese parameters across the Canadian Arctic and investigatethe amplitude and sources of the system’s variability overmore than a decade. Our findings reveal that, in the sum-mers of 2014 to 2016, the ocean surface across our studyarea served as a net CO2 sink and was partly undersaturatedwith respect to aragonite in the Canada Basin and the QueenMaud Gulf, the latter region exhibiting undersaturation overits entire water column at some locations. We estimate, usingmeasurements made across several years, that approximatelya third of the interannual variability in surface dissolved inor-ganic carbon (DIC) concentrations in the CAA results from
fluctuations in biological activity. In consideration of the sys-tem’s variability resulting from these fluctuations, we derivetimes of emergence of the anthropogenic ocean acidificationsignal for carbonate system parameters in the study area.
1 Introduction
Ocean acidification and its repercussions on marine ecosys-tems constitute an important consequence of the ongoing risein atmospheric carbon dioxide (CO2) concentrations. Theworld’s oceans absorbed approximately one-third of the an-thropogenic CO2 released to the atmosphere over the last twocenturies of industrial activity (Sabine et al., 2004) and arecurrently a sink for ∼ 24 % of global annual anthropogeniccarbon emissions (Le Quéré et al., 2018). Atmospheric car-bon dioxide uptake by the surface oceans has well-definedimpacts on seawater chemistry, including a decrease of pHresulting from the dissociation of carbonic acid (H2CO3), theproduct of the reaction between water and dissolved CO2. Alarge fraction of the hydrogen ions released by this reaction isneutralized by carbonate ions (CO2−
3 ), leading to a decreaseof their concentration and, concomitantly, the saturation stateof seawater with respect to the carbonate minerals calcite andaragonite. The saturation state is defined by
�C,A =[Ca2+
][CO2−
3
]/K∗SP, (1)
Published by Copernicus Publications on behalf of the European Geosciences Union.
3924 A. Beaupré-Laperrière et al.: The recent state and variability of the carbonate system
where square brackets denote concentrations and K∗SP is thestoichiometric solubility product of calcite or aragonite, thetwo most common marine CaCO3 polymorphs, at a giventemperature, pressure and salinity.
The combination of these chemical reactions is most of-ten referred to as ocean acidification (OA). As it proceeds,the dissolved inorganic carbon (DIC) concentration (the sumof [H2CO∗3], [HCO−3 ] and [CO2−
3 ]) in the surface ocean isexpected to increase relative to the total alkalinity (TA; thecapacity of a solution to neutralize protons), as the latter isnearly conservative in the surface ocean (Wolf-Gladrow etal., 2007). The global mean surface ocean pH currently sits∼ 0.1 units below its pre-industrial value (Orr et al., 2005)and, according to Earth System models, under the Intergov-ernmental Panel on Climate Change’s “business as usual”RCP8.5 emission scenario, is predicted to decrease by anadditional 0.3 units by the end of this century (Bopp et al.,2013).
Marine calcifying organisms, many of which are impor-tant primary producers (e.g., coccolithophores), extract theconstituents of their calcitic or aragonitic tests (shells) fromseawater. In most cases, their ability to do so is directly de-pendent on the saturation state of the surrounding water. Su-persaturated seawater (�>1) will favour carbonate precipi-tation, whereas undersaturated seawater (�<1) favours car-bonate dissolution. The majority of calcifying organisms, in-cluding planktonic foraminifera and coccolithophores, un-dergo dissolution or exhibit substantially hindered growthwhen exposed to undersaturated seawater (e.g., Mostofa etal., 2016). Calcifying organisms found in the Arctic Oceanare subject to rapid environmental changes, as this polarocean is warming more rapidly than others (Serreze andBarry, 2011) and is particularly vulnerable to acidificationdue to the low alkalinity and correspondingly weak buffercapacity of its cold waters (Shadwick et al., 2013). Atmo-spheric CO2 uptake by Arctic surface waters is further pro-moted by the rapidly melting seasonal ice cover (e.g., Stroeveet al., 2012), which exposes a gradually larger area of theocean to gas exchange with the atmosphere and whose melt-water dilutes calcium concentrations, alkalinity and carbon-ate ion concentrations, further decreasing �.
The Canadian Arctic Archipelago (CAA) and its adjacentdeep basins, the Canada Basin (CB) and Baffin Bay (BB,Fig. 1), are part of the region projected to undergo the largestreduction in ice cover and, consequently, the largest decreasein surface pH (∼ 0.6) and � (1 and 0.7 for �C and �A,respectively) over the 21st century (Popova et al., 2014).Recent observations (e.g., Yamamoto-Kawai et al., 2009b;Robbins et al., 2013; Qi et al., 2017) hint at a significantdecrease of the aragonite saturation state of surface waters,notably near the continental shelves (Chierici and Fransson,2009; Bates et al., 2009), as well as a rapid expansion ofthe undersaturated area in the Canada Basin. Aragonite sat-uration states in surface waters remain above saturation butrelatively low (�A = 1.5–2.5) in the eastern CAA and Baf-
fin Bay (Azetsu-Scott et al., 2010). Most of the time seriesdescribing carbonate mineral saturation states predate 2010and/or do not extend geographically to the CAA and BaffinBay.
In this study, we use a large observational dataset for thispart of the Arctic to (1) describe the recent state of the car-bonate chemistry and its spatial variability in the CanadianArctic Archipelago and adjacent basins, (2) investigate theinterannual variability in carbonate system parameters andidentify detectable temporal trends using time series span-ning from 2003 to 2016, and (3) estimate the contributionof the temporal change in biological activity to the observedvariability of surface DIC.
2 Study area
2.1 Canada Basin
The Canada Basin (CB), Canadian Arctic Archipelago andBaffin Bay accommodate the flow of surface waters fromthe North Pacific to the North Atlantic (Stigebrandt, 1984),as well as circulation of Atlantic waters at greater depths.The water mass structure of the southern Canada Basin isrepresentative of these broad circulation patterns and can besummarized as follows (Carmack et al., 1989; MacDonald etal., 1989; Lansard et al., 2012): a relatively cold and freshsurface layer that contains significant fractions of meteoricwater (river discharge and precipitation) and sea ice melt inthe summer and becomes homogeneous in winter; an inter-mediate layer (∼ 50–200 m) of advected Pacific waters, of-ten divided into summer and winter varieties, the latter beingdistinctively rich in nutrients and metabolic CO2 and recog-nizable by a temperature minimum in the upper halocline; alayer of warm (∼ 0.5 ◦C) and saline (SP>34) Atlantic water;and a cold bottom layer with practical salinities (SP) reach-ing 34.85. The main surface circulation feature in this area,the clockwise Beaufort Gyre, is the largest freshwater reser-voir in the northern oceans, formed through Ekman pump-ing (Proshutinsky et al., 2009). This feature is reversed atdepth. The main source of freshwater to the Beaufort Sea(the southwest portion of the Canada Basin) is the MackenzieRiver (Carmack and MacDonald, 2002), although the contri-bution of sea ice melt is increasing significantly given theaccelerating reduction in ice cover (Yamamoto-Kawai et al.,2009a). The supply of freshwater at the surface, combinedwith the advection of pre-acidified waters from the Pacific(100–200 m) and the Atlantic (below 400 m; Luo et al., 2016)oceans result in the presence of three distinct and expanding�A undersaturation horizons in the Canada Basin (Wynn etal., 2016).
2.2 Canadian Arctic Archipelago
The CAA is a series of islands on the Canadian continen-tal shelf, through which complex circulation patterns un-
Biogeosciences, 17, 3923–3942, 2020 https://doi.org/10.5194/bg-17-3923-2020

A. Beaupré-Laperrière et al.: The recent state and variability of the carbonate system 3925
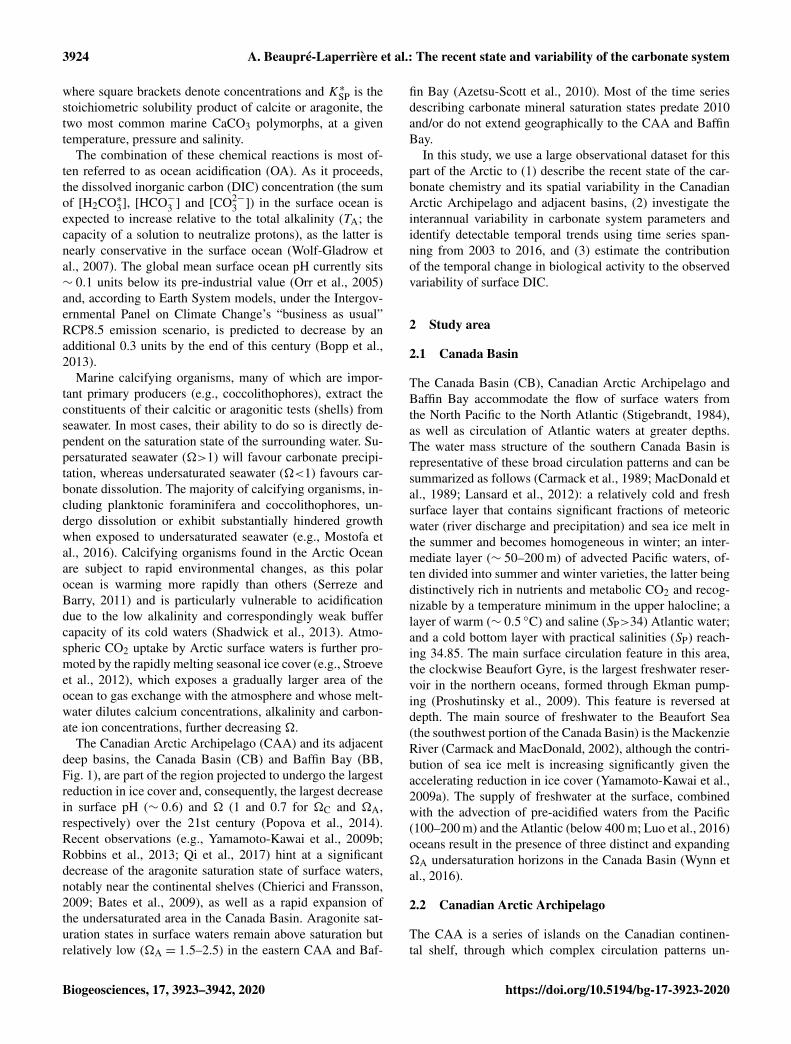
Figure 1. Map of the study area with dominant surface circulation flow paths (following McLaughlin et al., 2004, and Proshutinsky etal., 2009). CAA stands for Canadian Arctic Archipelago. Created using Ocean Data View (Schlizter, 2016).
fold in narrow and relatively shallow channels (<500 m);see McLaughlin et al. (2004) for a detailed description ofthe circulation and water mass processes in this area. Theprominent pathway for the eastward flow of Canada Basinwater masses into Baffin Bay extends along the 74th parallelfrom M’Clure Strait to Lancaster Sound. A shallow 125 msill at Barrow Strait, located centrally in the archipelago, in-hibits the eastward flow of Atlantic waters, so that only sur-face and Pacific-origin waters reach Baffin Bay (Bidleman etal., 2007). The properties of these water masses are substan-tially modified during this transit (McLaughlin et al., 2004).East of Barrow Strait, Atlantic waters originating from theLabrador Sea penetrate the archipelago through Baffin Bay.Smaller inflows of water from the deep Arctic Ocean intothe archipelago occur through the Queen Elizabeth Islands(northeast) and Nares Strait; minor outflows occur throughJones Sound and into Hudson Bay via Foxe Basin. Notwith-standing the Mackenzie River, whose discharge is limited tothe Beaufort Sea and Amundsen Gulf, the southern portion ofthe CAA receives a considerable amount of freshwater fromother large North American rivers (e.g., Coppermine, Burn-side, Black).
2.3 Baffin Bay
The oceanographic regime of Baffin Bay is distinct fromthat of the CAA and CB, as it receives multiple inputs fromboth the Arctic and Atlantic oceans. Cold and relatively freshArctic- and Pacific-derived waters enter this 2300 m deepsemi-enclosed basin through the Nares Strait and the Jonesand Lancaster sounds (Muench, 1971; Jones et al., 1998,2003). Warmer and more saline Atlantic Ocean waters aretransported from the Labrador Sea by the West GreenlandCurrent (WGC) into Baffin Bay through the eastern side
Figure 2. Geographical location of the oceanographic stations cov-ered by the dataset, colour-coded according to the year of sampling,with the approximate boundaries of the main areas mentioned in thetext.
of Davis Strait and circulate cyclonically, i.e., in an anti-clockwise direction, before joining the southward Baffin Is-land Current (BIC), which exits Baffin Bay through the west-ern Davis Strait (Bourke et al., 1989; Münchow et al., 2015).Atlantic Ocean waters are modified as they mix with Arcticinflows in northern Baffin Bay, near the North Water Polynya(Melling et al., 2001). The resulting water mass structureis described by Tang et al. (2004) as follows: (1) a cold(T<0 ◦C) and relatively fresh (SP<33.7) surface layer, rep-resenting the mixed Arctic inputs; (2) a warm (T>0 ◦C) andsaline (SP>34) Atlantic Ocean water layer found at depthsof ∼ 300 to 800 m; and (3) a deeper layer of nearly constantsalinity (SP = 34.5).
https://doi.org/10.5194/bg-17-3923-2020 Biogeosciences, 17, 3923–3942, 2020

3926 A. Beaupré-Laperrière et al.: The recent state and variability of the carbonate system
Table 1. Research cruises carried out by the CCGS Amundsen fromwhich the dataset was constructed.
Cruise Timescale
CASES Sep 2003–Aug 2004CFL Sep 2007–Jul 2008MALINA Jul–Aug 2009GEOTRACES Aug–Sep 2009ARCTICNET Leg 4a Oct–Nov 2009ARCTICNET Aug–Sep 2013ARCTICNET Aug–Sep 2014GEOTRACES/ARCTICNET Jul–Sep 2015ARCTICNET Aug–Oct 2016
3 Methods
The dataset used in this study comprises data from 420 sta-tions visited during various research cruises carried outaboard the Canadian Coast Guard Ship (CCGS) Amundsenbetween 2003 and 2016. Table 1 summarizes the time frameand relevant data acquired during each cruise; Fig. 2 showsthe position of each sampling station. Although ice condi-tions restricted most observations to the summer months, twowinter time series, acquired in 2003–2004 (CASES; Miller etal., 2011) and 2007–2008 (CFL; Shadwick et al., 2011) areincluded in the dataset.
3.1 Sampling and measurements
Seawater was sampled separately for each measured pa-rameter from Niskin bottles mounted on a Rosette sys-tem equipped with a Seabird SBE 911plus conductivity–temperature–depth (CTD) sensor, which recorded in situpractical salinity (SP) and temperature data throughout thewater column. The conductivity and salinity probe was cal-ibrated post-cruise against measurements carried out on dis-crete seawater samples using a Guildline Autosal 8400 sali-nometer (accuracy of ±0.002 or less), itself calibrated withIAPSO standard seawater. Samples used for pH determi-nation were drawn directly from the Niskin bottles into125 mL low-density polyethylene (LDPE) bottles with noheadspace to avoid gas exchange with surrounding air andleft to thermally equilibrate in a temperature bath set at 25.0(±0.1) ◦C. The pH, on the total proton scale (pHT), wasthen measured spectrophotometrically on a Hewlett-Packard8453 UV-visible diode array spectrophotometer using m-Cresol purple (Clayton and Byrne, 1993) and Phenol red(Robert-Baldo et al., 1985) indicators at 434 and 578 nm or433 and 558 nm, respectively, in a 5 cm quartz cell. Dailycalibrations were performed with TRIS buffer solutions atpractical salinities of 25 and/or 35, depending on the salin-ity range of the samples. The reproducibility was found to be±0.005 pH units or better, based on duplicate measurementsof the same samples with the same or both indicators. Sam-
ples destined for total alkalinity (TA) and dissolved inorganiccarbon (DIC) analyses were drawn directly from the Niskinbottles into 250 or 500 mL glass bottles with ground-glassstoppers, poisoned with solid mercuric chloride (HgCl2) tohalt biological activity, and sealed with Apiezon M grease.TA and DIC from the GEOTRACES 2009 and all post-
2010 cruises were measured onboard or at Dalhousie Uni-versity on a Marianda VINDTA 3C instrument, following theprotocol described by Dickson et al. (2007) and calibratedwith certified reference materials (CRM) provided by An-drew G. Dickson (Scripps Institute of Oceanography). Theprecision of the instrument was found to be ±2–3 µmol kg−1
based on repeated CRM analyses. The remaining DIC and TAanalyses were performed, respectively, on a SOMMA instru-ment (Johnson et al., 1993) fitted to a UIC 5011 coulometerand by potentiometric titration using a Radiometer Titrilab865 (see Mucci et al., 2010, for details) calibrated against thesame CRMs used with the VINDTA.
In situ pHT, DIC (ArcticNet 2009 only), pCO2, �Cand �A were calculated from TA and pHT (25 ◦C) or TAand DIC (for 548 out of 4730 data points) with the Ex-cel 2.1 version of the CO2SYS software (Lewis and Wal-lace, 1998), using the carbonic acid dissociation constantsdetermined by Mehrbach et al. (1973) and refit by Dick-son and Millero (1987), the HSO−4 dissociation constants ofDickson (1990), and the total boron concentration (BT) fromUppström (1974). pCO2 was normalized using CO2SYS tothe mean temperature of the top 100 m of the water column(−0.4 ◦C). The resulting ∂ln(pCO2) /∂T values range be-tween 0.033 and 0.051 ◦C−1, with a mean of 0.046 ◦C−1, ingood agreement with values obtained by Jiang et al. (2008;0.027–0.042 ◦C−1) and Takahashi et al. (1993; 0.0423 ◦C−1).
3.2 Quality control
In order to assess the robustness of the computed DIC values,we calculated DIC from TA and pHT (25 ◦C) and comparedthe results with the measured DIC values. The resulting co-efficient of determination of the linear fit to the measuredand calculated DIC values, R2, is 0.989, while the meandifference between calculated and measured DIC values is∼ 2 µmol kg−1. We excluded 30 measurements that differedfrom the calculated values by more than 50 µmol kg−1 (2.5 %of the mean DIC).
Questionable TA measurements, excluded from thedataset, were identified as those outside a range of 3 standarddeviations from the mean salinity-normalized TA for individ-ual regions (CB, CAA, BB) characterized by internally con-sistent water mass assemblages. TA measurements obtainedfrom the two instrumental methods (VINDTA and Radiome-ter Titrilab 865) used in 2015 and 2016 were also comparedto ensure that data originating from both methods could beused interchangeably in the calculation of additional param-eters and conjointly in time series. The resulting coefficientof determination between both datasets (R2) is 0.988, the
Biogeosciences, 17, 3923–3942, 2020 https://doi.org/10.5194/bg-17-3923-2020

A. Beaupré-Laperrière et al.: The recent state and variability of the carbonate system 3927
Table 2. Mean uncertainties of parameters computed in CO2SYS,their standard deviations and their relative weight with respect tothe mean value of each parameter, for different carbonate parameterinput pairs.
Computed Mean Uncertainty % of meanparameter uncertainty standard value
deviation
pHT (i-s) 0.026 0.002 0.3DIC (µmol kg−1) 6.8 0.7 0.4
Input parameters: TA/ pHT (TA/DIC)
pCO2 (µatm) 6.5 (25.0) 1.8 (6.7) 4.5 (17.5)�C 0.27 (0.13) 0.04 (0.04) 6.5 (3.2)�A 0.16 (0.08) 0.02 (0.02) 6.4 (3.1)1DICBio (µmol kg−1) 7.8–8.6∗ 1.3 69–77∗
∗ The δDICBio uncertainty depends on whether DICObserved was measured or computed.
mean of the non-systematic discrepancy between values is6 µmol kg−1 and its maximum is 36 µmol kg−1, respectively,corresponding to 0.3 % and 1.7 % of the mean TA. The de-gree to which the results of this test are representative of theentire dataset is uncertain, but they constitute the best pos-sible estimate of the uncertainty associated with the use ofthe two analytical methods used to measure TA. When TAmeasurements obtained from both methods deviated signif-icantly (>10 µmol kg−1), specific alkalinity (TA/SP), whichshould remain relatively constant in a given water mass ofuniform salinity (Millero, 2005; p. 268), was used to deter-mine which data to discard. The deviation from TA valuescalculated from DIC and pHT (25 ◦C) was used to comple-ment the first method, especially at the surface, although thevalidity of DIC measurements was previously assessed usingTA.
3.3 Error estimation
In order to quantify the error associated with the calculatedcarbonate system parameters reported in this study, we usedthe CO2SYS program modified by Orr et al. (2018), whichapplies error propagation to instrumental and constant-related uncertainties. For simplicity, we report the mean un-certainty for each parameter (see Table 2), as the variance isminimal within our dataset. We found the additional uncer-tainty associated with the unavailability of nutrient concen-trations (P and Si) as input parameters in CO2SYS to be neg-ligible (up to 0.0006 pH units, 1.5 µatm pCO2 and 0.006�units, as determined using nutrient data where available).
4 Results and discussion
4.1 Recent observations (2014–2016)
4.1.1 Surface observations
To characterize the recent state of seawater carbonate chem-istry in the study area, we use data obtained in the late sum-mers (August–September) of 2014, 2015 and 2016. Uncer-tainties for each parameter can be found in the Methods(Sect. 3.3). The mean 2014–2016 surface (<10 m) practi-cal salinity (SP), TA and DIC values in the Canada Basin(CB), Canadian Arctic Archipelago (CAA) and Baffin Bay(BB) are presented in Table 3. It is important to note thatthe mean regional values we report for the Canada Basinmay be skewed by the higher density of stations locatedalong the Mackenzie Shelf and that our sample size for Baf-fin Bay consists of only six stations. Practical salinities con-siderably below 25 were mostly observed near the mouth ofthe Mackenzie River, with some in the Queen Maud Gulf(QMG). The discrepancy between SP and TA values observedat the surface and in most of the water column of the CB,CAA and BB clearly illustrates the change in water massregime west of Lancaster Sound (see Sect. 2), while DIC,which is strongly affected by biological activity, shows a lessprominent spatial pattern. In all regions, surface water pCO2,of which we only consider data acquired over the top 5 mof the water column in order to render it more indicative ofgas exchange potential, was largely undersaturated with re-spect to the atmosphere, by as much as 150 µatm (Fig. 3).This suggests that the region as a whole acts as a net CO2sink during the summer, as Geilfus et al. (2018) observedin 2011. Ahmed et al. (2019) came to a similar conclusionbased on underway pCO2 measurements carried out in theCAA between 2010 and 2016 but reported consistent tem-poral fluctuations of summer sea surface pCO2 and 1pCO2driven by sea ice processes. The handful of locations exhibit-ing a positive 1pCO2 (pCO2SW–pCO2air; outgassing to theatmosphere) are located in the QMG and the transect be-tween Banks Island and Cape Bathurst (Fig. 4), where theepisodic upwelling of upper halocline water is well docu-mented (Mucci et al., 2010; Tremblay et al., 2011).
The saturation state of surface waters (<10 m) with re-spect to aragonite (�A, Fig. 5) ranges from 0.82 to 2.03(mean 1.26), 0.73 to 2.01 (mean 1.22) and 1.47 to 1.69(mean 1.57), respectively, in the CB, CAA and BB. �A cor-relates well with SP (r = 0.79; Fig. 6), although the sur-face samples with the highest salinities (SP ∼ 32), collectedin Baffin Bay, were not the most supersaturated. Recurrentundersaturated conditions (�A<1), potentially deleterious tocalcifying organisms, are found at the surface in two areas:the central Canada Basin and the Queen Maud Gulf. Suchconditions have been well documented in the former (e.g.,Robbins et al., 2013) and attributed mostly to the input ofsea ice melt, which lowers�A by diluting surface waters and
https://doi.org/10.5194/bg-17-3923-2020 Biogeosciences, 17, 3923–3942, 2020

3928 A. Beaupré-Laperrière et al.: The recent state and variability of the carbonate system
Table 3. Mean surface water (< 10 m) practical salinity (SP), total alkalinity (TA), dissolved organic carbon (DIC) and associated ranges inthe three subregions of the study area in 2014, 2015 and 2016.
SP TA (µmol kg−1) DIC (µmol kg−1)
Mean Range Mean Range Mean Range
Canada Basin 27.52 19.11–30.82 2029 1820–2231 1929 1761–2066CAA 27.57 22.17–31.40 1967 1604–2194 1868 1553–2061Baffin Bay 30.96 29.69–32.10 2138 2062–2209 1999 1920–2058
Figure 3. Surface water (<5 m) pCO2 and 1pCO2 (pCO2SW–pCO2air) from 2014, 2015 and 2016 in the Canada Basin (CB),Canadian Arctic Archipelago (CAA) and Baffin Bay (BB). Thedashed blue, green and red lines represent the average of theglobal mean monthly atmospheric pCO2 values for August andSeptember 2014, 2015 and 2016, respectively (data from Dlugo-kencky and Tans, NOAA/ESRL, https://www.esrl.noaa.gov/gmd/ccgg/trends/ last access: 28 March 2019). The 1pCO2 axis shiftsin accordance with the atmospheric value used for each year, suchthat points may be offset from their true position by up to 5.5 µatm.
promotes CO2 uptake (Yamamoto-Kawai et al., 2011). As of2016, surface undersaturation with respect to aragonite waslimited to the central Canada Basin and did not extend to itsbordering continental shelf, where �A remains near satura-tion (1–1.25).
In the Queen Maud Gulf, surface�A values as low as 0.84and 0.73 (±0.16) were observed in 2015 and 2016, respec-tively (most visible as the two minima in Figs. 6 and 7k).Most of the surrounding samples were slightly undersatu-rated (�A ∼ 0.90–1.05). Both minima were associated withlocally higher pCO2 values (429 and 438±6 µatm) and prac-tical salinities of 26.54 and 22.17. Two mechanisms, namelythe decrease in the calcium (Ca2+) ion concentration and al-kalinity via dilution by freshwater and the decrease of theCO2−
3 concentration concomitant with a decrease in pH, ex-plain these saturation minima. The former process is self-
Figure 4. Surface water (<5 m) pCO2 in 2014 (a), 2015 (b) and2016 (c) in the study area.
Biogeosciences, 17, 3923–3942, 2020 https://doi.org/10.5194/bg-17-3923-2020

A. Beaupré-Laperrière et al.: The recent state and variability of the carbonate system 3929
Figure 5. Surface water (<10 m) �A (a, b, c) and �C (d, e, f) in 2014 (a, d), 2015 (b, e) and 2016 (c, f). Note the different colour scales for�A and �C, for which the diverging value for the former is 1 and is 2 for the latter.
explanatory and results from the documented increase infreshwater inputs by melting of sea ice (Yamamoto-Kawai etal., 2009b) and increased river discharge (Déry et al., 2016).We estimate, based on a linear regression of surface δ18Odata against SP, that upwards of 95 % of the freshwater atthe surface of the QMG in 2015 was of riverine origin (Ap-pendix B). Our dataset does not allow us to directly differen-tiate the contributions of air–sea gas exchange and biologi-cal activity (respiration) to the high pCO2 observed at theselocations. Nonetheless, the depth of these samples (<5 m)implies some degree of equilibration with the atmosphere.Although the diurnal cycle of biological activity may playa role in the development of peaks in �, we rule out diur-nal fluctuations in pCO2 as the principal explanation for the�A minima discussed above, as the 0.73 minimum of 2016,was observed in the early afternoon. Although the �A min-ima represent significant undersaturation, the uncertainty in�A computations (0.08 or 0.16 depending on the parame-ters used in the calculation; see Sect. 3) blurs the saturation
threshold in such a way that �A values marginally below 1might in reality represent supersaturated conditions, and viceversa. It is important to note that, even without the influenceof climate change, areas of high riverine discharge naturallyharbour lower carbonate mineral saturation states. Thus, un-dersaturated conditions in the QMG and elsewhere do notsolely result from the recent increase of freshwater inputs de-scribed above or air–sea gas exchange. Nonetheless, changesin the amount of freshwater-driven dilution and atmosphericCO2 uptake affect the degree of this undersaturation, as wellas its spatial and temporal extent.
Surface waters throughout the study area are supersatu-rated with respect to calcite, with �C ranges (mean) of 1.34to 3.25 (2.04), 1.21 to 3.29 (1.97) and 2.38 to 2.70 (2.52)in the CB, CAA and BB, respectively. Uncertainties in �Cvalues are on the order of 0.25–0.30, almost twice as largeas those of �A, due to the larger uncertainty of the calcitestoichiometric solubility product (Mucci, 1983).
https://doi.org/10.5194/bg-17-3923-2020 Biogeosciences, 17, 3923–3942, 2020

3930 A. Beaupré-Laperrière et al.: The recent state and variability of the carbonate system
Figure 6. Surface water (<10 m)�A and associated practical salin-ities (SP, colour scale) in 2014, 2015 and 2016 in the Canada Basin(CB), Canadian Arctic Archipelago (CAA) and Baffin Bay (BB).The horizontal line at �A = 1 represents saturation with respect toaragonite.
4.1.2 Water column observations
Depth profiles of pHT, pCO2 and �A grouped by region(equivalent to water mass regime) are presented in Fig. 7. Wedivided the broad Canadian Arctic Archipelago region intofour subregions (see Fig. 2): the Parry Channel, the east–westchannel extending from M’Clure Strait to Lancaster Sound,the Amundsen Gulf, and the Queen Maud Gulf and the cen-tral CAA, which connects the QMG to the Parry Channel.The water mass structures are essentially the same as thosedescribed in Sect. 2.
The most prominent feature in profiles of carbonate sys-tem parameters in the Canada Basin is the Upper HaloclineLayer (UHL), a layer of water originating from the PacificOcean with a relatively low pH due to its high metabolic CO2content (Shadwick et al., 2011). In 2014–2016, the UHL wascharacterized by a pHT minimum of 7.82± 0.03, a pCO2maximum of ∼ 652± 6 µatm (both calculated at in situ tem-perature) and a �A minimum of 0.75± 0.16 in the centralCB. This pHT minimum migrates upwards from ∼ 180 to∼ 140 m as the UHL encounters the continental shelf westof M’Clure Strait but maintains its amplitude. The presenceof such an acidified layer exacerbates the vulnerability ofthe planktonic communities in this area, as, in addition tothe aragonite undersaturation found at the surface, �A dropsbelow one at depths of 100 to 125 m or even shallower inwaters in the Canada Basin. As CO2 naturally diffuses ormixes from the UHL to the overlying waters and the com-bination of gas exchange and freshening continues to gener-ate undersaturated conditions at the surface, the entire photiczone (where �A<1.5) may acidify and become undersatu-
rated with respect to aragonite at a much faster rate than thatof other oceans. The shallowest subsurface aragonite satu-ration horizon we observe in the central Canada Basin wasfound at ∼ 85 m in 2014. Our data do not corroborate theinterpretation of Wynn et al. (2016) that the upper bound-ary of the UHL is migrating downwards due to an expansionof the overlying Polar Mixed Layer (PML), at least not dur-ing the period of our observations. The �A crosses the sat-uration threshold back to supersaturation between 200 and250 m, where Atlantic waters become predominant, as evi-denced by a +0.8 ◦C temperature maximum at depths of 400to 500 m (in contrast to a temperature minimum of −1.5 ◦Cin the UHL).�A and pHT remain, respectively, above 1.3 and8.05 in this layer, with respective maxima of 1.74 (±0.16)and 8.17 (±0.03) found within the depth range of the tem-perature maximum mentioned previously. The profiles pre-sented in Fig. 7a, e, and i do not extend to the bottom of thebasin, but deep waters become undersaturated with respect toaragonite below ∼ 2100 m (data from 2009).
The Amundsen Gulf and the western portion of the ParryChannel (Fig. 7b, f, j) exhibit a similar water mass struc-ture and carbonate system chemistry as the Canada Basin, asthe dominant circulation pattern pushes water eastward fromthe CB to the CAA. Undersaturation with respect to arago-nite does not occur at the surface in these areas, owing tohigher salinities. Although the amplitudes of the �A, pHTand pCO2 excursions are slightly smaller than those foundin the CB, the UHL is considerably shallower in the west-ern CAA. Consequently, �A falls below 1 at depths of 50to 70 m, and the upper portion of the water column in thoseparts of the CAA might become undersaturated with respectto aragonite even more rapidly than in the CB. As reflectedby the blue lines in Fig. 7b, f and j, the UHL becomes pro-gressively less discernable on depth profiles as it undergoesmodification and mixing during its transit from the CB toLancaster Sound. Atlantic waters are found at the bottom ofthe water column in the Amundsen Gulf and Parry Channel.The saturation maxima at∼ 400 m (�A ∼ 1.1 to 1.4) are sig-nificantly lower in these areas than at similar depths in theCB.
The shallow bathymetry of the central CAA restricts theeastern flow originating from the CB to the layer of Pa-cific water (UHL) and the overlying surface water. �A isclose to 1 at the surface and reaches a maximum of ∼ 1.45(±0.16) at ∼ 30 m, before dipping back below 1 between 50and 75 m, like in other parts of the CAA. With the exceptionof one profile that exhibits a strong pCO2 maximum of 685(±6.49) µatm as well as pHT and�A minima of 7.80 (±0.03)and 0.76 (±0.16), respectively, at a depth 125 m, this UHLfeature becomes less prominent in the central CAA. Degra-dation of settling organic matter (remineralization) might ex-plain the greater amplitude of this peak than those observedin the Canada Basin at Station 310 in September 2016. Strat-ification becomes significantly weaker in the shallow waters(20–100 m) of the Queen Maud Gulf (Fig. 7c, g, k), despite
Biogeosciences, 17, 3923–3942, 2020 https://doi.org/10.5194/bg-17-3923-2020

A. Beaupré-Laperrière et al.: The recent state and variability of the carbonate system 3931
Figure 7. Depth profiles of pHT (left), pCO2 (middle) and �A (right) at representative stations of the Canada Basin (CB; top), Baffin Bay(BB; bottom) and the Canadian Arctic Archipelago (CAA). The latter is divided into four subregions (shown on Fig. 2): Parry Channel,Amundsen Gulf, Central Archipelago and Queen Maud Gulf (QMG).
https://doi.org/10.5194/bg-17-3923-2020 Biogeosciences, 17, 3923–3942, 2020

3932 A. Beaupré-Laperrière et al.: The recent state and variability of the carbonate system
freshwater addition theoretically strengthening stratification,as it is one of the areas with the strongest tidal mixing inthe CAA (McLaughlin et al., 2004). Practical salinity pro-files in this area do not show values exceeding 30 at the bot-tom of the water column, significantly lower than the valuesabove 32 observed at the same depths in the central CAA.The residence time of waters in this area might also be rel-atively high, due to its geographical isolation from the mainchannels of the CAA, possibly allowing more mixing to takeplace. The combined effects of low salinities from freshwateraccumulation (mostly from river discharge) and the efficientredistribution of CO2 through mixing result in low carbonatemineral saturation states throughout the water column. TheQMG is the only region in our study area where, at somelocations, the entire water column is undersaturated with re-spect to aragonite, making it an ideal location to study theeffects of such conditions on aragonitic organisms.
East of Barrow Strait, where a sill restricts the eastwardflow to the upper 125 m of the water column (Bidleman et al.,2007), the water mass regime changes. With the exceptionof one profile that captures the Pacific outflow through thewestern portion of Lancaster Sound at station 301 (Fig. 7d,h, l, blue line), this change is clearly visible in profiles ofcarbonate system parameters in Lancaster Sound and BaffinBay, where the upper 500 m of the water column is supersat-urated with respect to aragonite at each of the visited stations.Although surface waters in Northern Baffin Bay are a mix-ture of multiple inputs from the CAA and the Arctic Oceanthrough Nares Strait, the warm and saline Atlantic water in-flow from the Labrador Sea dominates the water mass struc-ture in the region and accounts for the high alkalinity of thesewaters relative to the CB and CAA (Münchow et al., 2015).In Baffin Bay, waters become undersaturated with respect toaragonite and calcite at depths of ∼ 600 and ∼ 1400 m, re-spectively. The pCO2 and pHT increase and decrease pro-portionally to each other with depth.
4.2 Time series
Of the 420 stations that make up our dataset, 24 were visitedin at least 2 different years and match our comparability cri-teria for time series. These criteria are (1) the stations weresampled within 31 calendar days of each other (this criterionis not ideal since seasonality is highly variable and drivenby complex sea ice processes, including ice break-up) and(2) the stations are located within a 5 km radius. The meantime difference and distance between comparable stations are12 calendar days and 1.81 km, respectively. Eight were vis-ited three times, the remainder were visited twice. With theexception of one site in northern Baffin Bay, all recurrentlysampled stations are located within or on the outskirts of theCAA. A total of 16 of the 24 time series span 3 years or less.Within all comparable stations, we identified the measure-ments made at similar depths in the top 100 m of the watercolumn (Fig. 8). The 2014–2015 and 2014–2016 intervals
Figure 8. Number of comparable data points in the top 100 m ofthe water column, obtained from measurements made at the samestation and within set depth intervals (of 3.5 m at the surface, in-creasing progressively to 15 m to a depth of 100 m), between eachyear of the dataset.
Figure 9. Location of the stations visited over an interval of 5 yearsor more. Stations are designated by area-related acronyms (LS isLancaster Sound, CAA is Canadian Arctic Archipelago, AM isAmundsen Gulf) that are not the station identifiers used during theexpeditions.
have the largest number of comparable data points (∼ 30),followed by the 2007–2009 and 2015–2016 intervals. Theremaining year combinations have less than 10 comparabledata points. The small data pool applicable to time seriesand the generally short and inconsistent time intervals be-tween comparable data points highlight the poor suitabilityof our dataset to the identification of temporal trends of oceanacidification. The strong interannual variability of carbonatesystem parameters in the CAA strengthens this conclusion.Nonetheless, we use data from the seven stations visited overa time interval of at least 5 years (Fig. 9) to identify sometrends in carbonate system parameters. The resulting depthprofiles are shown in Figs. 10 and 11.
Biogeosciences, 17, 3923–3942, 2020 https://doi.org/10.5194/bg-17-3923-2020

A. Beaupré-Laperrière et al.: The recent state and variability of the carbonate system 3933
Figure 10. Depth profiles of pCO2, pHT, DIC, DIC /TA and �A across time at one location in Lancaster Sound (LS1) and two locations inthe Canadian Arctic Archipelago (CAA1, CAA2).
To quantify near-surface change, we averaged data fromthe top 25 m of the water column. Across this depth in-terval, between 2007 and 2016, the temperature-normalizedpCO2, DIC and DIC /TA at site LS1 rose by 36± 9 µatm,37±10 µmol kg−1 and 0.008±0.005, while pHT and�A de-creased by 0.042±0.037 and 0.12±0.23, respectively. Givenits uncertainty, the change in �A is insignificant. The sametrend is visible between the same years at station CAA1,at a greater magnitude (+78 µatm pCO2, −0.088 pHT unit,−0.37 �A unit), except for a DIC decrease of 58 µmol kg−1
caused by a decrease in salinity of 1.76. The DIC /TA, whicheffectively normalizes DIC against salinity, shows an in-crease of 0.021, proportional to the change in the other pa-rameters. Data from the nearby station CAA2 also displaysa similar trend between 2009 and 2015 (+29 µatm pCO2,−0.041 pHT unit, +0.001 DIC /TA), albeit a strong posi-tive change in salinity (+1.81) contributed to an increaseof 0.06�A unit (again insignificant given its uncertainty of0.23).
Four stations located on the transect extending from CapeBathurst to Banks Island complete the seven time series(Fig. 11). Three of these time series (AM1, AM2, AM4) span2003–2009 or 2004–2009. Thus, given their spatial and tem-poral proximity, we expect a certain consistency in the trendsthey exhibit. Surprisingly, salinity increased at each of the
stations over the study period, by 1.46, 0.70 and 0.13, respec-tively. Despite the consistent salinity trend, stations AM2 andAM4 show opposite trends in carbonate system parameters,the former exhibiting a positive change in pCO2 (+49±9 µatm) and DIC /TA (+0.010±0.005) and a negative changein pHT (−0.089± 0.037) and �A (−0.20± 0.23), while thelatter displays negative but somewhat smaller changes inpCO2 (−35± 9 µatm) and DIC /TA (−0.007± 0.005) and apositive change in pHT (+0.051± 0.037) and �A (+0.13±0.23), mostly apparent near the surface (<10 m). The twoprofiles recorded at site AM2 exhibit a clear difference instratification; a sharp peak in carbonate system parameters(associated with a temperature maximum) appears at∼ 25 min 2003, while the top 50 m were fairly uniform in terms ofpCO2, pHT and DIC /TA in 2009. The magnitude of changein the carbonate system parameters at stations AM1 (2004–2009) and AM3 (2009–2016) is below their respective uncer-tainties. A relatively large change of −1.90 in near-surfacesalinity is observable at station AM3. The depth profiles atsites AM1 and AM3 (Fig. 11), both of which include mea-surements from 3 separate years, highlight the non-linearityof change (i.e., the variation between the earliest and the in-termediate year evolves in the opposite direction of the varia-tion between the earliest and latest years). Although this ob-
https://doi.org/10.5194/bg-17-3923-2020 Biogeosciences, 17, 3923–3942, 2020

3934 A. Beaupré-Laperrière et al.: The recent state and variability of the carbonate system
Figure 11. Depth profiles of pCO2, pHT, DIC, DIC /TA and �A and uncertainties across time at four locations at the western limit of theAmundsen Gulf (AM1, 2, 3, 4).
servation is limited to two groups of profiles, it constitutes acaveat to conclusions drawn from only two points in time.
Below 25 m depth, variations in atmospheric conditionsand biological activity become decreasingly influential oncarbonate system parameters, relative to changes in watermass properties resulting from mixing. The largest change inour time series occurs at Station LS1, where pCO2, DIC, andDIC /TA increased by 265 µatm, 95 µmol kg−1, and 0.040and pHT and �A decreased by 0.140 and 0.38, respectively,over the 25–100 m depth interval, between 2007 and 2016.This drastic change reflects the varying proportions of Pa-cific Ocean and Atlantic Ocean waters that reach LancasterSound, the latter water mass intruding episodically into theCAA (Prinsenberg and Bennett, 1987). An increase in theabundance (or a change in the properties) of Pacific Oceanwater between 2007 and 2016 is likely the cause of this fea-ture, as a similar trend is visible at station CAA1, locatedeast of Barrow Strait, where the intrusion of Atlantic Oceanwater is halted by a 125 m sill. This is supported by the ab-sence of a strong increase in salinity in Lancaster Sound in2007, which could be interpreted as a pulse of intruding At-lantic Ocean water. This feature is reversed at station CAA2between 2009 and 2015, highlighting the interannual vari-ability in the properties of the UHL. Below this layer, water
properties are relatively uniform in time at stations CAA1,CAA2, LS1 and AM2, except for pCO2 variations on the or-der of 20 to 30 µatm. Station AM1 exhibits a strong change indeepwater (300 to 400 m) properties between 2004 and 2008,for which the mechanism is unclear, the latter year displayingconsiderably less acidic conditions (+0.25 pHT unit), whilesalinity and temperature profiles are nearly identical for the2 years, suggesting no change in water masses. Total alka-linity measurements at this depth range in 2008 are substan-tially higher than those made in 2004, for similar salinities,but neither of these datasets appear disputable.
As previously stated, these time series are snapshots intime and cannot be assumed to represent the continuous evo-lution of the carbonate chemistry in the Canadian Arctic.Nonetheless, even with a small sample size, we can confi-dently state that the temporal evolution of carbonate systemparameters in the region does not display a systematic trendon sub-decadal timescales. Moreover, most of the significantchanges that our time series exhibit are associated with varia-tions in the physical oceanography of the region (water massdistribution and circulation) or surface processes (melting ofsea ice). Given the well-documented rapid melting of the seaice cover in the region (e.g., Tivy et al., 2011), we did notexpect to observe increases in summer surface salinity over
Biogeosciences, 17, 3923–3942, 2020 https://doi.org/10.5194/bg-17-3923-2020

A. Beaupré-Laperrière et al.: The recent state and variability of the carbonate system 3935
Figure 12. Mean 1DICBio (top 25 m of the water column)at stations of the Amundsen Gulf (a) and Canadian ArcticArchipelago (b). The central dashed line (0) is the reference state,in relation to which1DICBio is expressed (i.e. the point at the rightextremity of a line indicates the 1DICBio relative to the year atwhich this line intersects the central dashed line). The grey-shadedarea represents the range of uncertainty.
time intervals of 5 to 9 years. Our time series, therefore, of-fer proof of the strong interannual variability of this highlydynamic system. Discerning the ocean acidification signalamid the various physical and biological sources of changewould require continuous time series over a longer periodof time. We estimated this period to be 23 to 35 years forpH, 25 to 37 years for pCO2, 31 to 46 for �A, and 118 to177 years for DIC using calculations of time of emergence, orthe time required for the effects of a process to emerge fromthe natural variability of a system (see Appendix A). Timeof emergence calculations are usually performed with large,continuous datasets from climate models; we therefore do notconsider these results to be statistically robust. Nonetheless,this exercise shows the relative variabilities of the carbon-ate system parameters and highlights the particularly strongvariability of DIC, which is the object of the next section. Itsresults also imply that without accurate measurements of theeffects of biological activity and sea ice processes (both ma-jor drivers of natural variability), direct detection of the oceanacidification signal will require at least 20–25 years of obser-
vations. Gathering data in the CAA in the next few years istherefore critical, as regular ship-based observational cam-paigns in the region started in the early 2000s (Giesbrecht etal., 2014).
4.3 The biological contribution to interannual DICvariations: 1DICBio
We define 1DICBio as the temporal change in the contribu-tion of in situ biological activity (photosynthesis and respira-tion) to the DIC of a parcel of water over a given period oftime.1DICBio is calculated for each sampled depth at recur-rently visited stations according to
1DICBio = DICObs− DICRef ,
where DICRef is computed in CO2SYS using thetemperature-normalized seawater pCO2 calculated at areference time, adjusted to the time of interest assuming aconstant air–sea pCO2 gradient, and the TA measured at thistime of interest. The change in global mean atmosphericCO2 concentrations between the reference year and theyear of interest is used to correct pCO2 to account for gasexchange (data from Dlugokencky and Tans, NOAA/ESRL,https://www.esrl.noaa.gov/gmd/ccgg/trends/, last access:28 March 2019). This approximation rests on the assumptionthat the yearly increase in surface water pCO2 follows thatof the atmosphere (given stable biological production), asobservations from global monitoring stations demonstrate(e.g., González-Dávila et al., 2010), although the validityof this claim is weakened on short spatial and temporal(sub-decadal) scales (Fay et al., 2013; Wanninkhof et al.,2013). This also restricts our calculations to the upperportion of the water column (25 m) that is in direct contactwith the atmosphere. Under the additional assumptions thatDIC is only affected by gas exchange, biological activity,and mixing and that TA is not significantly affected bybiological activity (Zeebe and Wolf-Gladrow, 2001), DICRefrepresents the DIC of a parcel of water if its in situ biologicalcomponent remained unchanged relative to a reference year(i.e., identical contribution, negative or positive, from thebalance between photosynthesis and respiration). Becausethe reference pCO2 is calculated in part from TA, changesin water masses should not affect the results of this analysis,given the salinity range of the data subset used in thecalculation of 1DICBio (25.6<SP<33.7). Thus, 1DICBiocan provide insights into the interannual variability ofbiological activity in the Canadian Arctic, without directmeasurements of parameters such as chlorophyll or biomass.The uncertainty in 1DICBio was calculated by applyingstandard error propagation to the procedure described above.It is important to note that this calculated uncertainty ispurely mathematical and does not include the uncertaintyassociated with the assumptions made to calculate 1DICBio,such as the constancy of the air–sea 1pCO2, which could
https://doi.org/10.5194/bg-17-3923-2020 Biogeosciences, 17, 3923–3942, 2020

3936 A. Beaupré-Laperrière et al.: The recent state and variability of the carbonate system
be considerably affected by processes like changes in sea icecover.
Figure 12 shows 1DICBio, averaged over the top 25 mof the water column, at the 18 stations where compara-ble data were available, all located in the Amundsen Gulfand CAA. The magnitude of the calculated 1DICBio is be-yond its mathematical uncertainty, which varies from 6.4 to14.3 µmol kg−1 (mean of ±8.6 µmol kg−1) at 11 locationsout of 18. All significant results from the month of Oc-tober (2003–2009 and 2007–2009) in the Amundsen Gulfshow a positive mean 1DICBio (a decrease in biologicalDIC uptake and/or an increase in DIC production) of up to20.6± 10.5 µmol kg−1. Conversely, the 1DICBio calculatedfor the month of August (2004–2009, 2009–2016 and 2014–2015) is generally negative and of a similar magnitude. Datafor September are variable in direction and show the great-est change over consecutive years: relative to 2014, in theAmundsen Gulf, the mean 1DICBio fluctuated in 2015 and2016 by +28.0±11.0 to −11.2±8.0 µmol kg−1 over the 0–25 m depth interval.
It is unlikely that the consistent directions of change weobserve for the months of August and October represent ac-tual trends, given the small data pool and inconsistent ref-erence states used to make those observations. Nevertheless,we can use this analysis to constrain the contribution of fluc-tuations in biological activity to the interannual variability ofthe DIC. In the top 25 m of the water column, the maximumamplitude of1DICBio is 45.9±11.5 µmol kg−1, observed inthe Amundsen Gulf between 2014 and 2015. This maximumis not visible on Fig. 12, which only shows mean values.The Pearson correlation coefficient (r) between1DICBio and1DIC (the change in DIC over the same time interval) is 0.52and the associated coefficient of determination (R2) is 0.27,suggesting that 27 % of the interannual variability in surfaceDIC in the Canadian Arctic Archipelago is a direct result ofthe variability in biological activity. This has important im-plications with respect to the interpretation of DIC time se-ries in the region and explains, in part, the long time of emer-gence of DIC as a proxy for acidification, compared to othercarbonate system parameters, as hypothesized in Sect. 4.2.
The extremely weak (r = 0.08) correlation between1DICBio and the time interval over which it applies pro-vides additional evidence of the absence of a trend in thebalance between photosynthesis and respiration in the sur-face waters of the Canadian Arctic. The variability in thisbalance is driven by many interconnected, often localizedprocesses. For instance, short-lived episodes of upwelling ofhalocline waters not only directly change the chemical prop-erties at the surface but also provide nutrients that stimulatebiological activity (Tremblay et al., 2011). Primary produc-tion in the Arctic is also closely linked to the seasonal cycleof sea ice (e.g., Arrigo et al., 2008). Beyond its natural fluc-tuations, ongoing disruptions to this cycle and other physicalproperties (stratification, temperature, etc.) forced by climatechange are known to affect phytoplankton communities and
their productivity (Ardyna et al., 2014; Blais et al., 2017),possibly increasing their imprint on the variability of DICand other carbonate system parameters. As previously men-tioned, variations in water mass composition cannot directlyexplain variations in 1DICBio. Nonetheless, mixing is likelyaccompanied by changing nutrient concentrations, which in-fluence the balance of photosynthesis and respiration (Trem-blay et al., 2015).
5 Conclusions
Field observations of carbonate system parameters made be-tween 2014 and 2016 in the Canadian Arctic reveal that sur-face waters of the region serve as a net CO2 sink in thesummer and are generally close to saturation with respect toaragonite (1<�A<1.5). Surface undersaturation (�A<1.0)is found predominantly in the central Canada Basin, as doc-umented in previous years (Yamamoto-Kawai et al., 2011;Robbins et al., 2013), and in the freshwater-influenced QueenMaud Gulf, the only area of the Canadian Arctic where, insome locations, the entire water column is undersaturatedwith respect to aragonite. The CO2-rich Upper HaloclineLayer is the locus of a shallow aragonite undersaturationhorizon at depths of 85 to 125 m in the Canada Basin and 50to 70 m in the Canadian Arctic Archipelago, further fosteringundersaturation near the surface and potentially threateningmarine calcifying organisms living in this portion of the wa-ter column.
Time series of carbonate system parameters, although rel-atively short (<10 years) and incomplete, illustrate the stronginterannual variability of the region, due in part to complexcirculation patterns and varied water mass assemblages. Ourestimates of 1DICBIO, the change in the contribution of bi-ological activity to DIC, suggest that variations in biologi-cal activity (the balance between photosynthesis and respi-ration) account for approximately a third of the interannualvariability of DIC measurements. Additional work must alsobe carried out to extend this estimate to other carbonate sys-tem parameters (pH, pCO2, �). In order to test the validityof the1DICBIO concept and its underlying assumptions, ourresults should be compared to direct measurements of biolog-ical productivity (e.g., biomass, chlorophyll a) made duringthe same time period. Without the latter, the quantification ofthe progression of ocean acidification in the surface waters ofthe Canadian Arctic will require longer and more continuoustime series, the length of which can be estimated using theconcept of time of emergence. Future work on ocean acidi-fication in this region should focus on obtaining continuoustime series of carbonate system parameters, especially in ar-eas where surface waters might soon become undersaturatedwith respect to aragonite, as well as bridging the gap betweenobservations of carbonate mineral saturation and markers ofecosystem health.
Biogeosciences, 17, 3923–3942, 2020 https://doi.org/10.5194/bg-17-3923-2020

A. Beaupré-Laperrière et al.: The recent state and variability of the carbonate system 3937
Appendix A: Time of emergence of ocean acidificationsignals
The time of emergence (ToE) of a process affecting a nat-ural system is the time required for the measurable effectsof this process to emerge from the natural variability of thesystem. The concept is predominantly applied in global cli-mate change modelling studies, for which the results are ei-ther “years of emergence” based on a pre-industrial steadystate (e.g., Friedrich et al., 2012) or time intervals over whichobservations must be made in order to distinguish an anthro-pogenic signal from its natural variability. Few of these stud-ies have used observations (e.g., Sutton et al., 2016), and, toour knowledge, none of them have focused specifically onthe Arctic.
We define the time of emergence according to the follow-ing equation:
ToE=C×N
S, (A1)
in which N is the natural variability, defined (followingHawkins and Sutton, 2012) as the standard deviation of theannual means of one of four parameters (DIC, T -normalizedpCO2, �A, pHT), across 7 years from 2003 to 2016. S is theslope (in units per year) of the theoretical acidification curve,constructed by calculating the evolution of a given param-eter in CO2SYS at a constant alkalinity (2000 µmol kg−1),practical salinity (30), and temperature (0 ◦C) and assum-ing that the surface ocean pCO2 increases at the same meanrate as the atmospheric pCO2 between 2003 and 2016 (datafrom Dlugokencky and Tans, NOAA/ESRL, https://www.esrl.noaa.gov/gmd/ccgg/trends/, last access: 28 March 2019).Our computed rates of acidification (Table A1) are in generalagreement with the values reported by Bates et al. (2014). Cis a constant that sets the threshold of emergence at either 2 or3 standard deviations (N ), i.e., when the acidification signalbecomes significant beyond natural variability as it emergesfrom 95 % or 99.7 % of the observed annual mean values, as-suming the data (or the naturally occurring values of the pa-rameter they represent) are normally distributed. Only datacollected from June to October (inclusively) are used to min-imize the effect of seasonal variability.
Although the assumption of relative equilibration with at-mospheric pCO2 might be less applicable at these depths, weapplied the same technique using data from depths of 100 and300 m in order to estimate the time of emergence below thesurface, where the interannual variability should be smallerthan at the surface, if no important changes in water massesoccur. Significant acidification at these depths might be duein large part to advection (e.g., Luo et al., 2016) rather thangas exchange.
The results of this analysis are presented in Table A2. Atthe surface, pHT and pCO2 have very similar times of emer-gence of 23–35 years and 25–37 years for C values of 2 and3, respectively. The�A signal emerges after a slightly longer
Table A1. Values of natural variability (N ; the standard deviationof the annual means of each parameter) and theoretical acidificationrate (S; the slope of the theoretical acidification curve) used in thetime of emergence calculations.
Parameter N S
pH (i-s) 0.025 −0.002 yr−1
pCO2 26.65 µatm 2.17 µatm yr−1
�A 0.07 −0.004 yr−1
DIC 36.37 µmol kg−1 0.61 µmol kg−1 yr−1
Table A2. Calculated times of emergence of carbonate system pa-rameters at various depths, rounded to the closest year. The C valuerepresents the threshold used (2 or 3 standard deviations of annualmeans).
Time of emergence (years)
Parameter 0–15 m 90–110 m 290–310 m
pH (i-s) C = 2 23 26 21C = 3 35 40 31
pCO2 C = 2 25 36 20C = 3 37 55 29
�A C = 2 31 31 20C = 3 46 46 29
DIC C = 2 118 156 138C = 3 177 234 207
time, 31–46 years. The ToE of DIC is considerably longerthan that of the three other parameters, at 118–177 years. Thediscrepancy between DIC and the other parameters is largelydue to chemical considerations, as the high Revelle factors(15–20) in the region imply that the change in pCO2 causedby the uptake of atmospheric CO2 will be 15 to 20 timeslarger than that of DIC, relative to their initial concentrations.
Our results show a slight increase of ToE values from thesurface to the 90–110 m depth interval (except for�A that re-mains identical), followed by a decrease below surface val-ues at the 290–310 m depth interval (except for DIC). Weattribute the relatively strong variability of the ToE in the90–110 m depth interval to a periodical vertical migrationof the upper boundary of the metabolic CO2-rich (low pHT,�A, high pCO2, DIC) Upper Halocline Layer (UHL) thatis found at depths of ∼ 100–200 m throughout most of thestudy area. The results are also likely affected by the decreas-ing number of data with depth (Table A3), which could leadto less accurate annual means and explain the increase of theDIC ToE from the surface to the 290–310 m interval.
Despite their similarity, our calculated times of emergenceare consistently longer than those reported in modelling stud-ies (Keller et al., 2014; Rodgers et al., 2015). This is consis-tent with the fact that coastal waters, that comprise a large
https://doi.org/10.5194/bg-17-3923-2020 Biogeosciences, 17, 3923–3942, 2020

3938 A. Beaupré-Laperrière et al.: The recent state and variability of the carbonate system
Table A3. Number of data points included in the annual means usedin the time of emergence calculations.
Data count
Year 0–15 m 90–110 m 290–310 m
2003 166 30 152004 207 47 222007 65 24 102008 146 66 312009 103 17 102014 63 20 162015 24 10 5
portion of our dataset, exhibit a much higher variability in pH(and other carbonate system parameters) than open oceans(Duarte et al., 2013). Furthermore, direct observations arelikely to integrate variability on temporal and spatial scalesthat are too small to be resolved by models. It is also impor-tant to note that distinct measurement techniques and theirassociated uncertainties create an analytical bias between dif-ferent parameters, a bias that is not present in the same formin modelling studies. The relative uncertainties of in situ pHT(0.3 %) measurements and computed pCO2 (4.5 %) and �A(6.4 %) values are strongly correlated with their increasingtimes of emergence in the 0–25 m depth interval (r = 0.88).Although this correlation becomes significantly weaker (r =0.49) when DIC and its relative uncertainty (0.4 %) are in-cluded in the analysis, it suggests the presence of an ana-lytical bias in our ToE estimates. Nonetheless, the similaritybetween the ToE of pHT and pCO2 and the large ToE of DICare consistent with the findings of Keller et al. (2014).
The validity of these conclusions depends on a methodol-ogy that differs considerably from its modelling equivalent,even if the results from both approaches are consistent witheach other. In addition to the instrumental bias mentionedpreviously, our observations are subject to a sampling bias,since we only use data gathered in the summer months. Con-sequently, the natural variability used in our ToE calculationsdoes not encompass the entire annual cycle. Nevertheless,because we define the natural variability of the system interms of interannual rather than seasonal changes, the formershould not change, assuming the amplitude of the seasonalcycle is constant through time. The other form of samplingbias possibly affecting our results is spatial, as cruise tracksand durations varied every summer.
Appendix B: Estimation of the freshwater sources in theQueen Maud Gulf
In order to estimate the relative fractions of sea ice melt andmeteoric water (mostly river water) in the Queen Maud Gulf,we use δ18O and practical salinity (SP) data collected in thearea in 2015 to perform a linear regression analysis. Themethods of analysis of the oxygen isotopes, reported on theδ18O notation (V -SMOW), are described in detail in Lansardet al. (2012) for the samples collected during the CASES ex-pedition (2003–2004) and in Mucci et al. (2018) for the re-mainder of the samples.
Using the intercept of the trend line equation(δ18O= 0.5282SP–18.552) to extrapolate δ18O to SP = 0,we find the mean δ18O of the freshwater found in theQueen Maud Gulf in 2015 to be −18.55 ‰. Based on theδ18O values of meteoric water (−18.9± 0.1 ‰) and seaice melt (−2.0± 0.5 ‰) used by Lansard et al. (2012), thefractions of meteoric (river) water and sea ice melt wouldbe, respectively, 98 % and 2 %. A potential source of erroraffecting this estimate is the use of the δ18O of MackenzieRiver water as the riverine endmember, which might differsignificantly from the oxygen isotope signature of the riversdischarging in the Queen Maud Gulf.
Biogeosciences, 17, 3923–3942, 2020 https://doi.org/10.5194/bg-17-3923-2020

A. Beaupré-Laperrière et al.: The recent state and variability of the carbonate system 3939
Data availability. The raw data collected as a part of the Arctic-Net program, on which most of the observations presented in thispaper are based, can be accessed through the Polar Data Catalogue(Mucci, 2017). Complementary datasets, some of which are part oflarger databases, are also available on various online repositories(François et al., 2012; Chierici et al., 2013; Giesbrecht et al., 2014;Papakyriakou et al., 2017).
Author contributions. AM and ABL conceived the project. AM andHT acquired much of the data prior to 2016. ABL carried out thedata analysis and wrote the first draft of the paper, whereas AM andHT provided editorial and scientific recommendations. HT providedresults of alkalinity and dissolved inorganic carbon analyses andscientific recommendations.
Competing interests. The authors declare that they have no conflictof interest.
Acknowledgements. We would like to thank the captains and crewof the CCGS Amundsen without whom, over the years, this projectwould not have been possible. This project was funded through Arc-ticNet, itself funded by the Natural Sciences and Engineering Re-search Council of Canada (NSERC), the Canadian Foundation forInnovation (CFI), and the IPY-NSERC, CCAR-NSERC, and FrenchMALINA programs. Additional funding came from a Regroupe-ment Stratégique grant from the Fonds Québécois de RechercheNature et Technologies (FQRNT) to GEOTOP, as well as NSERCDiscovery and Marine Environmental Observation, Prediction andResponse Network (MEOPAR; Canadian Ocean Acidification Re-search partnership) grants to Alfonso Mucci and Helmuth Thomas.We would like to thank Jean-François Hélie at GEOTOP-UQAMfor carrying out the δ18O(H2O) analyses, as well as Constance Guig-nard for cruise preparation and support in the laboratory and at sea.Finally, Alexis Beaupré-Laperrière wishes to thank MEOPAR andthe Department of Earth and Planetary Sciences at McGill for finan-cial support in the form of stipends, scholarships (e.g., MountjoyScholarship) and assistantships. Figure 1 in this study was createdwith the Ocean Data View Software (Schlitzer, 2016).
Financial support. This research has been supported by the Net-work of Centers of Excellence-Tri-Council (grant no. 3.8 Arctic-Net/Manitoba), NSERC Discovery grants (grant no. RGPIN/39679-2013), and the NSERC-MEOPAR (Marine Environmental Observa-tion, Prediction and Response Network) (project no. 13: CanadianOcean Acidification Research Partnership).
Review statement. This paper was edited by Jean-Pierre Gattusoand reviewed by Leif Anderson and one anonymous referee.
References
Ahmed, M., Else, B. G. T., Burgers, T. M., and Papakyriakou,T.: Variability of surface water pCO2 in the Canadian ArcticArchipelago from 2010 to 2016, J. Geophys. Res.-Ocean., 124,1876–1896, doi:10.1029/2018JC014639, 2019.
Ardyna, M., Babin, M., Gosselin, M., Devred, E., Rainville, L., andTremblay, J.: Recent Arctic Ocean sea ice loss triggers novelfall phytoplankton blooms, Geophys. Res. Lett., 41, 6207–6212,doi:10.1002/2014GL061047, 2014.
Arrigo, K. R., van Dijken, G., and Pabi, S.: Impact of a shrinkingArctic ice cover on marine primary production, Geophys. Res.Lett., 35, L19603, doi:10.1029/2008GL035028, 2008.
Azetsu-Scott, K., A. Clarke, K. Falkner, J. Hamilton, E. P. Jones,C. Lee, B. Petrie, S. Prinsenberg, M. Starr, and P. Yeats, Cal-cium carbonate saturation states in the waters of the CanadianArctic Archipelago and the Labrador Sea, J. Geophys. Res., 115,C11021, doi:10.1029/2009JC005917, 2010.
Bates, N. R., Mathis, J. T., and Cooper, L. W.: Ocean acidificationand biologically induced seasonality of carbonate mineral satura-tion states in the western Arctic Ocean, J. Geophys. Res.-Ocean.,114, C11007, doi:10.1029/2008JC004862, 2009.
Bates, N. R., Astor, Y. M., Church, M. J., Currie, K., Dore, J. E.,Gonzalez-Davila, M., Lorenzoni, L., Muller-Karger, F., Olafs-son, J., and Santana-Casiano, J. M.: A time-series view of chang-ing surface ocean chemistry due to ocean uptake of anthro-pogenic CO2 and ocean acidification, Oceanography, 27, 126–141, doi:10.5670/oceanog.2014.16, 2014.
Bidleman, T. F., Kylin, H., Jantunen, L. M., Helm, P. A., andMacDonald, R. W.: Hexachlorocyclohexanes in the Canadianarchipelago, 1. Spatial distribution and pathways of α-, β- and γ -HCHs in surface water, Environ. Sci. Technol., 41, 2688–2695,2007.
Blais, M., Ardyna, M., Gosselin, M., Dumont, D., Belanger, S.,Tremblay, J., Gratton, Y., Marchese, C., and Poulin, M.: Con-trasting interannual changes in phytoplankton productivity andcommunity structure in the coastal Canadian Arctic Ocean, Lim-nol. Oceanogr., 62, 2480–2497, doi:10.1002/lno.10581, 2017.
Bopp, L., Resplandy, L., Orr, J. C., Doney, S. C., Dunne, J. P.,Gehlen, M., Halloran, P., Heinze, C., Ilyina, T., Séférian, R.,Tjiputra, J., and Vichi, M.: Multiple stressors of ocean ecosys-tems in the 21st century: projections with CMIP5 models,Biogeosciences, 10, 6225–6245, https://doi.org/10.5194/bg-10-6225-2013, 2013.
Bourke, R., Addison, V., and Paquette, R.: Oceanography of NaresStrait and Northern Baffin-Bay in 1986 with emphasis on deepand bottom water formation, J. Geophys. Res.-Ocean., 94, 8289–8302, doi:10.1029/JC094iC06p08289, 1989.
Carmack, E. C. and MacDonald, R.: Oceanography of the Canadianshelf of the Beaufort Sea: A setting for marine life, Arctic, 55,29–45, 2002.
Carmack, E. C., Macdonald, R., and Papadakis, J.: Water massstructure and boundaries in the Mackenzie Shelf estuary, J. Geo-phys. Res.-Ocean., 94, 18043–18055, 1989.
Chierici, M. and Fransson, A.: Calcium carbonate saturation inthe surface water of the Arctic Ocean: undersaturation infreshwater influenced shelves, Biogeosciences, 6, 2421–2431,https://doi.org/10.5194/bg-6-2421-2009, 2009.
Chierici, M. and Thomas, H.: CO2 system data during the Cir-cumpolar Flaw Lead, Polar Data Catalogue, available at: https://
https://doi.org/10.5194/bg-17-3923-2020 Biogeosciences, 17, 3923–3942, 2020

3940 A. Beaupré-Laperrière et al.: The recent state and variability of the carbonate system
www.polardata.ca/pdcsearch/PDCSearchDOI.jsp?doi_id=10900(last access: 28 July 2020), 2013.
Clayton, T. and Byrne, R.: Spectrophotometric seawater pH mea-surements - total hydrogen-ion concentration scale calibrationof M-Cresol Purple and at-sea results, Deep-Sea Res. Pt. I., 40,2115–2129, doi:10.1016/0967-0637(93)90048-8, 1993.
Déry, S. J., Stadnyk, T. A., MacDonald, M. K., and Gauli-Sharma, B.: Recent trends and variability in river dischargeacross northern Canada, Hydrol. Earth Syst. Sci., 20, 4801–4818,https://doi.org/10.5194/hess-20-4801-2016, 2016.
Dickson, A. G.: Standard potential of the reaction –AgCl(s)+1/2H2(g)=Ag(s)+HCl(aq) and the standardacidity constant of the ion HSO−4 in synthetic sea-water from273.15K to 318.15K, J. Chem. Thermodyn., 22, 113–127,doi:10.1016/0021-9614(90)90074-Z, 1990.
Dickson, A. G. and Millero, F.: A comparison of the equilibrium-constants for the dissociation of carbonic-acid in seawa-ter media, Deep-Sea Res., 34, 1733–1743, doi:10.1016/0198-0149(87)90021-5, 1987.
Dickson, A. G., Sabine, C. L., and Christian, J. R.: Guide to bestpractices for ocean CO2 measurements, PICES Special Publica-tions, Sidney, BC, Canada, 191 pp., 2007.
Dlugokencky, E. and Tans, P.: Trends in atmospheric carbon diox-ide, National Oceanic & Atmospheric Administration, Earth Sys-tem Research Laboratory (NOAA/ESRL), available at: http://www.esrl.noaa.gov/gmd/ccgg/trends/global.html, last access: 28March 2019.
Duarte, C. M., Hendriks, I. E., Moore, T. S., Olsen, Y. S., Steck-bauer, A., Ramajo, L., Carstensen, J., Trotter, J. A., and McCul-loch, M.: Is ocean acidification an open-ocean syndrome? Under-standing anthropogenic impacts on seawater pH, Estuar. Coast.,36, 221–236, doi:10.1007/s12237-013-9594-3, 2013.
Fay, A. R. and McKinley, G. A.: Global trends in surface oceanpCO2 from in situ data, Global Biogeochem. Cy., 27, 541–557,doi:10.1002/gbc.20051, 2013.
François, R., Mucci, A., Holmden, C., Varela D., Cullen, J., Ori-ans, K., Maldonado, M., Tortell, P., Rivkin, R., Kienast, M.,Thomas, H., Hale, M., Miller, L., Smith, J.N., Sigman, D.,Brzezinski, M., Weis, D., Fones, G., Saito, M., Allen, A., andWilliamson, S.: GEOTRACES: Multi-tracer investigation of theeffect of climate change on nutrient and carbon cycles in the Arc-tic Ocean, Canadian Cryospheric Information Network (CCIN),doi:10.5443/11458, 2012.
Friedrich, T., Timmermann, A., Abe-Ouchi, A., Bates, N. R.,Chikamoto, M. O., Church, M. J., Dore, J. E., Gledhill, D.K., Gonzalez-Davila, M., Heinemann, M., Ilyina, T., Jung-claus, J. H., McLeod, E., Mouchet, A., and Santana-Casiano, J.M.: Detecting regional anthropogenic trends in ocean acidifica-tion against natural variability, Nat. Clim. Change, 2, 167–171,doi:10.1038/NCLIMATE1372, 2012.
Geilfus, N. X., Pind, M. L., Else, B. G. T., Galley, R. J., Miller,L. A., Thomas, H., Gosselin, M., Rysgaard, S., Wang, F., andPapakyriakou, T. N.: Spatial and temporal variability of seawaterpCO2 within the Canadian Arctic Archipelago and Baffin Bayduring the summer and autumn 2011, Cont. Shelf Res., 156, 1–10, doi:10.1016/j.csr.2018.01.006, 2018.
Giesbrecht, K. E., Miller, L. A., Davelaar, M., Zimmermann, S.,Carmack, E., Johnson, W. K., Macdonald, R. W., McLaughlin,F., Mucci, A., Williams, W. J., Wong, C. S., and Yamamoto-
Kawai, M.: Measurements of the dissolved inorganic carbonsystem and associated biogeochemical parameters in the Cana-dian Arctic, 1974–2009, Earth Syst. Sci. Data, 6, 91–104,https://doi.org/10.5194/essd-6-91-2014, 2014.
González-Dávila, M., Santana-Casiano, J. M., Rueda, M. J., andLlinás, O.: The water column distribution of carbonate systemvariables at the ESTOC site from 1995 to 2004, Biogeosciences,7, 3067–3081, https://doi.org/10.5194/bg-7-3067-2010, 2010.
Hawkins, E. and Sutton, R.: Time of emergence of climate signals,Geophys. Res. Lett., 39, L01702, doi:10.1029/2011GL050087,2012.
Jiang, L., Cai, W., and Wang, Y.: A comparative study of carbondioxide degassing in river- and marine-dominated estuaries, Lim-nol. Oceanogr., 53, 2603–2615, doi:10.4319/lo.2008.53.6.2603,2008.
Johnson, K., Wills, K., Butler, D., Johnson, W., and Wong, C.:Coulometric total carbon-dioxide analysis for marine studies –maximizing the performance of an automated gas extractionsystem and coulometric detector, Mar. Chem., 44, 167–187,doi:10.1016/0304-4203(93)90201-X, 1993.
Jones, E., Anderson, L., and Swift, J.: Distribution of At-lantic and Pacific waters in the upper Arctic Ocean: Im-plications for circulation, Geophys. Res. Lett., 25, 765–768,doi:10.1029/98GL00464, 1998.
Jones, E., Swift, J., Anderson, L., Lipizer, M., Civitarese, G.,Falkner, K., Kattner, G., and McLaughlin, F.: Tracing Pacific wa-ter in the North Atlantic Ocean, J. Geophys. Res.-Ocean., 108,3116, doi:10.1029/2001JC001141, 2003.
Keller, K. M., Joos, F., and Raible, C. C.: Time of emergenceof trends in ocean biogeochemistry, Biogeosciences, 11, 3647–3659, https://doi.org/10.5194/bg-11-3647-2014, 2014.
Lansard, B., Mucci, A., Miller, L. A., Macdonald, R. W.,and Gratton, Y.: Seasonal variability of water mass distri-bution in the southeastern Beaufort Sea determined by to-tal alkalinity and delta O-18, J. Geophys. Res., 117, C03003,https://doi.org/10.1029/2011JC007299, 2012.
Le Quéré, C., Andrew, R. M., Friedlingstein, P., Sitch, S., Pongratz,J., Manning, A. C., Korsbakken, J. I., Peters, G. P., Canadell,J. G., Jackson, R. B., Boden, T. A., Tans, P. P., Andrews, O.D., Arora, V. K., Bakker, D. C. E., Barbero, L., Becker, M.,Betts, R. A., Bopp, L., Chevallier, F., Chini, L. P., Ciais, P.,Cosca, C. E., Cross, J., Currie, K., Gasser, T., Harris, I., Hauck,J., Haverd, V., Houghton, R. A., Hunt, C. W., Hurtt, G., Ily-ina, T., Jain, A. K., Kato, E., Kautz, M., Keeling, R. F., KleinGoldewijk, K., Körtzinger, A., Landschützer, P., Lefèvre, N.,Lenton, A., Lienert, S., Lima, I., Lombardozzi, D., Metzl, N.,Millero, F., Monteiro, P. M. S., Munro, D. R., Nabel, J. E. M.S., Nakaoka, S., Nojiri, Y., Padin, X. A., Peregon, A., Pfeil, B.,Pierrot, D., Poulter, B., Rehder, G., Reimer, J., Rödenbeck, C.,Schwinger, J., Séférian, R., Skjelvan, I., Stocker, B. D., Tian, H.,Tilbrook, B., Tubiello, F. N., van der Laan-Luijkx, I. T., van derWerf, G. R., van Heuven, S., Viovy, N., Vuichard, N., Walker,A. P., Watson, A. J., Wiltshire, A. J., Zaehle, S., and Zhu, D.:Global Carbon Budget 2017, Earth Syst. Sci. Data, 10, 405–448,https://doi.org/10.5194/essd-10-405-2018, 2018.
Lewis, E. and Wallace, D. W. R.: Program developed for CO2 sys-tem calculations, Carbon Dioxide Information Analysis Center,Oak Ridge National Laboratory, US Department of Energy, OakRidge, Tennessee, 1998.
Biogeosciences, 17, 3923–3942, 2020 https://doi.org/10.5194/bg-17-3923-2020

A. Beaupré-Laperrière et al.: The recent state and variability of the carbonate system 3941
Luo, Y., Boudreau, B. P., and Mucci, A.: Disparate acidifica-tion and calcium carbonate desaturation of deep and shal-low waters of the Arctic Ocean, Nat. Commun., 7, 12821,doi:10.1038/ncomms12821, 2016.
Macdonald, R. W., Carmack, E., McLaughlin, F., Iseki, K., andMacdonald, D.: Composition and modification of water massesin the Mackenzie Shelf estuary, J. Geophys. Res.-Ocean., 94,18057–18070, 1989.
Macdonald, R. and Yu, Y.: The Mackenzie estuary of the ArcticOcean, in: The Handbook of Environmental Chemistry, vol. 5H,Springer, Berlin/Heidelberg, 91–120, 2006.
McLaughlin, F. A., Carmack, E. C., Ingram, R. G., Williams, W. J.,and Michel, C.: Oceanography of the Northwest Passage, in: TheSea, Vol. 14, Wiley, New York, 1121–1242, 2004.
Mehrbach, C., Culberson, C. H., Hawley, J. E., and Pytkow-icz, R. M.: Measurement of the apparent dissociation constantsof carbonic acid in seawater at atmospheric pressure, Limnol.Oceanogr. 18, 897–907, 1973.
Melling, H., Gratton, Y., and Ingram, G.: Ocean circulation withinthe North Water Polynya of Baffin Bay, Atmos. Ocean, 39, 301–325, doi:10.1080/07055900.2001.9649683, 2001.
Miller, L. A., Papakyriakou, T. N., Collins, R. E., Deming, J. W.,Ehn, J. K., Macdonald, R. W., Mucci, A., Owens, O., Raud-sepp, M., and Sutherland, N.: Carbon dynamics in sea ice: Awinter flux time series, J. Geophys. Res.-Ocean., 116, C02028,doi:10.1029/2009JC006058, 2011.
Millero, F. J.: Chemical Oceanography, 3rd Edn., CRC Press, BocaRaton, Florida, 2005.
Mostofa, K. M. G., Liu, C.-Q., Zhai, W., Minella, M., Vione, D.,Gao, K., Minakata, D., Arakaki, T., Yoshioka, T., Hayakawa, K.,Konohira, E., Tanoue, E., Akhand, A., Chanda, A., Wang, B., andSakugawa, H.: Reviews and Syntheses: Ocean acidification andits potential impacts on marine ecosystems, Biogeosciences, 13,1767–1786, https://doi.org/10.5194/bg-13-1767-2016, 2016.
Mucci, A.: The Solubility of calcite and aragonite in seawater at var-ious salinities, temperatures, and one atmosphere total pressure,Am. J. Sci., 283, 780–799, doi:10.2475/ajs.283.7.780, 1983.
Mucci, A., Lansard, B., Miller, L. A., and Papakyriakou, T. N.:CO2 fluxes across the air-sea interface in the southeastern Beau-fort Sea: Ice-free period, J. Geophys. Res.-Ocean., 115, C04003,doi:10.1029/2009JC005330, 2010.
Mucci, A.: Long-term Monitoring of pH, total alkalinity, the sta-ble oxygen isotopic composition of water and the stable car-bon isotopic composition of dissolved inorganic carbon in theCanadian Arctic, Canadian Cryospheric Information Network(CCIN), doi:10.5884/12733, 2017.
Mucci, A., Levasseur, M., Gratton, Y., Martias, C., Scarratt, M.,Gilbert, D., Tremblay, J., Ferreyra, G., and Lansard, B.: Tidallyinduced variations of pH at the head of the Laurentian Chan-nel, Can. J. Fish. Aquat. Sci., 75, 1128–1141, doi:10.1139/cjfas-2017-0007, 2018.
Muench, R. D.: The physical oceanography of the northern BaffinBay Region – North Water Project Scientific Report No. 1, ArcticInstitute of North America, 150 pp., 1971.
Münchow, A., Falkner, K. K., and Melling, H.: Baffin Island andWest Greenland current systems in northern Baffin Bay, Prog.Oceanogr., 132, 305–317, 2015.
Orr, J. C., Epitalon, J., Dickson, A. G., and Gattuso, J.: Routineuncertainty propagation for the marine carbon dioxide system,
Mar. Chem., 207, 84–107, doi:10.1016/j.marchem.2018.10.006,2018.
Orr, J., Fabry, V., Aumont, O., Bopp, L., Doney, S., Feely, R.,Gnanadesikan, A., Gruber, N., Ishida, A., Joos, F., Key, R., Lind-say, K., Maier-Reimer, E., Matear, R., Monfray, P., Mouchet, A.,Najjar, R., Plattner, G., Rodgers, K., Sabine, C., Sarmiento, J.,Schlitzer, R., Slater, R., Totterdell, I., Weirig, M., Yamanaka, Y.,and Yool, A.: Anthropogenic ocean acidification over the twenty-first century and its impact on calcifying organisms, Nature, 437,681–686, doi:10.1038/nature04095, 2005.
Papakyriakou, T., Miller, L. A., Thomas, H.,; Mucci, A., and Else,B.: Partial pressure of carbon dioxide, dissolved inorganic car-bon, alkalinity, temperature, salinity and other variables collectedfrom the surface underway observations and discrete bottle sam-ples from CCGS Amundsen during the cruises in Baffin Bay,Nares Strait, and Lancaster Sound from 2013-08-11 to 2014-08-12, NOAA National Centers for Environmental Information,https://doi.org/10.7289/v5st7n3c, 2017.
Popova, E. E., Yool, A., Aksenov, Y., Coward, A. C., andAnderson, T. R.: Regional variability of acidification in theArctic: a sea of contrasts, Biogeosciences, 11, 293–308,https://doi.org/10.5194/bg-11-293-2014, 2014.
Prinsenberg, S. and Bennett, E.: Mixing and transports in BarrowStrait, the central part of the Northwest Passage, Cont. Shelf Res.,7, 913–935, doi:10.1016/0278-4343(87)90006-9, 1987.
Proshutinsky, A., Krishfield, R., Timmermans, M., Toole, J., Car-mack, E., McLaughlin, F., Williams, W. J., Zimmermann, S.,Itoh, M., and Shimada, K.: Beaufort Gyre freshwater reservoir:State and variability from observations, J. Geophys. Res.-Ocean.,114, C00A10, doi:10.1029/2008JC005104, 2009.
Qi, D., Chen, L., Chen, B., Gao, Z., Zhong, W., Feely, R. A., Ander-son, L. G., Sun, H., Chen, J., Chen, M., Zhan, L., Zhang, Y., andCai, W.: Increase in acidifying water in the western Arctic Ocean,Nat. Clim. Change, 7, 195–199, doi:10.1038/NCLIMATE3228,2017.
Robbins, L. L., Wynn, J. G., Lisle, J. T., Yates, K. K., Knorr, P.O., Byrne, R. H., Liu, X., Patsavas, M. C., Azetsu-Scott, K., andTakahashi, T.: Baseline monitoring of the Western Arctic Oceanestimates 20 % of Canadian Basin surface waters are undersat-urated with respect to aragonite, PLOS One, 8, UNSP e73796,doi:10.1371/journal.pone.0073796, 2013.
Robert-Baldo, G., Morris, M., and Byrne, R.: Spectrophotometricdetermination of seawater pH using Phenol Red, Anal. Chem.,57, 2564–2567, doi:10.1021/ac00290a030, 1985.
Rodgers, K. B., Lin, J., and Frölicher, T. L.: Emergence ofmultiple ocean ecosystem drivers in a large ensemble suitewith an Earth system model, Biogeosciences, 12, 3301–3320,https://doi.org/10.5194/bg-12-3301-2015, 2015.
Sabine, C., Feely, R., Gruber, N., Key, R., Lee, K., Bullis-ter, J., Wanninkhof, R., Wong, C., Wallace, D., Tilbrook, B.,Millero, F., Peng, T., Kozyr, A., Ono, T., and Rios, A.: Theoceanic sink for anthropogenic CO2, Science, 305, 367–371,doi:10.1126/science.1097403, 2004.
Serreze, M. C. and Barry, R. G.: Processes and impacts of Arcticamplification: A research synthesis, Global Planet. Change, 77,85–96, doi:10.1016/j.gloplacha.2011.03.004, 2011.
Shadwick, E. H., Thomas, H., Chierici, M., Else, B., Fransson,A., Michel, C., Miller, L. A., Mucci, A., Niemi, A., Papakyr-iakou, T. N., and Tremblay, J. -E.: Seasonal variability of the
https://doi.org/10.5194/bg-17-3923-2020 Biogeosciences, 17, 3923–3942, 2020

3942 A. Beaupré-Laperrière et al.: The recent state and variability of the carbonate system
inorganic carbon system in the Amundsen Gulf region of thesoutheastern Beaufort Sea, Limnol. Oceanogr., 56, 303–322,doi:10.4319/lo.2011.56.1.0303, 2011.
Shadwick, E. H., Trull, T. W., Thomas, H., and Gibson, J. A. E.:Vulnerability of Polar Oceans to anthropogenic acidification:Comparison of Arctic and Antarctic seasonal cycles, Sci. Rep.-UK, 3, 2339, doi:10.1038/srep02339, 2013.
Schlitzer, R.: Ocean Data View, available at: http://odv.awi.de (lastaccess: 28 July 2020), 2016.
Stigebrandt, A.: The North Pacific - a Global-Scale Estuary, J. Phys.Oceanogr., 14, 464–470, 1984.
Stroeve, J. C., Serreze, M. C., Holland, M. M., Kay, J. E., Malanik,J., and Barrett, A. P.: The Arctic’s rapidly shrinking sea icecover: a research synthesis, Climatic Change, 110, 1005–1027,doi:10.1007/s10584-011-0101-1, 2012.
Sutton, A. J., Sabine, C. L., Feely, R. A., Cai, W.-J., Cronin, M.F., McPhaden, M. J., Morell, J. M., Newton, J. A., Noh, J.-H.,Ólafsdóttir, S. R., Salisbury, J. E., Send, U., Vandemark, D. C.,and Weller, R. A.: Using present-day observations to detect whenanthropogenic change forces surface ocean carbonate chemistryoutside preindustrial bounds, Biogeosciences, 13, 5065–5083,https://doi.org/10.5194/bg-13-5065-2016, 2016.
Takahashi, T., Olafsson, J., Goddard, J., Chipman, D., and Suther-land, S.: Seasonal variation of CO2 and nutrients in the high-latitude surface oceans - a comparative study, Global Bio-geochem. Cy., 7, 843–878, doi:10.1029/93GB02263, 1993.
Tang, C., Ross, C., Yao, T., Petrie, B., DeTracey, B., and Dunlap, E.:The circulation, water masses and sea-ice of Baffin Bay, Prog.Oceanogr., 63, 183–228, doi:10.1016/j.pocean.2004.09.005,2004.
Tivy, A., Howell, S. E. L., Alt, B., McCourt, S., and Chagnon, R.:Trends and variability in summer sea ice cover in the CanadianArctic based on the Canadian Ice Service Digital Archive, 1960–2008 and 1968–2008, J. Geophys. Res.-Ocean., 116, C03007,doi:10.1029/2009JC005855, 2011.
Tremblay, J.-E., Belanger, S., Barber, D. G., Asplin, M., Martin,J., Darnis, G., Fortier, L., Gratton, Y., Link, H., Archambault,P., Sallon, A., Michel, C., Williams, W. J., Philippe, B., andGosselin, M.: Climate forcing multiplies biological productiv-ity in the coastal Arctic Ocean, Geophys. Res. Lett., 38, L18604,doi:10.1029/2011GL048825, 2011.
Tremblay, J., Anderson, L. G., Matrai, P., Coupel, P., Belanger,S., Michel, C., and Reigstad, M.: Global and regional driversof nutrient supply, primary production and CO2 drawdown inthe changing Arctic Ocean, Prog. Oceanogr., 139, 171–196,doi:10.1016/j.pocean.2015.08.009, 2015.
Uppström, L. R.: The boron/chlorinity ratio of deep-sea water fromthe Pacific Ocean, Deep-Sea Res. Oceanogr. Abstr., 21, 161–162,1974.
Wanninkhof, R., Park, G.-H., Takahashi, T., Sweeney, C., Feely,R., Nojiri, Y., Gruber, N., Doney, S. C., McKinley, G. A.,Lenton, A., Le Quéré, C., Heinze, C., Schwinger, J., Graven,H., and Khatiwala, S.: Global ocean carbon uptake: magni-tude, variability and trends, Biogeosciences, 10, 1983–2000,https://doi.org/10.5194/bg-10-1983-2013, 2013.
Wolf-Gladrow, D. A., Zeebe, R. E., Klaas, C., Koertzinger, A., andDickson, A. G.: Total alkalinity: The explicit conservative ex-pression and its application to biogeochemical processes, Mar.Chem., 106, 287–300, doi:10.1016/j.marchem.2007.01.006,2007.
Wynn, J. G., Robbins, L. L., and Anderson, L. G.: Pro-cesses of multibathyal aragonite undersaturation in theArctic Ocean, J. Geophys. Res.-Ocean., 121, 8248–8267,doi:10.1002/2016JC011696, 2016.
Yamamoto-Kawai, M., McLaughlin, F. A., and Carmack, E. C.: Ef-fects of ocean acidification, warming and melting of sea ice onaragonite saturation of the Canada Basin surface water, Geophys.Res. Lett., 38, L03601, doi:10.1029/2010GL045501, 2011.
Yamamoto-Kawai, M., McLaughlin, F. A., Carmack, E. C., Nishino,S., Shimada, K., and Kurita, N.: Surface freshening of the CanadaBasin, 2003–2007: River runoff versus sea ice meltwater, J. Geo-phys. Res.-Ocean., 114, C00A05, doi:10.1029/2008JC005000,2009a.
Yamamoto-Kawai, M., McLaughlin, F. A., Carmack, E. C., Nishino,S., and Shimada, K.: Aragonite undersaturation in the ArcticOcean: Effects of ocean acidification and sea ice melt, Science,326, 1098–1100, doi:10.1126/science.1174190, 2009b.
Zeebe, R. E. and Wolf-Gladrow, D.: Equilibrium, in: CO2 in Seawa-ter: Equilibrium, kinetics, isotopes, Elsevier Oceanography Se-ries, Amsterdam, 2–22, 2001.
Biogeosciences, 17, 3923–3942, 2020 https://doi.org/10.5194/bg-17-3923-2020