the redshift evolution of early-type galaxies in cosmos - iopscience
TRANSCRIPT

THE REDSHIFT EVOLUTION OF EARLY-TYPE GALAXIES IN COSMOS:DO MASSIVE EARLY-TYPE GALAXIES FORM BY DRY MERGERS?1
C. Scarlata,2C. M. Carollo,
2S. J. Lilly,
2R. Feldmann,
2P. Kampczyk,
2A. Renzini,
3A. Cimatti,
4
C. Halliday,4E. Daddi,
5M. T. Sargent,
2A. Koekemoer,
6N. Scoville,
7J.-P. Kneib,
8
A. Leauthaud,8R. Massey,
7J. Rhodes,
7,9L. Tasca,
8P. Capak,
7H. J. McCracken,
10
B. Mobasher,6Y. Taniguchi,
11D. Thompson,
7,12M. Ajiki,
13H. Aussel,
14,15
T. Murayama,13
D. B. Sanders,14
S. Sasaki,13,16
Y. Shioya,16
and M. Takahashi13,16
Received 2006 June 16; accepted 2007 January 26
ABSTRACT
We study the evolution since z � 1 of the rest-frame B luminosity function of ETGs in�0.7 deg2 in the COSMOSfield. In order to identify all progenitors of local ETGs we construct the sample of high-z galaxies using two com-plementary criteria: (1) a morphological selection based on the Zurich Estimator of Structural Types and (2) a photo-metric selection based on the galaxy properties in the (U�V )YMV color-magnitude diagram.We furthermore constrainboth samples so as to ensure that the selected progenitors of ETGs are compatible with evolving into systems that obeythe �B-rhl Kormendy relation. Assuming the luminosity evolution derived from studies of the fundamental plane forhigh-z ETGs, our analysis shows no evidence for a decrease in the number density of the most massive ETGs out toz � 0:7: both the morphologically and the photometrically selected subsamples show no evolution in the numberdensity of bright (�L > 2:5L�) ETGs. Allowing for different star formation histories, and cosmic variance, we estimatea maximum decrease in the number density of massive galaxies at that redshift of�30%.We observe, however, in boththe photometric and morphological samples, a deficit of up to about 2Y3 of fainter ETGs over the same cosmic period.Our results argue against a significant contribution of recent dissipationless ‘‘dry’’ mergers to the formation of the mostmassive ETGs. We suggest that the mass growth in low-luminosity ETGs can be explained with a conversion fromz � 0:7 to z ¼ 0 of blue, irregular, and disk galaxies into low- and intermediate-mass ‘‘red’’ ETGs, possibly alsothrough gas-rich mergers.
Subject headinggs: galaxies: elliptical and lenticular, cD — galaxies: evolution — galaxies: formation —galaxies: structure
1. INTRODUCTION
One of the currentlymost debated—and consequential—issuesin astrophysics is the formation of massive elliptical galaxies (seeRenzini 2006 for a recent review).
From the theoretical point of view, cold dark matter (CDM)simulations can accurately predict the redshift evolution of dark
matter halos. Specifically, on large scales CDM simulations haveenjoyed great success in accounting for the growth through cosmictimes of the structures—clusters, filaments, and voids—startingfrom the extremely smooth initial conditions inferred from thecosmic microwave background (e.g., Springel et al. 2006). Westill lack, however, an understanding of the astrophysical pro-cesses that produce massive galaxies with the properties that theseshow in the local universe: gas cooling, star formation, stellar, andactive galactic nucleus (AGN) feedback are all poorly—if at all—understood processes, which are currently parameterized with adhoc recipes in galaxy formation models. Simulations have beenless successful on these lower, galactic scales (�100 kpc), and it isnot clear yet whether this is due to the justmentioned complexitiesof baryon physics or to other reasons.From the observational point of view, the emerging picture is
still uncertain. In the local universe, studies of the stellar popu-lations of massive ellipticals indicate a formation epoch for thebulk of their stars at redshifts z > 2; however, the old stellar pop-ulations at z ¼ 0 cannot break the degeneracy between the massassembly of old smaller subunits relative to in situ star formation(Carollo et al. 1993; Bender et al. 1993; Carollo & Danziger1994a, 1994b; Bernardi et al. 2003b; Thomas et al. 2005). Thisdegeneracy can in principle be removed by observations of theevolution of the number density of ellipticals as a function of red-shift; however, small statistics, cosmic variance, and details in thedifferent analysis of the high-z samples have generated a debateas to whether massive ellipticals are already fully assembled byz � 1—a fact that, if true, would require considerable rethinking
1 Based on observations with the NASA/ESA Hubble Space Telescope, ob-tained at the Space Telescope Science Institute, which is operated byAURA, Inc.,under NASA contract NAS 5-26555.
2 Department of Physics, Swiss Federal Institute of Technology (ETH-Zurich),CH-8093 Zurich, Switzerland.
3 Dipartimento di Astronomia, Universita di Padova, I-35122 Padova, Italy.4 INAFYOsservatorio Astrofisico di Arcetri, I-50125 Firenze, Italy.5 National Optical Astronomy Observatory, Tucson, AZ 85726.6 Space Telescope Science Institute, Baltimore, MD 21218.7 California Institute of Technology, MC 105-24, Pasadena, CA 91125.8 Laboratoire d’Astrophysique de Marseille, BP 8, 13376 Marseille Cedex 12,
France.9 Jet Propulsion Laboratory, Pasadena, CA 91109.10 Institut d’Astrophysique de Paris, UMR 7095, 75014 Paris, France.11 Subaru Telescope, National Astronomical Observatory of Japan, Hilo,
HI 96720.12 Large Binocular Telescope Observatory, University of Arizona, Tucson,
AZ 85721.13 Astronomical Institute, Graduate School of Science, Tohoku University,
Aoba, Sendai 980-8578, Japan.14 Institute for Astronomy, University of Hawaii, Honolulu, Hawaii, 96822.15 Service d’Astrophysique, CEA/Saclay, 91191 Gif-sur-Yvette, France.16 Physics Department, Graduate School of Science and Engineering, Ehime
University, Matsuyama, Ehime, Japan.
494
The Astrophysical Journal Supplement Series, 172:494Y510, 2007 September
# 2007. The American Astronomical Society. All rights reserved. Printed in U.S.A.
of the currently favored galaxy formation models (see, e.g., Bellet al. [2004b] and Daddi et al. [2005] for examples of differentviews and Renzini [2006] for an extensive review and furtherreferences).
Some studies have suggested that the majority of the mostmassive (M > M �) early-type galaxies (ETGs) were assembledover the last few billion years from the dissipationless (‘‘dry’’)mergers of less massive ETGs (Bell et al. 2004b; Faber et al.2005). Estimates of the merger rate since z � 1 have been at-tempted by several authors (e.g., van Dokkum 2005; Bell et al.2006b; Lin et al. 2004; Kampczyk et al. 2007). Van Dokkum(2005) used the statistics of relic tidal interactions in the localuniverse and concludes that�35% of bulge-dominated galaxiesshould have experienced a merger with mass ratio >1:4 sincez � 0:1. Based on six ETG-ETG close pairs in the GEMS field,Bell et al. (2006b) estimate that each present-day ETG withMV <�20:5 has undergone �0.5Y2 major dry mergers sincez � 0:7. Several other studies, however, dispute such high fre-quencies of dry mergers since z � 1. For example, Bell et al.(2006a), based on the 3D two-point correlation function of ETGs,conclude that only 20% of all M > 2:5 ;1010 M� galaxies haveexperienced a major merger since z ¼ 0:8. This result roughlyagrees with the analysis of Lin and collaborators, who, from thecount of close pairs in the Deep Extragalactic Evolutionary Probe(DEEP) sample, conclude that only�9% of present-dayM � gal-axies have undergone a major merger over the same period. Sup-porting evidence against a large contribution of dry mergers to theformation ofmassive elliptical galaxies comes also from estimatesof the dry merging rate at z < 0:36 from the Sloan Digital SkySurvey (SDSS) database (Masjedi et al. 2006), which show a<1% probability per Gyr for an ETG tomerge with another ETG.TheMasjedi et al. estimate implies a dry-merging ratemuch lowerthan the rate at which ETG-hosting dark matter halos merge withone another (Hogg 2007), possibly highlighting a potential prob-lem with CDM simulations or in the way these simulations arerelated to the observed galaxy populations.
In any event, there are clearly major discrepancies amongcurrent attempts at measuring the dry merger rate, which in partare the result of the uncertainty affecting the time it will take for agiven galaxy pair to merge or for some tidal debris to disappear,and in part to small-number statistics. In this paper we follow adifferent approach in order to set limits on the role played by drymergers in establishing the population of massive ETGs in thelocal universe. Here we map the evolution with redshift up toz � 0:7 of the number density of massive ETGs. Since the bulkof stars in these galaxies formed at much higher redshifts (see theextensive literature quoted in Renzini 2006), an increase in thenumber density of massive ETGs since z ¼ 0:7 should be as-cribed to dry mergers; alternatively, a lack of evidence for suchan increase would allow us to set limits on the dry merging rate.
We use the data from theCosmic EvolutionSurvey (COSMOS)program (Scoville et al. 2007a) to study the evolution of the lumi-nosity function (LF) of the ETGs up to redshift z ¼ 1.We base theanalysis on the sample of �32,000 IAB � 24 COSMOS galaxieswith reliable photometric redshift in the range 0:2 < z � 1:0presented in Scarlata et al. (2007, hereafter Paper I) to extract acombined sample of 3980 morphologically and/or photometri-cally selected progenitors of early-type systems to study, in thez ¼ 0Y1 redshift window, their LF evolution in the rest-frameB band. Specifically, we select two complementary samples ofpossible progenitors of massive ETGs and study their individ-ual and combined redshift evolution. The first sample is selectedmorphologically, using the classification of ZEST (Zurich Esti-mator of Structural Types; Paper I). The second sample is selected
photometrically, using the red sequence identified, at all redshifts,on the rest-frame (U� V )YMV diagram. Both samples are furtherconstrained by requiring that, by passive-evolution fading, thehigh-z progenitors of ETGs evolve into z ¼ 0 systems that lie onthe �B-rhl ‘‘Kormendy relation’’ (Kormendy 1977).
Our double (i.e., morphological and photometric) selection ismotivated by the fact that, at z ¼ 0, elliptical galaxies are char-acterized by well-defined stellar population and dynamical/structural properties. Specifically, z ¼ 0 ellipticals both (1) haveuniformly old stellar populations with a small scatter in the ob-served colors, implying a small scatter in the formation epoch oftheir stellar populations; and (2) are described by regular surfacebrightness distributions, well represented by almost deVaucouleursdensity profiles, indicating a large role for violent relaxation in theirdynamical history. Depending on the relative timing and impor-tance of in situ star formation versus stellar mergers, z � 1 pro-genitors of ellipticals may thus appear as already morphologicallyrelaxed systems or possibly show passively evolving stellar popu-lations with irregular morphologies due to recent mergers. There-fore, to identify all plausible high-z progenitors of local ETGs, weconsider the sample created by the union of the morphologicallyand photometrically selected galaxies. This sample allows us to becomprehensive in the ‘‘counting’’ of the number density of mas-sive galaxies at earlier epochs. Still, selection biases remain in ouranalysis: the photometric-selected sample could include galaxiesthat are actually not progenitors of ellipticals and have red colorssimply because of the effects of dust extinction. On the other hand,blue progenitors with merger morphologies would not enter ineither of the samples. We discuss later in the paper the affect ofthese biases on our conclusions.
The paper is organized as follows. Section 2 describes the dataand the basic measurements; x 3 describes in detail the sampleselection criteria; x 4 quickly summarizes the structural proper-ties of the photometrically selected ETGs and the color proper-ties of the morphologically selected sample; x 5 presents ourmain analysis, i.e., the evolution with redshift of the rest-frameB-band LF of the different and also combined samples of high-zETG progenitors. We discuss our results in x 6 and highlighta few concluding remarks in x 7. Appendix A presents the testsperformed on the LFs to account for the photometric redshift un-certainties, and Appendix B presents the SDSS-based z ¼ 0 com-parison sample. Throughout the paper we assume �m ¼ 0:25,�m þ �� ¼ 1, and H0 ¼ 70 km s�1 Mpc�1. All magnitudes areAB magnitudes (Oke 1974), unless otherwise specified.
2. DATA AND BASIC MEASUREMENTS
2.1. The Data and the Input Catalog
The analysis presented in this paper uses the Cosmic EvolutionSurvey (COSMOS) Hubble Space Telescope (HST ) AdvancedCamera for Surveys (ACS) F814W images (hereafter IAB), andancillary ground-basedUVYtoYnear-infrared data available for theCOSMOS field. The ground-based BJ, g
þ, VJ , rþ, iþ, zþ data
were acquired with the Subaru Telescope, the u�-band data withthe Canada-France-Hawaii Telescope, and the infrared Ks imageswith the Cerro Tololo International Observatory and Kitt PeakNational Observatory telescopes. The observations and the dataprocessing are described in detail in Capak et al. (2007) Taniguchiet al. (2007) for the ground-based data and in Koekemoer et al.(2007) for the HSTACS data.
Photometric catalogs were created separately for the ground-based and the HST data. The ACS-based catalog was generatedby Leauthaud et al. (2007) using SExtractor (Bertin & Arnouts1996) in a two-step strategy in order to correctly detect and
IS THERE A NEED FOR DRY MERGERS? 495

deblend objects with a wide range of magnitudes and sizes.Extensive simulations presented in Leauthaud et al. (2007) showthat the ACS catalog is at least 90% complete for objects smallerthan 1.400 and IAB � 24 (roughly corresponding to a surface bright-ness limit of �IAB ¼ 25 mag arcsec�2).
The ground-based catalog was generated using SExtractor indual-image mode. The detection was performed in the originalbest-seeing point-spread function (PSF) iþ-band image, whilethe photometry was measured in the PSF-matched images. Thisprocess ensured that the photometry of nearby galaxies was op-timally deblended in the final catalog. Magnitudes were measuredwithin apertures of 300 diameter; and 5 � magnitude limits are26.4, 27.3, 27.0, 26.6, 26.8, 26.2, 25.2, and 21.6 in the u�, BJ, g
þ,VJ, r
þ, iþ, zþ, and Ks filters, respectively (Capak et al. 2007).In this work, we present the results for the central area of the
COSMOS field of �0.74 deg2 covered by the 260 ACS point-ings acquired during HST Cycle 12 observations. We limit ourstudy to the�32,000 galaxies with total magnitude (as measuredby the SExtractor MAG_AUTO) brighter than IAB ¼ 24:0 andphotometric redshifts (see next section) in the redshift range0:2 < z � 1:0.
2.2. Photometric Redshifts
We adopt the maximum likelihood photometric redshift esti-mates obtained for the COSMOS galaxies by Feldmann et al.(2006) with the Zurich Extragalactic Bayesian Redshift Analyzer(ZEBRA). Our photo-z were obtained using as a basic set of gal-axy templates the empirical spectra by Coleman et al. (1980) andKinney et al. (1996) that cover the spectral types from ellipticalto the star-forming galaxies. By means of an iterative techniqueZEBRA automatically corrects their original set of templates tobest represent the galaxy spectral energy distributions (SEDs) indifferent redshift bins (to empirically take into account, e.g., dustabsorption effects and other possible inadequacies inherent in theoriginal set of templates). The availability of a ‘‘training set’’ ofspectroscopically derived z-COSMOS redshifts (Lilly et al. 2007)for a small fraction of the whole photometric sample under in-vestigation allows ZEBRA to achieve an optimal correction ofthe galaxy templates and a precise calibration of the photometricredshifts, and thus accurate photo-z estimates.
The resulting photometric redshifts have an accuracy of�z/(1þ z) ¼ 0:027 over the whole redshift range considered inthe current analysis, relative to the z-COSMOS spectroscopicredshifts of IAB � 22:5 galaxies. Tests on the IAB � 22:5 spec-troscopic sample artificially fainted to reproduce a IAB � 24 sam-ple indiUcate photometric redshift errors �z/(1þ z) � 0:06.
We checked that our main results remain unchanged when(1) changing the redshift binning adopted by ZEBRA for the tem-plate optimization, the minimum errors in the photometry allowedby ZEBRA, and the corrections applied to the photometric catalog(i.e., the pliantness parameter � and the regularization parameter �that appear in the �2 minimization approach of the ZEBRA code;Feldman et al. 2006); and (2) using only galaxieswith�2 <�2
95 inthe ZEBRA fits, with�2
95 the value corresponding to the 95th per-centile in an ideal �2 distribution of a varying number of degreesof freedom; or all galaxies in the sample, independent of their �2
in the ZEBRA photometric fits.For a total of �4.4% of the galaxies that were detected in the
original ACS-based catalog it was not possible to derive a pho-tometric redshift estimate, due to either their absence or theirblending with other galaxies in the ground-based catalog. Thesegalaxies were excluded from our analysis. The usable Cycle 12IAB � 24ACS-based catalog contains 32,540galaxieswith photo-metric redshift in the range [0.2, 1.0] and �2 < �2
95.
2.3. The ZEST Morphological Classification
To extract the sample of morphologically selected ETGs athigh redshifts, and also to study later on in the paper the mor-phologies of the photometrically selected sample of ETGs, weused the ZEST classification presented in Paper I. ZEST quanti-tatively describes the galaxy structure using three variables (PC1,PC2, and PC3), obtained by performing a principal componentanalysis (PCA) in the five-dimensional parameter space of asym-metry (A), concentration (C ), Gini coefficient (G ), the second-order moment of the brightest 20% galaxy pixels (M20; e.g.,Abraham et al. 2003; Lotz et al. 2004), and the ellipticity of thelight distribution17 (�). These nonparametric diagnostics providecomplementary but also redundant information on galaxy struc-ture. With the PCAwe found that the first three PC variables ex-plain more than 90% of the variance in the original data set andthus completely describe the galaxy structure.Themorphological classification is performed in the space with
axes PC1-PC2-PC3. To associate a (dominant) morphologicalclass to different regions in the PC-space, the latter was partitionedinto a regular 3D grid with unit steps in each of the coordinates,and all the galaxies in the COSMOS sample within each of theunit PC-cubes were visually inspected. Each galaxy was then as-signed the morphological class of the PC-cube corresponding toits position. The ZESTclassification associates to each PC-cube atype (=1 for early-type galaxies; =2 for disk galaxies; and =3 forirregular galaxies). Furthermore, each PC-cube classified as type 2is assigned a ‘‘bulgeness’’ parameter according to the medianvalue (nm) of the distribution of n Sersic indices of all galaxiesbrighter than IAB ¼ 22:5 in that cube. The two-dimensionalGIM2D fits were performed by Sargent et al. (2007) on theCOSMOS-bright sample, i.e., IAB � 22:5; we verified in PaperI that the PCA provides consistent results if separately appliedto the faint (i.e., IAB � 24) and the bright (i.e., IAB � 22:5)samples. The bulgeness parameter is related to the B/D ratio 18
(see Paper I for detail) and ranges from 0 (bulge-dominated diskgalaxies, type 2.0) to 3 (pure disk galaxies, type 2.3).We use nm toassign the bulgeness parameter to each type 2Yclassified PC-cube,according to the following scheme: bulgeness ¼ 3, 2, 1, and0, respectively, for 0 < nm < 0:75, 0:75 � nm <1:25, 1:25 �nm < 2:5, and nm � 2:5. The distributions of Sersic n for allgalaxies classified as type 2, split according to their bulgenessparameter, are shown in Figure 9 of Sargent et al. (2007).In Paper I we discuss in detail the uncertainties and the sys-
tematic errors in the measured structural parameters as a functionof signal-to-noise ratio (S/N), and to what extent the COSMOS-calibrated ZEST morphological classification grid is affected bythe S/N of the individual galaxies; our tests show that the ZESTmorphological classification is robust down to IAB ¼ 24. Further-more, the ZEST classification is substantially more efficient indisentangling different galactic types than simpler classificationschemes based on, e.g., a threshold in n-Sersic index, or two/threeof the nonparametric diagnostics mentioned above.
2.4. Rest-Frame Magnitudes and Colors
In order to compute the rest-frame absolute B-band magnitude(MB), we define a color k-correction KBI (z) ¼ B� Iz, where B isthe magnitude at kB;obs ¼ (1þ z)kB and Iz indicates the observed
17 In order to ensure a meaningful comparison of the parameters among gal-axies at different redshifts, all coefficients are computedwithin elliptical aperturesof semimajor axis equal to one Petrosian radius (Petrosian 1976).
18 When single Sersic fits are performed to bulge+disk galaxies, the n Sersicindex of the global galaxy profile is found to be monotonically related to thegalaxy B/D ratio (e.g., Blanton et al. 2003).
SCARLATA ET AL.496 Vol. 172

I-band magnitude for a galaxy at redshift z. The central wave-length of the ACS filter (F814W) corresponds to the centralwavelength of the B band at redshift z � 0:8; therefore, B�Iz�0:8 ¼ 0. It follows that the rest-frame absolute magnitudeMB
can be expressed as
MB ¼ Iz � 5:0 log dL zð Þ=10 pc½ � � 25:0
þ KBI (z)þ 2:5 log (1þ z); ð1Þ
where dL is the luminosity distance at redshift z. The color B� Izdepends on the galaxy spectral energy distribution. For each gal-axy we therefore use its ZEBRA best-fit template and the corre-sponding photometric redshift to compute the B� Iz color.
The rest-frame U � V colors are derived from the ground-based photometry, by interpolating the observed SEDs at thewavelengths of the U and V filters, redshifted at the galaxy pho-tometric redshift. The adopted effective wavelengths of the Uand V filters are 3841 and 54798, respectively. Typical accuracyin the rest-frame U�V color is of 0.05 mag for �z� 0:03(1þ z)and 0.1 for �z � 0:06(1þ z).
3. SELECTION OF HIGH-z PROGENITORSOF EARLY-TYPE GALAXIES
3.1. The Morphologically Selected Sample
The morphologically selected sample was constructed by in-cluding all galaxies classified by ZEST as type 1, i.e., as early-type galaxies, and all bulge-dominated type 2.0 disk galaxies.The latter are located in volumes of PC-space that are adjacent tothe type 1 early-type galaxies and are therefore characterized byvery similar structural properties (see Paper I). Indeed, type 2.0galaxies have bulge properties very similar to the type 1 systemsand differ from these only by a clearly detected (nondominant)disk component. Down to the magnitude limit of our analysis(IAB ¼ 24), in the fraction of the COSMOS field under investi-gation, and in the redshift range 0:2 < z � 1:0 there are a total of2352 and 1352 galaxies with good photometric redshift that are,respectively, classified as type 1 and type 2.0 galaxies by ZEST.Both samples have similar Sersic n distribution, with 80% and70% of type 1 early-type and type 2.0 bulge-dominated galaxies,respectively, having n � 2:5. We highlight in the sections belowfurther similarities between types 1 and 2.0 galaxies. The in-clusion of these (heavily) bulge-dominated disk galaxies in ourmorphologically selected sample of ETGs also facilitates thecomparison with other studies, since these have generally tendedto include such systems in the analysis (see, e.g., Bell et al. 2004a).
3.1.1. A Further Constraint: The z ¼ 0 Kormendy Relation
ETGs in the local universe followwell-defined scaling relations.Of particular importance is the fundamental plane (Djorgovski& Davis 1987; Dressler et al. 1987) and, if the velocity disper-sion is not available, its photometric projection, i.e., the so-calledKormendy relation (Kormendy 1977). The Kormendy relationis a correlation between the half-light radius of the galaxy and theaverage surface brightness within the half-light radius.
Selecting ETG progenitors at high redshifts on the basis oftheir elliptical-like morphologies is equivalent to requiring thatthese progenitors already be fully assembled and dynamicallyrelaxed galaxies at those earlier epochs: they become z ¼ 0 earlytypes by evolution of their stellar populations (and possibly somemodest amount of additional star formation). Therefore, in con-structing a morphologically selected sample of high-z ETGs, wecan apply an additional constraint, namely, the surface brightness
must be such that with plausible surface brightness evolution itevolves into the Kormendy relation. Clearly, surface brightnessevolution may be uncertain, especially for blue objects with com-posite stellar population; however, we can take a conservativeapproach and estimate a minimum evolution that leads to theminimum number of excluded objects.
In Figure 1 we show the average surface brightness within thehalf-light radius in the rest-frame B band as a function of the half-light radius for the type 1 (early-type galaxies; left) and type 2.0(bulge-dominated disk galaxies; right) galaxies of our morpho-logically selected sample. We use different colors to representgalaxies with different ZEBRA best fit to their SEDs; in partic-ular, red points are galaxies fitted by ZEBRAwith an ‘‘ellipticalgalaxy’’ template, and blue points represent later spectral types(Feldmann et al. 2006). Dotted and dot-dashed lines show theIAB ¼ 24magnitude limit at the central redshift of the bin, for gal-axies with the SED of a star-forming and an elliptical galaxy, re-spectively. Typical error bars (i.e., estimated at the median sizeand magnitude of the sample galaxies) are shown on the upperright part of each panel. The errors are calculated by also takinginto account the effects of the photometric redshift. The half-lightradii used in Figure 1 are measured using a growth curve analysison the ACS IAB images. By comparison with the half-light radiimeasuredwithGIM2DbySargent et al. (2007)we found that PSFeffects, which are accounted for with GIM2D, start to be impor-tant only for galaxies with measured rhl< 0:200. At these sizes, rhlis typically overestimated by �25% compared with the GIM2Dmeasurement. We find similar results by analyzing a set of IAB ¼22Y24 simulated galaxies with Sersic index n ¼ 2 and 4. We de-cided not to correct for this effect, since the correction depends onthe exact shape of the galaxy surface brightness profile, which isunknown.We note, however, that our sample includes only�7%of galaxieswithmeasured rhl < 0:200, so the impact of the PSF cor-rection on the final selected sample of Kormendy-consistent gal-axies is minimal. In the figure, the solid black line represents thebest linear fit derived for the Coma Cluster galaxies (Jørgensenet al. 1995), passively evolved at the central redshift of the bin as-suming�B(z) / �1:36z (i.e., the evolution of a single stellar pop-ulation model with formation redshift zf ¼ 2; Bruzual & Charlot2003). The Jørgensen et al. (1995) data were converted fromJohnsonVega toABmagnitudes using the relationBAB ¼ BVega �0:1. The solid thin lines represent the best-fit relation at the twoextremes of the redshift bins. The dashed lines indicate a distancefrom the z ¼ 0 best-fit line of twice its rms dispersion.
Figure 1 shows that up to redshift z �1, for a given size, ob-jects that have a ZEBRA elliptical-like classification tend to have,on average, higher surface brightness relative to those with laterspectral types. Furthermore, the figure shows that, up to z � 0:6,many galaxies lie significantly below the local Kormendy relation.A fraction of the order of �80% of these ‘‘low-density’’ systemshave the ZEBRA SEDs of late-type, star-forming galaxies. Wenote that at redshifts higher than z ¼ 0:6 selection effects are re-sponsible for the absence of galaxies with h�Bi� 22 mag arcsec�2
and radii of a few kiloparsecs.In order to quantify the criterion for the exclusion of implau-
sible progenitors of ETGs on the basis of the z ¼ 0 Kormendyrelation, we followed the procedure described in Ferreras et al.(2005), namely:
1. We assigned a fading rate of �B to each galaxy, based onthe ZEBRA best fit to its SED.
2. We considered two extreme star formation histories (SFHs),both with an initial formation redshift zf ¼ 2. The first SFH de-scribes the passive evolution of a single-burst stellar population and
IS THERE A NEED FOR DRY MERGERS? 497No. 1, 2007

was assigned to all galaxies with a ZEBRA ‘‘elliptical galaxy’’best fit. The second SFH was assigned to galaxies best fitted byZEBRA with a star-forming SED. This SFH is described by aconstant star formation rate of 1 M� yr�1 up to the redshift atwhich the galaxy is observed (if larger than z ¼ 0:5) and by zerostar formation rate from the galaxy redshift (or z ¼ 0:5) to z ¼ 0.The lowest redshift possible for the truncation of the star forma-tion, i.e., z ¼ 0:5, was chosen in order for the z ¼ 0 stellar pop-ulation of the so-evolved galaxies to have colors consistent withthe observed scatter in the color-magnitude relation of nearbyETGs (Bower et al. 1992; Bernardi et al. 2003b). The SFHs, i.e.,the �B fading rates, for intermediate ZEBRA photometric typeswere derived by interpolating between the two extreme cases. Theevolution of the SFHs was computed assuming a constant met-allicity equal to the solar value.
3. Finally, we excluded from the final sample of ‘‘Kormendy-compatible,’’ morphologically selected progenitors of ETGs allobjects that, when evolved to z ¼ 0 with the above evolutionarytracks, were found to lie away from the local Kormendy rela-tion19 at a distance more than 2 times its observed scatter. Usinga threshold of 3 times the observed scatter would increase thenumber of galaxies included in the final sample of Kormendy-compatible ETGs by P10%, without changing our main con-clusions on the evolution of the number density of bright ETGs.
This selection might in principle be affected by the specific valueof the adopted formation redshift (zf ¼ 2) and the approach of
using the ZEBRA best-fit templates to determine the B-band sur-face brightness evolution of each galaxy. However, neither ofthese choices affects our final conclusions.First, if some of the galaxies that have a ZEBRA elliptical-
galaxy fit were actually reddened star-forming objects, then thenumber of rejected objects would be minimized. Assuming aslower B-band luminosity evolution (i.e., a higher formationredshift of, e.g., zf ¼ 3) would change the expected brighten-ing at redshift z ¼ 1 by �0.2 mag, resulting in a final sample ofKormendy-consistent ETGs only �7% larger than the sampleobtained using zf ¼ 2. Our choice of using zf ¼ 2 is supportedby recent results, based on the evolution of the fundamentalplane, showing thatM >1011 M� early-type galaxies have zf ¼2:01þ0:22
�0:17 (van Dokkum & van der Marel 2007), with no sig-nificant differences for ETGs in cluster and field environments.Although zf measured by van Dokkum & van der Marel (2007)is a luminosity-weighted mean star formation epoch, the star for-mation timescale for massive ETGs, estimated from z ¼ 0 ellip-ticals, is shorter than 1 Gyr. Furthermore, Dickinson et al. (2003)and Papovich et al. (2006) show that the star formation in mas-sive galaxies is largely completed by z �1:5. Although the evo-lution of the stellar population for less massive ETGs is lessconstrained, there is evidence that less massive ETGs evolve fasterthan high-mass ones, both in the field and in cluster (McIntoshet al. 2005; Treu et al. 2005). In the light of our results a mass-independent formation redshift is thus a conservative approach,since it gives the smallest number of rejected low-luminosityETGs.TheKormendy cut increases the fraction of galaxies in themor-
phologically selected (type 1þ 2:0) sample that also have theZEBRA SED of an elliptical galaxy: this increases from 53% to63%. Particularly affected are the lowest redshift bins up to
Fig. 1.—Average surface brightness within the half-light radius in the rest-frame B band (h�Bi) as a function of the half-light radius (rhl, in kpc) for all galaxiesmorphologically classified as early-type galaxies (ZEST type 1; left) and bulge-dominated disk galaxies (ZEST type 2.0; right). In each figure, the four panels correspond todifferent redshift bins, as indicated. Points are color coded according to the best-fit ZEBRAspectral types: red points correspond to galaxieswith ZEBRAelliptical-galaxy SED,and blue points represent all galaxies with later ZEBRA spectral types. The solid black line represents the best linear fit derived for the z ¼ 0 ComaCluster galaxies (Jørgensenet al. 1995), passively evolved at the central redshift of the considered bin. The solid thin lines represent the evolution of the best-fit relation at the extremes of the redshift bin.The dashed lines indicate a distance from the best-fit line of twice the rms of the z ¼ 0 relation. Dotted and dot-dashed lines show, at the central redshift of the bin, the IAB ¼ 24magnitude limit for galaxies with the SED of a star-forming and an elliptical galaxy, respectively. On the upper right of each panel we show the typical error bar in h�Bi and rhl.
19 The z ¼ 0 Kormendy relation, as we discussed in the text, is derived usinggalaxies belonging to the Coma Cluster. Bernardi et al. (2003a; see also discussionin Renzini 2006) found that there are very small differences in the fundamentalplane derived for galaxies in cluster or in the field, and these differences remainsmall up to redshift �1 (van Dokkum & van der Marel 2007 ).
SCARLATA ET AL.498 Vol. 172

z ¼ 0:6, in which the fraction of early-type morphologies withan early-type SED increases from 53% to 70%. We note thatabout 46% of the excluded ZEBRA late-type galaxies at red-shifts z < 0:6 are faint systems with IAB � 23. In the highestredshift bin, the fraction of excluded objects with ZEBRA late-type SEDs decreases to 20%, and only 1% of the ZEBRA el-liptical type objects do not pass the Kormendy relation test.
A similar fraction of type 1 and type 2.0 galaxies are excludedon the basis of the Kormendy relation constraint: the fraction oftype 2.0 galaxies in the final morphologically selected samplechanges from 37% before the Kormendy cut to 35% after it; i.e.,it remains basically constant. The exclusion of the ‘‘Kormendy-rejected’’ objects implies a cut of about 20% in the original sam-ple of ZEST morphologically selected early-type galaxies: Ourfinal sample of morphologically selected progenitors of ETGscontains 2730 galaxies (1798 type 1 and 932 type 2.0 systems).
3.2. The Photometrically Selected Sample
Progenitors of z ¼ 0 massive ETGs may appear, at z � 1, asmorphologically irregular, merging systems with old and passivelyevolving stellar populations. These galaxies can be selected on thebasis of their SED properties.
To define our COSMOS sample of photometrically selectedprogenitors of z ¼ 0 ETGs, we used the red sequence identifiedon the rest-frame (U � V )YMV color-magnitude diagram, as de-rived in the two-step procedure that we describe below.
3.2.1. Step 1: Identification of the ’’Initial Red Sequence’’
In Figure 2 (left) we show the rest-frame (U � V )YMV color-magnitude diagram for the COSMOS IAB � 24 galaxy sample,split in four redshift bins. The gray levels in each panel representthe weighted galaxy volume density in bins of 0.15 ofMV mag-nitude and 0.04 of U � V color; the density in each color-magnitude bin is computed as
Pi Wi/Vmax; i. The Vmax; i value is
the maximum volume within which a galaxy i, with a given ob-served IAB magnitude and spectral type, is detectable in theCOSMOS survey; the weights Wi are the corrections requiredso as to account for objects excluded either because no redshift
is available or because the redshift estimate is less accurate thanthe required threshold (see x 2.2, and also Paper I for details onthe derivation of theWi values). The gray-scale bar at the top ofeach panel shows the density in Mpc�3 corresponding to the grayintensity levels.
The presence of radial color gradients in galaxies can have aneffect on themeasured colors and on the slope of the red sequence,depending on the size of the apertures used to compute colors andmagnitudes (see, e.g., Scodeggio 2001). Although not easy toquantify, an estimate of this effect can be evaluated as follows. Thegalaxy colors in the COSMOS photometric catalog are computedwithin 300 diameter apertures, regardless of galaxy redshift (Capaket al. 2007). The local magnitude-size relation implies a half-lightradius of �6 kpc at MB��21:5 and of �2 kpc at MB��19:5;therefore, when no evolution is taken into account, the COSMOS300
aperture corresponds to �1.2 and �3.4 half-light radii for brightand faint galaxies, respectively. Assuming a de Vaucouleurs pro-file and using the average U � V color gradient derived byScodeggio (2001; d(U � V )/d(log R) ¼ �0:15), theU � V col-ors computed within 1.5rhl , 2.0rhl , 2.5rhl , and 5rhl differ from thecolor computed within 0.3rhl by ��0.05, �0.07, �0.08, and�0.11 mag, respectively. Given the assumptions on the shape ofthe galaxy surface brightness profile, on the value for the localcolor gradient, and on the size-luminosity relation, the estimates ofthe effect of the color gradient on the measured colors can only beconsidered as indicative, and we therefore decided not to correctthe data but rather to consistently derive the slope of the red se-quence from the observed COSMOS color-magnitude diagram ineach redshift bin.
In Figure 3 we show the normalized distribution of the rest-frame U � V color of all galaxies split in both redshift and ab-solute magnitude. In particular, we consider four redshift bins,one per column, and three bins of 1.5 mag centered at the valuesindicated in the figure (top: MV ¼ �20; middle: MV ¼ �21:5;bottom: MV ¼ �23). All panels in the figure show a degree ofbimodality between red and blue galaxies (see, e.g., Bell et al.2004b for a discussion of color bimodality at high redshift), albeitwith varying degrees of sharpness. We are nonetheless able to
Fig. 2.—Left: Rest-frame U � V color vs. absolute magnitude in the rest-frame V band, for the same redshift bins as in Fig. 1. In each redshift bin, the solid linesrepresent the color-magnitude relation of the red sequence at the central redshift of the bin (x 3.2.1); dashed lines are�3 ; rms away from the solid lines. The gray levelsrepresent the weighted volume density of galaxies in bins of 0.06 of U � V color and 0.15 of magnitude, as indicated by the gray-scale shading bar given on top of eachpanel.Right: Same rest-frame color magnitude diagrams as in the left panel, with highlighted in red and blue the galaxies belonging to the photometrically selected sample.In this panel, red points indicate galaxies with a ZEBRA SED best fit of an elliptical galaxy, and blue points show galaxies that belong to the photometrically selectedsample but have later spectral types according to the ZEBRA fits.
IS THERE A NEED FOR DRY MERGERS? 499No. 1, 2007

identify in each of the panels the color of the ‘‘red peak,’’ whichwe use as the starting point for the computation of the slope of thered sequence in each of the individual redshift bins.
Specifically, in each magnitude-redshift bin, we define(U � V )irs as the color that broadly isolates the ‘‘initial redsequence’’; (U � V )irs is defined as the color of the minimumin the valley between the blue and red peaks in each of the colordistributions, and it is indicated as a dotted line in each panel ofFigure 3. The (U � V )redpeak color is then computed as the me-dian of all colors redder than (U � V )irs. The (U � V )redpeakcolor is indicated with a dashed vertical line in each panel ofFigure 3. The number in the upper left corner of each panelindicates the median error on the (U � V )redpeak colors in eachmagnitude-redshift bin; in some bins, these are negligible. Thesemedian errors are conservatively obtained considering the max-imum error derived by interpolating the errors in each of thetwo adjacent passbands that are used to derive the rest-frame(U � V ) color of the galaxy. We tested that varying the adoptedcolor thresholds (i.e., (U � V )redpeak) within�3 �(U�V ) does notaffect the resulting sample of photometrically selected ETGs.
We then compute the slope of the initial red sequence in eachredshift bin by fitting a linear relation to theMVY (U � V )redpeakpoints (and their errors). The four slopes, as a function of increas-ing redshift, are �0:037 � 0:007, �0:032 � 0:011, �0:040 �0:015, and �0:029 � 0:020. Within the errors, these values areconsistent with the average of �0:035 � 0:005. Given the mea-sured uncertainties, we therefore choose to keep fixed in our anal-ysis the average slope of the red sequence to the ‘‘consistencyvalue’’ of �0.035 (�0.005) for all redshifts.
For each galaxy in each redshift bin, a ‘‘slope-corrected’’ coloris then obtained by setting (U � V )corr ¼ (U � V )þ 0:035MV .The zero point of the initial red sequence at the mean redshift
of each bin is thus defined as the color of the red peak of the(U � V )corr distributions. These zero-point colors (U � V )ZP areequal to 0:86 � 0:04, 0:83 � 0:05, 0:71 � 0:06, and 0:62 � 0:05at the redshift values corresponding to the centers of our bins, i.e.,z ¼ 0:3, 0.5, 0.7, and 0.9, respectively. The error bars are com-puted by estimating the shifts in the red peak of the (U � V )corrdistributions induced by a change in the red sequence slope of�1 �. The above-defined initial red sequence curves are shown,for each redshift bin, as solid lines in the left panel of Figure 2;in each panel, the dashed line is �3 � away from the initial redsequence.
3.2.2. Step 2: Refining the Red Sequence: The FinalPhotometrically Selected Sample
The initial red sequence derived above coarsely mixes galax-ies within broad redshift bins. To refine the evolution with red-shift of the zero point, we plot in Figure 4 the values of (U � V )ZPderived above as a function of redshift. Specifically, Figure 4shows the rest-frame U � V color as a function of redshift for anabsolute Vmagnitude of�20.0, passively evolved by assuming asingle-burst stellar population formed at redshift zf ¼ 2 and met-allicity Z ¼ 0:8 Z�. The color evolution of the model is shown inFigure 4 as a dashed line.The z ¼ 0 point shown in Figure 4 is obtained by applying to
the comparison SDSS sample described in Appendix B (anddiscussed in detail in Kampczyk et al. 2007) the same procedurethat we have described above for the COSMOS galaxies. The ob-served redshift evolution of the U � V color of the red sequenceatMV ¼ �20�1:3z is consistent with the evolution predicted forthe single stellar population formed at redshift zf ¼ 2, that alsoreproduces the z ¼ 0 U� V color of the red sequence of theSDSS ETG sample.
Fig. 3.—Distribution of the rest-frame U � V color for the COSMOS galax-ies.We divide all galaxies in four redshift bins (one redshift per column) and threemagnitude bins of 1.5 mag for each redshift (as indicated on the right side of theplot). The number in the upper left corner of each panel indicates the median erroron theU � V colors in each magnitude-redshift bin (x 3.2.1). The dotted verticalline shows the (U � V )irs color that we use to broadly isolate the red sequence ineach redshift-magnitude bin; the color of the peak in each bin [(U � V )redpeak] isindicated by the vertical dashed line. The histograms are normalized to the totalnumber of objects in each magnitude-redshift bin.
Fig. 4.—Circles represent the U � V color of the initial red sequence calcu-lated, as a function of redshift, at a magnitude MV ¼ �20:0 passively evolvedusing a single-burst stellar population with formation redshift zf ¼ 2 and metal-licity Z ¼ 0:8 Z�. The color evolution of this model is shown as a dashed line. Theerror bars are those listed for the (U � V )ZP in x 3.2.2. The z ¼ 0 point is derivedapplying the same procedure adopted for the COSMOS galaxies to the comparisonSDSS sample. The thick solid line shows the linear fit to the color evolution of thezero point of the red sequence, derived including the SDSS comparison data point.The thin solid lines are 1 rms away from the best fit.
SCARLATA ET AL.500 Vol. 172

A linear fit in the 0 � z � 1 redshift range (i.e., including theSDSS point) to the (U � V )ZPYz relationship at the evolvedMV ¼ �20 magnitude gives
(U � V )ZP ¼ (�0:37 � 0:04)zþ (1:69 � 0:02): ð2Þ
This best fit is shown in Figure 4 as a thick solid line; thinsolid lines are located 1 rms away from the best fit. This result isin agreement with the redshift evolution of (U� V )ZP found byBell et al. (2004b). We use this best fit, together with the slopesmeasured as described in x 3.2.1, to define the final red sequence atany redshift z.
We point out that the red sequence that is identified by ourtwo-step procedure is more robust toward contamination by inter-lopers than a red sequence that is obtained, e.g., by keeping theslope fixed to a value derived from local samples of ETGs (e.g.,Bell et al. 2004b). Using a nonoptimally chosen slope introducesundesirable effects, since this basically determines the fractionof faint galaxies in the resulting red sequenceYselected sample.Estimates for the slope of the z ¼ 0 red sequence in local galaxyclusters range from �0.12 to �0.02, depending on the apertureadopted for the measurements (Scodeggio 2001). Assuming a toosteep slope for the data under study would lead to the inclusion ofa large fraction of faint blue interlopers.
The final red sequence defines our ‘‘photometrically selectedsample’’ of high-z progenitors of z ¼ 0 ETGs. This sample in-cludes all galaxies with U � V color redder than the value cor-responding to ‘‘minus 3 �’’ from the final red sequence at theappropriate redshift, i.e.,U�V ¼1:53�0:37z�0:035(MV þ20).
The sample contains 3844 galaxies with IAB � 24 and photo-metric redshift in the range 0:2 < z � 1:0.20
Figure 2 (right) highlights in color the galaxies that belong tothis photometrically selected sample, and specifically in red thegalaxies that have a ZEBRA elliptical-galaxy fit, and in blue thosewith ZEBRA late-type spectral fits. Below (x 4.2) we argue that itis sensible to apply the Kormendy test described above also to theso-derived photometrically selected sample; we thus define as‘‘final photometrically selected sample ’’ those galaxies in thesample constructed so far that also pass the ’’Kormendy test.’’
4. PROPERTIES OF THE MORPHOLOGICALLYAND PHOTOMETRICALLY SELECTED
EARLY-TYPE GALAXIES
4.1. Colors of Morphologically Selected Galaxies
In Figure 5 we show, separately for the four considered red-shift bins, the (U � V )YMV color-magnitude diagram for theKormendy testYconsistent, morphologically selected sample ofearly-type galaxies discussed in x 3.1. In particular, black filledcircles show the ZEST type 1 early-type galaxies, and cyan circlesrepresent the bulge-dominated type 2.0 disk galaxies. The red linein each panel reproduces the final red sequence—calculated atthe center of the redshift bin—derived in x 3.2.2. At any redshift,the majority of morphologically selected early-type galaxies ischaracterized by red colors (consistent with the final red sequencedefined above); however, a fraction of the order of 40% of thesesystems has significantly bluer colors than the red sequence (seeTables 1 and 2). These galaxies would be missed in a pure color-based selection. This fraction is similar to that of morphologicallyselected galaxies at z ¼ 0 that do not belong to the red sequence(see Table 1 in Renzini 2006). The morphologically selectedsample of ETG progenitors covers the entire observed rangeof rest-frame (U � V ) colors, although very few of them haveU � V < 0:5. This is not a consequence of the Kormendy rela-tion selection that has been applied to the sample: this is dem-onstrated by the black dots in each panel, which show the galaxieswith morphological type 1þ 2:0 that are excluded from the finalmorphological sample on the basis of the Kormendy test. These‘‘Kormendy testYrejected’’ galaxies are typically faint systems (of
Fig. 5.—Rest-frame color-magnitude diagram U � V vs. MV for the mor-phologically selected sample of ETGs. Black and cyan filled circles are used forgalaxies kept in the sample, after passing the Kormendy relation test described inx 3.1.1. Black filled circles are used for the ZEST type 1 (early-type morphology)galaxies, while cyan filled circles are used for the ZEST type 2.0 (bulge-dominateddisk) galaxies. Black dots show the galaxies that were excluded from the mor-phologically selected sample on the basis of the Kormendy test. The red line ineach panel reproduces the final red sequence derived in x 3.2.2 calculated at thecenter of the redshift bin.
TABLE 1
Final Samples of ETGs
z (Range) Morpho Photo Combined
0.2 < z � 0.4 ........................... 414 422 574
0.4 < z � 0.6 ........................... 414 407 594
0.6 < z � 0.8 ........................... 862 824 1214
0.8 < z � 1.0 ........................... 1040 1224 1598
Total .......................................... 2730 2877 3980
Note.—Number of galaxies in the final morphologically selected (Morpho)and photometrically selected (Photo) samples, split in the four redshift bins. Thenumber of galaxies per redshift bin in the combined sample is also listed.
20 Bell et al. (2004b) found�4700 red sequenceYselected galaxies in the red-shift range 0:2 < z < 1:1 down to RVega ¼ 24 in the COMBO17 survey, in anarea similar to the COSMOS area presented here. If we consider the same redshiftrange and relax our constraint on the accuracy of the photometric redshift, we find�12% more photometrically selected COSMOS ETGs than COMBO17. Thisis consistent with ours being an IAB ¼ 24 selected sample and theirs being aRVega ¼ 24 selected sample. We also stress that ours and the sample of Bell et al.are not directly comparable, since Bell et al. fixed the red sequence slope to thevalue of�0.08 found in local galaxy clusters, while we consistently compute thered sequence slope, from the observed color-magnitude diagram.
IS THERE A NEED FOR DRY MERGERS? 501No. 1, 2007

the order of MV >�19:5); there is however no obvious depen-dence of this galaxy population on the U � V color.
As evident from Figure 5, the color distributions of ZEST type 1and type 2.0 galaxies are rather similar (apart from a small blue‘‘excess’’ at low redshifts of bulge-dominated disks at brightmag-nitudes). This is further illustrated in Figure 6, where the rest-frameU � V color distributions are shown for both types as solid
and dashed histograms, respectively. In each redshift bin, thetype 1 and type 2.0 samples are split in two components, onebrighter (left panels) and the other fainter (right panels) thanthe value of M �
B at the center of the given redshift bin; the M�B
values are derived from the Schechter fits discussed in x 5 andare given in the top right corner of each diagram.
4.2. Morphology and Structure of PhotometricallySelected Galaxies
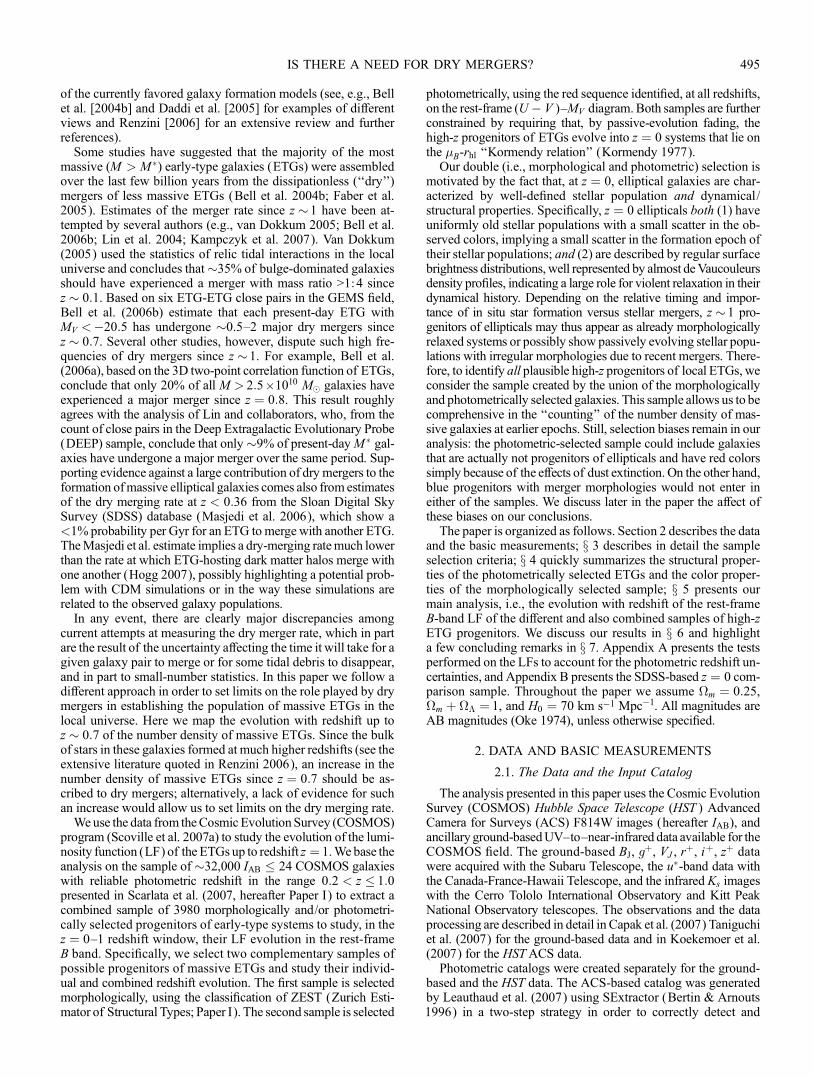
In Figure 7 (left) we show the fractions of photometrically se-lected early-type galaxies (derived in x 3.2) that belong to dif-ferent ZEST morphological classes. To make the comparisonamong different redshift bins meaningful, we limit the analysistoMB ¼ �19 at redshift z ¼ 0:9, and we evolve this magnitudelimit as a function of redshift according to the evolution of asingle-burst stellar population formed at zf ¼ 2, according tothe relation �MB ¼ �1:36z (cf. x 3.1.1).In Figure 7, type 1 early-type galaxies and type 2.0 bulge-
dominated galaxies are considered as a single class ( labeled with‘‘1þ 2:0’’). The results for the four redshift bins are representedwith different colors (as described in the figure). Galaxies with
Fig. 6.—Distribution of rest-frameU� V color for the type 1 (early-type galaxies; solid histograms) and type 2.0 (disk galaxies; dashed histograms) galaxies that passthe Kormendy relation test and are thus kept in the final morphologically selected sample of ETGs. Left and right panels are for galaxies brighter and fainter than M�
B ,respectively. The values of M�
B are derived from the Schechter fits to the LFs of the morphologically selected sample (see text) and are given in the upper right corners ofthe diagrams.
TABLE 2
Overlap in the Galaxy Final Samples
z (Range)
Morpho in Photo
(%)
Photo in Morpho
(%)
0.2 < z � 0.4 ...................... 63 61
0.4 < z � 0.6 ...................... 54 55
0.6 < z � 0.8 ...................... 55 57
0.8 < z � 1.0 ...................... 65 54
Note.—Listed are, split in the four redshift bins, the fraction of morpholog-ically selected galaxies present in the photometrically selected sample, and the frac-tion of photometrically selected galaxies present in the morphologically selectedsample.
SCARLATA ET AL.502 Vol. 172
early-type morphologies, i.e., the combined sample of type 1+2.0galaxies, contribute from�45% at z ¼ 0:9 to�60% at z ¼ 0:3 tothe sample of photometrically selected ETGs. This compares tothe fraction of�58% at z ¼ 0 (Renzini 2006). Themajority of thegalaxies that are not classified as early-type type 1 or type 2.0 gal-axies have the morphology of disk-dominated, small-bulge galax-ies (�30% and 20% of ZEST types 2.1 and 2.2, respectively); theremaining few percent are almost equally split between bulgelessdisks (type 2.3) and irregular galaxies (type 3).
Bell et al. (2004a) presented the morphological distribution ofa sample of COMBO17 red sequenceYselected galaxies with red-shifts between 0:65 � z < 0:75. They find that, down to MV ¼�20:3, 85% of the combined rest-frame V-band luminosity den-sity comes from visually classified E/S0/Sa galaxies. A slightlysmaller fraction (75%) was found byMcIntosh et al. (2005) usingan automatic morphological classification for early-type galaxiesbased on the Sersic index n. When limiting the analysis of theCOSMOS data to the same bright cut inMV magnitude and con-sidering the same redshift range, we find that a similar fraction of�75% of the rest-frame V-band luminosity density comes fromtype 1þ 2:0 ETGs.
4.2.1. Kormendy Test Selection of the Photometric Sample
In principle, mergers of old stellar subunits ‘‘caught in the act’’could have irregular morphologies and not satisfy the Kormendytest described above.We nonetheless investigatewhich fraction ofthe photometrically selected sample is excluded on the basis ofthis test and which are the properties of the rejected objects.
In Figure 8 we show the Kormendy diagram for the photomet-rically selected sample of ETGs, split into the four redshift bins;symbols and lines are as in Figure 1. In this figure we also iden-tify all galaxies that have an irregular (ZEST type 3) morpho-logical classification by large black circles. Indeed, not all of thered-sequenceYselected galaxies are consistentwith passively evolv-ing into the Kormendy relation at redshift z ¼ 0. Interestingly,however, the vast majority of galaxies that are excluded on thebasis of the Kormendy criterion have a regular (ZEST type 1 or
2) morphology. This is illustrated in Figure 7 (right), where weshow themorphological mixture of photometrically selected gal-axies that do not pass the Kormendy test. Only up to �2% ofthese Kormendy testYrejected galaxies have the type 3 irregularmorphology. This is consistent with the rather short (<1 Gyr)timescales during which major dissipationless mergers appear asone irregular system. At all redshifts, the vast majority (>70%) ofKormendy testYrejected objects in the photometrically selected
Fig. 7.—Left: Fraction of photometrically selected early-type galaxies with different ZESTmorphological types (type 1+2.0: morphological early-type; 2.1Y2.3: disk-dominated spirals; 3: irregulars). Right: Results for the photometrically selected galaxies that do not pass the Kormendy test. To make the comparison among differentredshifts meaningful, we consider (in both panels) only galaxies brighter thanMB ¼ �18:16,�18.44,�18.72, and�19 at z ¼ 0:3, 0.5, 0.7, and 0.9, respectively. Resultsfor different redshift bins are shown in different colors.
Fig. 8.—Kormendy diagram for the sample of photometrically selected early-type galaxies of x 3.2. Large black circles identify galaxies with irregular morpho-logical classification (ZEST type 3). Red dots indicate galaxies with SEDs bestfitted by ZEBRAwith an elliptical-galaxy template; blue dots identify objects thatare fitted by ZEBRAwith a late-type galaxy template.
IS THERE A NEED FOR DRY MERGERS? 503No. 1, 2007

sample are disk-dominated galaxies. Therefore, when studyingthe redshift evolution of the LFs of plausible ETG progenitors, itseems appropriate to apply the Kormendy test rejection criterionalso to the photometrically selected sample, as already done forthe morphologically selected sample.We thus indicate with ‘‘finalphotometrically selected sample’’ the 2877 galaxies, selected ac-cording to the red sequence criterion described in x 3.2, that fur-thermore pass the Kormendy test. We nevertheless also show, inour analysis of the LFs, the results obtained when no Kormendyselection is performed on the galaxy samples under study.
4.3. The Combined Sample of Progenitors of z ¼ 0 Ellipticals
There is, obviously, overlap between the morphologically andphotometrically selected samples, as shown in Figures 5 and 7.We therefore also present, in the following, the analysis for the‘‘combined sample’’ of all plausible candidate ETGprogenitors ateach redshift, i.e., the union of the above-defined morphologicallyand photometrically selected samples. This combined samplecontains a total of 3980 galaxies; specifically, 1623 of the 2730galaxies in the final morphologically classified sample are alsomembers of the final photometrically classified sample (see Tables 1and 2).
4.4. Summary of the Selected Final Samples
For easy reference we summarize in Tables 1 and 2, as a func-tion of redshift, the number of galaxies contained in the morpho-logical, photometric, and combined final samples, and the relativefraction of galaxies in common between the morphological andphotometric samples.
5. THE REDSHIFT EVOLUTION OF THE LFOF EARLY-TYPE GALAXIES IN COSMOS
We derive the B-band LFs using the 1/Vmax estimator (Schmidt1968; Felten 1976): the number of galaxies per unit comovingvolume in the range of absolute magnitudes dM , at redshift z, andbelonging to the sample S can be written as
Z�S(M ; z) dM¼
XS
1
Vmax; i; ð3Þ
where the sum is over all galaxies in the sample S within thespecific range of redshift and absolute magnitude. HereVmax; i isthe maximum comoving volume within which a galaxy i couldstill be detected, given the apparent magnitude limits of the sur-vey, i.e., in our study, 16 � IAB � 24; the volume is appropriatelycorrected so as to account for the (small) fraction of objects thatwere excluded from the initial ACS-selected sample due to thelack of photometric redshifts. More specifically, Vmax; i is the co-moving volume between z1 and z2, computed, for each galaxy i,taking into account the k-correction as a function of redshift. Thez1 and z2 values are, respectively, the maximum between zL andz16, and the minimum between zU and z24; the limiting values zUand zL are the upper and lower redshifts, respectively, of the con-sidered redshift bin, and z24 and z16 are the redshifts at whichgalaxy i would have an IAB apparent magnitude of 24 and 16,respectively, for a given rest-frame B-band absolute magnitudeand color.
The 1/Vmax estimator approach does not correct for sourcesthat are missing from the input catalog due to selection effects. Inparticular, a catalog that is defined according to a magnitude cutin a given passband suffers from color-dependent selection effects(e.g., Lilly et al. 1995). In our IAB � 24 sample, blue objects aredetected down to fainter absolute B magnitudes for redshifts
higher than z � 0:8, i.e., the redshift at which the observer-frameI band coincides with the rest-frame B band; below z � 0:8, it isthe red objects that are instead detected to fainter absoluteBmagni-tudes. Correcting for this bias is not straightforward, as it requiresan assumption on the color distribution of the galaxy populationthat is missing from the sample. To avoid this potential source oferror, we therefore limit the computation of the LF in each redshiftbin to the luminosity range for which we are complete, regardlessof galaxy colors.In Figure 9 we show, split in four redshift bins, the LFs com-
puted for the different samples of ETGs described in the previoussections. Specifically, the green, red, and black curves represent,respectively, the final morphologically selected sample, the finalphotometrically selected sample (i.e., both after the Kormendytest cut), and the combined sample of all plausible progenitors ofz ¼ 0 ETGs, which are selected either due to their morphologyor due to their colors. The error bars in each luminosity bin takeinto account Poissonian errors only. In Appendix Awe discuss allother sources of errors and their affect on the LFs. In particular, weshow in the Appendix that our main conclusions are largely un-affected by uncertainties in the photometric redshift errors.In the four panels of Figure 9, we highlight the effects of cut-
ting the sample according to the Kormendy test. In particular weshow, with black open symbols and thin lines, the LFs resultingfrom the morphologically (solid line) and photometrically (dashedline) selected samples when the Kormendy relation constraint isnot applied. At all redshifts, the inclusion of galaxies that are re-jected on the basis of the Kormendy test would lead to a substan-tial increase in the number of ETGs at the faint end (MB > �20)of the LFs.Figure 9 shows that at all redshifts, the shape of the LFs of the
final morphologically and photometrically selected samples ofETGs are very similar. However, at magnitudes brighter than
Fig. 9.—LFs derived using the 1/Vmax formalism and the ZEBRA maximumlikelihood photometric redshifts. Green, red, and black show, respectively, themorphologically selected, photometrically selected, and combined sample ofCOSMOS early-type galaxies. The black open symbols and lines show the LFsderived without applying the Kormendy selection cuts (solid line:morphologicalsample; dashed line: photometric sample). The error bars indicate Poisson errorsonly. Note that the relatively high normalization factor in the lowest redshift bin isdue to the well-known overdensity in the central region of the COSMOS field.
SCARLATA ET AL.504 Vol. 172

MB � �21, morphologically selected, i.e., dynamically relaxed,early-type galaxies tend to be more numerous than photomet-rically selected, i.e., oldYstellar-population galaxies, by up to afactor of 2. In contrast, photometrically selected ETGs are morenumerous relative to the morphologically selected by about thesame factor at fainter magnitudes. From the lowest up to thehighest redshift bin, respectively, about 90% � 10% to 75% �10%of the final sample of photometrically selectedETGs brighterthan MB ¼ �21�1:4z also belong to the morphologically se-lected sample.
These results suggest that, at all redshifts under study, themajority of the most massive ETGs are already dynamically re-laxed systems with the appearance of z ¼ 0 elliptical galaxiesand their stellar populations are passively evolving, which is con-sistent with other features of the LFs that we discuss in x 6.
We fit a Schechter function (Schechter 1976) to the COSMOSLFs to derive for them an analytical description. The Schechterfunction best-fit parameters, i.e., the characteristic magnitudeM �
B , the volume density atM�B,��, and the slope of the faint end,
�, are derived adopting a �2 procedure. The best-fit parametersfor the Schechter fits are shown in Table 3. The relatively highnormalization factor in the lowest redshift bin is due to the well-known overdensity in the central region of the COSMOS field(which is also a reason for using the SDSS to determine thecosmic evolution of the LFs in the z ¼ 1 to 0window). In the fits,the faint-end slope� is allowed to vary, and�-values in the range0.1Y0.6 are derived, with formal 1 � errors of about �� 0:1;these values are different from the � � �0:6 value adopted by,e.g., Bell et al. (2004b). However, these values of � are derivedon the Kormendy-consistent samples and are therefore not di-rectly comparable with those used by other authors. The faint-end slope in the highest redshift bin is however not well defined,given the magnitude cut of our sample; furthermore, despite thevariations in �-values, all the measurements are consistent within
3 �with a constant faint-end slope. Thus, all in all, the analyticalfits quantitatively demonstrate the similarity, discussed above, ofthe LFs as a function of redshift.
5.1. The z ¼ 0 Comparison Sample
The volume of universe covered by the Cycle 12 COSMOSdata in the redshift range 0 < z � 0:1 is only �5:5 ; 103 Mpc3
and includes less than 50 galaxies; therefore, cosmic variance andsmall number statistics make this bin inadequate for comparisonswith the higher redshift bins to trace galaxy evolution down toz ¼ 0. Furthermore, the 0:2 < z � 0:4 redshift bin is affected by arelatively strong overdensity (Scoville et al. 2007b).
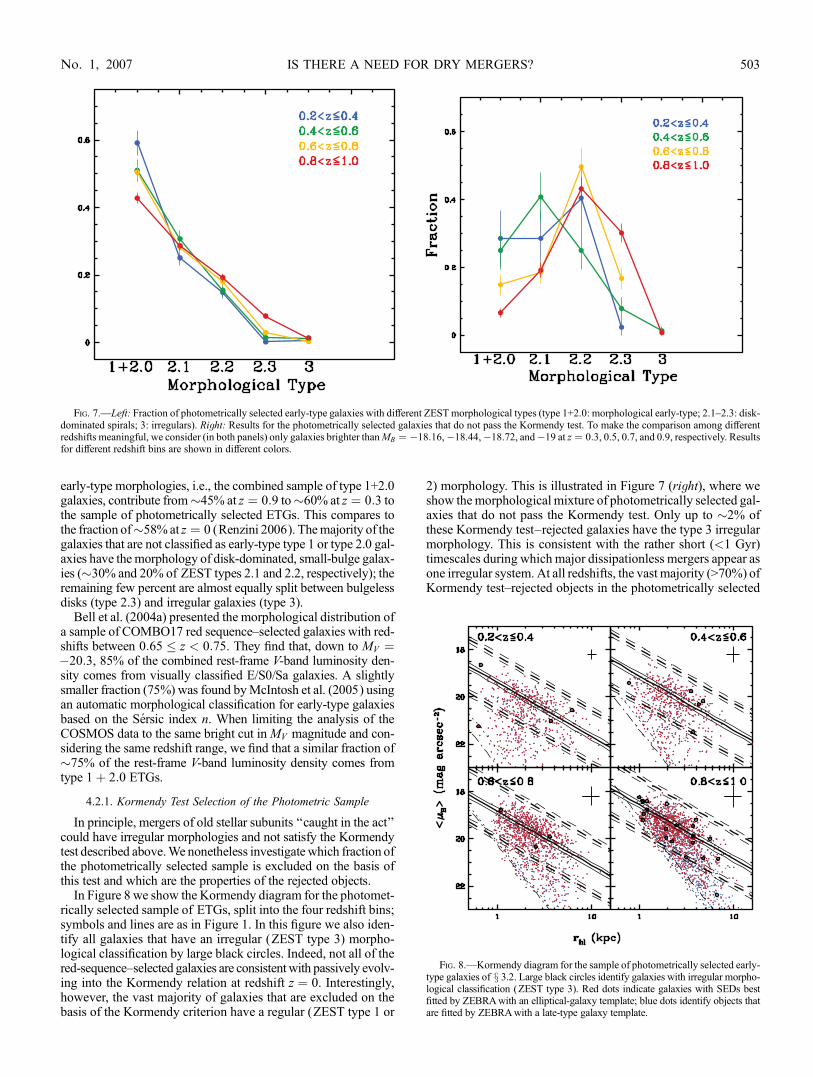
Therefore, following the approach described in Paper I, in or-der to study the evolution of the LFs from z � 1 to z ¼ 0, wecompare the COSMOS LFs with a complete sample of galaxiesextracted from the SDSS (York et al. 2000), appropriately red-shifted to z ¼ 0:7 so as to provide a direct calibration point forthe 0:6 < z � 0:8 COSMOS data. The generation of the red-shifted SDSS images is described in Kampczyk et al. (2007) andalso summarized in Paper I and in Appendix B. The SDSS red-shifted images were analyzed following a procedure identical tothat adopted for the COSMOS galaxies: (1) the SDSS galaxieswere morphologically classified with ZEST; (2) the photomet-rically selected sample of SDSS early-type galaxies was deter-mined according to the two-step procedure described in x 3.2;(3) the Kormendy cut was applied to both the photometric andmorphological samples of ETG progenitors; and (4) finally, theLFs for the morphologically selected, photometrically selected,and combined samples of redshifted SDSS ETGswere calculated,using the approach described in x 5. We stress that by applyingexactly the same procedure to the COSMOS and to the SDSSsamples, the same systematics apply to both the high-z and thelocal comparison sample. Thus, the direct comparison of the twoallows us to identify, without biases, any evolutionary effect of thegalaxy samples under study from z ¼ 0:7 to 0.
6. DISCUSSION
In Figure 10 we compare the 0:6 < z � 0:8 COSMOS LFs(solid lines) with the redshifted SDSS LFs (thick dashed lines)for the morphologically selected, photometrically selected, andcombined samples of ETGs. The thin dashed curves representthe SDSS LFs after brightening by�0.95 mag, i.e., the luminos-ity evolution from z ¼ 0:7 to 0 consistent with the observed evo-lution of the red sequence discussed in x 3.2.2.
At luminosities higher than�2:5L�Y3L� (i.e.,�1 mag brighterthanM �
B �20:7; see Table 3), the z � 0:7 COSMOS LF of thephotometrically selected sample of ETGs well matches the brightend of the corresponding SDSSLF, after applying the brighteningof 0.95mag. The number density of the brightest—and thus mostmassive—photometrically selected ETGs does not evolve fromredshift z ¼ 0:7 to redshift z ¼ 0.At faintermagnitudes, however,the number density of photometrically selected early-type galax-ies shows an increase of a factor of up to 3 from z � 0:7 to z ¼ 0.We stress that the sample of bright photometrically selected ETGsis not contaminated by dusty disks. Indeed, we found that thefraction of type 1+2.0 in the photometrically selected sampleof ETGs at redshift z ¼ 0:7 is �90% for galaxies brighter thanMB ¼ �21:7.
Broadly speaking, a similar result is also obtained for the mor-phologically selected and combined samples of early-type gal-axies. However, adopting an evolution similar to that above, thenumber density of the brightest, MB < �21:7 morphologicallyselected type 1+2.0 ETGs at z � 0:7 in the COSMOS field would
TABLE 3
Schechter Function Best-Fit Parameters
z (Range)
(1)
��
(Mpc�3 mag�1)
(2)
M�B
(mag)
(3)
�
(4)
Final Morphologically Selected Sample
0.2Y0.4 .......... 0.0025 � 0.0001 �20.34 � 0.10 0.28 � 0.11
0.4Y0.6 .......... 0.0010 � 0.0001 �20.38 � 0.12 0.64 � 0.12
0.6Y0.8 .......... 0.0014 � 0.0001 �20.70 � 0.07 0.60 � 0.09
0.8Y1.0 .......... 0.0013 � 0.0001 �20.76 � 0.12 0.42 � 0.13
Final Photometrically Selected Sample
0.2Y0.4 .......... 0.0025 � 0.0001 �20.22 � 0.12 0.12 � 0.13
0.4Y0.6 .......... 0.0010 � 0.0001 �20.14 � 0.10 0.43 � 0.13
0.6Y0.8 .......... 0.0013 � 0.0001 �20.55 � 0.08 0.38 � 0.09
0.8Y1.0 .......... 0.0017 � 0.0001 �20.62 � 0.07 0.21 � 0.10
Combined Sample
0.2Y0.4 .......... 0.0034 � 0.0001 �20.28 � 0.10 0.12 � 0.11
0.4Y0.6 .......... 0.0015 � 0.0001 �20.37 � 0.08 0.40 � 0.09
0.6Y0.8 .......... 0.0019 � 0.0001 �20.63 � 0.06 0.47 � 0.07
0.8Y1.0 .......... 0.0021 � 0.0001 �20.73 � 0.07 0.23 � 0.08
Notes.—Col. (1): redshift range; col. (2): Schechter function normalization��, and error; col. (3):M�
B , and error; col. (4): slope of the faint end, �, and error.The fits are performed on the finalmorphologically and photometrically selectedsamples, i.e., after the Kormendy test cut, and on the combined sample derivedfrom these final subsamples.
IS THERE A NEED FOR DRY MERGERS? 505No. 1, 2007

slightly exceed the number density of the brightened SDSS sam-ple. This suggests a faster luminosity evolution for the morpho-logically selected sample of ETGs, which is consistent with thelatter containing a fraction of galaxies with colors bluer than thosepredicted for a passively evolving stellar population (see x 4.1).These blue colors might arise from a substantial fraction of massin intermediate-age stars. However, a recent second burst of starformation, producing only a few percent of the stellar mass, wouldalso make the colors of the stellar population significantly bluerand increase the B-band luminosity of the galaxies.
For example, adding a 1%Y5% stellar mass in a second burstof star formation to an underlying old, single-burst populationwith formation redshift zf ¼ 2 is sufficient to explain the U� Vcolors of even the bluest morphologically selected ETGs at allredshifts under study. This suggests that the bulk of the stel-lar mass in all morphologically selected high-z ETGs is alreadyformed by z � 1. This is consistent with the other studies that wehave already mentioned, which find that z � 0:3Y0:75 galaxieswith M � 1011 M� have an integrated specific star formationrate less than the global value. These studies conclude that thebulk of star formation in massive galaxies occurs at early cosmicepochs and is largely complete by z �1:5, and that further massassembly in these galaxies takes place with low specific star for-mation rates (e.g., Dickinson et al. 2003; Papovich et al. 2006).
Furthermore, similar to the case of the photometrically selectedprogenitors of ETGs, the morphologically selected sample andthe combined sample of early-type galaxy progenitors also showa remarkable lack of evolution of the very bright end of their LF.Fainter early-type galaxies are instead again about a factor�2Y3less numerous than at z ¼ 0.
More quantitatively, we compute the total density of ETGsbrighter than 2:5L� in both the combined sample of COSMOSand SDSS ETGs. We indicate these two densities with �COSMOS
and �SDSS, respectively. The adopted value of L� is the one de-rived from the Schechter fit to the z ¼ 0:7 LF of the combined
sample (see Table 3). In order to compute �SDSS, we integrate theSDSS local LF brightened by 0.95 mag. Consistent with thequalitative analysis presented above, we find that
�COSMOS=�SDSS ¼ (2:32 � 0:17) ; 10�4
(2:38 � 0:20) ; 10�4¼ 0:97 � 0:11: ð4Þ
The density of L > 2:5L� ETGs remains constant, within thePoissonian errors, since z ¼ 0:7 to today. This conclusion mightin principle depend on the assumed amount of luminosity evo-lution (i.e., the SFH of the ETG population), on the cosmic var-iance, and on the effect of the photometric redshift uncertaintieson the LFs. As we discuss in Appendix A and x 5, Poissonianerrors at such bright magnitudes are, however, larger than theuncertainties on the LF induced by the errors on the photometricredshifts. Errors due to the photo-z can thus be neglected.The effect of cosmic variance on �COSMOS can be quantified
using the prescription of Somerville et al. (2004). We estimatethat, for the given density and COSMOS volume, this uncer-tainty contributes at most �25% to the error on �COSMOS. Weobtain a similar result by calculating the variance of the totalnumber of MB < �21:7, i.e., >2.5L�, galaxies in the 24 mockgalaxy catalogs generated by Kitzbichler et al. (2007) for theCOSMOS survey using the Millenium Run numerical simula-tions. The SDSS density, �SDSS, is not affected by cosmic var-iance, since the 1800 SDSS galaxies were chosen randomly in alocal volume larger than 2 ;105 Mpc3, and the derived SDSS LFclosely matches the Blanton et al. (2003) LF derived from the en-tire SDSS galaxy catalog (see further discussion in Kampczyket al. 2007).What causes the largest uncertainty in �SDSS is the assumed
luminosity evolution for the ETG stellar population. In the pre-vious analysis we have used the evolution of a single stellar pop-ulation formed at redshift zf ¼ 2, justified by the fact that thisSFH is consistent with the observed evolution of the red sequencezero point (see x 3.2.2). However, we can estimate the changes in-duced on �SDSS due to a reasonable range of SFHs and use them asmore realistic estimates of the errors on �SDSS. Although the rangeof observed d(M /L)/dz reported in the literature is broad (see,e.g., Table 2 in Treu et al. 2005 and references therein), a recentstudy by van Dokkum& van der Marel (2007) shows that stars inmassive ETGs (M >1011 M�), both in clusters and in the field,have a mean luminosity-weighted formation redshift of zf ¼2:01þ0:22
�0:17. For such massive galaxies, Thomas et al. (2005) showthat the star formation timescale is less than 1Gyr, which thereforemakes our zf a reasonable approximation for the measured value.This formation timescale, together with the error on zf presentedby vanDokkum&van derMarel (2007), can be used to derive theuncertainty on �SDSS due to varying the luminosity evolution ofthe ETGs. We find that an uncertainty in formation redshift of�zf ¼ 0:4 corresponds, roughly, to a �(MB) ¼ 0:1 at a red-shift z ¼ 0:7. It follows that the total density of MB ¼ �21:7 �0:1 ETGs in the combined sample is �SDSS ¼ (2:38 � 0:42) ;10�4 Mpc�3. It is clear, then, that the largest source of uncer-tainty on �SDSS is indeed due to the assumed SFH.Considering together the effects of cosmic variance and vary-
ing the SFHs, the ratio between the observed and predicted den-sity of massive ETGs at redshift z ¼ 0:7 is therefore �COSMOS/�SDSS ¼ 0:97 � 0:32. This shows that bright (L > 2:5L�) ETGsare already in place at z ¼ 0:7 and that the maximum evolutionin the number of bright ETGs allowed from z ¼ 0:7 to 0 is atmost of �30%.In contrast, there is indeed a dearth of lower luminosity ETGs
at z � 0:7 compared with the local universe. This deficiency of
Fig. 10.—Comparison of the SDSSLFs, redshifted to z ¼ 0:7 (open symbols,dashed lines), and the 0:6 < z � 0:8 COSMOS LFs ( filled symbols, solid lines),for the morphologically selected and photometrically selected samples, and forthe combined sample of ETGs. The SDSS LFs are shown also brightened by0.95mag, i.e., the amount consistent with the evolution of the red sequence in therest-frame U � V vs. MV color-magnitude diagram (thin dashed curves).
SCARLATA ET AL.506 Vol. 172

intermediate-to-faint ETGs is not an effect of incompleteness,since (1) in both themorphologically and photometrically selectedsamples, the deficit of early-type galaxies is visible at magnitudesMB � �21, i.e., well above our magnitude limit (MB � �18:5 atz ¼ 0:7); (2) the central wavelength of the F814W filter matchesthe rest-frame B band at z ¼ 0:8; this implies that, down to thefaintest magnitude bin considered, there are no color-dependentselection effects in the redshift range 0:6 < z < 0:8; (3) the ZESTclassification recovers the morphological class for �80% of thegalaxies down to IAB ¼ 23 (Paper I); furthermore, possible sys-tematics in the morphological classification are identical for theCOSMOS and for the local SDSS sample used to normalize ourresults.
Arguments for an apparent antihierarchical mass assembly ofETGs were recently presented based on the redshift evolution ofthe mass function (Bundy et al. 2005) and of the luminosity func-tion (Cimatti et al. 2006; Brown et al. 2007; Wake et al. 2006).Furthermore, enough star formation is observed in massive gal-axies at higher redshifts to account for all stars that we observealready assembled in massive galaxies by z � 1 (Daddi et al.2005). Our morphological selection of ETGs adds to this picturethe key information that not onlywas the full mass assembly of themost massive ETGs completed at an earlier cosmic time comparedto the less massive galaxies, but also that the majority of thesesystems achieved dynamical relaxation by z �1. A relatively largefraction of the less massive early-type galaxies have either not yetachieved relaxation at the redshift (epoch) at which they are ob-served or not completed their star formation.
7. CONCLUDING REMARKS
We highlight our three main results: (1) the shapes of the LFsof morphological, photometric, and combined samples of ETGprogenitors at all redshifts are remarkably similar; (2) the vastmajority of photometrically selected massive ETGs are already
dynamically relaxed—and thus have the morphology of an early-type galaxy—at redshifts z � 1; and (3) there is a deficiency ofapproximately <2L� ETGs, as opposed to remarkable constancyof the bright end (L > 2:5L�) of the LFs of morphologically andphotometrically defined ETGs.
These findings support a scenario in which the brightest, mostmassive early-type galaxies are already fully assembled �8 Gyrago, while fainter, less massive early-type galaxies keep formingtheir stars and assembling their mass from z ¼ 0:7 to the present.This trend in the observed evolution of the LFs of early-type gal-axies, together with the observed constancy with redshift of theLFs’ shapes, argues against a significant contribution of dry merg-ers in the buildup of the z ¼ 0 massive ETG population. Fur-thermore, we suggest that the z ¼ 0 lower luminosity early-typegalaxies are the end product of the conversion of blue irregularand disk galaxies into ‘‘red,’’ early-type galaxies. This explana-tion is also supported by the observed increase of about a factorof 3 in the number density of irregular galaxies from the localuniverse to z ¼ 0:7 (Paper I).
We thank the anonymous referee for the careful reading of themanuscript and the comments that helped to improve the presen-tation and discussion of our results. TheHST COSMOS Treasuryprogram was supported through NASA grant HST-GO-09822.We gratefully acknowledge the contributions of the entire COSMOScollaboration.More information on the COSMOS survey is avail-able at http://cosmos.astro.caltech.edu/. We thank the NASAIPAC/IRSA staff for providing online archive and server capa-bilities for the COSMOS data sets. T. Lisker is acknowledged forhelping with a preliminary reduction of a fraction of the ground-based near-infrared data. C. S. acknowledges support from theSwiss National Science Foundation.
Facilities: HST (ACS)
APPENDIX A
IMPACT OF PHOTO-z UNCERTAINTIES ON LFs
Feldmann et al. (2006) estimated the quality of the photometric redshifts by comparisonwith spectroscopic redshifts for a sample of866 galaxies observed within the z-COSMOS survey (Lilly et al. 2007). The comparison shows that the ZEBRA photometric red-shifts have an accuracy of �z / 0:027(1þ z) for galaxies brighter than IAB ¼ 22:5 and with redshift z � 1:2. In order to estimate theaccuracy at magnitudes fainter than IAB ¼ 22:5, we simulated a faint version of the spectroscopic redshift catalog by dimming the IAB �22:5 galaxies with available spectroscopic redshift down to our magnitude limit of IAB ¼ 24. We then recomputed the ZEBRA photo-metric redshifts for these artificially fainted sources. The accuracy of the ZEBRA photo-z’s down to IAB ¼ 24 is �/(1þ z) � 0:06.
To estimate the effect of the photometric uncertainties on the calculation of the LFs, we create 100 versions of the COSMOS cat-alog, by convolving themeasured photometric redshift with the photometric redshift error appropriate for themagnitude of each object.Weconsider two bins ofmagnitude: for all galaxieswith IAB � 22:5 we used�z ¼ 0:03(1þ z), while we use �z ¼ 0:06(1þ z) for all galaxieswith 22:5 < IAB � 24:0. Although the photometric redshift errors should be applied to an ‘‘error-free’’ catalog, our test provides aconservative estimate of how important the effects of the photometric redshift errors are on the observed LFs.
Using the simulated COSMOS catalogs we extracted 100 versions of the morphologically and photometrically selected samples ofETGs, following the procedures described in xx 3.1 and 3.2. We computed the LFs for these 100 resimulated samples using theprocedure described in x 5.
In Figure 11 we present the results of this test in the redshift range 0:6 < z � 0:8. This is the redshift range that we use to derive themain conclusions of our paper. In Figure 11 filled circles with error bars represents the LF computed using the ‘‘true’’ photometricredshifts, and the open circles represent the median of the 100 realizations. The shaded gray area associated with the simulated volumedensities represents the 16th and 84th percentiles of the simulated distributions within each magnitude bin. Figure 11 shows that thedominant effect of the redshift uncertainty is at the faint end of the LF, where the number of galaxies are systematically higher in theerror-convolved LFs. This effect is stronger in the color-selected samples than in the morphologically selected one.
At the bright end, the only significant effect is for very bright magnitudes (MB < �23, i.e., L > 10L�), where we would over-estimate the number of galaxies. Indeed, in the simulations we find 1Y2 galaxies with these magnitudes in 8 of the 100 mock realizations.These results are consistent with those of Brown et al. (2007), who performed similar simulations and find that the effect of pho-tometric redshift errors on the LF is only significant forMB � 5 log h < �22:5. We note, however, that no such galaxies are observed
IS THERE A NEED FOR DRY MERGERS? 507No. 1, 2007
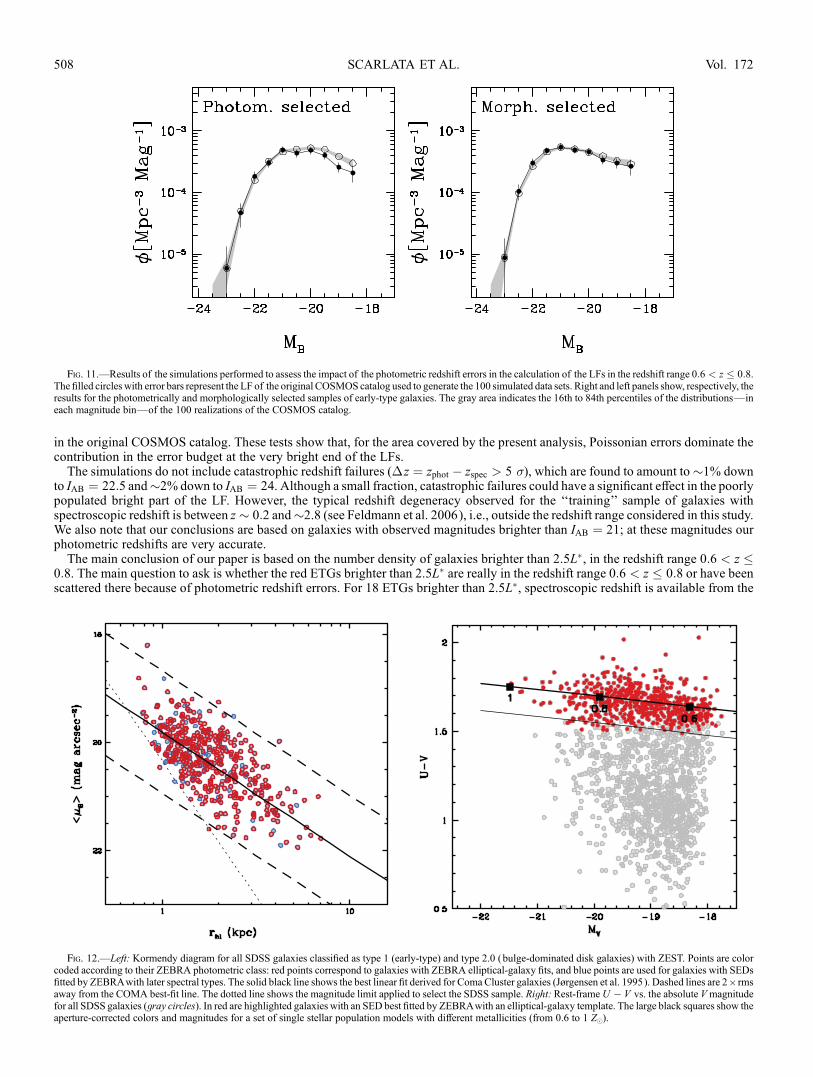
in the original COSMOS catalog. These tests show that, for the area covered by the present analysis, Poissonian errors dominate thecontribution in the error budget at the very bright end of the LFs.
The simulations do not include catastrophic redshift failures (�z ¼ zphot � zspec > 5 �), which are found to amount to�1% downto IAB ¼ 22:5 and�2% down to IAB ¼ 24. Although a small fraction, catastrophic failures could have a significant effect in the poorlypopulated bright part of the LF. However, the typical redshift degeneracy observed for the ‘‘training’’ sample of galaxies withspectroscopic redshift is between z � 0:2 and�2.8 (see Feldmann et al. 2006), i.e., outside the redshift range considered in this study.We also note that our conclusions are based on galaxies with observed magnitudes brighter than IAB ¼ 21; at these magnitudes ourphotometric redshifts are very accurate.
The main conclusion of our paper is based on the number density of galaxies brighter than 2.5L�, in the redshift range 0:6 < z �0:8. The main question to ask is whether the red ETGs brighter than 2.5L� are really in the redshift range 0:6 < z � 0:8 or have beenscattered there because of photometric redshift errors. For 18 ETGs brighter than 2.5L�, spectroscopic redshift is available from the
Fig. 11.—Results of the simulations performed to assess the impact of the photometric redshift errors in the calculation of the LFs in the redshift range 0:6 < z � 0:8.The filled circles with error bars represent the LF of the original COSMOS catalog used to generate the 100 simulated data sets. Right and left panels show, respectively, theresults for the photometrically and morphologically selected samples of early-type galaxies. The gray area indicates the 16th to 84th percentiles of the distributions—ineach magnitude bin—of the 100 realizations of the COSMOS catalog.
Fig. 12.—Left: Kormendy diagram for all SDSS galaxies classified as type 1 (early-type) and type 2.0 (bulge-dominated disk galaxies) with ZEST. Points are colorcoded according to their ZEBRA photometric class: red points correspond to galaxies with ZEBRA elliptical-galaxy fits, and blue points are used for galaxies with SEDsfitted by ZEBRAwith later spectral types. The solid black line shows the best linear fit derived for Coma Cluster galaxies (Jørgensen et al. 1995). Dashed lines are 2 ; rmsaway from the COMA best-fit line. The dotted line shows the magnitude limit applied to select the SDSS sample. Right: Rest-frameU � V vs. the absolute Vmagnitudefor all SDSS galaxies (gray circles). In red are highlighted galaxies with an SED best fitted by ZEBRAwith an elliptical-galaxy template. The large black squares show theaperture-corrected colors and magnitudes for a set of single stellar population models with different metallicities (from 0.6 to 1 Z�).
SCARLATA ET AL.508 Vol. 172
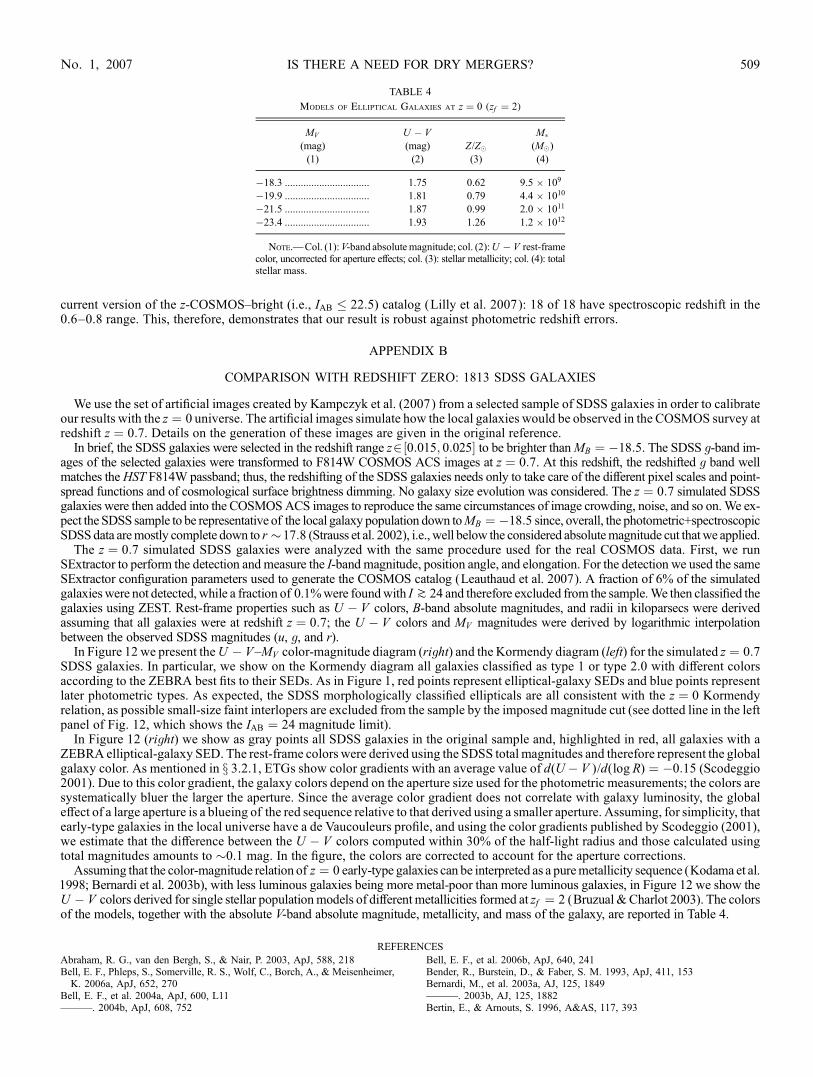
current version of the z-COSMOSYbright (i.e., IAB � 22:5) catalog (Lilly et al. 2007): 18 of 18 have spectroscopic redshift in the0.6Y0.8 range. This, therefore, demonstrates that our result is robust against photometric redshift errors.
APPENDIX B
COMPARISON WITH REDSHIFT ZERO: 1813 SDSS GALAXIES
We use the set of artificial images created by Kampczyk et al. (2007) from a selected sample of SDSS galaxies in order to calibrateour results with the z ¼ 0 universe. The artificial images simulate how the local galaxies would be observed in the COSMOS survey atredshift z ¼ 0:7. Details on the generation of these images are given in the original reference.
In brief, the SDSS galaxies were selected in the redshift range z2½0:015; 0:025� to be brighter thanMB ¼ �18:5. The SDSS g-band im-ages of the selected galaxies were transformed to F814W COSMOS ACS images at z ¼ 0:7. At this redshift, the redshifted g band wellmatches theHST F814W passband; thus, the redshifting of the SDSS galaxies needs only to take care of the different pixel scales and point-spread functions and of cosmological surface brightness dimming. No galaxy size evolution was considered. The z ¼ 0:7 simulated SDSSgalaxies were then added into the COSMOSACS images to reproduce the same circumstances of image crowding, noise, and so on.We ex-pect the SDSS sample to be representative of the local galaxy population down toMB ¼ �18:5 since, overall, the photometric+spectroscopicSDSSdata aremostly complete down to r �17:8 (Strauss et al. 2002), i.e., well below the considered absolutemagnitude cut thatwe applied.
The z ¼ 0:7 simulated SDSS galaxies were analyzed with the same procedure used for the real COSMOS data. First, we runSExtractor to perform the detection and measure the I-band magnitude, position angle, and elongation. For the detection we used the sameSExtractor configuration parameters used to generate the COSMOS catalog (Leauthaud et al. 2007). A fraction of 6% of the simulatedgalaxieswere not detected, while a fraction of 0.1%were foundwith I k 24 and therefore excluded from the sample.We then classified thegalaxies using ZEST. Rest-frame properties such as U � V colors, B-band absolute magnitudes, and radii in kiloparsecs were derivedassuming that all galaxies were at redshift z ¼ 0:7; the U � V colors and MV magnitudes were derived by logarithmic interpolationbetween the observed SDSS magnitudes (u, g, and r).
In Figure 12 we present theU � VYMV color-magnitude diagram (right) and the Kormendy diagram (left) for the simulated z ¼ 0:7SDSS galaxies. In particular, we show on the Kormendy diagram all galaxies classified as type 1 or type 2.0 with different colorsaccording to the ZEBRA best fits to their SEDs. As in Figure 1, red points represent elliptical-galaxy SEDs and blue points representlater photometric types. As expected, the SDSS morphologically classified ellipticals are all consistent with the z ¼ 0 Kormendyrelation, as possible small-size faint interlopers are excluded from the sample by the imposed magnitude cut (see dotted line in the leftpanel of Fig. 12, which shows the IAB ¼ 24 magnitude limit).
In Figure 12 (right) we show as gray points all SDSS galaxies in the original sample and, highlighted in red, all galaxies with aZEBRA elliptical-galaxy SED. The rest-frame colors were derived using the SDSS total magnitudes and therefore represent the globalgalaxy color. As mentioned in x 3.2.1, ETGs show color gradients with an average value of d(U� V )/d(log R) ¼ �0:15 (Scodeggio2001). Due to this color gradient, the galaxy colors depend on the aperture size used for the photometric measurements; the colors aresystematically bluer the larger the aperture. Since the average color gradient does not correlate with galaxy luminosity, the globaleffect of a large aperture is a blueing of the red sequence relative to that derived using a smaller aperture. Assuming, for simplicity, thatearly-type galaxies in the local universe have a de Vaucouleurs profile, and using the color gradients published by Scodeggio (2001),we estimate that the difference between the U � V colors computed within 30% of the half-light radius and those calculated usingtotal magnitudes amounts to �0.1 mag. In the figure, the colors are corrected to account for the aperture corrections.
Assuming that the color-magnitude relation of z ¼ 0 early-type galaxies can be interpreted as a puremetallicity sequence (Kodama et al.1998; Bernardi et al. 2003b), with less luminous galaxies being more metal-poor than more luminous galaxies, in Figure 12 we show theU � V colors derived for single stellar populationmodels of different metallicities formed at zf ¼ 2 (Bruzual & Charlot 2003). The colorsof the models, together with the absolute V-band absolute magnitude, metallicity, and mass of the galaxy, are reported in Table 4.
REFERENCES
Abraham, R. G., van den Bergh, S., & Nair, P. 2003, ApJ, 588, 218Bell, E. F., Phleps, S., Somerville, R. S., Wolf, C., Borch, A., & Meisenheimer,K. 2006a, ApJ, 652, 270
Bell, E. F., et al. 2004a, ApJ, 600, L11———. 2004b, ApJ, 608, 752
Bell, E. F., et al. 2006b, ApJ, 640, 241Bender, R., Burstein, D., & Faber, S. M. 1993, ApJ, 411, 153Bernardi, M., et al. 2003a, AJ, 125, 1849———. 2003b, AJ, 125, 1882Bertin, E., & Arnouts, S. 1996, A&AS, 117, 393
TABLE 4
Models of Elliptical Galaxies at z ¼ 0 (zf ¼ 2)
MV
(mag)
(1)
U � V
(mag)
(2)
Z/Z�(3)
M�(M�)
(4)
�18.3 ................................ 1.75 0.62 9.5 ; 109
�19.9 ................................ 1.81 0.79 4.4 ; 1010
�21.5 ................................ 1.87 0.99 2.0 ; 1011
�23.4 ................................ 1.93 1.26 1.2 ; 1012
Note.—Col. (1):V-band absolute magnitude; col. (2):U � V rest-framecolor, uncorrected for aperture effects; col. (3): stellar metallicity; col. (4): totalstellar mass.
IS THERE A NEED FOR DRY MERGERS? 509No. 1, 2007

Blanton, M. R., et al. 2003, ApJ, 594, 186Bower, R. G., Lucey, J. R., & Ellis, R. S. 1992, MNRAS, 254, 601Brown, M. J. I., et al. 2007, ApJ, 654, 858Bruzual, G., & Charlot, S. 2003, MNRAS, 344, 1000Bundy, K., Ellis, R. S., & Conselice, C. J. 2005, ApJ, 625, 621Capak, P., et al. 2007, ApJ, submittedCarollo, C. M., & Danziger, I. J. 1994a, MNRAS, 270, 523———. 1994b, MNRAS, 270, 743Carollo, C. M., Danziger, I. J., & Buson, L. 1993, MNRAS, 265, 553Cimatti, A., Daddi, E., & Renzini, A. 2006, A&A, 453, L29Coleman, G. D., Wu, C.-C., & Weedman, D. W. 1980, ApJS, 43, 393Daddi, E., et al. 2005, ApJ, 631, L13Dickinson, M., Papovich, C., Ferguson, H. C., & Budavari, T. 2003, ApJ, 587,25
Djorgovski, S., & Davis, M. 1987, ApJ, 313, 59Dressler, A., Faber, S.M., Burstein, D., Davies, R. L., Lynden-Bell, D., Terlevich,R. J., & Wegner, G. 1987, ApJ, 313, L37
Faber, S. M., et al. 2005, ApJ, submitted (astro-ph/0506044)Feldmann, R., et al. 2006, MNRAS, 372, 565Felten, J. E. 1976, ApJ, 207, 700Ferreras, I., Lisker, T., Carollo, C. M., Lilly, S. J., & Mobasher, B. 2005, ApJ,635, 243
Hogg, D. 2007, in The Fabulous Destiny of Galaxies: Bridging Past andPresent, ed. V. Le Brun et al. (Paris: Editions Frontieres), in press (astro-ph/0512029)
Jørgensen, I., Franx, M., & Kjærgaard, P. 1995, MNRAS, 273, 1097Kampczyk, P., et al. 2007, ApJS, 172, 329Kinney, A. L., Calzetti, D., Bohlin, R. C., McQuade, K., Storchi-Bergmann, T.,& Schmitt, H. R. 1996, ApJ, 467, 38
Kitzbichler, M. G., & White, S. D. M. 2007, MNRAS, 376, 2Kodama, T., Arimoto, N., Barger, A. J., & Aragon-Salamanca, A. 1998, A&A,334, 99
Koekemoer, A., et al. 2007, ApJS, 172, 196
Kormendy, J. 1977, ApJ, 218, 333Leauthaud, A., et al. 2007, ApJS, 172, 219Lilly, S., et al. 2007, ApJS, 172, 70Lilly, S. J., Tresse, L., Hammer, F., Crampton, D., & Le Fevre, O. 1995, ApJ,455, 108
Lin, L., et al. 2004, ApJ, 617, L9Lotz, J. M., Primack, J., & Madau, P. 2004, AJ, 128, 163Masjedi, M., et al. 2006, ApJ, 644, 54McIntosh, D. H., et al. 2005, ApJ, 632, 191Oke, J. B. 1974, ApJS, 27, 21Papovich, C., et al. 2006, ApJ, 640, 92Petrosian, V. 1976, ApJ, 209, L1Renzini, A. 2006, ARA&A, 44, 141Sargent, M., et al. 2007, ApJ, ApJS, 172, 434Scarlata, C., et al. 2007, ApJ, ApJS, 172, 406 (Paper I )Schechter, P. 1976, ApJ, 203, 297Schmidt, M. 1968, ApJ, 151, 393Scodeggio, M. M. 2001, AJ, 121, 2413Scoville, N., et al. 2007a, ApJS, 172, 1———. 2007b, ApJS, 172, 150Somerville, R. S., Lee, K., Ferguson, H. C., Gardner, J. P., Moustakas, L. A., &Giavalisco, M. 2004, ApJ, 600, L171
Springel, V., Frenk, C. S., & White, S. D. M. 2006, Nature, 440, 1137Strauss, M. A., et al. 2002, AJ, 124, 1810Taniguchi, Y., et al. 2007, ApJS, 172, 9Thomas, D., Maraston, C., Bender, R., & Mendes de Oliveira, C. 2005, ApJ,621, 673
Treu, T., et al. 2005, ApJ, 633, 174van Dokkum, P. G. 2005, AJ, 130, 2647van Dokkum, P. G., & van der Marel, R. P. 2007, ApJ, 655, 30Wake, D. A., et al. 2006, MNRAS, 372, 537York, D. G., et al. 2000, AJ, 120, 1579
SCARLATA ET AL.510