the regional water management group regional water management group ... gained a supply of imported...
TRANSCRIPT
Attachment 3 – Background
1
The Regional Water Management Group
The Regional Water Management Group (RWMG) is the Santa Ana Watershed Project Authority, or SAWPA. It was recognized as an accepted RWMG based on the determination of the California Department of Water Resources as part of the Region Acceptance Process conducted in 2009 and is shown on Table 1 – Round 1 Planning Eligible IRWM Regions from the 2009 RAP Decisions as an Approved Region. SAWPA is a joint powers authority focusing on a broad range of water resource issues including water supply reliability, water quality improvement, recycled water, wastewater treatment, groundwater management, brine disposal, and integrated regional planning. Its stated mission is to develop and maintain regional plans, programs, and projects that will protect the Santa Ana River basin water resources to maximize beneficial uses within the watershed in an economically and environmentally responsible manner. SAWPA consists of 18 staff members and serves at the direction of the SAWPA Commission that is composed of its five member agencies, all of which have statutory authority over water supply and water management in their service areas. These five agencies represent the majority of the water management authorities and stakeholders within the region boundary. SAWPA carries out functions useful to its five member agencies: Eastern Municipal Water District, Inland Empire Utilities Agency, Orange County Water District, San Bernardino Valley Municipal Water District, and Western Municipal Water District. The jurisdiction of SAWPA and its member agencies span most of the Santa Ana River Watershed, encompassing much of Orange County, a sliver of Los Angeles County, and the major population centers of western Riverside and southwestern San Bernardino Counties. Each of these agencies described below plans and executes long-term projects and management programs of their own; however, it is primarily the agencies working through SAWPA that provide the vehicle for effective and concerted planning efforts on a regional basis.
Eastern Municipal Water District (EMWD)
EMWD is a retail water agency servicing an area of approximately 555 square miles in western Riverside County. EMWD serves a population of approximately 675,000 in six incorporated cities and unincorporated portions of western Riverside County. In addition to its role as a retail agency, it also provides wholesale water to the sub-agencies Lake Hemet Municipal Water District, City of Hemet, City of San Jacinto, City of Perris, Nuevo Water Company, Elsinore Valley Municipal Water District, and Rancho California Water District.
As a member agency of the Metropolitan Water District of Southern California (MWD), EMWD gained a supply of imported water from the Colorado River Aqueduct and ultimately, water from northern California through the State Water Project, which transports water from Northern
Background Section
Attachment 3 – Background
2
California via the California Aqueduct. EMWD’s initial mission was to deliver imported water to supplement local groundwater supplies. Over time, EMWD’s role changed as additional agency responsibilities were added. These included groundwater production and resource management, wastewater collection and treatment, and finally regional water recycling.
Inland Empire Utilities Agency (IEUA)
IEUA’s service area covers about 242 square miles in the southwestern corner of San Bernardino County, and serves a population of approximately 800,000. IEUA provides regional wastewater service and imported water deliveries to eight contracting agencies. These include the City of Chino, City of Chino Hills, Cucamonga Valley Water District (CVWD), City of Fontana, City of Montclair, City of Ontario, City of Upland, and Monte Vista Water District.
As a member agency of MWD, IEUA provides supplemental water, as well as regional wastewater treatment for both domestic and industrial clients and energy recovery/production facilities. In addition, the Agency has become a recycled water purveyor, biosolids/fertilizer treatment provider, and continues to focus on water supply salt management for the purpose of protecting the regions vital groundwater supplies.
Orange County Water District (OCWD)
OCWD service area covers more than 350 square miles, and the Orange County Groundwater Basin. The basin provides a water supply to more than 20 cities and water agencies, serving over 2.3 million people. OCWD owns 1,600 acres in and near the Santa Ana River in Anaheim and Orange, which it uses to capture
flows and recharge the groundwater basin. OCWD also owns 2,400 acres above Prado Dam, which it uses for water conservation and water quality improvement.
OCWD’s mission is to manage and protect the Orange County Groundwater Basin in northern and central Orange County. The groundwater basin supplies approximately two-thirds of the water used by over two million residents in this District's service area. The balance is imported from the Colorado River and from northern California through the Sacramento/San Joaquin Delta State Water Project by MWD.

Attachment 3 – Background
3
San Bernardino Valley Municipal Water District (SBVMWD)
SBVMWD’s service area covers about 325 square miles primarily in southwestern San Bernardino County with a very small portion of its service area in Riverside County. The area within SBVMWD includes a population of around 600,000. SBVMWD spans the eastern two-thirds of the San Bernardino Valley, the Crafton Hills, and a portion of the Yucaipa Valley. It also includes the cities and communities of San Bernardino, Colton, Loma Linda, Redlands, Rialto, Bloomington, Highland, Grand Terrace, and Yucaipa. SBVMWD’s mission is to import water into its service area through participation in the California State Water Project. SBVMWD also is charged with managing groundwater and surface water within its boundaries through various court judgments.
Western Municipal Water District (WMWD)
WMWD’s service area covers a 527 square mile area of western Riverside County with a population of about 825,000 people. WMWD serves more than 24,000 retail and eight wholesale customers with water from both the Colorado River and the State Water Project. As a member agency of MWD, WMWD provides supplemental water to the cities of Corona, Norco, and Riverside and the water agencies of Box Springs, Lee Lake, Elsinore Valley, and Rancho California. Additionally, it serves customers in the unincorporated areas of El Sobrante, Eagle Valley, Temescal Creek, Woodcrest, Lake Mathews, and March Air Reserve Base. WMWD also operates and maintains domestic and industrial wastewater collection and conveyance systems for retail and contract services customers in Lake Hills, March Air Reserve Base, Home Gardens, Corona, and Norco.
About one-fifth of the water that WMWD purchases from the MWD comes from the Colorado River Aqueduct and about four-fifths from the State Water Project, which transports water from northern California via the California Aqueduct. WMWD currently imports a small quantity of water from the San Bernardino Basin and intends to increase these imports with the implementation of the Riverside-Corona Feeder project. WMWD also has several wells for pumping in its Murrieta Division.
As a regional water agency for the Santa Ana River (SAR) Watershed, SAWPA has had a long history of supporting and developing integrated regional water management plans. Under its 2002 Santa Ana Integrated Watershed Plan, SAWPA staff wrote and prepared much of the three-volume document and also administered consultant services in some support roles. Extensive outreach was conducted by SAWPA staff and its consultants with stakeholders throughout the watershed. Collaborative outreach meetings were held in multiple locations throughout the watershed to assure that input was obtained and included in the Plan. This role was repeated with the June 2005

Attachment 3 – Background
4
Update. The report was prepared almost entirely by SAWPA staff with extensive outreach similar to the 2002 effort.
IRWM Plan Adoption
SAWPA and all its member agencies have adopted the SAWPA Integrated Regional Water Management Plan in June 2005, as required as part of the Proposition 50 IRWM Implementation Program. The next IRWM Plan was commenced on February 2007, and a draft plan was completed on January 29, 2009. The current IRWM Plan is called the SAR Watershed “One Water One Watershed (OWOW)” Integrated Regional Water Management Plan. This plan expands the collaboration even more extensively than past IRWM planning efforts by using a bottom-up approach for inclusive stakeholder driven planning of water resources. By this, we mean that unlike previous SAWPA IRWM plans or other IRWM planning approaches across the State, every effort has been made to allow the key discussions of major water resource issues, concerns, problems, goals and objectives, and potential solutions to originate and be first fully vetted at the stakeholder level – the stakeholders being the local agencies, organizations, and other interested parties within the SAR Watershed. By expanding the involvement and collaboration to the on-the-ground level, greater buy-in and support were expected and realized for this planning development process. It is anticipated that the current OWOW Plan will be finalized and adopted by the RWMG, SAWPA, on December 7, 2010.
Role of SAWPA in the RWMG
Under the current IRWM Plan, the OWOW Plan, SAWPA staff serves in providing administrative and facilitative assistance to water resource management working groups called OWOW Pillar groups and the OWOW Steering Committee for the overall OWOW plan development. This role includes the hiring and managing of consultant services to support the planning and project selection criteria development process. In addition, SAWPA provides computer tools to assist the Steering Committee and Pillars in decision-making processes, provides planning documents to allow Pillars to build upon previous existing plans, and performs significant public outreach and education about the integrated planning approach for the SAR Watershed.
The majority of the initial work of the OWOW process was done by planning Pillars or subject area groups. Each group was led by a subject area expert or Pillar leader who was responsible in leading and guiding the work efforts of a large working group or Pillar. As work progressed and outreach activities continued, SAWPA provided names of interested parties and contacts to the Pillar leader. In addition, the Pillar leaders brought their own list of potential participants to the process that could lend expertise to the topic development. Staff experts from each of the SAWPA member agencies served as Pillar chairs along with several other organizations and non-profit organization experts. The knowledge and contacts of the Pillar committees provided an important link to watershed stakeholders.

Attachment 3 – Background
5
Other Stakeholders involved in RWMG
The list of stakeholders involved in our most recent integrated regional water management planning is one of the most extensive ever taken by any regional water management group. The master contacts database includes a rather diverse base of over 4,000 stakeholders. The focus of the database is to include those entities having an interest in water and representatives from cities located within the Watershed. It includes representatives from 120 agencies associated with water, including flood control, water conservation districts, and water supply agencies. It also includes representatives from the 61 incorporated cities within the watershed, including mayors, key department heads, city council members, and planning commissioners. The database also includes an up-to-date list of members of the California legislature.
Also included are representatives from county, state, and federal government; Indian Tribes; the real estate community; members of the environment and environmental justice, agricultural and development communities; consultants; trade associations; academia; media; non-profit organizations; and others simply interested in water. A complete list is shown below. Where additional or different contacts were made, these are described below as well.
The working relationship in the development of the IRWM Plan was overall very positive, collaborative and in many cases, long term. Through SAWPA’s long history of administering collaborative working groups and task forces, a strong working relationship has been built with the many entities listed below. The primary approach of input under the OWOW planning process was through the Pillar groups. Outreach to encourage involvement and participation included town hall meetings, presentations, email announcements, web-based interactive tools, blog forums, newsletters, and podcasts.
OWOW Governance
In developing the OWOW Integrated Regional Water Management (IRWM) Plan for the SAR Watershed, a decided “bottom-up” approach was envisioned for governance, as opposed to a “top down” approach. At the core of this approach was that unlike previous SAWPA IRWM plans or other IRWM planning approaches across the State, every effort has been made to allow the key discussions of major water resource issues, concerns, problems, goals and objectives, and potential solutions to originate and be fully vetted at the stakeholder level first – the stakeholders being the local agencies, organizations and other interested parties within the SAR Watershed. By expanding the involvement and collaboration of stakeholders at the “on-the-ground” level, it was possible to incorporate the deeper understanding of local issues afforded by stakeholders, and generate greater buy-in and support.
Consequently, if one were to ask where the governance for the SAR Watershed OWOW process originates, we believe it is at the grass-roots level, the foundation of a decentralized and collaborative “big tent” approach.

Attachment 3 – Background
6
OWOW governance takes place at several levels:
• Involvement from the watershed community at large through the creation of ten working groups (referred to as Pillars) representing different water issues, and in charge of identifying issues, proposing potential solutions, and writing the OWOW Plan.
• The formation of a Steering Committee composed of elected officials and representatives from water districts, the private sector, the environmental community, and the regulatory community, tasked with the development of the goals and objectives of the plan, strategic decision-making, project prioritization, and issuing recommendations.
• Oversight of the OWOW process by the SAWPA Commission to ensure a fair and transparent process. SAWPA administration and staff in charge of facilitating this bottom-up approach to watershed planning.
• Additional open public participation through a series of public workshops and meetings, as well as open sessions of the Steering Committee and SAWPA Commission in which the OWOW process was discussed.
Pillars
In order to manage the initial planning work, the stakeholders were organized into ten workgroups, or Pillars, centered on specific water resource management issue. These ten areas are aligned with the Resource Management Strategies identified in the Proposition 84 Guidelines, as summarized in the following table.
Pillar Group Corresponding Proposition 84 Guidelines Resource Management Strategies
Land Use and Water Increase water supply Improve water quality Practice resource stewardship
Water Supply Reliability Reduce water demand Improve operational efficiency and transfers Increase water supply
Water Recycling Increase water supply Improve water quality
Water Use Efficiency Reduce water demand
Water Quality Improve water quality
Environmental and Habitat Restoration Practice resource stewardship
Stormwater Risk Assessment Improve flood management
Environmental Justice Included in Guidelines as part of Impact and Benefit Standard
Parks and Open Space Not explicitly mentioned in Guidelines
Climate Change Included in Guidelines as separate standard
Table 1 - The Ten Pillars

Attachment 3 – Background
7
The Pillar categories were chosen based upon a review of water resource management strategies defined in the California Department of Water Resources (DWR) State Water Plan, previous DWR guidelines for IRWMP development, and local water resource needs.
The Pillars consisted of approximately ten to 60 volunteers depending on the topic and interest level. The volunteers included participants from local agencies, special districts, non-profit organizations, university officials, Native American Tribes, and private citizens. Each Pillar was led by a volunteer with expertise in the water issue assigned to each particular group. The leaders were selected by the SAWPA Commission and approved by the Steering Committee, and were responsible for working with their groups in organizing, leading, and facilitating the planning process for their particular topic. At the end of the process, each Pillar group prepared a chapter of the Plan, documenting current conditions and issues, and describing current and future watershed management strategies. In addition to identifying issues and potential strategies for their particular area of interest, the Pillars were asked to view the watershed problems from a multidisciplinary perspective that extended beyond their topic, and to consider other Pillars’ perspectives. For example, the Water Supply Pillar had to keep into consideration environmental and habitat restoration issues when developing their strategies. Through this process, synergies were developed and multi-benefit programs were identified. For example, through this approach, it was possible to incorporate the understanding that many downstream water resource and water quality problems could be more effectively and efficiently addressed upstream at the source, thus requiring collaboration with other entities. Over time, this process of collaboration among the Pillar groups provided a more unified vision that resulted in new integrated and multi-beneficial solutions to water resource challenges, and that increased collaboration among jurisdictions and geographies.
Another role of the Pillars was to provide support and input to the Steering Committee about the OWOW goals and objectives, based on their technical expertise in various water resource fields and their local knowledge.
It is important to point out that the planning approach taken for the development of this plan transcends previous integrated regional water resource planning efforts by deemphasizing planning solely as a prerequisite for an impending grant funding opportunity or for the development of a list of specific projects. Rather, the emphasis was placed on building a collaborative approach amongst stakeholders to help meet long-term (2030 time horizon) goals and objectives in an integrated and multi-beneficial manner.
After the completion of the Plan, the Pillar groups will continue meeting to explore new opportunities for collaboration.

Attachment 3 – Background
8
Steering Committee
The next level of governance up from the foundation of the Pillars was the OWOW Steering Committee. The Committee, consisting of 11 representatives from throughout the watershed, was convened by the SAWPA Commission and included:
• 2 representatives from the SAWPA Commission, representing water agencies, who serve as Convener and Vice-Convener
• 3 County Supervisors - one from each county
• 3 mayors - from large cities in each county
• 1 business representative from the development community
• 1 representative from the environmental community
• 1 Regional Water Quality Control Board Member
The Steering Committee’s role is to serve as the developer of integrated regional water management goals and objectives for the watershed and to act as the oversight body that performs strategic decision making, crafts and adopts programmatic suites of project recommendations, and provides program advocacy necessary to optimize water resource protection for all.
Furthermore, through the Steering Committee, the public-at-large can voice its opinion during its public meetings. Public meetings are held at least quarterly and are conducted in accordance with the Ralph M. Brown Act.
The Steering Committee members serve a term of two years under their committee role. If a Steering Committee representative is termed out of office or resigns from the office seat, the representative may continue in the assigned Steering Committee role until the two-year term expires, if requested by the Steering Committee. Steering Committee members may be appointed for multiple terms.
SAWPA Administration
The other arm to the governance of the OWOW process includes the management function conducted by the SAWPA. As a regional water agency for the SAR Watershed, SAWPA has a long history of supporting regional collaborative efforts of this kind. As with previous IRWMP efforts for the SAR Watershed, SAWPA serves as support in providing administrative, facilitative and oversight assistance to the Pillar groups and the Steering Committee for the overall OWOW Plan development. Further, SAWPA provides computer tools to assist the Steering Committee and Pillars in decision-making processes, provides planning documents to allow Pillars to build upon previous existing plans, and performs significant public outreach and education about the integrated planning approach for the SAR Watershed.

Attachment 3 – Background
9
As the administrator of OWOW and the RWMG for the SAR Watershed, SAWPA worked closely with several sub-regional IRWM planning efforts in the watershed that took place prior to, or concurrent with, the OWOW planning process. Of particular interest was the need to assure that proper coordination and incorporation of the excellent work conducted by the sub-regional IRWM planning groups was included in the OWOW Plan. SAWPA staff conducted outreach to all stakeholders of the sub-regional IRWM planning efforts, and invited their stakeholders to participate in the Pillar processes. In some cases, SAWPA staff even participated in the sub-regional IRWM planning process. Where sub-regional IRWM plans were previously completed, these plans were shared with the Pillars to serve as background material to their Pillar planning efforts. In all cases, SAWPA took a lead role in coordinating the IRWM lead agencies to assure that their planning work would be folded into the OWOW watershed-wide process as seamlessly as possible. It is understood that the Steering Committee will be responsible for the development and implementation of the project selection criteria. As funding opportunities arise to implement the OWOW Plan, the Steering Committee will provide to the SAWPA Commission an updated SAR Watershed IRWM plan and programmatic portfolio of projects specific to the funding opportunity. The SAWPA Commission will review the plan and programmatic project portfolio to ensure that these fulfill the intent and requirements of the specific funding mechanism, any legislative bill authorizing the funding, all legal requirements as defined by the funding administrative agency, and equitable application of the benefits of the project portfolio across the entire region. Review of these items and the project selection process will be conducted by the SAWPA Commission in a public hearing open to all interested stakeholders. If the SAWPA Commission is unable to ratify a specific portfolio of projects, the Commission will send it back to the Steering Committee.
Thereafter, SAWPA serves as the State liaison for the Santa Ana Region, on behalf of the OWOW stakeholders, responsible for all final report submittals, plan adoption processes, grant application submittals, and administrative oversight for the Santa Ana OWOW IRWM Plan funding. The formation of this governance structure for the SAR Watershed IRWM group is anticipated to serve as a permanent structure for policy guidance in all future rounds of IRWM planning and implementation in the SAR Watershed and will facilitate the sustained development of the Santa Ana Region now and into the foreseeable future.

Attachment 3 – Background
10
The Region
The SAR Watershed drains a 2,650 square-mile area. The watershed is home to over six million people and includes the major population centers of parts of Orange, Riverside, and San Bernardino Counties, as well as a sliver of Los Angeles County.
The SAR flows over 100 miles and drains the largest coastal stream system in southern California. It discharges into the Pacific Ocean at the City of Huntington Beach. The total length of the SAR and its major tributaries is about 700 miles.
The watershed boundaries nearly match the boundaries of the Santa Ana Regional Water Quality Control Board, an organization with whom SAWPA has worked closely for many years. In addition, its boundaries match the IRWM region and the recognized Santa Ana Funding Area, as defined by the Proposition 84 IRWM Program. Although there are many sub-watershed planning efforts, OWOW attempts to bring all these efforts, as well as all different jurisdictions in the watershed, into a single watershed-wide vision. Over the years, SAWPA has participated in the development of sub-regional IRWM plans, with the understanding that such plans would be complementary to OWOW.
Geologic and Hydrologic Features of the Watershed
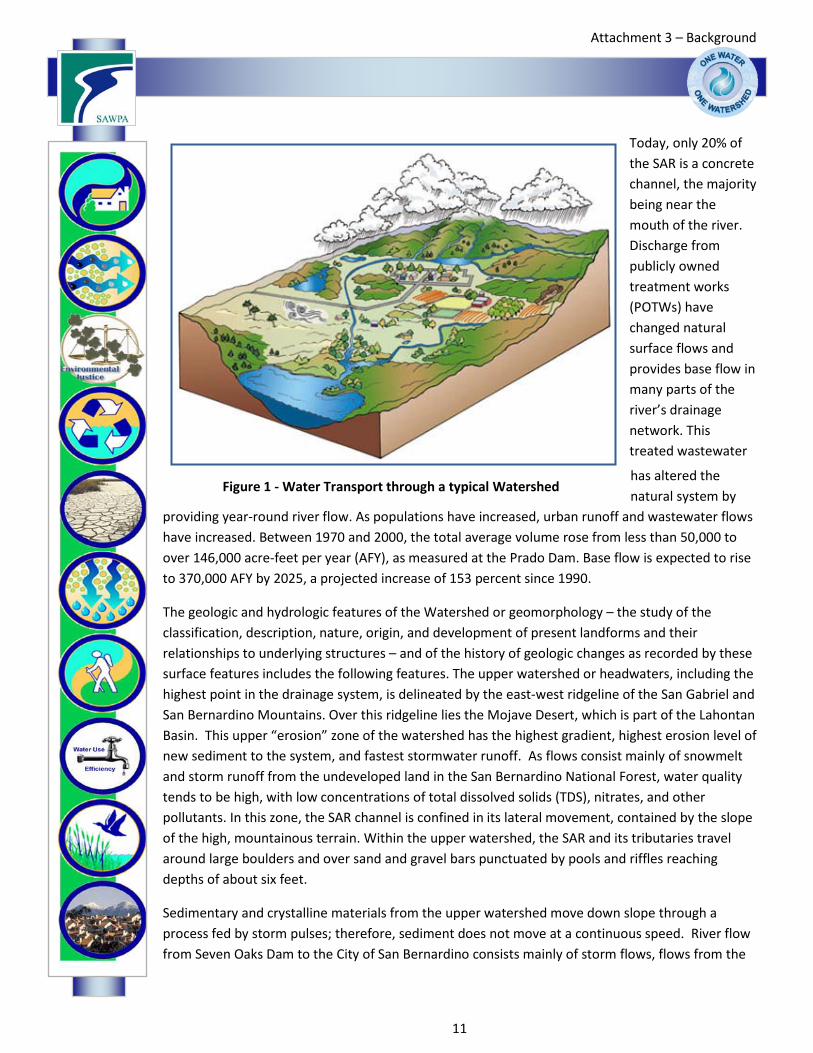
Much of the movement of materials, energy, and organisms associated with the channel environment and adjoining upland environment depend on the movement of water within the Watershed. To the extent that this movement is altered, so does the potential exist for the system to become “dysfunctional” for species that depend on it for life support. That is, alteration of water movement via damming or channelization can reduce ecosystem functionality. Refer to Figure 1 for an illustration of water transport through a typical watershed.
Today much of the lower Santa Ana River has lost its historical character
Attachment 3 – Background
11
Today, only 20% of the SAR is a concrete channel, the majority being near the mouth of the river. Discharge from publicly owned treatment works (POTWs) have changed natural surface flows and provides base flow in many parts of the river’s drainage network. This treated wastewater
has altered the natural system by
providing year-round river flow. As populations have increased, urban runoff and wastewater flows have increased. Between 1970 and 2000, the total average volume rose from less than 50,000 to over 146,000 acre-feet per year (AFY), as measured at the Prado Dam. Base flow is expected to rise to 370,000 AFY by 2025, a projected increase of 153 percent since 1990.
The geologic and hydrologic features of the Watershed or geomorphology – the study of the classification, description, nature, origin, and development of present landforms and their relationships to underlying structures – and of the history of geologic changes as recorded by these surface features includes the following features. The upper watershed or headwaters, including the highest point in the drainage system, is delineated by the east-west ridgeline of the San Gabriel and San Bernardino Mountains. Over this ridgeline lies the Mojave Desert, which is part of the Lahontan Basin. This upper “erosion” zone of the watershed has the highest gradient, highest erosion level of new sediment to the system, and fastest stormwater runoff. As flows consist mainly of snowmelt and storm runoff from the undeveloped land in the San Bernardino National Forest, water quality tends to be high, with low concentrations of total dissolved solids (TDS), nitrates, and other pollutants. In this zone, the SAR channel is confined in its lateral movement, contained by the slope of the high, mountainous terrain. Within the upper watershed, the SAR and its tributaries travel around large boulders and over sand and gravel bars punctuated by pools and riffles reaching depths of about six feet.
Sedimentary and crystalline materials from the upper watershed move down slope through a process fed by storm pulses; therefore, sediment does not move at a continuous speed. River flow from Seven Oaks Dam to the City of San Bernardino consists mainly of storm flows, flows from the
Figure 1 - Water Transport through a typical Watershed

Attachment 3 – Background
12
Lower San Timoteo Creek, and groundwater that is rising due to local geological features. From the City of San Bernardino to the City of Riverside, the river flows perennially and much of the reach is operated as a flood control facility. The principal tributary streams in the upper Watershed originate in the San Bernardino and San Gabriel Mountains. These tributaries include San Timoteo, Reche, Mill, Plunge, City, East Twin, Waterman Canyon, Devil Canyon, Cajon Creeks, and University Wash from the San Bernardino Mountains, and Lone Pine, Lytle, Day, Cucamonga, Chino, and San Antonio Creeks from the San Gabriel Mountains.
From the City of Riverside to the recharge basins below Imperial Highway, river flow in Orange County consists of highly treated POTW effluent, urban runoff, irrigation runoff water, imported water applied for groundwater recharge, and groundwater forced to the surface by underground barriers. Near Corona, the SAR cuts through the Santa Ana Mountains and the Peralta-Chino Hills, which together form the northern end of the Peninsular Ranges in southern California. The SAR then flows down onto the Orange County
coastal plain where the channel lessens in gradient, the valley floor is reached, and the soft features of the channel where sediment has deposited are more prevalent. Floodplains are strewn with boulders and characterized by sand and gravel washes. Within this valley floor, the transport and depositional processes are less confined by higher terrain as water, dissolved material and sediment move toward the sea. Over time, aquatic and terrestrial wildlife have adapted to this dynamic process and channel form. However, rapid urbanization has artificially increased the rate of sedimentation and loss of habitat in this part of the watershed, negatively affecting water quality and wildlife habitat.
In the southern portion of the watershed, the regional boundary divides the Santa Margarita River drainage area, which is not part of the Watershed, from that of the San Jacinto River. The San Jacinto River, which is part of the Watershed, starts in the San Jacinto Mountains, runs westerly through Canyon Lake and normally ends in Lake Elsinore. In wet years, the San Jacinto River will overflow the lake and connect with the SAR through the Temescal Wash. Flood flows from the San Jacinto River produce a broad, shallow wetlands area called Mystic Lake.
Prado Wetlands Area

Attachment 3 – Background
13
The Orange County coastal plain is composed of alluvium derived from the mountains. Upstream from the Santa Ana Canyon lay Prado Dam and Prado Wetlands; SAR flows are passed through the Prado Wetlands to improve water quality and remove nitrates before being used for Orange County Groundwater Basin recharge. Santiago Creek, the only major tributary to the lower SAR, joins the SAR in the City of Santa Ana. The lower limit of both the groundwater recharge area and the SAR’s ordinary flows is 17th Street in the City of Santa Ana. Prior to channelization of the lower part of the SAR, the channel used to meander slowly across broad flood plains. Currently, the SAR is a concrete channel from 17th Street in the City of Santa Ana to Adams Avenue in Huntington Beach. The riverbed is ordinarily dry from 17th Street in the City of Santa Ana to the Victoria Street Bridge. The Greenville-Banning Channel, which carries stormwater discharge and urban runoff, is channelized to the Victoria Street Bridge where it joins the SAR. Discharge from the Greenville-Banning Channel combines with tidal flow from the Pacific Ocean and the SAR is wet from the Victoria Street Bridge to the mouth of the SAR.
Groundwater in the watershed is highly controlled by the geology of the area, in both the configuration of bedrock and by the extensive faulting. Most groundwater basins are unconfined, much like a bowl full of sand that has water poured in halfway, see Figure 2. However, the variable depth to bedrock, and the presence of faults cause pressure zones where water flows towards (or to) the ground surface. In general, groundwater flows the same direction as surface waters from the mountains in the east/north to the Pacific Ocean in the west. There are about 40 groundwater basins in the watershed (depending on how they are defined and boundaries are drawn); many are inter-related. Some of the largest groundwater basins include the Chino Basin (Chino/Ontario/Fontana area), the Orange County
Figure 2 - SAR Watershed Groundwater Management Zones

Attachment 3 – Background
14
Basin, the Bunker Hill Basin (San Bernardino), the San Timoteo Basin (Yucaipa/Banning/Beaumont area), and the San Jacinto/Hemet Basins.
Four primary faults transverse the watershed, with other minor faults either branching off of, or running parallel to, the major faults. Within the upper watershed, the San Andreas Fault divides the San Bernardino Mountains from the San Gabriel Mountains and branches off into the San Jacinto Fault near San Bernardino. Known as southern California’s most active fault, the San Jacinto Fault affects groundwater in the San Jacinto River and the SAR, forcing groundwater to the surface at the Bunker Hill Dike. Toward the central watershed, the Elsinore-Whittier Fault passes under the Prado Dam from the northwest to the southeast. Toward the coast, the Newport-Inglewood Fault enters the region from the Los Angeles area and passes offshore near Newport Beach.
Climate
The climate of the watershed is considered Mediterranean with hot, dry summers, and cooler, wetter winters.
Average annual precipitation ranges from 12 inches per year in the coastal plain to 18 inches per year in the inland alluvial valleys, reaching 40 inches or more per year in the San Bernardino Mountains. Most of the precipitation occurs between November and March in the form of rain with variable amounts of snow in the higher mountains of the Watershed. The climatological cycle of the region results in high surface water flows in the spring and early summer period, followed by typically low flows during the dry season. Winter and spring floods generated by precipitation in the high mountains are not uncommon. Similarly, during the dry season, severe thunderstorms in the high mountains have periodically generated torrential floods in local streams.
Snowcapped San Gabriel Mountains
Attachment 3 – Background
15
Land Use
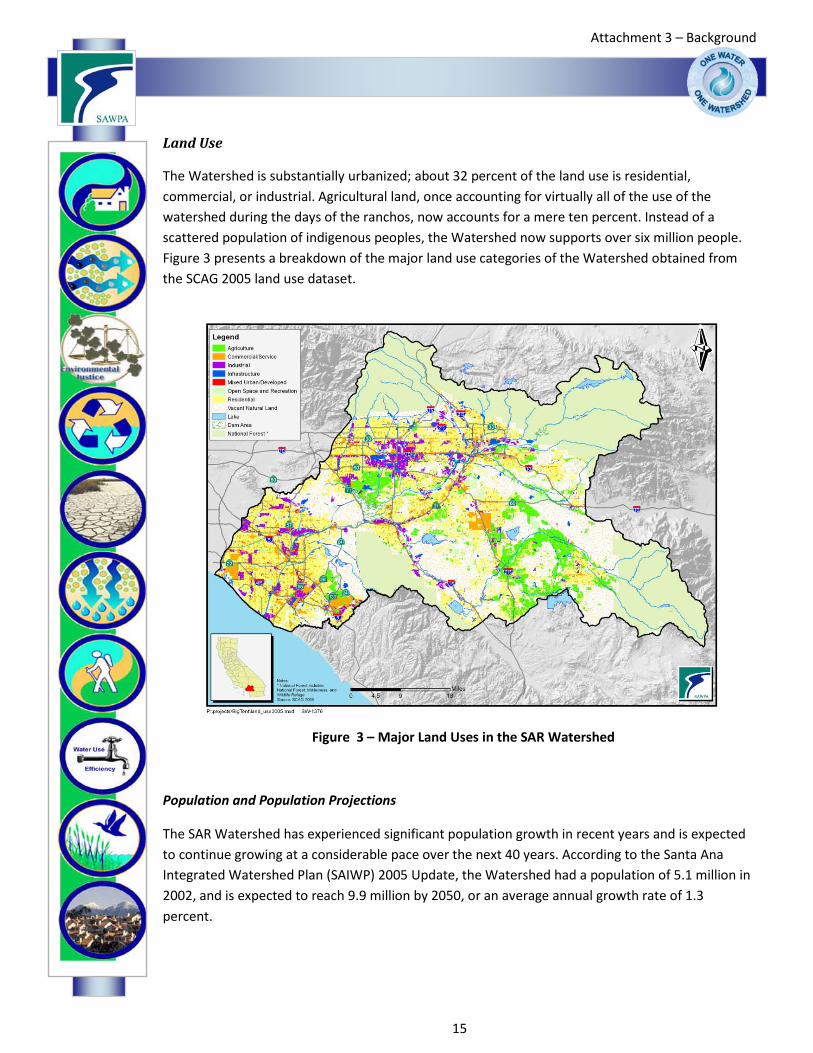
The Watershed is substantially urbanized; about 32 percent of the land use is residential, commercial, or industrial. Agricultural land, once accounting for virtually all of the use of the watershed during the days of the ranchos, now accounts for a mere ten percent. Instead of a scattered population of indigenous peoples, the Watershed now supports over six million people. Figure 3 presents a breakdown of the major land use categories of the Watershed obtained from the SCAG 2005 land use dataset.
Population and Population Projections
The SAR Watershed has experienced significant population growth in recent years and is expected to continue growing at a considerable pace over the next 40 years. According to the Santa Ana Integrated Watershed Plan (SAIWP) 2005 Update, the Watershed had a population of 5.1 million in 2002, and is expected to reach 9.9 million by 2050, or an average annual growth rate of 1.3 percent.
Figure 3 – Major Land Uses in the SAR Watershed

Attachment 3 – Background
16
The SAIWP estimates that much of future population growth will take place in Riverside and San Bernardino counties, as Orange County is fairly built out. According to the U.S. Census Bureau, Riverside County grew by 37.5% between 2000 and 2009 (or an annual average of 3.6%), compared to 9.1% for the state of California as a whole (an average of less than 1% per year). Population growth will continue at an average of 1.9% per year through 2035, according to Riverside County Center for Demographic Research.
Similarly, San Bernardino County grew by 18.0% in the same period (or 1.8% per year), or almost twice the state rate. In contrast, Orange County grew by 6.3% in the same period, below the state average.
Population growth will exacerbate some of the issues previously described for the watershed if no action is taken. In particular, population growth could result in more habitat fragmentation, reduction of impervious surfaces, modification of natural hydrology, increased water demand, and increase waste generation. The types of multi-benefit, multi-jurisdictional, or watershed-wide projects promoted by the OWOW Plan could help reverse this trend.
The recent recession will likely slow this growth rate substantially. Although recent SCAG reports show that the Santa Ana Watershed will continue to grow and reach long –term population estimates, the timeline is uncertain. Until the issues of higher unemployment and high-foreclosure rates within the region are resolved, population growth rates will be slowed based on SCAG estimates prepared by Beacon Economics.
Descriptive maps of the Santa Ana River Watershed are attached and follow the Background Section.

Attachment 3 – Background
17
The Existing IRWM Plan
History of Santa Ana River Watershed Planning
Since its formation, SAWPA has been on the forefront of water resource planning for the region. Formed originally as a regional planning agency in 1967, SAWPA undertook the first water quality management program study for the Watershed. These early planning roots provided the important water quality data and analysis for the development of the first Regional Board Basin Plan. Since that time, SAWPA has worked closely with the Regional Board in all Water Quality Basin Plan Updates and watershed planning efforts.
The 1998 SAWPA Water Resources Plan was one of the first watershed-wide water resource plans undertaken by SAWPA to optimize all available water resources in the watershed in an integrated fashion. This plan was initiated after MWD had kicked off their first Integrated Resource Plan in 1995. Because only three of the five SAWPA member agencies were MWD member agencies, the SAWPA Commission directed staff to prepare a similar water resource plan for the Watershed that would examine all available water resource development opportunities and assets within the Watershed. With one of the SAWPA member agencies, Valley District, also serving as an additional importing water agency and SWP Contractor within the Watershed besides MWD, new water resource development projects were identified. This plan was prepared entirely by SAWPA Planning staff.
In 2002, SAWPA updated and expanded the water resources planning in its Santa Ana Integrated Watershed Plan (IWP), a three- volume planning document that examined water resource management strategies to address regional needs in an integrated fashion. Water resource management strategies identified in this report included water storage, water quality protection and improvement, water recycling, storm & flood water management, and environment and habitat protection.
The first volume of the IWP is the Water Resources Component, a planning document that was built upon member agency long-term water resource plans and management programs, thus providing a vehicle to ensure effective and concerted planning efforts on a regional basis. This volume also describes the necessary water resources projects to achieve zero reliance on imported water supply, and the amount of salt removal facilities necessary to achieve a salt balance in the watershed.

Attachment 3 – Background
18
The second volume of the IWP is the Environmental and Wetlands Component. It describes the watershed-wide wetlands program and watershed plan that integrates wetlands, trails, habitat, open space, education, and invasive species removal. The third volume of the IWP is the Upper Santa Ana Regional Interceptor (SARI) Planning Component, which provides a foundational evaluation of the upper SARI, the watershed brine disposal pipeline, and a future long-term beneficial use of the SARI as the critical facility required to meet the SAWPA goal of transporting highly saline, non-domestic discharges
out of the upper watershed to protect its groundwater resources.
The first two volumes of the 2002 Integrated Regional Water Management Plan (IRWMP) were written and prepared by SAWPA Planning staff, with the third volume prepared by SAWPA’s consultant, CDM. The 2002 three-volume report describes integrated water projects and provides justification for the first IRWMP in the State, described under the State Proposition 13 Water Bond. The success of this effort provided funding totaling $235 million for the Watershed.
In 2005, SAWPA prepared the Santa Ana IWP 2005 Update, an IRWMP. This report, also prepared by SAWPA Planning staff, updated much of the work from the 2002 report incorporating the Urban Water Management Plans (UWMPs) performed by SAWPA member agencies and sub-agencies, and provided an updated listing of priority projects to achieve the goals of the watershed stakeholders. Recognizing the significant size of the watershed in geography and population, as well as the sheer complexity of coordination and integration of projects, the 2005 report sought to briefly describe and highlight the many detailed resource planning processes and documents that led to a list of proposed prioritized regional projects, as opposed to serving as a detailed technical or scientific water resource evaluation in itself. As a result of these efforts, the plan was ranked among the top ten IRWMPs by DWR staff, and provided the justification for $25 million from Proposition 50 IRWM implementation grant program.
The 2005 report also served as a clear indicator for local and State leaders of the enormous impact of the region on the State and Nation as noted by the following observations:
• Population of the region is larger than 41 U.S. states – six million people.
• Added over 75% of California’s new jobs in the past 15 years.
• Will add over 20% of all new jobs in California in the next 15 years. Over 54% of the job growth for the State comes from the SAR Region as of 2005.
• Home to a 110-mile SAR Trail running from the San Bernardino Mountains to the Pacific Ocean.

Attachment 3 – Background
19
• Contains some of the most sophisticated multi-agency groundwater management planning and salt management strategies in the U.S.
• Home to effective collaborative Regional Board/stakeholders efforts which now serve as a template for SWRCB strategic implementation.
In light of the growing need to address safe reliable water infrastructure, voters of the State of California passed Proposition 84 in 2006, which allocated $1 billion to integrated regions
throughout the State. Concurrent with this support, significant water crises have arisen prompting SAWPA and the regional stakeholders to update the Santa Ana IWP, now called the One Water One Watershed (OWOW) Plan.
The vision of the OWOW Plan is a sustainable Watershed that is drought-proofed, salt-balanced, and supports economic and environmental viability. To achieve this vision, stakeholders must address four major crises or threats, which SAWPA has labeled the Four Horsemen of the Apocalypse. They are:
Figure 4 – Cities and Counties in the SAR Watershed

Attachment 3 – Background
20
1) Climate Change resulting in reduced water supplies combined with increased water needs in the region.
2) Colorado River Drought Conditions resulting in reductions of imported supply due to upper basin entitlements and continued long-term drought.
3) San Joaquin Delta Vulnerability resulting in reductions or loss of supply due to catastrophic levee failure or changing management practices of the Delta.
4) Population Growth and Development resulting in interruptions in hydrology and groundwater recharge while increasing water needs.
Santa Ana “One Water One Watershed” IRWMP Planning Effort
To address the Four Horsemen of the Apocalypse, water agencies and stakeholders in the Watershed initiated a new planning effort by working together to address climate change, long-term drought, further interruptions in Delta water, and population growth. This effort was coordinated by SAWPA, who has helped coordinate water and sewer improvement projects for its member agencies for many years. It also has facilitated a number of task force efforts directed at specific water issues. But under SAWPA’s leadership, the joint powers authority has expanded its integrated watershed planning outreach efforts to include every aspect of water and every stakeholder on a watershed-wide basis.
SAWPA officially launched this IRWM planning effort during a meeting in the City of Chino on May 24, 2007, in which 178 officials representing more than 100 agencies in Riverside, San Bernardino and Orange counties met to discuss the framework for the “OWOW Plan”, a shared vision of the Watershed – a 2,650-square mile area from the San Bernardino Mountains westward to the Pacific Ocean. The goal and expectation was that this IRWMP would be far more comprehensive than any plan that could be developed by a single agency.
Attachment 3 – Background
21
Participants from numerous agencies and organizations have volunteered to serve on committees and have addressed
every aspect of water management planning, including water supply reliability, water quality improvement, water conservation, climate change, land use, flood risk management, environment and habitat enhancement, water
recycling, as well as water use in parks, recreation and open space areas. Participants also integrated water supply with
environmental needs and included environmental justice and disadvantaged communities’ issues into integrated water solutions.
The fundamental concept for this planning process was to pull parties together in every aspect of the water arena—those who provide water, those who use it, and those who manage it—in a way that has never been done before and in a way that goes beyond the interests of any one agency. This approach marked a major shift from previous IRWM planning efforts by greatly expanding the number and type of agencies and organizations involved in the process. It is noted that some agencies’ missions are so narrowly defined that they cannot easily plan for improvements that also would benefit surrounding constituencies.
With the advent of several water crises approaching or facing us now, the need to move forward with water resource integrated planning has become absolutely necessary. Through long-term collaboration among the many participating agencies, new synergies and multi-beneficial projects can be developed that focus on sustainability for the future. In this fashion, future funding can be leveraged for the benefit of everyone in the Watershed. It is clear that this type of planning also is critical for economic development. If water and the other amenities that go with it are not available, economic development will be curbed substantially. Unlike previous IRWMPs prepared by SAWPA, the OWOW Plan is divided into two phases. The first phase focuses on integrated water resource planning without identification of specific priority projects. Similar to a city or county general plan, the OWOW Plan provides an overall view of water resources with identification of current conditions and problem identification, current and future management strategies, and opportunities for collaboration and integration. Types of projects, rather than specific projects, have been identified in this first phase, similar to the relationship between a general plan to a specific plan. Individual projects will be reviewed, described and prioritized in the next phase of the OWOW Plan. The culmination of the first phase and all the stakeholder efforts were described at a major conference for the OWOW Plan held on January 29, 2009. The conference was entitled, State of the Santa Ana River Watershed – Overcoming Boundaries and was a huge success with over 1,000 watershed stakeholders in attendance.

Attachment 3 – Background
22
The goal of the conference was to continue to conduct outreach with watershed stakeholders to review efforts to find solutions to water issues in the Watershed. Through this conference, for the first phase of the OWOW Plan, organizers, including SAWPA are accomplishing the following:
• Further development of a regional “Santa Ana River Watershed” identity that encourages cooperation in addressing regional issues, both locally and legislatively.
• Inform those who manage water resources of possible interdisciplinary conflicts and create synergies (e.g., water supply and flood agencies manage the same surface water resources, but frequently manage resources in a manner counter-productive to each other’s interests).
• Better engage the land use and business community, showcasing water supply and quality as
cornerstones of sustainable economic growth.
A follow-up to the 2009 conference was held on April 22, 2010, at the Disneyland Hotel. Over 800 stakeholders across the watershed participated despite difficult economic conditions.
The next phase of OWOW commenced on June 1, 2010, with a “call for projects” and
the development of a rating and ranking system to attract the most cost effective, multi-beneficial, and sustainable water projects needed for the region and State. The plan is scheduled for adoption in December 2010 by the OWOW Steering Committee and the SAWPA Commission. The plan is anticipated to meet all the new DWR Plan Standards as defined in the Proposition 84 IRWM Guidelines.
Planning Updates and Coordination
The OWOW Plan will be a “living document” and will be updated every two to five years in a coordinated manner with local, regional, and statewide plans. Plan updates will be formally adopted by the Steering Committee and ratified by the SAWPA Commission. The Pillar groups will continue to be an instrumental part of the update process by providing technical expertise and ensuring that the point of view of different disciplines and interests groups is taken into consideration.

Attachment 3 – Background
23
Plan updates will incorporate, for example, changes to city General Plans, land use elements, Stormwater Management Plans, Water and Wastewater Master Plans, Urban Water Management Plans, County land use planning documents, and the Southern California Association of Governments (SCAG) land use data.
In addition, new water management strategies will be incorporated into future versions of the Plan as additional knowledge is gained on the state of the watershed, new technologies and best practices, and changes in policy and public mindsets. Furthermore, the Plan will be updated as necessary to comply with the requirements of future grant funding opportunities.
The OWOW Plan will be provided to cities, counties, water suppliers, nonprofit organizations, and other regional and State agencies for use in their water resource planning efforts. It is anticipated that the findings will support planning efforts and updates to General Plans, Strategic Plans, and other plans and programs. The document also will be helpful input to the Metropolitan Water District of Southern California Integrated Resources Plan, and the State of California DWR Water Plan.
The public process used to identify stakeholders and how they were included in the planning and decision-making process for the IRWM Plan
Recognizing that the input of the stakeholders including disadvantaged communities is vital to integrated regional water management planning, SAWPA has conducted extensive public education and outreach in past IRWM planning efforts and even more so with its most recent IRWM update, OWOW. Engaging significant stakeholder involvement in a large, diverse Watershed is challenging. It is unlikely that one individual “knows” all of the stakeholders, and as such, the development of mailing lists and notification of workgroup meetings can be daunting. The OWOW process was designed to be different from other planning processes. One critical difference is that OWOW was designed to be a “bottom-up”, rather than a “top-down” process. By encouraging participation from different groups of people and those holding varying viewpoints from throughout the Watershed, the capacity to reach larger numbers of stakeholders also grew.
Pillar Groups
The initial work of the OWOW process was accomplished using working groups or planning Pillars focused on subject areas (resource management strategies) as previously described under the RWMG Governance description section. Each group was led by a subject area expert, and that person was provided an extensive list of interested participants in that subject area based on contacts made at multiple outreach meetings held across the watershed and other outreach approaches conducted for the OWOW process. All these individuals were invited to the process, and were an important addition to the already large mailing list maintained by SAWPA. Each Pillar leader was responsible for maintaining a list of contacts interested in their particular Pillar and

Attachment 3 – Background
24
SAWPA provided names of additional contacts for them. The knowledge and contacts of the Pillar committees provided an important link to watershed stakeholders.
Web-Based Document Management
Pillar leaders were provided a web-based tool to allow development of this document in a virtual web-based environment that allowed collaborators from across the watershed to “check out” sections for writing and editing. Each Pillar leader was able to control and track work flow/edits through a web server. All participants and interested parties were able to request access to the server to view edits and working copies. Areas identified that required further discussion could be discussed on a publicly-accessible companion forum.
This web-based discussion forum was established for each Pillar group. Anyone interested was able to use the forum to discuss issues surrounding each section. This discussion forum provided a mechanism to collect information, receive comment, and facilitate communication across disciplines. How each group used the tool was dependent on their specific needs, with some groups preferring face-to-face dialogue, and others making use of conference calling and web tools. Web-based discussion forums also provided for transparency and identification of new stakeholders.
SAWPA Distribution List
SAWPA primarily provided communication to stakeholders based on an extensive mailing list maintained on the SAWPA server. The list was regularly updated, and anyone requesting information was added to the list. Email contact allowed frequent communication with a broad group of stakeholders throughout the Watershed. The mailing list also included stakeholders outside the Watershed interested in issues within the Watershed.
The master contacts database includes a rather diverse base of approximately 4,000 stakeholders. The purpose of the database is to provide information for those who have an interest in water and for representatives from cities located within the Watershed. It includes representatives from 120 agencies associated with water, including flood control, water conservation districts, and water supply agencies. It also includes contacts from the 61 incorporated cities within the Watershed, including mayors, key department heads, city council members, and planning commissioners. The database also includes an up-to-date list of members of the California legislature.
Also included are representatives of from county, state, and federal government; Indian Tribes; the real estate community; members of the environment and environmental justice communities; agricultural and development communities; consultants; trade associations; academia; media; non-profit organizations; and others simply interested in water.

Attachment 3 – Background
25
Newsletters
SAWPA has published 12 electronic OWOW newsletters since the inception of the program in the spring of 2007. The newsletter is distributed to everyone on the mailing list and is intended to provide background and updates on the OWOW program, as well as provide information on issues of interest to the Watershed community. As of January 2009, five of the OWOW Pillar leaders had included an article in the newsletter. These articles are intended to provide a link between a Pillar and the broader watershed community. This process will continue with other Pillar leaders and encourage conversation across disciplines and geography.
Beam Blasts
SAWPA also distributed six short electronic “beam blasts” to a subset of the distribution list. A “beam blast” was intended to provide a short, one-page issue update to an audience interested in policy, rather than technical issues. This electronic communication was provided to policy makers and opinion leaders throughout the Watershed. The intent was to provide a short introduction to issues for those that may not have time to read newsletters or attend meetings. Several conference calls also were scheduled so interested members of this group could receive short briefings on watershed issues.
Podcasts
A podcast can be defined as a series of audio or video digital media files distributed over the Internet so that they can be played on personal computers or portable digital players. SAWPA posted two audio podcasts on its website so that interested parties could become familiar with and participate in the OWOW process. Availability of these podcasts was announced using the SAWPA distribution list. SAWPA will continue to work to ensure that stakeholders are informed and have the ability to participate. Podcasts also have value as they reduce the need to drive to a particular location to learn about a topic. As many individuals have limited time, this was seen as a way to allow greater participation.
Meetings and Presentations
Another important process to involve stakeholders was the use of meetings and conferences to inform and encourage the participation in the OWOW process. In addition to meetings dedicated to the OWOW process, most of the collaborative “roundtable” groups and task
Attachment 3 – Background
26
forces were briefed about OWOW and encouraged to become actively involved in the Pillar meetings.
Every effort has been made to assure that the public is both a part of and is aware of the efforts of SAWPA and the OWOW development process. However, in addition to the previously discussed important communication tools, face-to-face meetings continue to be an integral component to the watershed-wide OWOW outreach efforts along with the recently added communication tools of Twitter and the OWOW Forum, an online discussion forum to communicate with stakeholders.
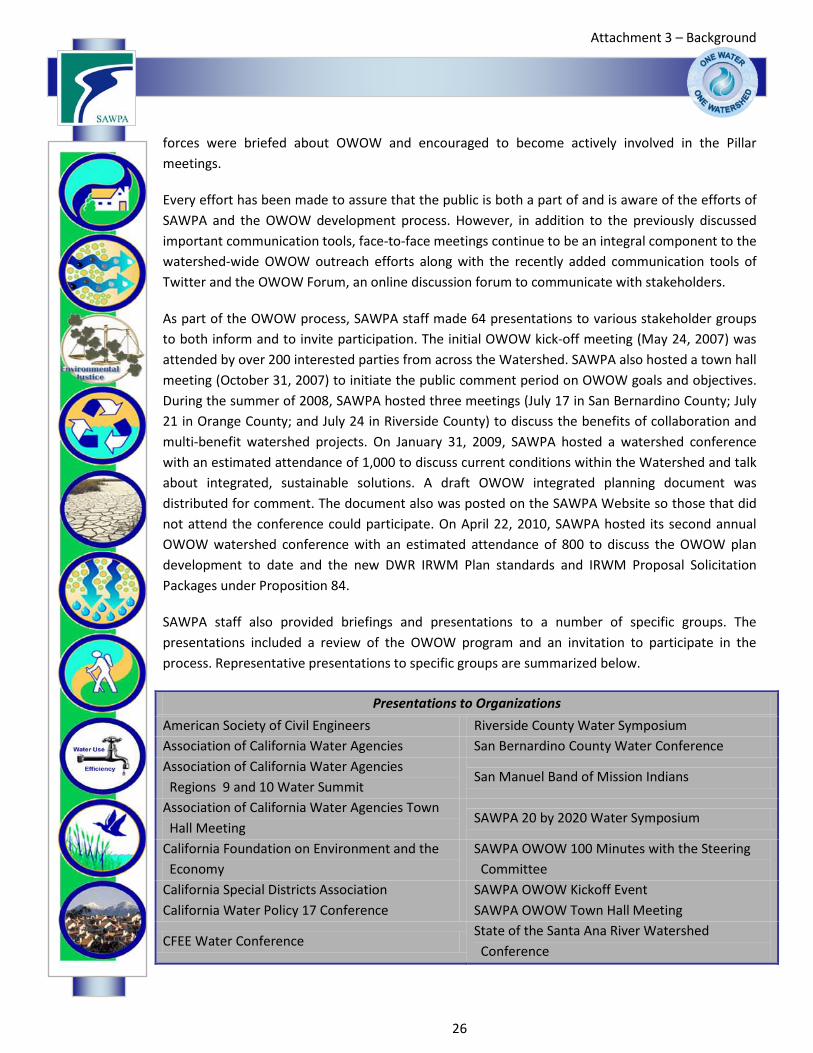
As part of the OWOW process, SAWPA staff made 64 presentations to various stakeholder groups to both inform and to invite participation. The initial OWOW kick-off meeting (May 24, 2007) was attended by over 200 interested parties from across the Watershed. SAWPA also hosted a town hall meeting (October 31, 2007) to initiate the public comment period on OWOW goals and objectives. During the summer of 2008, SAWPA hosted three meetings (July 17 in San Bernardino County; July 21 in Orange County; and July 24 in Riverside County) to discuss the benefits of collaboration and multi-benefit watershed projects. On January 31, 2009, SAWPA hosted a watershed conference with an estimated attendance of 1,000 to discuss current conditions within the Watershed and talk about integrated, sustainable solutions. A draft OWOW integrated planning document was distributed for comment. The document also was posted on the SAWPA Website so those that did not attend the conference could participate. On April 22, 2010, SAWPA hosted its second annual OWOW watershed conference with an estimated attendance of 800 to discuss the OWOW plan development to date and the new DWR IRWM Plan standards and IRWM Proposal Solicitation Packages under Proposition 84.
SAWPA staff also provided briefings and presentations to a number of specific groups. The presentations included a review of the OWOW program and an invitation to participate in the process. Representative presentations to specific groups are summarized below.
Presentations to Organizations
American Society of Civil Engineers Riverside County Water Symposium Association of California Water Agencies San Bernardino County Water Conference Association of California Water Agencies Regions 9 and 10 Water Summit
San Manuel Band of Mission Indians
Association of California Water Agencies Town Hall Meeting
SAWPA 20 by 2020 Water Symposium
California Foundation on Environment and the Economy
SAWPA OWOW 100 Minutes with the Steering Committee
California Special Districts Association SAWPA OWOW Kickoff Event California Water Policy 17 Conference SAWPA OWOW Town Hall Meeting
CFEE Water Conference State of the Santa Ana River Watershed Conference

Attachment 3 – Background
27
Coastal Conservancy Board Meeting TMG Communications Fall Conference Drought Contingency Workshop TMG Communications Watershed Conference Inland Empire Economic Partnership Conservation Meeting
Urban Water Institute
Inland Empire Utilities Agency - Climate Change Workshop
Water Education Foundation
Inland Empire Water Conference Water Education Foundation/California Department of Water Resources Climate Change & Water Adaptation Summit
Metropolitan Water District of Orange County Water Policy Forum
Water Policies & Planning in the West: Ensuring a Sustainable Future Conference
National Water Research Institute Western Governors Association Orange County Water Summit Western Riverside Council of Governments Regional Coordination Conference of Water Officials
Area Focused Water Groups
Basin Technical Group of San Bernardino Valley Newport Bay Watershed Executive Committee California Coastal Conservancy Chino Basin Water Conservation District Coastal Coalition
San Antonio Canyon Stakeholders Committee
Inland Empire Utilities Agency Chino Creek San Jacinto River Watershed Council Planning Group Santa Ana River Dischargers Association Lake Elsinore and Canyon Lake Watersheds Authority
Santa Ana River Watershed Alliance
Riverside County Water Forum
Western Riverside Regional Conservation Authority
Santa Ana Watershed Association
Business/Economic Development Group
Building Industry Association of Riverside County Building Industry Association : Baldy View Chapter Green Valley Initiative I-215 Corridor Economic Development Summit Inland Empire Economic Partnership Inland Action Group Raincross Group Temecula Valley Chamber of Commerce
Cities City of San Bernardino City Council City of Riverside Land Use Committee City of Garden Grove City of Rialto City Council City of Costa Mesa City Council City of Orange City Council City of Newport Beach City of Irvine Cities of Murrieta and Temecula City of Huntington Beach Council City of Murrieta City Council City of Corona City of Riverside
Attachment 3 – Background
28
Valley Group
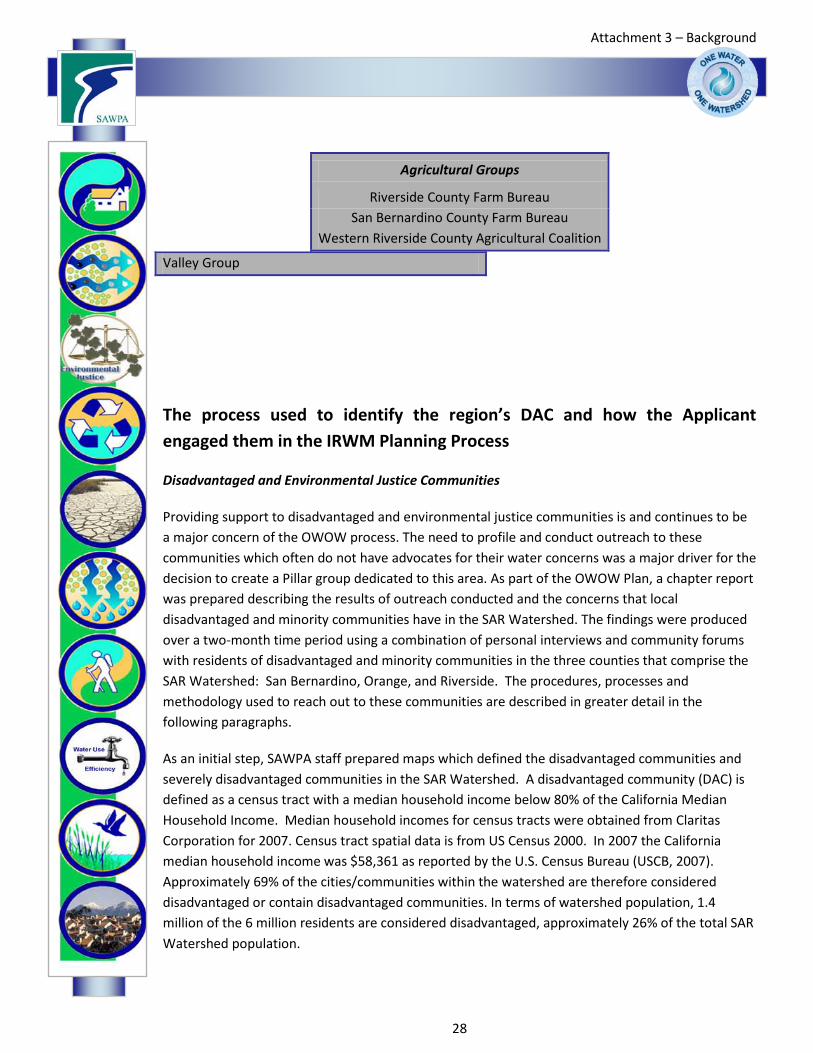
The process used to identify the region’s DAC and how the Applicant engaged them in the IRWM Planning Process
Disadvantaged and Environmental Justice Communities
Providing support to disadvantaged and environmental justice communities is and continues to be a major concern of the OWOW process. The need to profile and conduct outreach to these communities which often do not have advocates for their water concerns was a major driver for the decision to create a Pillar group dedicated to this area. As part of the OWOW Plan, a chapter report was prepared describing the results of outreach conducted and the concerns that local disadvantaged and minority communities have in the SAR Watershed. The findings were produced over a two-month time period using a combination of personal interviews and community forums with residents of disadvantaged and minority communities in the three counties that comprise the SAR Watershed: San Bernardino, Orange, and Riverside. The procedures, processes and methodology used to reach out to these communities are described in greater detail in the following paragraphs.
As an initial step, SAWPA staff prepared maps which defined the disadvantaged communities and severely disadvantaged communities in the SAR Watershed. A disadvantaged community (DAC) is defined as a census tract with a median household income below 80% of the California Median Household Income. Median household incomes for census tracts were obtained from Claritas Corporation for 2007. Census tract spatial data is from US Census 2000. In 2007 the California median household income was $58,361 as reported by the U.S. Census Bureau (USCB, 2007). Approximately 69% of the cities/communities within the watershed are therefore considered disadvantaged or contain disadvantaged communities. In terms of watershed population, 1.4 million of the 6 million residents are considered disadvantaged, approximately 26% of the total SAR Watershed population.
Agricultural Groups
Riverside County Farm Bureau San Bernardino County Farm Bureau
Western Riverside County Agricultural Coalition

Attachment 3 – Background
29
The SAR Watershed contains one of the fastest growing regions in California and also some of the State’s poorest residents. In 2000, the per capita income of portions of the Inland Empire was about 25% below the State average. This disparity in income is exacerbated by the recent economic downturn which has had a detrimental effect on the region in
general and specifically impacted laborers in disadvantaged communities with limited job skills.
Table 2 - Disadvantaged or Partially Disadvantaged Communities
Anaheim Garden Grove Long Beach Riverside Banning Glen Avon Los Alamitos Romoland Beaumont Grand Terrace March AFB Rubidoux Big Bear City Hemet Mira Loma San Bernardino Big Bear Lake Highgrove Montclair San Jacinto Bloomington Highland Moreno Valley Santa Ana Buena Park Home Gardens Muscoy Seal Beach Calimesa Homeland Newport Beach Sedco Hills Cherry Valley Huntington Beach Norco Stanton Chino Idyllwild-Pine Cove Nuevo Sun City Claremont Irvine Ontario Sunnyslope Colton La Habra Orange Upland Corona La Mirada Placentia Valle Vista Costa Mesa La Palma Pomona Westminster East Hemet Laguna Hills Quail Valley Wildomar El Toro Lake Elsinore Rancho Cucamonga Winchester Fontana Lakeland Village Redlands Woodcrest Fullerton Loma Linda Rialto Yucaipa
The U.S. EPA defines environmental justice as the fair treatment of all races, cultures, and incomes with respect to the development, implementation, and enforcement of environmental laws and policies, and their meaningful involvement in the decision making process of the government. In order to address the environmental justice issue, it was important to SAWPA that the OWOW

Attachment 3 – Background
30
process included programs, policies, and activities that ensure that all SAR Watershed residents, including minority populations and/or low income populations, are treated fairly. This included the need for equal enforcement of environmental laws across ethnic and income boundaries. One of the greatest challenges was to ensure that members of all communities including DACs are involved in the development of plans, including the OWOW Plan, and that all communities have input on water issues important to them.
Several environmental justice issues within the SAR Watershed were identified early in the OWOW process. First, direct community impacts from groundwater contamination by industrial operations have occurred primarily in the upper watershed. This sort of contamination should be addressed as a local issue before contaminant plumes spread and the issue becomes regional in nature. Addressing such issues early not only protects the water supply for the community living in the area from contamination, it also provides cost savings by avoiding the cost of regional clean-up efforts. Similar issues arise in areas where groundwater and surface waters are impacted by leaking septic systems located in some high density, lower income communities where sewer services are not available. Here again, regional water quality issues can be avoided through implementation of projects to correct an environmental justice issue. A sense of how widespread these water quality concerns are, is depicted on maps under Question No. 6 that show the various plumes (volatile organic compounds (VOC), perchlorate, and trichloroethylene (TCE)) in disadvantaged communities.
Some lower income areas of the watershed are served by small water companies lacking resources to upgrade infrastructure and provide up-to-date treatment technologies for waste. In these areas the community lacks the resources and, in some cases, the expertise to upgrade systems. Disadvantaged areas located within larger districts with greater resources are not impacted in this way.
Finally, communication continues to be an environmental justice issue. Language barriers and a reliance on “word of mouth” communication, limit communication avenues that are available to provide reliable, factual information to a community. In addition, the lower educational level of the community can result in difficulty interpreting the technical information needed to make informed decisions about water. Unfortunately, this issue has resulted in limited involvement from these communities in public discourse and in some cases, resulted in serious misinterpretation of information provided to the community.
As part of the planning process, it became apparent that in order to fulfill the goal of direct involvement of the environmental justice and disadvantaged community, it would be necessary to go directly to communities within disadvantaged census tracts and engage residents directly. It appeared implausible that adequate, unbiased information could be collected from meetings structured like those in the usual water resources planning process. It also became apparent that outreach would need to be conducted in a bilingual setting, as many residents were Spanish speaking and uncomfortable providing information in English.

Attachment 3 – Background
31
In order to get the widest possible assessment of the concerns of the residents in minority and/or low-income communities in the three counties, SAWPA sponsored a series of one-on-one interviews and community group meetings held over a period of two months in September and October 2008. The interviews were conducted in English and Spanish in the cities of Colton and Rialto in San Bernardino County, Lake Elsinore and Pedley in Riverside County, and Santa Ana in Orange County. A standard set of questions were used to establish whether or not the residents of these communities had concerns with the water quality. The residents were also questioned about their understanding of the concept of environmental justice and their perception of the water quality in the SAR. When the survey was written, Lake Elsinore was not included in the questionnaire. Once the field work commenced in Lake Elsinore, the lake became a topic which the residents wanted to address without prompting.
It was apparent from the response to the questions about environmental justice and the SAR that neither concept is readily familiar to the residents of the disadvantaged and minority communities where the field work was conducted. In order to establish a base line opinion, a focus group was held at a community meeting in Santa Ana, which was mostly attended by Anglo members of the community who were more affluent than the residents of the Barrio Logan area of Santa Ana who had initially been surveyed. A similar approached was used in the City of Colton because of the serious concerns about water quality in the disadvantaged and minority communities of that city. Many residents did not want to give their last names and in some instances they did not want to identify themselves although they readily gave their opinions on their concerns with the water quality.
Another area of concern is failing onsite wastewater treatment systems in various disadvantaged communities in the SAR Watershed. In the Beaumont Cherry Valley area of the upper SAR Watershed, a moratorium was placed on all future onsite wastewater treatment systems located in the Beaumont Cherry Valley Water District service area of Riverside County. Based on evaluation by the Santa Ana Regional Water Quality Control Board (RWQCB), preliminary studies showed a link
between septic systems in this area to potable groundwater wells. SAWPA was approached by the County of Riverside to serve as a technical advisor for a citizen advisory committee formed to evaluate various studies and actions taken to address the challenge. SAWPA worked the citizen advisory committee along with other technical experts from the Santa Ana RWQCB and EMWD to discuss the scientific merit of evaluation studies with the public in public meetings throughout 2008. The work conducted

Attachment 3 – Background
32
was useful in helping to profile a disadvantaged community in need of future water quality improvement funding and support.
In another disadvantaged community called Quail Valley, located within the County of Riverside, onsite wastewater treatments systems were failing to such a degree that raw sewage was observed under storm events to percolate out into street gutters resulting in a major health hazard. Approximately two years ago the Santa Ana RWQCB stepped in to start to address this problem from getting worse by prohibiting the construction of future septic systems. The control of this water quality contamination was deemed the number one priority of the RWQCB. Unfortunately, the water quality challenge persists due to the high costs associated with connecting to existing wastewater collection and treatment systems. To assist, SAWPA has been asked by EMWD to assist in the formation of a workgroup to conduct outreach and support for the citizens of the community about the problem, assist planning and feasibility studies, and pursue implementation funding opportunities. The task force would include many local entities such as Elsinore Valley Municipal Water District, EMWD, City of Canyon Lake, City of Menifee, and the Santa Ana RWQCB to conduct a multi-agency task force.
For the future, the OWOW process will seek to convene a number of roundtable discussions among public education professionals throughout the SAR Watershed to develop a strategy that reaches all communities. Continued outreach as part of the OWOW planning process will continue in order to identify the best integrated approaches for addressing water quality problems affecting disadvantaged communities.
The process used to identify the region’s water-related objectives and conflicts
In order to guide the development of the OWOW Plan, the Steering Committee and the Pillar Leader group convened to establish the goals and objectives for the Watershed that would allow a more holistic approach to resource management.
A two-day eco-charrette was hosted by Stantec Consulting on July 16, 2007, and July 17, 2007. This event provided an interactive and thought-provoking forum to discuss ideas and priorities in the pursuit of sustainable water resources and to discuss and take a first step toward developing goals and objectives for the Watershed. Stantec Consulting staff conducted a thoughtful and meaningful discussion regarding the values and principles that would be used as guiding principles for the Pillars to follow in the development the OWOW IRWMP. The eco-charrette format is based on developing a consensus of the OWOW leadership values, challenges, and strategies via group input and voting mechanisms to refine and enhance the overall vision of the group.
Through extensive discussion and collaboration among the OWOW Steering Committee and Pillar Leaders on issues pertaining to values, challenges, and strategies, they established a priorities list for each issue. Listed below is a summary of the issues obtaining the most “votes” at the eco-charrette.

Attachment 3 – Background
33
Values • Sustainability • Comprehensive Water Strategy • Smart Growth/Urban Centers Communities • Maintain Quality of Life
Challenges
• Benchmark Data • High-Impact Development/Heavy Footprint • Economics/Cost of Change
Strategies • Improved Social Marketing • Advocacy for a Sustainable Watershed • Increase Recycled Water Usage • Massive Reduction of Urban Runoff by 2030 • Maximize Utilization of Stormwater for Supply • Green Building/LID • Reduction of Turf and Water Guzzling Plants
In addition, using the Pillar Leaders’ input from the July 16, 2007 eco-charrette, the Steering Committee developed three statements to help each Pillar prepare their respective group’s report. These three statements are:
• Balance Environment and Economics • Plan for Severe Reduction of Imported Water Scenario • Consider Climate Change
The Steering Committee conveyed a sense of urgency that moderately aggressive to aggressive planning was needed. Furthermore, they were effective in conveying direction to produce a Plan that is more aggressive in taking steps to plan for major changes in how developing, protecting, and conserving water is approached. At the end of the eco-charrette, the general direction was as follows:
• There was a shared understanding that all water within the SAR Watershed is a precious resource. Climate change, continuing Colorado River drought, questions about the San Joaquin Delta’s vulnerability and its ability to deliver water to southern California, and changes to the hydrologic cycle as the result of our very own successful growth and development will stress our ability to provide sufficient water to supply to our Watershed for economic and environmental sustainability.
• There was an expressed commitment to invest time and resources for high-quality planning, both long-range and short-range, to ensure the best possible outcome and to achieve the

Attachment 3 – Background
34
stated mission of making the SAR Watershed drought-proofed, salt-balanced, and to continue its economic and environmental vitality.
• While major paradigm changes are being considered, the quality of life of the residents must be protected and the economic impact of a recommended change must be understood before implementation.
• The group indicated through voting that, in order to meet these challenges, the leadership in the Watershed would need to consider significant review of current practices and expectations. The best solutions likely would engender new ways of thinking about water use and the value of water.
• There was acknowledgment that while many advances would need to be made in conservation and water use efficiency, the planning process should consider if agricultural water conservation measures could free up water for urban use or if water could be purchased from agriculture for urban use.
• There was a commitment to employ emerging technologies to further urban water efficiencies and to develop new water supplies.
Generally, the consensus was that the OWOW effort would need to be bold and innovative to meet the Watershed’s vision.
There also was interest in matching the quality of water delivered to the water quality needed for a specific purpose. For example, highly-treated drinking water is not needed for agriculture or landscaping use. Steering Committee members discussed the impacts of land use decisions on water quality and the quantity of water available. There was a desire for better communication and coordination between the water industry and those charged with land use planning. Furthermore, the Steering Committee members also discussed how much public open space is dedicated to grass and how much of residential personal outdoor space can be maintained in grass verses other plantings that would be less water dependent. They acknowledged the need for grass play areas while seeing opportunities for water savings by replacing grass with drought tolerant plantings in other areas. The Steering Committee members suggested that the price paid for water by the consumer versus the actual cost of water, including environmental, wheeling, and infrastructure replacement costs be reconciled.
In addition to the two-day eco-charrette, the Steering Committee and the Pillar Leaders met on several occasions to review and enhance these goals and objectives. Draft goals and objectives were developed based on the eco-charrette exercises. A draft set of goals and objectives was presented to the Steering Committee for comment. The Pillar Leaders then prepared a draft final set of goals and objectives. These were presented for comment at a public town hall meeting held at the California Citrus State Historic Park on October 31, 2007. Email notices allowed the public on the mailing list to participate electronically in the comment process. Stantec Consulting consultants collected the comments and provided them to the Pillar Leaders for consideration. After final revision, the goals and objectives were adopted by the Steering Committee. The final product of

Attachment 3 – Background
35
their efforts is found in the table below. Table 3 below summarizes the objectives and sub-objectives developed in consensus by the group.
Objectives Sub-objectives Provide reliable water supply Reduce dependency on imported water.
Meet current and future water demands during all hydrologic conditions. Meet water demands during emergency or catastrophic conditions. Maximize water use efficiency (conservation). Increase use of recycled water.
Preserve and enhance the environment
Protect and enhance the ecological function of open-space. Protect and enhance water-related habits. Reduce or eliminate invasive riparian and aquatic species. Protect sensitive marine and estuarine environments. Consider ecological functionality in new development.
Promote sustainable water solutions
Promote strategies that link land and water use. Reduce greenhouse gas emissions. Reduce energy consumption and promote urban greening projects.
Develop partnerships for planning and implementation of economically, environmentally, and socially sustainable watershed projects.
Ensure high quality water for all users
Attain water quality standards in fresh and marine environments. Match water quality with intended uses. Protect and improve source water. Manage salinity.
Provide economically effective solutions
Leverage existing financial and infrastructure assets. Minimize capital, O&M, and life-cycle cost. Promote aggressive pursuit of grants and loans. Pursue innovative, non-traditional revenue-generating concepts.
Improve regional integration and coordination
Engage stakeholders in planning and implementation of Watershed projects. Increase communication and coordination.
Search for projects that meet multiple goals across geographic and water resource services.
Manage rainfall as a resource Provide appropriate flood control capacity and other benefits to the community. Maximize beneficial use of rain water.
Preserve open-space and recreational opportunities
Increase opportunities for recreation and open-space. Provide useable open-space for all residents of the watershed.
Maintain quality of life Balance quality of life, and social, environmental, and economic impacts when implementing projects.
Consider the needs of disadvantaged communities.
Table 3 - Objectives Adopted by the Steering Committee
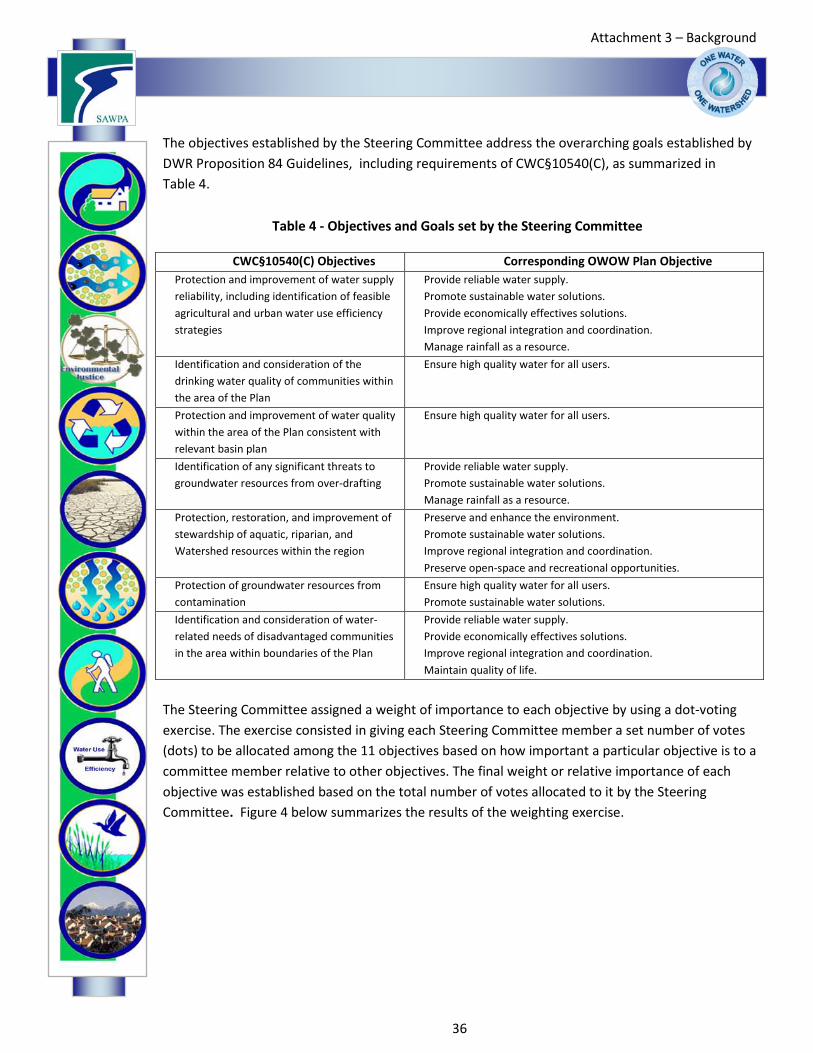
Attachment 3 – Background
36
The objectives established by the Steering Committee address the overarching goals established by DWR Proposition 84 Guidelines, including requirements of CWC§10540(C), as summarized in Table 4.
CWC§10540(C) Objectives Corresponding OWOW Plan Objective Protection and improvement of water supply reliability, including identification of feasible agricultural and urban water use efficiency strategies
Provide reliable water supply. Promote sustainable water solutions. Provide economically effectives solutions. Improve regional integration and coordination. Manage rainfall as a resource.
Identification and consideration of the drinking water quality of communities within the area of the Plan
Ensure high quality water for all users.
Protection and improvement of water quality within the area of the Plan consistent with relevant basin plan
Ensure high quality water for all users.
Identification of any significant threats to groundwater resources from over-drafting
Provide reliable water supply. Promote sustainable water solutions. Manage rainfall as a resource.
Protection, restoration, and improvement of stewardship of aquatic, riparian, and Watershed resources within the region
Preserve and enhance the environment. Promote sustainable water solutions. Improve regional integration and coordination. Preserve open-space and recreational opportunities.
Protection of groundwater resources from contamination
Ensure high quality water for all users. Promote sustainable water solutions.
Identification and consideration of water-related needs of disadvantaged communities in the area within boundaries of the Plan
Provide reliable water supply. Provide economically effectives solutions. Improve regional integration and coordination. Maintain quality of life.
The Steering Committee assigned a weight of importance to each objective by using a dot-voting exercise. The exercise consisted in giving each Steering Committee member a set number of votes (dots) to be allocated among the 11 objectives based on how important a particular objective is to a committee member relative to other objectives. The final weight or relative importance of each objective was established based on the total number of votes allocated to it by the Steering Committee. Figure 4 below summarizes the results of the weighting exercise.
Table 4 - Objectives and Goals set by the Steering Committee

Attachment 3 – Background
37
During subsequent meetings and workshops, the Steering Committee and the Pillar Groups identified Strategies to meet the objectives and targets to measure the extent to which the objectives are being met. As shown in Table 5 below, there is a strong correlation between objectives, strategies, and targets.
Goals & Objectives Strategies Targets Provide reliable water supply.
Promote sustainable water solutions.
Use rainfall as a resource.
Increase storage.
Reduce demand.
Desalinate groundwater.
Recycle water.
Consider stormwater as water supply.
Value water differently.
Recycle and reuse 100% of wastewater.
Store water to account for half of Watershed demand for 3 years.
Reuse all of Santa Ana River flow at least once.
Reduce potable water use by 20%.
Capture and recharge 80% of rainfall.
Preserve and enhance the environment.
Maximize preservation and use of native plants.
Fill gaps in riparian corridors to provide wetlands and linkages between open space and natural habitat.
Meet California Flood SAFE goals & construct soft bottom flood systems.
Ensure high-quality water. Develop risk-based water quality improvements.
Meet water quality standards.
Remove salt from Watershed to improve salt balance.
Project Readiness
9%
Cost Match7%
Cost Effectivness12%
Water Supply Benefits
22%
Water Quality/Salt
Management Benefits
12%
Restoration/Flood Management
Benefits10%
Watershed-Focused Recreation
Benefits5%
Active Partnerships9%
EJ and Tribe Benefits
4%
Climate Change2% Natural
Hydrology &
Land Use8%
Figure 4 - Relative Importance of Objectives
Table 5 - Objectives, Strategies, and Targets Identified

Attachment 3 – Background
38
Goals & Objectives Strategies Targets Provide recreational opportunities.
Complete the SAR Trail and connect all tributary corridors to.
Assure adequate water supply and safe wastewater treatment and disposal.
Reduce GHG emissions from water management activities.
Incorporate integrated water planning in General Plans.
Manage public property for more than one use.
Increase resource efficient land use.
Provide economically effective solutions.
Improve regional integration and coordination.
Create watershed governance.
Implement Watershed-wide education programs.
The process used to determine criteria for developing regional priorities
Finally, in order to prioritize projects based on the degree to which they meet the Plan goals and objectives, SAWPA staff and consultants developed Evaluation Criteria. Evaluation Criteria are considered more implementable and quantifiable than the overarching goals and objectives of the Plan, and thus are useful for the ranking of projects and to monitor the performance of projects upon implementation.
Some evaluation criteria were in turn divided into sub-criteria that provide additional granularity to the definition of a criterion. For example, “providing water supply benefits” is further divided into demand management, reuse, storage, and new local supplies. A performance measure was created for each criterion and sub-criterion to quantitatively determine the degree to which the latter are being met by each project (Table 6 below).

Attachment 3 – Background
39
Project Evaluation Criteria
Sub-criteria Performance Measures
1. Provide water supply benefits
Reduce water demand. Increase water reuse in Watershed.
Increase water storage in the Watershed.
Create new local water supply.
Reduction in imported water (in acre-feet per year) from conservation, recycling, desalination, storage, transfers, groundwater recharge/storage/conjunctive management, and/or other sources of new water
2. Provide restoration and flood management benefits
Number of acres of new or restored habitat or flood plain protected.
Number of acres of new or restored habitat or flood plain protected
3. Provide water quality and salt management benefits
Meet all applicable water quality standards.
Improve salt balance in the Watershed.
Volume of stormwater captured (acre-feet/year) or water treated (including salt management) in tons/year
4. Provide recreational benefits
Provide recreational benefits. Acres of open space/parks created.
5. Provide benefits and avoid adverse impacts to disadvantaged communities and Native American tribes
Provide benefits and avoid adverse impacts to disadvantaged communities.
Provide benefits and avoid adverse impacts to Native American tribes.
Benefits to disadvantaged communities (Yes/No)
Benefits to Native American tribes (Yes/No)
6. Reduce greenhouse gas emissions from water management activities
Reduce greenhouse gas emissions from water management activities.
Provide carbon sequestration.
GHG Score:
0 = no information
3 = narrative description only
4 = numeric estimate without specific actions
5 = numeric estimate with specific actions
7. Increase resource-efficient land use and reduce impact on natural hydrology
Increase resource-efficient land use and reduce impact on natural hydrology.
Uses LID or other resource-efficient land use (Yes/No)
Adversely impacts or changes natural hydrology (Negative impacts/No impacts/Positive impacts).
8. Cost match
Percent of project cost funded and secured from other sources.
Percent of project cost funded and secured from other sources.
9. Cost effectiveness Relative to similar projects.
A standardized per unit cost indicator (e.g., $/AF or $/acres of habitat).
10. Project readiness Project readiness. Project readiness score:
1 = Planning studies completed
2 = Conceptual design (15%) completed
3 = Preliminary design (30%) completed
4 = Final design (100%) completed
5 = Project ready for construction bids (permits secured)
11. Increase active participation.
Increase active participation.
Partnership Score:
1 = No or limited partnership
3 = Coordination with others
5 = Cost-share or in-kind funding partner
Table 6 - Evaluation Criteria
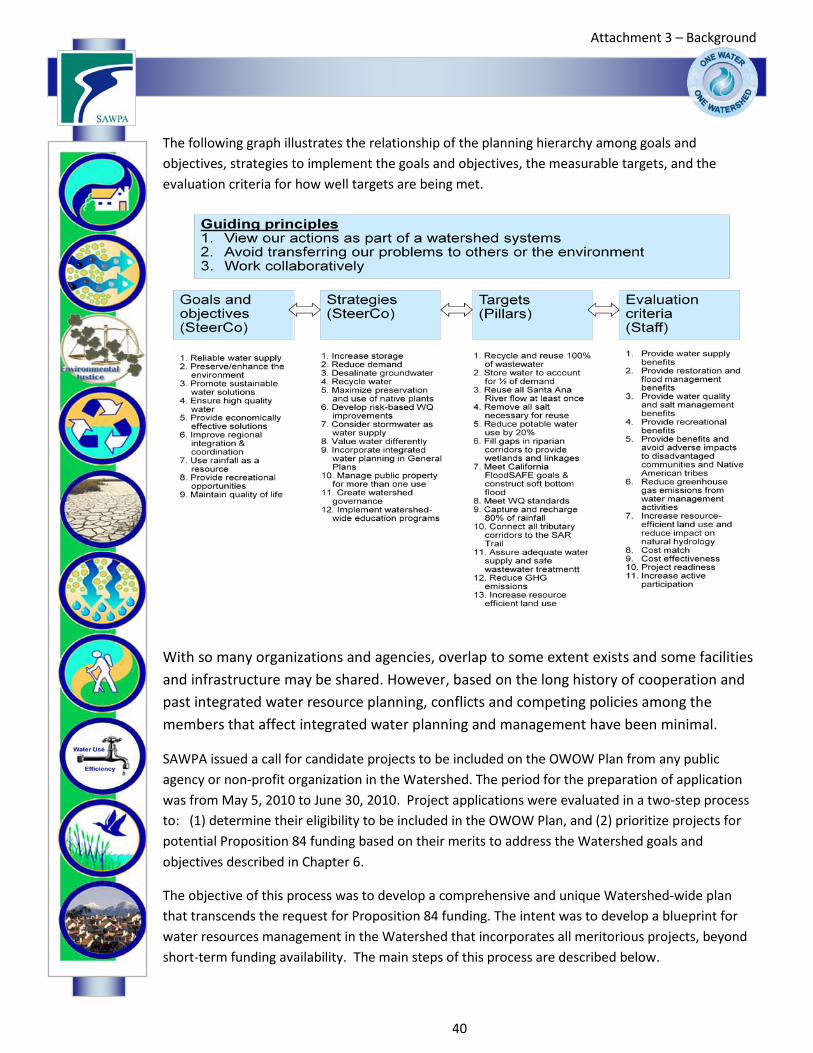
Attachment 3 – Background
40
The following graph illustrates the relationship of the planning hierarchy among goals and objectives, strategies to implement the goals and objectives, the measurable targets, and the evaluation criteria for how well targets are being met.
With so many organizations and agencies, overlap to some extent exists and some facilities and infrastructure may be shared. However, based on the long history of cooperation and past integrated water resource planning, conflicts and competing policies among the members that affect integrated water planning and management have been minimal.
SAWPA issued a call for candidate projects to be included on the OWOW Plan from any public agency or non-profit organization in the Watershed. The period for the preparation of application was from May 5, 2010 to June 30, 2010. Project applications were evaluated in a two-step process to: (1) determine their eligibility to be included in the OWOW Plan, and (2) prioritize projects for potential Proposition 84 funding based on their merits to address the Watershed goals and objectives described in Chapter 6.
The objective of this process was to develop a comprehensive and unique Watershed-wide plan that transcends the request for Proposition 84 funding. The intent was to develop a blueprint for water resources management in the Watershed that incorporates all meritorious projects, beyond short-term funding availability. The main steps of this process are described below.

Attachment 3 – Background
41
The data and technical analysis collected/performed and how that data is managed
Managing water resources data at a watershed-wide level in a centralized and consistent manner, and providing access to this information to key stakeholders and the public at large is key for the implementation, monitoring and updating of the OWOW Plan. Properly managed data helps SAWPA and other agencies and stakeholders in the watershed to identify water quantity and quality issues, assess and develop potential solutions, quantify the anticipated impacts of these solutions, and measure the extent to which anticipated impacts materialize. In addition, having a single depository of data with a consistent format allows the sharing of information among stakeholders, and the integration of watershed data with other databases at the State level.
SAWPA already provides tools for the watershed that facilitate the management, dissemination and integration of data. These tools can be further enhanced in the context of the OWOW Plan, and become a source of data for future studies and for the monitoring of the impact of the plan and specific projects in reaching the plan objectives.
One such tool is the Santa Ana Watershed Data Management System (SAW DMS), developed by SAWPA under contract with the State Water Resources Control Board. SAW DMS is a watershed-wide data management structure that supports programs and research that evaluate and promote the health of water quality in the watershed. The database incorporates data from existing systems as well as data not currently managed as part of a larger system. The project also includes a Web portal whereby users can access the data via the Internet.
The database manages data associated with watershed-wide Ambient Groundwater Recalculation (AWQ). This data includes well information (location and construction), groundwater level, and groundwater quality. A custom data portal application (GIS Data Query Tool) allows users to access and download the data from a Web portal on the SAWPA Website. The database and Web portal were installed on the SAWPA computer network in August 2005.
In addition, SAW DMS includes data for the Santa Ana River Annual Water Quality Report (SAR) and data for TMDL efforts in the San Jacinto and the middle Santa Ana River. Data update processes were made more efficient through the development of standard data exchange templates, or Electronic Data Deliverable (EDD) templates, and coordination with agencies to provide data using these templates. Data loading and quality control tools were then built to efficiently load data into SAW DMS using the EDDs. Reporting and query tools were developed to streamline reporting tasks for the AWQ and SAR projects. The Web portal developed in Phase I also was expanded to include additional data content, and the GIS Data Query Tool was enhanced based on user comments.
Data in SAW DMS is in a format compatible with the State Surface Water Ambient Monitoring Program (SWAMP).
Attachment 3 – Background
42
SAWPA will continue improving its database in terms of types of data to be included, ease of uses, accessibility, and compatibility with other relevant databases in the State.
SAWPA will develop a plan to monitor the implementation of the OWOW Plan and the specific projects herein included. The monitoring will take place at two levels, plan and project, to:
• Ensure progress is being made toward meeting the objectives of the Plan.
• Ensure specific projects identified in the Plan are being implemented as planned in terms of schedule, budget, and technical specifications.
• Identify potential necessary modifications to the Plan or to specific projects, in order to more efficiently and effective accomplish the goals and objectives of the Plan.
• Provide transparency and accountability regarding the disbursement and use of funds for project implementation.
The project sponsor will be responsible for providing the information necessary to conduct the monitoring and collaborate with SAWPA and other stakeholders in the Watershed in the identification of adaptive measures.
Program management and project administration will be performed by SAWPA, upon receipt of funding, following a process similar to the one used for projects funded through Propositions 13 and 50. Through this process, SAWPA expects to achieve, as a minimum, the same level of success in implementing projects to further the goals of the OWOW Plan. As with SAWPA’s past efforts, this process consists of measures to ensure consistency in the review, preparation, and submission of all documentation pertaining to grant funded projects, and to meet the objectives of the California Department of Water Resources (DWR) and State Water Resources Control Board (SWRCB), as well as the goals of the OWOW Plan.
SAWPA will serve as administrator for agreements between State Agencies and SAWPA, as well as program manager for the various programmatic requirements and related activities required through these agreements. SAWPA’s authority and administrative policy to serve as program manager for such agreements was granted by the SAWPA Commission in April 2001. This authority provides SAWPA the means to implement the specific terms and conditions of the sub-agreements which the implementing parties must follow.
Technical Analysis
As administrator for the OWOW plan, numerous sources of technical information and data sets were collected in order to develop the water management needs of the Plan. Shown below is a table most of the key technical studies that were collected, reviewed and applied by SAWPA and the Pillars to evaluate the current conditions, the historic data and projections for the future. These studies are often the product of multi-agency task forces that were administered by SAWPA and reflect the key technical components for the planning process.

Attachment 3 – Background
43
Technical analysis and feasibility analysis is also performed on a project level basis as well for the projects submitted as part of the OWOW prioritization list of implementation projects. As part of the Call for Projects, data is acquired for each project that provide technical project details such as project location, metrics for benefits such as acre-feet of water recharged or stored, number of acres of habitat restored, volume of stormwater captured or treated, amount of greenhouse gas emissions, and project readiness. Thereafter, priority projects are screened by an independent review panel to assure that the project is technically feasible and meets the project proponent’s claims on the project information form. Thereafter, for those projects that are selected for funding, an even more detailed technical evaluation and economic analysis is required and will be submitted to SAWPA for review. Depending on the funding program such as the DWR Proposition 84 IRWM program, the projects submitted will be required to then complete detailed evaluation forms as part of the grant application that assure technical and economic feasibility before implementation.
Title Author Date
Climate Change Impacts
Santa Ana Watershed Project Authority, Integrated Water Management Plan SAWPA 2009
Presenting Uncertainty About Climate Change to Water Resource Managers, A Summary of Workshops with the Inland Empire Utilities Agency
Rand Corporation
2008
Presentation of Uncertainty About Climate Change Modeling to SAWPA Area Rand Corporation 2008
Water Quality
Changes in Groundwater
Basins and Surface Water
Santa Ana River Wasteload Allocation Model Report Wildermuth Environmental, Inc. 2009
Recomputation of Ambient Water Quality in the Santa Ana Watershed for the Period 1987 to 2006, Final Technical Memorandum
Wildermuth Environmental, Inc. 2008
Water Supply and Water
Quality
Chino Basin Recharge Master Plan Update Wildermuth Environmental, Inc. 2010
Salinity Management Study, Technical Memorandum 1-3 CDM 2010
Middle Santa Ana River Watershed Bacterial Indicator TMDL Triennial Report CDM 2010
Santa Ana Watershed Salinity Management Program, Phase 1-2
CDM, Carollo and Wildermuth Environmental, Inc. 2010
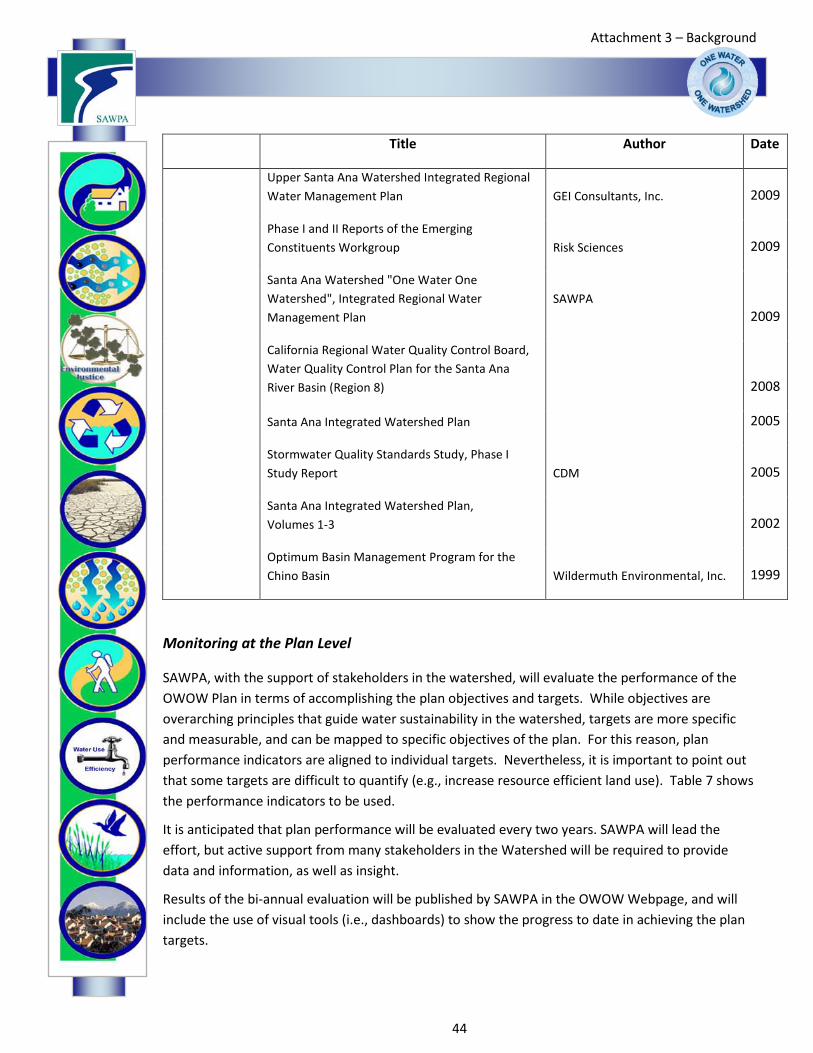
Attachment 3 – Background
44
Title Author Date
Upper Santa Ana Watershed Integrated Regional Water Management Plan GEI Consultants, Inc. 2009
Phase I and II Reports of the Emerging Constituents Workgroup Risk Sciences 2009
Santa Ana Watershed "One Water One Watershed", Integrated Regional Water Management Plan
SAWPA 2009
California Regional Water Quality Control Board, Water Quality Control Plan for the Santa Ana River Basin (Region 8) 2008
Santa Ana Integrated Watershed Plan 2005
Stormwater Quality Standards Study, Phase I Study Report CDM 2005
Santa Ana Integrated Watershed Plan, Volumes 1-3 2002
Optimum Basin Management Program for the Chino Basin Wildermuth Environmental, Inc. 1999
Monitoring at the Plan Level
SAWPA, with the support of stakeholders in the watershed, will evaluate the performance of the OWOW Plan in terms of accomplishing the plan objectives and targets. While objectives are overarching principles that guide water sustainability in the watershed, targets are more specific and measurable, and can be mapped to specific objectives of the plan. For this reason, plan performance indicators are aligned to individual targets. Nevertheless, it is important to point out that some targets are difficult to quantify (e.g., increase resource efficient land use). Table 7 shows the performance indicators to be used.
It is anticipated that plan performance will be evaluated every two years. SAWPA will lead the effort, but active support from many stakeholders in the Watershed will be required to provide data and information, as well as insight.
Results of the bi-annual evaluation will be published by SAWPA in the OWOW Webpage, and will include the use of visual tools (i.e., dashboards) to show the progress to date in achieving the plan targets.

Attachment 3 – Background
45
Plan Objectives Plan Targets Plan Performance Provide reliable water supply
Promote sustainable water solutions
Use rainfall as a resource
Recycle and reuse 100% of wastewater Store water to account for half of watershed demand for 3 years Reuse all of Santa Ana River flow at least once Reduce potable water use by 20% Capture and recharge 80% of rainfall Reduce GHG emissions from water mgmt activities Assure adequate water supply and safe wastewater treatment and disposal Provide benefits and avoid adverse impacts to disadvantaged communities and Native American tribes
Percentage of effluent in watershed being reused Percentage of watershed 3-year demand in storage Ratio OC recharge/Total SAR flow Percentage of water use reduction versus 2010 baseline Percentage of rainfall being captured and/or recharged Tons of CO2eq mitigated or sequestered Ratio No. of NPDES violations/No. of NPDES holders Number of DACs and Native American tribes involved
Preserve and enhance the environment
Fill gaps in riparian corridors to provide wetlands and linkages between open space and natural habitat
Meet California FloodSAFE goals & construct soft bottom flood systems
Increase resource efficient land use
Percent reduction in riparian corridor gap
Miles of soft bottom flood systems
Acreage of efficient land use
Ensure high quality water Meet all water quality standards
Remove salt from watershed to improve salt balance
Ratio of violations/NPDES permits
Tons of salt removed from the watershed
Provide recreational opportunities
Complete the SAR Trail and connect all tributary corridors to
Percent reduction in SARI Trail corridor gap
Provide economically effective solutions
Not applicable
Not applicable
Improve regional integration & coordination
Increase active participation in the Watershed Not applicable
Monitoring at the Project Level
In addition to monitoring the performance of the OWOW Plan as a whole, the performance of specific projects in the OWOW Plan receiving funding will be evaluated every six months. The evaluation will be led by SAWPA, but will require extensive participation for the sponsor of the project in question.
Table 7 – Project Performance Evaluation Measures

Attachment 3 – Background
46
Similar to the performance review at the plan level, the project performance review will be based on performance measures developed from the performance measures used to evaluate project applications. Table 8 shows the project performance evaluation measures to be used.
Project Evaluation Criteria Sub-criteria Performance Measures 1. Provide water supply benefits
1.1 Reduce water demand 1.2 Increase water reuse in watershed 1.3 Increase water storage in the
watershed 1.4 Create new local water supply
1.1 Percent of anticipated water demand reduction achieved
1.2 Percent of anticipated effluent reuse
1.3 Percent of anticipated water storage
1.4 Percent of anticipated new water supply created
2. Provide restoration and flood management benefits
2.1 Create or restore riparian habitat 2.2 Create or restore soft-bottom flood
control systems
2.1 Percent of anticipated habitat creation or restoration
2.2 Percent of anticipated soft-bottom restoration
3. Provide water quality and salt management benefits
3.1 Meet all applicable water quality standards
3.2 Improve salt balance in the watershed
3.1 Compliance with applicable water quality standards (yes/no)
3.2 Percent of anticipated salt removal
4. Provide recreational benefits
4.1 Provide recreational benefits
4.1 Percent of anticipated recreational trails created
5. Provide benefits and avoid adverse impacts to disadvantaged communities and Native American tribes
5.1 Provide benefits and avoid adverse impacts to disadvantaged communities
5.2 Provide benefits and avoid adverse
impacts to Native American tribes
5.1 Percent of anticipated number of people benefited
5.2 Percent of anticipated number of
people benefited
6. Reduce greenhouse gas emissions from water management activities
6.1 Reduce greenhouse gas emissions from water management activities
6.2 Provide carbon sequestration
6.1 Percent of CO2eq mitigated versus target
6.2 Percent of CO2 sequestered per
year (tons) versus target
7. Adherence to project schedule and budget
7.1 Adherence to project schedule
7.2 Adherence to project budget
7.1 Degree of adherence to project schedule
7.2 Degree of adherence to project budget
Results of the semi-annual project evaluation will be published by SAWPA in the OWOW Webpage, and will include the use of visual tools (i.e., dashboards) to show the progress to date in the implementation of each project.
Table 8 – Project Performance Evaluation Measures

Attachment 3 – Background
47
Project Implementation Tracking As part of SAWPA’s process to provide program management and administration of projects through the integrated regional water management planning process, SAWPA has instituted a series of measures to assure technical and economic feasibility, as well as environmental compliance for each project as follows.
CEQA Review
SAWPA will obtain all documentation needed from the CEQA lead agency to understand the project, as well as the requirements for environmental compliance or mitigation. SAWPA will review available information for compliance with CEQA and confirm that the necessary measures for compliance or mitigation have been addressed.
Schedule and Budget Tracking
SAWPA is required to periodically compile, summarize, and update schedule and budget information for all contracted projects. The purpose of maintaining and tracking project schedule and budget is to have readily available program and project information.
SAWPA maintains an automated Program Information Management System (System) to maintain and track data on the program, its projects, and their phase tasks and status. The following steps summarize the documentation required for schedule and budget tracking and maintenance:
• The construction agencies will prepare and submit cash flow projections, budget forecasts, and schedule information for each contracted project.
• Cash flow projections will be submitted for the remainder of the project period.
• Project schedule information including schedule of each phase and task of work completed will be submitted in accordance with the work breakdown structure for the project.
• Compile and summarize schedule and budget information into the System.
• Update schedule and cash flow projection information to the System at least once per quarter.
Site Visits
SAWPA staff performs site visits to better understand project progress, issues, and schedule. The constructing agency must ensure that the Grant Funding Agency, or any authorized representatives thereof, has suitable and reasonable access to the project site at reasonable times during project construction, and thereafter for the useful life of the project.

Attachment 3 – Background
48
Documentation Requirement
Each Construction Agency is required to submit project documentation to assure compliance with the less specific terms of the agreement entered into between SAWPA and the individual Constructing Agency.
Periodic Review and Evaluation
SAWPA will perform a project review or otherwise evaluate any project to determine compliance with the project funding criteria and requirements at any time, or if questions about the proper use or management of the funds arise as indicated in the agreement.
Agreement Deliverables
Agreement deliverables required per the Program Management and Administration Agreement include project status reports for the Grant Funding Agency (submit monthly), quarterly reports (submit 30 days after the end of each quarter ending January, April, July, and October for the duration of the contract), public outreach documents, program newsletters, and other documents.
Invoice Procedure
SAWPA uses an internal invoice review checklist to insure that all invoices and progress documentation submitted by the Constructing Agencies meet SAWPA’s, as well as the Grant Funding Agency’s, requirements. The purpose of the invoice review checklist is to ensure that invoice documents provided by the Constructing Agencies are complete and accurate.
SAWPA, through its contract with each Construction Agency, requires the Constructing Agency to:
• Maintain books, records, and other material relative to the Project in accordance with generally accepted government accounting standards.
• Retain books, records, and other material for a minimum of three years after Project completion.
• Make available books, records, and other material at all reasonable times for inspection, copying, and audit by the Grant Funding Agency or State auditors, or any authorized representatives thereof.
Audits
The Grant Funding Agency is authorized to review and obtain copies of all SAWPA’s records pertaining to the Memorandum of Understanding and subsequent contracts. To manage SAWPA finance department workflow and minimize program cost, the Grant Funding Agency will give SAWPA 30 days notice, if possible, for any detailed audit or time-consuming review of financial information.

Attachment 3 – Background
49
Closeout
SAWPA has developed a project closeout procedure to ensure that each project is closed in a manner that provides an auditable file. This procedure includes verifying completion of all required closeout activities and receipt of all needed documents and certifications upon completion of the project.
Each project will utilize the project closeout procedure provided for in the agreement. SAWPA will review and approve the completeness of the closeout process and transmit a completed project notice for approval from the Grant Funding Agency.
Additionally, SAWPA maintains project accounts in accordance with generally accepted government accounting standards. The following activities have been implemented:
• Establish an official Project file.
• Maintain separate accounts that depict all amounts received and expended on the Project, including all grant funds received.
• Maintain separate accounts that depict all income received which is attributable to the Project, specifically including any income attributable to grant funds disbursed under this contract.
• Maintain an accounting system which accurately depicts final total costs of the Project, including both direct and indirect costs.
• Establish accounts and maintain records as necessary for the State to fulfill reporting requirements, including any and all reporting requirements under federal tax statutes or regulations.
Adaptive Management
In as much as this Plan presents a snapshot of the innovative projects and summarizes the plans and projects of many agencies, it will quickly age. The dynamic nature of projects and plans in the Watershed will result in the need for frequent updates. Because the Plan will be used by agencies in the Watershed to help integrate individual plans and to focus funding opportunities on projects that are most effective and ready to proceed, the information contained in the Plan must remain current to be effective.
In recognition of the ever changing aspects of the planning process, the OWOW Steering Committee will update and refine this Plan every two to five years. The Plan update will take into consideration recent development in the Watershed, such as projects implemented since the last review, and new understanding of the Watershed issues. Furthermore, the results of the bi-annual performance review will be used to identify potential modification to the Watershed strategy.
Additionally, revisions to this Plan’s strategies aimed at sustainability of the Watershed will develop over time forming a culture for the Watershed community. Future revisions of this document will
Attachment 3 – Background
50
capture these developments, new projects that are created, and projects currently listed that develop and evolve.
As new funding opportunities arise to support the implementation of the remaining water resource projects, SAWPA will continue to pursue these opportunities. With the support of local and State agencies, further progress can be made in meeting long-term goals of water sustainability for the region and the State.
How Integrated Resource Management Strategies will be Employed
In the early stages of the planning process, various resource management strategies were evaluated. In 2000, as reflected in SAWPA’s early integrated water resource plans, six resource management strategies were developed that covered a broad spectrum of water resource planning. At the time, the integration of these six strategies: 1) Groundwater Cleanup and Purification, 2) Water Storage, 3) Flood Protection, 4) Wetlands, Habitat, and the Environment, 5) Water Recycling, and 6) Recreation and Conservation was considered innovative in proposing a new way to support the needs of water resources in a region. Past water resource management practices focused primarily on water supply functions without considering the more expansive and integrated benefits of integrating other resource management strategies. The groundwork for implementation of this approach was set into place with the passage of Chapter 6 Watershed Protection Program, Article 5 Southern California Integrated Watershed Program under Proposition 13 Safe Drinking Water, Clean Water, Watershed Protection and Flood Protection Act in the Year 2000, in which $235 million dollars was directed to support implementation of integrated multi-benefit projects in the Santa Ana Region. Using this template, the State Department of Water Resources adopted SAWPA’s integrated regional approach with the development of new guidelines for statewide implementation of this concept under the Integrated Regional Water Management Program for Proposition 50, Chapter 8 in the Year 2002. Under this program, integrated regional strategies were encouraged for the management of water resources and to provide funding, through competitive grants, for projects that protect communities from drought, protect and improve water quality, and improve local water security by reducing dependence on imported water. The program was jointly administered by the Department of Water Resources and the State Water Resources Control Board and was intended to promote an integrated and regional approach to water management. To further emphasize the importance of integrated regional water management planning, the State incorporated the integrated resource management approach into its California Water Plan Update 2005 and again in its 2009 Update. This latest plan emphasizes the value of an integrated regional water management approach using multiple resource management strategies as the first of 13 objectives for the implementation of the California Water Plan.

Attachment 3 – Background
51
In 2006, in light of new threats to water resources in the Santa Ana region and to the State overall, as previously discussed as the Four Horsemen of the Apocalypse, SAWPA reviewed its past resource management strategies, the resource management strategies defined in the California Water Plan, previous DWR guidelines for IRWMP development, and local water resource needs. A total of ten broad-based resource management strategies were defined and are depicted in the graphic below.
Integration of the Water PillarsLand Use
To assure that these resource management strategies for the OWOW Plan are comprehensive and fully reflect the resource management strategies as defined in the California Water Plan Update 2009, the OWOW Plan resource management strategies or Pillars are aligned with the Resource Management Strategies identified in the Proposition 84 Guidelines, as summarized in the following table.

Attachment 3 – Background
52
Pillar Group Corresponding Prop 84 Guidelines Resource Management Strategies
Land Use and Water Increase water supply Improve water quality Practice resource stewardship
Water Supply Reliability Reduce water demand Improve operational efficiency and transfers Increase water supply
Water Recycling Increase water supply Improve water quality
Water Use Efficiency Reduce water demand
Water Quality Improve water quality
Environmental and Habitat Restoration
Practice resource stewardship
Stormwater Risk Assessment Improve flood management
Environmental Justice Included in Guidelines as part of Impact and Benefit Standard
Parks and Open Space Not explicitly mentioned in Guidelines
Climate change Included in Guidelines as separate standard
In order to manage the initial planning work, the stakeholders were organized into ten workgroups, or Pillars, centered on a specific water resource management issue. Discussion of the formation of the Pillars and how their strategies were developed for the region is previously discussed under the RWMG Governance section.
How the IRWM Plan will be implemented and what impacts and benefits are expected
The IRWM Plan will be implemented by the efforts of SAWPA and the stakeholders who are vested in achieving the OWOW vision and goals. As funding opportunities arise, SAWPA and the OWOW Steering Committee will be on the forefront of working with stakeholders to maintain a fair and transparent process to implement projects from the OWOW Plan priority list and help secure funding. This is particularly important as State funding opportunities arise, like Proposition 84, designed for IRWM plans and projects to be administered by RWMGs.
Table 9 – Management Strategies Identified in Proposition 84 Guidelines

Attachment 3 – Background
53
Project Submittal Process
From May 5 to June 30, 2010, SAWPA conducted a “Call for OWOW Projects” and received candidate projects from agencies in the Watershed for inclusion in the OWOW Plan and potential Proposition 84 funding. Project sponsors were required to submit an online application with the following information:
• Project and agency name
• Type of project (construction, study/investigation, program)
• Location
• Project cost, requested funding, and matching sources
• Project description, including goals and benefits
• Anticipated environmental impacts and/or benefits (land use, natural hydrology, greenhouse gas emissions mitigation)
• Benefit/impacts to disadvantaged and Tribal communities
• Number of communities and/or sub-watersheds to be benefited
• Water resources management strategies being addressed by the project (e.g. conservation, reuse, restoration, recreation, etc.)
• Project readiness status (planning, design, permitting, CEQA/NEPA)
On June 30, the period for the reception of applications for projects to be included in the OWOW Integrated Watershed Management Plan (the OWOW Plan) ended with a high degree of participation. A total of 297 candidate projects were received from 64 diverse agency sponsors from throughout the Watershed. Project sponsors include water utilities, cities and counties,
Figure 5 - Project Locations

Attachment 3 – Background
54
NGOs, the USDA Forest Service, and private-public partnerships. As shown in the map above, candidate projects are well distributed throughout the Watershed.
During the call for projects, sponsors were encouraged to consider Watershed-wide, integrated projects that would provide multiple benefits to more than one agency or region of the Watershed. In addition, strong emphasis was placed on the need to benefit disadvantaged and Tribal communities. As shown on Figure 6, nearly 70% of received applications are for projects that provide a benefit for the entire watershed, multiple municipalities, or multiple sub-watersheds.
Furthermore, candidate projects provide a variety of benefits, as shown in Figure 7. Guaranteeing a sustainable, reliable, drought-proof and equitable water supply is one of the main objectives of the OWOW Plan and of the mandate of many relevant agencies in the Watershed. This results in 60% of the candidate projects being related to water supply. Nevertheless, the remaining 40% address
water quality, habitat restoration and flood control, and recreational and open space needs of the Watershed. Many of the projects provide more than one type of benefit.
Finally, a significant number of candidate projects will benefit disadvantaged (40%) and Tribal (14%) communities in the Watershed (Figures 8 and 9).
Candidate projects have a total cost estimate of $3,582 million, of which $1,682 million (47%) is being requested for grant funding. The remaining $1,900 million (53%) will be covered through a combination of local funds ($1,355 million), Federal contributions, and SRF loans.
22%
40%6%
32%
Entire watershed
Multiple municipalities
Multiple sub-watersheds
40%
60%
Yes No
60%18%
17%
5%
Water supply
Water quality
Restoration/ flood control
Recreation
Figure 6 - Project Benefit Breakdown by Area Affected
Figure 7 -Project Benefit Breakdown by Objective
Figure 8 - Projects Benefiting Disadvantaged Communities

Attachment 3 – Background
55
On average, each project is requesting grant funds in the amount of $5.7 million, although the amount requested varies significantly from $34,000 to $100 million. These funding requirements represent a significant challenge for the Watershed. A novel approach for this Plan, unlike previous efforts, is that the open bottom-up planning process transcends specific funding cycles. Projects are included in the OWOW Plan and ranked based on their merit to address the Watershed’s pressing needs, regardless of available funding opportunities at any given time. As funding programs become available, projects included in the OWOW Plan will be selected for funding.
Project Evaluation Process
Received projects were evaluated by SAWPA staff in a transparent manner based on the information provided by the applicant and a pre-established process, described below, to determine: (1) their eligibility to be part of the OWOW Plan, and (2) their priority to receive Proposition 84 funding.
This two-step process had as an objective the development of a comprehensive Watershed plan per DWR guidelines, regardless of which of the projects included in the Plan receive Proposition 84 funding during the current funding cycle. As a result, the Plan will be a blueprint for the improvement of water resources management in the Watershed, and not merely a document for requesting
funding. Projects in the Plan not receiving Proposition 84 funding at this time will be candidates for future funding opportunities, providing an incentive for project sponsors to participate in the Watershed-wide Plan.
Eligibility for OWOW Plan
Projects were selected to be included in the OWOW Plan based on their ability to meet the goals and objectives established by the Steering Committee and Pillar Groups. The anticipated benefit of each project for each of the Plan objectives was provided by project proponents in their applications. This information was used to rank projects. The expected impact and benefit will be further detailed during the different project development phases (i.e., planning, design, CEQA). The
14%
86%
Yes No
Figure 9 - Projects Benefiting Tribal Communities
Figure 10 - Funding Structure of Candidate Projects
Requested State funding
47%
Federal, in-kind, SRF loan
15%
Local contribution
38%
Match53%
100% = $3,582 million
Attachment 3 – Background
56
realized benefit of the projects, both at the watershed aggregated level and at the individual project level, will be monitored as projects are implemented.
Impacts and Benefits With the development of integrated watershed planning, multi-benefit, multi-purpose projects have moved to the forefront and have become one of the primary goals of the OWOW process. The idea of meeting a number of community needs with a single project is not new; however, specialization within agencies that deal with water has often moved these project types to the backburner. Efforts primarily have focused on single purpose projects, and the additional effort required to develop multi-objective solutions has made true multi-benefit projects relatively uncommon. In California, there has been an effort to incentivize collaborative planning through IRWM Planning and associated funding sources.
Some of the earliest multi-benefit water projects were done through a partnership between those interested in flood and groundwater management. Spreading grounds along the front slopes of local mountains have attenuated flood flows and recharged groundwater basins for nearly 100 years. OCWD partnered early with Orange County Flood Control District to provide recharge basins within flood control basins. More recently, IEUA has worked with San Bernardino County Flood Control to modify the operation of the flood control system to maximize recharge opportunities. IRWD has partnered with the Orange County Flood Control District to store recycled water in some flood basins. All of these projects primarily were facilitated by operational changes rather than the construction of new infrastructure, although in some cases the flood system was upgraded. Operational changes could occur only when both parties understood the needs and assets of the other. The development of multi-benefit projects will remain challenging and require sustained effort by agencies that manage water. In the Watershed alone, there are approximately 100 agencies that manage water in some way. This situation is not unique to this Watershed. The Federal government has 12 Federal agencies and eight separate committees all doing water-related work (Udall and Averyt, 2009). Agencies need to prioritize collaborative projects and provide the staff resources to ensure that such projects are developed. The purpose of integrated watershed planning is to consider other disciplines or functional areas when planning and implementing projects. Benefits of this approach far exceed the immediate benefit of reducing controversy surrounding a particular project. Pillar leaders developed a list of potential benefits in a workshop to identify incentives associated with the development of multi-benefit programs and projects. They are listed below:

Attachment 3 – Background
57
Solving problems using a multi-benefit approach prevents the creation of other problems. Often when a single-function project is developed, it has an impact on other water-related areas, often unanticipated. The truth of this statement is often born out in a CEQA or NEPA analysis, where numerous problem areas can be identified.
Multi-benefit problem solving results in no missed opportunities. In a multi-benefit type of approach, a careful exploration of all aspects of a particular project often results in the identification of incremental project changes that can result in large benefits in other areas.
Cost and resource savings for the public can be achieved. When a multi-benefit project is developed, the cost of providing each benefit is often less than providing similar benefits to the public using two or more separate projects. As land and other public resources become scarce, these types of projects are more likely to be undertaken and provide more public benefit.
Developing projects that provide multiple benefits develops trust. As groups develop multi-benefit projects, trust is developed among different constituencies, each interested in a different aspect of water. These groups are more likely to work toward similar solutions in the future if they have successfully developed multi-benefit projects.
Multi-benefit projects are focused on building successful projects, not dispute resolutions. Groups focused on problem solving rather than dispute resolution or litigation save public resources and implement solutions to regional problems faster than they would had they disputed each other’s single-function project.
Development of multi-purpose projects can develop better communication. Through the development of a project, groups that span geography or area of interest develop better communication and trust.
Multi-purpose projects often have diverse sources of funding. As multi-benefit projects are developed, multiple State and Federal funding sources become available providing
cost share opportunities, and increasing the probability that a specific project would move forward.
Development of multi-function projects allows sharing of human resources. Each agency or constituency interested in developing a project has access to individuals with unique abilities and perspectives. Teams formed from diverse groups often develop unique solutions to problems.
Pillar leaders met several times to develop matrices that demonstrated the potential benefits of multi-benefit projects undertaken between Pillars. In other words, how would a multi-benefit project conducted by one Pillar group benefit another group? The purpose of this exercise was to
Benefits of Multi-Purpose Projects
• Water use efficiency projects increase water supply reliability
• Integrated flood management projects also supply groundwater recharge and provide habitat
• Surface storage provides opportunities for local recreation
• Improving water quality of “tainted” local supplies increases reliability

Attachment 3 – Background
58
encourage Pillar leaders to begin to focus on how implementing projects to benefit their constituency can be designed to benefit others.
Drafts of these matrices were taken to three public workshops held in Orange, Riverside, and San Bernardino Counties. At these sessions, stakeholders were invited to comment on the work of the Pillar leaders, as well as suggest their own benefits. Again, the primary purpose of these workshops was to encourage discussion around the concept of designing projects for more than one purpose. As the Pillar leaders completed their final drafts, they developed a list of project types that would benefit more than one Pillar and were worthy of further consideration.
The following table provides a sample of the matrices used by all the Pillar leaders and the Watershed stakeholders to catalog the possible benefits to other Pillars by well designed projects. A project that fulfills a particular Watershed need can be designed to provide other benefits to all other Pillar groups. Maximizing these benefits provides for better projects and better use of public money.
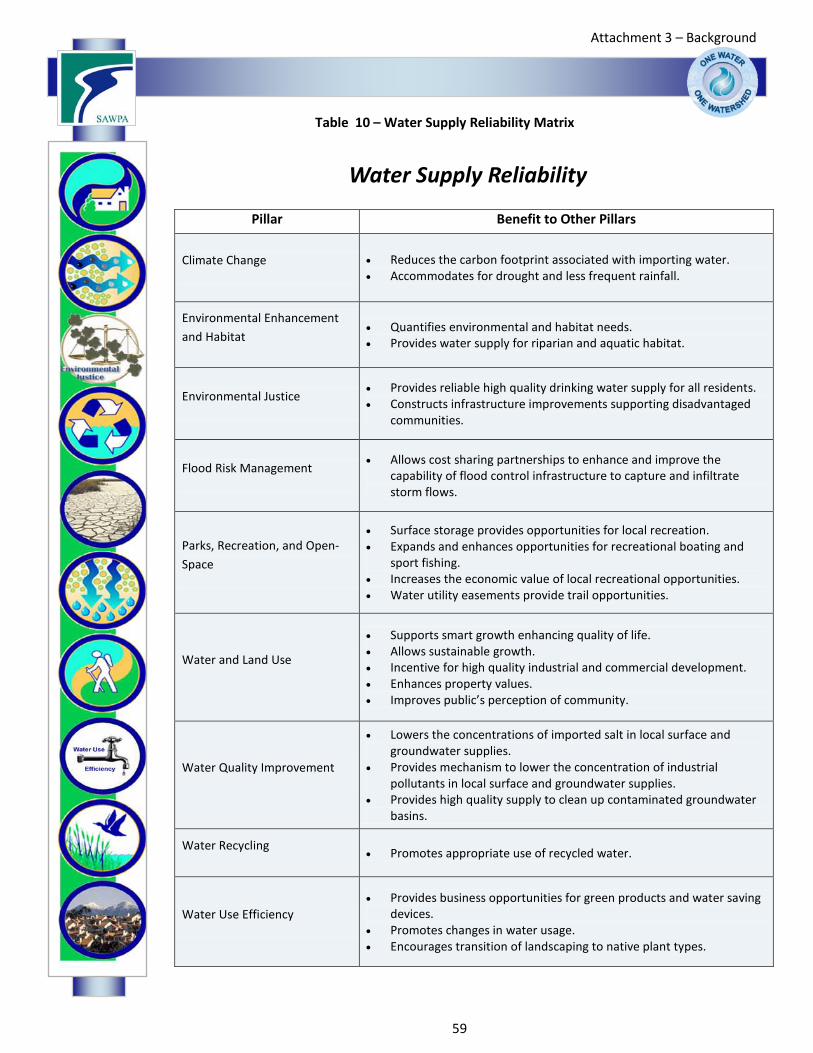
Attachment 3 – Background
59
Pillar Benefit to Other Pillars
Climate Change • Reduces the carbon footprint associated with importing water. • Accommodates for drought and less frequent rainfall.
Environmental Enhancement and Habitat
• Quantifies environmental and habitat needs. • Provides water supply for riparian and aquatic habitat.
Environmental Justice • Provides reliable high quality drinking water supply for all residents. • Constructs infrastructure improvements supporting disadvantaged
communities.
Flood Risk Management • Allows cost sharing partnerships to enhance and improve the
capability of flood control infrastructure to capture and infiltrate storm flows.
Parks, Recreation, and Open-Space
• Surface storage provides opportunities for local recreation. • Expands and enhances opportunities for recreational boating and
sport fishing. • Increases the economic value of local recreational opportunities. • Water utility easements provide trail opportunities.
Water and Land Use
• Supports smart growth enhancing quality of life. • Allows sustainable growth. • Incentive for high quality industrial and commercial development. • Enhances property values. • Improves public’s perception of community.
Water Quality Improvement
• Lowers the concentrations of imported salt in local surface and groundwater supplies.
• Provides mechanism to lower the concentration of industrial pollutants in local surface and groundwater supplies.
• Provides high quality supply to clean up contaminated groundwater basins.
Water Recycling • Promotes appropriate use of recycled water.
Water Use Efficiency • Provides business opportunities for green products and water saving
devices. • Promotes changes in water usage. • Encourages transition of landscaping to native plant types.
Table 10 – Water Supply Reliability Matrix
Water Supply Reliability

Attachment 3 – Background
60
To assure the IRWM plan is implemented, the RWMG will monitor other funding opportunities from other Federal, State, and local sources and track progress. Impacts of the implementation will be reflected by quantitative targets established by the OWOW Pillars and Steering Committee. These targets reflect a strong correlation between previously defined goals and objectives and strategies. The 13 specific targets for the Watershed as shown will help advance and measure the accomplishment of the goals and objectives.
Goals & Objectives Strategies Targets Provide reliable water supply
Promote sustainable water solutions
Use rainfall as a resource
Increase storage
Reduce demand
Desalinate groundwater
Recycle water
Consider stormwater as water supply
Value water differently
Recycle and reuse 100% of wastewater
Store water to account for half of watershed demand for three years
Reuse all of Santa Ana River flow at least once
Reduce potable water use by 20%
Capture and recharge 80% of rainfall
Preserve and enhance the environment
Maximize preservation and use of native plants
Fill gaps in riparian corridors to provide wetlands and linkages between open space and natural habitat
Meet California FloodSAFE goals & construct soft bottom flood systems
Ensure high quality water Develop risk-based water quality improvements
Meet water quality standards
Remove salt from Watershed to improve salt balance
Provide recreational opportunities
Complete the SAR Trail and connect all tributary corridors to
Assure adequate water supply and safe wastewater treatment and disposal
Reduce GHG emissions from water management activities
Incorporate integrated water planning in General Plans
Manage public property for more than one use
Increase resource efficient land use
Provide economically effective solutions
Improve regional integration & coordination
Create watershed governance
Implement Watershed-wide education programs
Table 11 - Goals & Objectives, Strategies, and Targets Used for Project Selection

Attachment 3 – Background
61
For an existing IRWM Plan, describe how the Plan meets the current IRWM plan standards
When the DWR IRWM plan standards were first released, the draft OWOW Plan was found to be remarkably in tune with most of the new IRWM standards. Some details of the OWOW Plan were not as fully described as defined in the DWR IRWM Guidelines for the new IRWM Plan standards so the OWOW Pillars and SAWPA staff worked together to review the new DWR standards that were finalized and released on May 5, 2010, to assure that all of the standards were met, described and fully documented in the IRWM Plan scheduled for adoption by the RWMG in December 2010. Shown below is a table that relates each of the IRWM plan standards to where they can be found in the OWOW Plan.
IRWM Plan Standard Refer to section… Governance Chapter 1 – One Water One Watershed Program Region Description Chapter 3 – Regional Description Objectives Chapter 6 – Regional Goals and Objectives Resource Management Strategies Chapter 5 – Resource Management Strategies Integration Chapter 1 – One Water One Watershed Program
Chapter 4 – Institutional Setting and Current Collaborative Efforts
Project Review Process Chapter 7 – Regional Projects Impact and Benefit Chapter 8 – Benefits of Sustainable Integrated
Solutions Plan Performance and Monitoring Chapter 9 – Strategy Implementation (section 9.2) Data Management Chapter 9 – Strategy Implementation (section 9.1) Finance Chapter 2 – Funding Technical Analysis Chapter 7 – Regional Projects Relation to Local Water Planning Chapter 4 – Institutional Setting and Current
Collaborative Efforts Chapter 5 – Resource Management Strategies (sub-section on Relation of Plan to local land use and water planning) Chapter 9 – Strategy Implementation
Stakeholder Involvement Chapter 1 – One Water One Watershed Program Coordination Chapter 1 – One Water One Watershed Program
Chapter 4 – Institutional Setting and Current Collaborative Efforts
Climate Change Chapter 5 – Resource Management Strategies; Section 5.9 Climate Change
Table 12 - Funding Structure of Candidate Projects