the relations between education and migration in ukraine
TRANSCRIPT

InternationalLabourOrganization
DECENT WORK TECHNICAL SUPPORT TEAM AND COUNTRY OFFICE FOR CENTRAL AND EASTERN EUROPE
EMPLOYMENT PROMOTION
Ganna VakhitovaTom Coupe
The Relations between Education and Migration in Ukraine


Ganna VakhitovaTom Coupe
ILO Decent Work Technical Support Team and Country Office for Central and Eastern Europe
The Relations between Education and Migration in Ukraine

Copyright © International Labour Organization 2013First published 2013
Publications of the International Labour Office enjoy copyright under Protocol 2 of the Universal Copyright Convention. Nevertheless, short excerpts from them may be reproduced without authorization, on condition that the source is indicated. For rights of reproduction or translation, application should be made to ILO Publications (Rights and Permissions), International Labour Office, CH-1211 Geneva 22, Switzerland, or by email: [email protected]. The International Labour Office welcomes such applications.
Libraries, institutions and other users registered with reproduction rights organizations may make copies in accordance with the licences issued to them for this purpose. Visit www.ifrro.org to find the reproduction rights organization in your country.
ILO Cataloguing in Publication Data
Vakhitova, Ganna; Coupe, TomThe relations between education and migration in Ukraine / Ganna Vakhitova, Tom Coupe; International Labour Organization, ILO Decent Work Technical Support Team and Country Office for Central and Eastern Europe (DWT/CO-Budapest). – Budapest: ILO, 2013
ISBN: 978-92-2-128181-8; 978-92-2-128182-5 (web pdf)
International Labour Office; ILO DWT and Country Office for Central and Eastern Europe
labour migration / international migration / migrant worker / educational level / education / equal employment opportunity / remittance / Ukraine
14.09.1
Also available in Ukrainian: Зв’язок між освітою та міграцією в Україні (ISBN 978-92-2-828181-1, Budapest, 2013).
This publication has been produced with the assistance of the European Union. The contents of this publication are the sole responsibility of the authors and can in no way be taken to reflect the views of the European Union.
The designations employed in ILO publications, which are in conformity with United Nations practice, and the presentation of material therein do not imply the expression of any opinion whatsoever on the part of the International Labour Office concerning the legal status of any country, area or territory or of its authorities, or concerning the delimitation of its frontiers.
The responsibility for opinions expressed in signed articles, studies and other contributions rests solely with their authors, and publication does not constitute an endorsement by the International Labour Office of the opinions expressed in them.
Reference to names of firms and commercial products and processes does not imply their endorsement by the International Labour Office, and any failure to mention a particular firm, commercial product or process is not a sign of disapproval.
ILO publications and electronic products can be obtained through major booksellers or ILO local offices in many countries, or direct from ILO Publications, International Labour Office, CH-1211 Geneva 22, Switzerland. Catalogues or lists of new publications are available free of charge from the above address, or by email: [email protected]
Visit our website: www.ilo.org/publns
Printed in Ukraine
Project funded by the European Union
EU-ILO Project «Effective Governance of Labour Migration and its Skill Dimensions»
The publication was developed and printed within the framework of the EU-ILO Project “Effective Governance of Labour Migration and its Skill Dimensions”.
For more detailed information contact the Project by e-mail:
http://ilo.org.ua/ProjectsIloArticles/EU-ILO_Migrant.aspx
http://www.ilo.org/budapest/lang--en/index.htm
Project Brief: EU-ILO Project in Moldova and Ukraine “Effective Governance of Labour Migration and its Skill Dimensions”
This project is implemented by the International Labour Organization in cooperation with Moldovan and Ukrainian tripartite partners, the International Organization for Migration and the World Bank. The project is in the framework of the European Commission’s thematic programme of cooperation with third countries in the areas of migration and asylum.
The overall objective of the project is to strengthen Moldova’s and Ukraine’s capacity to regulate labour migration and promote sustainable return, with a particular focus on enhancing human resources capital and preventing skills waste.
This publication was printed with the support of the European Union


5
Table of Contents
Page
List of Figures and Tables ............................................................................................ 7
List of Abbreviations .................................................................................................... 11
Foreword ..................................................................................................................... 13
Introduction .................................................................................................................. 15
Chapter 1: Does the Education System in Ukraine Diminish (Encourage) Labour Outflows by Contributing to Better (Worse) Local Employment Opportunities? ................................................................ 17
1.1 The Importance of Education to Succeed in the Labour Market – A Review of the Literature on Ukraine and Internationally ............................ 18
1.1.1 The Impact of Education on Wage ..................................................... 18
1.1.2 The Impact of Education on Employment ........................................... 19
1.1.3 The Impact of Education on Entrepreneurship ................................... 21
1.2 The Importance of Education to Succeed in the Ukrainian Labour Market – Evidence from the 2009 Wave of the ISSP and the 2007 Wave of the ULMS ........................................................................................ 24
1.3 Conclusions ................................................................................................... 31
Chapter 2: The Direct Impact of a Person’s Education on Migration ........................... 35
2.1 Education and Decision to Migrate – A Review of the Literature on Ukraine and Internationally ................................................ 35
2.1.1 Impact of Education on Propensity to Migrate .................................... 37
2.1.2 Impact of Education on the Choice of a Destination Country ............. 38
2.2 Impact of Education on Migration Decisions – Empirical Evidences ............ 40
2.3 Migration Decisions in 2005–2008 – Evidence from the Ukrainian Labour Force Survey and External Labour Migration Module ................................... 41

The Relations between Education and Migration in Ukraine
6
2.3.1 Propensity to Migrate .......................................................................... 41
2.3.2 Migration Destination .......................................................................... 43
2.3.3 Occupation Abroad ............................................................................. 46
2.3.4 The Migrant’s Legal Status Abroad ..................................................... 51
2.4 Migration Decisions in 2010–2012 – Evidence from Ukrainian Labour Force Survey and Labour Migration Module ................................................. 55
2.4.1 Propensity to Migrate .......................................................................... 55
2.4.2 Migration Destination .......................................................................... 56
2.4.3 Occupation Abroad ............................................................................. 59
2.4.4 The Migrant’s Legal Status Abroad ..................................................... 63
2.5 Conclusions ................................................................................................... 67
Chapter 3: Willingness and Scope of the Remittances Use on Education by the Recipient Families and Their Impact on the Demand for Education ....... 69
3.1 Remittances and Demand for Education – a Review of the Literature on Ukraine and Internationally....................................................................... 69
3.2 Remittances and Education Expenditures – Evidence from the 2007 Wave of the ULMS ........................................................................................ 76
3.3 Conclusions ................................................................................................... 78
Chapter 4: The Links Between Policy and Legislation Framework in the Area of Migration and Education............................................................................ 79
Conclusions ................................................................................................................ 85
Bibliography ................................................................................................................. 89
Annexes
Annex A: A Note on Methodology ......................................................................... 99
1. The Impact of Education on Migration Decisions – Evidence from the 2008 Ukrainian Labour Force Survey and External Labour Migration Module ........................................................................................... 99
2. Impact of Remittances on Education Demand .......................................... 100
Annex B: Findings From a Similar Research in Moldova ..................................... 103
Conclusions and Findings ............................................................................ 103
Migration ........................................................................................................ 105
Remittances and Access to Education .......................................................... 106

7
List of Figures and Tables
Figures
Figure 1: Structure of educational system in Ukraine ............................................... 22
Figure 2: Effect of a year of education on wages (in percentages) in Ukraine and various transition countries – basic specification ................................ 26
Figure 3: Effect of a year of education on wages (in percentages) in Ukraine and various transition countries – extended .............................................. 27
Figure 4: Effect of a year of education on the chance to be unemployed (in percentages) in Ukraine and various transition countries ..................... 29
Figure 5: Effect of a year of education on the chance to be self-employed (in percentages) in Ukraine and various transition countries ..................... 31
Figure 6: Education composition of Ukrainian migrants by destinations (both genders), 2005–2008 ....................................................................... 43
Figure 7: Education composition of Ukrainian migrants by destination (females only), 2005–2008 ........................................................................ 44
Figure 8: Education composition of Ukrainian migrants by destination (males only), 2005–2008 ........................................................................... 44
Figure 9: Mobility of Ukrainian migrants between occupations before and during migration (both genders), 2005–2008 ............................................ 48
Figure 10: Mobility of Ukrainian migrants between occupations before and during migration (females only), 2005–2008 ............................................ 48
Figure 11: Mobility of Ukrainian migrants between occupations before and during migration (males only), 2005–2008 ............................................... 49
Figure 12: Legal status of Ukrainian migrants in the host country (both genders), 2005–2008 ................................................................................................. 51
Figure 13: Legal status of Ukrainian migrants in the host country (females only), 2005–2008 ................................................................................................. 51
Figure 14: Legal status of Ukrainian migrants in the host country (males only), 2005–2008 ................................................................................................. 52

The Relations between Education and Migration in Ukraine
8
Figure 15: Who organized the last trip abroad (both genders), 2005–2008? ............ 52
Figure 16: Who organized the last trip abroad (females only), 2005–2008? ............. 53
Figure 17: Who organized the last trip abroad (males only), 2005–2008? ................ 53
Figure 18: Education composition of Ukrainian migrants by destinations (both genders), 2010–2012 ....................................................................... 57
Figure 19: Education composition of Ukrainian migrants by destinations (females only), 2010–2012 ........................................................................ 57
Figure 20: Education composition of Ukrainian migrants by destinations (males only), 2010–2012 ........................................................................... 58
Figure 21: Mobility of Ukrainian migrants between occupations before and during migration (both genders), 2010–2012 ............................................. 62
Figure 22: Mobility of Ukrainian migrants between occupations before and during migration (females only), 2010–2012 ............................................. 62
Figure 23: Mobility of Ukrainian migrants between occupations before and during migration (males only), 2010–2012 ................................................ 63
Figure 24: Legal status of Ukrainian migrants in the host country in 2010–2012 (both genders) ........................................................................................... 63
Figure 25: Legal status of Ukrainian migrants in the host country in 2010–2012 (females only) ............................................................................................ 64
Figure 26: Legal status of Ukrainian migrants in the host country in 2010–2012 (males only) ............................................................................................... 64
Figure 27: Who organized the last trip abroad in 2010–2012 (both genders)? ........... 65
Figure 28: Who organized the last trip abroad in 2010–2012 (females only)? ........... 65
Figure 29: Who organized the last trip abroad in 2010–2012 (males only)? .............. 65
Tables
Table 1: Number of applicants per vacancy by employment sphere ........................... 20
Table 2: To get ahead, it is essential, important or fairly important to .......................... 24
Table 3: To get ahead, it is essential to ........................................................................ 25
Table 4: Returns to education based on the ULMS ..................................................... 28
Table 5: Returns to Education based on the ULMS – Unemployment ........................ 30
Table 6: Returns on education based on the ULMS – Self-employment ..................... 32
Table 7: Educational levels of Ukrainian migrants and domestic labour force, per cent ... 39
Table 8: Educational composition of Ukrainian migrants and labour force in a host country, 2008 ...................................................................................... 40

9
List of Figures and Tables
Table 9: Impact of education on the decision to migrate based on LFS, 2005–2008 42
Table 10: Impact of education and occupation of the choice of migration destination, ELMS (2005–2008) .............................................................. 45
Table 11: Occupational composition of Ukrainian migrants during employment abroad by the level of education, 2005–2008.............................................. 46
Table 12: Educational composition of Ukrainian migrants by the type of occupation abroad, 2005–2008 ..................................................................................... 46
Table 13: Occupational composition of Ukrainian migrants before migration by the level of education, 2005–2008 .............................................................. 47
Table 14: Impact of education and previous occupation on the choice of occupation abroad, 2005–2008 ..................................................................................... 49
Table 15: Impact of education and previous occupation on the occupation mobility, 2005–2008 ..................................................................................... 50
Table 16: Impact of education and previous occupation on legal status of Ukrainian migrants in the host country, 2005–2008 .................................................... 54
Table 17: Impact of Education on the decision to migrate based on LFS, both periods ... 55
Table 18: Impact of Education and Occupation of the Choice of MigrationDestination, LMS (2010–2012) .................................................................... 59
Table 19: Occupational composition of Ukrainian migrants during employment abroad by level of education, 2010–2012.................................................... 60
Table 20: Occupational composition of Ukrainian migrants before migration by the level of education, 2010–2012 .......................................................... 61
Table 21: Impact of education and previous occupation on the choice of occupation abroad, 2010–2012 ..................................................................................... 62
Table 22: Impact of education and previous occupation on legal status of Ukrainian migrants in the host country, both periods ................................................... 66
Table 23: Remittances in Ukraine 2008–2011 (in USD millions) ................................. 72
Table 24: Structure of Ukrainian household total expenditure, 2002–2011 (per cent) ... 74
Table 25: Use of remittances and savings (per cent) .................................................. 75
Table 26: Impact of remittances on the demand for education based on ULMS ......... 76
Table 27: Descriptive statistics: remittance receivers vs. non-receivers...................... 101

11
List of Abbreviations
BEEPS Business Environment and Enterprise Performance Survey
ELMS External Labour Migration Survey (2005–2008)
ETF European Training Foundation
EU European Union
FEG Foundation for Effective Government
HBS Household Budget Survey
ILO International Labour Organization
IOM International Organization for Migration
ISSP International Social Survey Programme
LMS Labour Migration Survey (2010–2012)
LFS Labour Force Survey
ULMS Ukrainian Longitudinal Monitoring Survey


13
Fo reword
This report is one of the outcomes of the EU-funded large-scale project “Effective Governance of Labour Migration and its Skill Dimensions”, implemented by the International Labour Organization in collaboration with International Organization for Migration and the World Bank in Ukraine and Moldova in 2011–2013. The project is a part of the European Union’s thematic programme of cooperation with third countries in the areas of migration and asylum.
The project aims at enhancing Moldova’s and Ukraine’s capacity to manage labour migration in a way which contributes to development, with a particular focus on enhancing human resources and preventing skills waste or de-skilling. It also seeks to improve policy making based on sound research and data. In this way the project contributes to protection of migrants’ rights and prevention of exploitation and exclusion, in line with the principles and guidelines of the ILO Multilateral Framework on Labour Migration and ILO Conventions 97 and 143.
This study offers a comprehensive analysis of the relationship between education, remittances and migration in Ukraine while controlling for the impact of other factors. Four sets of questions are addressed:
• The extent to which the educational system in Ukraine contributes to better local employment opportunities, hence diminishing the outflows;
• The direct impact of individual education on migration;
• The use of remittances for education by the recipient families and their impact on the demand for education;
• The link between policy and legislative framework in the area of migration and education.
This thorough and broad lays the ground for evidence-based policy recommendations.
This country report for Ukraine was prepared by Ganna Vakhitova, Assistant Professor and Senior Researcher at Kyiv School of Economics, and Tom Coupe, Associate Professor and Senior Researcher at Kyiv School of Economics, in close collaboration with the Ministry of Social Policy, Ministry of Education and Science of Ukraine and the ILO Technical Support Team and Country Office for Central and Eastern Europe in Budapest.

The Relations between Education and Migration in Ukraine
14
Special appreciation goes to Francesco Panzica, International Expert on Migration and Employment, for his valuable comments and suggestions. The authors would like to thank Anna Olefir (currently with the World Bank office in Moldova) for her help with data for the 2008 study on labour migration; Alla Solop, Deputy Head of Labour Statistics Department, State Statistics Service of Ukraine and the ILO staff in Ukraine for the data on labour migration in Ukraine in 2010–2012; and Ilona Sologoub (Kyiv School of Economics) for her invaluable research assistance. The outstanding professionalism of Tetyana Minenko (ILO, Kyiv) is also greatly appreciated. Finally, the authors are grateful to all participants of the validation workshop, held in November 2012 in Kyiv, for their useful comments and suggestions.
Antonio GraziosiDirectorILO DWT/CO Budapest

15
Introduction
Migration plays an increasingly important role in the composition of the labour force all around the globe. Properly managed migration policies in destination countries may help them overcome temporary shocks in labour demand. Skills-oriented migration may complement the existing skills’ supply and demand and identified skill shortages.1 For sending countries, migration also may release unemployment pressure, transfer financial resources home and contribute to future labour skills development through gains in human capital. Poor migration policies or the absence thereof may further impede the labour market problems in both countries of origin and destination.
Both the European Union (EU) and Ukraine have a mutual interest in developing effective migration policies. The labour market situation in many EU states combined with current demographic trends fuel EU interest in temporary/circular migration. But as a labour-sending country, Ukraine is struggling to cope with its demographic and labour situation. Both receiving and sending countries want to improve the current and future skills and replacement ratios of their mutual labour forces.
Making migration a mutually beneficial solution for all parties involved, including migrants themselves, requires evidence–based decision making. In this context, knowledge of the skills composition of migration flows is important for designing effective labour migration schemes. However, many dimensions of migration have yet to be studied by neighbouring European countries, particularly in light of the transformation of domestic labour markets by the European Union.
What follows is a comprehensive analysis of the relationship among migration, education and remittances in Ukraine. This study is a part of a wider project, “Effective Governance of Labour Migration and its Sk ill Dimensions”, managed by ILO with funding from the European Union.
The study focuses on four questions. The first chapter discusses how education is related to the local labour market opportunities. It describes the education system in Ukraine and its recent developments, and discusses the supply and demand mismatch
1. Skills-oriented migration does not imply the movement of skilled workers only. Whenever there is a demand for unskilled labour such policy would encourage the mobility of unskilled workers to avoid de-skilling or “brain loss”.

The Relations between Education and Migration in Ukraine
16
that may be related to education. This initial chapter asks whether the lack of local opportunities to improve one’s labour market situation through education encourages Ukrainians to migrate.
The second chapter investigates to what extent education determines major migration decisions including the probability to migrate, the choice of destination, as well as the migrant’s occupation and legal status in the host country. These decisions to a large extent determine how successful a migration event will turn out for a given individual. The chapter helps to understand whether the improv ement in educational attainment can turn migration into a productivity enhancing experience.
The third chapter discusses the impact of remittances sent home by migrants on the local demand for education. The final chapter assesses the existing government policies in the area of migration and education in Ukraine.
After reviewing the international and local literature and discussing the new findings for Ukraine, and based on the analysis of four datasets, this study concludes with some policy recommendations.

17
CHAPTER 1
Does the Education System in Ukraine Diminish (Encourage) Labour Outflows by Contributing to Better (Worse) Local Employment Opportunities?
This initial chapter investigates to what extent education can help individuals to be successful in the Ukrainian labour market. It checks whether the lack of local opportunities to improve one’s labour market situation through education can be a reason why people migrate.
In general, Ukraine’s population is well educated. Ukraine has 100 per cent adult literacy and nearly universal secondary school enrolment.2 Higher education rates have also steadily grown over the last few years: while in 2001 13 per cent of Ukrainians had complete higher education, in 2010 this share has risen to 18.5 per cent, and among people of 25–44 years old, 30 per cent have a higher education degree.3
At the same time, unemployment (ILO methodology) in Ukraine has increased to about eight per cent, up from 6.4 per cent in 2008.4 Wages, especially reported5 wages, are low. According to the data of the State Employment Service for 2011, almost one-third of registered vacancies offered a salary lower than the subsistence level.6
This chapter discusses how education affects three measures of an individual’s ‘success’ in the labour market. First it asks whether extra education contributes to the wage of individuals.
2. http://www.unicef.org/infobycountry/ukraine_statistics.html.3. State Statistical Service Household Survey – 2010.4. Although this figure is lower than in many EU countries, note that even ILO figures underestimate the actual unemployment rate – for example, people working only on their subsidiary land plots are considered to be employed, while in reality they do not have a paid job. Further note also that unemployment benefits are about USD 70 in Ukraine and paid only for a half year, so unemployment leads to poverty with a high probability.5. Because of high social contributions (up to 40 per cent of the salary fund), many enterprises pay wages ‘in envelopes’, i.e. they officially pay a minimum wage and the rest is paid in cash. By some estimates, wages ‘in envelopes’ may constitute up to half of the shadow economy. The Tax Administration estimates the volume of cash salaries in 2011 reached UAH 170 billion or 13 per cent of GDP. Available at: http://news.dt.ua/ECONOMICS/obsyag_tinovoyi_ekonomiki_ukrayini_stanovit_350_mlrd_grn,_polovina_tsih_koshtiv_-_zarplati_v_konvert-107273.html.6. http://www.dcz.gov.ua/control/uk/statdatacatalog/list.

The Relations between Education and Migration in Ukraine
18
Then the focus shifts to whether education reduces the chance to be unemployed. Finally, the relationships among self-employment, innovation and education are considered.
The effect of education on these three measures has been thoroughly studied in the academic and applied literature, but country specific evidence for Ukraine is limited, which this review critically points to before a presentation of new findings based on an analysis of two datasets, the 2007 wave of the Ukrainian Longitudinal Monitoring Survey (ULMS) and the 2009 wave of the International Social Survey Program (ISSP).
1.1 The Importance of Education to Succeed in the Labour Market – A Review of the Literature on Ukraine and Internationally
1.1.1 The Impact of Education on Wage
Theoretically, education can increase wages because of various reasons. For example, human capital theory (Becker, 1994) suggests that education enhances productivity, which allows employers to pay higher wages to people with higher education. An alternative theory argues that education does not enhance productivity but only acts as a signal of high productivity (Spence, 1973).
To test whether education increases wages in practice, many economists have estimated what is known as Mincerian wage regressions, after Mincer (1974) who was the first to analyse the regression of wages on education. A recent ‘returns to education’ study by Badescu, D’Hombres and Villalba (2011) shows that on average the wage premium for tertiary education in 28 European countries is 43 per cent, ranging from 98 per cent in Portugal to 21 per cent in Sweden. The wage penalty for not graduating from secondary school varies from seven per cent i n Denmark to 31 per cent in Austria, averaging at 17 per cent.
The most recent investigation of returns to education in Ukraine can be found in Coupe and Vakhitova (2010). They showed that, in 2007, only higher education had a significant return of 5.6 per cent per additional year whereas other types of education had no effect on monthly wages. They further showed that returns to education in Ukraine are low even compared to other transition countries and that over time returns to education in Ukraine have barely grown. These findings are consistent with a number of earlier papers, which have estimated the returns to education for Ukraine (e.g. Leschenko, 2001, Herasym, 2004, Gorodnichenko and Sabirianova Peter, 2005) and other transition countries (Flabbi et al., 2008).
Several reasons have been suggested for the low returns to education in transition countries in general, and in Ukraine specifically:
1. many highly educated people employed by the state (teachers, doctors, low-level government clerks) receive low wages compared to the private sector. For example, an

19
Does the Education System in Ukraine Diminish Labour Outflows?
average wage in the education (mostly state-owned) sector was USD 260 at the end of 2011, which is 20 per cent lower than overall average wage and 33 per cent lower than an average wage in industry, where the share of the private sector is much higher;
2. a large number of middle-aged people with higher education but without the skills (e.g. knowledge of a foreign language or computer skills)7 currently in demand by the labour market work for low salaries;
3. widespread corruption and low quality of education in many Ukrainian universities;
4. a mismatch between the supply of university graduates and labour market demands;
5. Gorodnichenko and Sabirianova Peter (2005) offer, as explanations for their finding that Ukraine has much lower rates of return than Russia, that Ukraine has “lower demand for educated labour, more limited labour mobility, higher separation costs, and a larger extent of trade unions”;
6. Ukraine’s production structure (mostly semi-finished goods and raw materials) requires mostly skilled and unskilled blue-collar workers rather than higher-educated personnel. Nevertheless, many university students choose economics, finance or law, and even upon graduation some of them will have to work in another field.
1.1.2 The Impact of Education on Employment
For the same theoretical reasons as to why education should increase wages, education should also increase the probability of finding a job and hence decrease the probability of being unemployed. One of the early works investigating the impact of education on unemployment was an article by Mincer (1991). This study and a number of later articles have shown that education, especially higher education, reduces the probabi lity of a person being unemployed (see Biagi and Lucifora, 2005) for an overview). Riddell and Song (2011) also find that higher-educated people have greater chances to be re-employed after losing a job. When using data from the EU, USA and Japan, Georgiou (2010) shows that greater government expenses on education reduce countrywide unemployment rates.
Studies for Ukraine are relatively few. For example, Lehmann et al., (2010) show that workers with high school and college education are less likely to be displaced or quit jobs than less educated workers. Kupets (2006) investigates the duration of unemployment and finds that higher education significantly increases the chance to find employment, while other levels of education have no observable effect. This finding is supported by the European Training Foundation report on the “Transition from Education to Work in EU Neighbouring Countries” (2007), which shows that 26 per cent of Ukrainian graduates were unemployed two years after completing their most recent education. The probability for university graduates was almost half at 14 per cent.
7. For example, Pavlova and Rohozynsky (2005) report that older, highly educated women are the most unlikely to find a (new) job, as employers consider them either overqualified or inflexible and incapable of acquiring new skills. They also assert that there is an oversupply of people with higher education who nevertheless lack appropriate skills and therefore, remain unemployed.

The Relations between Education and Migration in Ukraine
20
Despite the fact that higher education reduces the chance to be unemployed, the World Bank Ukraine Labour Demand Study (2009)8 suggests there is an oversupply of white-collar workers and a deficit of blue-collar workers, especially skilled ones. Some quantitative illustration of the extent of such labour market skill mismatch is shown in Table 1, which presents the number of “applications per vacancy” for different professions. Note that these are official data, and official (registered) unemployment is about three times lower than that computed by ILO methodology.
Table 1: Number of applicants per vacancy by employment sphere
2001 2002 2003 2004 2005 2006 2007 2008 2009 2010 2011
Total 11 9 7 6 5 5 4 10 8 9 8
Police and armed forces – 2 – 10 3 3 2 7 1 14 8
Government 4 17 6 12 4 39 13 12 4 19 408
Heads of firms 11 8 6 5 4 5 4 8 7 8 8
Professionals (with academic education)
8 5 4 3 3 3 2 5 4 5 5
Technical staff (operators of complicated machines such as airplanes, atomic stations and so on; IT)
14 10 8 6 5 4 4 6 6 7 7
Technical services specialists (secretaries, accountants and so on)
43 25 20 12 9 8 6 12 13 14 16
Employees in trade and services (salesmen, HoReCa staff and so on)
26 20 18 14 10 7 6 13 8 10 12
Agricultural workers and fishermen
29 26 27 24 18 20 25 53 28 32 35
Skilled workers with instruments
4 3 2 2 2 2 1 6 7 5 4
Skilled workers with industrial machines
8 7 6 4 4 4 4 12 14 14 12
Basic professions 31 28 24 18 12 9 7 14 9 10 10
Source: State Employment Service (http://www.dsz.gov.ua).
Other evidence that a skill mismatch exists comes from the 2007 wave of the ULMS which shows that more than one-third of respondents state that they are performing a job that either requires a different, usually lower, level of education or a different field of education.9
8. http://siteresources.worldbank.org/UKRAINEEXTN/Resources/WB_Book_Report_labor_demand_EN_prew.indd.pdf.9. World Bank: Ukraine Country Economic Memorandum. Strategic Choices to Accelerate and Sustain Growth, Report No. 55895-UA (Washington D.C., World Bank, 2010)..

21
Does the Education System in Ukraine Diminish Labour Outflows?
Finally, press articles and business surveys also often report a lack of appropriately skilled personnel as one of the main obstacles to enterprise development. For example, in the 2009 Business Environment and Enterprise Performance Survey (BEEPS) 43 per cent of managers named an inadequately educated workforce as either a major or a very severe obstacle to firm growth.10 In the quarterly enterprise survey performed by the Institute of Economic Research11 the lack of qualified labour has also been constantly in the top-ten obstacles to enterprise growth. And the Competitiveness Report for Ukraine (FEG, 2012) stresses that skill mismatch is becoming more important over time – if in 2010 “poor quality of labour force” was ranked by managers as the 13th biggest problem of business in Ukraine, in 2011, it was in 10th place.
1.1.3 The Impact of Education on Entrepreneurship
Van der Sluis et al. (2008) present a review of the empirical literature linking education to entrepreneurship. Based on a meta-analysis, they draw the following conclusions:1. the impact of education on selection into entrepreneurship is insignificant; 2. the effect of education on firm performance is positive and significant;3. the return to a marginal year of schooling is 6.1 per cent for an entrepreneur;4. the effect of education on earnings is smaller for entrepreneurs than for employees in
Europe, but larger in the USA;5. the returns to schooling in entrepreneurship are higher in the USA than in Europe,
higher for females than for males, and lower for non-whites or immigrants.
Note that while Van der Sluis et al. (2008) concluded that there was no significant relationship between education and the probability to become an entrepreneur, education was found to increase the probability of a person becoming an entrepreneur by some authors (e.g. Puri and Robinson, 2006, Delmar and Davidsson, 2000, Ghani et al., 2011). Other studies, however, stress the need to distinguish between different kinds of entrepreneurship, namely, need-driven (pushed) and opportunity-driven (pulled). For example, Ardagna and Lusardi (2008) show that the impact of education is positive for people whose entrepreneurship is opportunity-driven and negative for people for whom it is need-driven (remedial). Investigating the differences in entrepreneurship determinants between males and females, Llussa (2010) shows that female entrepreneurship is much more often need-driven than opportunity-driven.
There is only one study that estimates the determinants of entrepreneurship in Ukraine. Dutz et al. (2001) showed that unlike advanced transition countries, where entrepreneurs tend to be male, middle-aged and more educated than other members of the labour force, in the Commonwealth of Independent States (CIS) there is little difference in the demographic profile of entrepreneurs compared to the rest of the labour force (hence, entrepreneurship is mostly pushed rather than pulled). Factors increasing the probability of becoming an entrepreneur in Ukraine were found to be secondary and vocational education (the impact of higher education was not tested). Other variables were insignificant, except for the negative impact of older age.
10. http://www.ebrd.com/pages/research/analysis/surveys/beeps.shtml. 11. http://www.ier.com.ua/ua/publications/regular_products/business_idea_industry/.

The Relations between Education and Migration in Ukraine
22
B OX 1
The Educational system in UkraineThe educational system in Ukraine combines elements of Soviet and Western education systems. Therefore, it has “junior specialist” and “specialist” degrees as well as BA and MA degrees. A schematic presentation of the Ukrainian educational system is provided in the Figure 1. The main components are 11-year secondary education, 5–6-year higher education and post-graduate education.
12
Figure 1: Structure of educational system in Ukraine
12. In Ukraine the term “secondary school” implies a school educating children from ages 6 to 17. If one wants to be more specific, one would use the terms “primary school” (6–10), “lower secondary school” (11–15) and “upper secondary school” (16–17). In 2001 Ukraine started the transfer to the 12-year secondary school system, with the last three years devoted to developing the professional orientation of students. However, in 2010 this process was abruptly stopped (main reasons being lack of funds and unpopularity of the reform), and Ukraine returned to 11-year secondary education cycle.
Doctor of sciences (ISCED-6), 3+ years
Candidate of sciences (ISCED-6), 3+ years
Master (1–2 years) Specialist (1–1.5 years)
Bachelor (institutes/universities; ISCED–5A),
2–3 years for junior specialists,3–4 years upon ISCED–3
Junior specialist (colleges/technical schools; ISCED–5B),2–3 years upon ISCED-3 and ISCED–4,
3–4 years upon ISCED–2
Complete general secondary education
(ISCED–3), 2 years
Qualified worker (vocational schools, ISCED–4)(1–1.5 years upon ISCED–3,
3 years upon ISCED–2)
Basic general secondary education (ISCED–2), 5 years
Primary education (ISCED–1), 4 years
Preschool education (ISCED–0)3
456789
101112131415161718192021222324252627282930
Age
С – certificate, A – attestat (school completion certificate), D – diplomaSource: adopted from http://www.mon.gov.ua/education/higher/bolpr/napr_ukr.doc

23
Does the Education System in Ukraine Diminish Labour Outflows?
Ukraine officially joined the Bologna Process in 2005, although some elements of the Western educational system already were adopted in the 1990s by a few of its higher educational institutions. In 2009 the Ministry of Education officially introduced the European Credit Transfer and Accumulation System (ECTS)13 and the Diploma Supplement template according to EU/EC/UNESCO standards. However, the transfer to a BA/MA/PhD degree system is still under way. Moreover, officially joining the Bologna Process does not necessarily mean a full implementation of its requirements.
Although the total number of higher educational institutions (post-secondary schools such as colleges, technical schools and universities) remained practically unchanged during the two decades between 1990–2010, the number of universities has more than doubled because of a change in the status of colleges and technical schools. The only post-secondary educational institutions for which the number has declined are vocational schools,14 contributing to the skill mismatch problem.
The European Training Foundation (2008 and 2009) provides an extensive review of the Ukrainian educational system and the employability of its graduates. Noting the high general level of education, the high share of educational spending as a percentage of GDP (above seven percent in 2009–2010) and an increasing participation in higher education, they nevertheless point to several weaknesses of the educational system in former Soviet Union (FSU) countries like Ukraine:
1. low salaries of teachers, poor equipment of schools and hence low quality of secondary education. At the TIMSS-2007,15 Ukrainian students scored below the international average and worse than students from other FSU countries that took part in the survey;
2. erosion of the vocational training system, which has led to the undersupply of skilled workers;
3. low quality of the higher education system with slowly changing curricula, an oversupply of educational institutions and a deficit of highly qualified staff along with a high corruption level.
These weaknesses may also contribute to explaining lower returns on education in Ukraine.
13. Order of MoE No. 943, 16 October 2009.14. The number of schools and their graduates reduced by 20 per cent over the period 1995–2010. In 1990–1995 their number was also falling but no quantitative estimate can be provided because pre-1995 data include only vocational schools subordinate to the Ministry of Education, while after 1995 schools subordinate to other state bodies and enterprises are also included.15. http://timss.bc.edu/timss2007/PDF/TIMSS2007_InternationalMathematicsReport.pdf; http://timss.bc.edu/timss2007/PDF/TIMSS2007_InternationalScienceReport.pdf, pp. 34–35.

The Relations between Education and Migration in Ukraine
24
1.2 The Importance of Education to Succeed in the Ukrainian Labour Market – Evidence from the 2009 Wave of the ISSP and the 2007 Wave of the ULMSIn the empirical analysis, two sources of data are used. First, the data from the 2009 International Social Survey Programme (ISSP) is put to use. ISSP, which started in 1985 and covers about 40 countries, is a cross–national collaboration on surveys covering topics important for social science research. The ninth wave focuses on social inequality and allows for an estimation of the relationships among education and the described three measures of success for Ukraine and several other transition countries and put the Ukrainian estimates in a comparative perspective. This survey also provides subjective estimates of the importance of different factors to ‘getting ahead’, complementing the ‘objective’ estimates that can be derived from regression analysis.
Second, the 2007 Ukrainian Longitudinal Monitoring Survey (ULMS) is used. The ULMS provides data for a statistically representative sample of the Ukrainian population, comprising 4,000 households and approximately 8,500 individuals. In addition to a household questionnaire there was an individual questionnaire, which tried to elicit detailed information about the labour market experience of Ukrainian workers. This survey also enables an estimate of the relationships among education and the three measures of success but it has a large number of respondents, allowing for more precise estimates.
As a starting point, ISSP data gives some idea of how important people say education is for success in the labour market. Table 2 gives the percentage of people who mark a given factor as essential, important or fairly important to ‘get ahead’ in a given country.
Table 2: To get ahead, it is essential, important or fairly important to ...
Success factors
Ukr
ain
e
Ru
ssia
Po
lan
d
Slo
ven
ia
Slo
vak
Rep
ub
lic
Hu
ng
ary
Cro
atia
Bu
lgar
ia
Est
on
ia
Lat
via
Have a good education 72.96 67.42 78.74 66.79 66.87 74.98 75.97 76.99 67.17 71.71
Know the right people 73.8 72.28 87.19 74.41 72.37 65.07 75.89 83.03 83.33 75.21
Work hard 93.99 92.73 98.64 93.93 94.01 86.11 93.88 95.78 97 97.19
Be ambitious 87.27 85.92 99.28 95.4 95.91 96.43 97.9 97.71 81.96 87.48
Come from a wealthy family
87.53 90.84 96.89 92.42 94.01 93.72 95.85 96.06 94.29 96.44
Have political connections
91.4 88.43 94.08 93.83 94.69 85.32 91.13 92.28 87.78 86.68
Have well-educated parents
66.94 52.81 66 67.64 75.22 67.75 61.49 61.92 40.39 61.85
Give bribes 58.34 49.63 37.78 35.43 47.98 54.2 30.89 45.49 17.23 36.21
Person’s gender 23.18 24.41 24.94 30.68 40.7 58.65 25.15 36.02 26.9 19.64
Person’s religion 19.83 16.11 27.63 25.52 28.55 23.12 25.67 25.68 11 9.02
Person’s race 32.44 33.56 38.84 44 43.74 47.3 31.27 41.79 21.4 25.07
Source: Authors calculations based on ISSP 2009.

25
Does the Education System in Ukraine Diminish Labour Outflows?
In many transition countries, most people say that hard work or ambition is the key to get ahead. Ukraine is no exception with hard work being identified as essential, important or fairly important by about 94 per cent of the respondents. Having a good education is thought to be at least fairly important16 by about 73 per cent of the respondents, with four other factors, besides hard work, scoring better on this criterion: having political connections, having ambition, having a wealthy family and knowing the right people. In other countries in the sample, good education ranks only fifth, sixth or seventh.
More than 37 per cent of Ukrainian respondents indicated they think good education is essential for getting ahead (Table 3). This makes education the factor that is most often thought to be essential, ahead of knowing the right people, working hard or having ambition. Compared to other transition countries, Ukrainians stand out as having the highest percentage of people who deem a good education essential for getting ahead.
Table 3: To get ahead, it is essential to ...
Success factors
Ukr
ain
e
Ru
ssia
Po
lan
d
Slo
ven
ia
Slo
vak
R
epu
blic
Hu
ng
ary
Cro
atia
Bu
lgar
ia
Est
on
ia
Lat
via
Have a good education 37.56 26.11 35.33 22.77 28.13 19.54 31.88 35.74 29.13 30.37
Know the right people 31.01 26.15 23.18 26.28 26.57 25 30.49 28.78 14.75 16.98
Work hard 30.67 30.51 26.69 29.26 34.29 34.9 42.39 48.96 24.72 36.7
Be ambitious 22.22 18.95 34.83 27.87 32.64 36.74 40.05 47.92 11.47 21.25
Come from a wealthy family
20.5 14.21 11.35 7.99 12.78 16.78 17.34 14.44 7.65 11.28
Have political connections
17.49 12.7 11.26 15.59 17.58 17.55 20.12 16.72 5.8 9.08
Have well-educated parents
16.73 10.44 10.09 6.85 10.86 13.13 14.13 14.01 9.84 11.46
Give bribes 12 6.26 5.94 6.59 7.06 10.08 4.94 9.15 1.9 5.36
Person’s gender 3.16 3.61 4 4.35 5.42 6.4 4.72 5.36 1.75 1.07
Person’s religion 3.12 1.01 2.09 1.58 3.17 3.52 4.08 3.57 1.03 0.67
Person’s race 2.71 1.41 2.14 2.09 5.85 12.44 3.32 5.5 2.94 0.96
Source: Authors calculations based on ISSP 2009.
After looking at the subjective opinion of people about the role education plays in being successful in the labour market, the next step is to look at wage, unemployment and self-employment data to estimate the ‘objective’ role of education.
The existing literature shows substantial differences in returns to education across countries, but also that these differentials have remained fairly stable over the last two decades. In the early 2000s the education wage premium in transition countries varied from 10–12 per cent for China and Hungary to 4.0 per cent for Ukraine (see Coupe and
16. The sum of respondents who think that it is essential, important or fairly important.

The Relations between Education and Migration in Ukraine
26
Vakhitova, 2009). In several transition countries, the returns to education showed small increases over time but not so in Ukraine.
Our analysis of the 2009 ISSP data estimates the return to a year of schooling in Ukraine at 5.4 per cent, after controlling for potential experience and gender (see Figure 2).17 This is among the lowest figures in the group of eight countries considered, and about half of the returns to education in Poland.
Figure 2: Effect of a year of education on wages (in percentages) in Ukraine and various transition
countries – basic specification
UA RU PL SI SK HU HR BG EE LV
12
10
8
6
4
2
0
In a more extended specification (Figure 3) which additionally includes dummies for living in urban areas, marital status, controls for occupation particularities (major occupation groups, public employee, working full-time, member of a trade union) and controls for current family (number of members, dummy for spouse working full-time), the returns drop to 1.2 per cent and become insignificant. In this extended specification returns to education in Ukraine are only one-fourth of the returns to education in Poland, and Ukraine is the only country where the data do not allow rejecting the hypothesis that there are no returns to education in terms of salary.
The estimates of the returns to education in Ukraine using the ULMS data are similar to ISSP data (see Table 4) – the returns to education are moderate at about 3.4 per cent. Given the larger sample size, the ULMS allows for more detailed estimates. Columns two and three show that the returns for men (1.6 per cent and insignificantly different from zero) are about a third of the returns for women (5.2 per cent). While the returns to education are lower for men, men do earn about substantially more than women (the coefficient of the male dummy is about 0.35). Columns four to six show further that what counts are the years of academic education, again with the returns for males substantially below the returns for females. Vocational education or secondary education has no returns. Adding
17. The specifications in this study follow Flabbi et al. (2008). People below 18 and above 65 are excluded from the sample, as well as people claiming to have more than 30 years of education. Experience is measured as max (0, age-education-5).

27
Does the Education System in Ukraine Diminish Labour Outflows?
a long list of additional control variables like in the case the ISSP reduces the size of the returns to education, though in the case of the ULMS returns do not turn insignificant in the regression for men and women together (but they remain insignificant in the regression for males).18
Figure 3: Effect of a year of education on wages (in percentages) in Ukraine and various transition
countries – extended
UA RU PL SI SK HU HR BG EE LV
6
5
4
3
2
1
0
In some specification the returns to education were allowed to differ across migration intensive regions (where more than three per cent of population of the region is estimated to be a labour migrant) and low migration regions. No significant differences in the returns to education between these different types of regions were found.19
Next the effect of education on the chance to be unemployed is analysed. Figure 4 shows that a year of education reduces the chance to be unemployed by 2.6 percentage points. In five out of ten countries the (negative) effect of education on the chance to be unemployed is bigger, with Slovakia (3.6 percentage points) being the country where education has the strongest effect on the chance to be unemployed. In Slovenia (1.8 percentage points) or Latvia (1.6 percentage points), the effect of education is substantially smaller than in Ukraine. When adding additional controls, the size of the effects reduces somewhat but similar results are obtained in terms of ranking of countries.
18. These results are available from the authors on request.19. These results are available from the authors on request.

The Relations between Education and Migration in Ukraine
28
Tab
le 4
: R
etu
rns
to e
du
cat
ion
bas
ed o
n t
he
UL
MS
Var
iab
les
All
Mal
esF
emal
esA
llM
ales
Fem
ales
Tota
l yea
rs o
f edu
catio
n0.
0343
***
0.01
600.
0523
***
(0.0
0765
)(0
.012
8)(0
.008
78)
Seco
ndar
y de
gree
–0.0
130
0.06
24–0
.101
*
(0.0
499)
(0.0
762)
(0.0
546)
Year
s of v
ocat
iona
l edu
catio
n–0
.009
39–0
.006
37–0
.009
73
(0.0
145)
(0.0
222)
(0.0
171)
Year
s of p
rofe
ssio
nal e
duca
tion
–0.0
0434
–0.0
0564
0.00
0677
(0.0
134)
(0.0
171)
(0.0
199)
Year
s of a
cade
mic
edu
catio
n0.
0538
***
0.02
93**
0.07
49**
*
(0.0
0773
)(0
.013
9)(0
.007
58)
Expe
rienc
e0.
0235
***
0.01
90**
*0.
0279
***
0.02
28**
*0.
0194
***
0.02
63**
*
(0.0
0421
)(0
.005
85)
(0.0
0614
)(0
.004
23)
(0.0
0584
)(0
.006
24)
Expe
rienc
e sq
uare
d–0
.000
579*
**–0
.000
553*
**–0
.000
597*
**–0
.000
565*
**–0
.000
555*
**–0
.000
570*
**
(8.3
6e–0
5)(0
.000
117)
(0.0
0012
1)(8
.46e
–05)
(0.0
0012
0)(0
.000
120)
Mal
e0.
357*
**0.
360*
**
(0.0
277)
(0.0
272)
Con
stan
t6.
244*
**6.
982*
**5.
926*
**6.
611*
**7.
086*
**6.
527*
**
(0.3
41)
(0.2
17)
(0.3
69)
(0.3
52)
(0.1
54)
(0.3
49)
Obs
erva
tions
2,78
91,
344
1,44
52,
789
1,34
41,
445
R-s
quar
ed0.
097
0.04
20.
070
0.11
30.
048
0.10
9
Dep
ende
nt v
aria
ble
is t
he l
og o
f th
e m
onth
ly w
age.
Add
ition
al c
ontro
ls f
or t
he m
onth
dur
ing
whi
ch t
he i
nter
view
was
tak
en a
re i
nclu
ded.
Rob
ust
stan
dard
err
ors
in p
aren
thes
es,
*** p
<0.0
1, **
p<0
.05,
* p<
0.1.
Peo
ple
belo
w 1
8 an
d ab
ove
65 a
re e
xclu
ded
from
the
sam
ple,
as
wel
l as
peop
le c
laim
ing
to h
ave
mor
e th
an 3
0 ye
ars
of e
duca
tion.
Exp
erie
nce
is m
easu
red
as m
ax (0
,age
-edu
catio
n-5)
.

29
Does the Education System in Ukraine Diminish Labour Outflows?
Figure 4: Effect of a year of education on the chance to be unemployed (in percentages) in
Ukraine and various transition countries
Results based on the ULMS are qualitatively similar (Table 5) – an extra year of education significantly reduces the chance of being unemployed, though the size of the effect is smaller than when using the ISSP data for Ukraine (–0.5 versus –2.6). The latter can be partially explained by the fact that the unemployment rate in the pre-crisis 2007 ULMS sample was substantially lower than the unemployment rate in the post crisis 2009 ISSP sample (five per cent versus 14 per cent). Here again, the effect of education is similar for males and females, and academic and professional education are more effective in reducing the chance to be unemployed than other kinds of education.
The final set of regressions focuses on the effect of education on entrepreneurship (Figure 5). While in eight out of 10 countries, education has no significant or a positive effect on the chance of being an entrepreneur, in Ukraine this effect is negative and sizeable (–2 percentage point for each year of education). A similar effect is obtained using a larger set of control variables or, for Ukraine, the ULMS data instead of the ISSP data.
UA RU PL SI SK HU HR BG EE LV
0
-0.5
-1
-1.5
-2
-2.5
-3
-3.5
-4

The Relations between Education and Migration in Ukraine
30
Tab
le 5
: R
etu
rns
to e
du
cati
on
ba
sed
on
th
e U
LM
S –
Un
emp
loym
ent
Var
iab
les
All
Mal
esF
emal
esA
llM
ales
Fem
ales
Tota
l yea
rs o
f edu
catio
n–0
.005
64**
*–0
.006
45**
*-0
.005
11**
*
(0.0
0121
)(0
.002
04)
(0.0
0144
)
Seco
ndar
y de
gree
0.01
150.
0183
0.00
464
(0.0
0945
)(0
.014
4)(0
.012
6)
Year
s of v
ocat
iona
l edu
catio
n–0
.001
39–0
.004
750.
0002
23
(0.0
0291
)(0
.004
67)
(0.0
0351
)
Year
s of p
rofe
ssio
nal e
duca
tion
–0.0
0672
***
–0.0
0615
–0.0
0681
**
(0.0
0232
)(0
.003
85)
(0.0
0266
)
Year
s of a
cade
mic
edu
catio
n–0
.007
44**
*–0
.010
3***
–0.0
0580
***
(0.0
0166
)(0
.002
98)
(0.0
0185
)
Expe
rienc
e0.
0010
30.
0017
70.
0006
090.
0012
70.
0022
00.
0008
12
(0.0
0078
4)(0
.001
34)
(0.0
0090
2)(0
.000
818)
(0.0
0137
)(0
.000
953)
Expe
rienc
e sq
uare
d–5
.13e
–05*
**–5
.88e
–05*
*–4
.62e
–05*
*–5
.33e
–05*
**–6
.51e
–05*
*–4
.69e
–05*
*
(1.5
5e–0
5)(2
.66e
–05)
(1.8
0e–0
5)(1
.62e
–05)
(2.7
3e–0
5)(1
.89e
–05)
Mal
e0.
0129
**0.
0122
*
(0.0
0625
)(0
.006
22)
Obs
erva
tions
4,71
71,
984
2,73
34,
717
1,98
42,
733
Dep
ende
nt v
aria
ble
is th
e lo
g of
the
mon
thly
wag
e. A
dditi
onal
con
trols
for
the
mon
th d
urin
g w
hich
the
inte
rvie
w w
as ta
ken
are
incl
uded
. Mar
gina
l effe
cts
afte
r P
robi
t reg
ress
ions
with
**
* p<0
.01,
** p
<0.0
5, *
p<0.
1. P
eopl
e be
low
18
and
abov
e 65
are
exc
lude
d fro
m th
e sa
mpl
e, a
s w
ell a
s pe
ople
cla
imin
g to
hav
e m
ore
than
30
year
s of
edu
catio
n. E
xper
ienc
e is
mea
sure
d as
max
(0, a
ge-e
duca
tion-
5).

31
Does the Education System in Ukraine Diminish Labour Outflows?
Figure 5: Effect of a year of education on the chance to be self-employed (in percentages) in
Ukraine and various transition countries
The negative effect of education on self-employment suggests that in Ukraine, self-employment is more due to push factors than to pull factors.
Using ULMS data instead of ISSP data suggests that the negative effect of education is mainly for females (though smaller than the estimates based on ISSP), while for males education is unimportant or has a small positive effect.
1.3 ConclusionsIn Ukraine, many people believe that good education is important for getting ahead – but they also believe education is not the only thing that matters – ambition, hard work, political connections, being from a wealthy family or knowing the right people also are thought to be important. In terms of these beliefs, Ukraine is fairly similar to nine other transition countries considered in this study.
When looking at the actual situation, rather than to claims, it is obtained that the effect of education on the chance of finding a job is positive, a year of education increases the chance to finding a job by about two to three percentage points (hence reduces the risk of unemployment with the same number of percentage points). It is important to keep in mind that many unemployed respondents are educated. This phenomenon raises huge concerns in society and government. Apparently, and as data reveals, the unemployed are less educated than individuals with a job. This gap in the level of education between employed and unemployed does create some opportunities to improve one’s labour market outcome by obtaining more education. Importantly, these opportunities in Ukraine are comparable to those available in other transition countries. Thus, it is unlikely that the system of education in Ukraine stimulates migration through the risk of unemployment. While it is still possible that for some particular fields more educated individuals are more likely to become unemployed, but not for the economy in general. Unfortunately, the data do not allow an investigation into the impact of education by fields.
UA RU PL SI SK HU HR BG EE LV
2.5
2
1.5
1
0.5
0
–0.5
–1
–1.5
–2
–2.5
–3

The Relations between Education and Migration in Ukraine
32
Tab
le 6
: R
etu
rns
to e
du
cati
on
ba
sed
on
th
e U
LM
S –
Sel
f-em
plo
ymen
t
Var
iab
les
To
tal
Mal
eF
emal
eT
ota
lM
ale
Fem
ale
Tota
l Yea
rs o
f Edu
catio
n–0
.001
10.
0041
8*–0
.004
52**
*
(–0.
0014
5)(–
0.00
248)
(–0.
0016
)
Seco
ndar
y D
egre
e–0
.013
3–0
.001
52–0
.023
9
(–0.
0135
)(–
0.02
15)
(–0.
0168
)
Year
s of V
ocat
iona
l Edu
catio
n–0
.004
83–0
.003
44–0
.004
88
(–0.
0036
1)(–
0.00
608)
(–0.
0040
5)
Year
s of P
rofe
ssio
nal E
duca
tion
–0.0
0024
0.00
628
–0.0
0525
**
(–0.
0023
3)(–
0.00
43)
(–0.
0024
8)
Year
s of A
cade
mic
Edu
catio
n–0
.000
790.
0027
8–0
.003
16*
(–0.
0016
9)(–
0.00
306)
(–0.
0018
1)
Expe
rienc
e0.
0088
3***
0.00
891*
**0.
0092
1***
0.00
906*
**0.
0088
0***
0.00
974*
**
–0.0
0103
–0.0
0179
–0.0
0122
(–0.
0010
4)(–
0.00
18)
(–0.
0012
3)
Expe
rienc
e Sq
uare
d–0
.000
188*
**–0
.000
202*
**–0
.000
183*
**–0
.000
192*
**–0
.000
202*
**–0
.000
192*
**
(–2.
09E–
05)
(–3.
74E–
05)
(–2.
33E–
05)
(–2.
10E–
05)
(–3.
75E–
05)
(–2.
36E–
05)
Mal
e0.
0402
***
0.04
11**
*
(0.0
0738
)(–
0.00
745)
Obs
erva
tions
4,76
12,
001
2,76
04,
761
2,00
12,
760
Mar
gina
l effe
cts
afte
r Pro
bit r
egre
ssio
ns w
ith **
* p<0
.01,
** p
<0.0
5, *
p<0.
1. A
dditi
onal
con
trols
for t
he m
onth
dur
ing
whi
ch th
e in
terv
iew
was
take
n ar
e in
clud
ed. P
eopl
e be
low
18
and
abov
e 65
are
exc
lude
d fro
m th
e sa
mpl
e, a
s w
ell a
s pe
ople
cla
imin
g to
hav
e m
ore
than
30
year
s of
edu
catio
n. E
xper
ienc
e is
mea
sure
d as
max
(0,a
ge-e
duca
tion-
5.

33
Does the Education System in Ukraine Diminish Labour Outflows?
The results for other two indicators about a person’s success in the labour market suggest that education may encourage migration due to unfavourable local labour market opportunities. The effect of education on wages is substantially smaller than in other transition countries, with estimates ranging between one and five percentage points extra wage for an extra year of education. At the same time returns are between five and ten per cent in other transition countries. In Ukraine, education reduces the probability that one becomes self-employed (especially for females), suggesting that entrepreneurship in Ukraine is more driven by push factors than by pull factors. Other transition countries, in contrast, show no effect or a positive effect of education on the chance of being self-employed. These results may be driven by many factors including the differences in minimum wage, labour market rigidities, business climate and industry structures. Investigation of their contribution to our findings stays beyond the scope of the study.
Overall, the results suggest that education is a less powerful tool to improve one’s labour market prospect in Ukraine, as compared to other countries in the sample.


35
CHAPTER 2
The Direct Impact of a Person’s Education on Migration
This chapter investigates to what extent education directly affects major migration decisions including the probability to migrate, the choice of destination, the choice of occupation and migrant’s legal status in the host country. These decisions to a large extent determine how successful a migration event will be for a given individual. The chapter will help to understand whether the better educational attainment can help a person to gain additional benefits (skills, knowledge) from migration and thus to improve a person’s productivity and wage.
The effect of education on the above-mentioned four migration decisions has been discussed in the academic and policy literature, though country specific evidence for Ukraine is limited. In what follows, first the international literature and then the existing literature on Ukraine is reviewed. Then new findings for Ukraine based on an analysis of two datasets, the 2008 wave of the Ukrainian Labour Force Survey (LFS) and the External Labour Migration Survey (ELMS), are presented.
2.1 Education and Decision to Migrate – A Review of the Literature on Ukraine and InternationallyWith the rise in overall education levels across the globe, the rate of skill transfer via migration also has increased. Barrientos (2007) showed that in the decade from 1990 to 2000 the share of migrants with higher education in the world rose from 29.8 to 34.6 per cent while the share of low-educated migrants declined from 44.9 to 36.4 per cent.
The migration process affects both sending and receiving countries. Although it may hurt some social groups, such as low-skilled workers, overall immigration is beneficial for a host country since immigrants are mostly young, in many cases well-educated and willing to work at the most low-paid or hard jobs that local people are often unwilling to take. In the countries with selective migration policies immigrants are also a source of a considerable “brain gain”. For example, Hunt and Gauthier-Loiselle (2009) demonstrate that for the

The Relations between Education and Migration in Ukraine
36
USA, a one percentage point increase in the share of immigrant college graduates in the population increases patents per capita by six per cent.20 A review study of Hodson and Poot (2011) for New Zealand also shows an important contribution of migrants to GDP growth. At the same time, Huber et al. (2010) show that utilization of highly skilled migrants by EU countries is much lower. In particular, high-skilled foreign-born EU residents are more likely to be unemployed and less likely to be employed. This cross-country comparison suggests that USA and New Zealand, countries with more flexible labour markets, with greater competition among employees, extract more gains from skilled immigration than the European Union with its rigid labour markets.
“Brain drain” is probably a major concern of sending countries nowadays, including Ukraine. Other negative impacts of emigration on a sending country can include:
1. depopulation of the country since migrant’s families are generally younger, and also tend to have less children and delay childbearing. In other instances, if both parents emigrate and have children in a host country, they most probably will not return home;21
2. adverse social impact on migrants’ families remaining at home: higher divorce rate, lack of social role models for children and control over them, which leads to a child’s poorer achievement at school or even higher delinquency rates.22
However, the impact of skilled migration on the sending country depends on the country’s institutional settings and current production mode. Recent research suggests that the outflow of skilled labour in fact may be beneficial for sending countries (a “brain gain” hypothesis). The benefits may come across the following lines:23
1. greater volume of remittances from higher-skilled (and higher-paid) workers;24
2. return migration and migrants bringing enhanced skills and business/academic ties to their countries25 (however, if a migrant holds an unqualified position, (s)he may well lose rather than gain qualification);
3. migration prospects may act as an incentive to obtain education and thus increasing the average education level in a country (however, the possibility of migration also may
20. They also cite the results of other authors showing that the percentage of immigrant Nobel Prize winners and founders of venture and high-tech companies is more than twice higher than their share in general US population. A possible explanation for this fact is that people who dare to migrate are more hardworking and have more inventive and entrepreneurial spirit than those who do not.21. For the Ukrainian case, see Alissa Tolstokorova (2009). Costs and Benefits of Labour Migration for Ukrainian Transnational Families: Connection or Consumption? Available at: http://urmis.revues.org/index868.html.22. United Nations Development Programme: National Human Development Report 2001 (New York, UNDP, 2011). Available at: http://www.undp.org.ua/files/ua_95644NHDR_2011_Ukr.pdf.23. An OLG model of Mayr and Peri (2009) provides these outcomes. 24. The evidence on this, however, is mixed. McDonald and Valenzuela (2009) find a positive impact of education on remittances, Faini (2006), Niimi et al. (2008) and Adams (2008) report lower remittances from higher educated people (probably because people with higher education tend to bring their families abroad), while Arestoff et al. (2010) finds no impact of education on remittance volume and Craciun (2006) finds that education is insignificant for both the probability of remitting and volume of remittances. Moreover, the link “higher skills – higher pay” is not automatic. Labour market may adjust through the higher probability of employment for more skilled or better amenities rather than through wages, for example.25. For example, Iara (2008) showed that young people from Eastern Europe with EU–15 working experience get on average a 30 per cent wage premium, but only if they have higher education.

37
The Direct Impact of a Person’s Education on Migration
act as a disincentive to study since a person would be intending to migrate and take on an unqualified job for which education is unnecessary);
4. ties with the Diaspora are likely to increase foreign trade volume of the sending country and attract foreign investment to it26 (however, a favourable investment climate and the rule of law are required);
5. the outflow of workers lowers the pressure on the domestic labour market and increases worker turnover. Higher turnover lowers the average wage bill of a firm since newly hired workers can be paid less than ‘old’ ones.27 (On the other hand, the excessive outflow of skilled workers may induce their deficit and increase wages. Also, if a firm wants to retain skilled workers, it has to raise their wages).
2.1.1 Impact of Education on Propensity to Migrate
Perhaps the highest share of the education-migration literature is devoted to the impact of education on a person’s decision to migrate and choice of the destination country. Theoretically, there are two major reasons for education to affect migration, i.e. income differentials and migration cost. Migration costs are typically assumed to be decreasing in education (Ivanova and Jeong, 2011; Romero, 2007), thus stimulating migration among well-educated individuals. Assuncao and Carvalho (2005), Cattaneo (2007) and Beyene (2011) argue that migration costs play a crucial role for positive self-selection of migrants. The link between income differential and education depends on the labour market situations in sending and receiving countries. The share of high-skilled workers in a country lowers the probability of immigration for high-skilled people who have to compete for jobs with natives, and increases it for low-skilled workers who become complements rather than substitutes for locals (Geis et al., 2008). Assuncao and Carvalho (2005) point out that both education and migration decisions are determined by family wealth. Wealthier families are more able to pay for both education and migration. Hence, more educated migrants can be more likely to migrate even if the home country offers higher returns to education than a host country (it is assumed that host country offers a migration premium in a form of higher wages at all levels of education or better living conditions). The presence of migration cost may induce migration of middle-class individuals and thus increase rather than lower inequality in the source country.
The majority of studies find that education (especially higher education) has a positive effect on the probability of migration. This conclusion is verified by Zaiceva and Zimmermann (2008) for EU-10 countries, Budnik (2011) and Cizkowitz et al. (2007) for Poland, Avato (2009) and Alquezar et al. (2010) for Egypt, Moldova, Albania and Tunisia, Danzer and Dietz (2009) for Georgia, Faini (2006) for EU host countries.
Other studies have shown that this impact is negative for a number of CIS countries, including Ukraine (Danzer and Dietz, 2008) and Moldova (Danzer and Dietz, 2009), for
26. Recent literature shows positive impact of Diaspora on FDI and technology transfer – for example, Flisi and Murat (2009), Leblang (2010), Murat, Pistoresi and Rinaldi (2008).27. Romero (2007), Commander et al. (2004).

The Relations between Education and Migration in Ukraine
38
Romania (Prelipceanu, 2010), for Eastern European youth (Iara, 2008), and for a number of West African countries (de Vreyer et al., 2010).
Caponi (2006) found that people with the lowest and highest levels of education have the highest gains from migration, and hence are more likely to migrate from Mexico. According to Sharma and Zaman (2009), it is just the opposite for Bangladesh where migration is at the highest rate among individuals with an average level of education. Education is not found to be significant as a migration factor in Ethiopia (Beyene, 2011).
2.1.2 Impact of Education on the Choice of a Destination Country
Grogger and Hanson (2008) show that more educated people are both more likely to emigrate and choose a destination country with higher returns to their skills. Geis et al. (2008) find that higher-skilled people28 have more freedom in destination choice because of the restrictive migration policies of selected host countries. Indeed, some developed countries have or consider skill-selective immigration policies (for example, Canada and Australia have scoring systems; Germany and other European countries are introducing the “Blue Card” system to attract skilled migrants29).
Grip et al. (2009) estimated migration probabilities and destination choices of European science and engineering graduates and found that best students choose to migrate to Anglo-Saxon countries (USA, Canada or Australia30) rather than other EU states. The authors suggest that countries with higher R&D intensity offer better career prospects (since highly educated people look not only for a high salary but also for a chance to realize their scientific, research or entrepreneurial ambitions). Perhaps for the same reason, at least in early 2000s, 61 per cent of Ukrainian tertiary educated migrants go to USA and only 22 per cent to EU-15, according to Ozden and Schiff (2006).
In addition to earning, skilled and unskilled migration can be driven by various amenities in the host country (Geis et al., 2008). For example, higher union coverage and unemployment benefits attract low-skilled immigrants while higher pension replacement rates increase the flows of high-skilled migrants. The quality of educational and medical systems31 (measured by PISA scores and infant mortality rate) encourage high-skilled and discourages low-skilled immigration.
Several descriptive studies discuss the relationship between education and migration for Ukraine. In particular, Parkhomenko (2006)32 refers to the parliamentary hearings on the “Situation and problems of legal and social status of current Ukrainian labour migration” in 2004 to claim that the education level of Ukrainian labour migrants (10.9 years of studies) was insignificant but lower than the education level of the country’s working
28. Geis et al. (2008) defines higher-skilled individuals as those with education of the level ISCED-3 or higher.29. http://www.europeanunionbluecard.com/.30. The fact that these societies traditionally composed of immigrants are more open to strangers may also play a role (lower assimilation cost).31. Important for children of migrants who would like to bring their family with them.32. http://cpcfpu.org.ua/en/projects/foreignpolicy/papers/306/.

39
The Direct Impact of a Person’s Education on Migration
population (11.4 years). A high education level characterizes Ukrainian labour migrants in the United Kingdom (12.5 years of studying), USA and Canada (12.3), Austria, Belgium, Netherlands, Germany, Luxemburg, France (11.8). The education level of the Ukrainian migrants working in Israel (11.5), Spain, Greece and Portugal (11 years) is also higher than the Ukraine average. Migrants to the Russian Federation, Czech Republic, Poland, Hungary and Slovakia received less education, 10.7 years or less.
According to the ETF survey (2008), neither education level nor the field of study influences the intention or decision to migrate. However, destination countries differ substantially by education level. Higher-educated Ukrainians tend to go to the North America, while individuals with lower education go mostly to Russia and South Europe (Italy, Greece and Spain).
Ukrainian State Statistics office shows that on average the education level of Ukrainian migrants is lower than that of the general population (see Table 7), and it has fallen even more. In 2001, 18.8 per cent of labour migrants had higher education33 as compared to 15.0 per cent in 2012. The share of migrants with complete secondary education in 2010–2012 goes up as compared to 2005–2008, while the proportion of migrants with basic secondary education or below goes down.This tendency is mostly driven by male migrants (the share of male migrant workers with complete secondary education shrank from 61.2 per cent to 57.8 per cent). Among females the share of migrants with unfinished higher education is going up from 19.1 per cent in 2005–2008 to 24.3 per cent in 2010–2012.
Table 7: Educational levels of Ukrainian migrants and domestic labour force, per cent
Level of education Employed working-age
population (15–70),
2010
ELMS – 2008 LMS – 2012
Total Male Female Total Male Female Total Male Female
Higher education (ISCED–5/6) 24.6 29.7 24.6 13.9 11.0 19.7 15.0 13.7 18.0
Unfinished higher education/vocational studies (ISCED–4)
16.1 25.4 16.1 17.3 16.5 19.1 14.5 10.0 24.3
Complete secondary (ISCED–3) 51.0 37.6 51.0 59 62.4 52.1 65.9 71.3 54.1
Basic secondary or less (ISCED–0/1/2) 8.2 7.3 8.2 9.8 10.1 9.1 4.6 5.1 3.7
Source: State Statistic Service.
Table 8 compares the educational distribution of Ukrainian migrants to that of some host countries. Only in one country (Italy) did the share of higher-educated migrants exceed that of the native population. In all other countries, the share of secondary-educated migrants exceeds the corresponding proportion of the native population, whereas the share of migrants with higher education is lower than that of the native workers.
33. As cited by Malynovska (2011).

The Relations between Education and Migration in Ukraine
40
Table 8: Educational composition of Ukrainian migrants and labour force in a host country, 2008
Country Share of the corresponding group by the level of education, per cent
Group of Ukrainian migrantsBasic secondary or
less (ISCED–0/1/2)
Complete secondary
(ISCED–3/4)
Higher
(ISCED–5/6)
All Ukrainian migrants (UM)a 9.8 76.3 13.9
Ukraine totalb 16.1 65.4 18.5
Russiac 22.5 60.4 16.0
UM in Russiaa 12.0 75.2 12.8
Italyc 47.8 39.5 12.7
UM in Italya 5.8 75.7 18.5
Czech Republicc 15.8 71.7 12.4
UM in Czech Republica 7.7 85 7.3
Polandc 19.6 63.8 16.5
UM in Polanda 8.8 85.4 5.8
Hungaryc 25.8 57.9 16.4
UM in Hungarya 11.1 81 7.9
Spainc 50.0 23.3 26.8
UM in Spaina 7.0 73.2 19.8
Portugalc 70.6 16.7 12.7
UM in Portugala 7.2 85.9 6.9
EU-27c 32.2 46.5 21.2
Data sources:a State Statistics Service, 2008 External Labour Migrant Survey, per cent of migrants (only migrants of age
15–60 entered the survey).b State Statistics Service, 2008 Economic Activity Survey, per cent of people aged 15–64‡ Rosstat, 2002 census
data, per cent of people over 10.c Eurostat database, 2008, per cent of people aged 15–64.
2.2 Impact of Education on Migration Decisions – Empirical Evidences The data for the empirical analysis come from two waves of the Labour Migration Survey, i.e. the External Labour Migration Survey (ELMS, 2008) and the Labour Migration Survey (LMS, 2012) supplemented by the Ukrainian Labour Force Survey (LFS). First, the migration in 2005–2008 is analysed. Next, more recent data covering 2010–2012 is discussed. To study the propensity to migrate, the LFS is used in both cases. Other migration decisions are considered conditional on the decision to migrate. For this purpose the entire migration data sets are used. Age limits of the respondents are adjusted following the design of ELMS (2008) to make all data comparable (see Appendix for further details).

41
The Direct Impact of a Person’s Education on Migration
2.3 Migration Decisions in 2005–2008 – Evidence from the Ukrainian Labour Force Survey and External Labour Migration ModuleThe ELMS covers migration in 2005–2008. It was conducted in April–May 2008 by the Ukrainian State Statistics Committee and the Ukrainian Centre for Social Reform with financial and technical support from the Open Ukraine Foundation, International Organization for Migration and the World Bank. The survey was operated as a supplement to two nationally representative surveys of non-institutional households, the above mentioned monthly Labour Force Survey (LFS) and the quarterly Household Budget Survey (HBS).
2.3.1 Propensity to Migrate
The analysis of the 2008 LFS data reveals no statistically significant impact of education on the probability to migrate after controlling for other factors. In contrast, most other variables have strong effects. Middle–aged, unmarried males, without small children, from rural settlements, and individuals from the West are most likely to migrate (see Table 9). This result suggests that in general Ukrainian migration in 2005–2008 was driven by push factors.

The Relations between Education and Migration in Ukraine
42
Table 9: Impact of education on the decision to migrate based on LFS, 2005–2008
Variables Marginal effects
Age 0.003***[0.000]
Age squared –0.00004***[0.000]
Female –0.012***[0.001]
Married –0.004***[0.001]
Education Tertiary –0.001
[0.002]Post-secondary non-tertiary 0.002
[0.002]Upper secondary 0.002
[0.001]Household characteristics Presence of children under age six –0.002**
[0.001] Presence of elderly (65+) –0.001
[0.001] Household size 0.00005
[0.0004]Type of settlement Urban –0.003**
[0.001]Location North –0.007***
[0.002] South –0.003
[0.002] East 0.001
[0.002] West 0.028***
[0.002]
Observations 36,495Pseudo R-squared 0.126
Dependent variable is a 0/1 indicator of migration experience in 2005–2008. Marginal effects are reported. Lower secondary and primary education is the base education category. Centre is the base location category. Standard errors in brackets. *** p<0.01, ** p<0.05, * p<0.1.

43
The Direct Impact of a Person’s Education on Migration
2.3.2 Migration Destination
Survey results allow to identify four major labour destinations of effective migration. In 2005–2008 out of 1,381 migrants, 642 (49.2 per cent)34 chose the CIS with the majority going to Russia (627 individuals). The second largest group included 365 (24.4 per cent) respondents who worked in CEE, Turkey or Egypt. Most of these respondents went to Czech Republic (182), Poland (126) and Hungary (45). The third group of migrants included 289 (19.5 per cent) individuals with working experience in Southern European states, such as Italy (216), Portugal (40) and Spain (33). Finally, 85 (6.8 per cent) respondents reported developed Western European countries and USA as their migration destination.35 Migrants to South Europe as well as to West Europe and North America were relatively more educated while CIS migrants in general had less schooling; especially males (see Figures 6–8).
Figure 6: Education composition of Ukrainian migrants by destinations (both genders), 2005–2008
Source: EMLS, 2008. Survey weights are applied.
34. Shares in the population are estimated using corresponding population weights.35. This group also includes one migrant each to Brazil, Saudi Arabia and Tunisia.
CIS CEE, Turkey and Egypt
Western Europe and USA
Southern Europe Total
100%
80%
60%
40%
20%
0%
Lower secondary and primary Upper secondary
Post-secondary Tertiary

The Relations between Education and Migration in Ukraine
44
Figure 7: Education composition of Ukrainian migrants by destination (females only), 2005–2008
Source: EMLS, 2008. Survey weights are applied.
Figure 8: Education composition of Ukrainian migrants by destination (males only), 2005–2008
Source: EMLS, 2008. Survey weights are applied.
Regression analysis supports this observation (see Table 10). Keeping everything else constant, more educated migrants are more likely to select Western countries rather than CIS. Additionally, more educated individuals are more likely to migrate to South European states (Spain, Italy, and Portugal). This result also holds for respondents who previously
CIS CEE, Turkey and Egypt
Western Europe and USA
Southern Europe Total
100%
80%
60%
40%
20%
0%
Lower secondary and primary Upper secondary
Post-secondary Tertiary
CIS CEE, Turkey and Egypt
Western Europe and USA
Southern Europe Total
100%
80%
60%
40%
20%
0%
Lower secondary and primary Upper secondary
Post-secondary Tertiary

45
The Direct Impact of a Person’s Education on Migration
Ta
ble
10
: Im
pa
ct
of
ed
uc
ati
on
an
d o
cc
up
ati
on
of
the
ch
oic
e o
f m
igra
tio
n d
es
tin
ati
on
, E
LM
S (
20
05
–20
08)
Var
iab
les
Ch
oic
e o
f m
igra
tio
n d
esti
nat
ion
Sp
eci
fica
tio
n 1
Sp
ecif
icat
ion
2
CE
E, T
urk
ey a
nd
E
gyp
t v
s. C
IS
Wes
tern
Eu
rop
e a
nd
US
A v
s. C
ISS
ou
th E
uro
pe
vs. C
ISC
EE
, Tu
rkey
an
d
Eg
ypt
vs. C
ISW
este
rn E
uro
pe
and
US
A v
s. C
ISS
ou
th E
uro
pe
vs.
CIS
Age
-0.0
10-0
.098
0.08
9-0
.016
-0.1
010.
074
[0.0
56]
[0.0
93]
[0.0
68]
[0.0
58]
[0.0
98]
[0.0
70]
Age
squa
red
0.00
003
0.00
133
-0.0
0087
0.00
014
0.00
143
-0.0
0066
[0.0
0073
][0
.001
22]
[0.0
0088
][0
.000
77]
[0.0
0128
][0
.000
91]
Fem
ale
1.26
7***
1.50
1***
2.25
7***
1.30
1***
1.60
0***
2.29
8***
[0.1
77]
[0.2
64]
[0.1
89]
[0.1
89]
[0.2
75]
[0.1
99]
Mar
ried
-0.2
08-0
.289
-0.6
38**
*-0
.121
-0.3
53-0
.761
***
[0.1
90]
[0.3
06]
[0.2
11]
[0.2
02]
[0.3
16]
[0.2
20]
Educ
atio
n
Terti
ary
0.06
32.
418*
**1.
054*
**0.
200
1.97
4***
0.66
6*[0
.331
][0
.658
][0
.368
][0
.358
][0
.683
][0
.396
]
Post
-sec
onda
ry n
on-te
rtiar
y0.
612*
*1.
675*
*1.
436*
**0.
587*
1.37
2*1.
094*
**[0
.297
][0
.687
][0
.352
][0
.326
][0
.702
][0
.374
]
Upp
er se
cond
ary
0.25
91.
292*
*0.
662*
*0.
272
1.26
6**
0.59
7**
[0.2
14]
[0.6
21]
[0.2
87]
[0.2
25]
[0.6
25]
[0.2
93]
Occ
upat
ion
B
lue
colla
r-0
.326
-1.0
07**
-1.0
96**
*[0
.355
][0
.400
][0
.326
]
Uns
kille
d0.
266
-1.1
83**
-1.0
65**
*[0
.399
][0
.571
][0
.406
]
Une
mpl
oyed
0.24
1-0
.965
**-0
.951
***
[0.3
53]
[0.4
18]
[0.3
32]
Obs
erva
tions
1,38
11,
381
1,38
11,
273
1,27
31,
273
Pseu
do R
-squ
ared
0.18
10.
181
0.18
10.
194
0.19
40.
194
Coe
ffici
ents
are
repo
rted.
Low
er s
econ
dary
and
prim
ary
educ
atio
n is
the
base
edu
catio
n ca
tego
ry. W
hite
col
lar i
s th
e ba
se o
ccup
atio
n ca
tego
ry. A
dditi
onal
con
trols
fo
r th
e ho
useh
old
com
posi
tion,
urb
an r
esid
ency
, mai
n re
ason
s fo
r m
igra
tion
and
geog
raph
ic lo
catio
n ar
e in
clud
ed. S
tand
ard
erro
rs in
par
enth
eses
, ***
p<0
.01,
**
p<0.
05, *
p<0
.1.
held white-collar jobs at home. At the same time, migrants working in Poland, Czech Republic, Hungary and Turkey are not different in terms of skills compared to migrants to Russia except among respondents with incomplete higher education. This group prefers all other destinations to the CIS region.

The Relations between Education and Migration in Ukraine
46
2.3.3 Occupation Abroad
For the group of migrants whose labour migration experience refers to 2007–2008, there is information available about their occupations prior to leaving Ukraine and while working abroad. All occupations are grouped into three large categories, i.e. white-collar workers, blue-collar workers and unskilled workers. Only two migrants say that they could not find the job abroad.36
Most Ukrainian migrants manage to get predominantly blue-collar or unskilled jobs abroad (Libanova, 2010). Table 11 demonstrates that above 80 per cent of well-educated migrants are in these occupational groups.37 However, those who manage to find a white-collar occupation hold mostly tertiary and post-secondary education (see Table 12). It is also noticeable that 37 per cent of migrants had no job at home (Table 13), though the share of previously unemployed is much lower for more educated migrants (24–27 per cent).
Table 11: Occupational composition of Ukrainian migrants during employment abroad by the
level of education, 2005–2008
Level of education Occupational groups during employment abroad
White collar Blue collar Unskilled Total
Tertiary 19.94 47.93 32.13 100
Post-secondary 14.55 59.9 25.55 100
Upper secondary 0.92 64.75 34.33 100
Lower secondary and primary 0 59.7538 40.25 100
Total 5.80 61.04 33.16
Source: EMLS, 2008. Survey weights are applied.38
Table 12: Educational composition of Ukrainian migrants by the type of occupation abroad,
2005–2008
Level of education Occupational groups during employment abroad
White collar Blue collar Unskilled Total
Tertiary 49.68 11.36 14.02 14.46
Post-secondary 40.9 16.01 12.57 16.31
Upper secondary 9.42 63.11 61.61 59.5
Lower secondary and primary 0 9.52 11.81 9.73
Total 100 100 100
Source: EMLS, 2008. Survey weights are applied.
36. For the empirical analysis they are treated similar to migrants with unskilled occupations.37. Population weights are applied.38. These respondents were mostly employed in construction, agriculture and retails at jobs that require more than the simplest skills. In most cases their actual qualification seems to substitute for the lack of formal education. Five respondents have some certificates from training courses (such as driver or welder courses).

47
The Direct Impact of a Person’s Education on Migration
Table 13: Occupational composition of Ukrainian migrants before migration by the level of
education, 2005–2008
Level of education Occupational groups at home
White collar Blue collar Unskilled Unemployed Total
Tertiary 43.95 25.03 4.07 26.95 100
Post-secondary 26.7 42.79 6.47 24.04 100
Upper secondary 4.38 42.79 10.76 42.07 100
Lower secondary and primary 1.35 42.25 11.37 45.04 100
Total 13.45 40.17 9.15 37.23 100
Source: EMLS, 2008. Survey weights are applied.
For the empirical assessment the likelihood of working aboard in a white-collar or unskilled occupation is estimated relative to the probability of getting a blue-collar job. The analysis reveals that skills seem to have a dual effect on the occupation abroad. Some highly skilled migrants are relatively more likely to work as white-collar workers, others – as unskilled ones. In particular, if skills are measured with education, the likelihood of being employed as a white-collar rather than a blue-collar worker is higher for more educated migrants.39 On the other hand, no relationship between migrant’s education and the acceptance of blue-collar versus unskilled occupations is found. A much clearer picture can be drawn if skills are measured with a previous occupation at home. Respondents reporting a white-collar occupation before migration are significantly more likely to work abroad as white collar workers compared to those previously with blue-collar occupations. This effect is hence similar (in terms of direction) to the impact of education. However, people who held white-collar jobs at home are more likely to end up as unskilled labourers rather than blue-collar workers, relative to previously blue-collar workers or even previously unemployed.
Given the importance of home occupation for the occupation abroad additional regressions are run to check the effect of education on the mobility between unskilled, white-collar and blue-collar jobs by comparing the jobs types at home and abroad. Individuals whose occupation abroad matches the previous occupation are identified as the “no mobility” group. Migrants who find work abroad at a different job within the same occupational level are called “horizontal” switchers. If an individual had to accept an occupation at a lower level (say white- or blue-collar workers working as unskilled labourers) belong to the “downward” movers. Finally, migrants who worked abroad at a high-level occupation compared to their domestic position are called “upward” shifters. The distribution of migrants by mobility groups is shown in Figure 9.
39. This result is not robust to the exact optimization procedure due to a very small number of observations in the white-collar group.

The Relations between Education and Migration in Ukraine
48
Figure 9: Mobility of Ukrainian migrants between occupations before and during migration (both
genders), 2005–2008
Source: EMLS, 2008. Survey weights are applied.
The analysis reveals that the probability of staying within the same level of occupation or moving to a lower level rather than staying in the same occupation increases with education. It implies that more skilled migrants (in terms of education) are more likely to accept another job abroad of a similar or lower level rather than getting the same job as they had locally. With additional control for the domestic occupation the results change but convey the same message. The probability of staying within the same level of occupation as compared to not changing occupation at all is still positively related to education, and white-collar workers are more likely than blue-collar workers to work abroad at a lower-level job. As Figure 10 and Figure 11 reveal, on average, in 2005–2008 women were more likely than men to experience downward mobility (39.1 per cent vs. 30.7 per cent) and were less likely to fall into the “no mobility” category (20.9 per cent vs. 31.1 per cent).
Figure 10: Mobility of Ukrainian migrants between occupations before and during migration
(females only), 2005–2008
Source: EMLS, 2008. Survey weights are applied.
27.63%
30.79%
33.54%
8.04%
No mobility Horizontal switch Downward mobility Upward mobility
20.9%
30.1%
39.1%
9.9%
No mobility Horizontal switch Downward mobility Upward mobility

49
The Direct Impact of a Person’s Education on Migration
Figure 11: Mobility of Ukrainian migrants between occupations before and during migration
(males only), 2005–2008
Source: EMLS, 2008. Survey weights are applied.
This difference in effects between education and occupation for the choice of occupation suggests two conclusions. First, domestic occupation of Ukrainian migrants is a better predictor of their occupation abroad than education. Second, while blue-collar Ukrainian migrants mostly get a corresponding job abroad, white-collar migrants are more likely to end up either in the white-collar or in the unskilled occupational groups.
Table 14: Impact of education and previous occupation on the choice of occupation abroad,
2005–2008
Variables Choice of occupation abroad
Specification 1 Specification 2
White collars
vs. blue collars
Unskilled
vs. blue collars
White collars
vs. blue collars
Unskilled
vs. blue collars
Age –0.0166 0.0108* –0.0176 0.0101
[0.0190] [0.00653] [0.0205] [0.00674]
Female 0.592* 0.480*** 0.560 0.451***
[0.360] [0.129] [0.375] [0.132]
Married –0.254 –0.0856 –0.415 –0.0545
[0.398] [0.139] [0.410] [0.143]
Education
Tertiary 16.02a 0.203 14.77a 0.134
[595.2] [0.255] [436.8] [0.271]
Post-secondary non-tertiary 15.88a –0.0529 14.8a –0.0957
[595.2] [0.241] [436.8] [0.251]
Upper secondary 12.94a –0.0882 12.17a –0.0865
[595.2] [0.183] [436.8] [0.187]
31.1%
31.1%
30.7%
7.1%
No mobility Horizontal switch Downward mobility Upward mobility

The Relations between Education and Migration in Ukraine
50
Variables Choice of occupation abroad
Specification 1 Specification 2
White collars
vs. blue collars
Unskilled
vs. blue collars
White collars
vs. blue collars
Unskilled
vs. blue collars
Occupation Blue collar –1.618*** –0.667***
[0.468] [0.237] Unskilled –1.141 0.768***
[0.832] [0.283] Unemployed –1.751*** –0.430*
[0.513] [0.235]
Observations 1,273 1,273 1,273 1,273Pseudo R-squared 0.0969 0.0969 0.1303 0.1303
Coefficients are reported. Lower secondary and primary education is the base education category. White-collar worker is the base occupation category. Additional controls for the household composition, urban residency and geographic location are included. Standard errors in parentheses, *** p<0.01, ** p<0.05, * p<0.1. a Statistically significant at 1 per cent under other optimization algorithm.
Table 15: Impact of education and previous occupation on the occupation mobility, 2005–2008
Variables Mobility categories
Specification 1 Specification 2
Horizontal switch vs. no mobility
Downward shift vs.
no mobility
Upward shift vs.
no mobility
Horizontal switch vs. no mobility
Downward shift vs.
no mobility
Upward shift vs.
no mobility
EducationTertiary 1.018** 2.067*** 0.257 1.109** 0.479 1.140 [0.467] [0.439] [0.621] [0.487] [0.517] [0.764]Post-secondary non-tertiary
0.781* 1.389*** 0.0427 0.796* 0.180 0.449
[0.411] [0.401] [0.538] [0.422] [0.466] [0.648]Upper secondary 0.988*** 0.827** –0.0204 1.007*** 0.797** –0.254
[0.330] [0.340] [0.417] [0.331] [0.368] [0.486]Occupation
Blue collars 0.00360 –2.734*** 13.62 [0.472] [0.406] [754.0]Unskilled 0.133 –19.53 17.25 [0.523] [650.2] [754.0]
Observations 719 719 719 719 719 719Pseudo R-squared 0.0606 0.0606 0.0606 0.242 0.242 0.242
Coefficients are reported. Lower secondary and primary education is the base education category. White-collar workers is the base occupation category. Additional controls for the household composition, urban residency and geographic location are included. Standard errors in parentheses, *** p<0.01, ** p<0.05, * p<0.1.

51
The Direct Impact of a Person’s Education on Migration
2.3.4 The Migrant’s Legal Status Abroad
Finally, for the purpose of measuring the effect of education on a legal status of migrants in the host country, migrants have been classified into three groups. The first one compiles migrants holding both residence and work permits. The second category includes migrants with only legal residency, in most cases temporary, but without work permits. This is the comparison group. The last group consists of migrants with undocumented status in the host country during their last visit. Figure 12 shows the share of migrants falling in each category. Figure 13 and Figure 14 reveal that in 2005–2008 there was slight difference in the distribution by gender without clear tendency.
Figure 12: Legal status of Ukrainian migrants in the host country (both genders), 2005–2008
Source: EMLS, 2008. Survey weights are applied.
Figure 13: Legal status of Ukrainian migrants in the host country (females only), 2005–2008
Source: EMLS, 2008. Survey weights are applied.
31.8%
42.7%
25.6%
Residency and work permit Only residence permit Unofficial
34.8%
37.4%
27.8%
Residency and work permit Only residence permit Unofficial

The Relations between Education and Migration in Ukraine
52
Figure 14: Legal status of Ukrainian migrants in the host country (males only), 2005–2008
Source: EMLS, 2008. Survey weights are applied.
It was found that schooling makes a difference only for the migrants with upper secondary education. They are more likely than other educational cohorts to hold either both types of permits or none. In terms of occupation, white-collar workers are relatively more likely to have a fully legal status compared to legal residency only (see Table 16).
It is worth mentioning that the factor that truly matters for the legal status of a migrant in the destination country is who organized the migration. Six groups can be distinguished here, i.e. migrant him/herself, employment agency, travel agency, future employer, friends and relatives or other individuals. Figure 15 shows the distribution of migrants by these categories for both genders, while Figure 16 and Figure 17 disaggregate it for females and males. With respect to gender differences, it is worth mentioning that in 2005–2008 females are four times more likely to work abroad through travel agencies, while males were almost twice as likely as females to use the employer’s assistance.
Figure 15: Who organized the last trip abroad (both genders), 2005–2008
Source: EMLS, 2008. Survey weights are applied.
30.2%
45.4%
24.4%
Residency and work permit Only residence permit Unofficial
47%
10%
17%
6%
17%
3%Migrant
Employment agency
Travel agency
Employer
Relatives/friends
Other

53
The Direct Impact of a Person’s Education on Migration
Figure 16: Who organized the last trip abroad (females only), 2005–2008
Source: EMLS, 2008. Survey weights are applied.
Figure 17: Who organized the last trip abroad (males only), 2005–2008
Source: EMLS, 2008. Survey weights are applied.
The empirical analysis reveals that private employment agencies are the only channel that increases the probability of holding both permits rather than a residency permit only. If it is the employer rather than the migrant him/herself who takes care of the contract, paper work and visa arrangements, the migrant is less likely to hold undocumented job status rather than only a residency permit. In contrast, relying upon travel agencies, friends, relatives or other individuals increases the probability of a fully unofficial stay in the destination country (Table 16).
48.9%
10.7%
14.6%
12.4%
10.9%
2.5%Migrant
Employment agency
Travel agency
Employer
Relatives/friends
Other
45%
11.5%
17.7%
3.3%
18.7%
3.8%Migrant
Employment agency
Travel agency
Employer
Relatives/friends
Other

The Relations between Education and Migration in Ukraine
54
Table 16: Impact of education and previous occupation on legal status of Ukrainian migrants in
the host country, 2005–2008
Variables Migrant’s legal status in the host country
Residence and work permitvs. residence permit only
Unofficial stayvs. residence permit only
Education
Tertiary –0.0261 –0.0188
[0.314] [0.325]
Post-secondary non-tertiary 0.0307 0.319
[0.294] [0.290]
Upper secondary 0.510** 0.343
[0.221] [0.225]
Occupation
Blue collar –0.537** –0.0662
[0.257] [0.288]
Unskilled –0.421 –0.311
[0.310] [0.348]
Unemployed –0.557** 0.124
[0.260] [0.287]
Trip organizer
Employment agency 0.692*** –0.145
[0.234] [0.279]
Travel agency 0.194 0.954***
[0.325] [0.289]
Employer –0.0424 –1.168***
[0.192] [0.263]
Relatives/friends 0.193 0.453**
[0.200] [0.192]
Other 0.566 1.683***
[0.488] [0.406]
Observations 1,273 1,273
Pseudo R-squared 0.0729 0.0729
Coefficients are reported. Lower secondary and primary education is the base education category. White collar worker is the base occupation category. Migrant is a base category for the trip organizer. Additional controls for the age, gender, marital status, household composition, urban residency and geographic location are included. Standard errors in parentheses, *** p<0.01, ** p<0.05, * p<0.1.

55
The Direct Impact of a Person’s Education on Migration
2.4 Migration Decisions in 2010–2012 – Evidence from Ukrainian Labour Force Survey and Labour Migration ModuleTo analyse the actual migration decisions in 2010–2012 the LMS (2012) has been used. This data were collected in April–June 2012 by the State Statistics Service of Ukraine and the Ptoukha Institute for Demography and Social Studies of the National Academy of Sciences of Ukraine with financial and technical support from the European Union, and the International Labour Organization. The module was implemented as a supplement to the Labour Force Survey in April–June 2012.
2.4.1 Propensity to Migrate
In 2010–2012 individuals who are most likely to migrate have stayed very similar to the 2005–2008 migrants in most dimensions. These are still middle-aged, unmarried males, without small children, from rural settlements, and from the West. However, the effect of education has changed. In the post-crisis period Ukrainians with a middle level of education (i.e. upper secondary and post-secondary non-tertiary) are statistically more likely to migrate if compared to other respondents. Moreover, whilst in size the effect of education is still smaller relative to the effect of geographic region, it is now comparable to the effect of gender, rural location or marital status (column 3 of Table 17). This result indicates that the nature of Ukrainian migration in 2010–1012 with respect to its skills dimension has changed.
Table 17: Impact of Education on the decision to migrate based on LFS, both periods
Variables 2005–2008 2010–2012
Age 0.003*** 0.003***
[0.000] [0.000]
Age squared –0.00004*** –0.00004***
[0.000] [0.000]
Female –0.012*** –0.007***
[0.001] [0.001]
Married –0.004*** –0.004***
[0.001] [0.001]
Education
Tertiary –0.001 0.001
[0.002] [0.002]
Post-secondary non-tertiary 0.002 0.005**
[0.002] [0.002]
Upper secondary 0.002 0.006***
[0.001] [0.002]

The Relations between Education and Migration in Ukraine
56
Variables 2005–2008 2010–2012
Household characteristics
Presence of children under age six –0.002** –0.002**
[0.001] [0.001]
Presence of elderly (65+) –0.001 –3.67e–06
[0.001] [0.001]
Household size 0.00005 0.002***
[0.0004] [0.000]
Type of settlement
Urban –0.003** –0.004***
[0.001] [0.001]
Location
North –0.007*** 0.003
[0.002] [0.002]
South –0.003 0.005*
[0.002] [0.003]
East 0.001 –0.001
[0.002] [0.002]
West 0.028*** 0.038***
[0.002] [0.003]
Observations 36,495 33,752
Pseudo R-squared 0.126 0.156
Dependent variable is a 0/1 indicator of migration experience in 2005-2008. Marginal effects are reported. Lower secondary and primary education is the base education category. Center is the base location category. Standard errors in brackets. *** p<0.01, ** p<0.05, * p<0.1.
2.4.2 Migration Destination
In 2010–2012 the total number of migrants in the population slightly decreased. However, their distribution by four major destination groups, as described above, did not change much. Similarly to the previous wave of the migration survey, two major migration directions include the CIS – 266 out of 606 respondents in the sample (corresponds to 45.8 per cent of the entire flow of migrants) and CEE, Turkey and Egypt – 208 (30.4 per cent) migrants. The third largest group, 107 (18.5 per cent) Ukrainians, worked in Southern European states and 25 (5.3 per cent) migrants went to ‘old’ West European countries and North America.
At the same time, the share of least educated migrants (with a lower secondary and primary education level) declined more than twice, especially in Southern Europe and the CIS. A similar decrease in the share of migrants with upper secondary education is observed

57
The Direct Impact of a Person’s Education on Migration
for Ukrainian overseas workers in Western Europe. In contrast, the share of Ukrainian migrants with tertiary education in that region almost doubled (see Figure 18).
Figure 18: Education composition of Ukrainian migrants by destinations (both genders), 2010–2012
Source: LMS, 2012.
Figure 19: Education composition of Ukrainian migrants by destinations (females only), 2010–2012
Source: LMS, 2012.
CIS CEE, Turkey and Egypt
Western Europe and USA
Southern Europe Total
100%
80%
60%
40%
20%
0%
Lower secondary and primary Upper secondary
Post-secondary Tertiary
CIS CEE, Turkey and Egypt
Western Europe and USA
Southern Europe Total
100%
80%
60%
40%
20%
0%
Lower secondary and primary Upper secondary
Post-secondary Tertiary

The Relations between Education and Migration in Ukraine
58
Figure 20: Education composition of Ukrainian migrants by destinations (males only), 2010–2012
Source: LMS, 2012.
In 2010–2012 the migrants to Western Europe and the USA became even more educated. The share of overseas workers with tertiary education migrating to this destination grew to 65.3 per cent. This change was mostly driven by an increase in proportion of well-educated female migrants from 44.7 per cent in 2005–2008 to 77.8 per cent in 2010–2012, while for men it changed from 32.3 per cent to 56.3 per cent. No male migrants with lower secondary and primary education went to Western and Southern Europe in 2012, but share of female workers with such education in Western Europe went from zero to 5.5 per cent. Female migrants to the CIS became more educated while the educational level of males working there declined (see Figure 19 and Figure 20).
Empirical analysis of the impact of skills on the choice of destination also confirms that the nature of Ukrainian migration has changed. After controlling for other factors, neither occupation nor education affects the choice of destination anymore. Geographical variables and household structure play much more important roles. Even after controlling for age and occupation, females are more likely to work in CEE and Southern Europe relative to the CIS. Migrants from urban settlements and from the Western and Central regions of Ukraine are more likely to go to Southern Europe. Individuals from households with small children are less likely to look for a job in developed countries while the presence of the elderly increases such a probability.
CIS CEE, Turkey and Egypt
Western Europe and USA
Southern Europe Total
100%
80%
60%
40%
20%
0%
Lower secondary and primary Upper secondary
Post secondary Tertiary
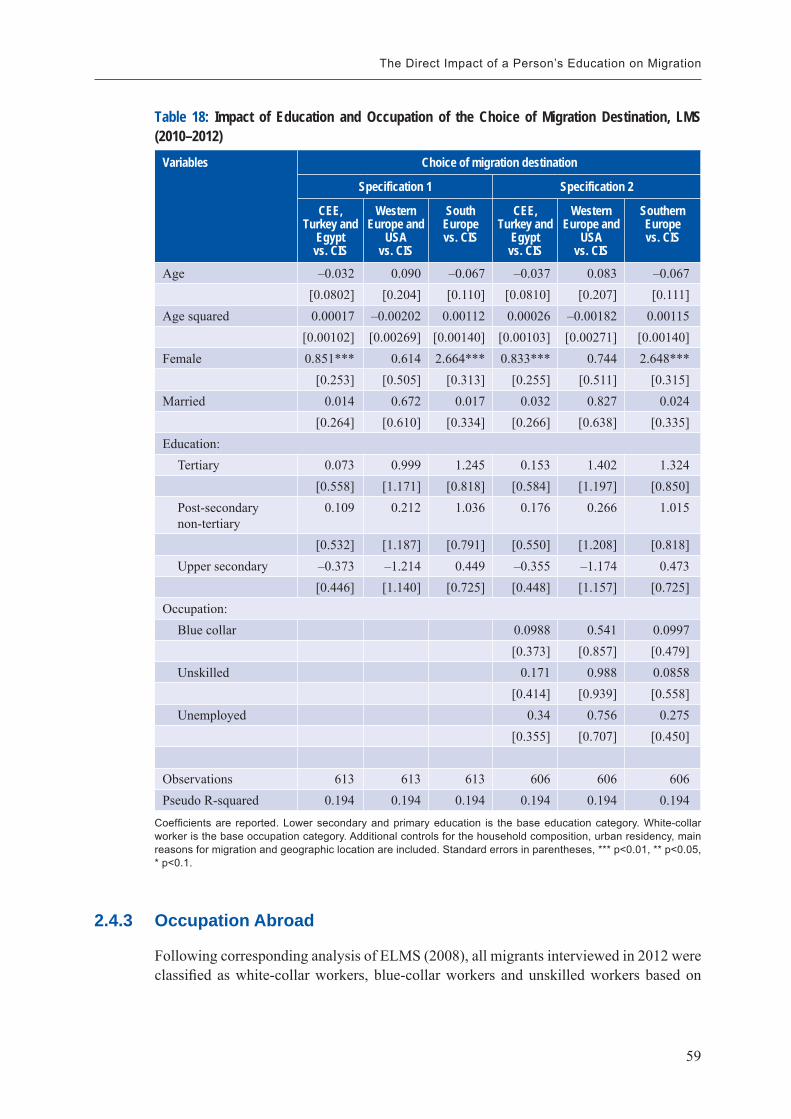
59
The Direct Impact of a Person’s Education on Migration
Table 18: Impact of Education and Occupation of the Choice of Migration Destination, LMS
(2010–2012)
Variables Choice of migration destination
Specification 1 Specification 2
CEE, Turkey and
Egypt vs. CIS
Western Europe and
USA vs. CIS
South Europevs. CIS
CEE, Turkey and
Egypt vs. CIS
Western Europe and
USA vs. CIS
Southern Europevs. CIS
Age –0.032 0.090 –0.067 –0.037 0.083 –0.067[0.0802] [0.204] [0.110] [0.0810] [0.207] [0.111]
Age squared 0.00017 –0.00202 0.00112 0.00026 –0.00182 0.00115[0.00102] [0.00269] [0.00140] [0.00103] [0.00271] [0.00140]
Female 0.851*** 0.614 2.664*** 0.833*** 0.744 2.648***[0.253] [0.505] [0.313] [0.255] [0.511] [0.315]
Married 0.014 0.672 0.017 0.032 0.827 0.024[0.264] [0.610] [0.334] [0.266] [0.638] [0.335]
Education:Tertiary 0.073 0.999 1.245 0.153 1.402 1.324
[0.558] [1.171] [0.818] [0.584] [1.197] [0.850]Post-secondary non-tertiary
0.109 0.212 1.036 0.176 0.266 1.015
[0.532] [1.187] [0.791] [0.550] [1.208] [0.818]Upper secondary –0.373 –1.214 0.449 –0.355 –1.174 0.473
[0.446] [1.140] [0.725] [0.448] [1.157] [0.725]Occupation:
Blue collar 0.0988 0.541 0.0997[0.373] [0.857] [0.479]
Unskilled 0.171 0.988 0.0858[0.414] [0.939] [0.558]
Unemployed 0.34 0.756 0.275[0.355] [0.707] [0.450]
Observations 613 613 613 606 606 606Pseudo R-squared 0.194 0.194 0.194 0.194 0.194 0.194
Coefficients are reported. Lower secondary and primary education is the base education category. White-collar worker is the base occupation category. Additional controls for the household composition, urban residency, main reasons for migration and geographic location are included. Standard errors in parentheses, *** p<0.01, ** p<0.05, * p<0.1.
2.4.3 Occupation Abroad
Following corresponding analysis of ELMS (2008), all migrants interviewed in 2012 were classified as white-collar workers, blue-collar workers and unskilled workers based on

The Relations between Education and Migration in Ukraine
60
the information on their occupations prior to leaving Ukraine and while working abroad. Eight migrants said that they could not find a job abroad.40
Table 19: Occupational composition of Ukrainian migrants during employment abroad by level
of education, 2010–2012
Level of education Occupational groups during employment abroad
White collar Blue collar Unskilled Total
Tertiary 28.68 43.72 27.6 100
Post-secondary 16.89 43.17 39.94 100
Upper secondary 5.26 53.06 41.68 100
Lower secondary and primary 1.09 45.43 53.48 100
Total 10.26 49.87 39.87
Source: LMS, 2012. Survey weights are applied.
Overall, in 2010–2012 the skill mismatch among migrants seemed to remain substantial. Still more than 70 per cent of well-educated migrants work aboard as blue-collar workers or unskilled employees. Nevertheless, similar to 2005–2008, during 2010–2012 those who found a white-collar occupation abroad are more likely to be better educated (see Table 19).
Several important differences between the two periods are worth mentioning. The proportion of migrants who got a white-collar job abroad almost doubled from 5.8 per cent in 2005–2008 to 10.3 per cent in 2010–2012 (see Table 11 for the first period and Table 19 for the second period). Such change is particularly striking given that the share of individuals employed at these occupations before migration has not changed much in 2010–2012 compared to the previous period (13.5 per cent – 2005–2008, Table 13, and 14.4 per cent – 2010–2012, Table 20). Furthermore, the proportion of migrants who found a blue-collar occupation abroad decreased at all educational levels (Table 19). However, this decline, at least partially, may be due to 10 percentage point reduction in the share of migrants with blue-collar occupations before migration. Similar to the previous period, during 2010–2012 40 per cent of migrants report no job at home before departure (Table 20). However, in contrast to 2005–2008, the share of individuals unemployed before migration does not vary much by education level.
40. As before, for empirical analysis they are classified as unskilled.

61
The Direct Impact of a Person’s Education on Migration
Table 20: Occupational composition of Ukrainian migrants before migration by the level of
education, 2010–2012
Level of education Occupational groups at home
White collar Blue collar Unskilled Unemployed Total
Tertiary 43.84 13.70 6.85 35.62 100Post-secondary 36.26 18.68 4.40 40.66 100Upper secondary 5.37 36.10 18.29 40.24 100Lower secondary and primary 0.00 34.38 18.75 46.88 100Total 14.36 30.69 14.85 40.10 100
Source: LMS, 2012. Survey weights are applied.
Table 21: Impact of education and previous occupation on the choice of occupation abroad,
2010–2012
Variables Choice of occupation abroad
Specification 1 Specification 2
White collar
vs. blue collar
Unskilled
vs. blue collar
White collar
vs. blue collar
Unskilled
vs. blue collar
Age –0.018 –0.0133 –0.0364* –0.0115[0.0171] [0.00982] [0.0201] [0.0104]
Female –0.351 1.049*** –0.566 1.111***[0.388] [0.201] [0.453] [0.208]
Married 0.371 0.0348 0.284 0.0205[0.371] [0.206] [0.409] [0.214]
EducationTertiary 2.273** –0.755 0.0882 –0.849
[1.095] [0.491] [1.172] [0.522]Post-secondary non-tertiary 1.483 –0.513 –0.427 –0.525
[1.108] [0.455] [1.194] [0.486]Upper secondary 0.600 –0.425 0.0605 –0.467
[1.059] [0.396] [1.088] [0.416]Occupation
Blue collar –4.669*** –0.506[0.823] [0.374]
Unskilled –2.347*** 1.231***[0.633] [0.418]
Unemployed –2.785*** 0.182[0.476] [0.354]
Observations 606 606 606 606Pseudo R-squared 0.0713 0.0713 0.169 0.169
Coefficients are reported. Lower secondary and primary education is the base education category. White-collar worker is the base occupation category. Additional controls for the household composition, urban residency, main reasons for migration and geographic location are included. Standard errors in parentheses, *** p<0.01, ** p<0.05, * p<0.1. a Statistically significant at one per cent under other optimization algorithm.

The Relations between Education and Migration in Ukraine
62
Regression analysis suggests that, similar to the previous period, an occupation prior to migration seems to be a better reflection of a migrant’s skills than education. However, impact of education becomes more pronounced in 2010–2012, at least for more educated individuals. As Table 21 shows, migrants with tertiary education are significantly more likely to get white-collar rather than blue-collar jobs abroad. In contrast to the previous results, no skills waste is observed anymore after controlling for the impact of other factors. Individuals reporting both white-collar and blue-collar occupations at home are significantly more likely to find a corresponding job abroad.
The distribution of migrants by mobility groups is shown at Figure 21. In 2010–2012 overall only mild changes were observed compared to the previous period. The share of migrants whose occupation abroad was the same as at home or within the same occupational level increased by six per cent. The proportion of individual who got jobs of a lower occupational level (say white-collar or blue-collar workers working as unskilled) went down by the same amount. The share of “upward” shifters did not change. This tendency is even stronger among male migrants (see Figure 22 and Figure 23). Unfortunately, regression analysis is not useful due to a small sample size.
Figure 21: Mobility of Ukrainian migrants between occupations before and during migration (both
genders), 2010–2012
Source: LMS, 2012. Survey weights are applied.
Figure 22: Mobility of Ukrainian migrants between occupations before and during migration
(females only), 2010–2012
Source: LMS, 2012. Survey weights are applied.
64.2%26.8%
8.9%
No mobility Horizontal switch Downward mobility
47.2%44.6%
8.2%
No mobility Horizontal switch Downward mobility

63
The Direct Impact of a Person’s Education on Migration
Figure 23: Mobility of Ukrainian migrants between occupations before and during migration
(males only), 2010–2012
Source: LMS, 2012. Survey weights are applied.
2.4.4 The Migrant’s Legal Status Abroad
In 2010–2012, the share of migrants without residency and work permits stays at the same level as in 2005–2008 – 25 per cent (see Figure 24). In contrast, the share of Ukrainian overseas workers with all the proper documents has grown from 32 per cent in the previous period to 51 per cent in 2010–2012. This tendency is somewhat stronger for female migrants (see Figure 25 and Figure 26).
Figure 24: Legal status of Ukrainian migrants in the host country in 2010–2012 (both genders)
Source: LMS, 2012. Survey weights are applied.
70.6%
20.2%9.2%
No mobility Horizontal switch Downward mobility
51%
25.2%
23.8%
Residency and work permit Only residence permit Unofficial

The Relations between Education and Migration in Ukraine
64
Figure 25: Legal status of Ukrainian migrants in the host country in 2010–2012 (females only)
Source: LMS, 2012. Survey weights are applied.
Figure 26: Legal status of Ukrainian migrants in the host country in 2010–2012 (males only)
Source: LMS, 2012. Survey weights are applied.
It is also observed that in 2010–2012 pre-departure strategy has changed (see Figure 27). Particularly, even more migrants organize their trip themselves (46 per cent in 2005–2008, 52 per cent in 2010–2012). The share of those who seek assistance from employment agencies almost doubled (19.5 per cent), while employers as well as relatives and friends are twice as less likely to organize trips in 2010–2012. The differences with the previous period are particularly evident for male migrants (see Figure 28 and Figure 29).
Empirical analysis reveals that in contrast to the previous period, in 2010–2012, neither education nor occupation at home affects the legal status of a migrant in the destination country. However, the trip organizer still plays an important role. Moreover, the effect of employment agencies became stronger. Not only does it increase the probability of being fully legally settled in the destination country, it also decreases the likelihood of being fully illegal. A similar effect in 2010–2012 is observed for relatives and friends, while in the previous period the network rather negatively affected the migrant’s status abroad. The negative effect of travel agencies present in 2005–2008 vanished in 2010–2012.
54.2%
20.2%25.8%
19.9%
Residency and work permit Only residence permit Unofficial
49.5%
20.2%24.9%
25.6%
Residency and work permit Only residence permit Unofficial

65
The Direct Impact of a Person’s Education on Migration
Figure 27: Who organized the last trip abroad in 2010–2012 (both genders)
Source: LMS, 2012. Survey weights are applied.
Figure 28: Who organized the last trip abroad in 2010–2012 (females only)
Source: LMS, 2012. Survey weights are applied.
Figure 29: Who organized the last trip abroad in 2010–2012 (males only)
Source: LMS, 2012. Survey weights are applied.
58%3.2%
19.5%
3.4%Migrant
Employment agency
Travel agency
Employer
Relatives/friends
Other
8.1%7.9%
65.2%9.6%
8.4%
4.1%Migrant
Employment agency
Travel agency
Employer
Relatives/friends
Other
2.1%10.6%
59.6%1.3%
16.7%
1.7%Migrant
Employment agency
Travel agency
Employer
Relatives/friends
Other
11.7%9.0%

The Relations between Education and Migration in Ukraine
66
Table 22: Impact of education and previous occupation on legal status of Ukrainian migrants in
the host country, both periods
Variables Migrant’s legal status in the host
country, 2005–2008
Migrant’s legal status in the host
country, 2010–2012
Residence and
work permit
vs. residence
permit only
Unofficial
stay vs.
residence permit
only
Residence and
work permit
vs. residence
permit only
Unofficial
stay vs.
residence permit
only
Education
Tertiary –0.0261 –0.0188 –0.257 –0.674
[0.314] [0.325] [0.635] [0.795]
Post-secondary non-tertiary 0.0307 0.319 –0.157 0.203
[0.294] [0.290] [0.627] [0.746]
Upper secondary 0.510** 0.343 –1.007* –0.298
[0.221] [0.225] [0.539] [0.651]
Occupation
Blue collar –0.537** –0.0662 –0.0233 0.66
[0.257] [0.288] [0.376] [0.505]
nskilled –0.421 –0.311 0.211 0.705
[0.310] [0.348] [0.428] [0.564]
Unemployed –0.557** 0.124 0.229 0.745
[0.260] [0.287] [0.361] [0.491]
Trip organizer
Employment agency 0.692*** –0.145 0.825*** –1.094***
[0.234] [0.279] [0.291] [0.408]
Travel agency 0.194 0.954*** –0.578 –0.373
[0.325] [0.289] [0.595] [0.633]
Employer –0.0424 –1.168*** 0.331 –2.313***
[0.192] [0.263] [0.360] [0.777]
Relatives/friends 0.193 0.453** 0.645* –1.155**
[0.200] [0.192] [0.383] [0.568]
Other 0.566 1.683*** 14.42 15.4
[0.488] [0.406] [571.8] [571.8]
Observations 1,273 1,273 606 606
Pseudo R-squared 0.0729 0.0729 0.126 0.126
Coefficients are reported. Lower secondary and primary education is the base education category. White-collar worker is the base occupation category. Migrant is a base category for the trip organizer. Additional controls for the age, gender, marital status, household composition, urban residency and geographic location are included. Standard errors in parentheses, *** p<0.01, ** p<0.05, * p<0.1.

67
The Direct Impact of a Person’s Education on Migration
2.5 ConclusionsThe empirical analysis indicates that education does not have a clear and persistent effect on most of the migration decisions of Ukrainians. Moreover, its impact on various aspects of migration decisions differs in the studied periods.
In 2005–2008, in particular, education did not affect the probability to migrate. However, more educated individuals were more likely to migrate to wealthier countries even though they tended to work at lower-level jobs there. In 2010–20012, semi-skilled individuals are relatively more likely to migrate, but neither education nor occupation prior to migration is related to the choice of the destination.
It has been observed that education is positively related to the probability of finding high-profile positions, such as professionals, technicians or clerks. This effect became more pronounced in 2010–2012. However, very few migrants manage to obtain such positions.
The analysis of 2005–2008 data tends to support the “brain-waste”, or better say, “skill-waste” hypothesis for white-collar Ukrainian migrants but not for blue-collar workers. In 2010–2012, after controlling for other factors, no skill waste is observed, neither for white-collar nor for blue-collar labourers.


69
CHAPTER 3
Willingness and Scope of Remittances Use on Education by Recipient Families and Their Impact on the Demand for Education
This chapter considers the opposite side of the migration-education relationship. It analyses the impact of remittances sent home by migrants on the local demand for education. First, theoretical and empirical literature on this issue is discussed. Then new empirical evidence for Ukraine is presented using ULMS 2007. The chapter will help to understand whether the growing inflow of remittances may boost the demand for education in Ukraine.
3.1 Remittances and Demand for Education – a Review of the Literature on Ukraine and InternationallyTheoretical models usually show that the impact of remittances on household spending on education is positive since remittances relax the household budget constraint (Bertoli, 2006, Marchiori et al., 2010) and thus increase funds available for investment into education.
Several empirical studies have confirmed this theoretical prediction. Dustman and Speciale (2006) find that an increase in remittances increases demand for education services in developing countries. Similar findings are reported by Adams (2007). From a sample of 115 developing countries he shows that countries that receive more remittances have lower poverty levels, and by reviewing household-level studies he concludes that remittance-receiving households on a margin spend less on consumption and more on investment goods such as education, health, housing or own business. This happens because migrants often view their earnings abroad not as a salary (which can be spent on everyday consumption) but as proceeds from a limited-time project, i.e. many of them believe their stay abroad is temporary, until they earn money for housing or education of their children. Hence, remittances are spent on this predefined purpose.
One thing the theoretical models typically do not take into account, however, is that receiving remittances usually implies the absence of a household member (a mother, a father or both), which can negatively affect a child’s education for several reasons:

The Relations between Education and Migration in Ukraine
70
1. a child is left behind without proper supervision so that (s)he pays less attention to studies, although formally attending school;
2. a greater amount of housework (cooking, cleaning, taking care of younger children, working on land plots in rural areas and so on) is levied on the remaining household members, including children, thus reducing their time available for studies (this is especially true when a mother is a migrant);
3. a child’s subjective value of education and her incentives to study are reduced: while watching her relative migrate and earn decent money from an unqualified job (sometimes more than qualified people get at home), a child may also convene to migrate and take an unqualified position (demotivation effect).41
Some empirical studies on the effect of remittances on education suggest that this demotivation effect may be important.42 Amuedo-Dorantes et al. (2008) for Haiti and Amuedo-Dorantes and Pozo (2010) for Dominican Republic find a positive effect of remittances on school attendance only in households with no migrant members (i.e. receiving remittances from friends or distant relatives).43 Studies on Mexico suggest that receiving remittances generally lowers the educational aspirations of children (they tend to complete less years of school and have a lower intention to enrol in higher education). Instead, their intention to migrate increases (e.g. Kandel and Kao, 200144 or McKenzie and Rapoport, 2006). Other Mexican studies do not find a significant effect of remittances on either educational attainment or spending (Orrenius et al., 2010, Borraz, 2005). However, these results may not apply to Ukraine or other European countries due to a specific pattern of migration.
Of course, the amount of remittances is not the only variable affecting education. Other factors, such as family and regional background, also play an important role. For example, Sawyer (2010)45 showed that educational aspirations (desired years of schooling) of children were the same in remittance-receiving and non-receiving households. It turned out, however, that mothers’ education significantly influences the educational aspirations of children (children with higher-than-average educated mothers wish to complete more years of schooling) but only in households that do not receive remittances. For remittance-receiving households mothers’ education plays no role in educational aspirations of children.
41. A detailed description of the negative impact of a household member on children can be found, for example, in the Caritas Ukraine report based on a survey of schoolchildren in Western oblasts of Ukraine: http://www.caritas-ua.org/index.php?option=com_content&view=article&id=220%3Am&catid=16%3Asi-&Itemid=1&lang=uk.42. Antman (2012) reviews studies of the impact of migration on family (children’s education, divorce rate etc) and specifically finds that elderly parents of a migrant child receive less support from all of their children (non-migrant as well) thus illustrating another aspect of an adverse impact of migration on a family – weakening of family ties.43. On the contrary, Bredl (2009) for Haiti shows that income (including remittances) has a positive effect on education spending, and absence of a household member makes no difference. A different choice of dependent variable may explain these opposite findings as discussed below.44. https://docs.google.com/a/kse.org.ua/viewer?a=v&pid=explorer&chrome=true&srcid=0B-9pz4JCfpJbZjkwM2VmZjYtYTJjMC00Mzg2LWEzNzctMTY2YmZkYmFlNGM1 45. http://www.migrationinformation.org/Feature/display.cfm?ID=775

71
Willingness and Scope of Remittances Use on Education by the Recipient Families
When it comes to actual years of schooling, the percentage of children who completed high school in non-remittance-receiving households is higher than that of remittance-receiving ones. Again, maternal education turned out to be the most significant factor for high-school completion: 50 per cent of children of higher-than-average educated mothers completed high school while only 18 per cent of lower-than-average educated mothers did so. Receipt of remittances only widened this gap: in remittance-receiving households the respective shares were 54 per cent and 16 per cent. This study once again stressed the importance of family background (such as the ability of parents to help with the homework and to be the role model for children) for educational attainment of a child. Remittances enhance the family background effect, raising the education of children in better-educated families and lowering it in the poorly educated ones.
Country- or region-specific variables also play an important role in determining children’s education. Thus, Acosta, Fajnzylber and López (2008), estimating the impact of remittances on the share of education in total household expenditures and the number of grades completed by a child, found that remittances positively impact education expenditures in El Salvador, Guatemala, Peru and Dominican Republic. At the same time their effect is negative in Jamaica and insignificant in Mexico and Nicaragua. Moreover, in all countries except for Mexico, the impact of remittances on education spending was higher for higher-income households, reflecting the effect of family background (higher-income households are likely to be more educated as well). The impact of remittances on educational attainment is not so clear-cut. Higher remittances are found to be positively and significantly associated with higher educational attainment of pupils in just six of 11 studied countries.
Benedictis et al. (2010) stress that a better supply of educational infrastructure (schools, classes) is crucial for the positive effect of remittances on child education.46 Kroeger and Andersen (2011), based on Kyrgyzstan data, arrive at a similar conclusion. They show that in a richer and more developed region of the country (north) international remittances increase education expenditures and enrolment of boys and decrease enrolment of girls into schools: since this region is more industrialized, education payoff is higher, and parents invest more in sons, expecting them to take care of parents in the future. In poorer and mostly agrarian mountain and southern regions a slight decrease in education spending and enrolment for both genders is observed in remittance-receiving households. Probably the demotivating effect of remittances is stronger than income effect here. This study also shows that a family is negatively affected by the absence of a family member (usually a father).
The effect of remittances on education is typically measured with two variables, school enrolment and education expenditures. School enrolment is more often used for poorer countries where child labour is common (e.g. Calero and Sparrow (2008) for Ecuador or Acosta (2006) for El Salvador). For more advanced countries, where secondary education is compulsory, this measure is not very informative. While some studies consider
46. Naturally, even being able to afford the tuition fee, parents would be reluctant to send their children to school which is very far from home.

The Relations between Education and Migration in Ukraine
72
university enrolment (Kandel and Kao, 2001, Gorlich et al., 2007), most others compare educational expenditures (their share in total household spending) since this variable is readily available from household surveys. Usage of different dependent variables may change the results. For example, Medina and Cardona (2010) state that remittances do not affect school enrolment rates in Colombia but affect education spending since children in remittance-receiving households are more likely to go to private rather than public schools. A similar result is reported by Cardenas et al. (2010) while Calero and Sparrow (2008) find a positive impact of remittances on both enrolment and education spending (and hence, a negative effect on child labour) in Equador. Based on in El Salvador data, Acosta (2006) also finds a positive effect of remittances on school enrolment rates, while Edwards and Ureta (2003) report that remittances negatively impact the hazard of dropping out of school.
Studies of the impact of remittances on education spending usually find increased spending in remittance-receiving households (e.g. Kifle (2007) for Eritrea, Tullao and Rivera (2008) for Philippines) or an increased share of educational expenditures in the total household spending (Hristev et al. (2010) for Moldova, Tabuga (2007) for Philippines, Adams (2005) for Guatemala). Several other studies report no significant impact (Parinduri and Thangavelu (2008) for Indonesia, Raihan et al. (2009) for Bangladesh).
Note that since the inflow of remittances increases private education expenses, it may reduce country-level public education spending (crowding out effect). For example, Ziesemer (2008) shows that remittances increase public education spending in relatively ‘poorer’ developing countries (in response to increased demand for education the government builds schools and hires new teachers) and reduce it in relatively ‘richer’ ones (since more people can afford private education, the government reduces the number of public schools or their size). In line with this study, Dustman and Speciale (2006) find an inverted-U relationship between remittances and public education spending, i.e. for small (large) amounts of remittances, an increase in remittances raises (lowers) public spending on education.
Table 23: Remittances in Ukraine 2008–2011 (in USD millions)
2008 2009 2010 2011
Total remittances 6,177 5,370 5,862 7,019
Remittances in per cent of GDP 3.4 4.6 4.3 4.2
Source: National Bank of Ukraine.
The above data include money transfers to citizens or residents of Ukraine made from abroad. Other sources, such as the World Bank, have lower figures but they do not account for informal transfers, such as bringing cash, whereas the NBU estimates these figures.
The majority of remittances are coming from migrants to the Russian Federation: in 2011 their remittances amounted to 1,987.6 USD millions equivalent to 32.8 per cent of the total remittances of the year. They are followed by United States (10.1 per cent), Germany (7.0 per cent), Cyprus (5.5 per cent) and Italy (5.4 per cent).

73
Willingness and Scope of Remittances Use on Education by the Recipient Families
These data on remittance inflows should be handled very carefully: for example, Hungary or Czech Republic, which are among the favourite destinations for labour migration from Ukraine, are not mentioned among major contributing countries in the above remittance statistics from the National Bank of Ukraine. This could be because transfers are not made through formal channels and, especially for Ukrainians working abroad but relatively near their homes, it is likely that they bring their earnings home personally.
Remittances to Ukraine, although lower than in other CIS states, such as Moldova, are nevertheless substantial. And their role is even more significant at the household level. According to ELMS survey, over 40 per cent of remittance-receiving households derived more than half of their income from remittances, and 23 per cent of households receive over 75 per cent of their income from abroad. It is evident that there is a positive correlation between benefiting from remittances and increasing the quality of life, by meeting basic needs, making saving, investing and so on. Remittances reduce poverty-related risk.
The impact of remittances on the household budget cannot be measured directly due to the lack of specific research. Therefore, in order to have some indications, two kinds of data have been considered. Specifically, Table 24 presents the structure of household total expenditure assessed by the State Statistical Service. Table 25 summarizes the use of remittances and savings brought back by returning migrants using ELMS (2008) and the ETF (2008) surveys.
The data from Table 24 show that education gets only 1.3 per cent of the households’ budget. But, according to the intensions expressed by migrants in the use of remittances and savings, it appears that education represents a priority and children’s education ranks in the top saving objectives, being in fourth place after basic needs, procurement of durable goods and purchase of real estate. This is confirmed by data from ELMS: over 70 per cent of remittance-receiving families report using this money to pay for living expenses, about 40 per cent – for buying durables. Spending on education is substantially lower.
Unfortunately, there is no necessary household-level data to test how an investment in education is higher in households receiving remittances compared with those without private transfers from abroad. It is also difficult to assess if remittances increase reservation wages and if they encourage new migration. In fact, remittances may influence the behaviour of some households that would prefer to send their members abroad rather than to find a job in the domestic labour market and therefore invest more in financing emigration rather than on education and training.

The Relations between Education and Migration in Ukraine
74
Table 24: Structure of Ukrainian household total expenditure, 2002–2011 (per cent)
2002 2003 2004 2005 2006 2007 2008 2009 2010 2011
Total consumption expenditure 92.8 93.3 92.6 91.1 90.5 90.0 86.2 87.8 90.0 90.2
food and non-alcoholic beverages 59.1 58.6 57.5 56.6 53.2 51.4 48.9 50.0 51.6 51.3
alcoholic beverages and tobacco 2.6 2.8 2.8 2.9 2.6 2.6 2.2 3.2 3.3 3.4
manufactured goods and services 31.1 31.9 32.3 31.6 34.7 36.0 35.1 34.6 35.1 35.5
including
clothing and footwear 5.4 5.3 5.7 5.7 5.8 5.9 5.9 5.6 6.1 5.8
housing, water, electricity, gas and other fuels
10.5 10.4 9.7 8.5 9.6 10.9 9.1 9.4 9.3 9.6
furnishing, household equipment and routine house maintenance
1.7 2.0 2.3 2.6 2.8 2.9 2.8 2.3 2.4 2.2
health 3.0 2.8 2.8 2.5 2.5 2.5 2.7 3.1 3.1 3.1
transport 3.0 3.3 3.0 3.0 3.7 3.4 4.0 3.8 3.7 4.0
communication 1.3 1.5 1.8 2.1 2.6 2.6 2.3 2.5 2.7 2.6
recreation and culture 1.9 2.3 2.4 2.6 2.4 2.4 2.5 1.8 1.8 2.0
education 1.2 1.1 1.3 1.1 1.4 1.3 1.3 1.3 1.3 1.3
restaurants and hotels 1.1 1.4 1.6 1.7 2.2 2.3 2.4 2.5 2.4 2.5
miscellaneous goods and services 2.0 1.8 1.7 1.8 1.7 1.8 2.1 2.3 2.3 2.4
Non-consumption total expenditure 7.2 6.7 7.4 8.9 9.5 10.0 13.8 12.2 10.0 9.8
Source: State Statistics Service.
There is anecdotal evidence47 that less educated labour migrants want their children to have a higher education to get a better job in Ukraine rather than repeat their fate. Hence, it may be inferred that there is some inclination to invest remittances into education. ELMS shows that 12.4 per cent of migrants’ families claim to invest remittances into education of household member(s). Another survey performed by the Center of Peace, Conversion and External Policy of Ukraine48 (hereafter CPCEU) showed that the purpose of migration of 22.3 per cent of migrants was earning money for education – their own or their children.
47. http://www.demoscope.ru/weekly/2006/0239/gazeta016.php48. “New Ukrainian labour migration as evaluated by return migrants” (“Hовітня українська трудова міграція в оцінках українських заробітчан”), 2004. 300 people surveyed in eight oblasts of Western Ukraine in autumn 2004. Available at: http://old.pauci.org/file/KJoC3YBaYoA_.doc

75
Willingness and Scope of Remittances Use on Education by the Recipient Families
In contrast, the ETF survey shows that earning money for education was not a primary reason for leaving Ukraine, only 1.3 per cent of potential migrants having named it as a purpose for migration.
Table 25: Use of remittances and savings (per cent)
Remittances,
ELMS survey
Remittances,
ETF survey
Migrants’ savings,
ETF survey
Essential consumption needs 72.0 73.4 58.3
Purchase of durable goods 39.3 25.8 39.5
Purchase of real estate 29.1* 11.9 22.8
Education 12.4 16.6 14.5
Repayment of debts 10.4 1 0.8
Savings 9.7 26.6 24.0
Medical treatment 6,5 – –
Business activity 1.0** 3.3 8.7
Other 0.5 4.5 4.1
Rent – 2.5 1.9
Housing repair n.a. 1.2 2.9
No answer – 2.2 3.9
Sources: ELMS Survey (2008), ETF Survey (2008).
So far, no studies estimated the impact of remittances on education using Ukrainian data. However, several papers (Tolstokorova, 2008, 2009, Caritas Ukraine,49 2009, UNICEF 2009) tried to investigate the effect of the absence of a family member on children and family as a whole. They found the following effects:
1. weakening family ties between spouses and between parents and children;
2. absence of a proper role model for children, child neglect. Although children of migrants are better dressed and have more pocket money than their peers, they often miss school, spend money on alcohol or drugs or show other types of deviant behaviour in the absence of everyday parental supervision50. They are reluctant in looking for a job relying on remittances or hoping to join their parent(s) abroad;
3. relaxing of household budget constraints with remittances increases the demand for higher education in migration-intensive regions.51 This extra investment into education in these regions does not necessarily translate into better job opportunities due to a lack of decent jobs, mismatches in the labour market and poor quality of education;
49. http://www.caritas-ua.org/index.php?option=com_content&view=article&id=220%3Am&catid=16%3Asi-&Itemid=1&lang=uk.50. http://www.demoscope.ru/weekly/2006/0239/gazeta016.php. 51. Of eight Ukrainian regions with the higher than average growth of the number of students per 1,000 population in 2000–2009, five are migration-intensive regions defined as such according to the ELMS 2008 survey.

The Relations between Education and Migration in Ukraine
76
4. when a mother is a migrant and a breadwinner while а father substitutes her at home ‘in the kitchen’ the traditional father role and his authority are undermined due to gender stereotypes;
5. when a migrant returns, (s)he experiences a cultural shock and loss of social relations (with friends, neighbours) and hence, difficulties in re-integrating into society. This is particularly acute for migrants that have been abroad for a long time. Informal arrangements, ties and tacit knowledge play a very large role in Ukraine.52 Hence, a migrant who had fallen out of this social context is pushed to migrate again;
6. in addition, reasons for re-emigration can be multiple. Shorter-term migrants may decide to leave again (circular migration) because their savings are over and they did not find a decent job at home.
3.2 Remittances and Education Expenditures – Evidence from the 2007 Wave of the ULMS
For the empirical analysis in this chapter the 2007 wave of the Ukrainian Longitudinal Monitoring Survey (ULMS) is used.53 The impact of remittances on education is measured by looking at education expenditures. School attendance is unlikely to be a good indicator since secondary education is compulsory in Ukraine. While occasionally neglected children may drop out of school, social services try to return them to educational institutions. Similarly, there are not enough households whose children attend private rather than public schools or kindergartens to employ such a measure.
The empirical estimation of the household demand of education reveals a significant influence of remittances on the education spending patterns. This effect, however, is dual. Indeed, after controlling for other factors migrant families spend more on average but not at the margin (see Table 26). Marginal propensity to invest in education (estimated as the mean of marginal effects) is 1.6 per cent for remittance receivers and 2.2 per cent for non-receivers.
Additionally, neither education of the household head nor education of other family members significantly affect household education expenditures. In contrast, in some cases a larger demand on education is observed in the entire migration region, both among receiver and non-receivers. This effect is only marginally significant.
Table 26: Impact of remittances on the demand for education based on ULMS
Variables (1) (2) (3) (4) (5)
Expenditures (in log) 0.0102*** 0.0102*** 0.0103*** 0.00981*** 0.00979***[0.00108] [0.00108] [0.00123] [0.00134] [0.00134]
Remittances (dummy) 0.0156*** 0.0154*** 0.0157*** 0.0179*** 0.0187***
[0.00542] [0.00560] [0.00572] [0.00636] [0.00659]
52. For example, when looking for a job, 48 per cent of Ukrainians get a position through relatives and friends (ULMS, 2007).53. See chapter 1 for the description of the data.

77
Willingness and Scope of Remittances Use on Education by the Recipient Families
Variables (1) (2) (3) (4) (5)
Expenditure * Remittances –0.00245*** –0.00248*** –0.00263*** –0.00288*** –0.00297***[0.000557] [0.000585] [0.000742] [0.000822] [0.000843]
Household head characteristicsAge –0.000113* –0.000144** –0.000140**
[6.36e–05] [6.95e–05] [6.97e–05]Female 0.000450 0.000529 0.000624
[0.00188] [0.00188] [0.00189]Employed –0.00132 –0.00119 –0.00152
[0.00176] [0.00221] [0.00252]Education (highest degree)
Academic 0.00156 0.00224 0.00274[0.00330] [0.00336] [0.00364]
Professional 0.00242 0.00240 0.00454[0.00323] [0.00324] [0.00387]
Vocational 0.00153 0.00186 0.00163[0.00304] [0.00305] [0.00350]
Secondary 0.00183 0.00191 0.00203[0.00281] [0.00282] [0.00331]
Household characteristicsSize 0.00176** 0.00188*
[0.000847] [0.000989]Number of young children –0.00666*** –0.00665***
[0.00212] [0.00221]Number of working household members –0.000154 0.000274
[0.00133] [0.00170]Village 0.00291 0.00280
[0.00207] [0.00206]Education of household members (number of people)
Academic –0.00117[0.00195]
Professional –0.00196[0.00229]
Vocational 0.000329[0.00245]
Secondary 0.000538[0.00199]
Migration region (dummy) 0.00382* 0.00407* 0.00343 0.00345*[0.00198] [0.00215] [0.00208] [0.00206]
Constant –0.0635*** –0.0647*** –0.0601*** –0.0600*** –0.0605***[0.00721] [0.00738] [0.0104] [0.0108] [0.0109]
Observations 3,100 3,100 2,863 2,862 2,862R-squared 0.045 0.046 0.050 0.054 0.055
Dependent variable is the share of education expenditures in the budget. Robust standard errors in parentheses, *** p<0.01, ** p<0.05, * p<0.1.

The Relations between Education and Migration in Ukraine
78
3.3 ConclusionsTheoretical models suggest that remittances may stimulate local demand on education. Indeed, such an effect has been observed in many developing countries. Empirical studies also point toward important negative consequences of migration on the local demand for education. Such consequences for children include demotivation as well as the lack of proper parental support and supervision. Finally, a proper supply and quality of educational infrastructure is crucial for the positive effect of remittances on education. Thus, the final outcome is a matter of the country- or region-specific factors that play an important role in determining children’s education.
The inflow of remittances to Ukraine is substantial, but most of this money is consumed. Empirical estimation of the demand for education reveals that after controlling for other factors average expenditures on education among remittance-receiving families are larger. However, it happens mostly because their income is larger. Once the impact of remittance is allowed to vary with income, marginal expenditures on education turn out to be larger among non-receivers. It implies that currently non-remittances are trying to catch up with remittance receivers by investing more on a margin into education. At the same time, remittance receivers tend to spend less on education from each additional unit of income. Thus, an increase in remittances is unlikely to substantially contribute to the demand for education in Ukraine.
This result, however, should be treated with a great caution. Given a quite low share of remittance receivers in the population, a larger sample is needed to make any conclusion with a high degree of confidence. Second, given that the expenditure category is defined quite narrowly, the dependent variable includes a large number of zeroes (not that many households spend on education). This issue requires more sophisticated estimation techniques that are beyond the possibilities of this study.

79
CHAPTER 4
The Links Between Policy and Legislation Framework in the Area of Migration and Education
This chapter discusses the existing government policies in the area of migration and education in Ukraine. First, it briefly outlines the existing legislation and official programs in the area of emigration. Then it discusses migration related issues in the area of education, affecting both children and adults. Finally, it critically assesses the situation with the social protection of Ukrainian migrants.
While Ukraine has several laws concerning immigrants,54 legislation dealing with emigrants appears to be scarce and fragmented. A law “On the procedure of leaving and entering Ukraine by citizens of Ukraine” in 1994 granted free external mobility to all citizens of Ukraine unless they are subject to legal charges. Ukraine signed 13 bilateral labour agreements with its major migration partners, including Poland (1994), Armenia (1996), Belarus (1996), Moldova (1996), Czech Republic (1996), Slovak Republic (1998), Russia (1998), Vietnam (1998), Latvia (1999), Lithuania (2002), Portugal (2003), Libya (2004) and Azerbaijan (2006). These agreements guarantee the right for paid leave and decent working conditions of Ukrainian citizens working legally in the respective countries. Negotiations on similar agreements with Spain, Italy and Estonia are still under way.55 Unfortunately, these agreements mostly stay on paper and do not reflect the actual situation.
According to the ELMS survey (2008), a quarter of Ukrainian migrants had an undocumented migration status in destination countries. At least to some extent this outcome should be attributed to the lack of government and non-government programs designed to assist individuals in getting jobs abroad. Sociological surveys suggest that awareness among potential, actual and return migrants about such services is very low. Particularly, according to the ETF (2008) report, only 19 per cent of potential migrants
54. For the list of legislative acts see Ukraine Extended Migration Profile 2011 prepared by State Migration Service together with international donors, pp. 68–70. Available at: http://www.dmsu.gov.ua/images/stories/files/Ukraine_Migration_Profile_EN_Final%202011.pdf.55. These labour agreements have to be differentiated from social security agreements (see below).

The Relations between Education and Migration in Ukraine
80
know about some state programs or private recruiting companies assisting in finding employment overseas. Among those respondents who are aware of migration assistance services, about 54 per cent plan to use them. These numbers suggest that such service is viewed as valuable by people but as the very least needs to be better promoted. As for programs helping return migrants, only 11 per cent made use of them while the vast majority of return migrants (80 per cent) had never heard about such programs.
A framework document on Ukrainian migration policy has been adopted only recently: the Concept of the State Migration Policy has been adopted by a presidential decree in May 2011.56 The Concept describes general directions of the migration policy of Ukraine, including the ‘promotion of home employment in order to prevent emigration’. It also foresees the development of the appropriate legal base for immigrants, emigrants and returning migrants. However, it does not have any implementation schedule.
A government program on reintegration of migrants for 2011–2015 was adopted in July 2011.57 For returning Ukrainian migrants it offers the assistance of the State Employment Service58 regarding information on vacancies and procedures for beginning entrepreneurial activity and psychological assistance.
The state has started paying attention to children of migrants after the Parliamentary Hearings devoted to labour migrants on 17 October 2004, where the Ukrainian Ombudswoman attracted the attention of the deputies to this problem. After that, the Ministry of Education, together with the Ministry of Family, Youth and Sports,59 issued several documents stating that school psychologists and social workers should pay special attention to the children of labour migrants. In 2007, the International Ukrainian School was created for children of Ukrainian labour migrants living abroad together with their parents. The school practices distant learning and allows children to obtain a state secondary education certificate (and hence, enter a higher educational institution in Ukraine). It cooperates with 27 Ukrainian schools in nine different countries (Malynovska, 2011).
About 12 per cent of returned migrants received some education or training in the destination country (ETF, 2008). A substantial number of Ukrainians that have studied abroad are no longer eager to return to Ukraine since they can find a better-paid job in their country of studies. Besides, to validate a foreign diploma in Ukraine, one has to pass the ‘nostrification’60 procedure which takes up to four months and can cost up to USD 400.61
56. http://www.dmsu.gov.ua/uk/pro-gmsu/pravova-informaciya/zagalni-polozhenna/ukaz-prezidenta-ukrani-pro-koncepciju-derzhavnoji-migracijnoji-politiki-.html57. http://zakon1.rada.gov.ua/cgi-bin/laws/main.cgi?nreg=653-2011-%F058. For example, in 2010 203.3 thousand people attended professional education courses at the State Employment Service (http://www.dcz.gov.ua/statdatacatalog/document?id=214180). Unfortunately, there is no information specifically on migrants.59. Since 2010 it is one ministry.60. Recognition/approval of the foreign degree.61. http://nostrification.in.ua/?mod=price

81
The Links Between Policy and Legislation Framework in the Area of Migration and Education
It is recognized at the state level62 and shown by the above mentioned surveys that emigration occurs mainly due to low salaries63 and inability to find a job64 in Ukraine. Hence, emigration is likely to reduce if a more business-friendly environment is established.65 In particular, poor opportunities for self-employment currently fuel emigration from Ukraine.
Note further that while the majority of migrants perform ‘blue-collar’ jobs at their destination countries, Ukraine experiences a deficit of qualified workers,66 and the system of professional education in Ukraine cannot satisfy the demand for them. The number of students in vocational schools is 10 per cent less than in 1995, and their quality and fields of education are far from those desired by employers due to the lack of cooperation between enterprises and vocational schools. Moreover, there are no systematic skill forecasts in Ukraine. The education plans follow economic development plans but they are not confronted with reality. For example, employers are looking for plant workers such as turners and millers, whereas vocational schools produce mostly service-sector workers; and while metalwork plants need workers from the fifth and sixth qualification categories, vocational school graduates have only qualification category three.67 In addition to the overall inefficiency of educational expenditures at the state level, professional education is underfinanced; therefore, textbooks and learning equipment are scarce and obsolete. Vocational schools have only 76 per cent of needed textbooks and one computer per 15 students.68
Enterprises have little interest in financing professional education since:
1. they cannot influence the curricula because professional education (as well as all other levels of education) is highly centralized and formalized;
2. there is no guarantee that an enterprise retains the workers whose education they have sponsored: formally, students could sign a contract with an enterprise promising to work there after graduation but enforcement of a such contract in Ukraine (through courts) is rather costly.
It is important to notice that Kupets (2010) provides evidence that returning migrants occupy lower-skilled positions in Ukraine than people who never worked abroad. This could happen for two reasons. One possible explanation relates to self-selection of migrants. At least two kind of selection scenarios may take place. It is possible that less skilled and less educated persons are more likely to go abroad – which this study does not confirm. Another self-selection scenario suggests that less skilled and less educated
62. http://www.niss.gov.ua/content/articles/files/Science_educational-e2f67.pdf63. 60 per cent of ELMS sample and 67 per cent of ETF sample indicated low salary as a reason to migrate.64. 39 per cent of ELMS sample and 46 per cent of ETF sample indicated unemployment as a reason to migrate.65. For example, it takes 24 days to register an enterprise in Ukraine as compared to 13 in OECD countries; there are 135 taxes (13 in OECD), and an average entrepreneur spends 657 hours a year filing tax forms (186 hours in OECD). http://www.doingbusiness.org/data/exploreeconomies/ukraine#paying-taxes. 66. According to State Statistical Service data, in 2010 46.4 per cent of vacancies were for blue-collar workers, while 38.1 per cent for office employees and 15.5 per cent for unqualified jobs. See also http://www.day.kiev.ua/14590367. Interview with the Head of Parliamentary Committee on Education and Science. http://www.kpu.ua/profesijno-tehnichna-osvita-ukra%D1%97ni-vikliki-sogodennja/68. http://www.niss.gov.ua/content/articles/files/Science_educational-e2f67.pdf

The Relations between Education and Migration in Ukraine
82
of migrants are more likely to return – which is not supported either (Kupets, 2010). The second explanation refers to ‘brain waste’ – since Ukrainian migrants are mostly employed in lower-skilled jobs abroad, their human capital deteriorates below the level of non-migrants. Ultimately, it is possible that return migrants simply cannot re-integrate into society when coming back home.
In 2008–2010 IOM implemented the pilot project ‘Temporary and Circular Labour Migration between Portugal and Ukraine’. The project was co-funded by the European Commission, the Portuguese government, IOM and the World Bank. It aimed at developing a more efficient circular migration mechanism, which would maximize the benefit of the migration experience for the country of origin, the country of destination and the individual migrants. Ukrainians have come to Portugal to work for a period of time and then returned to Ukraine, while being supported throughout the process including pre-departure orientation and post-return vocational training and instructions on small business start-ups. Such support presumes to facilitate the migrants’ integration while in Portugal. On the other hand, it stimulates skills gain and generates the opportunity for investing the money migrants saved while abroad, providing for a sustainable household income. Within the project’s framework, 35 unemployed Ukrainians were recruited by two Portuguese agricultural firms. Migrants received pre-migration orientations, language training and post-return vocational training.69 A recently performed evaluation of the project, however, is not very optimistic due to the economic crisis of 2009 in Portugal, management weaknesses and lack of cohesion:
“The project was well conceived, but its relevance has diminished in the current economic crisis context of Portugal where labour demand has been drastically reduced. The project was looking to activate the 2003 Bilateral Agreement on Circular Temporary Migration (ACTM) between Portugal and Ukraine. Major delays, weaknesses in the overall project management, low capacity for generating internal project cohesion and the complexity of the approach have limited project effectiveness; not all intended results will be achieved. However, this pilot initiative has outlined potential positive and negative effects of a circular migration approach and developed an operational framework for a circular migration scheme…Institutional capacity at the technical level for labour migration has been strengthened. Due to limited impact prospects, the ACTM will not be activated and development effects and increased regulated migration cannot be expected.” 70
Finally, an important aspect of migration is related to social security system problems. Working abroad as undocumented migrant and in the informal sector deprives workers of their right to a pension and other forms of social protection.71 Ukraine signed eight bilateral social security agreements with Bulgaria, Czech Republic, Estonia, Latvia, Lithuania, Slovakia, Portugal and Spain aiming to transfer to Ukraine certain amount of
69. ‘IOM Migrant Training Programmes Overview 2010–2011’, page 23. http://www.iom.int/jahia/webdav/shared/shared/mainsite/activities/facilitating/IOM_Migrant_Training_Programmes_Overview_2010_2011.pdf70. ‘Synthesis Report for the Migration and Asylum Section’, April 2011. The European Union’s ‘155-526//156-646//221-250’ Project for the Centrally Managed Thematic Projects.71. When a person was employed abroad, he/she was considered unemployed or out of labour force in Ukraine and did not pay contributions to the pension fund. Hence, he/she has the right only for a minimal social pension (since her work time abroad is not included into pension calculation).

83
The Links Between Policy and Legislation Framework in the Area of Migration and Education
pension contributions made in the destination country for return migrants. While being a very important achievement these agreements are only applicable to legal migrants who are officially employed. No information on the actual practice of using these agreements by eligible migrants is available. For a large number of undocumented migrants who work aboard, this implies no social protection in either country. There is also an option of signing an agreement for voluntary pension insurance with the Ukrainian Pension Fund. This agreement allows any Ukrainian to individually transfer contributions to the Pension Fund. However, a complicated mechanism coupled with the lack of trust in Ukrainian state institutions provide little hope that this option will be exercised. The fact that only about five thousand Ukrainians have so far signed such agreements with the Pension Fund speaks for itself (Malynovska, 2011).
Hence, concerning the extent of labour migration in Ukraine, existing government policies in the area of migration and education so far have had little influence on the migrants’ situation either at home or abroad. Rather, internal economic policies play a greater role in determining the extent of labour migration.


85
Conclusions
In Ukraine, similar to other countries, many people share the belief that good education is important for the success in the labour market.
The actual situation does reflect this belief but only partially. A year of education increases the chance to find a job by about two to three per cent. This effect is fairly similar in size to other transition countries. The effect of education on wages, however, is small relative to other transition countries (one to five per cent wage premium for a year of education). These results suggest that education does generate some opportunities in the local market, especially in the formal sector, but not many. It is a less powerful tool to improve one’s labour market prospects in Ukraine, as compared to the other transition countries. Thus, an effective policy for emigration prevention and the attraction of return migrants to Ukraine calls for general economic policies aiming at the improvement of the business environment, the overall investment climate, property rights protection and so forth. Educational reforms, including greater autonomy of educational institutions, their better cooperation with enterprises and the introduction of an effective “lifetime learning” system (i.e. provision of short-term upgrading courses for professionals by post-secondary educational institutions) would all improve the quality of the Ukrainian labour force, make the Ukrainian economy more competitive internationally and hence make it easier and more attractive to find a job in Ukraine. While more educated are more likely to benefit from these policies, better local perspectives for unskilled workers will grow as well.
Our results further show that education does not seem to have a clear and stable effect on migration from Ukraine. Moreover, empirical analysis suggests that the whole nature of Ukrainian migration in terms of its skills dimension has changed.
In 2005–2008, education was not a major determinant of the decision to migrate, though education did affect the choice of where to move. This suggests that it was rather the lack of opportunities for people in Ukraine in general, whether they are educated or not, that pushed people to go abroad. It also implies that education-based migration policies would not stop migration from Ukraine before the crisis. Instead, they could rather re-direct migration flows.
In 2010–2012 semi-educated migrants are slightly more likely to migrate; however, no effect of education on the choice of destination is observed now. This may signal a particularly poor labour market situation in the domestic market for blue-collar workers.

The Relations between Education and Migration in Ukraine
86
Similar to the local labour market, education generates some opportunities for Ukrainian migrants in the destination countries and this tendency became much more distinct in recent years. Education is positively related to the probability of finding high-profile positions, such as professionals, technicians or clerks, particularly in 2010–2012. It also increases the likelihood of being employed as a white-collar rather than a blue-collar worker. However, this study suggests that only a limited number of educated migrants have been able to explore these opportunities.72 In 2005–2008 about 80 per cent of Ukrainian educated migrants work abroad at blue collar or unskilled occupations. While this number went down to 72 per cent in 2010–2012, still too many previously white-collar migrants accept lower level jobs in foreign countries.73 There is at least a partial mismatch between education level of migrants and their jobs abroad.
This study provides evidence that the ‘brain-waste’ hypothesis was particularly acute for white-collar Ukrainian migrants but not that much for blue-collar workers in 2005–2008. While the situation improved in 2010–2012, it is not clear whether this improvement is permanent and to what extent it is driven by changes in the domestic labour market or in the country of destination. There are still questions about migrants reporting unskilled or no job prior to departure abroad and whose share is very high among workers abroad. Understanding the source of occupation mismatch warrants further investigation. At the moment it is only possible to speculate about potential causes.
A number of factors may lie behind this outcome. Unfortunately, part of the already obtained skills will be inevitably wasted if this mismatch is driven by the current lack of demand for specialists with tertiary education in the source and destination countries combined with the employments and wage differentials for unskilled labour between Ukraine and migration destination countries. This situation calls for market-driven educational policies. Such policies should put more emphasis on the revival of the professional education system in Ukraine, better cooperation with employers and a more flexible remuneration system able to attract needed specialists. The latter may be in particular need given the results for 2010–2012.
Brain waste among well-educated migrants during 2005–2008 in particular may be caused by a low transferability of high level skills obtained through education, but also by a lack of legal migration opportunities and recognition of skills abroad. The importance of this factor is partially supported by more evident impact of the previous occupation of Ukrainian migrants in both periods and the positive effect of education on the migrants’ occupation abroad in 2010–2012. Thus, any migration management measures that provide protected legal channels of migration and help to increase skills
72. In 2011 the Ukrainian government undertook steps aimed at improving migration management. Presidential Decree No. 622/2011 on the Concept of State Migration Policy has identified priority areas by creating the conditions for sustainable demographic and socio-economic development of the country, coordination of national legislation in the area of migration with the international standards, and strengthening of social and legal protection of Ukrainian migrant workers. An Action Plan to implement the State Migration Policy Concept was approved in October 2011. As implementing agency of the above Policy Concept, a State Migration Service was established for managing both immigration and emigration. In addition, the State Employment Service has been empowered with the recognition of prior learning, which is important for return migrants and their labour market integration back home.73. This de-skilling may also be due to the lack of bilateral agreements on recognition of qualifications between Ukraine and the destination countries.

87
Conclusions
transferability would benefit all parties (Ukraine, destination countries and migrants themselves) involved. These measures may include but are not limited to the following:
• establishing a migration management system including the provision of regular migration opportunities to work abroad;
• further progress on Bologna process and diploma recognition;
• further efforts on harmonization of qualification framework (at least in the most demanded sectors);
• establishment of the system for recognition of non-formal and informal skills;
• establishment of a system of internships in the migration destination countries for Ukrainian university graduates and experienced professionals (at least for the selected occupations where the persistent shortage of labour exists in the destination countries).
By improving transferability of high level skills, Ukraine may additionally benefit from the corresponding knowledge transfers associated with better matched and thus more effective exchanges of skilled specialists.
Another potential reason for the mismatch found in 2005–2008 may be associated with a lack of basic knowledge and skills which prevent the employability of more advanced professional skills. This includes the knowledge of the language of the destination country and of legislation and everyday routines in the destination country. The fact that this mismatch is not observed in the later period speaks in favour of this hypothesis. Orientation and migration-focused language and information courses run by representatives of receiving countries would re-enforce the tendency.
Finally, the Ministry of Social Policy, together with the State Migration Service, need to continue their efforts in promoting benefits of legal in contrast to undocumented migration channels. So far, education does not assure migrants legal employment abroad and does not provide them with jobs according to skills’ attainment. Here, in particular, attention should be devoted to registered private employment agencies. This channel is found to reduce the probability of irregular labour migration in both periods. Currently, the Ministry of Social Policy publishes regularly updated lists of agencies officially certified to assist in employment abroad. This information can be further spread (for example, through the State/Public employment agencies) along with feedback on the quality of these agencies services. More information about vacancies abroad, visa requirements and paper work, as well as the legal job search procedure should be more available to potential migrants.
Existing government policies in the area of migration and education so far have had little influence on the migrants’ decisions either at home or abroad. Rather, internal economic conditions play a greater role in determining the extent of labour migration. These findings once again emphasize that Ukraine needs to focus on further improving migration management including the provision of regular migration opportunities to work abroad.


89
Bibliography
Acosta, Pablo (2006). Labor supply, school attendance, and remittances from international migration: The case of El Salvador. World Bank Policy Research Working Paper 3903 (Washington, D.C., World Bank).
Acosta, Pablo, Fajnzylber, Pablo and López, J. Humberto. (2008). “Remittances and household behavior: Evidence for Latin America”. In Fajnzylber, Pablo and López, J. Humberto (eds.): Remittances and development. Lessons from Latin America. WB edition, pp. 133–170.
Adams, R.H. Jr. and Page, J. (2005a). “Do international migration and remittances reduce poverty in developing countries?” World Development, Vol.33, No.10, pp. 1645–1669.
Adams, Richard H. Jr. (2005b). Remittances, household expenditure and investment in Guatemala. World Bank Policy Research Working Paper 3532 (Washington, D.C., World Bank).
Adams, Richard H. Jr. (2007). International remittances and the household: Analysis and review of global evidence. World Bank Policy Research Working Paper 4116 (Washington D.C., World Bank).
Adams, Richard H., Jr. (2008). The demographic, economic and financial determinants of international remittances in developing countries. World Bank Policy Research Working Paper 4583 (Washington, D.C., World Bank). Available online: http://elibrary.worldbank.org/content/workingpaper/10.1596/1813-9450-4583.
Alderman, H. (1996). “Savings and economic shocks in rural Pakistan”, Journal of Development Economics, Vol. 51.
Alquezar, J., Avato, J. Bardak, U., Panzica, F. and Popova, N. (2010). Migration and skills, Directions in Development series (Washington D.C., World Bank). Available online: http://publications.worldbank.org/index.php?main_page=product_info&cPath=0& products_id=23776.

The Relations between Education and Migration in Ukraine
90
Amuedo-Dorantes, Catalina and Pozo, Susan. (2010). Accounting for remittance and migration effects on children’s schooling (Place, Publisher).
Amuedo-Dorantes, Catalina, Georges, Annie and Pozo, Susan. (2008). Migration, remittances and children’s schooling in Haiti. IZA DP No. 3657.
Antman, Francisca M. (2012). The Impact of migration on family left behind. IZA DP No. 6374.
Ardagna, Silvia and Lusardi, Annamaria (2008). Explaining international differences in entrepreneurship: The role of individual characteristics and regulatory constraints, NBER Working Paper No. 14012.
Arestoff, Florence, Kuhn, Mélanie and El Mouhoub Mouhoud (2010). Migration and remittances in South Africa: The role of political factors. Universite Paris-Dauphine WP. Available online: http://www.univ-orleans.fr/leo/infer/KUHN-new.pdf.
Assunção, Juliano J. and Carvalho, Leandro S. (2005). Financial constraints, migration and Inequality. PUC – Rio Economics Department DP No. 498.
Avato, Johanna (2009). Migration pressures and immigration policies: New evidence on the selection of migrants, DP No 0930, (Washington, D.C., The World Bank, Department for Social Protection and Labor University of Tuebingen, Department of Economics).
Badescu, Mircea, D’Hombres, Béatrice and Villalba, Ernesto (2011). Returns to education in European countries. Evidence from the European Community Statistics on Income and Living Conditions (EU-SILC). EUR 24850 EN – 2011. Available at: http://publications.jrc.ec.europa.eu/repository/bitstream/111111111/22267/1/reqno_jrc65411_eur_24850_en_web.pdf%5B1%5D.pdf.
Barrientos, Paola (2007). Analysis of international migration and its impacts on developing countries. Institute for Advanced Development Studies, Development Research Working Paper Series No. 12/2007.
Becker, Gary (1994). Human capital: A theoretical and empirical analysis with special reference to education (Chicago, The University of Chicago Press).
Benedictis, Geovanna, Calfat, Germán and Jara, Karina (2010). Assessing the impact of remittances on child education in Ecuador: The role of educational supply constraints, WP 2010.06 (University of Antwerp, Institute of Development Policy and Management).
Bertoli, Simone (2006). Remittances and the dynamics of human capital in the recipient country. Working Paper No. 07/2006 (Torino, Dipartimento di Economia ‘S. Cognetti de Martiis’ Università di Torino).
Beyene, Berhe Mekonnen (2011). Determinants of internal and international migration in Ethiopia, Memorandum No. 24/2011 (Oslo, Department of Economics, University of Oslo).
91
Bibliography
Biagi, Federico and Lucifora, Claudio (2005). Demographic and education effects on unemployment in Europe: Economic factors and labour market institutions. IZA DP No. 1806.
Borraz, Fernando (2005). “Assessing the impact of remittances on schooling: The Mexican experience”, Global Economy Journal, Vol. 5, pp. 1–30.
Bredl, Sebastian (2009). Migration, remittances and educational outcomes: The case of Haiti, DP No. 44 (Giessen, Zentrum für internationale Entwicklungs- und Umweltforschungder Justus-Liebig-Universität Giessen).
Budnik, Katarzyna B. (2011). Emigration triggers: International migration of Polish workers between 1994 and 2009, Working Paper No. 90 (Warsaw, National Bank of Poland).
Calero, Carla, Bedi, Arjun S. and Sparrow, Robert (2008). Remittances, liquidity constraints and human capital investments in Ecuador, Working Paper No. 458, Institute of Social Studies.
Caponi, Vincenzo (2006). Heterogeneous muman capital and migration: Who migrates from Mexico to the US? IZA Discussion Paper No. 2446.
Cárdenas, Mauricio, Medina, Carlos and Trejos, Andrés (2010). Measuring economic and social impacts of migration in Colombia: New evidence, WP # 601. Global Development Network (GDN) and the Institute for Public Policy Research.
Caritas Ukraine (2009). A report based on the sociological survey “Children on Labour Migrants: Features of Social Behaviour” (“Діти трудових мігрантів: особливості соціальної поведінки”) (Lviv, Caritas Ukraine).
Cattaneo, Cristina (2007). The self-selection in the migration process: What can we learn? LIUC Papers No. 199, Serie Economia e Impresa, 52.
Cizkowicz, Piotr, Holda, Marcin and Sowa, Urszula (2007). The new wave of Polish migration after EU enlargement – Current state, determinants and outlook, MPRA Paper No. 18596 (Warsaw,National Bank of Poland). Available at: http://mpra.ub.uni-muenchen.de/18596/.
Commander, Simon, Chanda, Rupa, Kangasniemi, Mari and Winters, L. Alan (2004). Must skilled migration be a brain drain? Evidence from the Indian software industry, IZA DP No. 1422.
Coupe, T. and Vakhitova, G. (2010). Recent Dynamics of Returns to Education in Transition Countries, KSE/KEI Working paper.
Crăciun, Cristina (2006). Migration and remittances in the Republic of Moldova: Empirical evidence at micro level. KSE MA thesis.

The Relations between Education and Migration in Ukraine
92
Danzer, Alexander M. and Dietz, Barbara (2008). Economic migration, networks and human capital transferability from the new European borderlands. A comparison of five astern European countries, IZA WP.
Danzer, Alexander M. and Dietz, Barbara (2009). Temporary labour migration and welfare at the new European fringe: A comparison of five Eastern European countries, IZA DP No. 4142.
de Vreyer, Philippe, Gubert, Flore and Roubaud, François (2007). Migration, self-selection and returns to education in the WAEMU. Developement institutions & Analyses de Long Terme Document De Travail DT/2007–10.
Delmar, F. and Davidsson, P. (2000) “Where do they come from? Prevalence and characteristics of nascent entrepreneurs”, Entrepreneurship & Regional Development, 12, pp. 1–23.
Dustmann, Christian and Speciale, Biagio (2006). Remittances and public spending on education (London, Department of Economics and Centre for Research and Analysis of Migration (CReAM), University College London).
Dutz, Mark, Kauffmann, Celine, Najarian, Serineh, Sanfey, Peter and Yemtsov, Ruslan (2001). Labour market states, mobility and entrepreneurship in transition economies, EBRD working paper No. 65.
Edwards, Alejandra and Ureta, Manuelita (2003). “International migration, remittances and schooling: Evidence from El Salvador”, Journal of Development Economics, 72, pp. 429–461.
European Training Foundation (ETF) (2007). Transition from education to work in EU neighbouring countries. Available at: http://213.215.218.67/pubmgmt.nsf/%28getAttachment%29/A45B02F13FE0B90BC125744800444C11/$File/NOTE7ELGL2.pdf.
European Training Foundation (ETF) (2008). The contribution of human resources development to migration policy in Ukraine, Working Paper.
European Training Foundation (ETF) (2009). Black Sea labour market reviews. Ukraine country report.
Faini, Riccardo (2006). Remittances and the brain drain, IZA DP No. 2155.
Flabbi, Luca, Paternostro, Stefano and Tiongson, Erwin R. (2008). “Returns to education in the economic transition: A systematic assessment using comparable data”, Economics of Education Review, 27: 724–740.
Flisi, Sara and Murat, Marina (2009). Immigrant links, diasporas and FDI. Evidence from five European countries, ETSG WP.
Foundation for Effective Governance (2012). Ukraine Competitiveness Report.

93
Bibliography
Geis, Wido, Uebelmesser, Silke and Werding, Martin (2008). How do migrants choose their destination country? An analysis of institutional determinants, CESIFO Working Paper No. 2506, Category 4: Labour Markets.
Georgiou, Miltiades N. (2010). The Impact of education on unemployment: An empirical analysis for Europe, Japan and USA (1992–2006), SSRN Working Paper Series.
Ghani, Ejuaz, Kerr, Kerr, William R. and O’Connell, Stephen D. (2011). Spatial determinants of entrepreneurship in India, NBER Working Paper No. 17514. Available at: http://www.nber.org/papers/w17514.
Görlich, Dennis, Mahmoud, Toman Omar and Trebesch, Christoph (2007). Explaining labour market inactivity in migrant-sending families: Housework, hammock, or higher education? WP No. 1391, Kiel Institute for the World Economy.
Gorodnichenko, Yuriy and Klara Sabirianova Peter (2005). “Returns to education in Russia and Ukraine: A semiparametric approach to cross-country comparative analysis”, Journal of Comparative Economics 33: 324–350.
Grip, Andries de, Fouarge, Didier and Jan Sauermann (2009). What affects international migration of European science and engineering graduates? IZA Discussion Paper No. 4268.
Grogger, Jeffrey and Hanson, Gordon H. (2008). Income maximization and the selection and sorting of international migrants, NBER WP.
Herasym, Halyna (2004). Private investment in human capital – Effect on earnings in Ukraine, EERC thesis.
Hodgson, Rob and Poot, Jacques (2011). New Zealand research on the economic impacts of immigration 2005–2010: Synthesis and research sgenda, Centre for Research and Analysis of Migration Discussion Paper Series, CDP No 04/11.
Hristev, Eugene, Mincu, Georgeta, Sandu, Maya and Walewski, Mateusz (2010). The effects of migration and remittances in rural Moldova, CASE Network Studies and Analyses No 0389, CASE-Center for Social and Economic Research. Available at: http://www.case-research.eu/upload/publikacja_plik/25599090_CNSA_389_June24.pdf.
Huber, Peter, Landesmann, Michael, Robinson, Catherine and Stehrer, Robert with Hierlander, Robert, Iara, Anna, O’Mahony, Mary, Nowotny, Klaus and Peng, Fei (2010). Migration, skills and productivity, WIIW Research Report No. 365.
Hunt, Jennifer and Gauthier-Loiselle, Marjolaine (2009). How Much Does Immigration Boost Innovation? IZA DP No. 3921.
Iara, Anna (2008). Skill diffusion by temporary migration? Returns to Western European work experience in Central and East European Countries, WIIW Working Paper No. 46.
Ivanova, Renata and Jeong, Byeongju (2011). Why don’t migrants with secondary education return? Working Paper Series No 449 (Prague, CERGE-EI).

The Relations between Education and Migration in Ukraine
94
Kandel, William and Kao, Grace (2001). “The impact of temporary labour migration on Mexican children’s educational aspirations and performance”. International Migration Review, Vol. 35, No. 4. (Winter), pp. 1205–1231.
Kifle, Temesgen (2007). Do remittances encourage investment in education? Evidence from Eritrea (Ann Arbor, MI, MPublishing, University of Michigan Library, Vol. 4, No. 1).
Kroeger, Antje and Anderson, Kathryn (2011). Remittances and children’s capabilities. New evidence from Kyrgyzstan, 2005–2008, DP 1170, Deutsches Institut fur Wirtschaftsforschung (DIW).
Kupets, Olga (2006). “Determinants of unemployment duration in Ukraine”, Journal of Comparative Economics. Vol. 34, Issue 2, pp. 228–247.
Kupets, Olga (2010). Employment outcomes for return labour migrants in Ukraine. (Наукові Записки НаУКМА, Том 107. Економічні науки). Available at: http://www.nbuv.gov.ua/portal/soc_gum/naukma/Econ/2010_107/08_kupets_ov.pdf.
Kupets, Olga (2012). The development and the side effects of remittances in the CIS countries: The case of Ukraine, CARIM-East Research Report 2012/02.
Leblang, David (2010). “Familiarity breeds investment: Diaspora networks and international investment”, American Political Science Review, Vol. 104, No. 3.
Lehmann, Hartmut, Muravyev, Alexander, Pignatti, Norberto and Zaiceva, Anzelika (2010). Worker displacement in Russia and Ukraine: A comparative analysis using micro data, ESCIRRU Working Paper No. 24.
Leschenko, N. (2001). The returns to education. Case of Ukraine, EERC thesis.
Libanova, E. (2010). External labour migration survey of Ukrainian Population: Main findings (in Ukrainian: Е. Лібанова. “Зовнішня Трудова Міграція Населення України: Основні Результати Вибіркового Обстеження”).
Libanova, E., and Malynovska, O. (2012). Social impact of emigration and rural-urban migration in Central and Eastern Europe, Final Country Report Ukraine.
Llussá, Fernanda (2010). Determinants of entrepreneurship: Are women different?, WP Series (Lisbon: Faculdade de Ciências e Tecnologia Universidade Nova de Lisboa).
Malynovska O. (2011). Labour migration: Social consequences and ways of regulation (Tрудова міграція: Соціальні наслідки та шляхи реагування. Аналітична доповідь). Available at: http://www.niss.gov.ua/content/articles/files/Malin_migraziya-dace3.pdf.
Marchiori, Luca, Pieretti, Patrice and Zou, Benteng (2010). The impact of migration on origin countries: A numerical analysis, DP 2010-06 (Luxembourg: Center for Research in Economic Analysis, University of Luxembourg).

95
Bibliography
McDonald, James Ted and Valenzuela, M. Rebecca (2009). The impact of skill mismatch among migrants on remittance behaviour, SEDAP Research Paper No. 242. Available at: http://socserv.mcmaster.ca/sedap/p/sedap242.pdf.
McKenzie, David and Rapoport, Hillel (2006). Can migration reduce educational attainment? Evidence from Mexico, World Bank Policy Research Working Paper No. 3952 (Washington D.C., World Bank).
Medina, Carlos and Cardona, Lina (2010). “The effects of remittances on household consumption, education attendance and living standards: The case of Colombia”, Lecturas de Economía, 72, pp. 11–43.
Mincer Jacob A (1974). Schooling, experience, and earnings (New York, Columbia University Press).
Mincer, Jacob (1991). Education and unemployment. NBER Working Paper No. 3838.
Murat, Marina, Pistoresi, Barbara and Rinaldi, Alberto (2008). Italian diaspora and foreign direct investment: A Cliometric perspective, University of Modena and Reggio E., Dept. of Economics in its series RECent WP # 013.
Niimi, Yoko, Ozden, Caglar and Schiff, Maurice (2008). Remittances and the brain drain: Skilled migrants do remit less, IZA DP No. 3393.
Osili, Una Okonkwo (2007). “Remittances and savings from international migration: Theory and evidence using a matched sample”. Journal of Development Economics 83, pp. 446–465.
Orrenius, Pia M., Zavodny, Madeline, Canas, Jesus and Coronado, Roberto (2010). Do remittances boost economic development? Evidence from Mexican states, Working Paper 1007 (Dallas, Federal Reserve Bank of Dallas, Research Department).
Ozden, Caglar and Schiff, Maurice (eds.) (2006). International migration, remittances, and the brain drain, (Washington, D.C., and New York, World Bank and Palgrave Macmillan).
Parinduri, Rasyad A. and Thangavelu, Shandre M. (2008). Remittance and migrant households’ consumption and saving patterns: Evidence from Indonesia, Research Paper No. 2008-02 (Nottingham University Business School, Malaysia Campus).
Parkhomenko, Natalia (2006). ‘Brain drain’ from Ukraine: Current situation and future challenges, Policy Paper # 3/2006 (Kiev, Centre for Peace, Conversion and Foreign Policy of Ukraine (CPCFPU)). Available at: http://cpcfpu.ru/en/projects/foreignpolicy/papers/306/.
Pavlova, Olga and Rohozynsky, Oleksandr (2005). Labour markets in CIS countries. CASE Network Studies and Analyses 0311, CASE – Center for Social and Economic Research.

The Relations between Education and Migration in Ukraine
96
Prelipceanu, Raluca (2010). “A gendered approach to temporary labour migration and cultural norms the case of migration from Romania”, Romanian Journal of Regional Science, Vol. 4, No 1.
Puri M., Robinson, D. T. (2006). Who are entrepreneurs and why do they behave that way, Working Paper (Durham NC, Duke University).
Raihan, Selim, Khondker, Bazlul H., Sugiyarto, Guntur and Jha, Shikha (2009). Remittances and household welfare: A case study of Bangladesh, Economics Working Paper Series No. 189 (Manila, Asian Development Bank).
Riddell, Craig W. and Song, Xueda (2011). The impact of education on unemployment incidence and re-employment success: Evidence from the U.S. Labour Market, IZA DP No. 5572.
Romero, Gabriel (2007). Skilled migration: when should a government restrict migration of the skilled workers? WP–AD–2007–25.
Sharma, Manohar and Zaman, Hassan (2009). Who migrates overseas and is it worth their while? An assessment of household survey data from Bangladesh, Policy Research Working Paper 5018 (Washington, D.C., World Bank Poverty Reduction and Economic Management Network, Poverty Reduction Group).
Spence, Michael (1973). “Job market signaling”, Quarterly Journal of Economics Vol. 87, No. 3, pp. 355–374.
Tabuga, Aubrey D. (2007). International remittances and household expenditures: The Philippines case, Discussion Paper Series No. 2007–18 (Manila, Philippine Institute for Development Studies).
Taylor, E. (2006). Does migration reshape expenditures in rural Mexico? Evidence from Mexico, Working Paper No. 3842 (Washington, D.C., World Bank).
Tolstokorova, A. (2008). “Locally neglected, globally engaged: Ukrainian women on the move”, In: Technologies of globalization. International conference proceedings, edited by Anderl, R., Arich-Gerz, B. & Schmiede, R. (Darmstadt, Technical University Darmstadt), pp. 44–61.
Tolstokorova, Alissa (2009). “Costs and benefits of labour migration for Ukrainian transnational families: Connection or consumption?”, Cahiers de l’Urmis, No. 12. Available at: http://urmis.revues.org/index868.html, accessed 20/04/2010.
Tullao, Tereso S. Jr., and Rivera, John Paolo R. (2008). The impact of temporary labor migration on the demand for education: Implications on the human resource development in the Philippines, EADN Working Paper No. 37.
UNICEF (2009). Poverty and unequal opportunities of children in Ukraine (Kiev, Institute of Demography and Social Research NASU, Ukrainian Centre for Social Reform) (Бідність та нерівні можливості дітей в Україні).
97
Bibliography
Van Der Sluis, Justin, Van Praag, Mirjam and Vijverberg, Wim (2008). “Education and entrepreneurship selection and performance: A review of the empirical literature”, Journal of Economic Surveys, Vol. 22, Issue 5, pp. 895–841.
World Bank (2009). Ukraine labour demand study. Available at: http://siteresources.worldbank.org/UKRAINEEXTN/Resources/WB_Book_Report_labor_demand_EN_prew.indd.pdf.
Zaiceva, Anzelika and Zimmermann, Klaus F. (2008). Scale, diversity, and determinants of labour migration in Europe, IZA Discussion Paper No. 3595.
Ziesemer, Thomas (2008). Worker remittances and government behaviour in the receiving countries, UNU-MERIT Working Papers, No. 2008–029.


99
ANNEX A
A Note on Methodology
1. The Impact of Education on Migration Decisions – Evidence from the 2008 Ukrainian Labour Force Survey and External Labour Migration ModuleThe data for the empirical analysis come from the first wave of the External Labour Migration survey and the Ukrainian Labour Force survey. The ELMS was conducted in April–May 2008 by the Ukrainian State Statistics Committee and the Ukrainian Centre for Social Reform with financial and technical support from the Open Ukraine Foundation, International Organization for Migration and the World Bank. The survey was operated as a supplement to two nationally representative surveys of non-institutional households, the abovementioned monthly Labour Force Survey (LFS) and the quarterly Household Budget Survey (HBS). The initial combined sample included more than 25 thousand households. Out of 48 thousand household members of working age, 1,381 respondents reported to be abroad for employment reason at least once between 2005 and the date of the interview. Out of these migrants, 268 individuals were also HBS respondents, while 1113 individuals were respondents to the LFS.
To study the propensity to migrate, the LFS sample is used. This task requires identifying who in the LFS are migrants and who are non-migrants. For this purpose the respondents’ information in the ELMS is matched to the individual data in the LFS. It was found that 667 migrants answer the individual LFS questionnaire in April–May 2008 (EAH1 form), including 245 current migrants who temporarily visited Ukraine at the time of the interview, and 422 respondents who worked abroad in 2005–2008 and at the moment stayed in Ukraine on a permanent basis, i.e. return migrants. Information for 247 other respondents from the migrant group was provided by other family members from the LFS household questionnaire (EAH2 form). Finally, 199 individuals were matched to certain LFS households but do not seem to be present in the main LFS set in the period under study (191 of these live abroad permanently).
The group of non-migrants is constructed from the main LFS sample for April–May 2008 (the initial sample includes 56,214 individuals). First, to avoid double counting for

The Relations between Education and Migration in Ukraine
100
the 7,924 individuals who were surveyed in both months, observations during May are eliminated. The next steps of sample construction followed the design of the migrants’ supplement to keep the two subsamples comparable. Thus, the non-migrant group was further reduced by dropping respondents who were not of working age (i.e. 8,071 females aged above 53 years and 3,499 males above 59 years old), as well as 124 individuals with education below primary, and 167 respondents from Sevastopol city. Then the 667 migrants identified from the migration survey as individuals with migration experience during 2005–2008 were also dropped. Additionally, 28 individuals whose main place of work during the reference week was located abroad were also recoded as migrants. Therefore, the final sample of non-migrants consists of 35,800 individuals. At the same time, 667 and 28 respondents were identified as individuals with migration experience being the group of migrants in the LFS.
Other migration decisions are considered conditional on the decision to migrate. For this purposes the entire migration data set is used.
The following explicative variables were constructed. First of all, these are standard demographic characteristics, such as age and age squared to proxy for experience, gender (an indicator variable taking a value of 1 for females and 0 for males) and marital status (an indicator variable taking a value of 1 for married respondents and zero otherwise).
Family composition is reflected in three variables, namely household size, number of children below seven in the household and number of elderly household members (age 65 and above). Geographic factors are controlled with a set of dummies describing five macro regions in Ukraine, such as Centre (base category), North, East, South, and West. Additionally there is a dummy for the type of settlement (urban residence takes a value of 1, zero for rural) as it is thought to contribute to migration through the difference in labour market opportunities. As an additional migration factor there is a variable that reflects two major causes of migration as indicated by the respondent (one corresponds to low wage in Ukraine, zero reflects lack of suitable employment a home).74 This last variable is available for migrants only, hence it can only be used for the propensity regression.
Our main variable, “education”, is captured with a set of dummies corresponding to the following levels within ISCED classification: tertiary, post secondary non-tertiary, upper secondary, and lower secondary and primary (base category).
2. Impact of Remittances on Education DemandMethodologically, the estimation is based upon a modified Working-Lesser model. Marginal propensity to invest in education is analysed by modelling the household’s demand on education while controlling for the household income75 and a vector of household’s socio-demographic characteristics. The dummy variable for remittances (REM) enters education
74. Only these two causes are recorded.75. Consistent with the literature for transition countries income is replaced with household expenditure to correct for the systematic income underreporting.

101
Annexes
demand equation linearly and interacted with a log of income to allow for the most flexible relationship. Then, the results are compared for remittance receiving and non-receiving households to reveal any differences in spending patterns of these two groups (Alderman 1996; Adams 2005a, 2008; Tabuga 2007).
Spending behaviour may be partly explained by the observed differences in household composition (family size, number of children and so forth), education, age, and gender of the household head, type of residence (urban/rural), geographic region and receipt of remittances (Osili, 2007, Alderman, 1996, Taylor, 2006, Adams, 2005a, 2008). Thus, these variables are included into the model to control for the differences in spending patterns.
Among 2,862 households in the sample there are 61 receiving remittances. These households are on average similar to the rest of the sample. However, they differ in two very important aspects. The education of the family heads in the remittance-receiving household is on average higher. They are more likely to hold academic and vocational degrees and less likely to have finished only secondary school. Additionally, the average monthly expenditures of a remittance-receiving household is 3,035.85 UAH, which is 32.5 per cent (significant at 10 per cent level) higher than that of non-receiving (2,291.46 UAH). Despite that, the share of education expenditures in monthly budget is the same for all households, around one per cent.
Table 27: Descriptive statistics: remittance receivers vs. non-receivers
Variables Remittance
receivers
Remittance non-
receivers
Household head characteristics
Age 51.87 50.3
[13.21] [13.40]
Female 0.64 0.72
[0.48] [0.45]
Employed 0.54 0.57
[0.50] [0.50]
Education (highest degree)
Academic 0.18* 0.26*
[0.38] [0.44]
Professional 0.19 0.18
[0.39] [0.39]
Vocational 0.20* 0.30*
[0.40] [0.46]
Secondary 0.34** 0.18**
[0.47] [0.39]

The Relations between Education and Migration in Ukraine
102
Variables Remittance
receivers
Remittance non-
receivers
Household characteristics
Size 2.99 3.3
[1.44] [1.79]
Number of working household members 1.19 1.2
[0.98] [1.08]
Number of young children 0.18 0.25
[0.45] [0.51]
Rural residents 0.34 0.28
[0.47] [0.45]
Monthly education spending 49.47 30.52
[281.85] [123.71]
Total monthly expenses 2291.46* 3035.85*
[3360.46] [3913.96]
Share of spending on education in total monthly spending 0.01 0.01
[0.05] [0.03]
Standard deviations in brackets. * significant at 10 per cent; ** significant at 5 per cent; *** significant at 1 per cent.

103
ANNEX B
Findings From a Similar Research in Moldova76
The project on ‘Effective Governance of Labour Migration and its Skills Dimensions’ aimed at supporting migration management in Moldova and Ukraine. Therefore, the studies and researches carried out within the project were conducted in parallel in both countries. Even if it is not possible to make a direct comparison due to the different conditions in the countries of reference, it could be interesting to have an idea of what is happening in the same sector with one of Ukraine’s immediate neighbours.
The study aimed at testing three general assumptions:Assumption 1. Remittances have an impact on the access to education in terms of (a)
continuing education at a professional level, (b) choice of the educational level (secondary vocational, specialized secondary/college and higher), and (c) choice of educational field (speciality).
Assumption 2. The expenditures related to education are higher in the families receiving money from abroad, compared to the families having no external transfers.
Assumption 3. The current professional system contributes to the increase in migration outflow.
All three assumptions have been confirmed by qualitative and quantitative data from the study.
Conclusions and Findings Education system and the labour force market
The number of students studying at the three levels of professional education was relatively equal at the beginning of the 1990s. The demand for the secondary professional studies decreased dramatically and became ‘non-prestigious’ and unattractive because of the economic collapse that occurred during that period. At the same time, a younger generation
76. This section has been written by Francesco Panzica, international consultant on migration and employment, who provided expert support during the implementation of the project in Moldova and Ukraine. The similar study in Moldova has been conducted in 2012 by Sintov, R. Cocojaru, N., CIVIS. Assessment of Links between Education, Training and Labour Migration in Moldova (ILO, 2013).
The Relations between Education and Migration in Ukraine
104
reoriented towards university studies since the latter became relatively accessible for many households with a better financial situation as a result of the migration of some family members. As a result, in two decades the number of professional college students has diminished to the point where it is three times smaller than the number of university students, while the contingent of students in the secondary vocational subsystem is five times smaller.
Besides the excess of university graduates, the educational system in Moldova generated a surplus of specialists in some areas: the university graduates in economy and law represent approximately 50 per cent of the total number of graduates for the years 2005–2010.
A major issue in this respect is the lack or inefficiency (where it exists) of vocational counselling in schools, gymnasiums and lyceums even though the curriculum provides for such classes. At the same time, the Moldovan authorities face difficulties in forecasting labour force demands – this affects negatively the process of establishing enrolment quotas in professional education institutions.
The selection of the level and area of studies does not coincide with the labour market demands: teenagers want to get a university diploma (while the labour market has a strong demand for skilled workers) and are oriented towards professions that they consider to be prestigious (economic science, legal and political science).
The structural changes in the national economy in the last years as well as the migration of the population led to a constantly decreasing rate of employment. This decreasing trend is generally not linked to the level of education and professional skills of the labour force. Still, the share of higher education graduates is bigger among the employed population compared to those with secondary vocational and specialised secondary/ college studies (59 per cent versus 51 per cent and 50 per cent accordingly, in 2010). To conclude, employment chances are better for those jobseekers with a higher level of education.
A lack of coherence is noticed here: there is an overwhelming demand for skilled workers on the labour market, while the chances to find a job still remain higher for the holders of university diplomas (while the interest for university studies is also increasing). This paradox has been explained in the speciality literature and confirmed by the results of our study. On the one hand, a new generation of students want a university diploma and this led to a structural change of the employed population depending on their level of education. On the other hand, the level of training offered in the vocational and trade schools is inadequate (in the majority of cases), so much so that the quality of the human capital generated by these institutions is far below the expectations of the employers. Neither are the university graduates perfect in this respect (they themselves overtly admit it), but comparatively they have an advantage: they are more flexible, capable of multitasking, able to learn quickly and more responsible. The junior specialists with university diplomas agree to be employed in areas far from being complementary with their speciality (especially as a first employment experience); this is either due to the lack of vacant jobs for their qualifications (e.g. graduates in law or economy), or due to the lack of experience, or due to the fact that they do not have the necessary knowledge and skills according to the position to which they might aspire.

105
Annexes
As for the labour market, it should be reiterated that the vacant jobs are mainly available for skilled workers. According to the official statistics almost 80 per cent of all jobs available are for the candidates with secondary vocational studies and this situation has not changed in the last five years. Another paradox of Moldovan labour market is that the graduates of vocational schools are more subject to the risk of unemployment despite the increased demand for skilled workers. The explanation in the preceding paragraph is still valid for this case, too.
As for the compliance of the studies’ profile of the respondents with their occupational one, the large majority of qualified employees carry out activities at their working places in strict conformity with their area of professional training. University graduates are best placed in this regard. However, the 2010 statistics of the National Bureau of Statistics (NBS) (compared to 2008) show an increase of the share of employees accomplishing activities below their qualifications (including university graduates). This is again a confirmation of the explanations stated before, concerning employment versus unemployment depending on the level of education.
Another conclusion of the study is that the cooperation between the professional training institutions and the business environment is very scarce and, to a great extent, inefficient. Both parties blame one another for this lack of contact. From the point of view of the educational institutions the economic agents are reluctant to cooperate, while the latter blame the institutions for educating a labour force that hardly meets the expectations and demands of the market. The World Economic Forum has done an assessment of the professional education system in Moldova as well as the cooperation level between educational institutions and economic agents. The basic conclusions of these assessments are that the educational system is not adjusted to new economic developments, while the newly generated human capital is not well enough trained for successful integration on the labour market immediately after graduating. However, a greater interest and a more active involvement of the business environment in the education of human capital early in the process may improve the state of things.
Migration
Brain drain is one of the indicators for the World Economic Forum to measure the labour market efficiency. Moldova scored only two points on a scale of seven (where one equals that the best people migrate abroad in search of a better opportunity of valuing their own capital, and seven equals a country of origin that offers grand opportunities for valuing the human potential). This means that the Moldovan labour market is practically non-efficient from the viewpoint of valuing the human potential of the country.
The migration of Moldovan population has registered an increasing trend in 2009–2011: from 295 thousand persons to 317 thousand. Almost one half (48 per cent) of the total migration contingent from Moldova represented the population with professional qualifications in 2011. The decision of the specialists to leave the country is namely influenced by an internal labour market characterised by small salaries, the impossibility of finding a job that matches their qualifications and so forth.

The Relations between Education and Migration in Ukraine
106
Even though persons with a higher level of education are less eager to migrate, the NBS data as well as sociological researches show an increase in the number of Moldovan students in the total migrating contingent. The population with a higher level of education is basically included in the category of long-term migrants, since they tend to work abroad for a longer period of time compared to the population with a lower degree of studies.
At the same time, the results of our study (as well as the ones of the previous surveys) show that students would rather stay inside the country and develop a career if there were decent opportunities for them rather than going abroad; however, they are pressed to choose migration as an alternative to the limited and unattractive opportunities they have in Moldova. Once they have left, they are mainly involved in activities for which they are over-qualified, but they would rather accept wasting their human capital as a price paid for the financial welfare offered to them by migration.
The education level of the migrants is a precondition for their success in the host countries. The findings of this report show that the university graduates from Moldova would more easily get involved in more ‘prestigious’ areas of activity for migrants; they would find a long-term job easier, be better paid and, accordingly, be better protected from the social point of view.
There are currently no official data available concerning the exact number of students who left abroad for their studies, the share of students returning home after having graduated from educational institutions abroad, their further social inclusion on the Moldovan labour market as well as many other important aspects regarding the labour market. Still, the statistical data held by certain ministries (e.g. the Ministry of Education) on the migration of Moldovan citizens show an increasing trend. Thus the number of students who left abroad for studies based on international cooperation protocols increased almost twice in the last six years (from 2,118 persons in the academic year 2006–2007 to 4,270 in 2011–2012). UNESCO data is even more significant.
One of the empirical findings of the survey is that the share of those who would remain after finishing studies abroad is constantly increasing: more and more Moldovan citizens would rather go abroad for studies to obtain an internationally accepted diploma, thus creating the preconditions for remaining there; the number of family reunification cases in the host countries is also constantly growing.
Remittances and Access to Education
The basic conclusion of this chapter is that there definitely exists a positive correlation between the remittances’ availability and access to education. Thus, the subjects from the families that benefit from remittances would more often choose to continue their studies after the secondary general level of education compared to the children from families that do not receive any money from abroad (57.9 per cent vs. 29.7 per cent).
The remittances have a defining role in the choice of studies’ level and specialities:

107
Annexes
• Young people from households with migrants are rather inclined to apply for university studies (30.9 per cent), compared to their co-nationals from the households with no migrants (23.5 per cent);
• Two-thirds of the students/graduates benefitting from remittances were only/mainly able to study in universities due to the money transfers from abroad;
• Just over a half of the respondents receiving no money from abroad chose to undergo secondary vocational studies since they lacked any possibility to cover the expenditures necessary for higher level education;
• Approximately a half of the students/graduates benefiting from remittances choose to be trained in a certain profession only/mainly due to these financial sources, otherwise they would be forced by the situation to choose other, less attractive specialities.
The educational investments are bigger in case of the families that benefit of money transfers from abroad. These households would thus allocate bigger amounts for the same type of expenditures, compared to the students from families receiving no money from abroad. Thus, for instance, a recipient family might spend MDL 5,900.00/year for accommodation, while a non-beneficiary family – approximately MDL 3,400.00/year; a student with remittances would spend approximately MDL 2,600.00/year for supplementary classes, while the student with no remittances would only spend approximately MDL 1,100.00/year. These differences are seen in all types of expenditures that any student would bear during the school year: education fees, accommodation, food, transportation, individual classes, non-official payments, books and consumables, extracurricular activities and son on.
These differences are noticeable depending on the studies’ level of the subjects. Thus, a student beneficiary of remittances would spend approximately MDL 2,805.00 for one year of studies in a vocational school, which is almost twice as much as a student who is a non-beneficiary of money transfers would pay. A college/specialised secondary student beneficiary of remittances would spend 1.5 times more money compared to a non-beneficiary colleague. The difference in the case of university studies is 1.3 times.
The children from the remittance families have better access to the information technology. For example, the share of students owing a PC is bigger among the beneficiaries of remittances compared to non-beneficiaries (39.3 per cent vs. 28.2 per cent).
There is also a positive link between the remittances’ availability and knowledge of a foreign language. Thus, for example, the remittance households’ beneficiaries would have better knowledge of English compared to those who receive no money from abroad. This is peculiar to all the respondents despite their level of studies. The access to learning a foreign language is therefore higher among the population benefitting from remittances.
The availability of remittances would considerably influence not only the access to education, but also the career intentions of the beneficiaries: namely, this reduces the incentives of the persons to find a job (i.e. reservation wage effect). Thi s fact was acknowledged by the results of the survey. Thus, the share of persons that had no occupation in the last 12 months is approximately 10 per cent higher in the households benefitting of remittances compared to the households that receive no money from abroad (45.7 per cent vs. 35.0 per cent accordingly).


ISBN 978-92-2-128181-8
9 7 8 9 2 2 1 2 8 1 8 1 8