the relationship between basal metabolic rate and daily ... · basal metabolic rate (bmr) is...
TRANSCRIPT
University of Groningen
The relationship between basal metabolic rate and daily energy expenditure in birds andmammalsRicklefs, Robert E; Konarzewski, Marek; Daan, S
Published in:American Naturalist
DOI:10.1086/285892
IMPORTANT NOTE: You are advised to consult the publisher's version (publisher's PDF) if you wish to cite fromit. Please check the document version below.
Document VersionPublisher's PDF, also known as Version of record
Publication date:1996
Link to publication in University of Groningen/UMCG research database
Citation for published version (APA):Ricklefs, R. E., Konarzewski, M., & Daan, S. (1996). The relationship between basal metabolic rate anddaily energy expenditure in birds and mammals. American Naturalist, 147(6), 1047-1071.https://doi.org/10.1086/285892
CopyrightOther than for strictly personal use, it is not permitted to download or to forward/distribute the text or part of it without the consent of theauthor(s) and/or copyright holder(s), unless the work is under an open content license (like Creative Commons).
Take-down policyIf you believe that this document breaches copyright please contact us providing details, and we will remove access to the work immediatelyand investigate your claim.
Downloaded from the University of Groningen/UMCG research database (Pure): http://www.rug.nl/research/portal. For technical reasons thenumber of authors shown on this cover page is limited to 10 maximum.
Download date: 18-05-2019
The Relationship between Basal Metabolic Rate and Daily Energy Expenditure in Birds andMammalsAuthor(s): Robert E. Ricklefs, Marek Konarzewski and Serge DaanSource: The American Naturalist, Vol. 147, No. 6 (Jun., 1996), pp. 1047-1071Published by: The University of Chicago Press for The American Society of NaturalistsStable URL: https://www.jstor.org/stable/2463191Accessed: 12-11-2018 12:34 UTC
JSTOR is a not-for-profit service that helps scholars, researchers, and students discover, use, and build upon a wide
range of content in a trusted digital archive. We use information technology and tools to increase productivity and
facilitate new forms of scholarship. For more information about JSTOR, please contact [email protected].
Your use of the JSTOR archive indicates your acceptance of the Terms & Conditions of Use, available at
https://about.jstor.org/terms
The American Society of Naturalists, The University of Chicago Press are collaboratingwith JSTOR to digitize, preserve and extend access to The American Naturalist
This content downloaded from 129.125.148.19 on Mon, 12 Nov 2018 12:34:44 UTCAll use subject to https://about.jstor.org/terms

Vol. 147, No. 6 The American Naturalist June 1996
THE RELATIONSHIP BETWEEN BASAL METABOLIC RATE AND
DAILY ENERGY EXPENDITURE IN BIRDS AND MAMMALS
ROBERT E. RICKLEFS,1* MAREK KONARZEWSKI,2"t AND SERGE DAAN3
'Department of Biology, University of Pennsylvania, Philadelphia, Pennsylvania 19104-6018; 2Department of Physiology, University of California-Los Angeles Medical Center, Los Angeles,
California 90024; 3Zoological Laboratory, University of Groningen,
P.O. Box 14, 9750 AA Haren, The Netherlands
Submitted February 23, 1994; Revised September 5, 1995; Accepted September 27, 1995
Abstract.-We examined the relationship between daily energy expenditure (DEE) and basal metabolic rate (BMR) in birds and mammals. Two models of the relationship between DEE and BMR were distinguished: a "shared pathways" model in which DEE replaces BMR in the active organism and a "partitioned pathways" model in which DEE includes BMR-that is, BMR is separate from the metabolic pathways that result in activity metabolism (ACT), and DEE = ACT + BMR. The appropriate null hypotheses for the relationship between basal and active metabolism are rDEE.BMR = 0 and rACT.BMR = 0, respectively. Correlations of the residuals (d and b) of the logarithms of DEE and BMR from their allometric regressions with the logarithm of body mass were tested against these null models. Using phylogenetically independent con- trasts, we found no significant relationship between DEE and BMR in birds, but a strong relationship (rdb = 0.86) among mammals. Thus, the hypothesis that sustained working capacity is related to basal metabolism is supported for mammals but not for birds. Residuals of metabolic variables from allometric regressions on body mass were greater for mammals than for birds and suggest that mammals are more diversified in their energetic physiology. The idea that sustainable energy expenditure may be pushed to physiological limits in mammals but not in birds is not supported, however, because the ratio of DEE to BMR has a somewhat lower mean and greater variance in mammals compared to birds. The nature of the relationship between DEE and BMR in mammals and the apparent absence of such a relationship in birds remain major puzzles in animal physiology.
Basal metabolic rate (BMR) is defined as the rate of energy metabolism of a nongrowing organism at rest under postabsorptive conditions in a thermoneutral environment. Although BMR has been widely used in comparisons among spe- cies, its biological significance is obscure. Basal metabolic rate is thought to represent the minimum energetic cost of maintaining cells and organs in readiness for higher levels of activity. The daily energy expenditure (DEE; often referred to as field metabolic rate, FMR, when measured on free-living animals) measures the rate of energy metabolism of an active organism. The relationship between
* To whom correspondence should be addressed. Present address: Department of Biology, Univer- sity of Missouri, St. Louis, Missouri 93121-4499; E-mail: [email protected].
t Present address: Institute of Biology, University of Warsaw, Branch in Bialystok, Swierkowa 20B Str., 15-950 Bialystok, P.O. Box 109, Poland.
Am. Nat. 1996. Vol. 147, pp. 1047-1071. ? 1996 by The University of Chicago. 0003-0147/96/4706-0009$02.00. All rights reserved.
This content downloaded from 129.125.148.19 on Mon, 12 Nov 2018 12:34:44 UTCAll use subject to https://about.jstor.org/terms

1048 THE AMERICAN NATURALIST
BMR and DEE may be thought of as the relationship between readiness and
action, and it has become an issue of central importance to understanding organis-
mal design and function.
The metabolic rates (both BMR and DEE) of ectotherms and endotherms pro-
vide a striking contrast in energetic physiology. According to the "aerobic capac- ity" hypothesis (Bennett and Ruben 1979; Taigen 1983), the evolution of endo-
thermy and high levels of sustained activity in birds and mammals was
accompanied by an increase in the capacity of aerobic pathways of metabolism and in the organ systems (digestion, respiration, circulation, and excretion) that support this capacity. The cost of maintaining this capacity may manifest itself in the minimum, or basal, metabolic rate. If the aerobic capacity hypothesis were
correct, basal and active metabolism should be correlated among both ectotherms
and endotherms as well. Supporting data come from several studies. For example, among a sample of anuran amphibians, maximum metabolic expenditure during activity was correlated with the minimum metabolic rate (Walton 1993).
Researchers (King 1974; Drent and Daan 1980) have observed that DEE during periods of high energy demand (such as provisioning large offspring in birds and lactation in mammals) averages about four times BMR. This multiple has been
suggested (Drent and Daan 1980) to represent an optimum sustainable metabolic rate or working capacity, beyond which further exertion would be detrimental to parental survival. Thus, BMR may represent the cost of maintaining either the metabolic capacity to make energy available for daily activities or the tissues that produce the metabolic demands of activity. This idea comprises a variety of physiological limits to energy production or demand. For example, it has been suggested that variation in BMR may represent differences between species in the ability of the digestive tract to assimilate the nutrients and energy substrates needed to support the metabolism of the active organism (Kirkwood 1983; Kara- sov and Diamond 1985; Weiner 1989, 1992; Peterson et al. 1990; Konarzewski and Diamond 1994).
Measurements of DEE (or FMR) have accumulated at a rapid pace recently owing to the application of doubly labeled water techniques to estimate metabolic rates of animals in natural settings (Nagy 1987). These studies have revealed that the ratio of DEE to BMR varies widely: values reported in the literature for birds feeding large chicks and for lactating mammals extend between two and seven (Birt-Friesen et al. 1989; Weathers and Sullivan 1989; Peterson et al. 1990; Bryant and Tatner 1991; Koteja 1991). This range of values calls into question the idea of a maximum working capacity that is closely tied to BMR.
The hypothesis that DEE is causally related to BMR could be rejected if these variables were not correlated after the allometric relationships of both measures to body size had been removed. In one study (Daan et al. 1990), BMR and DEE of 26 species of bird were analyzed, and the residuals with respect to body mass of the log-transformed values of BMR and DEE were found to be positively correlated (r = 0.45, P < .025). Measurements of DEE came from published doubly labeled water studies of parent birds feeding dependent chicks. A broader study of the relationship between DEE and BMR in birds and mammals was undertaken (Daan et al. 1991) and found significant correlations between the resid-
This content downloaded from 129.125.148.19 on Mon, 12 Nov 2018 12:34:44 UTCAll use subject to https://about.jstor.org/terms

BASAL METABOLISM AND DAILY ENERGY EXPENDITURE 1049
uals of DEE and BMR in both groups. The bird data included the 26 species analyzed earlier (Daan et al. 1990) and two additional species representing new data. The mammal data included 15 species ranging from the 6.5-g Pipistrellus
pipistrellus to the 2.4-kg Marmotaflaviventris. The correlation between the resid- uals of DEE and BMR in mammals had a value of r = ^0.52 (P < .05), and the regression of the residuals of DEE on those of BMR had a slope of about 0.5.
Koteja (1991) applied a similar analysis of residuals to the relationship between BMR and DEE (FMR), finding a weak correlation (r = 0.23, P < .02, n = 23) among birds engaged in reproduction (generally, feeding offspring) and a strong correlation among eutherian mammals (r = 0.83, P < .001, n = 18). However, noting the absence of such a relationship among marsupial mammals, songbirds (Passeriformes), and seabirds when each of these groups was considered sepa- rately, Koteja (1991) concludes that "the assumption that BMR is a reliable index of energy expenditure of free-living animals does not have a strong backing in the experimental data available so far." Maximum cold-induced metabolism and BMR have been shown to be correlated in a sample of rodent species (Hinds and Rice-Warner 1992) but not among 12 species of shrews (Soricidae) (Sparti 1992). Hayes et al. (1992) found no correlation between BMR and cold-induced maxi- mum metabolic rate within populations of deer mice (Peromyscus maniculatus). In addition, neither measure of metabolism was correlated with litter size, off- spring mass, or total litter mass (Hayes et al. 1992), suggesting a general indepen- dence of life-history traits and metabolic capacity within a species, which is also consistent with comparisons among species of mammals (see Harvey et al. 1991).
How we interpret the results of these analyses depends on whether values of DEE represent comparable measurements of maximum sustainable metabolic capacity. Variation among individuals within populations (Bryant and Tatner 1991) and modest increases in DEE in response to increased brood size (Masman et al. 1989; Dijkstra et al. 1990; Bryant and Tatner 1991) suggest that birds may have considerable reserve capacity (Diamond and Hammond 1992) for DEE. Additional doubt about the consistency of the relationship of FMR to maximum sustainable metabolic capacity is raised by studies such as that of Hayes (1989), who found that measured values of FMR in deer mice were closer to maximum cold-induced metabolic rates in high-elevation populations than in low-elevation populations.
THE FUNCTIONAL RELATIONSHIP BETWEEN DEE AND BMR
How one interprets correlations between DEE and BMR depends on how these variables are functionally related to each other. If DEE were simply the sum of BMR and metabolic expenditures for activity (i.e., DEE = BMR + ACT), then DEE and BMR would not be strictly independent variables from a statistical point of view. That is, variation in BMR would produce correlated variation in DEE. This point raises a concern over the appropriate null hypothesis against which to test observed correlations between DEE and BMR.
The relationship between DEE and BMR may be represented by two funda- mentally different models of metabolism. One of these, which we call the "shared
This content downloaded from 129.125.148.19 on Mon, 12 Nov 2018 12:34:44 UTCAll use subject to https://about.jstor.org/terms

1050 THE AMERICAN NATURALIST
pathways" model, is that DEE represents a speeding up of the metabolic path- ways that, in a resting state, produce BMR. Thus, DEE replaces BMR in the active organism, and the two measured variables may be thought of as being independently estimated, each representing the metabolism of the organism in a different physiological state. Basal metabolic rate has no meaning in the active organism and therefore it is not a component of DEE. Accordingly, one may inquire whether the metabolic level of the resting state is related to that of the active state, for which the appropriate null hypothesis is rDEE.BMR = O.
The other possibility is the "partitioned pathways" model, which presumes that BMR and metabolic expenditures for activity (ACT), including thermoregula- tion and other non-"basal" sources of energy demand, are products of different metabolic pathways that add to produce the total metabolic rate of the organism. That is, BMR remains unchanged in the active state. Basal and activity-induced metabolism could be correlated if the pathways responsible for BMR are in some way scaled to match those that produce ACT, perhaps because the physiological processes that result in BMR directly support the capacity of the organism to sustain activity. According to this perspective, the processes responsible for BMR continue to function in the active individual; DEE is then the sum of BMR and ACT, and the appropriate null hypothesis is rACT.BMR = 0. As we shall show below, these two null hypotheses can differ considerably, which could affect how we interpret the relationship between DEE and BMR.
Correlation between DEE and BMR also might be generated by the way we parameterize these variables. Because both DEE and BMR are related to body mass, the accepted practice is to remove this influence by calculating the residuals of BMR and DEE from their allometric (log-log) regressions on body mass. Clearly, if variation in body mass among species or other units of comparison includes components that contribute little to metabolic function-such as white fat, plumage or pelage, and skeleton-this variation in mass will produce corre- lated variation in the residual values of DEE and BMR. So will errors in estimat- ing body mass.
A final consideration is phylogenetic relationship. Because many of the species included in comparisons are close relatives, each is not a strictly independent sample of the relationship between DEE and BMR when common phylogenetic origin produces historic effects (Felsenstein 1985; Harvey and Pagel 1991). Statis- tical inference requires independent sampling, and it is therefore important to analyze comparative data with methods, such as that of calculating phylogeneti- cally independent contrasts (PIC), that attempt to guarantee statistical indepen- dence (Garland et al. 1992).
In this article, we reanalyze the relationships between DEE and BMR in birds and mammals in the context of these considerations of structural and statistical independence of the variables and phylogenetic independence of the sampling units, and we consider the implications of measurement error for observed corre- lations. In brief, we find evidence for a relationship between DEE and BMR to be weak or lacking in birds but strong in mammals. We hypothesize that the correlation between DEE and BMR in mammals results from correlated variation in metabolic intensity of tissues rather than in the proportion of metabolically
This content downloaded from 129.125.148.19 on Mon, 12 Nov 2018 12:34:44 UTCAll use subject to https://about.jstor.org/terms

BASAL METABOLISM AND DAILY ENERGY EXPENDITURE 1051
active tissues. We suggest that the corrplation coefficients relating DEE and BMR do not allow one to distinguish between the hypotheses rACT BMR = 0 and rDEE BMR - 0, and that the apparent absence of a DEE-BMR correlation in birds is not likely the result of its being obscured by measurement error, high and variable safety margins, or lack of variation among species. Our analysis considers varia- tion only among species; patterns of variation among populations within species, among individuals within populations, or among taxa above the species level might differ.
THE CORRELATION BETWEEN DEE AND BMR
BMR and Activity Metabolism
In this discussion, we use both untransformed and log10-transformed variables, and original variables and their residuals. We adopt the following conventions: names of log-transformed variables are truncated, and names of variables denot- ing residuals are written in lowercase. Thus:
BMR, ACT, DEE Acronyms for the metabolic expressions considered in this study (basal metabolic rate, metabolic expenditure for activity, daily energy expenditure [including measure- ments of field metabolic rate, FMR])
BMR, ACT, DEE Untransformed variables; ACT = DEE - BMR B, A, D Log10-transformed variables; for example, B =
log 1o(BMR) b, a, d Residuals of log10-transformed variables, which are devia-
tions from log-log regressions of the variables on body mass
bmr, act, dee Untransformed variables calculated from residuals; for
example, bmr = antilogl0(b)
In addition, MASS and M represent the untransformed and log10-transformed values of body mass; coefficients in regression equations are represented by
Greek letters; Vx represents the variance of variable X, sx its standard deviation, and COVxy and rxy the covariance and correlation between variables X and Y. Finally, phylogenetically independent contrasts for any of these variables are presented in boldface type.
To analyze the relationship between DEE and BMR, the allometric (log-log) regressions of both variables on body mass were determined (Daan et al. 1990, 1991; Koteja 1991), and then the correlation between the residuals of individual
measurements from each of these regressions was calculated. Thus, predicted
values of B and D are given by B = ot + OM and D = 4 + OM, and the residuals are
b = B - ot - OM (1)
and
d = D - 4 - OM. (2)
This content downloaded from 129.125.148.19 on Mon, 12 Nov 2018 12:34:44 UTCAll use subject to https://about.jstor.org/terms

1052 THE AMERICAN NATURALIST
When DEE is thought of as the sum of BMR and an additional increment of metabolism resulting from various activities (ACT) (the partitioned pathways
model),
d = loglo(BMR + ACT)--OM. (3)
Differentiating the equations for b and d with respect to BMR, one obtains
db 1
dBMR BMR loglo(e) (4)
and
dd 1
dBMR (BMR + ACT)log10(e) (5)
Therefore,
dd BMR (6) db BMR + ACT(
Thus, under the hypothesis rACT.BMR = 0, variation only in BMR would produce a fortuitous correlation between the residuals of the log-transformed values of DEE and BMR (d and b); the slope of the relationship between d and b would be BMR/(BMR + ACT). Because DEE is typically about three to four times BMR, this relationship would have a slope between 0.25 and 0.33, which would then be the appropriate null model against which to compare the relationship between d and b. In contrast, variation only in ACT would produce no fortuitous correlation between the residuals of DEE and BMR, by similar reasoning because the deriva- tive of a (i.e., residual log10 [ACT]) with respect to BMR is zero. In another study (Daan et al. 1991), d and b were related with a slope of 0.48 ( + 0.20 SE), which did not differ significantly from a slope of 0.25-0.33 but did differ at the P = .05 level from a slope of zero. The DEE-BMR relationship obtained earlier (Daan et al. 1991) for mammals also had a slope of approximately 0.50. Koteja (1991) did not report the slope of this relationship for mammals, but from his figure 2 it would appear to be close to unity. Clearly, the statistical significance and biological interpretation of the DEE-BMR relationships among birds and, perhaps, among mammals may depend on which null model is adopted.
The correlation between DEE and BMR under the partitioned pathways model
can be calculated in the following way. When DEE = BMR + ACT, the covari- ance between DEE and BMR is
COVDEE.BMR = COV(BMR+ACT).BMR (7a)
= COVBMR.BMR+BMR.ACT (7b)
= VBMR + CO VBMR ACT * (7C)
Because rDEE.BMR = COVDEE.BMR/(SDEESBMR), we can rewrite this equation as
VBMR + COVBMR.ACT rDEE BMR -=)
S DEE S BMR
This content downloaded from 129.125.148.19 on Mon, 12 Nov 2018 12:34:44 UTCAll use subject to https://about.jstor.org/terms

BASAL METABOLISM AND DAILY ENERGY EXPENDITURE 1053
TABLE 1
SIMULATED CORRELATIONS BETWEEN DAILY ENERGY EXPENDITURE AND BASAL METABOLIC RATE
Sb Sa Sbir Sact Sdee Sbmrlsdee rdee. bmr rdb
.10 .10 .244 .766 .808 .302 .322 .323 .10 .15 .242 1.159 1.186 .204 .214 .224 .10 .20 .236 1.839 1.860 .127 .150 .194 .15 .10 .373 .735 .830 .449 .465 .473 .15 .15 .382 1.208 1.268 .301 .303 .340 .15 .20 .382 1.726 1.753 .218 .179 .216 .20 .10 .525 .757 .908 .578 .553 .528 .20 .15 .545 1.191 1.310 .416 .416 .327 .20 .20 .523 1.676 1.751 .299 .288 .317
NOTE.-Assume dee = bmr + act; ractbmr =; act =3bmr; b = O Sb; a = 0.5 Sa (n= 1,000); s is the SD, and r is the correlation coefficient. See text for details of variables; single-letter variables are log transformed; three-letter variables are antilogs of log-transformed variables.
Noting that SACTrACT.BMR = COVACT.BMR/SBMR, we can then write
S BMR + S ACTrACT BMR (9) rDEE . BMR -
S DEE
Thus, when rACT.BMR = 0, the measured variables DEE and BMR will exhibit a correlation of rDEE.BMR = SBMR/SDEE. This is the appropriate null hypothesis for the partitioned pathways model.
Most analyses of the relationship between DEE and BMR are based on residu- als of log-transformed variables, and so the null hypothesis under the assumption DEE = BMR + ACT (i.e., rACT.BMR = 0) is rdb < Sb/Sd. This follows because,
owing to log transformation, SbISd > SBMR/SDEE; to the degree that DEE is approx- imately a multiple of BMR, SDEE iS increased by the same factor relative to sBMRI whereas Sd is not increased relative to Sb* In order to examine the likely range of rdb for realistic values of Sd and Sb' we performed simulations in which samples of values of a and b were generated as uncorrelated random normal deviates with means of 0.5 and 0 (thereby differing by a factor of 3.16) and standard deviations of Sa and Sb equal to 0.10, 0.15, or 0.20. Nine sets of 1,000 values were generated, one for each combination of values of Sa and Sb. These values were then used to calculate d, bmr, act, and dee, and the correlations rdee.bmr and rdb (table 1). Over the range of values used in the simulations, estimates of rdee.bmr and rdb were similar and varied between 0.15 and 0.55. Increasing the variance of b increased the correlation between DEE and BMR, while increasing the variance of a de- creased the correlation. In addition, the correlation varied inversely with the metabolic scope. For example, with the mean of b equal to zero (bmr = 1) and
Sa Sb = 0.10, as the mean of a increased from 0.3 (2BMR) to 0.5 (3BMR) and 0.7 (5BMR), simulated values of rdb decreased from 0.44 to 0.32 and 0.16. In this article, the appropriate null model under the assumption that DEE = BMR + ACT (i.e., no correlation between ACT and BMR) will be estimated by the ratio
Sbmr'Sdee -
The correlation between d and b provides limited inference about the relation-
This content downloaded from 129.125.148.19 on Mon, 12 Nov 2018 12:34:44 UTCAll use subject to https://about.jstor.org/terms

1054 THE AMERICAN NATURALIST
ship between metabolism in the active and resting states. When rdb significantly
exceeds SbmrrSdee, one may conclude that active and resting metabolism are corre- lated, but one cannot distinguish between the shared and partitioned pathways
models. When rdb exceeds 0 but not SbmrrSdee, one cannot conclude that active and resting metabolism are correlated because the partitioned pathways model may pertain. When rdb does not differ significantly from zero but is significantly
less than SbmrrSdee, one could plausibly conclude not only that active and resting metabolism were uncorrelated but that the partitioned pathways model did not apply. This conclusion would not be valid, however, when BMR and ACT were negatively correlated, for example, because of different relative sizes of organs that contributed differentially to BMR and ACT. The primary lesson to be gained from considering comparative analyses of BMR and DEE in this way is that correlations can provide relatively little information about the relationship be- tween active and resting metabolism but can help focus other kinds of investiga- tions into metabolic processes.
- DATA ANALYSES
Metabolic Relationships in Birds
Previous studies (Daan et al. 1990, 1991) tabulated metabolic data for 28 species of birds. All the values for DEE were based on doubly labeled water estimates of energy expenditure of free-living adults feeding large chicks. Such values are presumed to represent maximum sustainable levels of energy expenditure, but this has not been independently verified. The allometric relationships of B, A, and D to body mass (M) were linear (quadratic terms insignificant) and produced the following regressions, based on log 0-transformed values and measurements in watts (W) and grams (g):
B = -1.379 (0.055 SE) + 0.682 (0.022 SE) M, (10)
D = - 0.796 (0.060 SE) + 0.659 (0.024 SE) M, (11)
and
A = -0.926 (? 0.079 SE) + 0.646 (? 0.032 SE) M (12)
(for eq. [10], F = 952, df = 1,26, P < .0001, r2 = 0.973, Sb = 0.109; for eq. [11], F = 733, df = 1,26, P < .0001, r2 = 0.966, Sb = 0.121; for eq. [12], F - 408, df = 1,26, P < .0001, r2 = 0.940, Sb = 0.159). In this analysis, rab = 0.201 (P = .31) and rdb = 0.447 (P = .017). The degrees of freedom used to calculate statistical probabilities of correlations between residuals were not reduced by the degrees of freedom used in the calculations of residuals from allometric regres- sions, and so P values for correlation coefficients should be interpreted conserva- tively. Even if one accepts that rdb > 0, whether this result supports a relationship between activity metabolism and basal metabolism depends on whether the ap- propriate null hypothesis is closer to rab = 0 or to rdb = 0. To calculate the expected correlation between d and b under the first hypothesis, we calculated dee and bmr from an ANCOVA of D and B as a function of M assuming parallel
This content downloaded from 129.125.148.19 on Mon, 12 Nov 2018 12:34:44 UTCAll use subject to https://about.jstor.org/terms

BASAL METABOLISM AND DAILY ENERGY EXPENDITURE 1055
slopes (interaction F = 0.5, df = 1,948, P = .5) and assuming the residuals of B to have a mean of zero. The common slope of the allometric regression was 0.670
(+0.016 SE), and the mean value of d was elevated 0.529 log10 units above that of b. The standard deviations of the antilogs were Sbmr = 0.243 and Sdee = 0.940. Thus, according to the null hypothesis rab = 0, we estimated rdb = 0.243/0.940 = 0.26, from which the observed value of rdb does not differ significantly. There-
fore, the bird data are marginally supportive of a relationship between DEE and BMR in a shared pathways model but not in a partitioned pathways model, in which DEE = BMR + ACT.
Analysis of Phylogenetically Independent Contrasts
The metabolic data available for birds are not widely representative and include
several pairs of close relatives (congeners). Phylogenetic relationships of these species based on the DNA hybridization studies of Sibley and Ahlquist (1990) are depicted in figure 1. Within this diagram, species with, for example, high residuals of BMR (b > 0.05) appear to be clustered (regressions not shown).
Phylogenetic effects can be removed from correlations among taxa by calculat- ing phylogenetically independent contrasts, provided that the evolutionary model is correctly specified and that the phylogeny is known without error (Felsenstein 1985; Garland et al. 1992). In this analysis, contrasts were calculated by the phenotypic diversity analysis programs software described by Garland et al.
(1993). Within-genus contrasts were deleted from the analysis because we had to arbitrarily set branch lengths for three of four of these (Sibley and Ahlquist [1990] did not include both members of these pairs in their analysis), and two of these (Hirundo and Pygoscelis) produced conspicuous outlier values for standardized contrasts owing to their having been standardized by small branch lengths. Thus, the total data set consisted of 23 (i.e., n - 1) independent contrasts. Following Garland et al. (1992), we determined that the absolute values of the standardized contrasts for mass and metabolic variables were uncorrelated with their standard deviations (square roots of the sums of the branch lengths) (r, -0.15 to - 0.33; P, .12-.48). Thus, the branch lengths obtained from the phylogeny of Sibley and Ahlquist (1990) exhibit statistical adequacy.
The allometric relationships among positivized contrasts were similar to those
for the original measurement variables (fig. 2; table 2). Residuals b, a, and d were calculated based on the regressions of contrasts of B, A, and D on body mass M (see fig. 2). For these data, rab = 0.06 (P = .78) and rdb = 0.34 (P = .12) (fig. 3). The latter value does not differ significantly from the correlation coefficient of 0.45 obtained elsewhere (Daan et al. 1991). The phylogenetic contrasts are not inconsistent with either null hypothesis (rab = 0 or rdb = 0) and fail to support the idea that metabolic expenditures for parental activity are correlated with basal metabolic rates.
Metabolic Relationships among Mammals
We tabulated DEE and BMR for 33 species of mammals; the data were obtained from previous studies (Daan et al. 1991; Koteja 1991; Karasov 1992). Metabolic rates were allometrically related to body mass with slopes of 0.78 (BMR), 0.72
This content downloaded from 129.125.148.19 on Mon, 12 Nov 2018 12:34:44 UTCAll use subject to https://about.jstor.org/terms

1056 THE AMERICAN NATURALIST
ATH50 (0C)
25 20 15 10 5 0 Genera I , ., , I I
MF Melanerpes
MV 0 Merops
UL * Uria CG * Cepphus
N AE * Aethia RT * Rissa
C - FT 0 Fako -A EC 0 Eudyptes
D p x ~~~~~~PA Pygoscelis PP * Pygoscelis AP Aptenodytes
H IM 00 Oceanites OL Oceanodroma
r PG * Pelecanoides B K Ly PU * Pelecanoldes
IQ MG Macronectes _ L t PF 0 Puffinus
DE Diomedea Di 0 Diomedea
CC Cinclus == OE * Oenanthe
SV * Sturnus
PM Parus E
G RR Riparia U z HR Hirundo
F V HT 0 Hlrundo DU Delichon
PS Passerculus
FIG. 1 -Phylogeny of avian species included in an earlier analysis (Daan et al. 1991), according to the DNA hybridization studies of Sibley and Ahlquist (1990). The scale repre- sents the difference between the melting point temperatures of the DNA hybrids formed within taxa and those formed between taxa in opposite branches derived from a node. These branch lengths were used to compute Felsenstein's (1985) independent contrasts. Open circles indicate species with low residuals of BMR (b < -0.05); solid circles, species with high residuals (b > 0.05) (log-log regressions not shown).
(DEE), and 0.68 (ACT) (table 3). Residuals d and a were strongly correlated with b (rab = 0.60, rdb = 0.75), with regression slopes not differing from unity (table 4).
In an ANCOVA, D and B had parallel regression slopes (interaction F = 2.3, df = 1,62, P = .13), with respect to an M of 0.714 (?+-0.023 SE). The intercept of D exceeded that of B by 0.464. We calculated the antilogs of b and d adjusted to means of 0.0 and 0.464, respectively, which yielded values of Sbmr = 0.50 and
This content downloaded from 129.125.148.19 on Mon, 12 Nov 2018 12:34:44 UTCAll use subject to https://about.jstor.org/terms

BASAL METABOLISM AND DAILY ENERGY EXPENDITURE 1057
BMR DEE K ACT //
0.3 -RR H/
0.2 /
0 . 1 To L C VD/ fr L
0.0 0.2 0.4 0.6 0.0 0.2 0.4 0.6 0.0 0.2 0.4 0.6
Mass contrast
FIG. 2.-The relationships of standardized phylogenetically independent contrasts for
three measures of metabolism to phylogenetic contrasts for body mass in birds. Letters refer
to the nodes in fig. 1.
TABLE 2
REGRESSIONS OF PHYLOGENETICALLY INDEPENDENT CONTRASTS
FOR METABOLIC RATES ON CONTRASTS FOR MASS
AMONG BIRDS (N = 23 CONTRASTS)
Measurement F p SEP r2
Basal metabolic rate 420 .680 .033 .95 Daily energy expenditure 308 .650 .037 .93 Activity (DEE - BMR) 168 .636 .049 .88
NOTE.-Values were log transformed prior to analysis; all regres- sions significant at P < .0001; I is the slope of the least-squares
linear regression of the metabolic measurement on body mass; SEP is the SE of the slope.
Sdee = 1.36. The ratio of these values, 0.37, estimates rdb under the hypothesis that rab = 0. Thus, for the mammal data, one may clearly reject both rab = 0 and rdb = 0 and conclude that metabolic expenditures associated with activity are positively correlated with BMR.
Because no phylogeny comparable to that of Sibley and Ahlquist (1990) for birds exists for mammals, we constructed a phylogenetic tree from the hierarchi- cal classification of mammals in Wilson and Reeder (1993), based on subclass, order, family, subfamily, genus, and species, with additional information from several phylogenetic analyses included to resolve polytomies (fig. 4). We report the results for phylogenetically independent contrasts, assuming a gradual model of evolution and with contrasts standardized by the square root of the branch lengths shown in figure 4.
Regressions of the phylogenetic contrasts of the metabolic variables B, D, and A on mass M were highly significant with allometric slopes of 0.76, 0.72, and 0.71, respectively (table 5). The residuals from these regressions were highly correlated (rdb = 0.86, rab = 0.77), and the regression slope of d on b was 1.23 (table 5; fig. 5). Analyses assuming punctuated evolution, or either gradual or
This content downloaded from 129.125.148.19 on Mon, 12 Nov 2018 12:34:44 UTCAll use subject to https://about.jstor.org/terms

0.10
DEE o 10 ACT L
8n L T -0.05 T R 0 R
A M.05 --F A R 8 MV K
-01 D00 0.0 00 0.10 -00 .0 00
- 0R00 D fc D v E
Z c E~~ ~ -0.05 - s H -0.05 S J ( c
-0.10
-0.10 -0.05 0.00 0.05 -0.10 -0.05 0.00 0.05
Residuals of BMR contrasts
FIG. 3.-The relationships between the residuals with respect to body mass contrasts for daily energy expenditure (DEE) contrasts and activity energy expenditure (ACT) contrasts and the residuals for basal metabolic rate (BMR) contrasts in birds. Letters refer to the
nodes in fig. 1.
TABLE 3
REGRESSIONS OF LOG 0-TRANSFORMED METABOLIC VARIABLES (W) ON BODY MASS (kg) AMONG MAMMALS (N = 33)
Variable F r2 RMSE (x SEO SE
B 678 .96 .16 2.43 .04 .75 .03 D 382 .93 .20 2.82 .05 .68 .04 A 206 .87 .25 2.57 .06 .68 .04
NOTE. -B and A are log-transformed basal and active metabolism; D is log-transformed daily energy expenditure. Body mass was log transformed to calculate the regressions. All regressions are signifi- cant at P < .0001; RMSE, square root of the residual mean square error; ox, intercept of regression; , slope of regression.
TABLE 4
REGRESSION SLOPES OF METABOLIC VARIABLES D AND A ON B
IN MAMMALS (N = 33)
Variable F r2 SEP
d 41 .569 .906 .142 a 17 .355 .911 .220
NOTE.-d is the residual of log-transformed daily energy expendi- ture from its regression on log-transformed body mass; a is the residual of log-transformed activity metabolism. All regressions are significant at P < .0001.
This content downloaded from 129.125.148.19 on Mon, 12 Nov 2018 12:34:44 UTCAll use subject to https://about.jstor.org/terms

BASAL METABOLISM AND DAILY ENERGY EXPENDITURE 1059
Taxonomic distinction
8 7 6 SC 0 F SF G S Species -J L I I I - I ---
la^, Gymnobelus leadbeaterl JG ~ Petaurus breviceps
Phascolarctos dnereus
Bradypus varlegatus
Pipistrellus pipistrellus r Eptescicus fuscus
- IM Myotis lucifugus
A D Plecotis auritus Allouatta palilata
Odocolleus hemlonus (female)
B s Ammospermophilus leucurus B ; Spermophilus saturatus K " Spermophilus parryae
Tamias striatus H N Marmota tlaviventris
Thomomys bottae Perognathus formosus
CDiT Dipodomys merriami Dipodomys microps
F Arvicola terrestris U Microtus californicus
zi Microtis agrestris 0 Mlcrotis arvalls
Clethrlonomys rutilus Clethrlonomys glareolus
E J Acomys cahirinus v Acomys russatus
Mus musculus Peromyscus maniculatus
L Peromyscus leucopus Peromyscus crinitus Sekeetamys calurus
Lepus californicus
FIG. 4.-Phylogeny of 33 species of mammals in the data set used in the present analysis. Phylogeny based on hierarchical classification in Wilson and Reeder (1993); SC, subclass; 0, order; F, family; SF, subfamily; G, genus; S, species. Additional phylogenetic information was obtained from Hall and Kelson (1959; node X), Novacek (1990; nodes C, D, and E), and Catzeflis et al. (1993; node J). In addition, keys in Hall and Kelson (1959) were used to resolve H/I, K/N, M/R/W, and Z1/Z5.
punctuated evolution without standardization of contrasts by branch length, pro- duced similar results, as did the use of major-axis rather than least-squares regres- sion to calculate residuals (LaBarbera 1989). Thus, the relationship between DEE and BMR-statistically nonsignificant in birds-appears to be very robust in mammals.
DISCUSSION
Our analyses failed to detect a relationship between basal metabolism (BMR) and metabolic expenditure for activity (DEE or ACT) within a sample of 28
This content downloaded from 129.125.148.19 on Mon, 12 Nov 2018 12:34:44 UTCAll use subject to https://about.jstor.org/terms
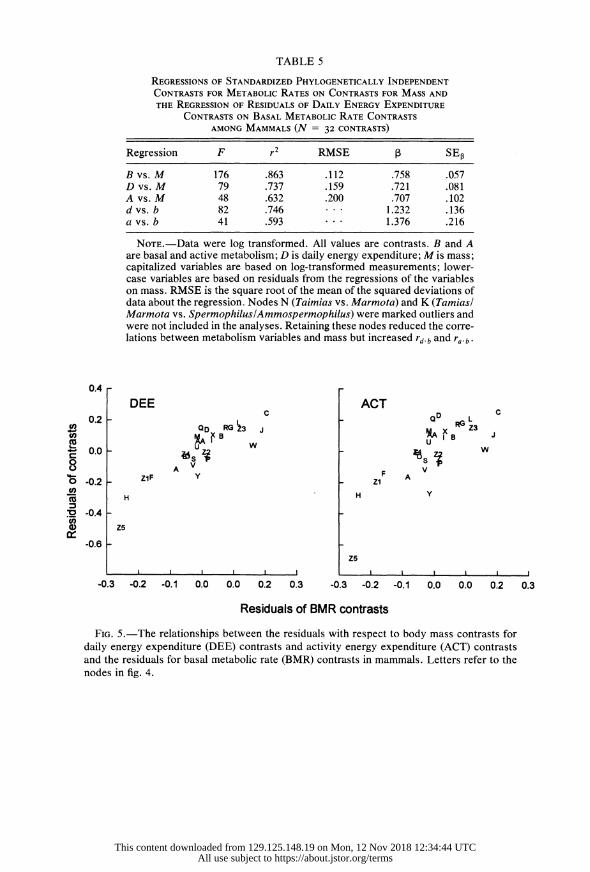
TABLE 5
REGRESSIONS OF STANDARDIZED PHYLOGENETICALLY INDEPENDENT
CONTRASTS FOR METABOLIC RATES ON CONTRASTS FOR MASS AND
THE REGRESSION OF RESIDUALS OF DAILY ENERGY EXPENDITURE
CONTRASTS ON BASAL METABOLIC RATE CONTRASTS
AMONG MAMMALS (N = 32 CONTRASTS)
Regression F r RMSE SE
B vs. M 176 .863 .112 .758 .057 D vs. M 79 .737 .159 .721 .081 A vs. M 48 .632 .200 .707 .102 d vs. b 82 .746 1.232 .136 a vs. b 41 .593 * 1.376 .216
NOTE.-Data were log transformed. All values are contrasts. B and A are basal and active metabolism; D is daily energy expenditure; M is mass; capitalized variables are based on log-transformed measurements; lower- case variables are based on residuals from the regressions of the variables on mass. RMSE is the square root of the mean of the squared deviations of data about the regression. Nodes N (Taimias vs. Marmota) and K (Tamiasl Marmota vs. SpermophiluslAmmospermophilus) were marked outliers and were not included in the analyses. Retaining these nodes reduced the corre- lations between metabolism variables and mass but increased rd.b and ra.b.
0.4
DEE ACT
0.2 C QD RG L QD RG ~3 j ~AB Z3
0.0 U W w
8 A ZV 4-0. ZJF y F A Ho H y
2-0.4-
a) Z5
-0.6 -
Zs
I~~~~ ~ ~ l l l I .I -0.3 -0.2 -0.1 0.0 0.0 0.2 0.3 -0.3 -0.2 -0.1 0.0 0.0 0.2 0.3
Residuals of BMR contrasts
FIG. 5.-The relationships between the residuals with respect to-body mass contrasts for daily energy expenditure (DEE) contrasts and activity energy expenditure (ACT) contrasts and the residuals for basal metabolic rate (BMR) contrasts in mammals. Letters refer to the nodes in fig. 4.
This content downloaded from 129.125.148.19 on Mon, 12 Nov 2018 12:34:44 UTCAll use subject to https://about.jstor.org/terms
BASAL METABOLISM AND DAILY ENERGY EXPENDITURE 1061
species of birds, but they revealed 4 very strong relationship between these vari- ables in a sample of 33 species of mammals. These results have important implica- tions for comprehending the physiology of basal metabolism and for interpreting
patterns of variation in basal metabolism among taxa. They also raise the issue of whether there may be fundamental differences in energetic physiology between birds and mammals.
Fortuitous Correlation between DEE and BMR
Each organism may be thought of as having a "metabolic" mass primarily
responsible for the production of BMR and DEE. Accordingly, correlations be-
tween the residuals of DEE and BMR may result either from correlated variation
in the mass-specific levels (metabolic intensity) of BMR and DEE, from variation in the proportion of metabolically active tissue in the body, or from both. In
the second case, the correlation may arise independently of any physiological relationship between basal and active metabolism. For example, one would ex-
pect that fatter individuals would have lower residuals of both BMR and DEE from metabolism-body mass regressions than leaner individuals. Differences in the proportions of other metabolically less active tissues, such as bone, fur, and feathers, will have the same effect of creating a correlation between residuals of BMR and DEE. Unfortunately, too few data are available for species that have also been subjected to metabolic studies to estimate the magnitude of this effect. The correlations between the residuals of DEE and BMR obtained in this study for mammals would require variation in the proportion of a metabolically inert component equivalent to a standard deviation of 0.1 log10 units, or a coefficient of variation of about 25%. We think it is unlikely that variation of anywhere near this magnitude exists in our data set. However, although it would seem that the DEE-BMR correlation results from correlation in the metabolic intensity of BMR and DEE in certain tissues rather than the proportions of tissues having higher or lower metabolic intensity, the latter possibility should be investigated directly.
Measurement Error
Our analysis may have lacked sufficient power to resolve a relationship be- tween DEE and BMR in birds. Measurement of BMR and, especially, DEE is subject to considerable error and perhaps variation between studies, which could obscure any relationship between the two (Riska 1991). In addition, when one includes values of BMR and DEE from different studies, different metabolic states of the subjects (Bennett 1987; Hayes and Chappell 1990) may reduce the correlation between these variables. In an attempt to circumvent this latter prob- lem, Koteja (1991) analyzed a subset of data for reproducing birds in which both BMR and DEE were measured in the same study (n = 15), but these did not significantly improve the relationship between d and b (r = 0.44, P = .10; not significantly different from the correlation within the larger sample).
We examine the influence of measurement error and individual variation on the correlation between two variables in greater detail in the appendix and con- clude that such factors are not responsible for the differences observed between birds and mammals.
This content downloaded from 129.125.148.19 on Mon, 12 Nov 2018 12:34:44 UTCAll use subject to https://about.jstor.org/terms
1062 THE AMERICAN NATURALIST
Phylogenetic Contrasts
The application of phylogenetic contrasts in this study had no influence on the qualitative results and little effect on the values of the correlations themselves.
For the allometric relationship of BMR and DEE to body mass, the pairs of values for birds were r M = 0.97, r M = 0.95, r M = 0.97, r M = 0.93; for mammals, they were 0.96, 0.86, 0.93, and 0.74 (values for contrasts indicated in
boldface). The corresponding values for the slopes of the regressions were 0.68, 0.69, 0.66, 0.64, and 0.75, 0.76, 0.68, and 0.72. For the correlations between the
residuals of DEE and BMR (rdb, rdb), these were 0.45, 0.36, 0.75, and 0.86 for birds and mammals, respectively. Thus, phylogenetically structured data and phylogenetically independent contrasts reveal similar patterns of covariation be- tween traits (see also Walton 1993).
BMR and Metabolic Expenditures for Activity
Two contrasting hypotheses concerning BMR and DEE differ according to whether the metabolic processes resulting in the elevation of DEE over BMR
replace (shared pathways model) or add to (partitioned pathways model) those resulting in BMR. The first would apply when the entire metabolic machinery of the organism comes under the control of the activity of the moment; the second applies when metabolism is partitioned into a basal component that runs continu- ously and various other components that run intermittently during periods of activity. According to the shared pathways model, the appropriate null hypothesis is rdb = 0; according to the partitioned pathways model, it is rab = 0. The data available for birds allow one to accept either null hypothesis; those for mammals clearly reject both null hypotheses. Thus, our analysis strongly suggests that there is a fundamental difference in the energetic physiology of birds and mammals.
Daily energy expenditure and BMR ought to be correlated when BMR is related to the capacity of the organism to metabolize energy at a sustained rate. In this case, BMR is the metabolic requirement of maintaining tissues and organs either involved in or in support of the higher level of metabolic work, whether these comprise the digestive organs, which make energy available to the organism; the heart, liver, kidneys, and other organs that take care of transport, various biochemical transformations, and excretion of waste products; or the effector organs, principally skeletal muscles, that are directly involved in activity and are responsible for much of the daily energy expenditure of active organisms (cf. the aerobic capacity model for the evolution of endothermy; e.g., Bennett and Ruben 1979; Taigen 1983; Hayes and Garland 1995; Ruben 1995).
Some components of BMR clearly are replaced by DEE and thus have no independent meaning in the active organism. For example, circulation of blood requires activity by the heart muscle, albeit at different levels, in the resting and active states. Other components of BMR may be shut down during activity. For example, in birds ventilation by the lungs in the resting organism is accomplished by thoracic muscles, whereas during flight ventilation is accomplished by the powerful contractions of the pectoral muscle's (Butler et al. 1977; Butler 1981). It is also possible that certain maintenance activities-such as production of blood
This content downloaded from 129.125.148.19 on Mon, 12 Nov 2018 12:34:44 UTCAll use subject to https://about.jstor.org/terms

BASAL METABOLISM AND DAILY ENERGY EXPENDITURE 1063
cells, production of antibodies, proliferation of crypt cells in the intestine, DNA repair, and protein turnover-occur primarily during the resting phase and are shut down during periods of activity. Finally, a third set of components of BMR
may persist relatively unaltered during activity. For example, a large part of BMR is devoted to maintaining ion gradients and electrical potentials in tissues of the body that must continue during periods of rest and activity alike. Thus, there appears to be good reason to believe that BMR and ACT are partly structurally independent and that the appropriate null model for testing the relationship be- tween metabolic expenditures during rest and activity lies between rab = 0 and
rdb = 0 Basal metabolic rate and sustained metabolic activity need not be correlated if
BMR is related to the maximum short-term energy expenditure of the individual rather than its sustained metabolic capacity. Because organisms do not use their full metabolic capacity most of the time, which in birds may be 8-15 times BMR during flight (Torre-Bueno 1978), DEE may be inappropriate for testing a relation- ship between BMR and metabolic capacity. Although DEE and maximum short- term energy expenditure in activity might be correlated, any relationship between these two measures would be obscured by variation in the time-activity budgets of organisms. In this event, the postulated relationship between BMR and activity might be correct, while measurements of DEE use an unsuitable time frame for detecting this relationship, particularly in birds. In this case, metabolic rate during short periods of intense activity may provide an appropriate basis for comparison. An analysis by Koteja (1987) failed to find such a relationship, however. Koteja examined the relationship between BMR and maximum short-term metabolic rate during exercise (EM) in 18 species of mammal. He removed the influence of body size by examining the residuals of the logarithms of BMR and EM from the regression of each of these quantities on the logarithm of body mass. In Koteja's study, the correlation between the residuals of EM and BMR (r = -0.14) did not differ significantly from zero (P > .5).
Over broad taxonomic comparisons, for example, between mammals and rep- tiles, BMR and DEE clearly are related (Bennett and Ruben 1979; Hulbert and Else 1981; Pough 1983; Taigen 1983; Karasov and Diamond 1985), as they were among mammals in this study. The pathways of causation are, however, less apparent. In the transitions from reptiles to mammals and birds, striking increases in metabolic rate were achieved by increases in aerobic capacities (Bennett and Ruben 1979; Else and Hulbert 1985; Hulbert and Else 1989). Differences among birds or mammals are smaller and more difficult to characterize by correlation analysis. It has been shown (Daan et al. 1990) that BMR is statistically related to the relative sizes of the heart and kidney in birds. Nevertheless, these organs are so small (3%-5% and 2%-4%, respectively, of lean dry body mass) that, in spite of their high metabolic activity (Field et al. 1939; Martin and Fuhrman 1955; Scott and Evans 1992), variation in the size of these organs alone cannot likely account for the observed variation in BMR among species. McNab (1994) related the low BMR of flightless birds to the reduced size of the flight muscles, even though "basal" metabolic rates of muscle tissue, measured from tissue slices, are much lower than those of brain and visceral tissues (e.g., Scott and Evans
This content downloaded from 129.125.148.19 on Mon, 12 Nov 2018 12:34:44 UTCAll use subject to https://about.jstor.org/terms

1064 THE AMERICAN NATURALIST
1992). Thus, it would appear that the relative sizes of these organs belong to a
suite of characteristics associated with differences in BMR. Furthermore, this variation evidently results from differences in the intensity of metabolism (W g-1) rather than the relative sizes of organs having high basal metabolic rates. We cannot determine whether this suite of characters is associated with long-term sustained levels of activity or with maintaining a capacity for shorter periods of intense activity.
The idea of a close relationship between sustained and basal metabolic rates appears to be true for mammals but not for birds, although phenotypic responses in maximum cold-induced metabolism apparently are paralleled by changes in BMR in birds (e.g., Dawson et al. 1983). Possibly, mammals exhibit greater physi- ological variation than do birds (e.g., McNab 1986, 1988a, 1988b; Bennett and Harvey 1988), which makes it easier to detect a relationship between DEE and BMR statistically. When metabolism is adjusted for body mass, values vary al- most twice as much among species of mammals as they do among species of birds. Nonetheless, our analysis of error variation suggests that because the relationship between DEE and BMR is so strong in mammals, it seems unlikely that its ab- sence in birds results from a lack of adequate variation.
Alternatively, birds and mammals may differ in some fundamental physiologi- cal attribute that affects the relationship between DEE and BMR. An obvious one is that the energy delivered to young mammals (embryonic nutrition and lactation) is produced by the metabolic activity of the mother; indeed, the rate of energy metabolism during lactation may be the maximum metabolic capacity of the adult. This factor could result in a closer coupling of DEE and BMR than one observes in birds. Accordingly, one would expect the metabolic expenditures (DEE) of birds to be lower on average and more variable than in mammals be- cause DEE of birds would be limited by factors other than metabolic capacity. However, neither is true. In addition, if BMR were adjusted with respect to DEE, then one would expect a parallel relationship between the two measures regardless of their absolute values.
Comparing D and B with M as a covariate, ANCOVAs revealed that the slopes of the two regressions did not differ in either mammals (interaction F = 2.3, df = 1,64, P = .13) or birds (interaction F = 0.5, df = 1,52, P = .47), with common slopes of 0.748 (?+ 0.047 SE) and 0.673 (?+-0.033 SE), respectively. The standard deviations of observations about the regression lines were greater in
mammals (0.194 logl0 units) than in birds (0.119); the elevations of DEE above BMR in mammals (0.461 + 0.047 SE; factor of 2.89) and birds (0.530 ? 0.033 SE; factor of 3.39) did not differ significantly (standard errors overlap). Further- more, the logarithm of the ratio of DEE to BMR was slightly higher and slightly less variable in birds than it was in mammals (table 6). Thus, these data do not support the idea that mammals work closer to their metabolic capacities than do birds, on average, although metabolic capacity is not precisely defined, nor is it known how well it is measured by DEE. In addition, recent work on effects of the combined metabolic stresses of lactation and cold on laboratory mice has demonstrated that metabolic outputs in response to each of these stresses are additive rather than complementary and that each of these stresses increases the
This content downloaded from 129.125.148.19 on Mon, 12 Nov 2018 12:34:44 UTCAll use subject to https://about.jstor.org/terms

BASAL METABOLISM AND DAILY ENERGY EXPENDITURE 1065
)TABLE 6
STATISTICS OF THE DISTRIBUTION OF 1og1o (deelbmr) IN BIRDS AND MAMMALS
Antilog10 Antilog10 Antilog10 Taxon n Minimum of Minimum Maximum of Maximum Mean of Mean SD
Mammal 34 .214 1.64 .829 6.75 .461 2.89 .145 Bird 28 .277 1.89 .748 5.60 .535 3.43 .117
NOTE.-Mean values (0.461 and 0.535) differ: ANOVA F = 4.8, df = 1,60, P = .03; Wilcoxon Z = 2.2, P = .03; Kruskal-Wallis X2 = 4.7, P = .03.
ratio of DEE to BMR (Hammond and Diamond 1994; Hammond et al. 1994). In these studies, energy expenditure appears to be limited by the tissues that pro- duce metabolic demand rather than by the acquisition of energy by the organism, and DEE and BMR are at least partially decoupled (see also McDevitt and Speakman 1994a, 1994b).
Another explanation for the presence of a DEE/BMR correlation in mammals and its absence in birds would be that BMR parallels the maximum power output of the individual rather than its sustained output and that birds are more variable than mammals in the proportion of DEE contributed by periods of maximum power output. If this were true, one would expect the ratio of DEE to BMR to be more variable in birds than in mammals. In fact, however, the opposite is true: the standard deviation of D - B is 0.117 for birds and 0.145 for mammals (table 6).
CONCLUSIONS
Although the different relationships of sustained metabolic expenditure to basal metabolic rates in mammals and birds add what may be an important observation to the phenomenology of metabolism, fundamental understanding of the nature of basal metabolism and its relationship to daily energy expenditure continues to be elusive. Where should we go from here? Additional correlational studies are unlikely to help without specific, detailed hypotheses and accompanying experi- mental studies of energetics on the tissue level as well as on the organism level. Studies by Hayes (1989), Hulbert and Else (1989), Joos and John-Alder (1990), and Walton (1993) provide models for such work. Lindstrom and Kvist (1995) have examined the relationship between BMR and the food-processing capacity of the gut by measuring maximum gross energy intake rates (GEIR) during premi- gratory fattening in passerine birds. These rates were higher (5.4BMR) than val- ues of DEE typical of birds feeding large offspring (3.4BMR) (table 6). The cor- relation between GEIR and BMR, based on an analysis of residuals of 22 species, was 0.43 (P = .024), which was close to the DEE/BMR correlation re- ported elsewhere (Daan et al. 1990). Presumably, GEIR measures gut func- tion rather than energy expenditure, and so the appropriate null model is rGEIR. BMR - 0.
Broad comparisons indicate that the reptile-mammal transition was accompa-
This content downloaded from 129.125.148.19 on Mon, 12 Nov 2018 12:34:44 UTCAll use subject to https://about.jstor.org/terms

1066 THE AMERICAN NATURALIST
nied by an increase in aerobic capacity. Whether variation among birds and mam-
mals occurs along the same physiological dimension remains open to question, as does the relationship between aerobic capacity and BMR itself. Additional
understanding of cellular metabolic capacities at rest and under exercise will put us in a better position to formulate hypotheses and design experimental studies of organismal metabolism. Further analyses of the relationship between organismal metabolism and the relative proportions of body components, as made recently (Daan et al. 1990), will show whether variations in metabolism result from differ-
ences in proportions of metabolically active tissues or from differences in meta- bolic intensity of tissues. Experimental manipulation of metabolism may also provide opportunities to test the relationships between different components of metabolism, although such experiments also may produce spurious, uninterpret- able results. For example, chronic thyroxine release in field-active fence lizards (Sceloporus undulatus) elevated standard metabolic rates (i.e., BMR) by 59% without significantly increasing total daily metabolic rate (DEE) (Joos and John- Alder 1990). It would be interesting to determine whether the activity component of metabolism decreased in the experimental lizards (partitioned pathways model) or, alternatively, thyroxine causes the scaling up of metabolism in the same way that activity does (shared pathways model).
In the final analysis, we must also consider why it is that we care so much about BMR. Basal metabolism is convenient to measure, and values are available for hundreds of species of birds and mammals. Therefore, BMR provides us with a rich phenomenology. Perhaps-, however, BMR encompasses so many different processes that its components cannot be sorted out practically by comparative and experimental analyses of organismal function. If this were true, then such "higher-level" studies might best be used to point out interesting directions for reductionist work. The marked difference between the metabolic relationships within birds and mammals would seem to be a good starting point.
ACKNOWLEDGMENTS
The manuscript was greatly improved by comments and suggestions of T. Gar- land, Jr., R. E. Shea, G. H. Visser, W. W. Weathers, J. B. Williams, and several anonymous reviewers. R.E.R. was supported by National Science Foundation grant BSR-9007000.
APPENDIX
MEASUREMENT ERRORS
We assume that the observed value X of one variable is equal to its true value x plus some error mx. We suppose that x has variance uF2 and that mx has variance 2 . Similarly Y = y + my and y and my have variances uy and umyo, respectively. Now, the observed correlation between X and Y may be estimated by
PxY = Pxy (FA+ y (Al) [(ur + r2)(u2 + cr ) ]112
This content downloaded from 129.125.148.19 on Mon, 12 Nov 2018 12:34:44 UTCAll use subject to https://about.jstor.org/terms
BASAL METABOLISM AND DAILY ENERGY EXPENDITURE 1067
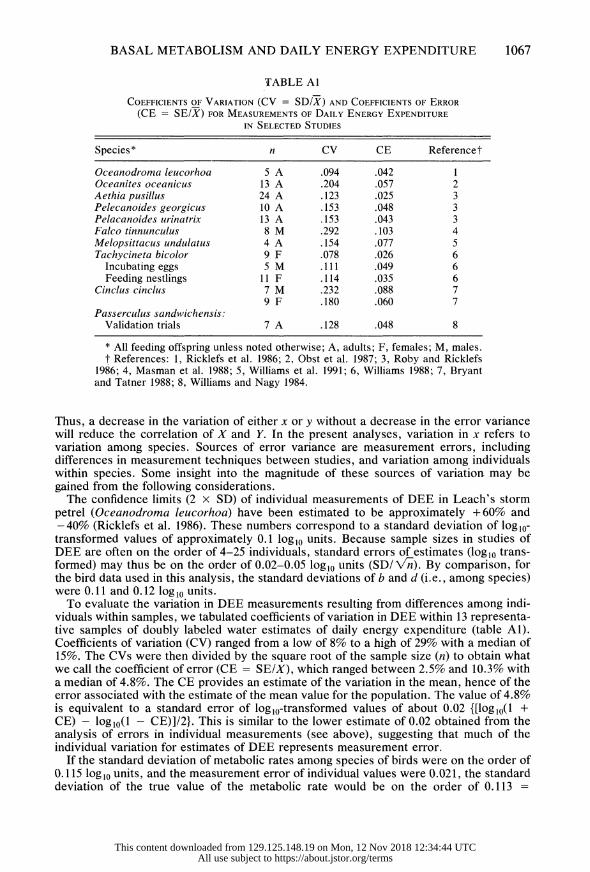
TABLE Al
COEFFICIENTS OF VARIATION (CV = SD/X) AND COEFFICIENTS OF ERROR (CE = SE/X) FOR MEASUREMENTS OF DAILY ENERGY EXPENDITURE
IN SELECTED STUDIES
Species* n CV CE Reference t
Oceanodroma leucorhoa 5 A .094 .042 1 Oceanites oceanicus 13 A .204 .057 2 Aethia pusillus 24 A .123 .025 3 Pelecanoides georgicus 10 A .153 .048 3 Pelacanoides urinatrix 13 A .153 .043 3 Falco tinnunculus 8 M .292 .103 4 Melopsittacus undulatus 4 A .154 .077 5 Tachycineta bicolor 9 F .078 .026 6 Incubating eggs 5 M .111 .049 6 Feeding nestlings 11 F .114 .035 6
Cinclus cinclus 7 M .232 .088 7 9 F .180 .060 7
Passerculus sandwichensis: Validation trials 7 A .128 .048 8
* All feeding offspring unless noted otherwise; A, adults; F, females; M, males. t References: 1, Ricklefs et al. 1986; 2, Obst et al. 1987; 3, Roby and Ricklefs
1986; 4, Masman et al. 1988; 5, Williams et al. 1991; 6, Williams 1988; 7, Bryant and Tatner 1988; 8, Williams and Nagy 1984.
Thus, a decrease in the variation of either x or y without a decrease in the error variance will reduce the correlation of X and Y. In the present analyses, variation in x refers to variation among species. Sources of error variance are measurement errors, including differences in measurement techniques between studies, and variation among individuals within species. Some insight into the magnitude of these sources of variation may be gained from the following considerations.
The confidence limits (2 x SD) of individual measurements of DEE in Leach's storm petrel (Oceanodroma leucorhoa) have been estimated to be approximately +60% and -40% (Ricklefs et al. 1986). These numbers correspond to a standard deviation of logl0- transformed values of approximately 0.1 log10 units. Because sample sizes in studies of DEE are often on the order of 4-25 individuals, standard errors of estimates (log10 trans- formed) may thus be on the order of 0.02-0.05 log10 units (SD/<V). By comparison, for the bird data used in this analysis, the standard deviations of b and d (i.e., among species) were 0.11 and 0.12 log10 units.
To evaluate the variation in DEE measurements resulting from differences among indi- viduals within samples, we tabulated coefficients of variation in DEE within 13 representa- tive samples of doubly labeled water estimates of daily energy expenditure (table Al). Coefficients of variation (CV) ranged from a low of 8% to a high of 29% with a median of 15%. The CVs were then divided by the square root of the sample size (n) to obtain what we call the coefficient of error (CE = SE/X), which ranged between 2.5% and 10.3% with a median of 4.8%. The CE provides an estimate of the variation in the mean, hence of the error associated with the estimate of the mean value for the population. The value of 4.8% is equivalent to a standard error of logl0-transformed values of about 0.02 {[logl0(1 + CE) - logl (1 - CE)]/2}. This is similar to the lower estimate of 0.02 obtained from the analysis of errors in individual measurements (see above), suggesting that much of the individual variation for estimates of DEE represents measurement error.
If the standard deviation of metabolic rates among species of birds were on the order of 0. 115 log10 units, and the measurement error of individual values were 0.021, the standard deviation of the true value of the metabolic rate would be on the order of 0.113 =
This content downloaded from 129.125.148.19 on Mon, 12 Nov 2018 12:34:44 UTCAll use subject to https://about.jstor.org/terms

1068 THE AMERICAN NATURALIST
A/0.1152 - 0.0212. Entering these values into the equation relating the observed and true correlations gives Pxy = 0.966 py. Even using the highest of the values of CE in table Al, PxY/Pxy = 0.85. Thus, it would seem that errors in the measurement of DEE or the estimate of its mean value in a population cannot account for the weak or absent correlation between DEE and BMR in birds.
In contrast to the effect that measurement error in BMR and DEE has in reducing their intercorrelation, error in measuring body mass M increases this correlation owing to its parallel effect on the residuals of BMR and DEE for each species. Values of B and D are measured with errors mB and mD, which are uncorrelated. Values of M are measured with error mM. When one adjusts B and D with respect to body mass, one adds error to b and d of the magnitude 1B.MmM and ,BD.MmM, respectively, where X is the slope of the regres- sion of B or D on M. The error terms fB.MmM and f3D.MmM are perfectly correlated and have a covariance equal to B.MfD.MUr2M. Now, if D and B have a true correlation PD.B and covariance PD.BUDUB, the observed correlation between d and b is
PDBUCDUCB + IBMIDMCFrM
[(rb FB + (rnB + I3BM(TnM)((UD + CrMD + I3DM(rFM)] (A2)
To gain some idea of the magnitude of this effect, let us assume CD, CB = 0.10, PDB = 0.5, nmD ' UnmB = 0.02, and PiDM, PiBM = 0.7. Now, for values of crM = 0.01, 0.02, 0.05, 0.10, 0.15, and 0.20, rdb = 0.483, 0.490, 0.536, 0.647, 0.748, and 0.820. In the last three cases, the observed values of Cd and gb were 0.124, 0.146, and 0.173. Thus, for
measurement error to seriously bias one's estimate of PDB, rn,M must be on the same order as cB and CD, in this example representing a CV in M of about 23%. In addition, for error in estimation of M to account for the higher values of rdb, Cd, and gb in mammals compared to birds, 0nM for mammals would have to exceed that for birds by 0.15-0.20.
To illustrate this point, let us assume that PDB = 0 and cB, CD (including error) = 0.08. In this case, 0mM = 0.10 would yield Cd, cb = 0.11 and rdb = 0.43, which resembles the values observed for birds, and rnM = 0.20 would yield Cd, crb = 0.16 and rdb = 0.75, which resembles the values observed for mammals. In our opinion, however, it is highly unlikely that errors in measuring metabolically active mass should be so large.
LITERATURE CITED
Bennett, A. F. 1987. Inter-individual variability: an underutilized resource. Pages 147-169 in M. E. Feder, A. F. Bennett, W. R. Burggren, and R. B. Huey, eds. New directions in ecological physiology. Cambridge University Press, Cambridge.
Bennett, A. F., and J. A. Ruben. 1979. Endothermy and activity in vertebrates. Science (Washington, D.C.) 206:649-654.
Bennett, P. M., and P. H. Harvey. 1988. Active and resting metabolism in birds: allometry, phylogeny and ecology. Journal of Zoology (London) 213:327-363.
Birt-Friesen, V. L., W. A. Montevecchi, D. K. Cairns, and S. A. Macko. 1989. Activity-specific metabolic rates of free-living northern gannets and other seabirds. Ecology 70:357-367.
Bryant, D. M., and P. Tatner. 1988. Energetics of the annual cycle of dippers Cinclus cinclus. Ibis 130:17-38.
1991. Intraspecies variation in avian energy expenditure: correlates and constraints. Ibis 133: 236-245.
Butler, P. J. 1981. Respiration during flight. Pages 155-164 in I. Hutas and L. A. Debreczeni, eds. Advances in physiological sciences. Vol. 10. Pergamon, Oxford.
Butler, P. J., N. H. West, and D. R. Jones. 1977. Respiratory and cardiovascular responses of the pigeon to sustained, level flight in a wind tunnel. Journal of Experimental Biology 71:7-26.
Catzeflis, F. M., A. W. Dickerman, J. Michaux, and J. A. W. Kirsch. 1993. DNA hybridization and rodent phylogeny. Pages, 159-172 in F. S. Szaay, M. J. Novacek, and M. C. McKenna, eds. Mammal phylogeny. Vol. 2. Placentals. Springer, Berlin.
This content downloaded from 129.125.148.19 on Mon, 12 Nov 2018 12:34:44 UTCAll use subject to https://about.jstor.org/terms

BASAL METABOLISM AND DAILY ENERGY EXPENDITURE 1069
Daan, S., D. Masman, and A. Groenewold.i 1990. Avian basal metabolic rates: their association
with body composition and energy expenditure in nature. American Journal of Physiology
(Regulatory, Integrative, and Comparative Physiology 28) 259:R333-R340.
Daan, S., D. Masman, A. M. Strijkstra, and G. J. Kenagy. 1991. Daily energy turnover during
reproduction in birds and mammals: its relationship to basal metabolic rate. Pages 1976-1988
in Acta XX Congressus Internationalis Ornithologici.
Dawson, W. R., R. L. Marsh, W. A. Buttemer, and C. Carey. 1983. Seasonal and geographic variation
of cold resistance in house finches Carpodacus mexicanus. Physiological Zoology 56:
353-369.
Diamond, J. M., and K. A. Hammond. 1992. The matches, achieved by natural selection, between
biological capacities and their natural loads. Experientia (Basel) 48:551-557.
Dijkstra, C., A. Bult, S. Bijlsma, S. Daan, T. Meijer, and M. Zijlstra. 1990. Brood manipulations in
the kestrel, Falco tinnunculus: effects on fitness of parents and offspring. Journal of Animal
Ecology 59:269-286.
Drent, R. H., and S. Daan. 1980. The prudent parent: energetic adjustments in avian breeding. Ardea
68:225-252.
Else, P. L., and A. J. Hulbert. 1985. An allometric comparison of the mitochondria of mammalian and
reptilian tissues: the implications for the evolution of endothermy. Journal of Comparative
Physiology B, Comparative Biochemistry 156:3-11.
Felsenstein, J. 1985. Phylogenies and the comparative method. American Naturalist 110:129-139. Field, J., II, H. S. Belding, and A. W. Martin. 1939. An analysis of the relation between basal
metabolism and summated tissue respiration in the rat. Journal of Cellular and Comparative
Physiology 14:143-157.
Garland, T., Jr., P. H. Harvey, and A. R. Ives. 1992. Procedures for the analysis of comparative data using phylogenetically independent constrasts. Systematic Biology 41:18-32.
Garland, T., Jr., A. W. Dickerman, C. M. Janis, and J. A. Jones. 1993. Phylogenetic analysis of covariance by computer-simulation. Systematic Biology 42:265-292.
Hall, E. R., and K. R. Kelson. 1959. The mammals of North America. Vols. 1 and 2. Ronald, New York.
Hammond, K. A., and J. Diamond. 1994. Limits to dietary nutrient intake and intestinal nutrient uptake in lactating mice. Physiological Zoology 67:282-303.
Hammond, K. A., M. Konarzewski, R. M. Torres, and J. Diamond. 1994. Metabolic ceilings under a combination of peak energy demands. Physiological Zoology 67:1479-1506.
Harvey, P. H., and M. D. Pagel. 1991. The comparative method in evolutionary biology. Oxford University Press, Oxford.
Harvey, P. H., M. D. Pagel, and J. A. Rees. 1991. Mammalian metabolism and life histories. American Naturalist 137:556-566.
Hayes, J. P. 1989. Field and maximal metabolic rates of deer mice (Peromyscus maniculatus) at low and high altitudes. Physiological Zoology 62:732-744.
Hayes, J. P., and M. A. Chappell. 1990. Individual consistency of maximal oxygen consumption in deer mice. Functional Ecology 4:495-503.
Hayes, J. P., and T. Garland, Jr. 1995. The evolution of enthothermy: testing the aerobic capacity model. Evolution 49:836-847.
Hayes, J. P., T. Garland, Jr., and M. R. Dohm. 1992. Individual variation in metabolism and reproduc- tion of Mus: are energetics and life history linked? Functional Ecology 6:5-14.
Hinds, D. S., and C. N. Rice-Warner. 1992. Maximum metabolism and aerobic capacity in heteromyid and other rodents. Physiological Zoology 65:188-214.
Hulbert, A. J., and P. L. Else. 1981. Comparison of the "mammal machine" and the "reptile ma- chine": energy and thyroid activity. American Journal of Physiology (Regulatory, Integra- tive, and Comparative Physiology 10) 241:R350-R365. 1989. Evolution of mammalian enthothermic metabolism: mitochondrial activity and cell composition. American Journal of Physiology (Regulatory, Integrative and Comparative Physiology 25) 256:R63-R69.
Joos, B., and H. B. John-Alder. 1990. Effects of thyroxine on standard and total metabolic rates in the lizard Sceloporus undulatus. Physiological Zoology 63:873-885.
This content downloaded from 129.125.148.19 on Mon, 12 Nov 2018 12:34:44 UTCAll use subject to https://about.jstor.org/terms

1070
Karasov, W. H. 1992. Daily energy expenditure and the cost of activity in mammals. American Zoologist 32:238-248.
Karasov, W. H., and J. M. Diamond. 1985. Digestive adaptations for fueling the cost of endothermy. Science (Washington, D.C.) 228:202-204.
King, J. R. 1974. Seasonal allocation of time and energy resources in birds. Pages 4-70 in R. A. Paynter, Jr., ed. Avian energetics. Publications of the Nuttall Ornithological Club, no. 15.
Nuttall Ornithological Club, Cambridge, Mass.
Kirkwood, J. K. A. 1983. A limit to metabolizable energy intake in mammals and birds. Comparative
Biochemistry and Physiology A, Comparative Physiology 75:1-3.
Konarzewski, M., and J. Diamond. 1994. Peak sustained metabolic rate and its individual variation in cold-stressed mice. Physiological Zoology 67:1186-1212.
Koteja, P. 1987. On the relation between basal and maximum metabolic rate in.mammals. Comparative Biochemistry and Physiology A, Comparative Physiology 87:205-208.
1991. On the relation between basal and field metabolic rates in birds and mammals. Func- tional Ecology 5:56-64.
LaBarbera, M. 1989. Analyzing body size as a factor in ecology and evolution. Annual Review of Ecology and Systematics 20:97-117.
Lindstrom, A., and A. Kvist. 1995. Maximum energy intake rate is proportional to basal metabolic rate in migrating passerine birds. Proceedings of the Royal Society of London B, Biological Sciences 261:337-343.
Martin, A. W., and F. A. Fuhrman. 1955. The relationship between summated tissue respiration and the metabolic rate in the mouse and dog. Physiological Zoology 28:18-34.
Masman, D., S. Daan, and H. J. A. Beldhuis. 1988. Ecological energetics of the kestrel: daily energy expenditure throughout the year based on time-energy budget, food intake and doubly labeled water methods. Ardea 76:64-81.
Masman, D., C. Dijkstra, S. Daan, and A. Bult. 1989. Energetic limitation of avian parental effort: field experiments in the kestrel (Falco tinnunculus). Journal of Evolutionary Biology 2:435-455.
McDevitt, R. M., and J. R. Speakman. 1994a. Limits to sustainable metabolic rate during transient exposure to low temperatures in short-tailed field voles (Microtus agrestis). Physiological
Zoology 67:1103-1116.
1994b. Central limits to sustainable metabolic rate have no role in cold acclimation of the short-tailed field voles (Microtus agrestis). Physiological Zoology 67:1117-1139.
McNab, B. K. 1986. The influence of food habits on the energetics of eutherian mammals. Ecological Monographs 56:1-19.
1988a. Food habits and the basal rate of metabolism in birds. Oecologia (Berlin) 77:343-379.
1988b. Complications inherent in scaling the basal rate of metabolism in mammals. Quarterly
Review of Biology 63:25-54.
1994. Energy conservation and the evolution of flightlessness in birds. American Naturalist 144:628-642.
Nagy, K. A. 1987. Field metabolic rate and food requirement scaling in mammals and birds. Ecological Monographs 57:111-128.
Novacek, M. J. 1990. Morphology, paleontology, and the higher clades of mammals. Current Mam- malogy 2:507-543.
Obst, B. S., K. A. Nagy, and R. E. Ricklefs. 1987. Energy utilization by Wilson's storm petrel (Oceanites oceanicus). Physiological Zoology 60:200-210.
Peterson, C. C., K. A. Nagy, and J. Diamond. 1990. Sustained metabolic scope. Proceedings of the National Academy of Sciences of the USA 87:2324-2328.
Pough, F. H. 1983. Amphibians and reptiles as low-energy systems. Pages 141-188 in W. P. Aspey and S. I. Lustick, eds. Behavioral energetics: vertebrates' costs of survival. Ohio State University Press, Columbus.
Ricklefs, R. E., D. D. Roby, and J. B. Williams. 1986. Daily energy expenditure by adult Leach's storm petrels during the nesting cycle. Physiological Zoology 59:649-660.
Riska, B. 1991. Regression models in evolutionary allometry. American Naturalist 138:283-299.
Roby, D. D., and R. E. Ricklefs. 1986. Energy expenditure in adult least auklets and diving petrels during the chick-rearing period. Physiological Zoology 59:661-678.
This content downloaded from 129.125.148.19 on Mon, 12 Nov 2018 12:34:44 UTCAll use subject to https://about.jstor.org/terms

BASAL METABOLISM AND DAILY ENERGY EXPENDITURE 1071
Ruben, J. A. 1995. The evolution of enthothdrmy in mammals and birds: from physiology to fossils.
Annual Review of Physiology 57:69-95.
Scott, I., and P. R. Evans. 1992. The metabolic output of avian (Sturnus vulgaris, Calidris alpina)
adipose tissue, liver and skeletal muscle: implications for BMR/body mass relationships. Comparative Biochemistry and Physiology A, Comparative Physiology 103:329-332.
Sibley, C. G., and J. E. Ahlquist. 1990. Phylogeny and classification of birds: a study in molecular evolution. Yale University Press, New Haven, Conn.
Sparti, A. 1992. Thermogenic capacity of shrews (Mammalia, Soricidae) and its relationship with basal rate of metabolism. Physiological Zoology 65:77-96.
Taigen, T. L. 1983. Activity metabolism of anuran amphibians: implications for the origin of endo-
thermy. American Naturalist 121:94-109.
Torre-Bueno, J. R. 1978. Respiration during flight in birds. Pages 89-94 in J. Piiper, ed. Respiratory function in birds, adult and embryonic. Springer, Berlin.
Walton, B. M. 1993. Physiology and phylogeny: the evolution of locomotion in hylid frogs. American Naturalist 141:26-50.
Weathers, W. W., and K. A. Sullivan. 1989. Juvenile foraging proficiency, parental effort, and avian reproductive success. Ecological Monographs 59:223-246.
Weiner, J. 1989. Metabolic constraints to mammalian energy budgets. Acta Theriologica 34:3-35. 1992. Physiological limits to sustainable energy budgets in birds and mammals: ecological
implications. Trends in Ecology & Evolution 7:384-388.
Williams, J. B. 1988. Field metabolism of tree swallows during the breeding season. Auk 105:706-714. Williams, J. B., and K. A. Nagy. 1984. Validation of the doubly labeled water technique for measuring
energy metabolism in savannah sparrows. Physiological Zoology 57:325-328.
Williams, J. B., P. C. Withers, S. D. Bradshaw, and K. A. Nagy. 1991. Metabolism and water flux of captive and free-living Australian parrots. Australian Journal of Zoology 39:131-142.
Wilson, D. E., and D. M. Reeder, eds. 1993. Mammal species of the world: a taxonomic and geo- graphic reference. 2d ed. Smithsonian Institution Press, Washington, D.C.
Associate Editor: Theodore Garland, Jr.
This content downloaded from 129.125.148.19 on Mon, 12 Nov 2018 12:34:44 UTCAll use subject to https://about.jstor.org/terms