the reservation wage curve - parthen-impact.com · benefit corresponds to what is deemed the margin...
TRANSCRIPT
1
The reservation wage curve
Uwe Blien+* [email protected] (corresponding author)
Susanne Messmann** [email protected]
Mark Trappmann+* [email protected]
+ Otto-Friedrich-University of Bamberg
* Institute for Employment Research (IAB), Nuremberg
** Public Employment Services, Nuremberg
Abstract Reservation wages indicate the wage threshold for which individual workers are inclined
to supply their working capacity. In important theoretical approaches it is expected that
this threshold depends on the unemployment rate. If this is true, the variation of reservation
wages might be an important force behind the "wage curve", which describes the effects of
regional unemployment on market wages.
Up to now, the connection of regional unemployment to reservation wages has not been
tested, since required regionalized survey data has not been available. With the "Labour
Market and Social Security" study (PASS), a large panel survey in Germany, information
on regional reservation wages is now available. The empirical analysis with this data opens
up the "black box" of the wage generation process and delivers insights about its determin-
ing factors. The analysis is based on standard job matching theory which is used to derive a
relationship between unemployment and reservation wages.
Keywords: Reservation Wages, Wage Curve, Regional Labour Markets
JEL-Code: J64, J31, R23
Acknowledgements:
The authors would like to thank Stefan Bender, Stephan Brunow, Albert Hummel, Elke Jahn
& Ruediger Wapler for very helpful support. The responsibility for the analysis and for all
conclusions remains solely with the authors.
2
1 Introduction
Reservation wages indicate the wage threshold for which individual workers are inclined to
supply their working capacity. In important macroeconomic approaches it is assumed that this
threshold depends on labour market tightness or directly on the unemployment rate. In this
paper we examine the relationship between regional unemployment and reservation wages
theoretically and empirically. The analysis is inspired from the research about the “wage
curve”, which concerns the effects of regional unemployment on market wages. The research
presented here gives evidence about the mechanism generating wage curves and is therefore
an important contribution to the testing of the theories involved. We use a labour market-
matching approach as the basis of empirical research to derive conclusions on reservation and
market wages and their respective relation to unemployment.
Empirical analyses of the intended kind were not possible until recently, since there is a scar-
city of data on reservation wages. Information on this topic is collected rarely in surveys
(about the exceptions see Sestito, Viviano 2011). Especially data giving information about
relatively small regional units was not available. With the data of the first wave of the large
panel survey “Labour Market and Social Security” (PASS) for Germany there is now an ex-
ception to this rule. It is used in this paper to investigate how reservation wages are affected
by different levels of regional unemployment. PASS contains randomly selected respondents
distributed over the regions of Germany and includes many variables important for wage
analyses (gender, age, qualification etc.). Wave one of PASS covers a sample of 6,804 house-
holds receiving unemployment benefits at the time of sampling and a sample of 5,990 house-
holds randomly drawn from the German residential population.
Among economists the discussion about reservation wages is mainly related to macroeconom-
ic modeling. Here, however, we take a different perspective by transferring these models to a
regional level by treating every region as a small, very open economy of its own. This has the
appealing feature of adding a cross-sectional dimension to the empirical approach. The inter-
esting relationship can be estimated with great precision on the basis of micro data. The varia-
tion of unemployment rates between German regions is huge. They cover a span from 2.0 (in
the district of Eichstätt close to Munich) to 24.2 % (in the district of Uckermark, both for June
2007). The global unemployment rate was 7.2 °% in West Germany and 14.6 °% in East
Germany.
2 Reservation wages and the wage curve
2.1 The common institutional background
Since it can be suspected that the specific institutional setting in Germany has an impact on
the formation of reservation wages, a short characterization of Germany’s support scheme for

3
unemployed and needy individuals and households is in order. It gives the common back-
ground of the regional variation we intend to explain.
More than 80 percent of employment in Germany is subject to social insurance contributions.
When former employees who have contributed to this system become unemployed they are
entitled to unemployment insurance payments for up to one year which cover 60 to 67 percent
of their former net income. However, unemployed people receiving these insurance payments
have to accept all reasonable (in German: “zumutbare”) job offers or they will lose their enti-
tlement. The definition of what is reasonable is detailed in German Social Code III: Within
the first three months of unemployment all job offers of up to 80 percent of the former wage
level are defined as reasonable. After that it is 70 percent for another 3 months. Beginning
with the seventh month, job offers have to be accepted if they exceed the level of unemploy-
ment insurance payments.
For those whose unemployment insurance entitlements have expired and those who never had
any or no sufficient entitlements to support their livelihood, Social Code II regulates further
payments. Recipients are granted a basic income support. The amount of this means-tested
benefit does not depend on former income. It is only granted after personal assets have been
used up. There are exemptions for old age provisions up to an amount that depends on a per-
son’s age and for real estate property inhabited by the household in need. The amount of the
benefit corresponds to what is deemed the margin of subsistence. Nevertheless it can be cut
for breaches like not participating in active labor market programs or turning down acceptable
job offers. Cuts are temporary, usually amount to 10 percent (for mere failures to report) to 30
percent (for neglects of duties) and can be cumulated. Recipients under the age of 25 can even
lose their entire entitlement. Whenever sanctions exceed thirty percent they can – but need not
generally – be replaced by in-kind allowances.
This description shows that the German social security system is not ‘generous’. For each
person who becomes unemployed, there is ultimately the threat of having to accept any job
offer in the long run - in order not to lose entitlements entirely. It becomes a strategic decision
at what point to accept a job-offer at which wage-level. The current amount of insurance or
benefit payments – while it may have an influence on this decision – exerts this influence only
in interaction with individual expectations about future employment prospects.
2.2. The introduction of the wage curve
The regulation of unemployment benefits is uniform for all workers of the German labour
market. Now we turn to the regional variation we are interested in. Our regional analysis of
reservation wages follows the track of the wage curve, which was introduced by Blanchflower
& Oswald (1994). A wage curve is a decreasing convex curve of wages on regional unem-
ployment. Based on micro data of individual workers Blanchflower & Oswald (1994, see also
Blanchflower, Oswald 2005 & 2006) presented empirical evidence for a wage curve relation-
ship. In most of the 12 countries under observation, including the U.S. and Britain, the authors
4
found an elasticity of about -0.10. This means that doubling the local unemployment rate in a
region implies a drop of around 10 percent in the level of wages in that region holding every-
thing else constant. The results were so stable that the authors claimed to have found a new
“empirical ‘law’ of economics” (Blanchflower & Oswald 1994: 1), which included even the
size of the coefficient. For the Anglo-Saxon countries, the estimates of the unemployment
elasticity of earnings lie in a range from (-0.08 to -0.11) in almost all specifications. These
empirical results are based on pooled cross sections of micro data.
Later, additional evidence in favour of the existence of a wage curve was presented by other
authors (for Germany see Bellmann, Blien 2001 and Baltagi, Blien, Wolf 2009, 2012), where-
as the precise size of the unemployment effect was a point of debate: In several countries
(e. g. in Germany) the size of the effect appeared to be smaller. In general it was related to the
institutional conditions of the respective country. A meta-analysis on the empirical results
concerning the wage curve was provided by Nijkamp and Poot (2005), recent studies include
estimates for the labour markets of Russia (Shilov, Moeller 2009), of Turkey (Baltagi
Baskaya, Hulagu 2013), and of Poland (Baltagi, Rokicki 2014).
Technically, the wage curve is simply a standard wage equation, which can be used to esti-
mate the returns to education or the male/ female wage gap. In the case of the wage curve
research the local unemployment rate is added to the set of regressors. Although, Blanchflow-
er and Oswald (1994) present a wide range of evidence on the appropriate functional form and
find non-linearities, they argue that the simple log-linear function is generally a good approx-
imation.
Turning to explanations for the wage curve, often efficiency wage approaches are seen as im-
portant. The wage curve can be regarded as a substitute for a common labour supply function
of a macro-model. Blanchflower & Oswald transfer the so-called "wage setting curve" of the
macro-models developed by Layard et al. (1991, 2005), by Carlin & Soskice (1990, 2006) and
others to regional labour markets. The incorporation of the regional dimension in the analysis
of wages has the advantage of gaining variance, since the researcher is able to study many
small economies instead of only a single large one. Regionalized versions of bargaining theo-
ry and efficiency wage theory can be used to explain the negative relationship between wages
and unemployment. Originally, Blanchflower & Oswald also used contract theory as a third
explanation of the wage curve, which was not taken up later. The authors developed an effi-
ciency wage model similar to the one presented by Shapiro and Stiglitz (1984). In this model
high rates of unemployment and high wages are substitutes in motivating workers to put high
effort into their work.
2.3 Theory of labour market matching
Instead to the several approaches used by Blanchflower and Oswald, we turn to a theory
which has seldom been used to derive a wage curve. This is the theory of labour market
matching, developed mainly by Pissarides and Mortensen. In contrast to other approaches,
labour market matching theory has the advantage of explicitly including the reservation wage

5
level. It seems therefore ‘natural’ to use it for a theoretical foundation of the variation of res-
ervation wages. However, there is a distance between matching approaches and wage curve
research. The only known theoretical matching model related to the wage curve is Sato
(2000), whose approach differs from ours, though he used the same starting point. We will
come back to Sato’s paper later and explain the deviations.
In a specific sense matching theory comprises the wage negotiation approach, since it also
includes Nash bargaining between workers and firms. The core of the theory (following e.g.
Pissarides 2000 and 2009, see also Mortensen 2010 and Zenou 2009b) can be directly used to
develop a wage curve, it is only necessary to treat unemployment explicitly. In matching theo-
ry, the decision of firms to create jobs is modelled in two steps. First, the decision to open a
vacancy is described by the following Bellman equation:
))(/( VJuvqciV (1)
A Bellman equation is a necessary condition for optimality in dynamic programming. Second,
the equation for an occupied job has the following shape:
sJwpiJ (2)
In these equations J is the capitalized value of an occupied job and V is the value of a vacan-
cy, i is the interest rate, p the product of a single worker, w the wage, v the vacancy rate and u
the unemployment rate. s is the separation rate, which is calculated for occupied jobs, c is the
cost of search during the time a vacancy is open, q is a special form of the aggregate labour
market matching function: m(u/v,1) = q(v/u). The function m = m(u,v) describes the forming
of matches between firms and workers, which is homogeneous of degree 1 and concave in its
arguments. The calculations of workers are mapped by the following equations:
)( UWswiW (3)
))(/()/( UWuvquvziU (4)
Here, W are the expected returns from holding a job and U those of being unemployed. z
comprises unemployment assistance and the nonmonetary aspects of leisure. Therefore, z
takes over several institutional aspects of the economy and especially of labour market poli-
cy, which are discussed in section 2.1. These should not trouble us any further, because they
are mainly constant between regions.
In the matching approach, a single firm and an individual worker negotiate about the size of
the wage. Since it is assumed that they meet each other pair-wise, they form a double-sided
monopoly, which is described as a Nash bargaining problem:
})()max{( 1 VJUWw (5)
The first order condition of the maximization exercise is:
)( UVWJUW (6)
6
This solution depends on a parameter 0 < β <1 whose exact size is regarded as given. It char-
acterises the relative “strength” of the side of the workers compared to the side of the firms
owners, which are both involved in the bargaining process.
Now we have nearly all material at our disposal to construct on the one hand a wage curve
and on the other hand an expression for reservation wages. The latter one is already defined
by equation (4), since this describes the lower threshold for wages. If wages are higher than
iU workers are available for working. To derive expressions for market wages and for reser-
vation wages, which could be estimated, a further assumption is needed. It is assumed that in
(1) vacancy creation exhausts all available profits, therefore V is assumed to be zero. Then,
(1) can be transformed to the so-called job creation condition:
0Vuvq
c
si
wp
if
)/( (7)
Now, we can recalculate (4), to find a new expression for the reservation wage
R = iU:
ucvziUR /1
(8)
For the market wage it is found:
)/()1( ucvpzw (9)
Pissarides calls (9) the “wage equation”. He prefers not to focus directly on u, the unemploy-
ment rate, but rather on θ = v/u, the labour market tightness (which is used in empirical anal-
yses for Great Britain by Longhi 2011). Therefore, his wage equation is an increasing linear
function in w, θ -space, whereas we prefer to reformulate (9) as a regional equation (r is the
region index) and present it as a nonlinear decreasing function in w, u-space:
)/()1( rrrr ucvpzw (10)
Now, we have obtained the regional wage curve in an easy way from the Mortensen/ Pissar-
ides system. It is also possible to compare equation (10) with a regionalized version of equa-
tion (8). We have already stated that w must be greater than R in this system. By construction
reservation wages are lower than market wages. It is also obvious that the derivative of Rr is
different from the one of wr.
2// rrrr ucvuw (11)
2)1(/
r
rrr
u
cvuR
(12)
Since 0 < (1-β) < 1 the first term on the right hand side of (12) is larger than β, the factor in
(11). It can be concluded that reservation wages Rr react more strongly to variations in re-
gional unemployment ur than the market wage wr. This is due to the fact that reservation wag-

7
es do not depend directly on the actions of firms which modify the movements of market
wages.
2.3. Discussion
We have already mentioned that there is one paper which uses a matching model to derive a
relationship between unemployment and wages. Sato (2000) starts from an angle similar to
our paper but develop into a different direction. Since he uses a framework similar to the one
we apply, the hint may be enough that in equation (2) the productivity of an individual worker
is included. Sato attributes differences in the unemployment rate to variations in productivity.
Also, in his paper high wages are derived from high levels of productivity. Therefore, in
Sato’s approach the inverse relationship between unemployment and wages (i.e. the wage
curve) is an indirect one, which is due to the effects of productivity in two directions, whereas
a ‘standard’ wage curve depicts a direct effect of unemployment on wages.
Hummel and Elhorst (2013) use Sato’s model as the basis of an empirical analysis of the
wage curve on US labour markets. However, we do not follow their track, because it can be
shown that the relationship between productivity and (un-)employment is an ambiguous one.
In standard models productivity gains have a labour saving effect, which could increase un-
employment. This direct effect is counteracted by a compensating effect due to price reduc-
tions which follow productivity gains. The relative strength of the counteracting effects de-
pends on the elasticity of product demand and is an empirical question.
The ambiguity of the employment reaction is not only a theoretical possibility (Combes,
Magnac, Robin 2004: 220ff., Blien, Sanner 2014,), but is also empirically shown in research
on agglomeration effects. Cingano and Schivardi (2004) demonstrate that the productivity
advantages observed for metropolitan areas can be accompanied by relatively low employ-
ment levels which are attributed to inelastic product demand. Due to these ambiguous effects
we do not include productivity directly in our own empirical approach. However, we control
for the composition of the labour force with respect to qualification levels etc., which are re-
lated to productivity.
Apart from the extensions of the matching model introduced by Sato, there are several others
available which might be of potential interest to our purpose. There are extensions developed
by Y. Zenou (2009a and 2009b), who among others includes a land market in the model and
is therefore able to develop an urban structure of the labour market. Since we expect labour
markets being larger than city quarters, we do not use Zenou’s extensions.
However, there are points of the basic matching model which can be criticised. The treatment
of an individual worker like a capital asset is a particular characteristic of this approach,
though there is an asymmetry between capital assets and workers. The first ones exist sepa-
rately from their owners and can therefore be sold on the market, whereas the capital a work-
er represents is embodied in her (or in him) and cannot simply be sold on the market like a capi-
8
tal asset. Another point is the parameter β which has to be treated as given. In the empirical
analyses we abstract from these critical points and assume the theoretical structure as given.
What have we learnt from the theoretical discussion about the level of reservation wages and
its relation to unemployment? In the labour market matching model reservation wages vary
with the unemployment rate. There is a gap between the reservation and the market wage,
which is derived from the Nash-bargaining process which gives the framework in case a firm
hires a new employee.
From the matching model a special conclusion is available which has already been men-
tioned: The reaction of reservation wages to unemployment should be larger than the one of
market wages. This is an important result which can be tested empirically. All the previous
discussions do not take into account that different groups of workers might have different
levels of reservations wages, since these are expected to depend also on the personal situation
of the workers. Someone who might be receiving a very low level of wage might have a rela-
tively high reservation wage, because the paid wage might not be sufficient to nourish a fami-
ly according to given cultural standards. Therefore, a distribution of reservation wages is to be
expected in empirical analyses. Another reason for deviations between reservation and paid
wages are adaptation processes described above.
In this paper, however, we are not primarily interested in the variation of reservation wages
between different groups of workers. We include a number of variables to control for different
levels of reservation wages between worker groups. The target of the empirical analyses,
however, is the relation between regional unemployment and reservation wages.
3 Data sources and structural analysis
3.1 The data sources
The empirical analyses in this article are performed using data from the first wave of the panel
study “Labour Market and Social Security” (PASS, see Trappmann et al. 2010), which is a
new large-scale panel study in Germany conducted by the Institute for Employment Research
(IAB). Its main purpose is the evaluation of the unemployment assistance scheme for long-
term unemployed and households with insufficient income (Unemployment Benefit II) which
was introduced in Germany in 2005. But due to the comprehensive design of the survey (Ru-
dolph and Trappmann 2007) the dataset is also representative for the German population and
therefore has the potential of answering a broad range of questions concerning the labour
market and the welfare state in Germany. The first wave of the panel survey was conducted
between December 2006 and July 2007. During this time 18,954 individuals in 12,794 house-
holds were interviewed.
The sample of the first PASS wave consists of two sub-samples: sub-sample one is a random
sample of 6,804 households receiving unemployment assistance in July 2006 drawn from the
registers of the German Public Employment Service. The second sub-sample is a random

9
sample of 5,990 households of the German residential population. Both sub-samples are clus-
tered in the same 300 randomly selected postal code areas in Germany and get predominantly
identical questions though there are some extra questions for unemployment benefit recipients
(which exist in both sub-samples). The participating households are interviewed yearly about
a range of topics including their education, employment and unemployment histories, assets
and income from different sources, programme participation (active labour market policy
programmes), household composition, dwelling, health and social networks. Taking on an
individual perspective as well as focusing on the household community in joint receipt, the
survey includes a “household questionnaire” to be answered by the head of the household and
a “person questionnaire” for each person older than 14 years. In wave one 18,954 persons
were interviewed – 9,386 in the recipient sample and 9,558 in the population sample (see
Christoph et al. 2008 and Hartmann et al. 2008).
The data from PASS are ideal for the purpose of this paper as they contain a large number of
employed and unemployed people distributed equally over Germany, information on their
place of residence, on their reservation wage and a large set of attributes that are usually sup-
posed to have an effect on reservation wages such as employment status, household income,
education, gender, age, family size and structure. Furthermore, the survey design based on the
two sub-samples allows us to distinguish between the German residential population and un-
employment benefit recipients in our analyses.
To capture the reservation wage in the survey, people who have ever been or currently are
searching for a job were asked about their expected net-wage. Subsequently the same group
of people was asked if they would also accept a lower wage offer and how high this minimum
respectively reservation wage would at least have to be. The response to this question is ex-
pected to be the individual reservation wage. For people who would not accept a lower wage,
the expected wage is assumed to be their reservation wage.
Table 1: Selection of data for analysis
Total Sample N=18,954 100%
Individuals older than 64 years n=1,705 9.0%
Never searched for a job n=5,421 28.6%
Occupational Status: retired/permanently unable to work/student n=166 0.9%
Non-respondents "don't know/refuse" n=815 4.3%
Implausible answer (reservation wage < € 100 or > € 4.000) n=51 0.3%
Analysis sample n=10,796 57.0%
Source: PASS, own calculation.
Based on the full sample size of 18,954 individuals participating in the first wave of the
PASS, the reservation wage was generally not collected from people aged 65 years or older,
full-time students and from people who denied ever having searched for a job. Furthermore
10
we excluded retired people as well as people permanently unable to work. With implausible
statements according to the reservation wage - reported reservation wages of below € 100 and
over € 4,000 net wage per month - and non-respondents taken into account, almost 60 % of
the original number of cases can be used in our analysis. Table 1 shows the selection of cases
for the analysis. Further restrictions to the sample size may apply during the analysis due to
missing values in the independent variables.
3.2 Structural analysis of reservation wages
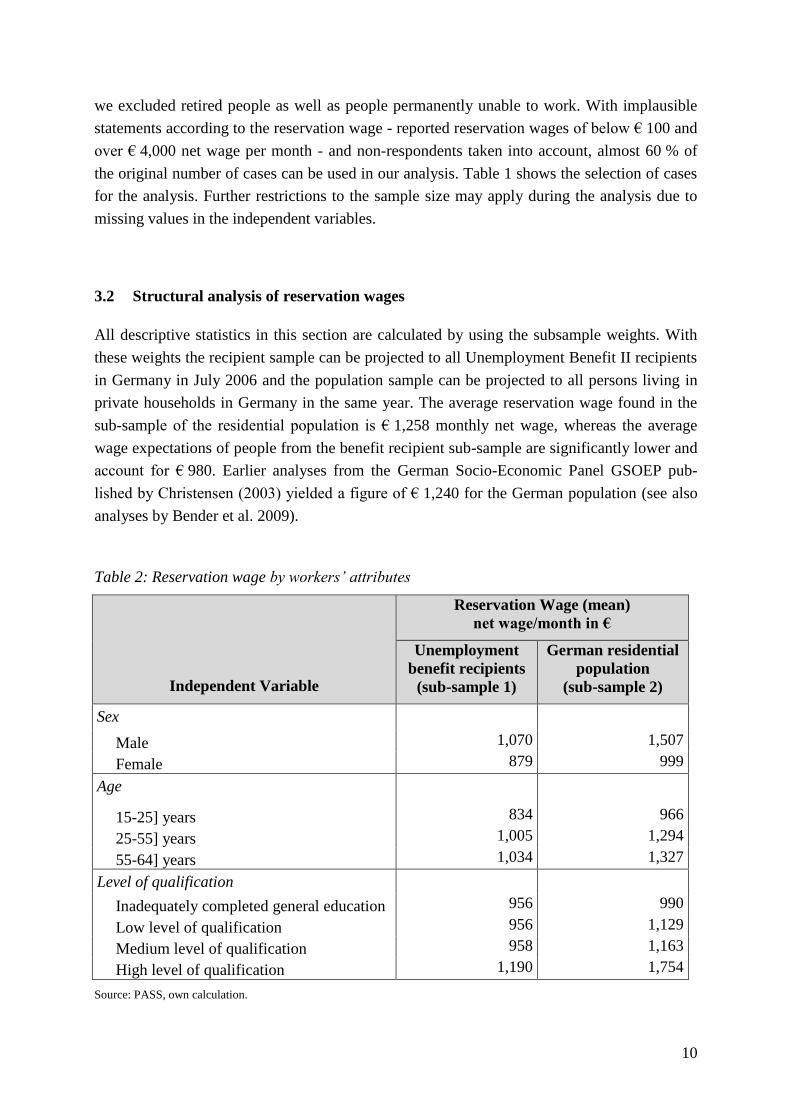
All descriptive statistics in this section are calculated by using the subsample weights. With
these weights the recipient sample can be projected to all Unemployment Benefit II recipients
in Germany in July 2006 and the population sample can be projected to all persons living in
private households in Germany in the same year. The average reservation wage found in the
sub-sample of the residential population is € 1,258 monthly net wage, whereas the average
wage expectations of people from the benefit recipient sub-sample are significantly lower and
account for € 980. Earlier analyses from the German Socio-Economic Panel GSOEP pub-
lished by Christensen (2003) yielded a figure of € 1,240 for the German population (see also
analyses by Bender et al. 2009).
Table 2: Reservation wage by workers’ attributes
Independent Variable
Reservation Wage (mean)
net wage/month in €
Unemployment
benefit recipients
(sub-sample 1)
German residential
population
(sub-sample 2)
Sex
Male 1,070 1,507
Female 879 999
Age
15-25] years 834 966
25-55] years 1,005 1,294
55-64] years 1,034 1,327
Level of qualification
Inadequately completed general education 956 990
Low level of qualification 956 1,129
Medium level of qualification 958 1,163
High level of qualification 1,190 1,754
Source: PASS, own calculation.

11
Further analyses of the reservation wage by several determining variables generally show the
expected results: In both subsamples women have a considerably lower reservation wage than
men and reservation wages are increasing with age as well as with level of education, with a
large interval between the medium and the highest educational level (see Table 2). In this
more detailed analysis it can also be seen that the observed differences within the values of
these parameters are larger for the residential population than for the population of benefit
recipients.
Our expectation that reservation wages are influenced by unemployment and that the reaction
should even be stronger than for market wages, can only be true if there is considerable inde-
pendency of the individual reservation wage and the current net market wage. Therefore, we
look at mean differences between the two variables for people who are currently employed.
Table 3 shows a considerable amount of variation between reservation wages and market
wages for almost 90% of the respondents in both samples. More than half of the employed
people among the residential population would work for less than their current wage and a
third of the wage top up recipients would be prepared for wage concessions. That many of
these would demand higher wages than they currently receive is no surprise, since their wage
is below the one acceptable due to cultural standards and even below the one regarded as ac-
ceptable by German law and by the relevant job-centers. The confirmation of distinct dispari-
ties between reservation wages and market wages shows that it is worthwhile to prepare a
wage curve-type analysis of reservation wages and that the results could be differ from those
of market wages.
Table 3: Reservation wage and market wage
Mean Difference
(N in %)
Difference: Reservation Wage – Cur-
rent Net Wage
Unemployment
benefit recipients
(sub-sample 1)
German residential
population
(sub-sample 2)
Reswage < Net Wage -332 (33%) -566 (57%)
Reswage = Net Wage 0 (11%) 0 (13%)
Reswage > Net Wage 502 (56%) 492 (30%)
Source: PASS, own calculations.
As we are particularly interested in the effects of unemployment on reservation wages we are
now going to explore the regional variation of the reservation wages. On a bi-variate level we
can already see a considerable difference between East and West Germany: the average reser-
vation wage among the residential population (sub-sample 2) in West-Germany accounts for
1,297 € as opposed to 1,125 € in the Eastern parts of Germany. For the unemployment recipi-
ents we can find the respective regional figures of 1,018 € in West and 918 € in East Germa-
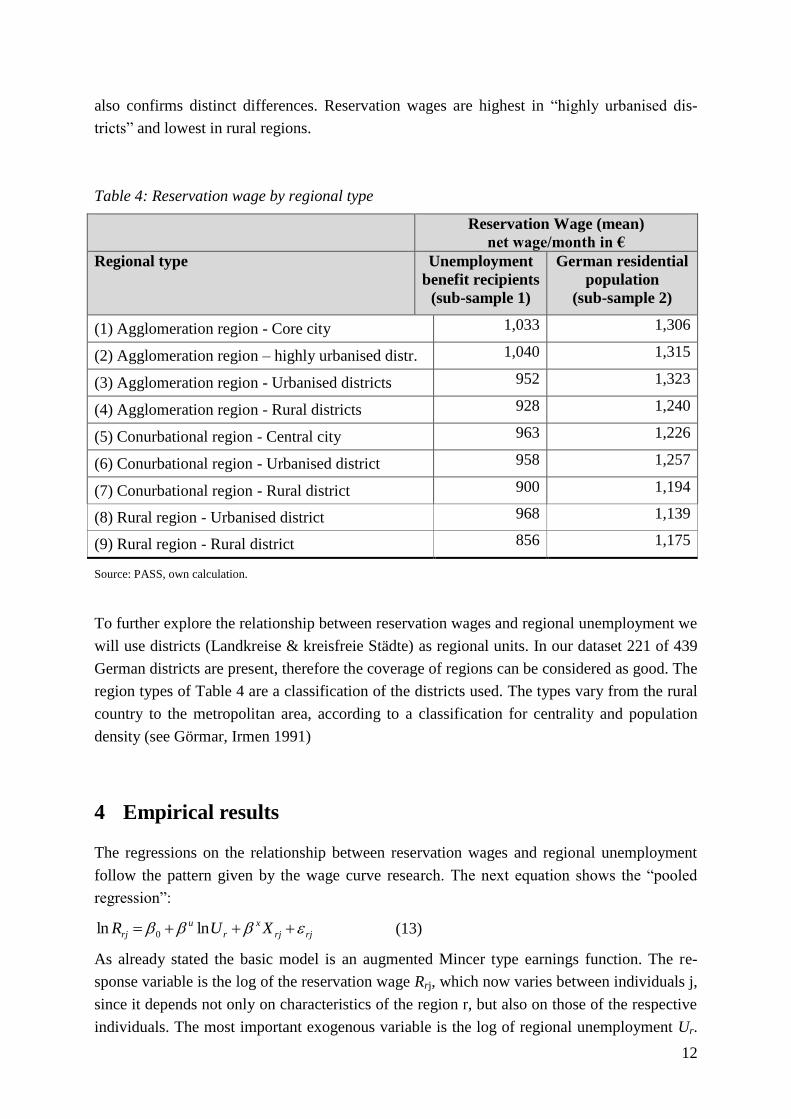
ny. A more differentiated analysis of reservation wages by regional types as shown in Table 4
12
also confirms distinct differences. Reservation wages are highest in “highly urbanised dis-
tricts” and lowest in rural regions.
Table 4: Reservation wage by regional type
Reservation Wage (mean)
net wage/month in €
Regional type Unemployment
benefit recipients
(sub-sample 1)
German residential
population
(sub-sample 2)
(1) Agglomeration region - Core city 1,033 1,306
(2) Agglomeration region – highly urbanised distr. 1,040 1,315
(3) Agglomeration region - Urbanised districts 952 1,323
(4) Agglomeration region - Rural districts 928 1,240
(5) Conurbational region - Central city 963 1,226
(6) Conurbational region - Urbanised district 958 1,257
(7) Conurbational region - Rural district 900 1,194
(8) Rural region - Urbanised district 968 1,139
(9) Rural region - Rural district 856 1,175
Source: PASS, own calculation.
To further explore the relationship between reservation wages and regional unemployment we
will use districts (Landkreise & kreisfreie Städte) as regional units. In our dataset 221 of 439
German districts are present, therefore the coverage of regions can be considered as good. The
region types of Table 4 are a classification of the districts used. The types vary from the rural
country to the metropolitan area, according to a classification for centrality and population
density (see Görmar, Irmen 1991)
4 Empirical results
The regressions on the relationship between reservation wages and regional unemployment
follow the pattern given by the wage curve research. The next equation shows the “pooled
regression”:
rjrj
x
r
u
rj XUR lnln 0 (13)
As already stated the basic model is an augmented Mincer type earnings function. The re-
sponse variable is the log of the reservation wage Rrj, which now varies between individuals j,
since it depends not only on characteristics of the region r, but also on those of the respective
individuals. The most important exogenous variable is the log of regional unemployment Ur.
13
A number of further controlling variables Xrj is included to control for regional differences in
composition with respect to other factors influencing reservation wages. These variables af-
fect productivity p and negotiation strength β, which are included in the theoretical model (see
equation (10)). Since there the variable search cost c is multiplicatively included, it is also
important to estimate equations for different subgroups of workers for whom differing search
cost are to be expected.
We control for a set of variables that is likely to influence the last or current job income.
Among these are demographics like gender, age, age squared (divided by 100), migration
background. In addition we control for the level of formal labour market qualification and the
current occupational status. At the household level we include the current log household in-
come, using the OECD scale to adjust for differences in household size and the number of
children under the age of 18 in the household.
To control any regional effects which are not due to the unemployment rate we include dum-
mies indicating the type of the district (see Table 4). Additionally, we include one for the
eastern part of Germany. Finally, a standard error term εri is also included. The basic model
(13) is estimated by Ordinary Least Squares (OLS). In a second version of the model (14) we
use the same variables, but assume a different error structure:
rrjrj
x
r
u
rj XUR lnln 0 (14)
The error term δr varies only between regions and takes over unobserved influences affecting
all individuals of one region to the same extent. Normally, a wage curve is estimated by using
regional fixed effects. In the present case random effects have to be used, because fixed ef-
fects would be multi-collinear with the regional unemployment rate in a cross-section. Re-
gional random effects are important to control for the unobserved heterogeneity of regions.
They take the deviating number of observations between the regional and the individual level
into account (see Moulton 1990). The model is estimated by Maximum Likelihood. As usual,
we assume that the error terms δr and εri are normally distributed and independent of the ex-
ogenous variables. The model can be regarded as a multilevel model.
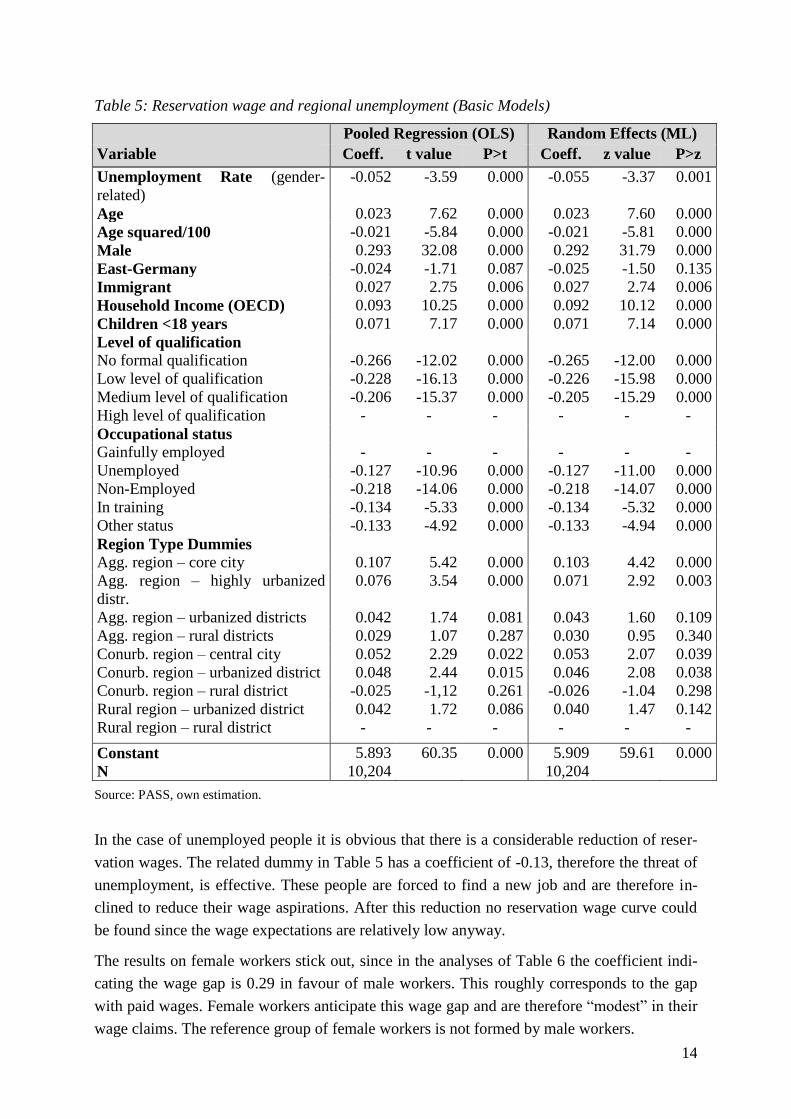
Table 5 presents the results for the pooled regression with the log of reservation wages as re-
sponse variable. The coefficients of the control variables show the expected signs and in most
cases are very close even to the expected sizes. The reservation wage profile increases with
age and with higher qualification levels. The coefficients of the regional dummies correspond
closely to analyses with paid wages for the German labour market (see Blien 2001).
The unemployment rate at the district level we used in the model is a gender specific rate.
This is a more accurate indicator of labour market tightness than including the variable as a
global measure uniform for both sexes. The coefficient is -0.05 and is highly significant.
Therefore it can be concluded that a wage curve for reservation wages exists. This conclusion
is confirmed by the Maximum Likelihood estimate of the random effects model. The coeffi-
cient and the significance level are nearly the same as in the OLS estimate. Table 5 displays
the results of both estimation procedures for the combined samples.
14
Table 5: Reservation wage and regional unemployment (Basic Models)
Pooled Regression (OLS) Random Effects (ML)
Variable Coeff. t value P>t Coeff. z value P>z
Unemployment Rate (gender-
related)
-0.052 -3.59 0.000 -0.055 -3.37 0.001
Age 0.023 7.62 0.000 0.023 7.60 0.000
Age squared/100 -0.021 -5.84 0.000 -0.021 -5.81 0.000
Male 0.293 32.08 0.000 0.292 31.79 0.000
East-Germany -0.024 -1.71 0.087 -0.025 -1.50 0.135
Immigrant 0.027 2.75 0.006 0.027 2.74 0.006
Household Income (OECD) 0.093 10.25 0.000 0.092 10.12 0.000
Children <18 years 0.071 7.17 0.000 0.071 7.14 0.000
Level of qualification
No formal qualification -0.266 -12.02 0.000 -0.265 -12.00 0.000
Low level of qualification -0.228 -16.13 0.000 -0.226 -15.98 0.000
Medium level of qualification -0.206 -15.37 0.000 -0.205 -15.29 0.000
High level of qualification - - - - - -
Occupational status
Gainfully employed - - - - - -
Unemployed -0.127 -10.96 0.000 -0.127 -11.00 0.000
Non-Employed -0.218 -14.06 0.000 -0.218 -14.07 0.000
In training -0.134 -5.33 0.000 -0.134 -5.32 0.000
Other status -0.133 -4.92 0.000 -0.133 -4.94 0.000
Region Type Dummies
Agg. region – core city 0.107 5.42 0.000 0.103 4.42 0.000
Agg. region – highly urbanized
distr.
0.076 3.54 0.000 0.071 2.92 0.003
Agg. region – urbanized districts 0.042 1.74 0.081 0.043 1.60 0.109
Agg. region – rural districts 0.029 1.07 0.287 0.030 0.95 0.340
Conurb. region – central city 0.052 2.29 0.022 0.053 2.07 0.039
Conurb. region – urbanized district 0.048 2.44 0.015 0.046 2.08 0.038
Conurb. region – rural district -0.025 -1,12 0.261 -0.026 -1.04 0.298
Rural region – urbanized district 0.042 1.72 0.086 0.040 1.47 0.142
Rural region – rural district - - - - - -
Constant 5.893 60.35 0.000 5.909 59.61 0.000
N 10,204 10,204
Source: PASS, own estimation.
In the case of unemployed people it is obvious that there is a considerable reduction of reser-
vation wages. The related dummy in Table 5 has a coefficient of -0.13, therefore the threat of
unemployment, is effective. These people are forced to find a new job and are therefore in-
clined to reduce their wage aspirations. After this reduction no reservation wage curve could
be found since the wage expectations are relatively low anyway.
The results on female workers stick out, since in the analyses of Table 6 the coefficient indi-
cating the wage gap is 0.29 in favour of male workers. This roughly corresponds to the gap
with paid wages. Female workers anticipate this wage gap and are therefore “modest” in their
wage claims. The reference group of female workers is not formed by male workers.
15
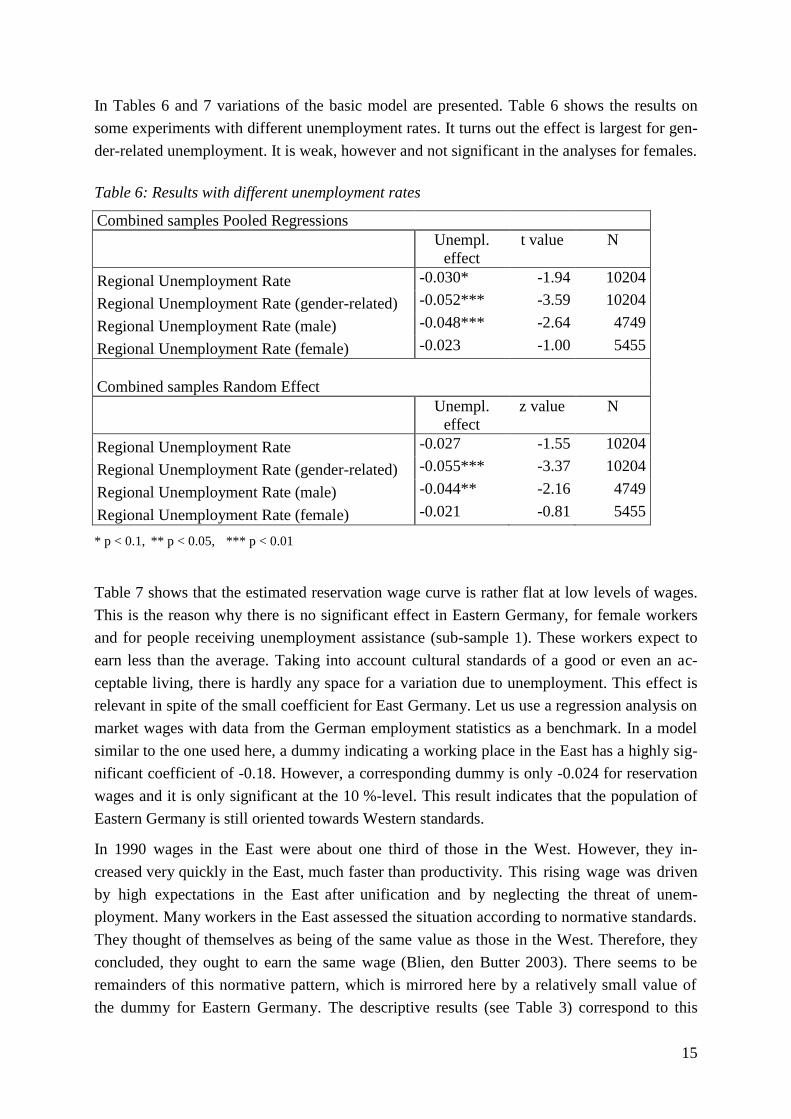
In Tables 6 and 7 variations of the basic model are presented. Table 6 shows the results on
some experiments with different unemployment rates. It turns out the effect is largest for gen-
der-related unemployment. It is weak, however and not significant in the analyses for females.
Table 6: Results with different unemployment rates
Combined samples Pooled Regressions
Unempl.
effect
t value N
Regional Unemployment Rate -0.030* -1.94 10204
Regional Unemployment Rate (gender-related) -0.052*** -3.59 10204
Regional Unemployment Rate (male) -0.048*** -2.64 4749
Regional Unemployment Rate (female) -0.023 -1.00 5455
Combined samples Random Effect
Unempl.
effect
z value N
Regional Unemployment Rate -0.027 -1.55 10204
Regional Unemployment Rate (gender-related) -0.055*** -3.37 10204
Regional Unemployment Rate (male) -0.044** -2.16 4749
Regional Unemployment Rate (female) -0.021 -0.81 5455
* p < 0.1, ** p < 0.05, *** p < 0.01
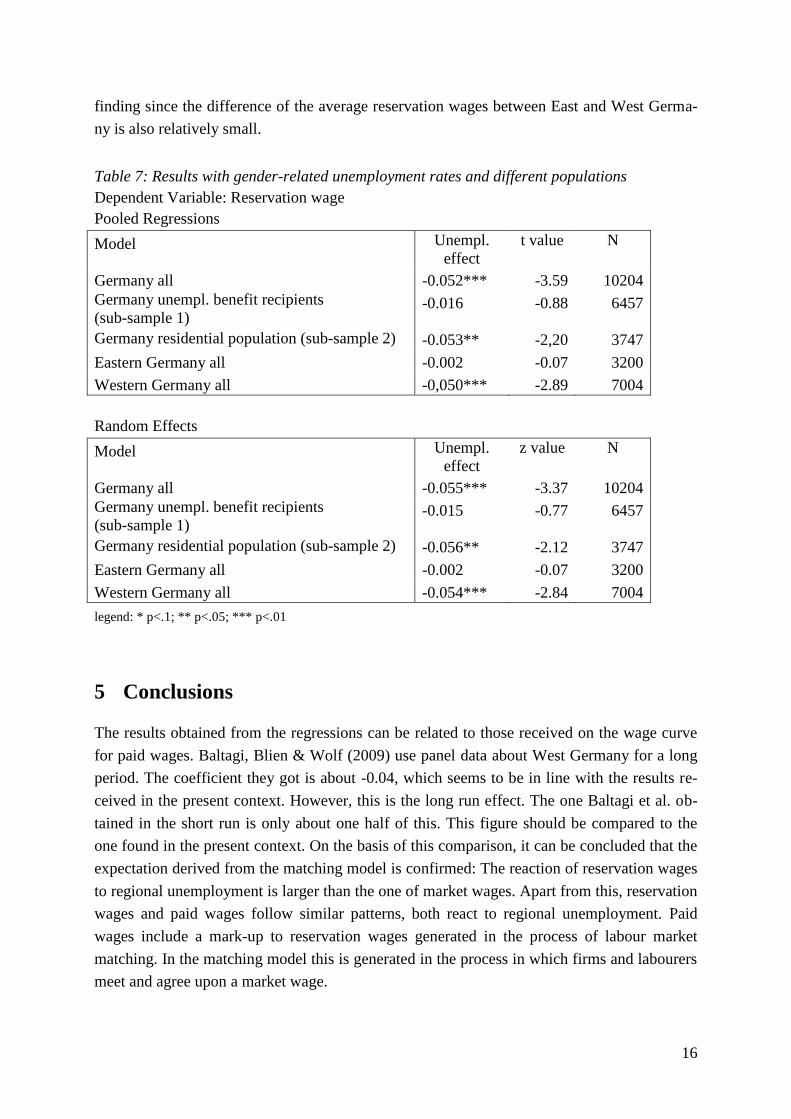
Table 7 shows that the estimated reservation wage curve is rather flat at low levels of wages.
This is the reason why there is no significant effect in Eastern Germany, for female workers
and for people receiving unemployment assistance (sub-sample 1). These workers expect to
earn less than the average. Taking into account cultural standards of a good or even an ac-
ceptable living, there is hardly any space for a variation due to unemployment. This effect is
relevant in spite of the small coefficient for East Germany. Let us use a regression analysis on
market wages with data from the German employment statistics as a benchmark. In a model
similar to the one used here, a dummy indicating a working place in the East has a highly sig-
nificant coefficient of -0.18. However, a corresponding dummy is only -0.024 for reservation
wages and it is only significant at the 10 %-level. This result indicates that the population of
Eastern Germany is still oriented towards Western standards.
In 1990 wages in the East were about one third of those in the West. However, they in-
creased very quickly in the East, much faster than productivity. This rising wage was driven
by high expectations in the East after unification and by neglecting the threat of unem-
ployment. Many workers in the East assessed the situation according to normative standards.
They thought of themselves as being of the same value as those in the West. Therefore, they
concluded, they ought to earn the same wage (Blien, den Butter 2003). There seems to be
remainders of this normative pattern, which is mirrored here by a relatively small value of
the dummy for Eastern Germany. The descriptive results (see Table 3) correspond to this
16
finding since the difference of the average reservation wages between East and West Germa-
ny is also relatively small.
Table 7: Results with gender-related unemployment rates and different populations
Dependent Variable: Reservation wage
Pooled Regressions
Model Unempl.
effect
t value N
Germany all -0.052*** -3.59 10204
Germany unempl. benefit recipients
(sub-sample 1) -0.016 -0.88 6457
Germany residential population (sub-sample 2) -0.053** -2,20 3747
Eastern Germany all -0.002 -0.07 3200
Western Germany all -0,050*** -2.89 7004
Random Effects
Model Unempl.
effect
z value N
Germany all -0.055*** -3.37 10204
Germany unempl. benefit recipients
(sub-sample 1) -0.015 -0.77 6457
Germany residential population (sub-sample 2) -0.056** -2.12 3747
Eastern Germany all -0.002 -0.07 3200
Western Germany all -0.054*** -2.84 7004
legend: * p<.1; ** p<.05; *** p<.01
5 Conclusions
The results obtained from the regressions can be related to those received on the wage curve
for paid wages. Baltagi, Blien & Wolf (2009) use panel data about West Germany for a long
period. The coefficient they got is about -0.04, which seems to be in line with the results re-
ceived in the present context. However, this is the long run effect. The one Baltagi et al. ob-
tained in the short run is only about one half of this. This figure should be compared to the
one found in the present context. On the basis of this comparison, it can be concluded that the
expectation derived from the matching model is confirmed: The reaction of reservation wages
to regional unemployment is larger than the one of market wages. Apart from this, reservation
wages and paid wages follow similar patterns, both react to regional unemployment. Paid
wages include a mark-up to reservation wages generated in the process of labour market
matching. In the matching model this is generated in the process in which firms and labourers
meet and agree upon a market wage.

17
The results obtained are of general importance. They open the veil which covers the wage
generation process, since they show in detail the results of the calculations and expectations
of workers. It is remarkable that there is a significant reaction in the reservation wage towards
regional unemployment. The expectations of workers are influenced by the unemployment
rate in the area their working places are located. Firms are able to use this regional variation,
which is one of the reasons why a wage curve for market wages is present. In the case of rela-
tively high unemployment rates, the expectations of workers are relatively low. They fear
staying unemployed which affects their reservation wages. Firms are able to use this weak-
ness of workers under the condition of high unemployment. The wage curve for paid wages
then reflects the shape of the curve for reservation wages – at least up to a certain degree.
We have seen that there are some exceptions from the described rule for (sub-)populations of
workers affected by relatively low wages. Due to high unemployment rates in East Germany
wages and reservation wages are considerably lower than the average, therefore there is no
tolerance for further (small-scale regional) variation of reservation wages. In the subpopula-
tion of the regions of West Germany, however, a reservation wage curve is present.
18
References
Baltagi, B.H., Baskaya, Y.S., Hulagu, T., 2013. How different are the wage curves for formal and
informal workers? Evidence form Turkey. Papers in Regional Science 92/1, pp. 271-283
Baltagi, B.H., Blien, U., Wolf, K., 2009. New Evidence on the Dynamic Wage Curve for Western
Germany: 1980-2004. Labour Economics 16/1, pp. 47-51.
Baltagi, B.H.; Blien, U.; Wolf, K., 2012. A Dynamic Spatial Panel Data Approach to the
German Wage Curve, in: Economic Modelling 29/1: 12-21
Baltagi, B.H.; Rokicki, B. 2014. The spatial Polish wage curve: with gender effects: Evidence
from the Polish Labor Survey. Regional Science and Urban Economics 49: 36-47
Bellmann, L., Blien, U., 2001. Wage Curve Analyses of Establishment Data from Western Germany.
Industrial and Labour Relations Review 54/4, pp. 851-863
Bender, S., Koch, S., Meßmann, S., Walwei, U., 2008. Was muten sich Arbeitslose zu? Lohnkonzes-
sionen von ALGII-Empfängern. Sozialer Fortschritt 3, pp. 75-84.
Blanchflower, D.G., Oswald, A.J., 1994. The Wage Curve. MIT Press, Cambridge (Mass.), London.
Blanchflower, D.G., Oswald, A.J., 2005. The Wage Curve Reloaded. NBER Working Paper 11338
Blanchflower, D.G., Oswald, A.J., 2006. The Wage Curve. An Entry for the New Palgrave, 2nd
edi-
tion.
Blien, U., 2001. Arbeitslosigkeit und Entlohnung auf regionalen Arbeitsmärkten. Physica, Heidelberg.
Blien, U., Butter, F. A.G. den, 2003. Scope for Future Employment Policy and Institutional Reform in
Germany and the Netherlands: a Rejoinder. In: Blien, U., Butter, F. den (eds.), Labour Participation
and Unemployment; a Comparison of Developments and Institutions in Germany and the Netherlands.
Working documents of the Scientific Council for Government Policy, The Hague, pp. 139-156.
Blien, U., Sanner, H., 2014. Technological Progress and Employment. Economics Bulletin 34/1: 245-
251
Carlin, W., Soskice, D., 1990. Macroeconomics and the Wage Bargain. A Modern Approach to Em-
ployment, Inflation and the Exchange Rate. Oxford University Press, Oxford.
Carlin, W., Soskice, D., 2006. Macroeconomics. Imperfections, Institutions and Policies. Oxford Uni-
versity Press, Oxford.
Christensen, B., 2003. Anspruchslohn und Arbeitslosigkeit in Deutschland. Mitteilungen aus der Ar-
beitsmarkt- und Berufsforschung 04/2003, pp. 573-598.
Christoph, B., et al., 2008. Codebook and Documentation of the Panel study ‘Labour Market and So-
cial Security’ (PASS) vol. 1: Introduction and Overview, Wave 1 (2006/2007). FDZ Datenreport
05/2008, Nuremberg.
Cingano, F., Schivardi, F. 2004. Identifying the Sources of Local Productivity Growth. Journal of the
European Economic Association 2/4, pp. 720-742
Combes, P.-P, Magnac, T., Robin, J.-M., 2004. The Dynamics of Local Employment in France. Jour-
nal of Urban Economics 56: 217-243
19
Contini, B., Pacelli, L., Revelli, R., 1994. Alternative Approaches to The Estimation Of Labor De-
mand (Does Firm Size Matter?). Paper presented at the Summer School “Recent Developments in
Labour Microeconometrics”, Paris.
Görmar, W., Irmen, E., 1991. Nichtadministrative Gebietsgliederungen und -kategorien für die Regio-
nalstatistik. Die siedlungsstrukturelle Gebietstypisierung der BfLR. Raumforschung und Raumord-
nung 49/6, pp. 387-394. Updated version: http://www.bbsr.bund.de/BBSR/DE/Raumbeobachtung/
Raumabgrenzungen/SiedlungsstrukturelleRegionstypenEuropa/NUTS3Zus/nuts3typenzusamm
_node.html
Hartmann, J., Brink, K., Jäckle, R., Tschersich, N., 2008. IAB-Haushaltspanel im Niedrigeinkom-
mensbereich, Methoden- und Feldbericht, FDZ Methodenreport 07/2008, Nürnberg.
Hummel, A.J., Elhorst, J.P., 2013. Regional labor productivity differentials explaining U.S. wage
curve patterns, paper presented at the North American Regional Science Conference, Atlanta
Layard, R., Nickell, S., Jackman, R., 2005. Unemployment. Macroeconomic Performance and the
Labour Market (new edition). Oxford University Press, Oxford. (first edition 1991)
Longhi, S., 2011. Job Competition and the Wage Curve. Regional Studies Online First.
Mortensen, D.T., 2010. Wage Dispersion in the Search and Matching Model. American Economic
Review 100/2, pp. 338-342.
Moulton, B.R., 1990. An Illustration of a Pitfall in Estimating the Effects of Aggregate Variables on
Micro Units. The Review of Economics and Statistics 72, pp. 334-338.
Petrongolo, B., Pissarides, C., 2001. Looking into the Black Box: A Survey of the Matching Function.
Journal of Economic Literature 39/2, pp. 390-431.
Pissarides, C.A., 2000. Equilibrium Unemployment Theory (2nd ed.). MIT Press, Cambridge (Mass.),
London.
Pissarides, C.A., 2009. The Unemployment Volatility Puzzle: Is Wage Stickiness the Answer? Eco-
nometrica 77/5, pp. 1339-1369.
Rudolph, H., Trappmann, M., 2007. Design und Stichprobe des Panels „Arbeitsmarkt und Soziale
Sicherung (PASS)“. In: Promberger, M. (ed.), Neue Daten für die Sozialstaatsforschung: Zur Konzep-
tion der IAB-Panelerhebung “Arbeitsmarkt und Soziale Sicherung“, IAB Forschungsbericht 12/2007,
Nürnberg, pp. 60-101.
Sato, Y., 2000. Search theory and the wage curve. Economics Letters 66, pp. 93-98
Shapiro, C., Stiglitz, J.E., 1984. Equilibrium Unemployment as a Worker Discipline Device. American
Economic Review 73/3, pp. 433-444.
Shilov, A., Möller, J., 2009. The Wage Curve in Russia, 1995-2005. Economics Letters 102/2, pp. 90-
92.
Trappmann, M. et al., 2010. PASS: a Household Panel Survey for Research on Unemployment and
Poverty. Schmollers Jahrbuch, Zeitschrift für Wirtschafts- und Sozialwissenschaften 130/4, pp. 609-
622.
Zenou, Y., 2009a. Endogenous Job Destruction and Job Matching in Cities. Journal of Urban Econom-
ics 65, pp. 323-336.

20
Zenou, Y., 2009b. Urban Labour Economics. Cambridge University Press, Cambridge.