the review body on doctors' and dentists' remuneration...
TRANSCRIPT
January 2016
The Review Body on Doctors' and Dentists' Remuneration (DDRB) Review for 2016 Written Evidence from the Health Department for
England 2016

2
Title: The Review Body on Doctors' and Dentists' Remuneration (DDRB) Review for 2016: Written Evidence
from the Health Department for England 2016
Author: S&ER Directorate/ Workforce/ Pay, Pensions & Employment Services / 13710
Document Purpose: Policy
Publication date: January 2016
Target audience:
Pay Review Bodies
Public
NHS Organisations
Contact details:
nhs_pp&[email protected]
You may re-use the text of this document (not including logos) free of charge in any format or medium, under the terms of the Open Government Licence. To view this licence, visit www.nationalarchives.gov.uk/doc/open-government-licence/
© Crown copyright
Published to gov.uk, in PDF format only.
www.gov.uk/dh
3
The Review Body on Doctors' and Dentists' Remuneration (DDRB) Review for 2016 Written Evidence from the Health Department for
England 2016
Prepared by NHS Pay, Pensions & Employment Services
4
Contents
Contents .................................................................................................................................... 4
Executive summary .................................................................................................................... 5
1. NHS Strategy and Introduction ......................................................................................... 9
2. Evidence on the General Economic Outlook ................................................................... 15
3. NHS Finances ................................................................................................................... 25
4. Recruitment, Retention, Motivation and Medical Workforce Planning........................... 34
5. Reforming Employment Contracts ................................................................................... 55
6. Contract Reform – General Medical Practitioners ........................................................... 57
7. Contract Reform – General Dental Practitioners ............................................................. 63
8. Salaried Primary Dental Care Services ............................................................................. 67
9. Contract Reform – Ophthalmic Practitioners ................................................................... 68
10. Pensions and Total Reward .......................................................................................... 69
Annex A 19 August 2015 Remit Letter from the Chief Secretary to the Treasury to PRB Chairs about Public Sector Pay 2016-17
Annex B 6 November 2015 DH Remit Letter from Lord Prior to Paul Curran
Annex C 2 June 2015 Financial Challenge Letter from Secretary of State to Chairs of NHS Trusts, NHS Foundation Trusts and Clinical Commissioning Groups
Annex D 3 August 2015 Monitor letter
Annex E 13 October 2015 Safe Staffing and Efficiency Letter from NHS Improvement, NHS England, NICE and CQC to NHS trusts and FTs
Annex F 30 November 2015 Agreement between BMA, DH and NHS Employers, and Memorandum of understanding
Annex G Pension Scheme Summary of benefits & comparison with 2015 scheme
Annex H List of Activities/Products Suggested to Support the Vision for Reward in the NHS
5
Executive summary
We are all rightly proud of our NHS and the staff that work incredibly hard for the benefit of patients. But the NHS continues to face major challenges and an ageing population will place more pressure on health and social care. We need measures to improve the safety culture in the NHS and further strengthen its transition to a modern patient-centric healthcare system. We understand pay restraint is challenging for staff and we know how tough this can be. We do, however, need to look seriously at the inbuilt cost of pay progression, £200 million a year gross for the medical workforce, and develop more affordable, sustainable pay systems.
We want the NHS and primary care to be the safest health care systems in a world, where
patients are right at the heart of everything it does. We are committed to working with the NHS to deliver seven day services so that patients get the same high quality, safe, urgent and emergency care on a Saturday and Sunday as they do on a week day. In the Spending Review and Autumn Statement the Government has made clear that it will prioritise the integration of the NHS and social care, spending £120 billion a year by 2020/2021 to create a seven day NHS.
NHS England’s Five Year Forward View published in October 20141 states that new models of care cannot be designed unless the NHS has the right numbers of staff with the right skills, values and behaviours:
"NHS employers and staff and their representatives will need to consider how working patterns and pay and terms and conditions can best evolve to reward high performance, support job and service redesign and encourage recruitment and retention in parts of the country and in
occupations where vacancies are high”.
To support the delivery of seven day services, we have embarked on contract reform right across the non-medical and medical workforce. Employers tell us that they need contracts that work for staff and patients and which are affordable and sustainable.
But pay is not the only part of the NHS employment offer. In a demanding health care environment, it is vital trusts focus hard on their staff engagement strategies and that they more effectively use the entire employment offer by taking a Total Reward (TR) approach which includes presenting both pay and non-pay benefits. This can help employers recruit and retain the skilled and compassionate workforce they need.
The Department is working with NHS Employers to build the business case and strategy for implementing TR across the NHS over the next few years. This aims to build on the success of rolling out Total Reward Statements (TRS) to NHS staff whose employers use the Electronic Staff Record (other NHS staff receive Annual Benefits Statements).2 TRS help clarify for staff their pay, pension and other financial allowances as well as locally available reward offers such as health and wellbeing programmes, learning and development, flexible working opportunities, childcare vouchers, cycle to work schemes etc.
Funding to deliver health care and how the system achieves this to the right standard and in a safe and sustainable way are interdependent. The NHS must deliver against the key standards of patient care and it must also live within its means; it cannot choose one or the other. This relies on constraining pay bill growth to help deliver quality services and protect front line
1 https://www.england.nhs.uk/wp-content/uploads/2014/10/5yfv-web.pdf 2 http://www.nhsbsa.nhs.uk/TRS.aspx

The Review Body on Doctors' and Dentists' Remuneration (DDRB) Review for 2016
6
staffing. It also relies on staff and system leaders working together to create an environment which supports continuous learning and innovation.
The government is doing its part. We have introduced a range of financial controls to help trusts make better use of their budgets. The controls set out in more detail in Chapters 1, 3 and 5, range from reviewing and clamping down on unjustified high pay of very senior managers to helping the NHS bring down spiralling agency staff bills - which cost the NHS £3.3 billion last year, more than the cost of all that year’s 22 million Accident and Emergency admissions combined.
Government Pay Policy
The government has made clear that continued pay restraint in the public sector remains a vital element of its fiscal consolidation plans. In the summer budget, the Chancellor announced that, from 2016/2017, public sector pay increases will be funded at an average of 1% in each year up to 2019/2020. The Chancellor also said that the government will continue to examine pay reforms and modernise the terms and conditions of public sector workers.
The Autumn Statement and Spending Review sets out a long term economic plan to control public expenditure and return the country to surplus, which includes reforming public services.
At a time of difficult decisions the government’s pay policy will help ensure the NHS workforce is affordable and help protect jobs.
Recruitment and Retention
For this pay review round, the Chief Secretary to the Treasury’s (CST) remit letter (Annex A) asked that we consider how best to target an average of 1% to support recruitment and retention. We do not believe there are significant recruitment and retention challenges that would be resolved by awarding more than one per cent on a staff group or regional basis3.
The recruitment and retention picture for the NHS remains strong. Measures of staff engagement in the staff survey and in the Friends and Family Test (FFT) remain largely positive. The trend for motivation - “the extent to which staff look forward to going to work, and
are enthusiastic about and absorbed in their jobs” has been fairly stable but with some variation across trust types showing that there is scope for improvement. Pay satisfaction has however dipped from 38% to 33% which is understandable given the consolidated pay award for most employed NHS staff was around 2% over the last parliament.4 Pay accounts for around 60% of
a trusts’ entire expenditure. Incremental pay costs the NHS £200 million (gross) every year for medical staff on top of annual pay awards. NHS England's most recent ‘staff friends and family test’ survey shows that the majority of staff (63%) would recommend their trust as a place of work and 79% would recommend their trust as a place to receive care.
Vacancy rates are an important element of workforce planning at local and national levels. The Health and Social Care Information Centre (HSCIC) consulted on the publication of its August 2015 NHS job data, the responses to which will be collated and which will inform the next publication of NHS Jobs data in late February 2016. We expect the next publication will provide more meaningful information on vacancies by occupational group and by region.
Currently, data derived from NHS Jobs reflects the number of job advertisements and the number of staff recruited as a result. However, some advertisements cover multiple posts, and
3 https://www.england.nhs.uk/wp-content/uploads/2014/10/5yfv-web.pdf 4 http://www.nhsstaffsurveys.com/Page/1010/Home/NHS-Staff-Survey-2015/

NHS Strategy and Introduction
7
the number of staff recruited is captured only if the employer decides to record it on the NHS Jobs system. There are recruitment and retention pressures in certain groups and areas but there is no evidence that awarding higher pay increases to particular staff groups or on a regional basis would resolve these.
Summary
To ensure patients are at the centre of everything the NHS does, we need to invest in the substantive workforce, relying on temporary staffing by exception.
The content of our evidence this year reflects the government’s priority for reducing the deficit whilst ensuring public sector workforces are affordable and that contracts are reformed to better support the delivery of public services. In the NHS, the affordability and flexibility of national pay frameworks is vital to support different ways of working to meet increasing demand and to support the delivery of seven day services.
As set out in Lord Prior’s remit letter to you, the Department will provide high level evidence focussing on the economic and financial (NHS funding) context and strategic policy with separate evidence provided by:
NHS Employers and NHS providers on recruitment, retention, motivation and morale for
employed NHS staff on medical terms and conditions;
Health Education England (HEE) on education, training and workforce capacity; and
NHS England - high level information on affordability and funding constraints and an update
on the Five Year Forward View.
The subsequent chapters of the Department’s evidence, therefore, set out:
Chapter 1, how pay strategy should support contract reform;
Chapter 2, the general economic outlook for the UK economy which underlines the need for
continued public sector pay restraint which is a crucial part;
Chapter 3, NHS Finance;
Chapter 4, workforce vacancy rates, analysis of leaving rates, agency spend, discusses staff
engagement, and medical workforce planning including international recruitment.
Chapter 5, contract reform for juniors, consultants, and SAS doctors;
Chapter 6, contract reform General Medical Practioners;
Chapter 7, contract reform for General Dental Practioners;
Chapter 8, contract reform for Salaried Primary Dental Care services;
Chapter 9, contract reform for Ophthalmic Practioners; and
Chapter 10, current position on pension reform and Total Reward for staff.
In conclusion, we do not believe there is currently the evidence to support the targeting of a 1% pay award on an occupational or regional basis. Distributing a one percent award in this way will not resolve or improve recruitment, retention or motivation for medical staff.
Although the government has provided sufficient funding across the public sector to fund a pay award at an average of 1% in each of the four years from 2016/2017, the NHS must make better use of its £45 billion pay bill. NHS employers need to look carefully at the TR offer and

The Review Body on Doctors' and Dentists' Remuneration (DDRB) Review for 2016
8
how the pay and non-pay benefits employers can offer locally could help them recruit and retain the staff they need. We want NHS Employers and NHS trades unions to work together, in a balanced and fair way to support new ways of working as identified in the Five Year Forward View and which help support the delivery seven day services.

9
1. NHS Strategy and Introduction
1.1. The Spending Review and Autumn Statement makes clear the Government’s ambition to return the country to surplus and to reform public services. Across the Spending Review period day to day departmental spending will fall on average at less than half the rate of the preceding five years.
1.2. The government has chosen to invest £120 billion a year by 2020/2021 to protect the position of the NHS as a world class health system, and will drive forward ambitious plans to integrate health and social care services by 2020. The Spending Review:
provides the NHS in England £10 billion per annum more in real terms by 2020/2021 than in 2014/2015, with £6 billion a year available by the first year so that the NHS’ own Five Year Forward View is fully funded enabling it to deliver services seven days a week;
enables universities to provide up to 10,000 additional nursing training places this Parliament by replacing direct funding with loans;
gives local councils the power to increase social care funding through a new 2% Council Tax precept;
lays out a radical, local-led plan to create an integrated health and social care system by 2020, backed by an extra £1.5 billion in the Better Care Fund through local authorities; and
confirmed the government will invest over £5 billion in health research and development over the next 5 years through the Department of Health.
1.3. The overarching aim of healthcare workforce policy is to ensure the right workforce with the right skills is available and affordable in the right place at the right time to provide the services patients need. To achieve this we need to be able to recruit and retain high quality, highly motivated staff in sufficient numbers and enable their training and development throughout their career to reflect the way services and technology will change.
1.4. In an environment of limited resources and ever rising demand for health and social care services, affordability of the workforce requires a balance of pay and reward which is sufficiently attractive to enable the recruitment and retention of a high quality workforce and maintain good industrial relations. As part of this, we need to recognise the importance of building the right incentives into the pay system so that it encourages compassion, flexibility and innovation within the workforce.
Workforce
1.5. We are committed to making sure we have enough NHS staff to meet patients’ needs. We already have 7,600 more nurses on our wards and 10,500 more doctors since May 2010. It will be for local providers and their Local Education and Training Boards (LETBs) to develop workforce plans for delivering seven day services in hospitals and primary care which will make the best use of staff skills and expertise. While there may be additional staff needed, we are working with NHS England to make sure we have the workforce we need, including looking at new working patterns and roles such as physician associates. Trusts spend around 60% of their funding on pay which is why we believe contract reform is crucial to help ensure the workforce is affordable and sustainable.

The Review Body on Doctors' and Dentists' Remuneration (DDRB) Review for 2016
10
1.6. The health service cannot function without a supply of highly trained healthcare professionals to provide services funded by the NHS. The NHS subsidises the education and training system through HEE at an annual cost of almost £5 billion to control the supply of core staff groups. Centrally, we need to ensure that the education and training “offer” is attractive enough to recruit sufficient high quality students, recognising the clinical nature of their training, whilst also reflecting changes in the wider higher education system and providing value for money for the significant investment in training and developing the future NHS workforce.
1.7. Maintaining the quality of healthcare services has become a high priority since the publication of the Francis report on Mid Staffordshire Foundation Trust. This has led to an extra focus on professional regulation, the training and development of healthcare
assistants and the supply of key groups of healthcare professionals - especially nurses and GPs. However, increasing numbers of healthcare professionals in the short term is difficult because of the time taken to train them, so this requires short term action including return to practice initiatives, retention campaigns and the need to ensure essential international recruitment is supported by wider government policies.
1.8. The world’s fifth largest organisation needs to become the world’s largest learning organisation. Learning will be as much about efficiency as it is about quality, given the tight financial constraints we face. As trusts embark on that journey, they will need a great deal of support. The operating name for the new jointly-led Monitor and TDA is NHS Improvement5. Together they will be responsible for increased support to hospitals to continue to improve care, boost efficiency and embed hospital safety as a key priority.
Seven Day Services
1.9. The government committed in its manifesto to ensuring patients can receive the hospital care they need, seven days a week by 2020, and ensuring hospitals are properly staffed, so that the quality of care is the same every day of the week.
1.10. Implementation of seven day services will be achieved by supporting trusts to meet the four priority standards by 20206 identified as having the most impact on reducing risk of weekend mortality. These are:
Standard 2: Time to Consultant Review
Standard 5: Access to Diagnostics
Standard 6: Access to Consultant-directed Interventions
Standard 8: On-going Review
1.11. The trajectory is for 25% of the population to be covered by March 2017, 50% by March 2018 and complete coverage by March 2020. Self-assessments of how far trusts are implementing the four standards are to be organised by NHS England. Trust and national level data will be published at the end of April and October each year, including on MyNHS7.
5 https://www.gov.uk/government/news/government-announces-monitor-and-trust-development-authority-move-to-single-leadership-to-deliver-increased-support-to-hospitals
6 https://www.england.nhs.uk/ourwork/qual-clin-lead/7-day-week/
7 MyNHS is a comparison website tool, that allows health and social care organisations to see how their services compare with those of others. It has been developed by NHS England, together with the Department of Health, the Health and Social Care Information Service, the

NHS Strategy and Introduction
11
1.12. In order to measure the outcomes from more seven day services in hospitals, we will establish a headline metric focusing on mortality. Two supporting metrics are already being developed: length of stay by day of the week for emergency admissions, and emergency readmissions by day of discharge for all admissions. We intend that the metrics will be published regularly at trust level as official statistics from January 2016.
1.13. The Royal College of Surgeons, the Royal College of Physicians, and the Royal College of Anaesthetists have been supportive about the need for seven day services, particularly for urgent and emergency care.
The Government’s Four Year Pay Policy
1.14. The government has made clear that fiscal consolidation remains its priority. Pay restraint will help the NHS and other parts of the public sector to afford the workforce it needs to provide vital public services.
1.15. The government is clear that automatic incremental pay progression should be removed from public sector pay systems. In the NHS, a typical nurse currently receives seven years of pay progression, employed doctors in training currently receive automatic incremental pay for time served and consultants have a 19 year pay progression system.
1.16. We have to look seriously at the inbuilt cost of pay progression, £200 million for employed medical staff, and develop more affordable, sustainable pay systems. At a time of difficult decisions, the government’s pay policy will help to ensure the NHS workforce is affordable and protects jobs.
1.17. Over the next four years the government’s pay policy includes:
average pay increase of 1% - 2016/2017; 2017/2018; 2018/2019 and 2019/2020; and
introduction of a new compulsory National Living Wage (NLW) from April 2016 set at £7.20 from next April rising to £9.00 an hour by 2020 which replaces the minimum wage currently £6.50 an hour.
Helping Trusts Meet the Financial Challenge
1.18. In his letter of June 2015 to Chairs of NHS Trusts, NHS Foundation Trusts (FTs) and Clinical Commissioning Groups, the Secretary of State emphasised that keeping control of the paybill, while ensuring the NHS can recruit and retain high quality staff, is a crucial part of meeting the efficiency challenge. Measures include:
clamping down on unjustified excessive pay for very senior managers and the expectation that new redundancy terms, which limit pay-outs should apply to executive staff in the same way they apply to AfC staff; and that
compulsory exits through redundancy should be used as the very last resort for all staff, with organisations seeking to re-deploy staff wherever possible. See Annex C.
Care Quality Commission and Public Health England. It gives commissioners, providers and professionals a central snapshot of published data, to drive improvements in the quality of care. https://www.nhs.uk/service-search/performance/search
The Review Body on Doctors' and Dentists' Remuneration (DDRB) Review for 2016
12
1.19. The government has also proposed a cap of £95,000 on exit payments, including redundancy, in the public sector. This is being put into effect through the Enterprise Bill (currently awaiting its second reading).8 If this becomes law all public sector employees will be subject to this cap and it will affect all exit payments from Summer 2016. The Government will also consult on further measures to ensure exit payments are fair and proportionate across the public sector.
1.20. Other Sections 154 to 157 of the Small Business, Enterprise and Employment Act 2015 which comes into effect on 1 April 2016 will enable claw-back of redundancy payments of high earners who are re-hired within the public sector.9
1.21. In August this year, Monitor wrote to all trusts emphasising the need for strong financial management. Monitor is working closely with trusts in deficit, and have introduced a mandatory approvals processes for spending on consultancy in relation to those trusts in breach of their licence. The overall approach is not limited to those trusts most in need, but is designed to ensure the NHS makes better use of their budgets. This work is informed by Lord Carter’s review on “The Model Hospital” and the central procurement initiative.10 Monitor’s letter at Annex D also references the March 2013 AfC collective agreement - “Implementing fully the Agenda for Change 2013 agreement on pay progression”.11
Temporary Staffing
1.22. On 13 October 2015 the Secretary of State announced a cap on the hourly rates per shift agencies can charge for providing staff to the NHS.12 These measures are expected to remove £1 billion from agency spending bills over the next three years.13 The caps will gradually decrease over time, so that in future agencies cannot charge the NHS a shift rate that is more than the hourly rate paid to existing substantive doctors, nurses and other staff. The measures will help improve the current situation where staff who undertake short-term agency work can receive greater rewards than those in a substantive post which provides better continuity of care for patients. The consultation exercise concluded on 13 November. The caps are set slightly higher than the pay that substantive staff receive, but will be gradually reduced to the same level as substantive staff plus 55% by April 2016. This gradual reduction in the cap will mean trusts are better able to manage this change. The 55% uplift accounts for employment on-costs including
8 http://services.parliament.uk/bills/2015-16/enterprise.html
9 https://www.gov.uk/government/uploads/system/uploads/attachment_data/file/396597/DRAFT-_Exit_Payment_Regulations_vFinal.pdf 10 https://www.gov.uk/government/uploads/system/uploads/attachment_data/file/434202/carter-interim-report.pdf
11 http://www.nhsemployers.org/your-workforce/pay-and-reward/nhs-terms-and-
conditions/nhs-terms-and-conditions-of-service-handbook
12 https://www.gov.uk/government/consultations/national-price-caps-for-agency-staff-
working-in-the-nhs
13 https://www.gov.uk/government/news/clampdown-on-nhs-staffing-agency-costs

NHS Strategy and Introduction
13
employer pension contribution, employer national insurance, holiday pay to the worker and a modest administration fee.
1.23. The price caps have been developed with, and are supported by clinical leaders in Care Quality Commission (CQC) and NHS England. Trusts will be able to override caps where absolutely necessary to protect patient safety. Any overrides will be subject to scrutiny by Monitor and the TDA.
1.24. Monitor and the TDA published guidance14 on the price caps for procuring agency staff in the NHS following the conclusion of the consultation on the rules, the specific caps and the associated impact assessment.
“The price caps are intended to support trusts when they procure from agencies and to encourage staff to return to permanent and bank working. They should enable trusts to manage their workforce in a more sustainable way, reduce reliance and expenditure on
agency staffing, raise quality and improve the working environment for their staff”. CQC are working closely with NHS Improvement to ensure ongoing patient safety.
Contract Reform
1.25. NHS contracts are over a decade old. Pay Review Bodies, employers, staff and trades unions have all identified key areas for reform. The government has been clear that reforms should be delivered on a cost neutral basis. Across the employed workforce there is consensus that, for example incremental pay systems should be reformed. You have observed that, to deliver this the partners need to discuss and agree a balanced package of reforms as described earlier. The government wants to see every penny of the £45 billion pay bill for employed staff used to deliver the best possible care for patients.
1.26. Those that choose a career in the NHS want to provide excellent care whenever and wherever needed. A stronger emphasis on linking pay more closely to performance/responsibility rather than incremental pay for time served is a common theme across the NHS workforce. Patient care is a team effort and contract reform will also help trusts ensure the right staff are rostered across seven days. For example, we are working with the BMA on contract reform, to replace the contractual right of consultants to opt out of non-emergency work at the weekends and evenings with stronger safeguards over working hours. Replacing the ‘opt out’ will help to increase the availability of senior decision makers, not only for patients but as a crucial part of the entire health care team.
1.27. We know that patients would not understand why care in a 24/7 health care system at particular times of the day or week can cost much more to deliver. Contract reform intends to strike a fair balance between providing care whenever and wherever that care is needed whilst recognising that NHS staff, in common with employed staff in the public and private sectors right across the country also want to balance work in the evenings, overnight and at weekends with family/caring responsibilities.
14 https://www.gov.uk/guidance/rules-for-all-agency-staff-working-in-the-nhs
The Review Body on Doctors' and Dentists' Remuneration (DDRB) Review for 2016
14
Staff Engagement
1.28. Good staff support and engagement is directly related to patient experience, safety and quality of care. The NHS is a place where staff should want to work and each organisation must develop an environment and culture which embeds not only the NHS Constitution but develops its own values around commitment to excellent, safe patient care where staff feel safe, bullying is not tolerated and where they are supported and properly rewarded.
Summary
1.29. The overall NHS employment offer is still very attractive and continues to enable employers to recruit the staff the NHS needs. All employers should ensure they are making the best use of TR to help recruit and retain staff. Ensuring staff understand their overall employment offer through their TRS,15 will raise awareness of the national and local benefits available to them.
1.30. Following the events at Mid Staffordshire Hospital, we need meaningful performance and appraisal systems that reward staff not just for what they do for patients but how they care for them – demanding competence, the right behaviours and values to keep patients safe.
1.31. The NHS continues to face the most significant financial challenge of its history despite being protected in real terms. This means trusts must make every penny count. We are doing our part, for example, by driving down spend on employing staff through agencies and banks so trusts can invest in their substantive workforce. Trusts must achieve financial balance and strive to make the NHS the safest healthcare system in the world. They must continue to look forward, harnessing new technologies and new ways of working for the benefit of patients. For example by:
delivering seven day services;
reducing emergency admissions and length of stay; and
making more efficient use of expensive technology.
1.32. The NHS in England is already among the best healthcare systems in the world and that is down to the hard work NHS staff do every day to ensure patients are treated with dignity and respect. Developing a NHS which continues to focus hard on learning and continuous improvement will help create the innovations it needs to make the best use
tax payer funding.
1.33. Ensuring the NHS is a place staff want to work is not just about pay. The NHS must work hard to improve the capability and capacity of the HR community and system leaders so they can bring staff with them as they seek to reform health care systems and national employment contracts. Making that happen means using the overall employment offer more effectively. Good leadership and effective staff engagement strategies will help improve morale, we know high levels of staff engagement are linked to patient satisfaction and improved outcomes.
15 http://www.nhsbsa.nhs.uk/TRS.aspx

Evidence on the General Economic Outlook
15
2. Evidence on the General Economic Outlook
Introduction
2.1. The UK economy grew faster in 2014 than any other major advanced economy at 2.9%, its best performance since 2005. The Spending Review and Autumn Statement set out the government’s long term economic plan to fix the public finances, return the country to surplus and run a healthy economy that starts to bear down on the excessive national debt. It recognises the risks from abroad and the need to secure Britain’s economic
future.
2.2. Public sector pay restraint has been a key part of the fiscal consolidation so far. It helped save approximately £8 billion in the last Parliament and is expected to save another £5 billion in the current Parliament. At a time when further spending reductions are required to complete the repair of the public sector finances, a policy of pay restraint makes a significant contribution to protecting jobs and maintaining public services.
2.3. At Summer Budget 2015 the government announced that it would fund public sector workforces for pay awards of 1% for four years from 2016/2017 onwards. The Office for Budget Responsibility (OBR) estimates that this policy will protect 200,000 jobs by 2019/2020. The government expects that pay awards will be applied in a targeted manner to support the delivery of public services, ensuring that flexibility exists to meet any recruitment and retention pressures.
2.4. The UK economy is fundamentally stronger than five years ago, with positive growth since the first quarter of 2013. The UK economy grew by 0.4% in the third quarter of 2015 and the OBR forecast the UK economy to grow by 2.4% in 2015 overall.
2.5. Since 2010 the deficit has halved as a share of GDP and for the first time since 2001/2002, the national debt is forecast to fall in 2015/2016, meeting the target set out in 2010. However, risks remain to the recovery, including from slower growth in the global economy. Debt stands at its highest share of GDP since the late 1960s, and the deficit remains among the highest in advanced economies. At Spending Review and Autumn Statement, the government set out the action it would take to complete the job of
repairing the public finances started in the last Parliament. The government will reduce the deficit at the same rate as in the previous Parliament (around 1.1% of GDP a year on average) to reach an overall surplus of £10.1 billion in 2019/2020. Running a surplus on the headline measure of borrowing is the most reliable way to bring down debt as a share of GDP in the long term.
2.6. Inflation is forecast by the Bank of England and OBR to remain low for rest of the year, before returning gradually to the 2% target in the medium term. The OBR forecast inflation of 0.1% in 2015 and 1.0% in 2016. The Bank of England’s latest inflation forecast, published in the November Inflation Report has been revised down compared to the August report. The Monetary Policy Committee (MPC) expect inflation at 0.1% (down from 0.4%) in the year to Q4 2015, 1.25% (down from 1.6%) in the year to Q4 2016, and unchanged at 2.1% in the year to Q4 2017.
2.7. Headline employment and unemployment figures were strong in 2013 and 2014. This trend has continued in 2015 with employment almost continuously rising, reaching a record high in the three months to October of 31.3 million, at a record rate of 73.9%. The OBR expects employment to increase by 1.1 million over the forecast period,

The Review Body on Doctors' and Dentists' Remuneration (DDRB) Review for 2016
16
representing employment growth of 3.5%. Unemployment fell by 244,000 in the year to Aug-Oct 2015 to a level of 1.71 million. The unemployment rate in the three months to October 2015 stood at a nine year low of 5.2%, down from the peak of 8.5% in the three months to November 2011. Real wage growth has remained at pre-recession rates. In the three months to October, total pay grew by 2.4% in both nominal and real terms, compared to the same period last year. Regular wages grew by 2.0% in nominal terms and 2.1% in real terms. Total pay in the private sector grew by 2.7%, while in the public sector (excluding financial services) it grew by 1.6%. Average earnings have outstripped inflation for 13 consecutive months, the longest period of real earnings growth since before the recession, and are forecast by the OBR to continue to grow faster than inflation for the entire forecast period.
Growth
2.8. In 2008 the UK was hit by the most damaging financial crisis in generations. Between Q1 2008 and Q2 2009 the UK economy contracted by 6.1%, greater than the reductions in growth in the US, France, and Canada.
2.9. The government’s long term economic plan has secured the recovery. The government’s fiscal responsibility has allowed monetary activism to support demand in the economy alongside repair of the financial sector. This has been supported by supply-side reform to deliver sustainable increases in standards of living.
2.10. UK GDP growth has been positive since the first quarter of 2013 and GDP is now 6.1% above its pre-crisis peak. Growth in 2014 was 2.9%, above the OBR’s March forecast of 2.6%. The UK economy grew by 0.4% in the third quarter of 2015, following 0.5% growth in the second quarter. The recovery is broad-based with widespread growth across all major sectors since the start of 2013, and production, services and construction all growing in the third quarter on a year earlier. The OBR’s forecast at Autumn Statement 2015 confirmed the UK recovery is well established with growth of 2.4% in 2015 and 2016 at 2.4%, before rising to 2.5% in 2017.
2.11. However, external risks remain, reinforcing the case for stability in the government’s long-term economic plan. The global economic recovery remains uneven and the risks from the world economy demonstrate the need to continue to fix the economy to ensure the UK can deal with risks from abroad.
2.12. As a part of its economic policy, the government has announced its intention to improve the UK’s productivity performance. Improving productivity is key to increasing living standards and delivering strong growth. The government has published a productivity plan, “Fixing the foundations: Creating a more prosperous nation”, which tackles the UK’s serious long-term challenges, with major reforms to improve the UK’s infrastructure, tackle failures in the skills system, improve the planning system, encourage long-term finance for productive investment and give cities the governance and powers they need to succeed.
2.13. In the Autumn Statement the government announced further measures to improve productivity in the UK including protecting per pupil funding for schools, providing an additional £1.3 billion (until 2019/2020) to attract new teachers into the profession, protecting today’s £4.7 billion science funding in real terms for the rest of the Parliament, investing up to £6.9 billion in the UK’s research infrastructure up to 2021; and proposing a new University focusing on Engineering, to be located in Hereford.

Evidence on the General Economic Outlook
17
Table 2.1: Forecasts for GDP growth 2015 to 2017
Forecasts for GDP growth (per cent) 2015 2016 2017
OBR (Summer Budget 2015) 2.4 2.3 2.4
IMF WEO (July 2015 update) 2.4 2.2 2.2
Avg. of independent forecasters (August 2015) 2.6 2.4 2.4
Inflation
2.14. November’s annual CPI inflation rate was 0.1%, up from -0.1% in August. External factors, such as oil and commodity prices, continue to exert significant downward pressure on inflation. Recently low inflation is good news for working families, helping their budgets stretch further with lower food and fuel costs. In the year to November 2015, food prices fell by -2.7% and prices of motor fuels fell by -12.9%.
2.15. Compared to the Bank of England’s August 2015 Inflation Report, the outlook for inflation in the August report has been revised downwards. The Monetary Policy Committee (MPC) judged that CPI inflation is likely to remain close to zero in the near term, before rising as past falls in energy prices begin to drop out of the annual comparison. The MPC expect inflation at 0.1% (down from 0.4%) in the year to Q4 2015, 1.25% (down from 1.6%) in the year to Q4 2016, and unchanged at 2.1% in the year to Q4 2017.
2.16. Inflation is forecast by the Bank of England and OBR to remain low for rest of the year, before returning gradually to the 2% target in the medium term. The OBR forecast inflation of 0.1% in 2015 and 1.0% in 2016.
Table 2.2: Forecasts for CPI Inflation 2015 to 2017
Affordability and Fiscal Strategy
2.17. Since 2010 the government has taken action to cut the deficit which has more than halved as a share of GDP from its 2009/2010 post-war peak. However, the job is not yet done. The deficit remains high compared to advanced economies and public sector net debt as a share of GDP has more than doubled since the pre-recession period. The government remains committed to eliminating the deficit and to getting debt as a share
Forecasts for CPI Inflation
(per cent change on a year earlier) 2015 2016 2017
OBR (Autumn Statement 2015) 0.1 1.0 1.8
IMF WEO (October 2015) 0.1 1.5 2.0
Avg. of independent forecasters (December 2015)
0.1 1.3 1.9

The Review Body on Doctors' and Dentists' Remuneration (DDRB) Review for 2016
18
of GDP on a declining path across the forecast period to return the public finances to a more sustainable position.
2.18. At Summer Budget the government announced its intention to reduce the deficit at the same average rate as over the previous Parliament. That means reducing the deficit by around 1.1% a year on average over the next four years. The government is maintaining this same pace of deficit reduction and has taken the decisions necessary to finish the job of repairing the public finances. Public sector net borrowing as a share of GDP is forecast to fall year-on-year across the forecast period and the government is expected to achieve a surplus of £10.1 billion in 2019/2020.
2.19. However continued action will be required in order to bring debt down to more sustainable levels. Last year, net debt as a share of GDP reached its highest level since
the late 1960s. By 2020/2021, it is still forecast to be 71.3%, significantly above there-recession level in 2007/2008. High debt increases the UK’s vulnerability to future shocks. Evidence suggests that at higher debt levels, the scope for fiscal policy to stabilise the economy is reduced.
2.20. A strategy for debt reduction must also take into account the possibility of future economic shocks. Independent monetary policy now delivers low and stable medium-term inflation to the benefit of the whole economy. This contrasts with the experience after World War II, when very high inflation, together with artificially low interest rates, played a major role in reducing debt. The UK economy has been subject to relatively frequent shocks in the past, and though their nature and timing are unpredictable, responsible fiscal policy should allow for them. Once future economic shocks are allowed for, running a deficit to finance capital investment (balancing only the current budget) and relying on trend economic growth is insufficient to bring down debt, as set out in HM Treasury analysis at Budget 2014. In a low inflationary environment, with economic shocks, the most reliable way to bring down debt as a share of GDP is to run an overall surplus in normal times. Substantial debt reduction in future will depend on responsible management of the public finances and sustainable economic growth.
Proposed new Charter for Budget Responsibility
2.21. On 14 October 2015, Parliament approved the government’s updated Charter for Budget Responsibility. The new fiscal rules commit the government to delivering a surplus by the end of the Parliament, and every year thereafter when the economy is in normal
times, entrenching a commitment to long-term fiscal sustainability. The Charter sets out:
A target for a surplus on public sector net borrowing in 2019/2020, and a supplementary target for public sector net debt to fall as a share of GDP in each year from 2015/2016 to 2019/2020.
A target, once a surplus is achieved in 2019/2020, to run a surplus each subsequent year as long as the economy remains in normal times.
2.22. Under the updated Charter, the surplus rule will be suspended if the economy is hit by a significant negative shock (defined as 4 quarter-on-4 quarter GDP growth below 1%). This provides flexibility to allow the automatic stabilisers to operate freely when needed. Following a shock, the government of the day will be required to set a plan to return to surplus, including appropriate fiscal targets. The framework does not prescribe what the targets should be, allowing the government of the day to respond to the circumstances. However, the targets will be voted on by the House of Commons and assessed by the OBR.

Evidence on the General Economic Outlook
19
2.23. The end goal is to ensure that long-term debt reduction continues, leaving the country better placed to withstand future economic shocks. Returning to a surplus in normal times will provide the government of the day with the fiscal space to allow appropriate action to be taken in the face of future shocks.
Labour market
2.24. After strong rises in 2013 and 2014, headline labour market figures slowed in the first half of 2015. 2014 saw the employment level increasing by over 600,000, and the employment rise in the first half of 2015 was 139,000, taking the level of employment to 31.0 million. Since then, employment has risen to record levels of 31.3 million. In the three months to September, the employment rate rose by 1.0 percentage point on the year to 73.9%, the highest rate on record. The unemployment rate fell by 0.8 percentage points on the year, and by 3.3 percentage points since the peak of 8.5% in the 3 months to November of 2011, to a nine year low of 5.2%. The OBR forecast the rate to stabilise at 5.4% by the end of the forecast period.
2.25. The number of vacancies in the three months to November 2015 stood at record levels, having increased by 45,000 over the year to 747,000. The number of unemployed people per vacancy fell to 2.3 in the three months to October 2015, down from a high of 5.9 following the recession.
2.26. Wage growth picked up in 2015, reaching levels of up to 3.3% in the three months to May. The most recent data shows more moderate total pay growth of 2.4% in the three months to October, in both nominal and real terms, with real wage growth remaining at pre-recession rates.
Employment and unemployment
2.27. Over the year to the three months to October 2015, employment grew by 505,000. The majority of this growth was among full-time employees, whose numbers increased by 348,000 on the year. The number of people in self-employment rose slightly on the year (71,000).
2.28. Over the year to Aug-Oct 2015, unemployment fell by 244,000 to 1.71 million, down 995,000 from the peak in the three months to November 2011.
2.29. Long term unemployment (unemployment of 12 months or more) stood at 509,000 in
Aug-Oct 2015, down by 175,000 over the year. Over 70% of the fall in total unemployment over the year came from the decrease in long term unemployment.
2.30. Working age inactivity (16-64) fell slightly on the year to the three months to October 2015, with the level and rate at 8.93 million and 21.9% respectively. The female inactivity rate also continued to decline, dropping 0.4 percentage points on the year.
2.31. Youth unemployment (16-24) fell by 129,000 over the year to Aug-Oct 2015. This was primarily amongst those not in full-time education. The youth unemployment rate stood at 13.6%, down 2.9 percentage points on the year. Excluding people in full-time education, there were 416,000 unemployed 16-24 year olds, with a corresponding unemployment rate of 12.2%.
2.32. The claimant count fell by 112,400 in the year to November 2015. The claimant count rate stood at 2.3%, the lowest level since February 1975. Table 2.3 summarises these statistics:

The Review Body on Doctors' and Dentists' Remuneration (DDRB) Review for 2016
20
Table 2.3: Labour market statistics summary (Levels in 000s, rates in %)*
2010 2011 2012 2013 2014 Aug-Oct 2015
Employment level (All aged 16 and over)
29,228 29,376 29,696 30,043 30,726 31,302
Employment rate (All aged 16-64)
70.4 70.3 71 71.5 72.9 73.9
Unemployment level
(All aged 16 and over)
2,497 2,593 2,572 2,476 2,027 1,713
Unemployment rate (All aged 16 and over)
7.9 8.1 8 7.6 6.2 5.2
Youth unemployment level (All aged 16-24)
933 996 1,005 969 783 625
Youth unemployment rate (All aged 16-24)
20 21.4 21.4 20.8 17 13.6
Claimant Count 1,496.4 1,534.4 1,585.6 1,421.0 1,037.6 796.2
* The latest public and private sector employment figures available are for the third quarter of 2015. These show that private sector employment rose by 226,000 on the quarter and was up
by 554,000 over the year. This more than offset the fall in public sector employment which decreased by 19,000 on the quarter and by 48,000 over the year. Over this period over six private sector jobs have been created for every public sector job lost. These series exclude the
effects of major reclassifications where large bodies employing large number of people have moved between the public and private sectors.
Public sector pay and pensions
2.33. The recent recession saw a significant fall in UK wage growth, particularly in the private sector. Analysis by IFS and ONS shows that over the last few years public sector workers have benefitted from a higher pay growth on average compared to workers with similar characteristics in the private sector. While the pay differential between public and private sector workers is narrowing, the overall remuneration of public sector employees when taking employer pension provision into account continues to be above that of the market.
2.34. Earnings growth in the private sector has been strong throughout 2015 and in the three months to October, total pay growth (including bonuses) stood at 2.7%, while private sector regular pay growth (excluding bonuses) also stood at 2.3%. Although low inflation has helped boost real wages, nominal private sector wage growth remains below rates seen before the recession (about 4-5% per annum).
2.35. Public sector average earnings growth was 1.3% in the three months to October 2015. Regular earnings (excluding bonuses) also grew by 1.3% over the same period. These

Evidence on the General Economic Outlook
21
rates stood above the rate of inflation in this period (-0.1%) but still below the pre-recession average growth rate, as in the private sector.
2.36. Historically, public sector wages tend to fall and recover at a slower pace during economic cycles than private sector wages – i.e. there can be a delay between a recession occurring and public sector wage adjustment. Since July 2014, private sector earnings growth has been faster than growth in public sector wages, but this follows on from sustained public sector wage growth in the years immediately following the recession. From the three months to March 2008 to the three months to October 2015, total average private sector earnings have increased by 10.4%, while those in the public sector have increased by 16.1%. The overall level of public sector average weekly wage remains above that of the private sector. Table 2.4 compares the growth in average
public and private sector weekly earnings since 2008.
Table 2.4: Total pay comparison
Source: Average Weekly Earnings, ONS Labour Market Statistics, December 2015
2.37. When considering changes to remuneration, it is important to consider other elements of the total reward package. Including hourly employer pension contributions to hourly pay and bonus, recent HMT analysis finds that public sector workers benefit from an 8% premium compared with their private sector counterparts. This is supported by the IFS (October 2014 paper), who found that a 4.6% pay premium continues to exist in favour of public sector workers and that the premium increases significantly if one incorporates pension payments in the analysis. This premium is driven by a number of factors including high pay for women, and protection for the low paid in the public sector. Table 2.5 shows the comparison of average hourly earnings for public and private sector workers with similar characteristics across time.
The Review Body on Doctors' and Dentists' Remuneration (DDRB) Review for 2016
22
Table 2.5: Estimated public-private hourly pay differential
2.38. The government wants to move from a low wage, high tax, high welfare society to a higher wage, lower tax, lower welfare society and wants to do this in a fair way by ensuring that low wage workers take a greater share of the gains from growth. An essential part of this is the introduction of a new National Living Wage (NLW) for workers aged 25 and above.
2.39. At Summer Budget 2015, it was announced that the NLW will increase pay to £7.20 per hour from April 2016, rising to £9.00 per hour by 2020, benefitting workers across the economy. Estimates indicate that the NLW policy is expected to directly benefit approximately 200,000 public sector jobs.
Pension reforms
2.40. One major factor in the overall reward package is pension provision. In the last few
decades pension provision in the public and private sectors has diverged, in response to pressures around longevity, changes in the business environment and investment risk. This has led to a sharp decrease in the provision of defined benefit schemes in the private sector. Around 85% of public sector employees are members of employer-sponsored pension schemes, compared to only 35% in the private sector.
2.41. Following a fundamental review of public service pension provision by the Independent Public Service Pensions Commission, the government has introduced key changes to the pension element of the remuneration package. New public service pension schemes introduced in April 2015:
calculate pension entitlement using the average earnings of a member over their career, rather than their salary at or near to retirement;
calculate pension benefits based on Normal Pension Age linked to the member’s State Pension Age; and
include an employer cost cap mechanism, which will ensure that the risks associated with pension provision are shared with scheme members to provide backstop protection for the taxpayer.

Evidence on the General Economic Outlook
23
2.42. The changes introduced through the Public Service Pensions Act 2013 will save an estimated £65 billion by 2061/2062.
2.43. Wider changes to public service pension provision have also taken place. Progressive increases in the amount that members contribute towards their public service pension began in April 2012 and were phased in over three years, with the final increases made in April 2014. Members are now contributing an average of 3.2 percentage points more, delivering £2.8 billion of savings a year by 2014/2015.
2.44. Protections from the impact of the contribution changes have been put in place for the lowest paid. Those earning less than £15,000 were not subject to increases; and increases for those earning up to £21,000 (£26,000 for Teachers) were capped at 1.5 percentage points.
2.45. Public service pensions will remain among the best available and will continue to offer members guaranteed, index-linked benefits in retirement that are protected against inflation. Private sector workers buying benefits in the market would have to contribute over a third of their salary each year to buy an equivalent pension.
2.46. Putting together the evidence on pension provision and pay levels – and recognising that there will be significant variation between and within individual workforces – the overall remuneration of public sector employees is above that of the market. The government is therefore clear that any changes to public service pensions, including the progressive increase in contributions from 2012/2013, do not justify upward pressure on pay.
Recruitment and Retention
2.47. Across the whole economy there is evidence that the labour market is performing strongly. There has been strong growth in employment and tightening of labour market slack, a record high number of vacancies. However, there is limited evidence of widespread recruitment and retention issues within the public sector, and resignation rates continue to be below pre-recession levels in this sector. Table 2.6 demonstrates recent resignation and early retirement rates in the public sector.
The Review Body on Doctors' and Dentists' Remuneration (DDRB) Review for 2016
24
Table 2.6: Resignation and Early Retirement Rates (up to Q4 2014)
Source: Labour Force Survey Microdata, ONS and HM Treasury analysis
2.48. The rate at which people are resigning from the public sector remains substantially below re-recession levels. Within the public sector, the resignation rate was relatively constant prior to the recession, in the region of 0.4 – 0.5%. From the middle of 2008 this rate fell sharply to 0.2 – 0.3%, potentially relating to opportunities outside the public sector becoming scarcer. Since then it has made little sustained recovery and remained within the range up to 2014. The early retirement rate figures increased between 2010 and 2011, but have subsequently fallen back again.
2.49. The CIPD Labour Monthly Outlook, Autumn 2015, indicates that amongst all private sector firms, where pay has increased by 2% or more, in only 22% of cases were pay awards set at that level because of recruitment and retention issues.
2.50. There is limited evidence of widespread recruitment and retention issues in the public
sector. The government’s expectation that the 1% pay award for 2016/2017 will be applied in a targeted manner to support the delivery of public services ensures that flexibility exists to meet any recruitment and retention pressures.

NHS Finances
25
3. NHS Finances
Funding Growth
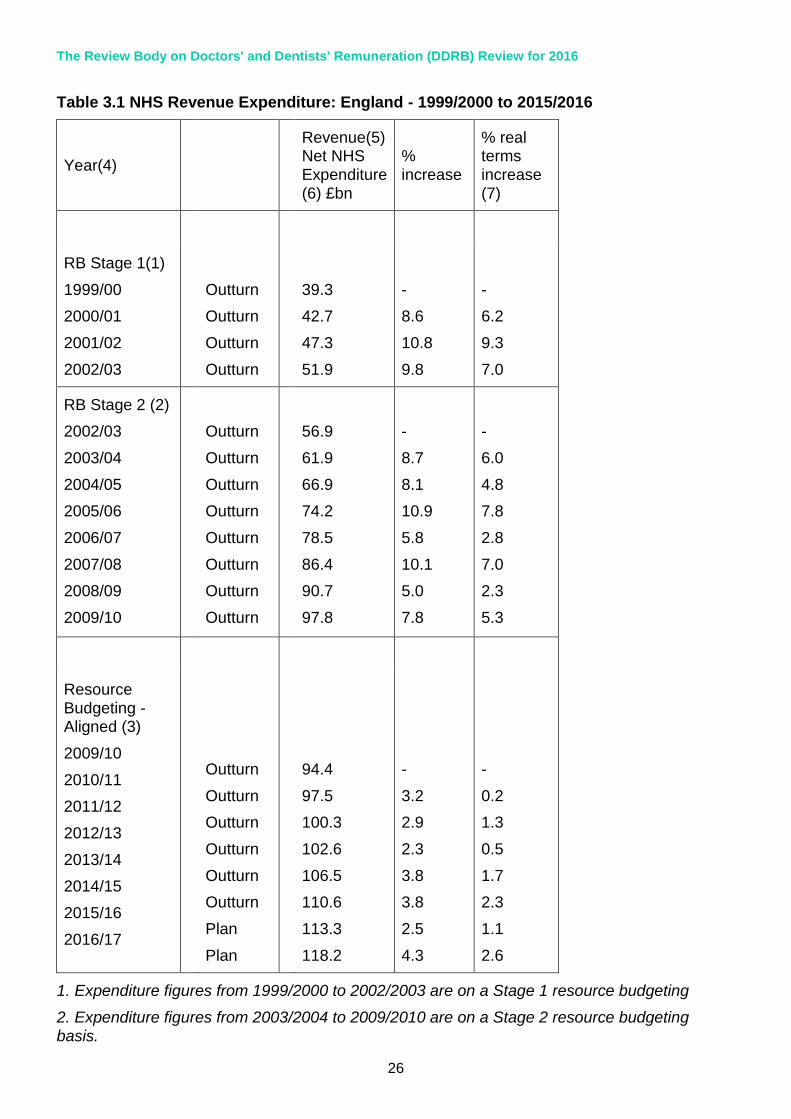
3.1. This chapter sets out the financial context for the NHS.
3.2. Between 1999/2000 and 2010/2011 NHS revenue expenditure increased by an average of 5.3% in real terms. The four years of the most recent spending review period (2011/2012 to 2014/2015) have shown subdued growth, averaging 1.4% per year in real terms. Table 3.1 shows:
Outturn NHS revenue expenditure figures from 1999/2000 to 2014/2015; and
Revenue Departmental Expenditure Limits (RDEL).
The Review Body on Doctors' and Dentists' Remuneration (DDRB) Review for 2016
26
Table 3.1 NHS Revenue Expenditure: England - 1999/2000 to 2015/2016
Year(4)
Revenue(5) Net NHS Expenditure (6) £bn
% increase
% real terms increase (7)
RB Stage 1(1)
1999/00
2000/01
2001/02
2002/03
Outturn
Outturn
Outturn
Outturn
39.3
42.7
47.3
51.9
-
8.6
10.8
9.8
-
6.2
9.3
7.0
RB Stage 2 (2)
2002/03
2003/04
2004/05
2005/06
2006/07
2007/08
2008/09
2009/10
Outturn
Outturn
Outturn
Outturn
Outturn
Outturn
Outturn
Outturn
56.9
61.9
66.9
74.2
78.5
86.4
90.7
97.8
-
8.7
8.1
10.9
5.8
10.1
5.0
7.8
-
6.0
4.8
7.8
2.8
7.0
2.3
5.3
Resource Budgeting - Aligned (3)
2009/10
2010/11
2011/12
2012/13
2013/14
2014/15
2015/16
2016/17
Outturn
Outturn
Outturn
Outturn
Outturn
Outturn
Plan
Plan
94.4
97.5
100.3
102.6
106.5
110.6
113.3
118.2
-
3.2
2.9
2.3
3.8
3.8
2.5
4.3
-
0.2
1.3
0.5
1.7
2.3
1.1
2.6
1. Expenditure figures from 1999/2000 to 2002/2003 are on a Stage 1 resource budgeting
2. Expenditure figures from 2003/2004 to 2009/2010 are on a Stage 2 resource budgeting basis.
NHS Finances
27
YearIncrease in
Revenue
Expenditure
Increase in
HCHS
provider
paybill
Proportion of
revenue
increase on
paybill
(£bn) (£bn) (%) (%) (£bn) (%) (£bn)
2001/02 4.6 2.4 51 7.3 1.6 4.5 0.9
2002/03 4.6 2.4 51 5.2 1.3 5.4 1.2
2003/04 6.5 2.6 41 5.4 1.4 5.2 1.3
2004/05 5.0 4.5 91 11.9 3.8 4.4 1.2
2005/06 7.3 2.5 34 4.7 1.6 3.2 1.0
2006/07 4.3 1.3 30 5.3 1.9 -1.4 -0.5
2007/08 7.9 1.3 16 4.1 1.5 -0.5 -0.2
2008/09 4.4 2.6 60 3.2 1.3 3.8 1.4
2009/10 7.1 2.7 39 1.9 0.8 5.0 2.0
2010/11 3.3 1.6 49 2.9 1.3 0.9 0.4
Average 5.5 2.4 44 5.3 1.6 2.8 0.9
2011/12 2.8 0.2 7 1.7 0.7 -1.2 -0.5
2012/13 2.3 0.6 25 1.2 0.5 0.1 0.0
2013/14 3.9 0.5 14 0.0 0.0 1.3 0.5
2014/15 4.1 1.0 25 0.2 0.1 2.2 0.9
Average 3.3 0.6 18 0.8 0.3 0.6 0.3
Increase in HCHS paybill
due to prices
Increase in HCHS paybill
due to volume
3. Expenditure figures from 2009/2010 to 2016/2017 are on an aligned basis following the government’s Clear Line of Sight programme.
4. Expenditure figures are not consistent over the period (1999/2000 to 2016/2017) and this should be noted when making comparisons between years.
5. Revenue is quoted gross of non-trust Depreciation and Impairments; prior to September
2007, revenue was quoted net of non-trust Depreciation and Impairments. This brings DH in line with HMT presentation of the statistics.
6. Expenditure excludes NHS (Annually Managed Expenditure (AME))
7. Real terms increase has been calculated using GDP as at 25/11/2015
Share of Resource Going to Pay
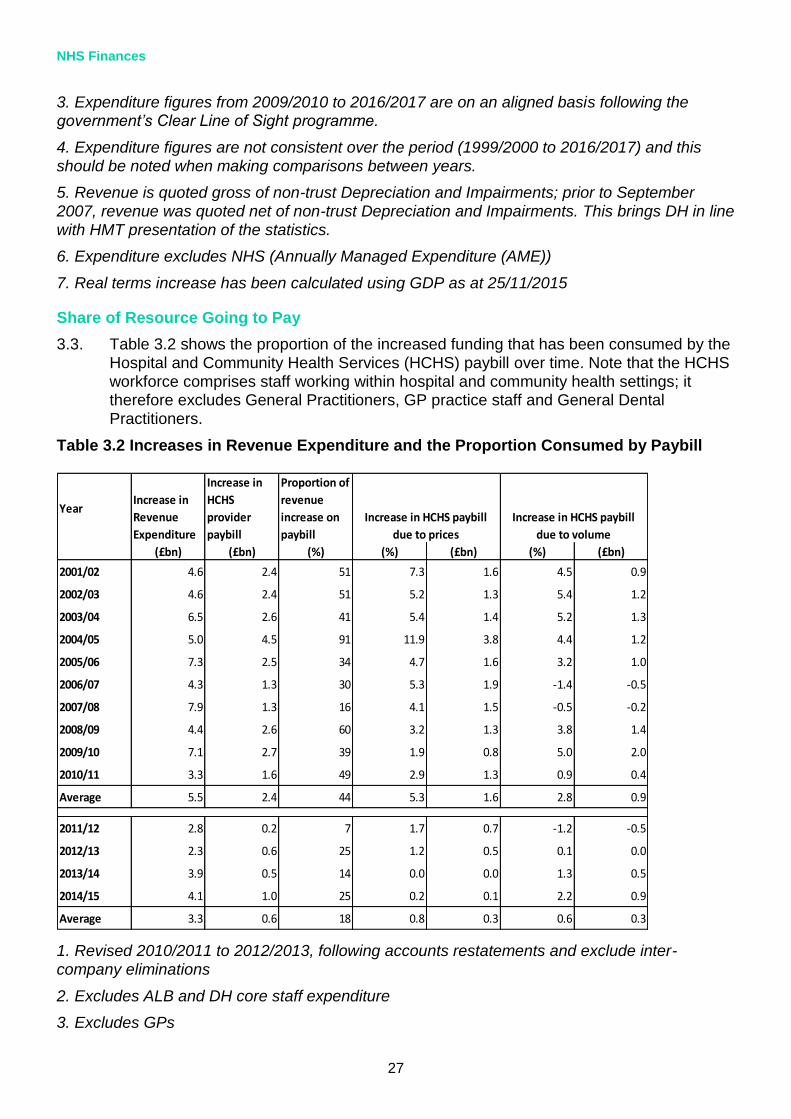
3.3. Table 3.2 shows the proportion of the increased funding that has been consumed by the Hospital and Community Health Services (HCHS) paybill over time. Note that the HCHS workforce comprises staff working within hospital and community health settings; it therefore excludes General Practitioners, GP practice staff and General Dental Practitioners.
Table 3.2 Increases in Revenue Expenditure and the Proportion Consumed by Paybill
1. Revised 2010/2011 to 2012/2013, following accounts restatements and exclude inter-company eliminations
2. Excludes ALB and DH core staff expenditure
3. Excludes GPs

The Review Body on Doctors' and Dentists' Remuneration (DDRB) Review for 2016
28
4. Volume & Price estimates changes methodology in 2010/2011 to make use of a more detailed staff group breakdown from ESR
5. Figures may not sum due to rounding.
3.4. On average, between 2011/2012 and 2014/2015, increases to the HCHS paybill have consumed 18% of the increases in revenue expenditure. Of these 18 percentage points, pay effects have consumed around 10 percentage points and volume effects around 8 percentage points.
3.5. HCHS pay is the largest cost pressure, on average it has accounted for around 39% of the increases in revenue expenditure since 2001/2002. As pay represents such a large proportion of NHS resources, managing the paybill is key to ensuring the NHS lives within the funding growth it has been assigned in the next year.
Pressures on NHS Funding Growth
3.6. Different priorities compete for limited funding growth given to the NHS. They are grouped into three categories:
baseline pressures;
underlying demand; and
service developments.
3.7. Baseline pressures cover the cost of meeting existing commitments that are essential for delivery of NHS services. They do not cover underlying demand, or increased levels of activity, which may arise due to demographic pressures or medical advances. Service developments are new areas of activity which arise due to new policies or ministerial commitments.
3.8. HCHS paybill pressures are the largest component of the baseline pressures and usually form the first call on NHS resources. Managing baseline pressures effectively allows the NHS to treat a growing, ageing population whilst making best use of the funding available.
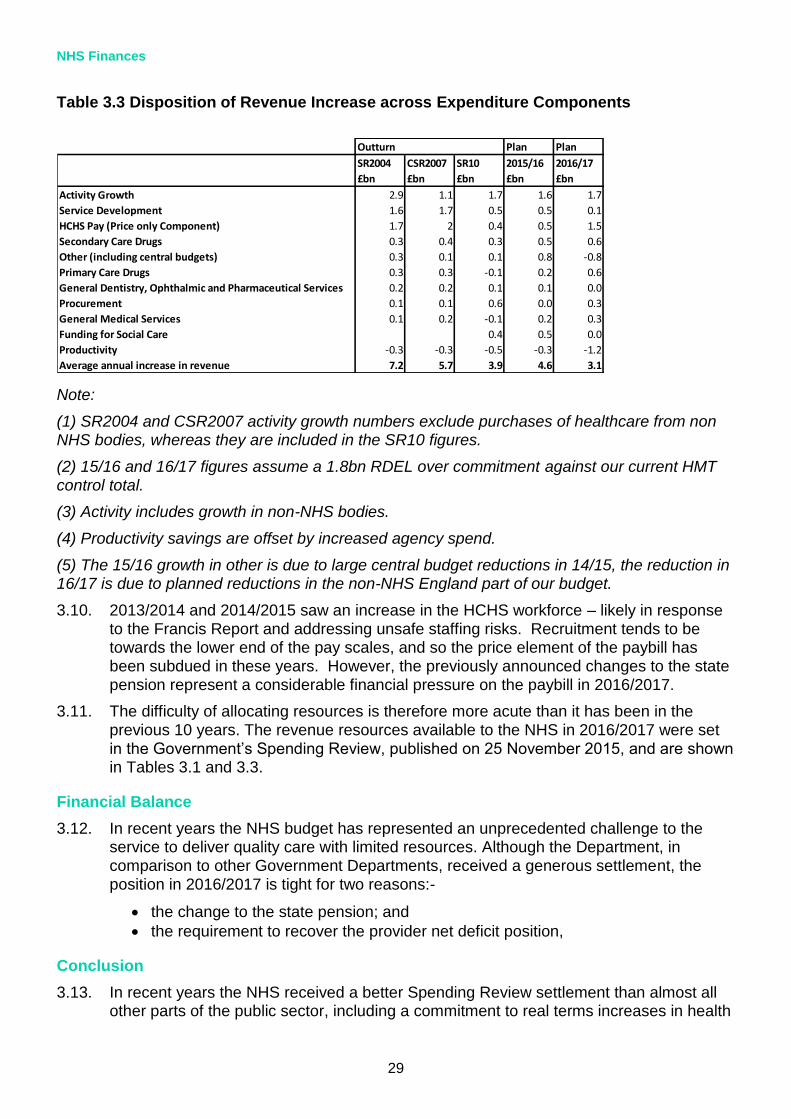
Allocation of Resources
3.9. Table 3.3 shows how funding increases have been allocated across baseline pressures, demand and service developments in previous Spending Review periods.
NHS Finances
29
Plan Plan
SR2004 CSR2007 SR10 2015/16 2016/17
£bn £bn £bn £bn £bn
Activity Growth 2.9 1.1 1.7 1.6 1.7
Service Development 1.6 1.7 0.5 0.5 0.1
HCHS Pay (Price only Component) 1.7 2 0.4 0.5 1.5
Secondary Care Drugs 0.3 0.4 0.3 0.5 0.6
Other (including central budgets) 0.3 0.1 0.1 0.8 -0.8
Primary Care Drugs 0.3 0.3 -0.1 0.2 0.6
General Dentistry, Ophthalmic and Pharmaceutical Services 0.2 0.2 0.1 0.1 0.0
Procurement 0.1 0.1 0.6 0.0 0.3
General Medical Services 0.1 0.2 -0.1 0.2 0.3
Funding for Social Care 0.4 0.5 0.0
Productivity -0.3 -0.3 -0.5 -0.3 -1.2
Average annual increase in revenue 7.2 5.7 3.9 4.6 3.1
Outturn
Table 3.3 Disposition of Revenue Increase across Expenditure Components
Note:
(1) SR2004 and CSR2007 activity growth numbers exclude purchases of healthcare from non NHS bodies, whereas they are included in the SR10 figures.
(2) 15/16 and 16/17 figures assume a 1.8bn RDEL over commitment against our current HMT control total.
(3) Activity includes growth in non-NHS bodies.
(4) Productivity savings are offset by increased agency spend.
(5) The 15/16 growth in other is due to large central budget reductions in 14/15, the reduction in 16/17 is due to planned reductions in the non-NHS England part of our budget.
3.10. 2013/2014 and 2014/2015 saw an increase in the HCHS workforce – likely in response to the Francis Report and addressing unsafe staffing risks. Recruitment tends to be towards the lower end of the pay scales, and so the price element of the paybill has been subdued in these years. However, the previously announced changes to the state pension represent a considerable financial pressure on the paybill in 2016/2017.
3.11. The difficulty of allocating resources is therefore more acute than it has been in the previous 10 years. The revenue resources available to the NHS in 2016/2017 were set
in the Government’s Spending Review, published on 25 November 2015, and are shown in Tables 3.1 and 3.3.
Financial Balance
3.12. In recent years the NHS budget has represented an unprecedented challenge to the service to deliver quality care with limited resources. Although the Department, in comparison to other Government Departments, received a generous settlement, the position in 2016/2017 is tight for two reasons:-
the change to the state pension; and
the requirement to recover the provider net deficit position,
Conclusion
3.13. In recent years the NHS received a better Spending Review settlement than almost all other parts of the public sector, including a commitment to real terms increases in health
The Review Body on Doctors' and Dentists' Remuneration (DDRB) Review for 2016
30
spending in 2014/2015 and 2015/2016. However, this still represented the biggest financial challenge in the history of the NHS.
3.14. The NHS is delivering on this challenge and has so far met its savings targets in 2011/2012, 2012/2013, and 2013/2014. However, there is still work to do in shifting the focus from centrally driven savings to transformational changes which will reduce the long term cost pressures on NHS services.
Provider Deficits
3.15. The NHS faces a significant financial challenge in 2015/2016. To help, an additional £2 billion this year and £8 billion over the next five years, that the NHS has said it needs to implement its own plan for the future, will be invested. Whilst NHS providers delivered an overall net deficit in 2014/2015, offsetting savings throughout the rest of the system were achieved and financial balance against all spending controls was delivered. And with the financial controls package and help from system leads, we expect to deliver financial balance against the overall spending controls in 2015/2016.
3.16. In 2016/2017 we expect trusts to balance their books but it will still be challenging because of increasing demand for health services as a consequence of the ageing and growing population, new drugs and treatments and safer staffing requirements.
3.17. NHS England will invest £2.1 billion in 2016-17 into a Sustainability and Transformation Fund:
The transformation element of the fund is intended to support the ongoing development of new models of care along with the investment identified to begin implementation of policy commitments in areas such as 7-day services, GP access, cancer, mental health and prevention.
In 2016-17, £1.8 billion forms the sustainability element of the fund, the purpose of which is to support NHS Improvement to bring the provider trust sector back to financial balance in year. Existing provider support funding held by NHS England (included within central programmes) will be added to the fund to create a single process. The sustainability funding will have two elements:
- a general element which will be distributed to relevant providers to support the sustainability of emergency services and the achievement of agreed control totals; and,
- a targeted element which we will use to support relevant providers to go further faster through additional efficiency gains.
Labour Productivity and Total Factor Productivity in the NHS
3.18. Labour productivity is calculated by dividing total NHS output by an appropriate measure of labour input (usually some form of weighted sum of staff numbers and hours worked). It measures the amount of output generated per ‘unit’ of labour, and as such is an important component of efficiency.
3.19. The measure of labour productivity we use for the NHS in England is the one developed by the University of York (Centre for Health Economics, CHE). The York measure uses a wide range of NHS data sources to assess outputs and inputs and also adjusts the output measure to take some account of quality change, including change in waiting times and death rates. Their figures show that in 2012/2013 NHS outputs were 84% higher than in their base year of 1998/1999, while the volume of labour input was 40% higher. This suggests an average growth in labour productivity of 2.0% per annum.

NHS Finances
31
Table 3.4 Labour Productivity Data from York (CHE)
Source: York (CHE)
3.20. Labour productivity is an important component of efficiency, but labour inputs account for only around half of the total cost of the NHS. A broader measure of productivity divides total output by an appropriate measure of all inputs, for example including drugs. This is called total factor productivity and York University also produce figures on this basis. Their figures show, as before, that in 2012/2013 NHS outputs were 84% higher than in the base year of 1998/1999. However, the total volume of factor inputs increased
Total output growth
Labour input growth
Labour productivity growth
Output index
Labour index
Productivity index
100.0 100.0 100.0
1999/00 2.2% 1.6% 0.6% 102.2 101.6 100.6
2000/01 2.3% 1.1% 1.2% 104.5 102.7 101.8
2001/02 3.7% 5.4% -1.6% 108.4 108.2 100.2
2002/03 5.8% 4.7% 1.0% 114.7 113.3 101.3
2003/04 4.9% 4.5% 0.4% 120.4 118.4 101.7
2004/05 6.4% 4.8% 1.6% 128.1 124.0 103.3
2005/06 7.1% 3.4% 3.6% 137.2 128.3 107.0
2006/07 6.5% 0.6% 5.8% 146.2 129.1 113.2
2007/08 3.7% 0.6% 3.0% 151.5 129.9 116.6
2008/09 5.7% 4.2% 1.5% 160.2 135.4 118.3
2009/10 4.1% 4.6% -0.4% 166.8 141.6 117.8
2010/11 4.6% 1.3% 3.2% 174.4 143.4 121.6
2011/12 3.2% -0.2% 3.4% 179.9 143.0 125.8
2012/13 2.3% -1.9% 4.4% 184.1 140.2 131.3
Ave. annual growth
4.5% 2.4% 2.0%

The Review Body on Doctors' and Dentists' Remuneration (DDRB) Review for 2016
32
by 81% over the same period, resulting in a moderate growth of 0.1% per annum in total factor productivity.
3.21. More generally productivity, as formally defined here, does not take into account the costs of inputs, including changes in staff pay. A full measure of technical efficiency would, in addition factor in changes in pay and the cost of inputs relative to a suitable deflator. If pay increases more quickly than GDP deflator, this would have a negative effect on technical efficiency.
Table 3.5 Total Factor Productivity Data from York (CHE)
Total output growth
Total factor input growth
Total factor productivity growth
Output index
Total Input index
TFP
Productivity index
100.0 100.0 100.0
1999/00 2.2% 5.1% -2.7% 102.2 105.1 97.3
2000/01 2.3% 1.6% 0.7% 104.5 106.7 98.0
2001/02 3.7% 6.1% -2.2% 108.4 113.2 95.8
2002/03 5.8% 7.1% -1.2% 114.7 121.2 94.7
2003/04 4.9% 7.6% -2.5% 120.4 130.4 92.3
2004/05 6.4% 6.5% -0.1% 128.1 138.9 92.2
2005/06 7.1% 7.2% -0.1% 137.2 148.9 92.2
2006/07 6.5% 1.9% 4.5% 146.2 151.8 96.3
2007/08 3.7% 3.9% -0.2% 151.5 157.6 96.1
2008/09 5.7% 4.2% 1.4% 160.2 164.3 97.5
2009/10 4.1% 5.4% -1.3% 166.8 173.2 96.3
2010/11 4.6% 1.3% 3.2% 174.4 175.5 99.3
2011/12 3.2% 1.0% 2.1% 179.9 177.3 101.5
2012/13 2.3% 2.0% 0.4% 184.1 180.8 101.8
Ave. annual growth
4.5% 4.3% 0.1%

NHS Finances
33
Efficiency Savings
3.22. The NHS Five Year Forward View anticipated a gap between resources and patient needs of nearly £30 billion a year by 2020/2021, if there were no further efficiencies. To fill this gap the Five Year Forward View called for an extra £8 billion in funding, which the government committed to as part of the comprehensive spending review. To live within this budget, the NHS will make at least £22 billion of efficiency savings (equivalent to 2% - 3% efficiency per annum) and must eliminate provider deficits, currently estimated at be £2 billion.
3.23. The Department of Health is working with the health service, partners and patients to implement a number of measures to achieve efficiency savings and productivity improvements to enable the NHS to live within its resources. This includes:
acute providers agreeing challenging productivity improvements across workforce, estates and procurement;
CCGs adopting the RightCare methodology to reduce unwarranted variation and deliver measurable improvements in CCG efficiency;
implementing New Care Models;
improving the prevention of ill-health; and
increasing income to the NHS through charges and commercial opportunities.
3.24. The plan for how to make the majority of these savings is up to local areas but support will be provided through a series of national initiatives such as central pay controls, procurement savings and reducing the cost of the architecture that leads and manages the NHS.
3.25. Lord Carter’s recent review into productivity and how hospitals buy goods and services found that the NHS could save up to £5 billion a year, by making better use of staff, medicines and deploying its vast buying power more effectively, so every penny possible can be spent on patient care. Lord Carter’s recent review says that increasing staff efficiency by just one per cent, through better planned rotas and shifts could save hospitals £400 million a year.
3.26. The Department of Health and NHS Improvement are working with the NHS to support sustainable staffing, including tackling growth in spending on high cost agency staff. NHS Improvement has written to providers with further tough in-year controls on agency spend, including a new hourly price cap and published guidance to trusts on
implementing these. NHS Improvement is now working to support the system to deliver savings.
3.27. The ambition to deliver efficiency savings will never compromise the safety or quality of services. It will focus on encouraging the most productive ways of working throughout the NHS and best practice, including a greater focus on safety, which has been shown to save money. Unnecessary use and abuse of health services will continue to be challenged.
The Review Body on Doctors' and Dentists' Remuneration (DDRB) Review for 2016
34
4. Recruitment, Retention, Motivation and Medical Workforce Planning
New Vacancy Statistics Publication
4.1. We recognise that DDRB members have been frustrated about the lack of vacancy data. We have committed to improving the evidence base to support the DDRB’s work around recruitment and retention.
4.2. Currently data derived from NHS Jobs reflects the number of job advertisements and the number of staff recruited as a result. However, some advertisements cover multiple
posts, and the number of staff recruited is captured only if the employer decides to record it on the NHS Jobs system.
4.3. We are pleased to report that good progress is being made to secure the evidence the DDRB needs. The Department has been working with the HSCIC and others including HEE to consider how meaningful vacancy data can be provided using a combination of data from NHS Jobs, the ESR and a new data collection – the workforce Minimum Data Set (wMDS).
4.4. HEE works with provider organisations to develop the workforce plan for England based on demand, and taking into account what providers are telling them about a range of issues, including their current and future staffing requirements based on the needs of their local populations. The department has been supporting the HSCIC to work closely with NHS Jobs to publish Advertisement data as a proxy for vacancies and this data can be broken down from national data, to regional or even trust based data.
4.5. The HSCIC continue to investigate ESR as a potential source for vacancy information building on the information extracted from NHS Jobs, to both help define what more meaningful data may be possible to extract from both systems, and in a drive to improve the quality and completeness of data both in ESR and in NHS Jobs.
4.6. The HSCIC are also exploring other sources of potential vacancy information including the direct collection of further information for independent providers of NHS funded services investigating the information which is available in the ESR data warehouse and considering other sources of information for specific areas – for example for public
health which spans the NHS and Local Authorities.
4.7. Earlier this year, the HSCIC undertook a consultation on proposed wide ranging changes to the definitions and presentation of its HCHS workforce statistics. They are considering the responses and an initial set of suggestions for change derived from the consultation will be shared shortly. This will be open to comment for two weeks and then a final set will be issued. The HSCIC also undertook a consultation as part of its first NHS Jobs based provisional experimental vacancy statistics publication. This consultation closed on the 20 November and the HSCIC response is expected next year.
4.8. We support the HSCIC stated view on the vacancy statistics published in August 2015: “This publication provides figures which are an insight to recruitment in the NHS but which should be treated with caution, and users are discouraged from attempting to draw any conclusions from this data at this time.”

Recruitment, Retention, Motivation and Medical Workforce Planning
35
4.9. We want to utilise workforce data, where we are able and would welcome the DDRB’s views on the R&R data it has been able to secure through the HSCIC and what more we might usefully do to provide the meaningful data you need.
Background
4.10. Around 60% of a trust’s expenditure is spent on pay through the national pay framework which includes additional flexibilities such as Recruitment and Retention Premia (RRP) and High Cost Area Supplements (HCAS).
4.11. RRP is designed to address short or long term recruitment and retention pressures but must be objectively justified to ensure that staff receive equal pay for work or equal value. The payment of RRP is a key indicator of local R&R pressures. This analysis is performed by NHS Employers and included in their evidence. The latest figures show a continuation of the downward trend in the proportion of staff receiving an RRP payment.
4.12. The local NHS Electronic Staff Record (ESR) system allows trusts to record payments to staff against hundreds of different codes. The national ESR Data Warehouse (DW) contains information on these payments, with the codes grouped into about 20 broad payment types, including eg basic pay, RRP, local payments, and pay protection. The RRP grouping includes all payments coded by trusts as national or local RRP.
4.13. To avoid duplication of effort and to ensure consistency, NHS Employers provides the analysis of the ESR DW figures on the use of RRPs in its evidence, using data which we extract from the DW and process.
4.14. The government made a commitment in the White Paper “Equity and Excellence:
Liberating the NHS” to “…initiate a fundamental review of data returns, with the aim of culling returns of limited value, to ensure that the NHS information revolution is fuelled
by data that are meaningful to patients and clinicians when making decisions about care,
rather than by what has been collected historically”. The Fundamental Review covered all national data returns requested by the Department of Health in England and its Arm’s Length Bodies (ALBs) from NHS organisations and recommended that 76 (25%) of the returns be discontinued and estimated that this would reduce the burden on the NHS by approximately £10 million per annum. Following consultation, a number of central returns were discontinued including the Annual NHS Vacancy Collection and the General Practitioners Practice Vacancy Survey. The collections were suspended in 2010 and discontinued in 2013 in line with the principles set out in the White Paper.
4.15. To reduce the burden on data providers, the Department and partners have focused on extracting workforce data, wherever possible through administrative systems, without the need for direct data collection from providers, whether an NHS organisation or general practice and this principle applies to the vacancy data. We know that previous vacancy data collections were not especially useful to the PRBs because of the coverage and the way the data was reported by trusts.
Workforce Minimum Data Set (wMDS)
4.16. Workforce planning requires an understanding of the external and internal environment; business vision and strategy and current workforce. It also requires forecasted information taking into account the impact of turnover, retirements, recruitment and continuing professional development on workforce demand and supply. The Department working with NHS England, HEE and the HSCIC on the design of the workforce information architecture for the new education and training system, has developed a wMDS to be collected from all providers of NHS funded care

The Review Body on Doctors' and Dentists' Remuneration (DDRB) Review for 2016
36
4.17. The wMDS is an expanded census collection, which includes more data items than the census, and is collected more frequently. The census and monthly workforce statistics already include detailed tables on turnover, and staff movements, including reasons for leaving (quarterly), and the HSCIC already publish monthly earnings and sickness absence data for HCHS based on ESR data. The wMDS will include more information on absences and vacancies for the HCHS as well as absence and vacancy data for staff working in general practice.
4.18. All areas of the wMDS will assist planners in understanding workforce demographics. It will help them in developing strategies and plans to ensure the appropriate education commissioning, education and learning strategies and whole system changes to provide the future workforce.
4.19. The HSCIC published the first wMDS collection as experimental statistics on 2 September 2015 with data as at 31 March 2015. The second collection will be published in March 2016 with data as at 30 September 2015. The wMDS is drawn quarterly for the HCHS organisations using ESR and collected quarterly from the non-ESR trusts. It is collected twice a year from general practice including GPs and practice staff and twice a year from the independent sector providers of NHS funded care.
4.20. The first publication was a limited collection and did not include absence or vacancy data. However, this data will be collected as part of the second collection for general practice in the expanded census collection as at September 2015. This will provide information on the start and end date of vacancies, length of vacancy and vacancies unfilled between 01 April 2015 and 30 September 2015 and the HSCIC intend to publish the results in March 2016 (subject to data quality and data completeness).
4.21. Vacancy data within the wMDS is derived from a number of sources, for the HCHS workforce it will be automatically extracted from NHS Jobs (proxy information based on job adverts) supplemented by vacancy information derived from other sources where available, including direct collection for independent sector providers of NHS funded care.
4.22. For workforce planning purposes, the wMDS will provide more details on those working in general practice and in understanding the full range of staff providing services from primary care. For example, more detail is needed on practice nursing to understand the changes in the numbers shown in the HSCIC GP Census and how this has impacted on
‘skill mix’ changes suggested by a rise in other clinical staff also involved in direct patient care.
4.23. HEE and its LETBs are interested in the increased professionalism of practice management and the important roles played by administrative/clerical staff and their continuing professional development needs. Data will become available twice yearly meaning that users will be working on more accurate and relevant data.
Health and Social Care Information Centre
4.24. The HSCIC centre publish workforce statistics annually and monthly. The annual Census provides the best means of viewing medium and long-term trends in workforce numbers and provides detailed information on staff working in the NHS in England at 30 September each year. The census includes information for staff working in general practice, including GPs and practice staff, provides a more detailed breakdown of the HCHS information already published in the monthly workforce statistics and is the only source of long term time series covering the entire NHS workforce.

Recruitment, Retention, Motivation and Medical Workforce Planning
37
4.25. The monthly statistics provide a time series back to September 2009 for the HCHS. The time series provides the opportunity to see the impact of seasonal variation such as the impact of the training cycle. Nurses graduate in the summer and take up employment from September between late summer and mid-winter. Normal turnover has then resulted in a gradual decline in numbers over the rest of the year.
4.26. The monthly data is headcount and FTE statistics, including turnover on the HCHS workforce in England and is drawn from the HR and Payroll system for the NHS - ESR. It does not include staff working in general practice or those providing NHS funded services that do not use ESR, such as the independent sector, local authorities and some social enterprises. And the two NHS organisations that do not use ESR.
4.27. The HSCIC also publish quarterly data on HCHS staff, reasons for leaving, staff
movements and redundancy data, as well as earnings data and data on sickness absence for NHS staff. Published data is available on the HSCIC website.16
4.28. The latest data reflecting the position as at 31 August 2015, published by the HSCIC on 27 November, shows that there are 1,075,596 (fte) staff working in the NHS, an increase of 18,945 (1.8%) since May 2010. The total number of professionally qualified staff has increased during the same period by over 21,300 (3.7%).
NHS Jobs
4.29. On 18 August 2015 the HSCIC published “NHS Vacancy Statistics; England, March 2014 to February 2015 - Provisional experimental statistics” based on data obtained from the NHS Jobs online recruitment portal. The NHS Jobs system is used to provide data on the number of job adverts placed as a proxy administrative source for recruitment information. NHS Jobs allows adverts from other employers providing NHS services such as NHS sub-contractors and Local Authorities as these adverts include newly established roles as the NHS responds to the changing needs of the population. Not all advertisements therefore will be for jobs in the NHS, though the HSCIC constrained the publication to adverts placed by known NHS organisations. It is also possible that single adverts will be for multiple posts or for new posts.
4.30. Whilst NHS Jobs holds data on the number of advertisements, it is not able to identify when posts are filled or where posts have been vacant for three months directly (though it is possible to identify posts that have been advertised for three months). However the dates associated with the adverts may provide a useful proxy measure in the interim and, over time it will give an indication of trends and pressures in the labour market.
4.31. Depending on the data quality and completeness, the intention for HCHS, is to publish information at national and HEE LETB region initially, with the aim of publishing information at individual organisation level as the data source and processing develops. This advert data will provide the DDRB with some clarity as to posts that employers are seeking to fill and which posts are advertised for more than three months, which may be indicative of hard to fill posts.
Turnover Data
4.32. Staff turnover statistics published by the HSCIC have been analysed to identify changes in the leaver rates between May 2009 and May 2015. The statistics are based on data
16 http://www.hscic.gov.uk/

The Review Body on Doctors' and Dentists' Remuneration (DDRB) Review for 2016
38
extracted from employee records in the NHS ESR, which is the HR & Payroll system used by almost all HCHS organisations.
4.33. Turnover data is based on:
headcount;
“Total NHS Excluding Bank, Locums and Trainee Doctors” gives figures for staff who have left the English HCHS. Staff Group-specific figures includes people who have moved to another staff group; and
the leaver rate is calculated by dividing the number of leavers by the average of the headcount of staff at the beginning of the period and headcount of staff at the end of the period.
Leaving Rates
4.34. The leaver rate is the proportion of staff who left in the 12 months leading up to each date point. It excludes bank staff, locum doctors and also doctors in training. It includes both people who have left the HCHS and also those who have moved to another occupation group within the HCHS. Leaver rates are driven by three main types of effect:
structural changes to the NHS such as the Health & Social Care Act whereby Primary Care Trusts were abolished and Clinical Commissioning Groups were introduced. This led to a step decrease in the size of the HCHS workforce. Manager and administrator leaver rates increased over the last Parliament as the government committed to reducing the costs of administration by around a third by the end of the Parliament;
age distribution effects: All else being equal, a workforce with a higher proportion of older staff would be expected to have higher leaver rates. This is driven by larger numbers of staff reaching retirement age and leaving the workforce; and
behavioural effects: Changes in factors such as the level of staff satisfaction, the general economic situation and pension arrangements can lead to a change in the proportion of staff leaving the NHS to work elsewhere or retire.
4.35. In summary, almost all HCHS staff groups have seen an increase in the leaver rate over the past six years. The exception to this is HCHS doctors, where leaver rates increased in the years to May 2013 and have subsequently decreased.
Analysis
4.36. This analysis looks at leaver rates by staff group, but does not control for the above effects. Age distribution is unlikely to have changed significantly during this period and hence is unlikely to have noticeably affected leaver rates. Structural changes (including abolition of Strategic Health Authorities and Primary Care Trusts replaced by CCGs) are likely to have led to one-off increase in leaver rates in 2010/2011 and in 2012/2013.
4.37. Table 4.1 below presents a time series of the leaver rate for each broad occupation group. The Table indicates that:
for the HCHS workforce as a whole, about 9% of staff left during the 12 months to May 2015;
the broad trend in the average leaver rate for all staff over the past six years has been upwards. Within this period, there was a marked increase in the 12 months to May 2011 and again in the 12 months to May 2013, most likely driven by structural effects; some staff transferred with their work into organisations outside the HCHS (eg Public Health England); some took opportunities to take up a new
Recruitment, Retention, Motivation and Medical Workforce Planning
39
0%
2%
4%
6%
8%
10%
12%
14%
16%
18%
May-09 May-10 May-11 May-12 May-13 May-14 May-15
12
-mo
nth
leav
er r
ate
12-month leaver rates: OverviewRates are the proportions of staff leaving in the previous 12 months
Total excl. Bank, Locums and Trainee Doctors All Professionally Qualified Clinical
All Support to clinical All NHS infrastructure support
role, eg in NHS England or a Clinical Commissioning Group; some left the HCHS, eg with redundancy or early retirement package, where their job was not continuing in the new system;
professionally qualified staff had an average leaver rate similar to the all staff average, and it exhibited a similar trend; and
leaver rates for clinical support and infrastructure support staff tend to be higher than those for professionally qualified staff, about 14% and 15% respectively in the 12 months to May 2015. They have also been increasing, with infrastructure support staff exhibiting the largest step changes as expected from structural effects.
Table 4.1 Time Series of 12-month Leaver Rate, by Broad Occupation Group
4.38. Table 4.2 below presents the time series of the leaver rate for specific professionally qualified occupation groups. It indicates that:
the average leaver rate for HCHS doctors increased between 2008/2009 and 2012/2013, but has fallen in the last two years back to its 2008/2009 level; and
leaver rates for qualified nurses, Scientific, Therapeutic and Technical staff and ambulance staff have all increased over the period. The rate for qualified ambulance staff, which was the lowest in 2008/2009 at less than 6%, has increased the most rapidly to more than 9% in 2014/2015.
The Review Body on Doctors' and Dentists' Remuneration (DDRB) Review for 2016
40
0%
2%
4%
6%
8%
10%
12%
May-09 May-10 May-11 May-12 May-13 May-14 May-15
12
-mo
nth
leav
er r
ate
12-month leaver rates: Professionally qualified staffRates are the proportions of staff leaving in the previous 12 months
All Professionally Qualified Clinical HCHS Doctors
Qualified nursing, midwifery & health visiting Qualified scientific, therapeutic & technical
Qualified ambulance
Table 4.2 Time Series of 12-month Leaver Rate for Professionally Qualified Staff, by Occupation Group
Difference between Pay Experience of Established staff and Overall Average Earnings
4.39. There is general evidence in the wider economy that the pay of staff who remained in their job increased by more than the average for the workforce. It is clear that this also applies to the NHS and is part of the reason why retention remains strong,
4.40. A current DH analytical project is developing a methodology to look at the average increase in individuals’ pay, including incremental progression and promotion. This will show how cohorts of people’s average earnings have increased compared with inflation. This is different from the increase in average earnings for all staff, or all staff in
a particular occupation group or band, which includes people who have joined or left during the period.
Safe Staffing
4.41. On 13 October this year, NHS Improvement, NHS England, NICE and CQC wrote to NHS trusts and FTs on the importance of ensuring both safe staffing and greater efficiency. The letter emphasised the importance of using the guidance on safe staffing to support rather than replace judgements about staffing made by experienced professionals at the front line; and it also emphasised the responsibility of Trust boards for these issues. The letter is at Annex E.
Agency Staffing
4.42. Spending by NHS trusts and FTs on temporary staff, which includes nursing and medical locums, as well as other staff types, provided by agencies has increased to the extent that it is impacting significantly on NHS finances. The increase in agency spend is the product of a range of factors:
Recruitment, Retention, Motivation and Medical Workforce Planning
41
increasing workforce demands, as a result of increasing demands on services;
movement towards seven-day services; and trust and FTs’ response to the Francis Review to meet safe staffing levels with increased demand outstripping supply of substantive staff;
limits to the supply of nurses and other staff and shortages in particular specialties;
increases in the numbers of nurses leaving the profession; and
use of the highest cost agency staff and procurement of agency staff through “off-framework” arrangements.
Agency Spend for 2014/2015
4.43. Spend on agency staff by NHS trust and FTs in the financial year 2014/201517 is shown
in the table 4.3 below.
Table 4.3 Spend on Agency Staff by NHS Trust and FTs in Financial Year 2014/2015
Temporary Agency Spend
£000s
Foundation Trusts 1,847,778
NHS Trusts 1,507,945
Total 3,355,723
in 2014/2015, the Department of Health collected audited financial data from NHS trusts for Agency/contract staffing. The data was collected on the NHS Summarisation Schedules and consolidated figures were published in the Department’s Annual Report and Accounts.
the Department also collected a total Agency spend figure for the FT sector which was provided by Monitor as the Department does not hold information centrally at individual FT level
in the guidance that accompanied the data collection, the definition of Contract / Agency staff is: “Agency” employee payments for the employment of staff where the staff remain employees of the agency and “Contract staff” where the NHS trust has control over numbers and qualifications of staff (in contrast to a service obtained under contract).
excluded from the “Agency/Contract” category are the costs of staff recharged by another organisation where no element of overhead is included i.e. where the staff costs are shared between the NHS trust and other bodies; staff on secondment or on loan from other organisations; amounts payable to contractors in respect of the provision of services (for example, cleaning or security).
the definition of agency/contract includes bank staff where bank services are provided by a Managed Service Provider such as NHS Professionals. Where bank services are managed in-house, spending on temporary, bank, staff is not counted as agency spend.
17 https://www.gov.uk/government/publications/department-of-health-annual-report-and-accounts-2014-to-2015
The Review Body on Doctors' and Dentists' Remuneration (DDRB) Review for 2016
42
Lowest-
Spending
Trust
Lower
Quartile
Median
Trust
Upper
Quartile
Highest-
Spending
Trust
E Midlands 2% 5% 7% 8% 10%
E of England 1% 6% 8% 11% 15%
Yorks & Humb 2% 4% 6% 8% 14%
Wessex 2% 4% 6% 7% 10%
Thames V 5% 6% 8% 12% 13%
N W London 3% 8% 9% 11% 15%
S London 7% 9% 10% 14% 21%
N C & E London 2% 6% 7% 11% 16%
Kent, S & S 3% 5% 8% 9% 19%
N East 1% 2% 3% 4% 8%
N West 1% 4% 6% 8% 17%
W Midlands 2% 5% 7% 9% 16%
S West 2% 3% 5% 7% 11%
where an NHS trust obtains FT status part way through any year, the data provided is only for the part of the year the organisation operated as an NHS trust.
the Department does not collect data in relation to the number of agency shifts or by category of staff.
while we don’t collect or hold data centrally on the spend on different staff types, evidence from the Prime Minister’s Implementation Unit suggests that approximately a third of agency spend is attributed to medical locums.
Agency Expenditure – Analysis by Region
4.44. Agency expenditure is highly variable between trusts. Variation within regions is far greater than variation between regions. This suggests that agency expenditure is driven
principally by individual trust-specific factors.
4.45. The Table shows 2014/2015 agency expenditure as a percentage of total staffing expenditure, for the trusts in each LETB region. The trust median average is given, and also the other four quartile values. The median ranges from 3% in the North East to 10% in South London. The range at trust level is from 1% to 21%. These figures include all staff groups, medical and non-medical, including non-clinical. In addition to agency, other off-payroll staffing such as self-employed contractors, interim managers and externally-managed bank are included.
Table 4.4 2014/2015 agency expenditure as a percentage of total staffing expenditure, for the Trusts in each LETB region
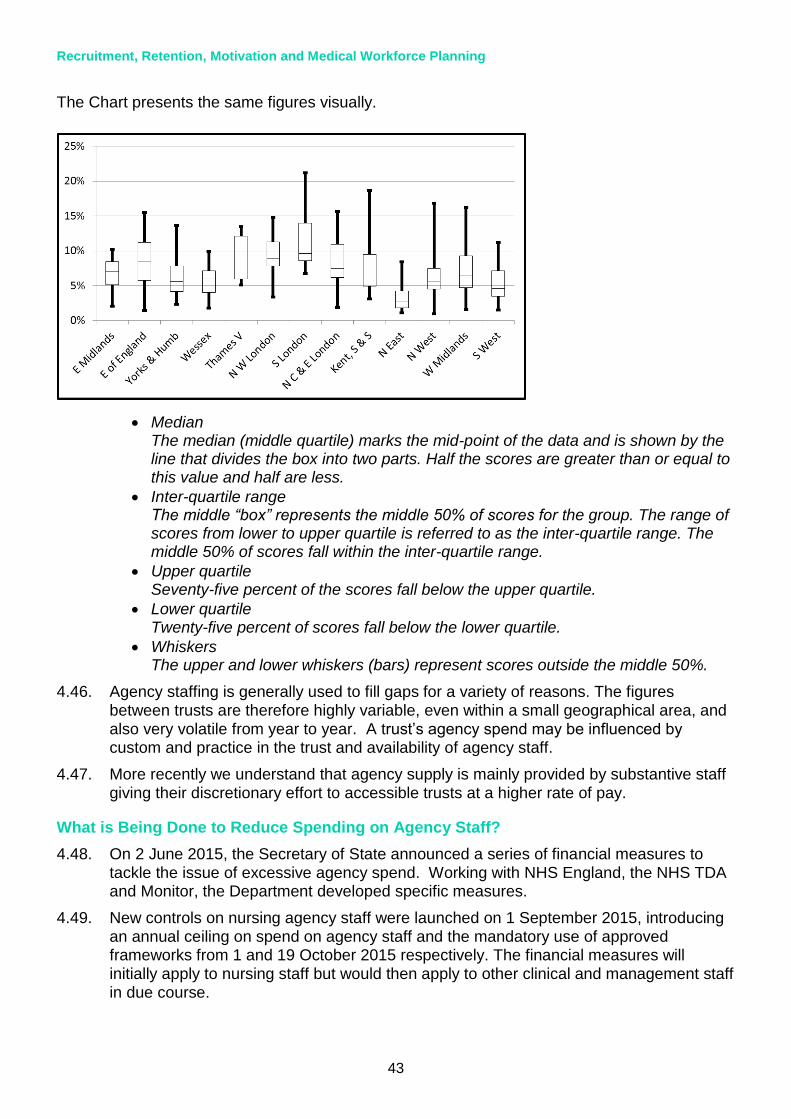
Recruitment, Retention, Motivation and Medical Workforce Planning
43
The Chart presents the same figures visually.
Median The median (middle quartile) marks the mid-point of the data and is shown by the line that divides the box into two parts. Half the scores are greater than or equal to this value and half are less.
Inter-quartile range The middle “box” represents the middle 50% of scores for the group. The range of scores from lower to upper quartile is referred to as the inter-quartile range. The middle 50% of scores fall within the inter-quartile range.
Upper quartile Seventy-five percent of the scores fall below the upper quartile.
Lower quartile Twenty-five percent of scores fall below the lower quartile.
Whiskers The upper and lower whiskers (bars) represent scores outside the middle 50%.
4.46. Agency staffing is generally used to fill gaps for a variety of reasons. The figures between trusts are therefore highly variable, even within a small geographical area, and also very volatile from year to year. A trust’s agency spend may be influenced by custom and practice in the trust and availability of agency staff.
4.47. More recently we understand that agency supply is mainly provided by substantive staff giving their discretionary effort to accessible trusts at a higher rate of pay.
What is Being Done to Reduce Spending on Agency Staff?
4.48. On 2 June 2015, the Secretary of State announced a series of financial measures to tackle the issue of excessive agency spend. Working with NHS England, the NHS TDA and Monitor, the Department developed specific measures.
4.49. New controls on nursing agency staff were launched on 1 September 2015, introducing an annual ceiling on spend on agency staff and the mandatory use of approved frameworks from 1 and 19 October 2015 respectively. The financial measures will initially apply to nursing staff but would then apply to other clinical and management staff in due course.
The Review Body on Doctors' and Dentists' Remuneration (DDRB) Review for 2016
44
Ceiling
4.50. Monitor and TDA have set ceilings on the amount trusts can spend on nursing agency staff. On 1 September 2015 trusts were sent their annual ceilings that are their maximum rates for October 2015 to March 2016, and for 2016/2017 and 2018/2019. The ceilings are for nursing agency spending only, and are expressed as a percentage of total nursing spend. Spend is being monitored monthly via trust returns.
Framework Agreements
4.51. From 19 October, trusts are required to secure nursing agency staff via framework agreements that have formal approval from TDA and Monitor. Anyone breaking these rules through use of off-framework arrangements must report each instance in their monthly returns. Monitor and TDA published a list of approved frameworks in September 2015.
Price (Rate) Caps
4.52. The Secretary of State announced proposals for caps on the amount that a trust or FT can pay for agency staff. The caps would apply to agency nursing, medical, other staff and bank staff. Monitor and the NHS TDA launched a consultation on these proposals on 15 October 2015.18
4.53. The consultation closed on 13 November and received 3,404 responses with strong support from trusts to introduce the rate caps. These were implemented on 23 November 2015. The rate caps will apply to all staff groups. Payments for the provision of bank staff are exempt but will be kept under review.
4.54. The proposed caps would initially be set at 100% (150% for junior doctors) on top of AfC or equivalent doctor permanent pay rates, before being reduced over several months to 55% above AfC or equivalent doctor pay rates by 1 April 2016.
4.55. Monitor, TDA, NHS England and CQC will monitor the impact of the price caps on workforce, performance and service quality to ensure that any concerns about patient safety are appropriately managed through the ‘break glass’ provision. A trust’s performance will be monitored on its monthly returns and trusts will be held to account on a quarterly basis. Monitor and TDA will take appropriate and proportionate action in cases of non- compliance.
4.56. Other initiatives being undertaken by DH alongside partners and Arms’ Length Bodies include:
improving the deployment of the existing employed nursing workforce as included in the Lord Carter review into efficiency published 11 June 2015. The interim report outlines the work that has been carried out by Lord Carter working with 22 NHS providers reviewing the productivity of NHS hospitals. The full report will be published shortly;
led by the Chief Nursing Officer (CNO), work is underway to look at improving workforce planning and supply by offering guidance and support in staffing levels and effective communications to tackle these issues;
the TDA/Monitor plans for implanting these changes; and
18 https://www.gov.uk/government/consultations/national-price-caps-for-agency-staff-working-in-the-nhs

Recruitment, Retention, Motivation and Medical Workforce Planning
45
HEE are working to bring nurses back into the workplace through their Return to Practice programme.19
Is There a Link Between Seven Day Services and Agency Costs? When is the Use of Agency Staff Highest?
4.57. We can find no evidence that there is a disproportionate use of agency during ‘unsocial hours’ such as at weekends or at night. The available data from the London Procurement Partnership (LPP) and Crown Commercial Services suggests around 4 in 10 hours worked by agency staff fall during “unsocial hours” (nights, weekends, and bank holidays). This shows that the demand for agency staff does not appear to be high during out of hours, given that 60% of all hours of the year are “unsocial hours”.
4.58. Additionally, in May 2014 a national collaborative framework was introduced which reduced enhancements to nursing agency rates for nights, weekends and bank holidays for the London region. The LPP report that the removal of these enhanced rates appear to have had no impact on willingness and availability of agency staff to work at these times. In most circumstances, it is expected that the NHS would use national frameworks when commissioning agency staff, to help keep costs down, ensure quality, and make services more affordable.
4.59. Introducing additional services at weekends could increase agency spend to fill the gap if permanent staff are unwilling or unable to change their working patterns to cover new weekend shifts. There is therefore a crucial requirement for robust staff engagement plans, and less reliance on agency staff through better procurement and human resources processes, and more efficient use of local bank staff instead.
Staff Experience
4.60. The Department is committed to developing and improving the data available to employers that will help them improve their staff experience. This includes the annual NHS staff survey, the Friends and Family Test (FFT), sickness absence statistics and network groups, which complement local information.
Staff Engagement
4.61. There is a complex relationship between overall pay and levels of staff engagement, morale and motivation. Other factors have a much greater impact on levels of engagement in the short term for example interaction with line managers, employee voice and the handling of organisational change. The 2014 NHS Staff Survey20 score for overall staff engagement of 3.70/5 remains reasonably high despite the pressures on NHS staff. We measure staff morale through the NHS Staff Survey using staff engagement scores which have remained unchanged for medical and dental consultants at 3.84/5 (2013 and 2014) and doctors and dentists in training (3.81/5 in 2013 and 2014).
4.62. A NHS Staff Survey measure for motivation was introduced in 2009. Staff Motivation as it is used within the NHS Staff Survey is defined as “the extent to which staff look forward to going to work, and are enthusiastic about and absorbed in their jobs.” The trend for motivation has been fairly stable with overall NHS scores of 3.82/5 in 2012,
19 http://comeback.hee.nhs.uk/
20 http://www.nhsstaffsurveys.com/Page/1006/Latest-Results/2014-Results/

The Review Body on Doctors' and Dentists' Remuneration (DDRB) Review for 2016
46
3.84/5 in 2013 and 3.82/5 in 2014. Scores for both groups of medical and dental staff are higher than average with consultants reporting 4.01/5 in 2013 and 4.0/5 in 2014 and doctors and dentists in training 3.95/5 in 2013 and 3.98/5 in 2014.
4.63. Published research21 has shown that good staff support and engagement is directly related to patient experience, safety and quality of care.
4.64. A further test of “staff engagement” is the extent to which an employee would advocate their trust as a place to receive care and a place to work, and that their trust has care of patients as its top priority (advocacy). This is reflected via the FFT22 for staff and patients and given greater impetus as NHS England has introduced a CQUIN (Commissioning for Quality and Innovation) payment for NHS organisations to support implementation of the staff FFT.
4.65. The Staff FFT was introduced in April 2014 and is carried out quarterly by NHS England. It allows staff to give their feedback on NHS services helping trusts locally understand quickly what’s working well and what areas need attention. The Staff FFT asks whether staff would recommend their organisation as a place to work and whether they would recommend their organisation as a place to receive treatment.23 Although there is wide variation across the service the overall trend is positive with 62% saying they would recommend their organisation as a place to work, unchanged from 62% in Q1 2014/201524 and 79% saying they would recommend their trust as a place to receive treatment (up from 76% in Q1 2014/2015).
4.66. The annual NHS Staff Survey records advocacy through the key indicators “staff
recommendation of the(ir) trust as a place to work or receive treatment”. Scores for DDRB’s remit group include, for example, medical and dental staff overall recording 3.75/5 in 2013 and 2014, consultants 3.71/5 (2014) up from 3.68/5 (2013) and medical and dental staff in training broadly similar at 3.81/5 (2013) and 3.80/5 (2014).
4.67. The CQC’s regulatory regime25 is also using measures of staff engagement as part of the Chief Inspector’s assessment of the organisational health of providers. Changes to the way CQC regulates, inspects and monitors care include a vision of a ‘well-led’ service, with effective leadership, governance (clinical and corporate) and clinical involvement at all levels of the organisation, and an open, fair and transparent culture
21 West, M.Culture and Behaviour in the English NHS (2013)
Foresight project,‘Mental Capital and Well-Being’(www.foresight.gov.uk)
Boorman, S. The Boorman Review (2009) http://www.nhshealthatwork.co.uk/health-work-wellbeing.asp
Staff engagement – Six Building Blocks for harnessing the creativity and enthusiasm of NHS Staff (February 2015)
King’s Fund. HSJ analysis of CQC ratings against staff survey results (May 2015)
22 https://www.england.nhs.uk/2013/07/30/nhsfft/ 23 Results for quarter one 2015 reported in August 2015.
24 https://www.england.nhs.uk/ourwork/pe/fft/staff-fft/data/
25 http://www.cqc.org.uk/search/services/hospitals?f%5b0%5d=im_field_inspection_rating%3A3926

Recruitment, Retention, Motivation and Medical Workforce Planning
47
that listens and learns from people’s views and experiences to make improvements. Inspections encompass an assessment of aspects of governance, leadership and culture to assess whether a service is ‘well-led’. The CQC reports26 provide information on the range of staff engagement activity across the NHS.
4.68. The NHS has a comprehensive range of data as well as good practice advice and guidance to help trusts plan how they can improve staff engagement locally.
4.69. The Department has been highlighting the importance of staff engagement including, for example, most recently, supporting events with NHS Employers to raise the profile of the issue in the service including support for the government's "Engaging for Success Taskforce"27. The Department has commissioned NHS Employers to develop staff engagement resources. Examples include a staff engagement toolkit28 to support trusts
and, following the Francis report29, help line managers to foster staff engagement and better understand what it means to be an engaging manager in the NHS.
4.70. The Department commissioned NHS Employers to work with the NHS Leadership Academy to develop “Do OD” – the first national Organisational Development (OD) resource for the NHS which supports the service to be more effective in leading organisational and culture change enabling system transformation.
4.71. The focus of this work links with the Leadership Academy’s programmes’ aims, and supports trusts in delivering culture change, improving staff engagement, and helping the development of a more open, supportive and inclusive culture in which, for example, reporting incidents can be done with confidence, and in which the risk of bullying can be reduced.
4.72. The importance of staff engagement is also being promoted by the NHS Leadership Academy30 in their recently published, refreshed version of 'the Healthy NHS Board'31. This sets out what boards need to put in place to help them develop a responsive, insightful approach to issues in their organisations, including advice on effective staff engagement. The Academy is also developing and implementing a leadership
26 http://www.cqc.org.uk/sites/default/files/media/documents/cqc_consultation_2013_tagged_0.pdf 16
27 http://engageforsuccess.org/
28 http://www.nhsemployers.org/your-workforce/retain-and-improve/staff-experience/staff-engagement/staff-engagement-resources
29 http://webarchive.nationalarchives.gov.uk/20150407084003/http://www.midstaffspublicinquiry.com/report
30 The NHS Leadership Academy was established in 2012 as a national hub for leadership development and talent management. Through leadership development, it aims to improve leadership knowledge, behaviours, skills and attitudes, and ultimately lead to better patient care, experience and outcomes
31 http://www.leadershipacademy.nhs.uk/wp-content/uploads/2013/06/NHSLeadership-HealthyNHSBoard-2013.pdf
The Review Body on Doctors' and Dentists' Remuneration (DDRB) Review for 2016
48
development offer that places a strong emphasis on shaping positive cultures and engaging staff.
4.73. Starting in September 2013, the Academy launched a suite of leadership development programmes that together represent the first national approach to leadership development in the NHS, designed to develop outstanding leaders for every tier across the healthcare system 'from frontline to board'.
4.74. Building on evidence (West et al)32 that found a significant reduction in patient standardised mortality rates in organisations with high staff engagement (in turn associated with high levels of effective and engaging leadership). All of the Academy's leadership development programmes contain components on the values and behaviours required in a new integrated health care system focused around the needs of patients,
carers and service users and in ways which liberate, engage and motivate staff to provide a compassionate and personal health care experience. These behaviours are congruent with NHS values and uphold the NHS Constitution, which states: “Respect, dignity, compassion and care should be at the core of how patients and staff are treated
not only because that is the right thing to do but because patient safety, experience and outcomes are all improved when staff are valued, empowered and supported.”
Staff Health and Wellbeing
4.75. The Department continues to commission NHS Employers to support trusts in their responsibility for improving the health and wellbeing of their staff in line with the NHS Constitution33 pledge “to provide support and opportunities for staff to maintain their
health, wellbeing and safety” (p14).
4.76. Improving staff health and well-being can help NHS organisations increase productivity and make efficiency savings, as well as improve the experience of patients and staff.
4.77. In terms of wellbeing, key staff survey indicators show small changes compared with results from 2013. Work pressure felt by staff in 2014 is 3.09/5, up from 3.06/5. Staff working extra hours has risen in 2014 to 71.46% up from 70.47%; however, we do not know if this is paid or unpaid and whether it is a choice to boost income. 39.50% staff up from 38.6% reported suffering work related stress in last 12 months; however, staff feeling pressure in last 3 months to attend work when feeling unwell has decreased in 2014 to 25% from 27.3% in 2013. Overall sickness levels have dropped slightly for the reporting period June 2014 to June 2015, from 3.95% to 3.94%;34 and the overall trend remains fairly stable and lower than the 2009 estimate of 4.48% when work began on addressing sickness absence in the NHS following the Boorman Report.35
32 West, M. Culture and Behaviour in the English NHS (2013)
33 www.gov.uk/government/uploads/system/uploads/attachment_data/file/170656/NHS_Constitution.pdf 34 http://www.hscic.gov.uk/searchcatalogue?productid=18296&topics=2%2fWorkforce%2fStaff+management%2fSickness+absence&sort=Relevance&size=10&page=1%20-%20top
35 Boorman, S. The Boorman Review (2009) http://www.nhshealthatwork.co.uk/health-work-wellbeing.asp
Recruitment, Retention, Motivation and Medical Workforce Planning
49
4.78. In response to the NHS Staff Survey and following Francis, the Department put a stronger emphasis on Mental Health and Wellbeing, commissioning NHS Employers to develop a behaviour change toolkit to support individuals and teams to make the changes which will influence their emotional wellbeing36 and the quality of the care they deliver. Their Toolkit “How are you feeling NHS?” was launched earlier this year.37
4.79. In 2014 the Department commissioned NHS Employers to develop “Healthier Staff, higher quality care: a pledge to work to improve the health and wellbeing of staff who work in healthcare”38 which was signed by ministers, senior DH officials and NHS Leaders.
4.80. The Staff Experience Summit followed, hosted by NHS Employers, which brought together senior NHS leaders to sign a pledge to continue to improve the health and
wellbeing of staff who work in healthcare. The summit and pledge focused on staff experiences39 in their own organisations and plans to improve staff experience internally and across the system.
4.81. The Department has amended the 2014/2015 commission of NHS Employers to support NHS England’s initiative on improving staff health40 offer, engaging the NHS Health and Wellbeing networks and supporting the 12 pilot organisations. This complements the support NHS Employers continue to provide organisations in improving their staff health and wellbeing which includes:
informing: Keep employers up to date on the latest developments regarding the health and wellbeing of the current NHS workforce;
engaging: Engage with employers on issues relating to the health and wellbeing of the existing workforce;
influencing: Represent the views of employers to the Department of Health and key stakeholders. Influence national policy and national initiatives and exert influence on the future of health and wellbeing work; and
supporting improvement and leading the way: Supporting employers across the NHS to improve the health and wellbeing of their staff by helping leads to develop robust wellbeing programmes that deliver measurable outcomes, with a particular focus on emotional wellbeing (mental health) across the NHS. This includes encouraging trusts to use the “How are you feeling NHS?” with individuals, teams and professionals to encourage open, and supportive conversations about emotional wellbeing.
4.82. NHS doctors remain highly committed to their jobs in the face of undoubted pressures on the service. Despite concerns over issues such as pay restraint and workload, doctors and dentists remain broadly satisfied with their jobs and levels of satisfaction remain higher than the average weighted scores. Motivation has been affected by
36 http://www.nhsemployers.org/your-workforce/retain-and-improve/staff-experience/health-work-and-wellbeing
37 http://www.nhsemployers.org/your-workforce/retain-and-improve/staff-experience/health-work-and-wellbeing/protecting-staff-and-preventing-ill-health/taking-a-targeted-approach/how-are-you-feeling-nhs-toolkit/toolkit-resources
38 http://www.nhsemployers.org/
39 http://www.nhsemployers.org/
40 https://www.england.nhs.uk/2015/09/02/nhs-workplace/

The Review Body on Doctors' and Dentists' Remuneration (DDRB) Review for 2016
50
current challenges but remains high (see paragraph 4.62 above). The level of staff engagement has not changed over the past two years for consultants and doctors and dentists in training. There is a wealth of activity across the service addressing these issues. The Department recognises the pressures facing the service and the importance of employers maintaining staff motivation. Progress has been made although much remains to be done and the degree of variation is too wide.
4.83. The Department has developed a framework to help employers across the NHS in England improve their staff experience through better engagement and improved health and wellbeing with NHS Employers providing advice, guidance and good practice.
Future Workforce
4.84. Workforce planning requires an understanding of the external environment, internal environment, business vision and strategy and plans, current workforce and forecasted impact of turnover, retirements, recruitment and continuing professional development on workforce demand and supply. All areas of the wMDS will assist planners in understanding workforce demographics and in developing strategies and plans to ensure the appropriate education commissioning, education and learning strategies and whole system changes to provide the future workforce.
4.85. The government is committed to supporting a world class health education and training system which is built on robust workforce planning led by providers of NHS commissioned services. HEE has been given a clear remit to lead workforce planning and education commissioning across the health system to secure the future supply of the workforce. HEE’s national workforce plan for England is underpinned by a comprehensive local workforce planning process that involves local health communities across the country working in partnership to ensure that the future workforce reflects the needs of local service users, providers and commissioners of healthcare in both acute and community settings.
4.86. HEE is best placed to address any questions that the review body may have about the quality of workforce planning or the evidence base that underpins decisions on future workforce investment.
Health Education England
4.87. HEE was issued with a mandate by the Secretary of State for Health on 12 March 2015. The mandate sets out the key priorities for HEE from April 2015 to March 2016. “Delivering high quality, effective, compassionate care: Developing the right people with the right skills and the right values: a mandate from the government to HEE”41 incorporates the strategic objectives of the government in the areas of workforce planning, health education, training and development for which HEE and the LETBs have responsibility.
4.88. The mandate requires HEE to work with local providers to address shortages across the system.
41 https://www.gov.uk/government/publications/health-education-england-mandate-april-2015-to-march-2016

Recruitment, Retention, Motivation and Medical Workforce Planning
51
Transforming Primary Care
4.89. Under “Transforming Primary Care” the government committed to increasing the primary and community care workforce by at least 10,000. As set out by the Secretary of State for Health in a speech on a New Deal for General Practice on 19 June, this will include an estimated 5,000 more doctors working in general practice by 2020 as well as 1,000 physician associates (PAs), thousands more community nurses, pharmacists and allied health professionals.
4.90. To support this, HEE plans to commission 205 PA training places in 2015/2016 up from 24 in 2014/2015.
GP Trainees
4.91. HEE has been increasing the number of GP training posts since 2013 with the aim of reaching its mandate objective of 3,250 trainees entering GP training each year by August 2016. Final fill rates for GP training places in 2015/2016 are due to be published by HEE before the end of the year following the end of applications to the third round of recruitment on 30 September and final offers made in November. The offer on a new contract for junior doctors includes a flexible pay premium, operating in much the same way as the current GP training supplement, to preserve pay parity with hospital trainees.
4.92. The Department continues to work with the GPC, the RCGP and HEE to develop a tariff based approach for funding clinical placements in GP practices for medical students and trainees. During 2015, the Department has continued work to develop tariffs for placements in GP practices, and has been working with GP practices to better understand the costs incurred with having medical students and trainees on placement with them. See also paragraph 4.115.
Physician Associates (PAs)
4.93. As mentioned in paragraph 6.21 the government committed to the expansion of the PA role in primary care. A PA is a healthcare professional who, while not a doctor, works to the medical model, with the attitudes, skills and knowledge base to deliver holistic care and treatment within the general medical and/or general practice team, under defined levels of supervision. Training to become a PA generally requires a science-related first degree followed by two years of further training.
4.94. There are currently just over 250 PAs working across a range of specialties in the UK, salaries will be dependent on a number of factors including experience. It is not possible to confirm the exact remuneration of the PAs currently working in the NHS in England, but the latest vacancies on NHS Jobs shows the type of PA posts being recruited to in the NHS in England and the salary ranges on offer are between £31,000 and £45,000 - with £50,000 being the exception in the current list of advertised posts.
4.95. Although these figures may indicate similarities with the earnings of junior doctors at various stages of the training (average earnings for doctors in foundation programmes are around £36,000 and in the later stages around £53,000) PAs do not have the same level of lifetime earnings potential as junior doctors - many of whom can look forward to a career as a consultant or GP with earnings that are currently in the top 2% of society.
4.96. PAs should stay on AfC terms as the majority are already employed on AfC, HEE report that of those in employment in England, around 75%, are in HCHS and therefore would be on AfC terms. Although they form part of the clinical support team and they are trained in the medical model, they are dependent clinicians, not doctors and deliver
The Review Body on Doctors' and Dentists' Remuneration (DDRB) Review for 2016
52
healthcare under the supervision of a qualified doctor. PAs are not currently regulated which limits considerably their scope of practice.
International Recruitment
4.97. The government is committed to a self-sustaining workforce and the reduction of demand for migrant labour, to ensure all workers trained in the UK are able to get the jobs they are qualified for. The Home Office has implemented a number of policies that deal with economic migration into the UK and seeks to ensure that the UK can benefit from controlled migration that supports only the “brightest and the best” individuals who contribute positively to the UK economy.
4.98. In the past, the NHS has relied on immigration to bolster domestic workforce supply. The UK has been moving towards self-sufficiency for a number of years and there has been significant investment in training to increase the UK supply of medical practitioners.
4.99. Where there is a clear shortage in the UK and European Economic Area (EEA) workforce that warrant a fast-track approach, there is an option to make use of the shortage occupation list (SOL), with the benefit of not requiring a resident labour market test. However for roles to be placed on the SOL the Home Office (normally) requires the independent Migration Advisory Committee (MAC) to review the position and to recommend that a role is included on the list. HEE is responsible for providing the right workforce, with the right skills and values, in the right place at the right time to better meet the needs and wants of patients; both now and in the future and its mandate requires it to reduce the number of professions on the SOL each year.
4.100. In 2014/2015 around 1,687 Tier 2 visas were issued to medical practitioners. Around 1,400 were issued to immigrants with roles on the SOL, which is around 10% of the level of Tier 2 (General) and about 2.5% of the visas issued under all Tier 2 routes. The NHS has 19 current roles on the list including doctors and consultants specialising in Emergency Medicine and clinical radiology.42
Migration Advisory Committee & Shortage Occupations List
4.101. MAC is undertaking a fundamental review of the Tier 2 route of entry, which is the immigration route for non-EEA skilled workers who wish to take up a sponsored role with a UK employer. There are a maximum of 20,700 places available annually via this entry route and places are prioritised according to a points system. These are allocated monthly to make sure all the places are not taken up in the first few months of the year.
4.102. In 2014, the Home Secretary commissioned the MAC to conduct a limited review into the number of occupations on the SOL.
4.103. This review is focused on the structure and operation of all Tier 2 routes and will review on whether the route requires changes to it to ensure it assists the government priority of targeting the “brightest and the best”.
4.104. Tier 2 is the immigration system for skilled workers who are non-EEA taking up a sponsored position with a UK employer.
42 https://www.gov.uk/government/uploads/system/uploads/attachment_data/file/308513/shortageoccupationlistapril14.pdf
Recruitment, Retention, Motivation and Medical Workforce Planning
53
4.105. Places are prioritised according to a point system with priority given to those on the SOL, those with PHD-level occupations and those with the highest salary. In 2014/2015 around 29% of places were used for healthcare occupations.
4.106. The annual limit for Tier 2 applications is 20,700 and a commitment to maintain this number has been given for the duration of this Parliament. As part of its commitment to reduce migration and to move to a self-sustaining workforce the Department has included an objective in its mandate to HEE an objective to reduce the number of roles on the SOL year on year.
Impact on Doctors
4.107. On 15 October 2015 the government announced that, in response to concerns over supply, nurses would be included on the shortage occupation list as an interim measure. The Home Office is instructing the MAC to undertake a full assessment of nursing roles with respect to their shortage position and will report to the Home Secretary on 15 February 2016. Whist this change applies nurses there will be corollary.
4.108. The Home Office says that 198 doctors have been rejected in the monthly Tier 2 RCoS allocation rounds since April 2015. There has been no outcry in NHS in England that we are aware of.
4.109. Evidence from the Home Office suggests that had nurses been on the shortage list 344 additional doctors would have been refused visas in six months since April 2015. 13(4%) of these would have been Specialty Registrars in General Practice based on the historic Home Office Management Information.
4.110. Based on an assumed salary cut-off of £45,000, Home Office estimate an additional 60-80 application for doctors could be rejected between each month December 2015 and March 2016.
4.111. There may be specific local issues but there is unlikely to be a national problem.
4.112. It is unlikely that trained GPs will be rejected if the cut off rests at around £45,000, salaried GP’s generally earn more than this.
4.113. “Doctor” roles are on the SOL should not be affected:
consultant in the following specialities; - clinical radiology - emergency medicine - old age psychiatry
Core Trainee 3 and Specialist Trainee 4 to Specialist Trainee 7 in emergency medicine;
Core trainee in psychiatry; and
Non-consultant, non-training, medical staff post in the following specialities; - emergency medicine (including specialist doctors working in accident and
emergency) - old age psychiatry - paediatrics.
Shape of Training

The Review Body on Doctors' and Dentists' Remuneration (DDRB) Review for 2016
54
4.114. On postgraduate medical education, Professor Greenaway submitted the Shape of Training Report43 to the four UK Health Departments in October 2013. The four UK Health Departments have said that they are broadly supportive of the direction set out by the review. A UK-wide Group led by the four UK Health Departments has been formed to take forward the work. Reporting to the Department, HEE is the lead for work with respect to Shape of Training in England, and, working with key stakeholders, will provide a more detailed feasibility assessment, including an impact assessment for the health system with a cost analysis with respect to elements of Shape of Training in February 2016.
GP Trainees
4.115. The Department continues to recognise the need to increase the GP workforce. HEE has been asked to ensure a minimum of 3,250 trainees per year (equating to approximately half of the annual number of trainees completing foundation training and moving into specialisations) are recruited to GP training programmes in England by 2016. HEE continues to undertake work on GP recruitment and retention, return to practice and the reduction of attrition rates with the aim of increasing the GP workforce by 5000 by 2020. See Chapter 8.
GP Trainers Grant
4.116. The Department continues to work with the BMA, the Royal College of General Practitioners and HEE to develop a tariff based approach for funding clinical placements in GP practices for medical student and trainees. During 2015 the Department has continued work to develop tariffs for placements in GP practices, and has been working with GP practices to better understand the costs incurred with having medical students and trainees on placement with them.
43 http://www.shapeoftraining.co.uk/reviewsofar/1788.asp

Reforming Employment Contracts
55
5. Reforming Employment Contracts
5.1. Patient care is a team effort, ensuring patients receive the best possible care every day of the week in a way which is fair to staff and patients. There is consensus that the contracts for consultants and doctors and dentists in training (juniors) need to change so that they work better for staff and patients. Our ambition for contract reform is to ensure those staff making the greatest contribution are rewarded for this, with pay linked more closely to the quality of the work they do for patients and performance. As part of this the government has made clear that we need to end time-served incremental pay progression, consistent with the policy that applies across the public sector.
5.2. It is vital that patients can rely on the team, not just Monday to Friday, but every day of the week. We know many of our hard working staff already work at the weekends, nights and in the evenings. To help make seven day services the norm right across our NHS, it must be affordable and sustainable. Contracts that help put patients at the heart of everything the NHS does are critical to delivering our ambitions for seven day services.
5.3. Fairness for all staff is incredibly important. We want contract reform for medical and non-medical staff to be based on the same key principles. We are not looking to make savings, but to re-distribute the available pay bill in the best possible way that is fair to staff and patients; that reward staff for what they do for patients; how they care for them and that they are available to care for patients across seven days. The NHS Pay Review Body said that “It will be important for morale and motivation of our remit group that changes to reward packages between the two groups (medical and non-medical) are
regarded as fair”.
5.4. Contract reform is not just about pay. Its role in recruiting, retaining and motivating staff should be part of a total reward approach and embedded in an organisation’s staff engagement strategy. See Chapter 4 and 10.
Consultants
5.5. The department welcomed the DDRB’s July 2015 report, contract reform for consultants and doctors and dentists in training – supporting healthcare services seven days a week, which broadly endorsed proposals put forward by NHS Employers on consultant contract reform, and set out a number of observations as a basis for negotiation.
5.6. In September NHS Employers and the BMA Consultants’ Committee agreed to re-enter negotiations using the DDRB’s observations as a starting point, and with a view to putting an offer to the BMA membership as (at the very least) the best achievable by negotiation. The negotiations concluded in December, with the expectation that an offer will be put to consultants in the New Year.
5.7. In line with the DDRB’s observations, the ambition is to develop a better contract for consultants that rewards them more fairly, includes appropriate safeguards to support patients and doctors, engages them as senior decision makers in the NHS and better supports seven day service provision. The aim is to introduce a new collective agreement from 2016/2017 with existing consultants moving across to the new contract by April 2017.
The Review Body on Doctors' and Dentists' Remuneration (DDRB) Review for 2016
56
5.8. The Government has also committed to consult on changes to the National Clinical Excellence Awards scheme based on the principles of the DDRB’s 2012 previous review of the clinical excellence awards scheme.
Doctors and Dentists in Training (Juniors)
5.9. Following talks facilitated by ACAS, the BMA agreed to return to meaningful negotiations and to temporarily suspend proposed strike action until 13 January. NHS Employers and the Department of Health have agreed to temporarily suspend implementation of the new contract without agreement. Our aim is to ensure:
fairer pay for juniors;
stronger safeguards on working hours;
improved training – including more consultant support at weekends; and
contracts that support a seven day NHS.
5.10. The partners are committed to finding a solution that works for staff and patients.
5.11. Negotiations were on the basis of an agreement and memorandum of understanding between the parties which acknowledged a shared responsibility for the safety of patients and junior doctors and the desire to achieve and implement without undue delay a contractual framework that provided fair reward and a safe working environment for junior doctors throughout the week. The agreement and Memorandum of Understanding are attached at Annex F.
5.12. Following conciliation through ACAS last year, good progress has been made. Of the 16 issues the parties agreed to discuss 15 of these appear to be largely resolved. This includes issues around patient safety and training.
5.13. The final substantive issue is about pay rates for evening and weekend working, which the government is willing to be flexible on, but we need the BMA to reciprocate and move from their fixed position of no change.
5.14. It is disappointing that the BMA chose to announce further industrial action particularly when there has been so much progress.
5.15. We remain committed to talks and it is encouraging that the BMA has agreed to again involve ACAS in the discussions. We are also pleased that one of our most respected NHS chief executives, Sir David Dalton of the Salford Royal, has agreed to take the negotiations forward on behalf of the NHS.
5.16. Negotiations were for England only. It remains for the other UK Health Departments to determine arrangements, including whether to seek agreement in each country on the basis of any deal emerging from negotiations in England. Employers from the other countries remain engaged with the work.
Staff Grade and Associate Specialists
5.17. We will wish to consider, in due course and in the light of the reform of contracts for other staff groups, what changes might be desirable for this group of doctors, to ensure a continued fit with the arrangements for other employed doctors and consistency with wider public sector pay policies.

Contract Reform – General Medical Practitioners
57
6. Contract Reform – General Medical Practitioners
6.1. The material in this chapter is intended to provide background information only about ongoing developments in general practice. Detailed evidence on general practitioners and general dental practitioners has been provided separately by NHS England.
6.2. We provide evidence on recent trends in general practice as well as the Government’s vision to transform general practice as part of a system of wider ‘out of hospital services’ by 2020.
Current Situation in General Practice
2015/16 GMS Contract and GP Income
6.3. The GMS contract 2015/2016 introduced a number of important changes for patients, including offering online access to full medical records.
6.4. The contract changes included an overall uplift of 1.16% to the global sum equivalent for all GP providers. This uplift was applied with the intention to deliver the 1% General Medical Practitioner income as recommended in the DDRB’s Forty-Third report 2015.
6.5. The latest HSCIC data shows that the average income before tax in 2013/2014 for a contractor GP was £101,900 compared to £105,100 in 2012/2013. This was a decrease of 3.1%.
6.6. Changes to the contract mean that from April 2016, practices must publish on their practice websites by the end of 2015/2016 the average earnings derived from the GP contract for GPs working in the practice. This will provide increased transparency.
Investment in General Practice
6.7. Total spend on general practice44 has increased in nominal terms every year since 2003/2004 (the first year that data was available).45 The biggest increases were in 2004/2005 (19%) and 2005/2006 (12%), the first two years of the new GP contract.
6.8. Taking into account inflation,46 total investment in general practice was on a declining trend from 2005/2006 to 2012/2013. However, the last two years’ data both show a real increase in expenditure. Total real expenditure in 2014/2015 was 18.9% higher than 2003/2004 levels (representing average real growth of 1.7% per year).47
44 Data on spend in general practice in this section taken from HSCIC “Investment in General
Practice 2010/11 – 2014/15” http://www.hscic.gov.uk/catalogue/PUB18469/inve-gene-prac-eng-wal-ni-scot-10-15-rep.pdf 45 There was a change in the way the data was collected from 2006/07, meaning that the figures before this are not strictly comparable (although rough comparisons are reasonable).
46 https://www.gov.uk/government/collections/gdp-deflators-at-market-prices-and-money-gdp

The Review Body on Doctors' and Dentists' Remuneration (DDRB) Review for 2016
58
5,811
6,914
7,747 7,757 7,867 7,961 8,321 8,350 8,397 8,459 8,766 9,001 7,570
8,735 9,509 9,248 9,120 8,990 9,180 8,943 8,856 8,761 8,892 9,001
0
2,000
4,000
6,000
8,000
10,000
Inve
stm
en
t in
Ge
ne
ral P
ract
ice
(£
m)
Nominal Real (2014/15 prices)
Table 6.1 Nominal and Real Total Spend on General Practice (£m)
6.9. Nominal spend per person48 on general practice has increased nearly every year since 2003/2004. The three exceptions are 2006/2007, 2010/2011 and 2011/2012, where spend per person fell by approximately half a percent in each of those years. The latest year (2014/2015) showed an increase in nominal spend per person of 1.8% compared to the previous year.
6.10. Taking into account inflation, investment in general practice per person followed a declining trend from 2005/2006 to 2012/2013. However, the last two years’ data both show a real increase in expenditure. Real expenditure per head in 2014/2015 was 9.3% higher than 2003/2004 levels (representing average real growth of 0.95% per year).
48 Population data taken from Office for National Statistics "Annual Mid-year Population Estimates, 2014" http://www.ons.gov.uk/ons/rel/pop-estimate/population-estimates-for-uk--england-and-wales--scotland-and-northern-ireland/mid-2014/stb---mid-2014-uk-population-estimates.html
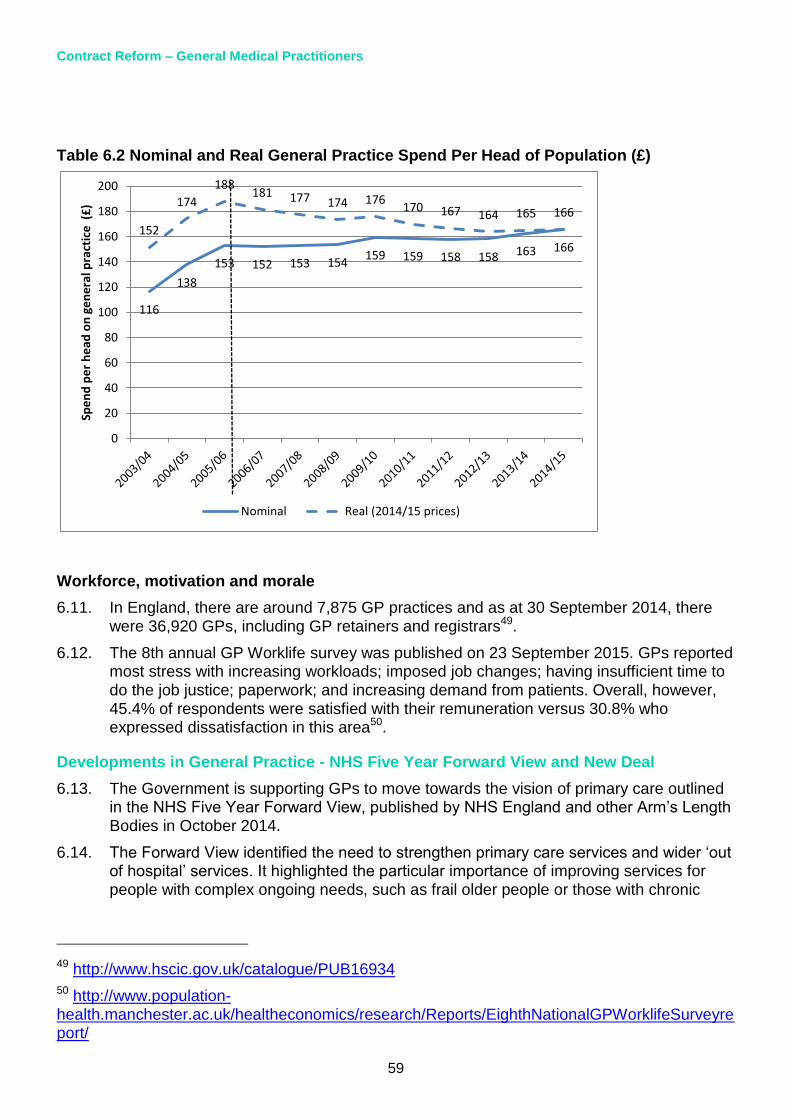
Contract Reform – General Medical Practitioners
59
116
138
153 152 153 154 159 159 158 158 163 166
152
174
188 181 177 174 176
170 167 164 165 166
0
20
40
60
80
100
120
140
160
180
200
Spe
nd
pe
r h
ead
on
ge
ne
ral p
ract
ice
(£
)
Nominal Real (2014/15 prices)
Table 6.2 Nominal and Real General Practice Spend Per Head of Population (£)
Workforce, motivation and morale
6.11. In England, there are around 7,875 GP practices and as at 30 September 2014, there were 36,920 GPs, including GP retainers and registrars49.
6.12. The 8th annual GP Worklife survey was published on 23 September 2015. GPs reported most stress with increasing workloads; imposed job changes; having insufficient time to do the job justice; paperwork; and increasing demand from patients. Overall, however, 45.4% of respondents were satisfied with their remuneration versus 30.8% who expressed dissatisfaction in this area50.
Developments in General Practice - NHS Five Year Forward View and New Deal
6.13. The Government is supporting GPs to move towards the vision of primary care outlined in the NHS Five Year Forward View, published by NHS England and other Arm’s Length Bodies in October 2014.
6.14. The Forward View identified the need to strengthen primary care services and wider ‘out of hospital’ services. It highlighted the particular importance of improving services for people with complex ongoing needs, such as frail older people or those with chronic
49 http://www.hscic.gov.uk/catalogue/PUB16934
50 http://www.population-health.manchester.ac.uk/healtheconomics/research/Reports/EighthNationalGPWorklifeSurveyreport/
The Review Body on Doctors' and Dentists' Remuneration (DDRB) Review for 2016
60
conditions, as well as a greater focus on prevention. It set out some immediate steps to stabilise and strengthen general practice services, including:
stabilising core practice funding;
giving GP led clinical commissioning groups (CCGs) more influence over the wider NHS budget; and providing new funding through schemes such as the Prime Minister’s GP Access Fund to support new ways of working and improved access to services.
6.15. As set out in the Conservative manifesto ahead of the 2015 general election committed, the Government is committed to improving access to GP services as part of our plan for a seven day NHS. Achieving improved access not only benefits patients but also has the potential to create more efficient ways of working, which benefits GPs and practice staff.
6.16. In June 2015, the Secretary of State for Health set out further details of a ‘New Deal for General Practice’ to help transform the quality of services and access to care. As part of the New Deal, the government’s intention is to transform access to primary care and give GPs greater responsibility and greater opportunities to help coordinate the care and support given to their registered patients.
6.17. For its part of the New Deal, the government is investing in general practice infrastructure; increasing the GP workforce; and taking actions to reduce bureaucracy to free time for GPs to spend with patients.
Investment in Infrastructure
6.18. We are investing in primary care infrastructure through the Primary Care Transformation Fund, £1 billion of funding over four years. The first tranche of the fund is being deployed in 2015/16 to support a range of initiatives, including hundreds of schemes from individual practices to improve their estate. NHS England has now written to Clinical Commissioning Groups (CCGs), inviting them to put forward proposals for investment from the Fund for 2016/17 and beyond to support premises or technology which will increase the capacity of general practice and out-of-hospital care.
6.19. Additionally, we have invested £175 million (including £25 million from the Primary Care Transformation Fund) in two waves of Prime Minister’s GP Access Fund (formerly known as PM’s Challenge Fund) schemes, which are piloting innovative ways of improving access to GP services.
Workforce
6.20. As part of the New Deal, the government has committed to increasing the primary and community care workforce by at least 10,000, including 5,000 more doctors working in general practice by 2020.
6.21. Practices are able to determine the practice skill mix that can best meet the needs of their patients. A multi-disciplinary team includes not just GP but other types of healthcare professional, for example nurses, pharmacists and physiotherapists, as well as newer roles such as physician associates. The exact nature of the primary care team will vary.
6.22. In January 2015, HEE, NHS England, the Royal College of General Practitioners (RCGP) and the BMA’s General Practitioners Committee (GPC) published a ten point

Contract Reform – General Medical Practitioners
61
plan, Building the Workforce51 to boost GP numbers. It includes actions to make general practice more attractive to junior doctors and medical students, as well as to encourage experienced GPs to remain in the profession and support GPs to return to practice after a period of time out.
6.23. One of these actions is for the four partner organisations to develop innovate primary care skill mix pilots. A scheme for clinical pharmacists working in general practice was launched in June.
Reducing bureaucracy
6.24. As part of the New Deal for General Practice, the government has committed to reducing the bureaucratic burdens on general practice. In support of this, NHS England commissioned the NHS Alliance and Primary Care Foundation to complete a study of general practice. The resulting report, Making Time In General Practice52, identified a number of national and local actions that should be taken to free up GP time. GP practices, as businesses, have the ability to make changes to the way they operate to increase efficiency, and the report does include recommendations for actions that can be taken by individual GP practices and GP federations and networks.
6.25. On 29 October 2015, the Secretary of State announced specific measures to free up time for GPs and general practice by stopping unnecessary re-referrals from hospitals back to GPs, freeing up an estimated 5% of all GP appointments, introducing a single payment systems for all transactions, and making general practice paperless.
New contract 2017
6.26. To support the move towards this vision for primary care services, the Prime Minister announced on 4 October 2015 that there will be a new voluntary contract for GP federations or practices that cover populations of at least 30,000 patients to support them to deliver seven day services and integrate care for patients. NHS England will now work with the medical and nursing professions to offer, by April 2017, a new contract that properly recognises the outcomes that GPs and their colleagues deliver for patients, including seven day access.
6.27. The key principles of the new contract will be: more money for primary care; more control for GPs over the way they work; and more time to care for patients including through services seven days a week. This will be supported by funding from within the £10 billion of extra investment already committed to the NHS on the back of a strong economy.
Issues for the Doctors’ and Dentists’ Review Body to consider
6.28. The Department has asked the Review Body to consider how an overall pay uplift of an average of 1% could be applied to improve recruitment and retention.
6.29. We would welcome the Review Body’s views; however, having carefully considered the case for targeting the pay award to support recruitment and retention, following the remit from the Chief Secretary to the Treasury, we do not consider that there is a strong case for targeting in 2016/17.
51 https://www.england.nhs.uk/commissioning/wp-content/uploads/sites/12/2015/01/building-the-workforce-new-deal-gp.pdf 52 https://www.england.nhs.uk/2015/10/05/gp-appointments/

The Review Body on Doctors' and Dentists' Remuneration (DDRB) Review for 2016
62
6.30. The Review Body will want to consider the impact on patient services of applying any differential uplift to GP contracts. As a considerable proportion of practice income is based on a weighted capitation formula, which takes account of patient profile, we have strong concerns that a differential uplift would cut across the operation of the formula. NHS England is currently conducting a review of this formula.
6.31. Furthermore, there remains a lack of robust data on vacancy rates within general practice. From 2015, the HSCIC has started to collect this information from practices as part of the wMDS. The HSCIC intends to publish the full dataset including vacancy information for the first time in March 2016. Publication will be subject to the quality, completeness and robustness of the data.
6.32. Additionally, as set out above, work is already underway by NHS England, Health
Education England, the Royal College of GPs and British Medical Association’s General Practitioners Committee to boost the GP workforce as part of the ten point plan. The Review Body will wish to consider any uplift within the context of the work already being undertaken.
6.33. Finally, GP practices are independent businesses and the Review Body will also want to take into account the ability of practices to decide how to apportion any uplift and that this might not support recruitment and retention.
Employed GPs
Salaried GPs
6.34. There are model terms and conditions for salaried GPs including a pay range with minimum and maximum pay points. It is for the employer to determine the level of salary and whether and how pay should vary over time. Last year the DDRB recommended that the pay range minimum and maximum should increase by 1% for 2015/2016.
Contract Reform – General Dental Practitioners
63
7. Contract Reform – General Dental Practitioners
General Dental Services Contractors
7.1. The government has extended the public sector pay policy of 1% for the rest of this Parliament. The government’s view is that this policy should extend to all employees and those individuals or groups indirectly funded via the public sector. We would expect the DDRB recommendation for General Dental Practitioners to be considered within this wider context.
General Dental Practitioners: Earnings and Expenses
7.2. The average taxable income for all dentists in 2013/2014 was £71,700 down from £72,600 in 2012/2013. This reflects a fall in the average gross income to £155,100 in 2013/2014 from £156,100. The level of expenses to gross income (the expenses ratio) increased to 53.8% from 53.5%. The expenses ratio remains towards the lower end of the range seen during the last ten years. Table 7.1 has details for the last ten years.
Table 7.1 Gross Income, Expenses and Taxable Income for All Dentists from 2004/2005 to 2013/2014
Average Gross Earnings
Average Expenses
Average Taxable Income
Expenses ratio
2004/2005 £193,215 £113,187 £80,032 58.6%
2005/2006 £205,368 £115,450 £89,919 56.2%
2006/2007 £206,255 £110,120 £96,135 53.4%
2007/2008 £193,436 £104,373 £89,062 54.0%
2008/2009 £194,700 £105,100 £89,600 54.0%
2009/2010 £184,900 £100,000 £84,900 54.1%
2010/2011 £172,000 £94,100 £77,900 54.7%
2011/2012 £161,000 £86,600 £74,400 53.8%
2012/2013 £156,100 £83,500 £72,600 53.5%
2013/2014 £155,100 £83,400 £71,700 53.8%
Source: HSCIC, Dental Earnings and Expenses report 2004/2005 – 2013/201453
7.3. In England, the earnings of a dentist are dependent on whether they are a Providing-Performer dentist or a Performer only dentist.54 In 2013/2014, Providing-Performer dentists had an average taxable income of £115,200 up from £114,100 in 2012/2013. In
53 http://www.hscic.gov.uk/catalogue/PUB18376
54 A Provider is a dentist who is a partner, sole trader, or shareholder who holds a GDS/PDS contract. A Provider can also be a limited company that holds a GDS/PDS contract. Providers are sometimes referred to as Contractors. Performer-only dentists work for a GDS/PDS Provider and are sometimes referred to as Associates. They may be self-employed (including a locum) or employed.

The Review Body on Doctors' and Dentists' Remuneration (DDRB) Review for 2016
64
contrast, a Performer only dentist saw their average taxable income fall to £60,600 in 2013/2014 down from £60,800 in 2012/2013.
7.4. A number of factors make it difficult to compare the level of earnings and gross income from one year to another. These factors include variations in hours worked and in the balance between NHS and private sector work; the shift in the make-up of the dentist population with relatively fewer Provider-Performers and more Performer only dentists and the evolving nature of practice business models and the rise of incorporation.
General Dental Practitioners: Recruitment and Retention
7.5. The HSCIC publish data on the number of dentists who have delivered NHS dentistry in any given financial year (Table 7.2 below). This is based on data from the NHS Business Service Authority who processes the payment forms.
Table 7.2: Number and Percentage of Dentists with NHS Activity by Dentist Type, 2006/2007 to 2014/2015
2006/2007 2010/2011 2011/2012 2012/2013 2013/2014 2014/2015
Total 20,160 22,799 22,920 23,201 23,723 23,947
Providing performer 7,585 5,858 5,099 4,649 4,413 4,038
Performer only 12,575 16,941 17,821 18,552 19,310 19,909
Source: HSCIC, Dental Statistics for England 2014/1555
7.6. From 2006/2007 to 2014/2015 the total number of dentists actively delivering NHS services increased from 20,160 to 23,947. During this period, the number of Provider-Performers fell and they now make up only 16.9% of the workforce. The number of performer only dentists rose significantly from 12,575 to 19,909. This suggests that while individual practices may have difficulty in attracting and retaining performer dentists, there does not appear to be a general problem across England.
General Dental Practitioners: Motivation and Morale
7.7. The Dental Working Hours: Motivation and Morale 2012/2013 & 2013/2014 report was published56 by HSCIC in August 2015. Motivation is regarded as the internal drive of an individual, e.g. inspiration or enthusiasm. The results show that in 2013/2014 more Performer only dentists answered ‘strongly agree’ or ‘agree’ to the motivation questions. Performer only dentists appear to have higher morale than Provider-Performers. This is shown in table 7.3 below.
55 http://www.hscic.gov.uk/catalogue/PUB18129
56 http://www.hscic.gov.uk/catalogue/PUB18272

Contract Reform – General Dental Practitioners
65
Table 7.3 Average Motivation Results; Average Morale Results 2012/2013, 2013/2014
Average motivation (%) Average Morale (%)
Provider-Performer
Performer only Provider-Performer
Performer only
2012/13 48.3 48.2 27.3 42.1
2013/14 45.7 48.8 27.2 42.7
1 - Average of ‘strongly agree’ or ‘agree’ responses to the motivation questions
2 - Percentage of dentists who recorded their morale as ‘very high’ or ‘high’
7.8. In 2013/2014, Performer only dentists responded more positively than Provider-Performer dentists with a 48.8% ‘strongly agree’ or ‘agree’ response compared to 45.7%.
7.9. Morale generally relates to comfort and satisfaction. 42.7% of Performer only dentists answered ‘very high’ or ‘high’ to the question ‘How would you relate your morale as a dentist?’ This contrasts to only 27.2% of Provider-Performer dentists.
7.10. Comparing the data published by HSCIC relating to 2012/2013 and by British Dental Association relating to 2012, the BDA data reports a higher motivation score for Provider-Performers (58%) than the HSCIC published report (47.5%). However, it is difficult to draw conclusions from the differences as the population groups covered by the survey differ. For example, the BDA only canvassed their members, many of them doing private only work. The Dental Working Group57 report covered individuals undertaking more NHS work and working longer hours.
Dental Contract Reform
7.11. The government is committed to reforming the current dental contractual framework including a period of prototyping (see below) to test new ways of remunerating dentists. The government will also be carefully considering the issue of non-time limited dental contracts as part of contract reform. This commitment, originally made in 2010 and reaffirmed by the current government, is intended to increase access to NHS Dentistry and implement improvements in oral health. The reformed approach will move away from the current activity-driven system to one that includes:
a clinical approach focussed on prevention as well as treatment; and
measurement of quality through a Dental Quality and Outcomes Framework (DQOF).
57 Dental Working Group includes representatives from the Department of Health; NHS England; The Welsh Government; The Department of Health, Social Services and Public Safety, Northern Ireland; The Northern Ireland Health and Social Care Business Services Organisation; Scottish Government; NHS National Services Scotland: Information Services Division; The British Dental Association; The Secretariat for the Review Body on Doctors’ and Dentists’ Remuneration; The NHS Business Services Authority Information Services; HMRC: Knowledge, Analysis and Intelligence Division; and The National Association of Specialist Dental Accountants and Lawyers

The Review Body on Doctors' and Dentists' Remuneration (DDRB) Review for 2016
66
7.12. Piloting of the new contractual framework began in 2011 to test the new clinical approach and gather the learning needed to design a new remuneration system. In 2014 the government announced the proposed new approach to remuneration which will reflect activity, quality and capitation set out above.
7.13. Prototype sites will test the proposed new system from this autumn in about 100 dental practices. Prototyping will continue throughout 2016/2017. If successful, stress testing the new approach with a larger number of sites will commence in 2017/2018, with a possible wider national roll-out commencing in 2018/2019. The inclusion of capitation in the remuneration approach and focus on prevention in the new clinical approach was welcomed by those involved in piloting. As recommended, we will consider the impact on motivation when finalising any new arrangements. As we are several years away
from a potential rollout of the new arrangements it is too early, at this stage, to plan on how DDRB recommendations may fit alongside them.

Salaried Primary Dental Care Services
67
8. Salaried Primary Dental Care Services
8.1. Salaried dentists working in community dental services (CDS) which are commissioned by NHS England, provide an important service to patients
8.2. NHS England are continuing to review how CDS are commissioned in line with their aim of implementing a single operating model wherever possible. They are currently undertaking a review of all contracts to ensure that provision is mapped against local need. This includes CDS contracts.
8.3. The Department of Health believes that CDS fill an important role in dental health service provision and are not aware of any specific difficulties in filling vacancies faced
by providers.
8.4. Three CDS are existing contract reform pilot sites and they will continue to test the new clinical approach with their specific, and usually vulnerable, patient groups.
8.5. The terms and conditions for salaried dentists directly employed by the NHS are negotiated by NHS employers on behalf of the NHS.

The Review Body on Doctors' and Dentists' Remuneration (DDRB) Review for 2016
68
9. Contract Reform – Ophthalmic Practitioners
9.1. The Department of Health remains firmly of the view that there should be a common sight test fee for optometrists and Ophthalmic Medical Practitioners (OMPs), which is consistent with previous DDRB recommendations for joint negotiation of the fee. Optometrists carry out nearly 99.9% of NHS sight tests. Discussions are to take place with representatives of the professions on the implementation of government pay policy. Commissioning of the NHS sight testing service in England is the responsibility of the NHS England.
Background
9.2. Between 31 December 2013 and 31 December 2014, the number of OMPs who were authorised by NHS England and Local Health Boards (LHBs) in Wales to carry out NHS sight tests decreased from 301 to 274, and the number of optometrists increased by 3.3% from 11,937 to 12,329. The General Ophthalmic Services continue to attract adequate numbers of practitioners of good quality with appropriate training and qualifications.
9.3. In 2014/2015, 13.51 million sight tests were paid for by NHS England and LHBs in Wales. This was 0.2% less than 2013/2014. Within these figures, the proportion of sight tests carried out by OMPs was 0.1%.
Sources:
General Ophthalmic Services, Workforce Statistics, England and Wales - 31 December
2014. http://www.hscic.gov.uk/catalogue/PUB16974
General Ophthalmic Services Activity Statistics - England, year ending 31 March 2015.
http://www.hscic.gov.uk/catalogue/PUB17930
Eye care statistics for Wales, 2014-15 - http://gov.wales/statistics-and-research/eye-
care/?lang=en
Pensions and Total Reward
69
10. Pensions and Total Reward
Introduction
10.1. The government has undertaken a range of changes to pensions in both the public and private sectors; including the introduction of the new state pension from April 2016, a review of the State Pension Age, and the introduction of auto-enrolment. The Public Service Pensions Act 2013 set out reforms to public service pension schemes, implemented from 1 April 2015 in the NHS Pension Scheme. Annex G demonstrates that the new NHS Pension Scheme 2015 continues to provide a generous pension for NHS staff and remains one of the best schemes available. The employer continues to
pay more towards the cost of the scheme than the workforce, contributing 14.3% of pensionable pay. Employee contributions are tiered according to income, with the rate paid by the lowest earners kept low in order to encourage and maintain participation in the scheme.
10.2. The NHS Pension Scheme (1995/2008 sections) is a final salary defined benefit occupational pension scheme. This scheme is now closed, other than for a limited group who are eligible for age-related protection. The new NHS Pension Scheme 2015 is a career average revalued earnings (CARE) scheme. The key differences between the two schemes, other than the way benefits are calculated, are different normal pension ages (1995 section – 60, 2008 section – 65, 2015 Scheme – state pension age) and accrual rates (1995 section – 1/80, 2008 section – 1/60, 2015 Scheme – 1/54). Under the new career average pension scheme most low and middle earners working a full career will continue to receive pension benefits that are at least as good, if not better than those under the former final salary schemes.
Implementation of the 2015 Scheme
10.3. Draft regulations for the 2015 NHS Pension Scheme were the subject of a public consultation in autumn 2014. There had been a significant amount of partnership working on the design and detail of the 2015 Scheme, and the responses to the public consultation largely reflected the fact that the regulations were consistent with what had been agreed with member representatives. Employee contribution rates from 1 April 2015 remain broadly the same as they were in the 2014/2015 scheme year.
10.4. The valuation of the existing NHS Pension Scheme, as at 31 March 2012, was completed using the methodology set out in the HMT Valuation Directions enacted through provisions in the Public Service Pensions Act 2013. The valuation report was published on 9 June 201458. This included a new discount rate for valuing the net present value of public service pension liabilities. The discount rate reduced from 3.5% plus RPI to 3% plus CPI following consultation in 2010 on the appropriate basis for the rate. This change resulted in increases to the net present value of scheme liabilities, for both past and future service, and therefore increased costs to employers.
10.5. Although public service schemes like the NHS are unfunded, government policy is that employer and employee contributions must meet the full cost of the liabilities accrued. Where previous contributions are found to have been insufficient to cover the full costs of the scheme, employers are required to pay off any deficit. Further changes include an
58 https://www.gov.uk/government/publications/nhs-pension-scheme-actuarial-valuation

The Review Body on Doctors' and Dentists' Remuneration (DDRB) Review for 2016
70
increased long term earnings assumption. The discount rate and the earning assumption are based on the Office for Budget Responsibility’s long term forecasts. The overarching principle behind the HMT Valuation Directions is for the valuations to measure the true cost of providing the public sector pension scheme, and to fully reflect those in the employer contribution rate from 1 April 2015. As a result of the 2012 valuation, the employer contribution rate from 1 April 2015 increased by 0.3% to 14.3%.
Review into Working Longer
10.6. The NHS Pension Scheme Proposed Final Agreement included the provision that in the new scheme, for pension accruals post 2015, the Normal Pension Age (NPA) should be set equal to the State Pension Age (SPA). This reflects the requirements of the Public Service Pensions Act 2013. Since September 2012 there has been an on-going tripartite review involving the Department of Health, NHS Employers and the NHS trade unions to address the impact of working longer in the NHS, with particular reference to staff working on the frontline and those with physically demanding roles, including the emergency services. The review was undertaken by the Working Longer Group (WLG), which delivered its initial report to the Department of Health in March 2014. The WLG oversees progress in delivering the recommendations in its report, which were accepted by DH Ministers. WLG’s recommendations were aimed at enabling staff to continue working to SPA, and beyond if they wish.
Review of Access
10.7. Within the recommendations of the Independent Public Service Pensions Commission there was provision to review the Fair Deal policy. After further consultation and discussions with the Trade Unions the Chief Secretary to the Treasury laid a Written Ministerial Statement in the House of Commons on the 4 July 2012 that stated:
“The government has reviewed the Fair Deal policy and agreed to maintain the overall approach, but deliver this by offering access to public service pension schemes for
transferring staff. When implemented, this means that all staff whose employment is
compulsorily transferred from the public service under Transfer of Undertaking (protection of employment) Regulations (TUPE), including subsequent TUPE transfers,
to independent providers of public services will retain membership of their current
employer’s pension arrangements. These arrangements will replace the current broad comparability and bulk transfer approach under Fair Deal, which will then no longer
apply.”
10.8. The Fair Deal for Staff Pensions59 is a non-statutory policy setting out how pensions issues are to be dealt with when staff are compulsorily transferred from the public sector to independent providers delivering public services.. The guidance applies to retenders involving compulsory transfers of staff who were transferred out under the old Fair Deal. Under the guidance there will continue to be protection where staff are subsequently transferred to a new employer.
10.9. The wider access review, included in the Proposed Final Agreement, was NHS specific and was developed in partnership with the DH, HMT, Trade Unions, Independent Sector and NHS Employers – building on the new Fair Deal provisions. The review resulted in additional provision within the NHS Pension Scheme, from 1 April 2014, allowing independent providers (IPs) of NHS clinical services with an Alternative Provider Medical
59 Fair Deal for staff pensions: staff transfer from central government, October 2013

Pensions and Total Reward
71
Services (APMS) contract or a NHS Standard Contract – including services procured under ‘Any Qualified Provider’ – to enrol eligible employees in the NHS Pension Scheme. IPs are able to choose from two levels of access – open (all employed staff) or closed (only staff with eligibility for the NHS Pension Scheme within the previous 12 months), or to maintain the default position where they comply with the new Fair Deal only.
10.10. The Department is currently undertaking a review of the access provisions and is considering whether the regulations are having the intended effect. Should the resulting report recommend changes to the regulations then these will be subject to public consultation.
Changes in Employee Pension Contributions
10.11. Even with the increases in employee contribution rates, implemented across three years from 2012/2013, the NHS Pension Scheme remains an excellent investment for retirement. The Government Actuary’s Department calculate that members can generally expect to receive around £3 to £6 in pension benefits value for every £1 contributed.
10.12. It should also be borne in mind that if members choose to leave the scheme they will lose the NHS employer contribution to their pension – currently 14.3%. Members would also give up their death-in-service benefits which may mean needing to review their life insurance arrangements.
10.13. In determining the distribution of contribution increases, a key government objective is to limit any commensurate increase in instances of members choosing to opt-out from the scheme. Consequently the Department has continued to review opt-out data from the scheme administrators to evaluate the impact of the first, second and third year of increases which have been applied from 1 April 2012. Trade Unions and NHS employer representatives have also reviewed this data. The evidence shows that there has been no significant change, and staff continue to value membership of the scheme.
10.14. High earners are likely to benefit from higher rate tax relief on their pension contributions. This meant that before contributions were raised in April 2012, members with full-time earnings over £60,000 actually paid a contribution rate that was lower than colleagues who earned half that amount, once tax relief had been taken into account.
10.15. Net of tax relief, the 2014/2015 contribution rates (Table 10.1) meant that a doctor on a salary of £80,000 only actually contributed at a rate 0.66% higher than a nurse earning £30,000. The Department does not consider this a disproportionate outcome for high earners

The Review Body on Doctors' and Dentists' Remuneration (DDRB) Review for 2016
72
Table 10.1 2014-15 contributions after tax relief (net)
Full-time pay
2013-14 contribution rate net of tax relief
2014-15 contribution rate net of tax relief
Net contribution rate increase (percentage points)
Additional cost (£ per month)
£10,000 4% 4% 0% 0
£15,000 4% 4% 0% 0
£20,000 4.24% 4.48% 0.24% 4
£25,000 5.44% 5.68% 0.24% 5
£30,000 7.2% 7.44% 0.24% 6
£40,000 7.2% 7.44% 0.24% 8
£60,000 6.78% 7.5% 0.72% 36
£80,000 7.38% 8.1% 0.72% 48
£130,000 7.98% 8.7% 0.72% 78
10.16. Employee contribution rates remain the same in 2015/16 as they were in 2014/2015, and have been set until 31 March 2019 (Table 10.2). However, the tier 4/5 pensionable pay boundary has been re-aligned to ensure that it reflects the current level of the higher rate tax threshold. The top of tier 4/bottom of tier 5 now coincides with the pay level at which members see their marginal tax rate increase from 20% to 40% after recognising that pension contributions reduce their taxable pay. It is expected that around 10% of members will see their contribution rate increase (by between 0.6% and 3.2% of pensionable pay, depending where they are in the pay range) at some point during the four years 2015-2019. A proportion of members are expected to progress to higher contribution tiers year to year through pay progression.
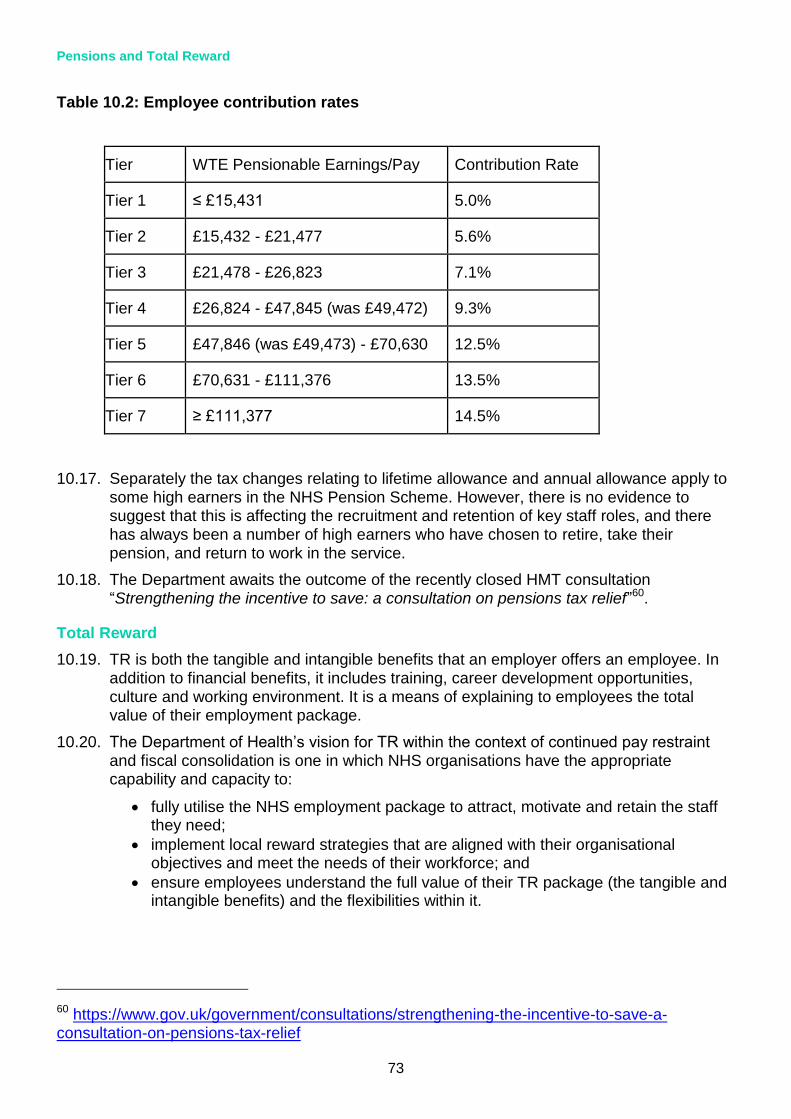
Pensions and Total Reward
73
Table 10.2: Employee contribution rates
Tier WTE Pensionable Earnings/Pay Contribution Rate
Tier 1 ≤ £15,431 5.0%
Tier 2 £15,432 - £21,477 5.6%
Tier 3 £21,478 - £26,823 7.1%
Tier 4 £26,824 - £47,845 (was £49,472) 9.3%
Tier 5 £47,846 (was £49,473) - £70,630 12.5%
Tier 6 £70,631 - £111,376 13.5%
Tier 7 ≥ £111,377 14.5%
10.17. Separately the tax changes relating to lifetime allowance and annual allowance apply to some high earners in the NHS Pension Scheme. However, there is no evidence to suggest that this is affecting the recruitment and retention of key staff roles, and there has always been a number of high earners who have chosen to retire, take their pension, and return to work in the service.
10.18. The Department awaits the outcome of the recently closed HMT consultation “Strengthening the incentive to save: a consultation on pensions tax relief”60.
Total Reward
10.19. TR is both the tangible and intangible benefits that an employer offers an employee. In addition to financial benefits, it includes training, career development opportunities, culture and working environment. It is a means of explaining to employees the total value of their employment package.
10.20. The Department of Health’s vision for TR within the context of continued pay restraint and fiscal consolidation is one in which NHS organisations have the appropriate capability and capacity to:
fully utilise the NHS employment package to attract, motivate and retain the staff they need;
implement local reward strategies that are aligned with their organisational objectives and meet the needs of their workforce; and
ensure employees understand the full value of their TR package (the tangible and intangible benefits) and the flexibilities within it.
60 https://www.gov.uk/government/consultations/strengthening-the-incentive-to-save-a-consultation-on-pensions-tax-relief
The Review Body on Doctors' and Dentists' Remuneration (DDRB) Review for 2016
74
10.21. Our main objective is to develop a coherent TR policy for implementation across the NHS that will help the NHS deliver workforce productivity improvements by supporting employers in ways that will:
help NHS organisations recruit, retain and motivate the staff they need to deliver excellent services to patients;
enable staff to understand the value of their reward package and have access to opportunities to maximise its value for them at different stages in their career;
contribute to improved patient and staff experience (engagement; health and wellbeing);
improve local management of the NHS paybill and support wider NHS productivity gains;
support and empower employers across the NHS to adopt and develop innovative pay and reward solutions that meet local need and enable them to compete for the best staff;
be in the vanguard of public sector approaches to TR; and
focus on reversing the increasing dissatisfaction with pay as evidenced by declining NHS Staff survey results reporting satisfaction with pay falling from 38% in 2013 to 33% in 2014 by improving staff perceptions of the value of their NHS reward package.
10.22. We are working with NHS Employers to develop the business case, strategy and plans for implementing the TR policy during this Parliament. This will be through:
re-engaging with NHS Employers TR focus groups to build on the roll out in 2014 of TRSs;
ensuring the NHS has access to TR expertise and is kept up to date with latest developments and leading edge practice supported by a range of products;
influencing a change in employer behaviour to embrace TR and share learning, for example, through encouraging wider use of its Reward Strategy toolkit61 designed to lead trusts through planning, developing and implementing their reward strategies; and ensuring that our TR approach influences and is influenced by ongoing pay contractual changes and pensions modernisation. Pay contractual negotiations are evolving but consideration may be given, for example, to arrangements under which employees may want to make use of Early Retirement Reduction Buyout (ERRBO) 62and/or, for example, buy more leave etc.
10.23. Details of possible activities and products agreed with NHS Employers to support the vision for reward in the NHS are included in Annex H.
Features of Total Reward Packages for Employed Doctors and Dentists
10.24. Components of the TR package for medical and dental staff employed directly by the NHS, updated where appropriate from last year, include:
for consultants, incremental progression of almost 7% of basic salary;
competitive starting pay for doctors in training;
61 http://www.nhsbsa.nhs.uk/3798.aspx
62 http://www.nhsbsa.nhs.uk/Pensions/4017.aspx

Pensions and Total Reward
75
a defined benefit pension scheme with a 14.3% employer contribution and flexible early retirement options from 55 years old;
immediate life assurance of twice an employee’s annual pay and generous death benefits for spouses and dependent children;
for consultants, between 40 and 42 days holiday (inclusive of Bank Holidays) compared with the 28 days statutory minimum;
sick pay of six months full pay and six months half pay compared with statutory sick pay of £88.45 per week for up to 28 weeks;
redundancy pay of up to two year’s salary with a minimum of 24 years reckonable service (using a notional £23,000 minimum and £80,000 maximum earnings for the purpose of calculating benefits) compared with the statutory half to one and a half week’s pay for each full year of service depending on age;
maternity pay of eight weeks full pay, 18 weeks half pay, 13 weeks statutory maternity pay (SMP) and an optional extra 13 weeks unpaid leave compared with the statutory entitlement of six weeks at 90% of average gross weekly earnings and 33 weeks at the lower of either £139.58 or 90% of average gross weekly earnings;
paternity leave of two weeks starting twenty weeks after the child is born as well as an additional two to 26 weeks if the mother has returned to work. Fathers are also entitled to receive additional paternity pay if the mother has not exhausted her SMP when she returns to work; and
the nationally recognised values, diversity and reputation of the NHS including, for example, excellent opportunities for flexible working, career breaks etc and other local initiatives (for examples, see the TRS section below).
Total Reward Statements
10.25. The Public Service Pension Act 2013 introduces a new legal requirement on public sector schemes to provide benefits information statements to members in pensionable service.
10.26. TRS were first introduced in the NHS during 2014 and are made available annually to most NHS employees. TRS are accessed by employees via the TRS portal and ESR employee self-service for organisations that use the facility. TRS have been developed and delivered by NHS Business Services Authority (NHSBSA) in partnership with the NHS ESR programme to support staff retention and motivation by giving NHS staff
details on the overall value of their employment package. Staff in organisations not using ESR receive an annual benefit statement (ABS).
10.27. TRS have been designed to help improve communications with employees, help them understand their complete benefits package and highlight the value of their employment and NHS pension benefits in one place. Evidence, for example, from NHS workshops suggests that employees do not understand the full value of their reward package with many unaware that they receive a 14.3% employer contribution towards their pension package. TRS should help resolve this and feedback from pilots confirmed that:
the concept appears to be understood by staff and well supported;
the quality of statements is regarded as good; and
there is further work to be undertaken with NHS employers to support the local customisation of statements thus ensuring that the project’s benefits are fully realised.
The Review Body on Doctors' and Dentists' Remuneration (DDRB) Review for 2016
76
10.28. TRS content is refreshed annually for each eligible employee. NHSBA, which administers the TRS carried out a Year One Evaluation in April 201563. Their findings show that TRS/ABS has been welcomed by NHS staff and viewed as a tool that provides valuable information. NHSBSA will continue to work with NHS Employers to refine work already done to build further awareness to establish fully the value and potential of TRS to a wider audience.
10.29. A TRS is a personalised summary that shows employees their reward package including:
basic pay;
allowances; and
pension benefits (for NHS Pension Scheme members).
10.30. Organisations using ESR can also add information about local benefits allowing employers to showcase the positive benefits of working for their trust. Local benefits could include:
health and wellbeing programmes;
learning and development;
flexible working opportunities;
childcare vouchers; and
cycle to work scheme.
10.31. The national roll out of TRS for 2015 has gone live with effect from 31 August 2015. There are 1,810,544 statements available following the successful pilot in 2014.
63 TRS/ABS Year One Evaluation Review. NHSBSA Customer Insight and Communication Team 2015

Pensions and Total Reward
77
Annex A
The Review Body on Doctors' and Dentists' Remuneration (DDRB) Review for 2016
78
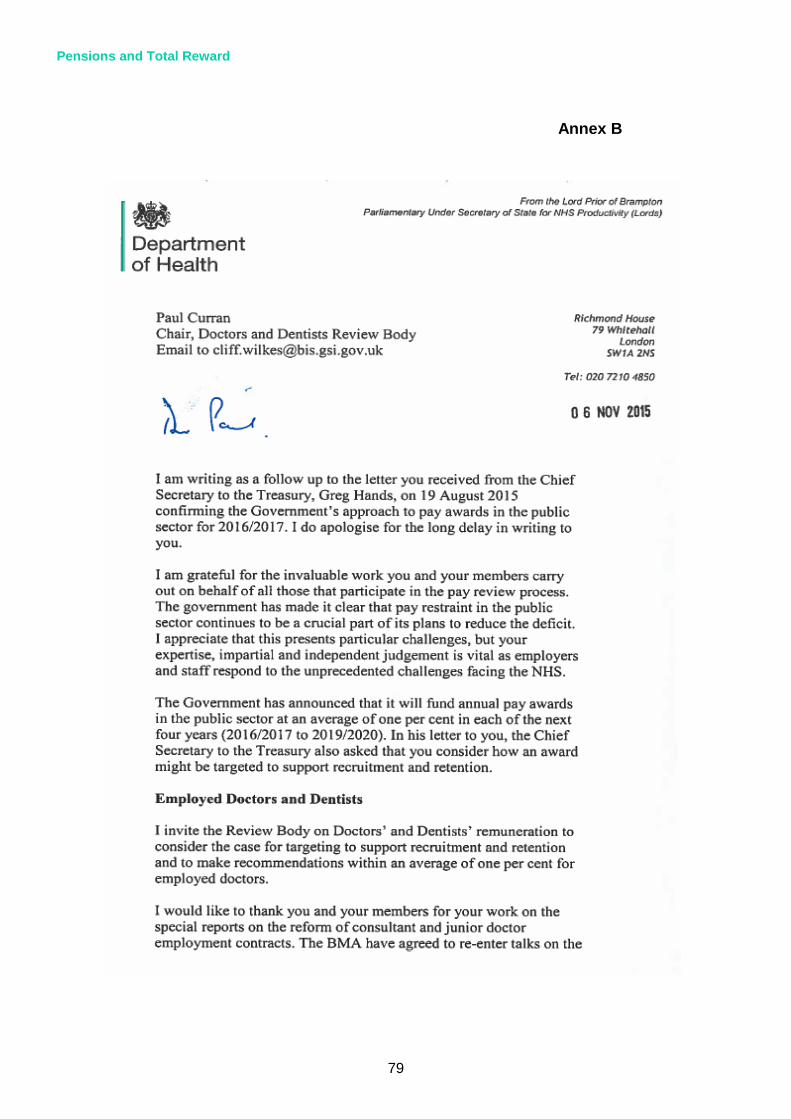
Pensions and Total Reward
79
Annex B
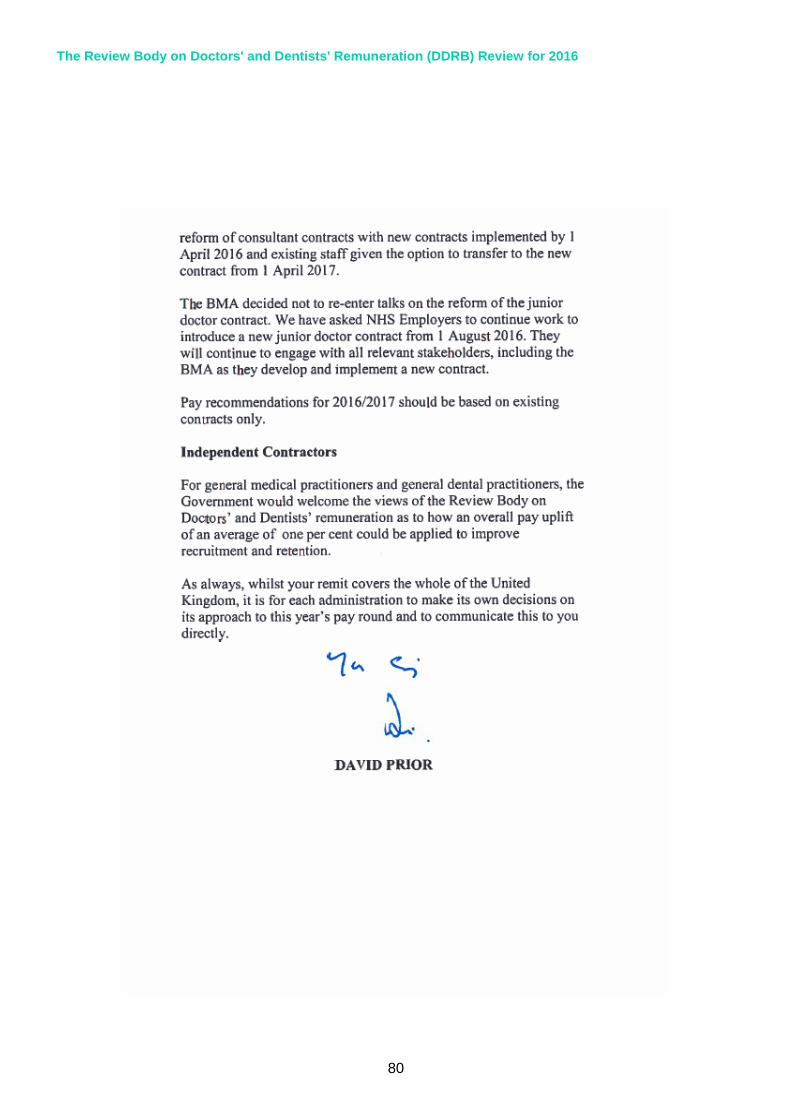
The Review Body on Doctors' and Dentists' Remuneration (DDRB) Review for 2016
80

Pensions and Total Reward
81
Annex C

The Review Body on Doctors' and Dentists' Remuneration (DDRB) Review for 2016
82
Pensions and Total Reward
83

The Review Body on Doctors' and Dentists' Remuneration (DDRB) Review for 2016
84
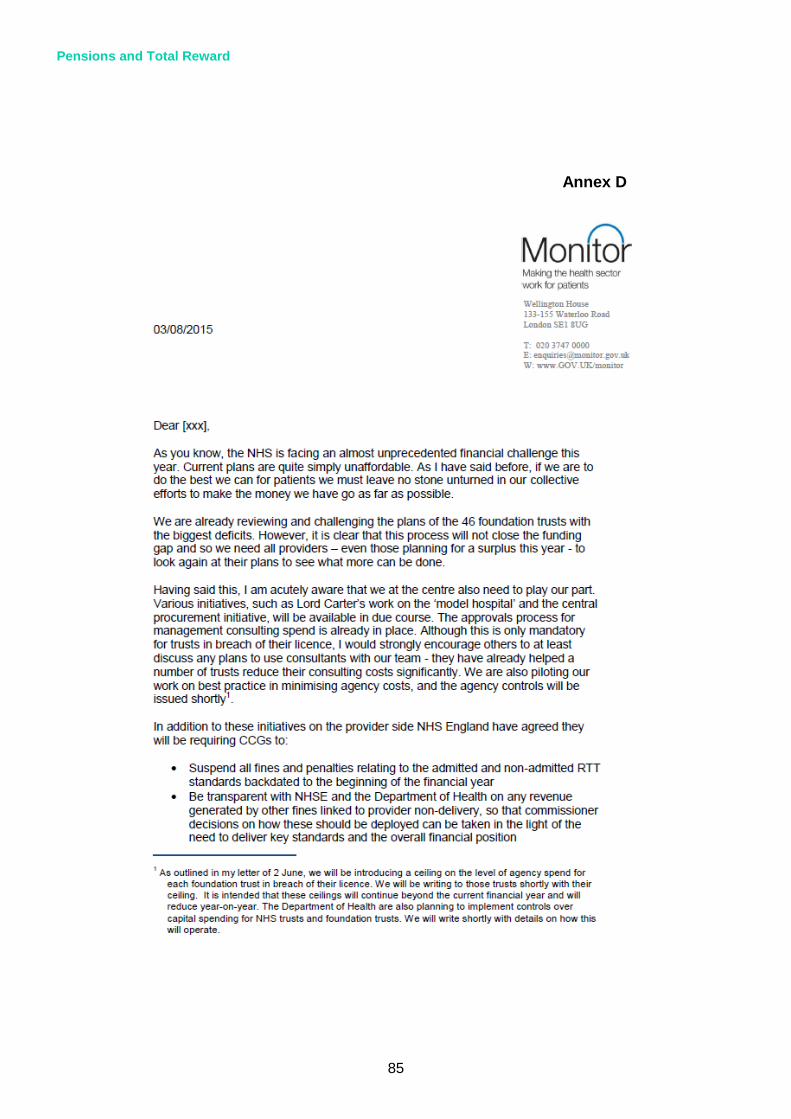
Pensions and Total Reward
85
Annex D

The Review Body on Doctors' and Dentists' Remuneration (DDRB) Review for 2016
86

Pensions and Total Reward
87
The Review Body on Doctors' and Dentists' Remuneration (DDRB) Review for 2016
88
Annex E

Pensions and Total Reward
89

The Review Body on Doctors' and Dentists' Remuneration (DDRB) Review for 2016
90

Pensions and Total Reward
91
Annex F
Agreement between BMA, DH and NHS Employers
30 November 2015
Following productive talks under the auspices of ACAS, the BMA, NHS Employers and the Department of Health are all agreed that a return to direct and meaningful negotiations in relation to a new contract for junior doctors is the right way forward. We intend to reach a
collaborative agreement, working in partnership to produce a new contract for junior doctors, recognising their central role in patient care and the future of the NHS.
All parties are committed to reaching an agreement that improves safety for patients and doctors and therefore NHS Employers have agreed to extend the timeframe for the BMA to commence any industrial action by four weeks to 13 January 2016 at 17:00, to allow negotiations to progress. Within that timetable, the BMA agrees to temporarily suspend its proposed strike action and the Department of Health agrees similarly to temporarily suspend implementation of a contract without agreement.
All parties acknowledge that they share responsibility for the safety of patients and junior doctors, which must be paramount. In reaching this agreement to return to negotiations the BMA acknowledge the wish of NHS Employers and the Department of Health to agree and implement a new contract without undue delay. All sides wish to achieve a contractual framework that provides fair reward and a safe working environment for junior doctors throughout the week.
Note: for the purposes of this agreement, NHS Employers is acting on behalf of all employers of junior doctors.
Memorandum of understanding
This memorandum sets out the basis on which the parties will progress the agreement to return to negotiation reached on 30 November 2015.
We acknowledge the commitment of the BMA, NHS Employers and DH to the centrality of junior
doctors in the current and future NHS, to recognise their dedication to patients and the NHS, and to provide a safe and supportive environment and fair reward.
The parties support the commitment to patients to ensure that the quality of care and patient outcomes (including appropriately adjusted mortality rates) are the same every day of the week. In that context we recognise the commitment of the government to work with the medical profession and other staff groups in partnership to improve access to seven day services. The parties recognise that junior doctors currently make a significant contribution

The Review Body on Doctors' and Dentists' Remuneration (DDRB) Review for 2016
92
across seven days, that urgent and emergency care is the priority for such services and that any new contract would support these aims.
All parties acknowledge the crucial role of doctors in training across the NHS in providing safe patient care and the need to properly recognise that contribution not only through terms and conditions but also by reaffirming the commitment to a high-quality training experience, the very best working environment and appropriate work-life balance.
The current cost-neutral November 2015 offer is the basis for further negotiation, and the BMA, NHS Employers and DH have agreed to work collaboratively to develop and oversee new contractual terms and conditions of service for junior doctors.
Contractual safeguards for safety are paramount and we therefore commit to develop a jointly selected and supported guardian role to oversee the hours of work of doctors in training and ensuring appropriate payment for hours worked outside planned work schedules.
A commitment is also made to define propositions on work schedules, including the number of hours designated as plain time ensuring that doctors in training would not be expected to work consecutive weekends, and how time for administrative duties and training should be recognized.
Our discussions will also address access to flexible training (through joint work between HEE, BMA and NHS Employers), taking into account the changing demographic of the medical workforce, as well as developing further our shared commitment to ensuring that the training and working environment for junior doctors is improved (including addressing issues of fixed leave, study leave, notice of deployment and duty rosters, access to rest and refreshment facilities).
Collaborative work on pay will include an 'open-book' approach to the November 2015 pay calculator and supporting data and models, including cost-neutrality and equality impact, helping ensure clear systems for pay progression and managing transition. This agreement also recognises the need to work in partnership with HEE and where relevant the medical royal colleges to improve the training experience for junior doctors, including improving access to flexible working and enabling the transition to a fully competency-based approach to support junior doctors to progress through their training.
Source: http://www.acas.org.uk/index.aspx?articleid=5557
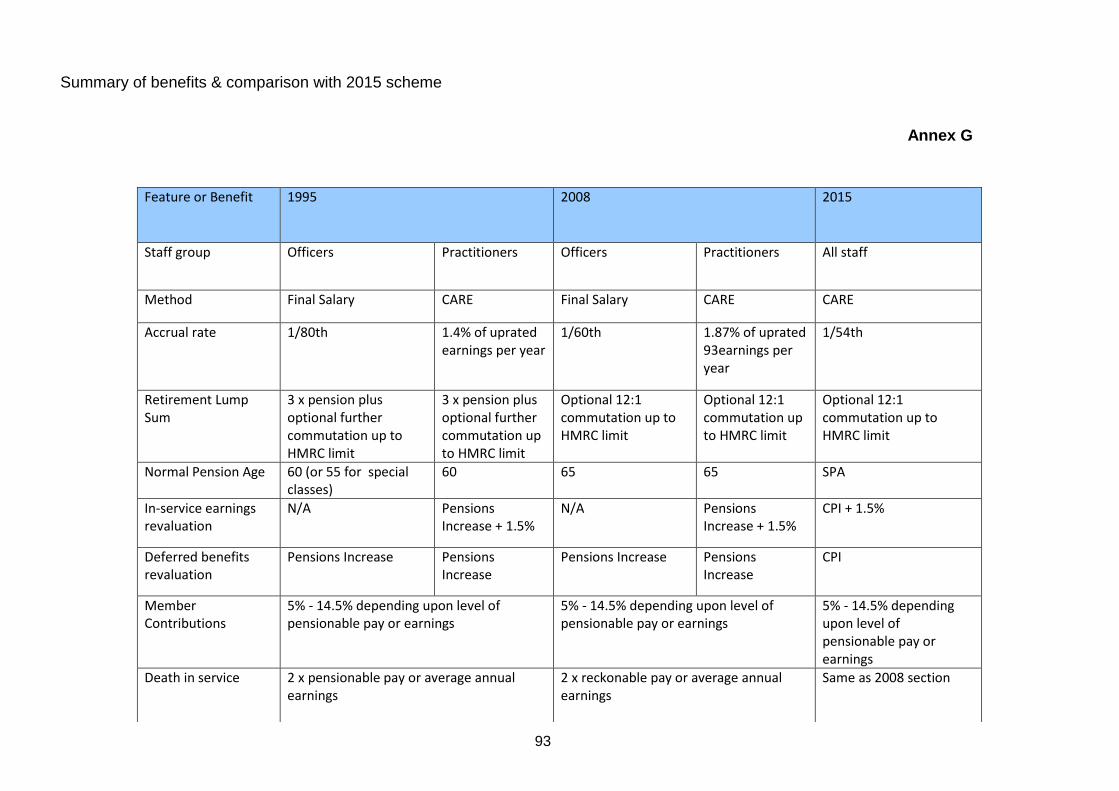
93
Summary of benefits & comparison with 2015 scheme
Annex G
Feature or Benefit 1995 2008 2015
Staff group Officers Practitioners
Officers Practitioners
All staff
Method Final Salary CARE Final Salary CARE CARE
Accrual rate 1/80th 1.4% of uprated earnings per year
1/60th 1.87% of uprated 93earnings per year
1/54th
Retirement Lump Sum
3 x pension plus optional further commutation up to HMRC limit
3 x pension plus optional further commutation up to HMRC limit
Optional 12:1 commutation up to HMRC limit
Optional 12:1 commutation up to HMRC limit
Optional 12:1 commutation up to HMRC limit
Normal Pension Age 60 (or 55 for special classes)
60 65 65 SPA
In-service earnings revaluation
N/A Pensions Increase + 1.5%
N/A Pensions Increase + 1.5%
CPI + 1.5%
Deferred benefits revaluation
Pensions Increase Pensions Increase
Pensions Increase Pensions Increase
CPI
Member Contributions
5% - 14.5% depending upon level of pensionable pay or earnings
5% - 14.5% depending upon level of pensionable pay or earnings
5% - 14.5% depending upon level of pensionable pay or earnings
Death in service 2 x pensionable pay or average annual earnings
2 x reckonable pay or average annual earnings
Same as 2008 section
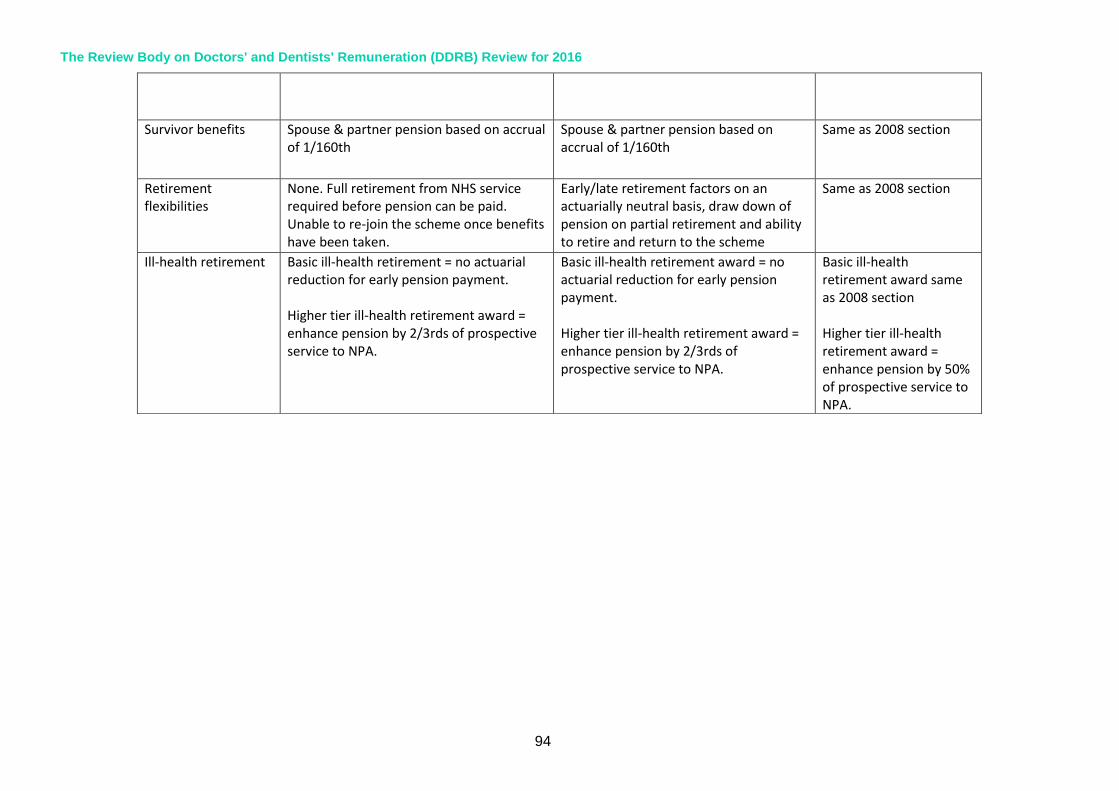
The Review Body on Doctors' and Dentists' Remuneration (DDRB) Review for 2016
94
Survivor benefits Spouse & partner pension based on accrual of 1/160th
Spouse & partner pension based on accrual of 1/160th
Same as 2008 section
Retirement flexibilities
None. Full retirement from NHS service required before pension can be paid. Unable to re-join the scheme once benefits have been taken.
Early/late retirement factors on an actuarially neutral basis, draw down of pension on partial retirement and ability to retire and return to the scheme
Same as 2008 section
Ill-health retirement Basic ill-health retirement = no actuarial reduction for early pension payment. Higher tier ill-health retirement award = enhance pension by 2/3rds of prospective service to NPA.
Basic ill-health retirement award = no actuarial reduction for early pension payment. Higher tier ill-health retirement award = enhance pension by 2/3rds of prospective service to NPA.
Basic ill-health retirement award same as 2008 section Higher tier ill-health retirement award = enhance pension by 50% of prospective service to NPA.

95
Annex H
List of Activities/Products Suggested to Support the Vision for Reward in the NHS
Education and Training
Training Programmes Linking with leading training providers to develop an NHS specific training programme that can be offered nationally at a reduced rate to employers
Seminar Session Series of seminar sessions run across the country on a variety of reward topics Run by different benefit providers and reward consultants
Employer Reward Network
Employer Support Network
Develop the existing NHS Employers Reward Engagement Group:
NHS Employers Team Working More Collaboratively
Proactively develop supportive/creative approaches to counteracting emerging issues
To ensure emerging issues are responded to proactively, providing employers with support to implement/develop new approaches to rewarding their staff
National Products and Tools
Briefing Papers Provide guidance, ideas and suggestions for how employers can maintain engagement with changes in how they reward staff
Reward Strategy Toolkit
Develop online for employers to adapt locally including the following:
This would be supported by an implementation plan and plan to add to/update the products regularly Aon Hewitt consultancy to support the development of the content
Online Communication
Guidance on voluntary benefits - 'top available products'
benefits that can be offered to staff
Intelligence

The Review Body on Doctors' and Dentists' Remuneration (DDRB) Review for 2016
96
Networking With Reward Experts from Other Sectors
Discover reward practices in organisations outside of the health service to generate ideas for new ways of rewarding staff and learning that can be transferred to employers. Link with HPMA
Total Reward Statement Development
Develop local use to reflect local range of benefits