the rise of market-reliant affordable housing tools
TRANSCRIPT

Patrick Spauster, Lydia Lo, and Yonah Freemark
November 2021
Survey results covering two decades of planning policy trends in US cities show a decline in
government-organized housing trust funds and a shift toward private market–reliant affordable
housing tools such as inclusionary zoning and zoning incentives. The result may ultimately be less
housing support for low- and moderate-income families in the communities that need it most.
This brief leverages results of the National Longitudinal Land Use Survey (NLLUS) to examine how
communities have altered land-use policies to generate housing affordable for households with low and
moderate incomes. We explore how local jurisdictions with land-use powers have altered their
approaches to implementing affordable housing trust funds, inclusionary zoning, and zoning incentives.
Results indicate that localities are increasingly dependent on market-reliant tools that provide
incentives for or require private-market actors to produce affordable housing as a part of their normal
business instead of localities proactively and directly paying to develop affordable housing.
Key Takeaways Local governments increasingly leverage market-reliant land-use policy tools to produce
affordable housing. On average, localities have reduced their emphasis on using publicly run
affordable housing trust funds and turned toward inclusionary zoning, which depends on
private-market investment in market-rate units to produce affordable units as a share of total
construction. As such, affordable housing production is constrained by the overall housing
market, which itself is constrained by other forces, such as restrictive zoning laws and high
construction costs. Research indicates that inclusionary zoning policies produce few new
affordable units (Ramakrishnan, Treskon, and Greene 2019).
M E T R O P O L I T A N H O U S I N G A N D C O M M U N I T I E S P O L I C Y C E N T E R
The Rise of Market-Reliant Affordable Housing Tools Findings from the National Longitudinal Land Use Survey

2 T H E R I S E O F M A R K E T - R E L I A N T A F F O R D A B L E H O U S I N G T O O L S
The use of local policy tools to support affordable housing investment varies across the
country. Larger, denser, and wealthier cities in the Northeast and the West are more likely to
adopt tools such as housing trust funds, inclusionary zoning, and zoning incentives compared
with cities in the Midwest and the South. These differences may reflect greater affordability
challenges in the Northeast and the West, stronger demand that reduces the risk of using
market-reliant policies, and greater wealth with which to use these tools. But many cities have
yet to leverage these approaches to add affordable housing, and low-income communities have
few local resources to address their needs through these tools.
The national affordability gap remains daunting, and further assistance is needed to meet the
needs of low- and moderate-income families.1 Although local governments have pursued
market-reliant affordable housing–related policy tools, these initiatives are unlikely to meet the
need for increased housing affordability among millions of Americans because evidence shows
they create few affordable units and few cities implement them. Further federal investment
remains necessary to fill the gap.
Contextualizing Local Housing Affordability Tools Housing affordability is a crisis affecting most US metropolitan areas. Most households with incomes
less than $35,000 a year spend more than half their incomes on rent, leaving little for food, education,
and health care (Getsinger et al. 2017; JCHS 2020).2 The affordable housing crisis has pushed local
governments nationwide to develop new tools to create units accessible to low- and moderate-income
families.
The two primary policy tools by which the federal government reduces housing expenses for
families are the Low-Income Housing Tax Credit, which finances the construction or renovation of
dwellings for low- and moderate-income families, and Housing Choice Vouchers, which provide low-
income families support to rent housing, much of it on the private market.3 Despite a rising affordability
crisis, per capita federal support for low-income renters has declined by roughly 20 percent over the
past decade (Vale and Freemark 2019), and Housing Choice Vouchers provide assistance to only one in
four eligible households (Ellen 2020). Neither program is sufficiently funded to meet the country’s
affordable housing needs, provoking local governments to search for new ways to create affordable
housing.
Moreover, neither federal program directly addresses local policies that prevent the creation of an
adequate housing supply overall in the face of high demand and rising costs, especially in neighborhoods
with the greatest access to opportunities such as employment. Local governments are granted
considerable authority to manage their own land-use regulations and tax policies, both of which local
actors can use to exacerbate inequities between communities or to reduce them. Some local laws allow
for wealth hoarding by a few exclusive communities, which limits the ability to redistribute funds for
public services to less-well-off places (Freemark, Steil, and Thelen 2020; Trounstine 2018). As a
consequence, compared with urban areas in peer European countries, access to affordable housing in
T H E R I S E O F M A R K E T - R E L I A N T A F F O R D A B L E H O U S I N G T O O L S 3
US metropolitan regions is less evenly distributed between municipalities, and segregation is more
entrenched (Freemark and Steil 2021).
Local land-use laws affect the availability and price of housing and can be used to promote equitable
outcomes. Local policies that increase the quantity of affordable housing and reduce inequities between
neighborhoods can complement federal investment. Zoning regulations define what types of land uses
are allowed where, as well as the scale of new construction. Zoning changes, thus, can affect property
values and new construction (Dong 2021; Einstein 2021; Freemark 2020; Greene and Ellen 2020;
Monkkonen 2019). In general, a larger supply of housing—whether oriented toward low- and moderate-
income families or not—is associated with lower housing costs overall in the long run (Been, Ellen, and
O’Regan 2019).
Local rules can also support affordable units more directly. Localities can generate funds from taxes
to support investment in affordable housing (e.g., through trust funds) and shape the affordability of
new market-rate development, such as in terms of requirements that new market-rate projects include
units affordable for low- and moderate-income families (inclusionary zoning). We explore these latter
approaches and their use by communities in this brief, which leverages data from NLLUS (Gallagher, Lo,
and Pendall 2019).
We explore key findings from NLLUS on affordable housing–related tools and regulations that cities
have implemented, the characteristics of jurisdictions that favor one kind of program over another, and
the ways implementation of those regulations has changed. We show that communities have
increasingly turned away from government-coordinated housing trust funds and toward more private
market–directed tools, such as inclusionary zoning, to increase affordable housing availability. In the
process, cities have left the fortunes of low-income families up to a real estate development sector that
faces many constraints and inadequate incentives in producing even enough market-rate housing to
meet the demand of people who can afford it—let alone subsidized, affordable housing for all who need
it.
Research Methods
Using data collected from NLLUS, this brief offers unique insight into understanding local rules related
to affordable housing and how they have changed. Overseen by the Urban Institute, NLLUS is a
repeated survey—conducted first in 1994, again in 2003, and most recently in 2019—of jurisdictions
that regulate land use. It tracks jurisdictions’ regulations over 25 years using the same or similar
questions each time to ensure accurate comparisons. Other surveys such as the Wharton Residential
Land Use Regulation Index (Gyourko, Hartley, and Krimmel 2019) or the Terner Center California Land
Use survey (Mawhorter and Reid 2018) capture similar measures of zoning and land-use restrictions,
but NLLUS is the only national land-use survey to capture jurisdictions’ proactive affordable housing
production policies (Pendall 2020).
4 T H E R I S E O F M A R K E T - R E L I A N T A F F O R D A B L E H O U S I N G T O O L S
In 2019, Urban distributed the survey by email to staff in every city or other jurisdiction that had
planning authority, at least 10,000 residents, and was located in the 50 largest US metropolitan areas by
population. Roughly 50 percent of recipients completed the survey online.4 We tested the
characteristics of respondents, finding that they were representative of the full cohort of such
jurisdictions across the nation in terms of population size and density. Survey questions and results are
available for the public and researchers to explore for free, either using an online interactive tool5 or
through a detailed data catalog6 (Gallagher, Lo, and Pendall 2019).
In this brief, we compare NLLUS results from 2003 and 2019, focusing on communities with staff
who responded in both years to ensure that changes are not biased by different response levels in the
two years. We study responses related to affordable housing trust funds, mandatory inclusionary
zoning, and zoning incentives. We undertake analyses that identify overall trends, as well as
multivariate regressions, which allow us to identify whether community use of particular policy tools is
associated with local demographic characteristics, based on data derived from the US Census Bureau
and American Community Survey (in 2000 and 2016).
Other researchers have begun to publish findings using NLLUS data. Pendall, Lo, and Wegmann
(2021), comparing results from 2003 and 2019, show that metropolitan areas with depressed housing
markets were more likely to embrace exclusionary zoning. On the other hand, in metropolitan areas
with strong housing markets, they find that zoning became more accommodating in terms of allowing
higher-density apartments, including in suburban communities.
Our research offers new evidence for the ways local governments have changed their approaches
to regulating land use, especially regarding affordable housing policies. Results we describe here,
however, are limited by the design of NLLUS. First, because the survey was conducted at specific times,
it does not record policy interventions that may have occurred in intervening years (e.g., a city that
adopted inclusionary zoning in 2004 and eliminated it in 2018 would be recorded as not using
inclusionary zoning in the 2003 and 2019 surveys). This may, in part, explain differences in our data on
housing trust funds and data produced by other surveys (Housing Trust Fund Project 2016).
Second, the survey relies on knowledgeable staff and shared definitions. Respondents from some
communities may not have been fully aware of policies in place, or they interpreted questions in a
manner different from how respondents from other cities did. Lewis and Marantz (2019) emphasize
that survey responses on zoning policy may be inconsistent and unreliable. Third, though NLLUS is more
detailed than any equivalent national land-use index, there remain policy details specific to each
community that cannot be captured in the survey responses we describe. Nevertheless, the longitudinal
nature of the survey, especially its inclusion of responses from many of the same communities over
time, provides useful insight that is otherwise unavailable.
Changing Popularity of Local Affordable Housing Tools We examine NLLUS data on local jurisdictions’ affordable housing policies. The following are common,
but they do not represent the full range of policies local governments enact.

T H E R I S E O F M A R K E T - R E L I A N T A F F O R D A B L E H O U S I N G T O O L S 5
Housing trust funds are dedicated accounts communities can use to fund affordable housing
construction, acquisition, or maintenance. Governments fund trust funds in myriad ways, such
as taxes, impact fees, in-lieu fees, and other revenue mechanisms (in some cases, the in-lieu fees
are funded by inclusionary zoning policies, described below). Local government agencies
typically distribute funds to projects and individuals chosen through public decisionmaking.
These funds became increasingly popular in the 1980s, and there are an estimated 700 such
funds throughout the US, including state-supported ones. For example, Washington, DC’s
Housing Production Trust Fund has generated funds to create or preserve about 10,000 units
of affordable housing over the past two decades. Localities with such funds have discretion over
their use, such as what types of residents qualify for support and which buildings are subsidized
(Brooks and Anderson 2017).7
Mandatory inclusionary zoning policies require private developers to include a certain share of
affordable units as part of new market-rate development projects or pay an in-lieu fee into a
trust fund in the place of such development. Such policies rely on private-sector investment;
without private projects, no affordable units are completed. Certain inclusionary zoning policies
are voluntary, sometimes combined with a zoning incentive (see below); others allow
developers to pay an in-lieu fee instead of building affordable housing on site, often directed
toward local housing trust funds. Local governments determine eligibility for affordable
housing units created through inclusionary zoning, as well as the share of units that must be
designated affordable, and whether such units are for rent or for sale (Anacker 2020; Dawkins,
Jeon, and Knapp 2017; Keep-Barnes 2017; Ramakrishnan, Treskon, and Greene 2019; Shroyer
2020; Thaden and Wang 2017).
Zoning incentives are exceptions to the base zoning code that allow developers to construct
bigger buildings, fewer parking spaces, or more units on a specific site, or to vary from base
zoning in some other way, in exchange for providing affordable housing. As with inclusionary
zoning, this policy relies on private-sector investment to be viable (Sclar et al. 2020; Yeganeh,
McCoy, and Hankey 2019).
These three policies often interact. Some jurisdictions allow developers to meet mandatory
inclusionary zoning requirements by paying in-lieu fees (NLLUS data show that two-thirds of
jurisdictions with mandatory inclusionary zoning offer this option), and the revenue from these fees
often flows into affordable housing trust funds. Because NLLUS questions ask about these policies
independently,8 our analysis does not address the interactions between these three policies but instead
examines each policy and how it has changed over time separately.
Furthermore, each of these policies is subject to state government oversight. Several states have
outlawed mandatory inclusionary zoning by municipalities within their borders; other states encourage
it.9 States also sometimes set out specific requirements related to trust fund management or use of
zoning policies. We do not, however, examine differences between states on this front.
According to the 2019 NLLUS, the use of specific local housing affordability policies varies across
the United States. Just under half of respondent communities used zoning incentives, with about a third

6 T H E R I S E O F M A R K E T - R E L I A N T A F F O R D A B L E H O U S I N G T O O L S
as many using housing trust funds or regulating new construction through inclusionary zoning policies
to create affordable housing (figure 1).
FIGURE 1
Popularity of Key Local Affordable Housing Policies, 2019
URBAN INSTITUTE
Source: Authors’ analysis of National Longitudinal Land Use Survey (NLLUS) data.
Notes: N = 753 to 915 respondents. The figure includes all census “place”-level jurisdictions in NLLUS with populations greater
than 10,000. Variables are nonexclusive.
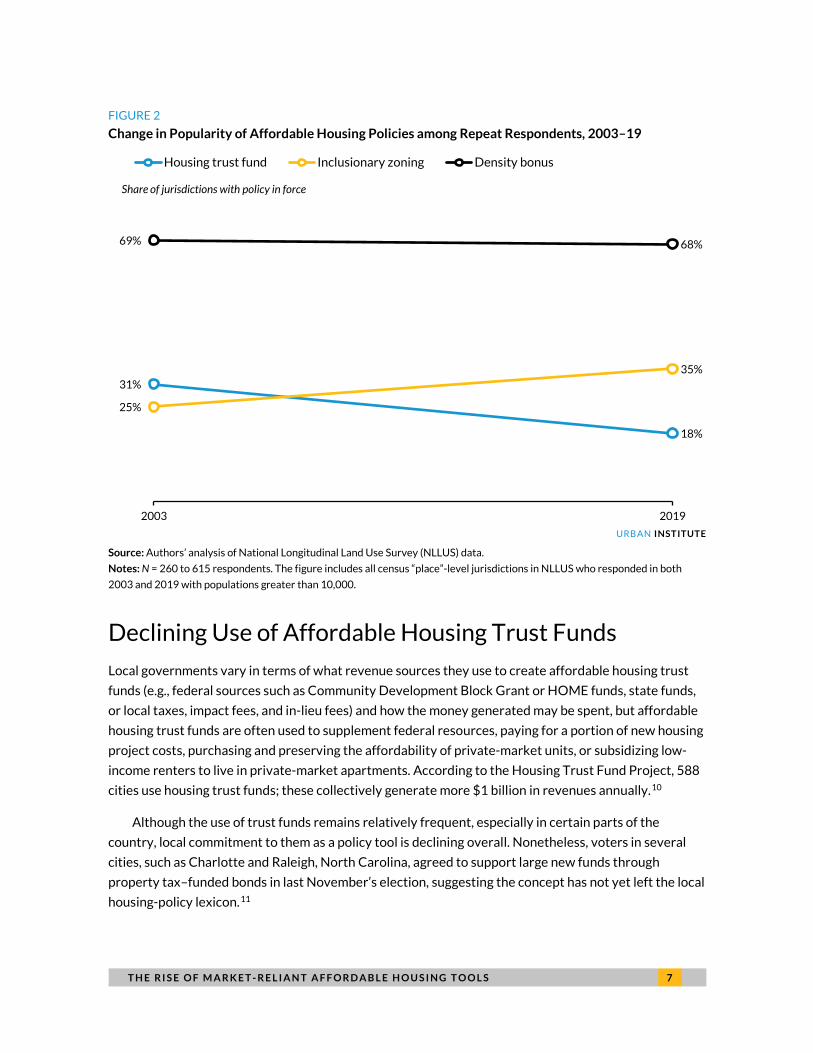
Facing rising concerns about housing affordability, communities have altered their approaches to
affordable housing policy to lean more heavily on private-sector initiatives. Figure 2 illustrates repeat
respondents’ affordable housing policies between 2003 and 2019 (in other words, it documents only
policies in communities with staff who responded in both years). Among repeat respondents, the
percentage who used an affordable housing trust fund declined from 31 percent to 18 percent.
At the same time, the use of density bonuses for affordable housing developers, the most popular
zoning incentive in the survey, remained constant at roughly two-thirds of surveyed communities
(though we do not have enough information to determine whether the specific incentives communities
used changed over time). Inclusionary zoning, on the other hand, has become increasingly popular: 25
percent of respondent communities used it in 2003 and 35 percent used it in 2019. In 2019, of the 158
communities using in-lieu fees (64 percent of those with inclusionary zoning programs), 115 also had a
housing trust fund into which in-lieu fees may be directed (73 percent of those with in-lieu fees).
Communities without trust funds may be directing their in-lieu fees into another account.
17%
16%
49%
Housing trust funds
Inclusionary zoning
Zoning incentives
Share of jurisdictions with policy
T H E R I S E O F M A R K E T - R E L I A N T A F F O R D A B L E H O U S I N G T O O L S 7
FIGURE 2
Change in Popularity of Affordable Housing Policies among Repeat Respondents, 2003–19
URBAN INSTITUTE
Source: Authors’ analysis of National Longitudinal Land Use Survey (NLLUS) data.
Notes: N = 260 to 615 respondents. The figure includes all census “place”-level jurisdictions in NLLUS who responded in both
2003 and 2019 with populations greater than 10,000.
Declining Use of Affordable Housing Trust Funds
Local governments vary in terms of what revenue sources they use to create affordable housing trust
funds (e.g., federal sources such as Community Development Block Grant or HOME funds, state funds,
or local taxes, impact fees, and in-lieu fees) and how the money generated may be spent, but affordable
housing trust funds are often used to supplement federal resources, paying for a portion of new housing
project costs, purchasing and preserving the affordability of private-market units, or subsidizing low-
income renters to live in private-market apartments. According to the Housing Trust Fund Project, 588
cities use housing trust funds; these collectively generate more $1 billion in revenues annually.10
Although the use of trust funds remains relatively frequent, especially in certain parts of the
country, local commitment to them as a policy tool is declining overall. Nonetheless, voters in several
cities, such as Charlotte and Raleigh, North Carolina, agreed to support large new funds through
property tax–funded bonds in last November’s election, suggesting the concept has not yet left the local
housing-policy lexicon.11
31%
18%
25%
35%
69% 68%
2003 2019
Housing trust fund Inclusionary zoning Density bonus
Share of jurisdictions with policy in force
8 T H E R I S E O F M A R K E T - R E L I A N T A F F O R D A B L E H O U S I N G T O O L S
Housing Trust Funds Are More Popular in Expensive and Dense Communities
in the Northeast and the West
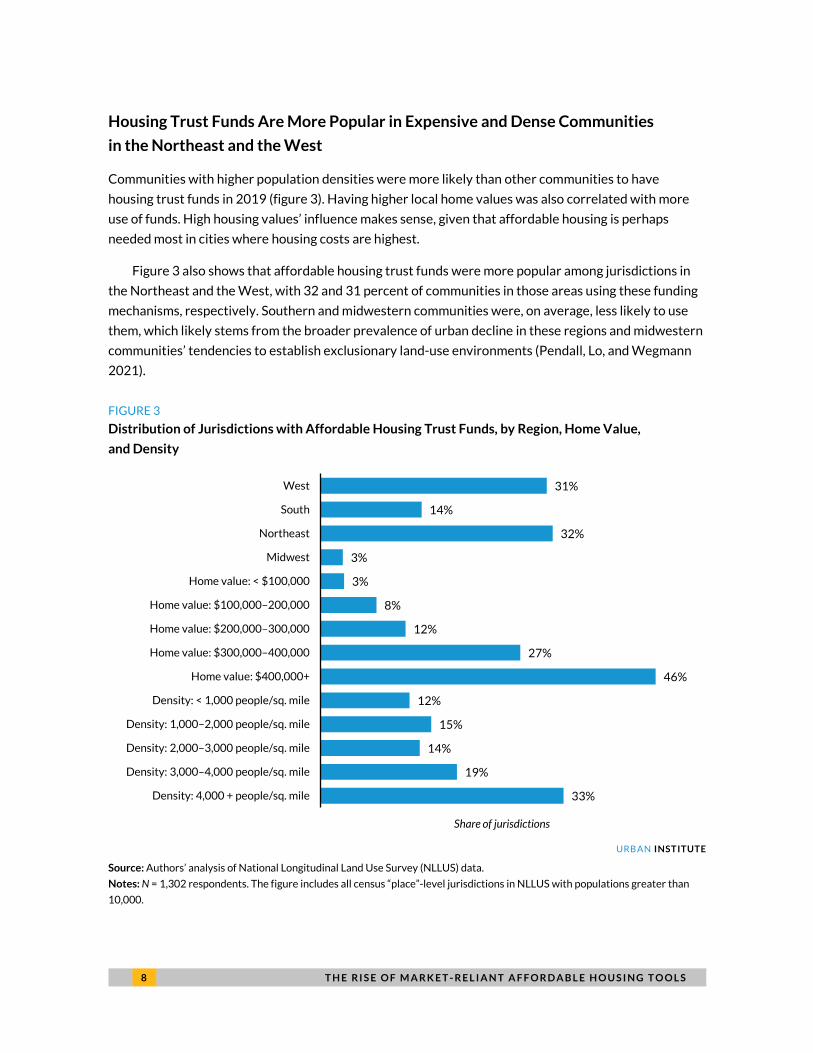
Communities with higher population densities were more likely than other communities to have
housing trust funds in 2019 (figure 3). Having higher local home values was also correlated with more
use of funds. High housing values’ influence makes sense, given that affordable housing is perhaps
needed most in cities where housing costs are highest.
Figure 3 also shows that affordable housing trust funds were more popular among jurisdictions in
the Northeast and the West, with 32 and 31 percent of communities in those areas using these funding
mechanisms, respectively. Southern and midwestern communities were, on average, less likely to use
them, which likely stems from the broader prevalence of urban decline in these regions and midwestern
communities’ tendencies to establish exclusionary land-use environments (Pendall, Lo, and Wegmann
2021).
FIGURE 3
Distribution of Jurisdictions with Affordable Housing Trust Funds, by Region, Home Value,
and Density
URBAN INSTITUTE
Source: Authors’ analysis of National Longitudinal Land Use Survey (NLLUS) data.
Notes: N = 1,302 respondents. The figure includes all census “place”-level jurisdictions in NLLUS with populations greater than
10,000.
33%
19%
14%
15%
12%
46%
27%
12%
8%
3%
3%
32%
14%
31%
Density: 4,000 + people/sq. mile
Density: 3,000–4,000 people/sq. mile
Density: 2,000–3,000 people/sq. mile
Density: 1,000–2,000 people/sq. mile
Density: < 1,000 people/sq. mile
Home value: $400,000+
Home value: $300,000–400,000
Home value: $200,000–300,000
Home value: $100,000–200,000
Home value: < $100,000
Midwest
Northeast
South
West
Share of jurisdictions

T H E R I S E O F M A R K E T - R E L I A N T A F F O R D A B L E H O U S I N G T O O L S 9
We conducted a series of regressions to control for relationships between variables and limited the
number of variables to avoid multicollinearity (table 1). We found that local housing values and
population density are statistically significantly associated with having a housing trust fund in use. In
addition, larger cities are more likely to have such funds in effect, perhaps suggesting that local
bureaucratic capacity influences the ability to implement local housing affordability programs. Having a
higher white population, however, was negatively associated with such policies, which may reflect less
distributive governance often associated with more white-dominated communities (Tausanovitch and
Warshaw 2014).
Moreover, communities in the Northeast were more likely to have trust funds in use than
communities in other regions, even after controlling for local housing values and other characteristics
(table 1, model 2). It is less clear why that is the case. It may be that northeastern jurisdictions have local
political cultures that are more supportive of government-funded affordable housing than midwestern
or southern political cultures.
TABLE 1
Correlates of the Presence of a Housing Trust Fund (1 or 0), by Land-Use Jurisdiction, 2019
Model 1 Model 2 Share of population that is non-Hispanic white -0.10 (0.04) ** -0.13 (0.05) *** Population size (log) 0.05 (0.01) *** 0.06 (0.01) *** Population density (log) 0.02 (0.01) ** 0.02 (0.01) ** Median housing value (log) 0.21 (0.02) *** 0.18 (0.02) *** Northeast region (dummy) 0.17 (0.02) *** South region (dummy) 0.03 (0.02) West region (dummy) 0.04 (0.03) Intercept 1.02 (0.21) *** 1.29 (0.22) *** n 1,467 1,467 R2 0.18 0.21
Source: Authors’ analysis of National Longitudinal Land Use Survey (NLLUS) data.
Notes: The table includes all census “place”-level jurisdictions in NLLUS with populations greater than 10,000. Regional dummies
are compared with the Midwest region. Robust standard errors are in parentheses.
*** p < 0.01; ** p < 0.05; * p < 0.1.
Affordable Trust Funds Are Losing Popularity
Despite rising housing costs nationwide, many jurisdictions that had affordable housing trust funds in
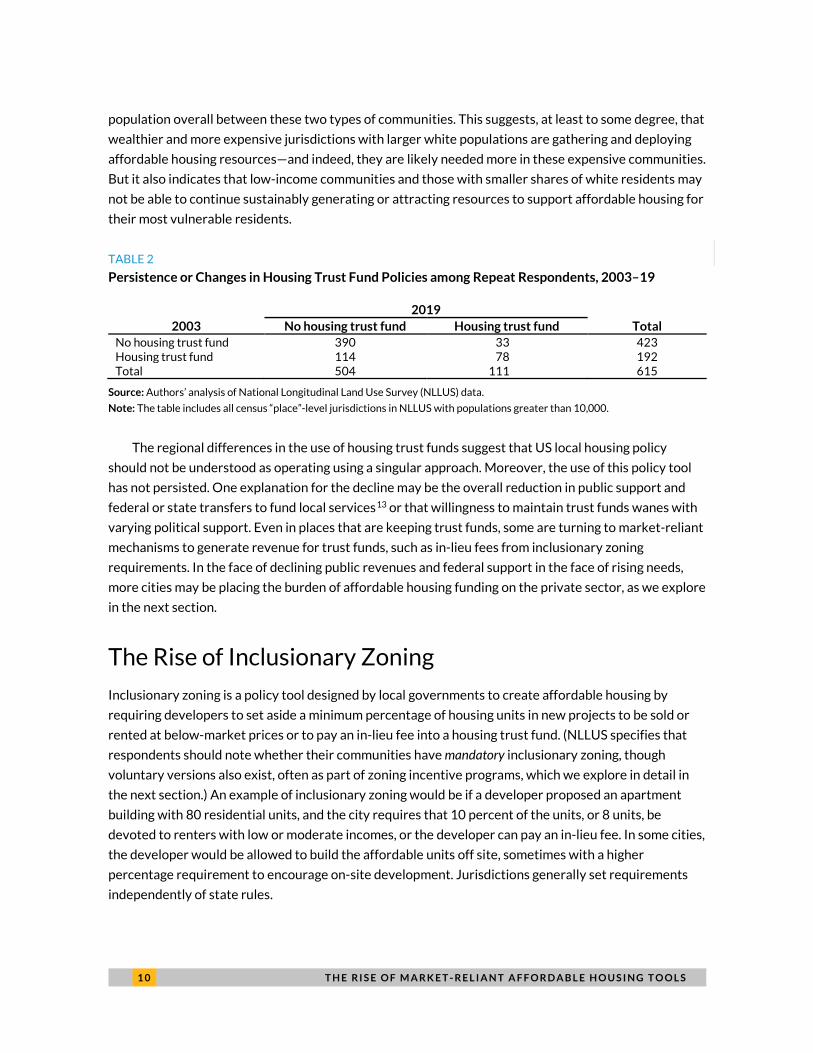
2003 had abandoned them by 2019 (table 2). Overall, according to NLLUS data of 615 repeat
respondents,12 the share of communities with trust funds declined from 31 percent in 2003 (192
communities) to 18 percent in 2019 (111 communities). Of those with trust funds in 2003, 59 percent
gave them up by 2019, whereas of those without them in 2003, only 8 percent added them by 2019.
We used t-tests of means to compare the demographic characteristics of the communities that
dropped or added housing trust funds over the study period. Those that dropped trust funds had
significantly lower household incomes, median housing values, and share of their populations that were
white than those that added trust funds. But there was no significant difference in population density or
1 0 T H E R I S E O F M A R K E T - R E L I A N T A F F O R D A B L E H O U S I N G T O O L S
population overall between these two types of communities. This suggests, at least to some degree, that
wealthier and more expensive jurisdictions with larger white populations are gathering and deploying
affordable housing resources—and indeed, they are likely needed more in these expensive communities.
But it also indicates that low-income communities and those with smaller shares of white residents may
not be able to continue sustainably generating or attracting resources to support affordable housing for
their most vulnerable residents.
TABLE 2
Persistence or Changes in Housing Trust Fund Policies among Repeat Respondents, 2003–19
2003 2019
Total No housing trust fund Housing trust fund No housing trust fund 390 33 423 Housing trust fund 114 78 192 Total 504 111 615
Source: Authors’ analysis of National Longitudinal Land Use Survey (NLLUS) data.
Note: The table includes all census “place”-level jurisdictions in NLLUS with populations greater than 10,000.
The regional differences in the use of housing trust funds suggest that US local housing policy
should not be understood as operating using a singular approach. Moreover, the use of this policy tool
has not persisted. One explanation for the decline may be the overall reduction in public support and
federal or state transfers to fund local services13 or that willingness to maintain trust funds wanes with
varying political support. Even in places that are keeping trust funds, some are turning to market-reliant
mechanisms to generate revenue for trust funds, such as in-lieu fees from inclusionary zoning
requirements. In the face of declining public revenues and federal support in the face of rising needs,
more cities may be placing the burden of affordable housing funding on the private sector, as we explore
in the next section.
The Rise of Inclusionary Zoning
Inclusionary zoning is a policy tool designed by local governments to create affordable housing by
requiring developers to set aside a minimum percentage of housing units in new projects to be sold or
rented at below-market prices or to pay an in-lieu fee into a housing trust fund. (NLLUS specifies that
respondents should note whether their communities have mandatory inclusionary zoning, though
voluntary versions also exist, often as part of zoning incentive programs, which we explore in detail in
the next section.) An example of inclusionary zoning would be if a developer proposed an apartment
building with 80 residential units, and the city requires that 10 percent of the units, or 8 units, be
devoted to renters with low or moderate incomes, or the developer can pay an in-lieu fee. In some cities,
the developer would be allowed to build the affordable units off site, sometimes with a higher
percentage requirement to encourage on-site development. Jurisdictions generally set requirements
independently of state rules.

T H E R I S E O F M A R K E T - R E L I A N T A F F O R D A B L E H O U S I N G T O O L S 1 1
Unlike housing trust funds, which provide direct subsidies for tenant-based assistance and creating
or preserving affordable units, inclusionary zoning serves as a quasi-tax on market-rate housing
transactions either to create subsidized, income-restricted units or indirectly generate revenue to fund
future affordable housing development. It depends on the creation of new market-rate projects—
particularly those that appeal to higher-income families—to cross-subsidize the costs of providing
housing for people with lower incomes. As a result, it is limited in its ability to produce a large number of
affordable units. Moreover, it works only in cities and neighborhoods where there is a market for new
investment and land values and where potential rents offset additional costs to developers for building
affordable units.
Urban Institute researchers have previously found that inclusionary zoning’s impacts are mixed.
Although these policies have produced new units, they are typically reserved for moderate- or middle-
income families, not the families with low or extremely low incomes who are most in need and who are
more likely to be served by programs such as housing trust funds (Ramakrishnan, Treskon, and Greene
2019). The policy may also have a detrimental impact on overall pricing, as the cross-subsidy inherent in
the model may increase the cost of market-rate units as developers pass the cost of the subsidy onto the
market-rate housing buyers or renters to preserve their normal profit margins (Soltas 2020).
On the other hand, inclusionary zoning may make possible the development of mixed-income
projects that are more likely to encourage neighborhood-level integration by economic class, race, or
ethnicity (Kontokosta 2014). This may make it feasible for lower-income people to access communities
of “opportunity”—those with better schools and easy commutes to jobs (Jacobus 2019). But the
effectiveness of this policy in promoting social mix is dependent on whether jurisdictions allow
developers to pay a fee in lieu of providing affordable housing on site or permit developers to build
affordable housing units at a different site to fulfill the inclusionary zoning requirement. These two
options reduce the potential for inclusionary zoning to decrease segregation.
Despite these challenges, our review of NLLUS data shows that inclusionary zoning policies, unlike
housing trust funds, have become more popular over the past two decades. But the popularity of such
policies varies substantially, depending on region and local characteristics, such as population density
and housing costs.
Large, Wealthy Cities in the Northeast and the West Are Using Inclusionary Zoning
to Integrate Affordability into New Development Projects
As with housing trust funds, the use of inclusionary zoning is context dependent. Cities and counties
with land-use power in the Northeast and the West were significantly more likely to use inclusionary
zoning to promote affordable housing than those in the South or the Midwest, where such policies were
virtually nonexistent (figure 4). The use of inclusionary zoning was also correlated strongly with housing
prices (more expensive communities were more likely to have the policy in place). More than 47 percent
of jurisdictions in the highest home-value quintile used such policies, compared with just 5 percent in

1 2 T H E R I S E O F M A R K E T - R E L I A N T A F F O R D A B L E H O U S I N G T O O L S
the lowest quintile. And communities with relatively high population densities (more than 4,000 people
per square mile) were more likely to use inclusionary zoning than those with lowest densities.
FIGURE 4
Distribution of Jurisdictions with Inclusionary Zoning, by Region, Home Value, and Density
URBAN INSTITUTE
Source: Authors’ analysis of National Longitudinal Land Use Survey (NLLUS) data.
Notes: N = 1,315 respondents. The figure includes all jurisdictions in NLLUS with populations greater than 10,000.
Using multiple regression models—again, limiting the number of variables to reduce
multicollinearity—we reaffirmed these findings. We identified housing value to be a significant
contributor in determining whether a community has implemented inclusionary zoning (table 3). We
also found that communities that had a higher share of residents of color and communities in the
Northeast were more likely to have an inclusionary zoning policy in effect, similar to the findings we
presented in table 1. We did not, however, find consistently significant differences in population size or
density in affecting the likelihood of inclusionary zoning being used, suggesting that communities of
many levels of bureaucratic capacity can implement this policy.
32%
19%
14%
13%
13%
47%
27%
10%
4%
5%
4%
38%
9%
26%
Density: 4,000 + people/sq. mile
Density: 3,000–4,000 people/sq. mile
Density: 2,000–3,000 people/sq. mile
Density: 1,000–2,000 people/sq. mile
Density: < 1,000 people/sq. mile
Home value: $400,000+
Home value: $300,000–400,000
Home value: $200,000–300,000
Home value: $100,000–200,000
Home value: < $100,000
Midwest
Northeast
South
West
Share of jurisdictions

T H E R I S E O F M A R K E T - R E L I A N T A F F O R D A B L E H O U S I N G T O O L S 1 3
TABLE 3
Correlates with the Use of Mandatory Inclusionary Zoning (1 or 0), by Land-Use Jurisdiction, 2019
Model 1 Model 2 Share of population that is non-Hispanic white -0.14 (0.05) *** -0.23 (0.05) *** Population size (log) 0.01 (0.01) 0.02 (0.01) *** Population density (log) 0.01 (0.01) * 0.01 (0.01) Median housing value (log) 0.23 (0.02) *** 0.20 (0.02) *** Northeast region (dummy) 0.22 (0.02) *** South region (dummy) -0.02 (0.02) West region (dummy) -0.02 (0.03) Intercept -2.77 (0.23) *** -2.53 (0.24) *** n 1,482 1,482 R2 0.16 0.22
Source: Authors’ analysis of National Longitudinal Land Use Survey (NLLUS) data.
Notes: The table includes all census “place”-level jurisdictions in NLLUS with populations greater than 10,000. Regional dummies
are compared with the Midwest region. Robust standard errors are in parentheses.
*** p < 0.01; ** p < 0.05; * p < 0.1.
One explanation for the regional variation in inclusionary zoning policy may be that certain state
governments preempt local governments use of such tools, as we noted above. Eleven states, including
Arizona, Colorado, Florida, Idaho, Indiana, Tennessee, Texas, Virginia, and Wisconsin, prevent local
governments from implementing such policies.14
Inclusionary Zoning Is Becoming More Popular
Among the full sample of cities with NLLUS responses in 2019, 16.1 percent noted that they used
inclusionary zoning. But examining only repeat respondents—municipalities that were recorded in both
2003 and 2019—we found a significant increase in the use of inclusionary zoning, from 25 percent to 35
percent of communities (figure 2). Between 2003 and 2019, 23 municipalities in that repeat respondent
group stopped using the policy, whereas 48 municipalities adopted it. Inclusionary zoning is becoming
more popular overall.
We identified recent changes in the characteristics of communities using inclusionary zoning.
Communities that added inclusionary zoning had higher population densities than those that dropped
the policy between 2003 and 2019. In addition, those that added the policy were more likely to be in the
Midwest or the South (21 of those jurisdictions that added inclusionary zoning) than those that
abandoned the policy (12 percent of such jurisdictions were in the Midwest or the South).
The recent growth in the use of inclusionary zoning suggests forward momentum for jurisdictions
relying on private-market actors to invest in mixed-income projects to promote affordable housing. The
policy is particularly popular in more expensive communities—which makes sense, given that those are
the places where relying on private development and engaging in cross-subsidization of costs is more
feasible. Inclusionary zoning is also popular in denser communities, which are also the places where
bigger apartment buildings are most financially viable.

1 4 T H E R I S E O F M A R K E T - R E L I A N T A F F O R D A B L E H O U S I N G T O O L S
At the same time, the growing use of inclusionary zoning may not dramatically expand the
affordable housing supply. There remain many more households with incomes too low to afford market
rents than inclusionary zoning policies can supply. Consider the National Capital region, where more
than 260,000 low-cost housing units are required to meet the affordability gap (Turner et al. 2019). By
comparison, according to Census Bureau data, the District of Columbia, Maryland, and Virginia added
315,000 housing units overall between 2010 and 2019. If a 20 percent inclusionary zoning policy were in
place across those three jurisdictions over the next 10 years and all units were built in the capital region,
less than a quarter of the need for affordable units would be met.
Moreover, units supported through inclusionary zoning typically assist households living in
neighborhoods where private development is financially feasible—in other words, wealthier and
gentrifying communities—but provide little to no assistance to projects in lower-income communities,
where the need for high-quality affordable housing is also present. Chicago’s examination of its
inclusionary zoning policy, for example, found that almost all new affordable units built under the
program were in neighborhoods that were wealthier and whiter than the city as a whole (City of
Chicago Inclusionary Housing Task Force 2020).
Inclusionary zoning may be useful to encourage the provision of additional affordable units,
especially in opportunity neighborhoods, but it is limited in its ability to respond to overall housing
affordability challenges. Inclusionary zoning depends on the overall rate of private-market housing
production, which has failed to recover quickly from the Great Recession (JCHS 2020). That means it
can play only a complementary role in overall affordable housing investment strategies. As an example,
New York City’s inclusionary housing policy, introduced in 2016, had produced only 2,065 units by
2020, in a city with 3.2 million housing units (Kober 2020). Municipalities thus must promote other
policies to achieve their affordable housing production goals.
Local Zoning Incentives Remain Popular
Zoning incentives are tools through which communities allow developers to build projects more to their
liking in exchange for a public benefit. These incentives have been the most popular housing-related
land-use tools for local governments over the past 20 years. Example incentives include allowing
developers to build at a higher density than otherwise permitted by the zoning code, reducing
developer fees, fast-tracking construction permits, or reducing the number of mandated parking spots
for new housing units. Developers providing affordable housing are entitled to leverage these
incentives to alter requirements. (Other types of zoning incentives encourage the provision of public
park space, plazas, and the like, but we consider only those that support affordable housing.)
A popular zoning incentive is permitting developers to exceed density limits through density
bonuses. For example, Montgomery County, Maryland, requires 12.5 percent of all new residential units
to be affordable (an inclusionary zoning law) but permits a density bonus of 22 percent above a zone’s
base density in exchange for a building that is more than 15 percent affordable units.15 In California, the
state density bonus law provides developers the ability to construct larger buildings if they offer

T H E R I S E O F M A R K E T - R E L I A N T A F F O R D A B L E H O U S I N G T O O L S 1 5
affordable units on site.16 The use of density bonuses by land-use jurisdictions has remained steady and
might have had modest effects on increasing housing density in some communities.
For municipalities intent on reducing housing costs, zoning incentives that promote housing
affordability could encourage more housing production by easing development. In contrast with
inclusionary zoning, which mandates the creation of affordable housing as part of new residential
construction, zoning incentives are optional for developers looking to vary their development programs
from what would otherwise be allowed as of right.
Despite a changing housing policy landscape, zoning incentives remain a popular tool for local
governments to encourage increasing the housing supply. In 2019, according to NLLUS data, 49 percent
of land-use jurisdictions used some sort of zoning incentive, compared with 16 percent that used
inclusionary zoning and 17 percent that used affordable housing trust funds (figure 2).
Communities Use Many Types of Zoning Incentives
Incentives offering developers a density bonus were by far the most popular policy among jurisdictions
surveyed by NLLUS (figure 5). Thirty-six percent of jurisdictions had a density bonus policy in place in
2019. These policies typically are designed to allow developers to increase the floor area of new
construction.
Eighteen percent of jurisdictions allowed building envelope extensions that increase the permitted
size of new construction, such as through increased height limits or smaller setbacks to surrounding
buildings. A similar share allowed lowered parking minimum requirements, freeing up lot area for
housing and reducing construction costs.
Some jurisdictions waived impact fees for new housing or sped up permitting by allowing
developers to fast-track the approvals process. Less-used policies included lowering minimum unit sizes
(the requirement that individual dwellings have a minimum number of square feet) and permitting
accessory dwelling units where otherwise prohibited.

1 6 T H E R I S E O F M A R K E T - R E L I A N T A F F O R D A B L E H O U S I N G T O O L S
FIGURE 5 Popularity of Different Zoning Incentives, 2019
URBAN INSTITUTE
Source: Authors’ analysis of National Longitudinal Land Use Survey (NLLUS) data.
Notes: N = 79 respondents. The figure includes jurisdictions in NLLUS with populations greater than 10,000 that use zoning
incentives and whose representatives answered this question.
Large, Wealthy Cities and Places with High Proportions of People of Color Use
Density Bonuses at Higher Rates
As with housing trust funds and mandatory inclusionary zoning, we recorded major regional differences
in the use of these zoning incentives, based on NLLUS responses. For example, 41 percent of
jurisdictions in the Northeast used density bonuses, compared with 70 percent in the West, 23 percent
in the South, and 14 percent in the Midwest (figure 6).
Median home value within a jurisdiction correlated strongly with a community’s likelihood of using
this tool. Within the roughly one-fifth of cities and counties with the highest median home values (more
than $400,000), 69 percent used density bonuses. Among the roughly one-fifth of communities with the
lowest home values (below $100,000), this value was 8 percent. This connection may stem from the fact
that density bonuses are worth more as incentives where the resulting extra units can be sold or leased
for more money. In other words, density bonuses can be a stronger motivator for developers to produce
affordable housing when the rest of the housing available is less affordable. These findings are similar to
those we recorded for the use of inclusionary zoning.
The densest cities, too, were more likely than their peers to provide density bonuses, though that
gap was smaller than the gap between the communities with the highest and lowest median home
values. Fifty-one percent of the highest-density communities (those with at least 4,000 people per
18%
11%
10%
18%
6%
3%
36%
Lower minimum parking requirements
Impact fee waiver
Permit fast-tracking
Building envelope extensions
Lower minimum unit size
Allowing accessory dwelling units
Density bonus
Share of jurisdictions with policy in force

T H E R I S E O F M A R K E T - R E L I A N T A F F O R D A B L E H O U S I N G T O O L S 1 7
square mile) had bonus density incentives, while only 28 percent of the lowest-density communities
(those with fewer than 1,000 people per square mile) had such incentives in effect.
FIGURE 6
Distribution of Jurisdictions with Density Bonus Incentives, by Region, Home Value, and Density
URBAN INSTITUTE
Source: Authors’ analysis of National Longitudinal Land Use Survey (NLLUS) data.
Notes: N = 1,111 respondents. The figure includes all jurisdictions in NLLUS with populations greater than 10,000.
The proportion of people of color in a jurisdiction was also correlated with their likelihood of
providing incentives for increased density. More than half the communities in the quintile with the
highest share of people of color provided density bonus incentives. Meanwhile, only 25 percent of
jurisdictions with the lowest proportion of people of color offered such incentives.
Use of Zoning Incentives Has Been Stable and May Be Producing Increased
Multifamily Housing
The use of zoning incentives remained stable and popular between 2003 and 2019, based on a review of
jurisdictions with staff members who responded to NLLUS in both years. Most jurisdictions that had
them in 2003 maintained them through 2019, with a low share either adopting or abandoning them.
Thus, such incentives continue to be essential tools in the land-use toolbox for municipalities, alongside
the growing use of inclusionary zoning.
51%
39%
34%
27%
28%
69%
45%
29%
23%
8%
14%
41%
23%
70%
Density: 4,000 + people/sq. mile
Density: 3,000–4,000 people/sq. mile
Density: 2,000–3,000 people/sq. mile
Density: 1,000–2,000 people/sq. mile
Density: < 1,000 people/sq. mile
Home value: $400,000+
Home value: $300,000–400,000
Home value: $200,000–300,000
Home value: $100,000–200,000
Home value: < $100,000
Midwest
Northeast
South
West
Share of jurisdictions

1 8 T H E R I S E O F M A R K E T - R E L I A N T A F F O R D A B L E H O U S I N G T O O L S
Zoning incentives may result in the creation of more housing overall. When asked how zoned
density in their communities has changed over the past 10 to 15 years, respondents from less than a
quarter of jurisdictions agreed that the amount of land available for single-family homes and the
permitted density for such housing increased (figure 7). But around 30 percent of respondents agreed
that the permitted density for multifamily construction increased in their communities, and about 40
percent agreed that the amount of land available for multifamily housing increased over the past 10 to
15 years.
FIGURE 7
Distribution of Jurisdictions’ Answers to the Question: “In 2019, how has single family (SF) and multi-
family (MF) housing changed in the last 10-15 years?”
URBAN INSTITUTE
Source: Authors’ analysis of National Longitudinal Land Use Survey (NLLUS) data.
Notes: N = 406 respondents. MF = multifamily (apartment) homes; SF = single-family homes. The figure includes all jurisdictions in
NLLUS with populations greater than 10,000.
These findings suggest that cities and counties with land-use jurisdiction—both with and without
density bonuses—are orienting more of their land toward denser projects. Communities with a density
bonus in place were more likely to have respondents agree that they saw an increase in permitted
density (52 percent) for multifamily housing over the past 10 to 15 years compared with those without a
density bonus (28 percent). But more research is necessary to link these zoning rules with actual
changes in communities’ built forms, especially with respect to their potential influence on availability of
affordable housing units.
Zoning incentives continue to be a popular way to manage land use. When coupled with the decline
in affordable housing trust funds and the rise of inclusionary zoning, their continued use provides
further evidence of jurisdictions relying increasingly on indirect regulations of private-market actors to
9%
5%
11%
6%
48%
61%
70%
71%
42%
34%
19%
23%
0% 20% 40% 60% 80% 100%
Amount of land for MF
Density permitted for MF
Amount of land for SF
Density permitted for SF
Decreased Stayed the same Increased
Share of jurisdictions

T H E R I S E O F M A R K E T - R E L I A N T A F F O R D A B L E H O U S I N G T O O L S 1 9
increase housing supply, sometimes increasing the supply of units affordable to moderate- and low-
income families.
In the context of a nationwide housing shortage, many communities are showing signs of openness
to increased density. Wealthy, diverse cities in the Northeast and the West frequently offer density
bonuses. These communities, already denser than their peers, are likely already facing housing
constraints and high costs and may see increased density to increase housing supply. But alone, this
research cannot determine whether zoning incentives, left in large part intact over the past 20 years,
have increased the supply of affordable housing. The increased reliance on private-sector incentives
have likely had only a small influence at the margins.
Conclusion
NLLUS data show that communities have altered their affordable housing approaches to lean more
heavily on private-sector provision. Even as affordable housing trust fund use has declined, the use of
zoning incentives held steady at roughly two-thirds of jurisdictions, and the use of inclusionary zoning
ramped up dramatically, increasing from about 25 percent in 2003 to 35 percent in 2019 among repeat
respondents.
This shift in affordable housing creation policies also represents a shift in responsibility. The
reduction in direct local-government responsibility for financing affordable housing, combined with an
increased reliance on the private sector, increases burdens on vulnerable residents. Incentives and
inclusionary zoning simply do not provide the scale of new housing necessary to meet the demand of
families with low and moderate incomes. The federal government’s declining support for deeply
affordable housing means limited support for local governments that have limited resources available to
fund such units.
None of these findings suggest that inclusionary zoning and zoning incentives such as density
bonuses are without merit—indeed, both have the potential to create more affordable housing. But our
findings do show that the transfer of responsibility for affordable housing provision to the private
sector without any increase in support for direct public funding for affordable housing (at the local,
state, or federal levels) has likely exacerbated the nation’s shortage of affordable housing. Without
additional policies to create housing, zoning incentives or inclusionary zoning are unlikely to make a
dent in the housing crisis on their own.

2 0 T H E R I S E O F M A R K E T - R E L I A N T A F F O R D A B L E H O U S I N G T O O L S
Notes 1 “The Gap: A Shortage of Affordable Rental Homes,” National Low Income Housing Coalition, accessed August 2,
2021, https://reports.nlihc.org/gap/about.
2 “Household Income by Gross Rent as a Percentage of Household Income in the Past 12 Months: American Community Survey 2019 One-Year Estimates,” Census Reporter, accessed August 2, 2021, https://censusreporter.org/data/table/?table=B25074&geo_ids=01000US&primary_geo_id=01000US.
3 Oriya Cohen, “The Role of Housing Choice Vouchers in Addressing America’s Rental Housing Crisis,” Housing Matters blog, April 7, 2020, https://housingmatters.urban.org/articles/role-housing-choice-vouchers-addressing-americas-rental-housing-crisis; and Tax Policy Center, “What Is the Low-Income Housing Tax Credit and How Does It Work?” Urban-Brookings Tax Policy Center, accessed August 2, 2021, https://www.taxpolicycenter.org/briefing-book/what-low-income-housing-tax-credit-and-how-does-it-work.
4 Lydia Lo, “Who Zones? Mapping Land-Use Authority across the US,” Urban Wire (blog), Urban Institute, December 9, 2019, https://www.urban.org/urban-wire/who-zones-mapping-land-use-authority-across-us.
5 “Zoning Insights: Explore Data from the National Longitudinal Land Use Survey,” Urban Institute, accessed August 2, 2021, https://www.urban.org/policy-centers/metropolitan-housing-and-communities-policy-center/projects/zoning-insights-explore-data-national-longitudinal-land-use-survey.
6 “National Longitudinal Land Use Survey (NLLUS),” Urban Institute, accessed August 2, 2021, https://datacatalog.urban.org/dataset/national-longitudinal-land-use-survey-nllus. Some questions changed slightly between survey years. For example, in 2003, we asked, “Does your jurisdiction have a local affordable housing funding mechanism (e.g., housing trust fund)?” In 2019, we asked, “Does your jurisdiction have a dedicated affordable housing trust fund?” (Gallagher, Lo, and Pendall 2019).
7 See also Brian McCabe, “The Housing Production Trust Fund, Explained,” Greater Greater Washington, February 8, 2021, https://ggwash.org/view/80343/what-is-the-housing-production-trust-fund-anyway.
8 The three NLLUS questions we analyzed include the following: Affordable housing trust funds. “Does your jurisdiction have a dedicated affordable housing trust fund?” If yes, “How is revenue dedicated to the fund? Choose all that apply: (A) federal funds such as CDBG or HOME, (B) funding from another state or local government unit, (C) allocations of local revenue” Inclusionary zoning. “Does your jurisdiction require private-sector builders to develop affordable housing? (We define affordable housing as units guaranteed to remain affordable for at least five years to households earning less than 120 percent of area median income.)” Zoning incentives. “Does your jurisdiction provide any of the following regulatory incentives to encourage or facilitate the provision of affordable housing by private-sector builders? (We define affordable housing as units guaranteed to remain affordable for at least five years to households earning less than 120 percent of area median income.) (Answer Yes or No to all): Bonus density; Exceptions to limits on height, setback, floor area ratio, or other aspects of the building envelope; Exceptions to limits on minimum floor area in affordable units; exceptions to limits on accessory dwelling units; Exceptions to parking standards; Waivers or reductions of development impact fees or service charges; Fast-track or streamlined permit processing”
9 “Is Inclusionary Housing Legal?” Inclusionary Housing, accessed August 2, 2021, https://inclusionaryhousing.org/inclusionary-housing-explained/what-are-the-downsides/is-it-legal/; and “State Preemption of Local Equitable Housing Policies,” Local Solutions Support Center, accessed August 2, 2021, https://www.supportdemocracy.org/equitablehousing/.
10 “City Housing Trust Funds,” Housing Trust Fund Project, accessed August 2, 2021, https://housingtrustfundproject.org/housing-trust-funds/city-housing-trust-funds/.
11 Aaron Shroyer and Yonah Freemark, “Four Local Housing Policy Implications from the 2020 Elections,” Urban Wire (blog), Urban Institute, December 3, 2020, https://www.urban.org/urban-wire/four-local-housing-policy-implications-2020-elections.
12 Repeat respondent jurisdictions’ responses were left unweighted, and they consequently may not represent jurisdictions across the United States.

T H E R I S E O F M A R K E T - R E L I A N T A F F O R D A B L E H O U S I N G T O O L S 2 1
13 Megan Randall, “Census of Governments Illustrates Declining Aid to Localities, Other Trends in State and Local
Finance,” TaxVox (blog), Urban-Brookings Tax Policy Center, April 21, 2020, https://www.taxpolicycenter.org/taxvox/census-governments-illustrates-declining-aid-localities-other-trends-state-and-local-finance.
14 Richard Schragger, “State Preemption of Local Laws: Preliminary Review of Substantive Areas,” Legal Effort to Address Preemption, August 9, 2017, https://www.abetterbalance.org/resources/state-preemption-of-local-laws-preliminary-review-of-substantive-areas/.
15 “Density Bonus,” Montgomery County Planning, December 16, 2016, https://montgomeryplanning.org/glossary_term/density-bonus/.
16 Doug Champion, Amy Forbes, Ben Saltsman, Lauren Traina, and Matthew Saria, “California’s AB 2345 Expands and Enhances Density Bonus Law Development Incentives,” Gibson Dunn, January 25, 2021, https://www.gibsondunn.com/californias-ab-2345-expands-and-enhances-density-bonus-law-development-incentives/. Some California respondents to NLLUS noted they did not offer zoning bonuses, which is in conflict with state law. It is unclear whether this results from inadequate knowledge of staff who respond (Lewis and Marantz 2019) or municipalities skirting statewide requirements.
References Anaker, Katrin B. 2020. “Inclusionary Zoning and Inclusionary Housing in the United States: Measuring Inputs and
Outcomes.” In Research Handbook on Community Development, edited by Rhonda Phillips, Eric Trevan, and Patsy Kraeger, 189–203. Northampton, MA: Edward Elgar Publishing.
Been, Vicki, Ingrid Gould Ellen, and Katherine O’Regan. 2019. “Supply Skepticism: Housing Supply and Affordability.” Housing Policy Debate 29 (1): 25–40. https://doi.org/10.1080/10511482.2018.1476899.
Brooks, Mary E., and Michael Anderson. 2017. “State and Local Housing Trust Funds.” In Advocates’ Guide 2017: A Primer on Federal Affordable Housing and Community Development Programs, edited by the National Low Income Housing Coalition, 5-45–49. Washington, DC: National Low Income Housing Coalition.
City of Chicago Inclusionary Housing Task Force. 2020. Inclusionary Housing Task Force Staff Report September 2016. City of Chicago.
Dawkins, Casey, Jae Sik Jeon, and Gerrit-Jan Knaap. 2017. “Creating and Preserving Affordable Homeownership Opportunities: Does Inclusionary Zoning Make Sense?” Journal of Planning Education and Research 37 (4): 444–56. https://doi.org/10.1177/0739456X16659763.
Dong, Hongwei. 2021. “Exploring the Impacts of Zoning and Upzoning on Housing Development: A Quasi-experimental Analysis at the Parcel Level.” Journal of Planning Education and Research. https://doi.org/10.1177/0739456X21990728.
Einstein, Katherine Levine. 2021. “The Privileged Few: How Exclusionary Zoning Amplifies the Advantaged and Blocks New Housing—and What We Can Do about It.” Urban Affairs Review 57 (1): 252–68. https://doi.org/10.1177/1078087419884644.
Ellen, Ingrid Gould. 2020. “What Do We Know about Housing Choice Vouchers?” Regional Science and Urban Economics 80:103380. https://doi.org/10.1016/j.regsciurbeco.2018.07.003.
Freemark, Yonah. 2020. “Upzoning Chicago: Impacts of a Zoning Reform on Property Values and Housing Construction.” Urban Affairs Review 56 (3): 758–89. https://doi.org/10.1177/1078087418824672.
Freemark, Yonah, and Justin Steil. 2021. “Local Power and the Location of Subsidized Renters in Comparative Perspective: Public Support for Low- and Moderate-Income Households in the United States, France, and the United Kingdom.” Housing Studies. https://doi.org/10.1080/02673037.2021.1910628.
Freemark, Yonah, Justin Steil, and Kathleen Thelen. 2020. “Varieties of Urbanism: A Comparative View of Metropolitan Fragmentation and Inequality.” Politics and Society 48 (2): 235–74. https://doi.org/10.1177/0032329220908966.
2 2 T H E R I S E O F M A R K E T - R E L I A N T A F F O R D A B L E H O U S I N G T O O L S
Gallagher, Megan, Lydia Lo, and Rolf Pendall. 2019. “An Introduction to the National Longitudinal Land Use Survey and Data.” Washington, DC: Urban Institute.
Getsinger, Liza, Lily Posey, Graham MacDonald, Josh Leopold, and Katya Abazajian. 2017. The Housing Affordability Gap for Extremely Low-Income Renters in 2014. Washington, DC: Urban Institute.
Greene, Solomon, and Ingrid Gould Ellen. 2020. “Breaking Barriers, Boosting Supply: How the Federal Government Can Help Eliminate Exclusionary Zoning.” Washington, DC: Urban Institute.
Gyourko, Joseph, Jonathan Hartley, and Jacob Krimmel. 2019. The Local Residential Land Use Regulatory Environment across U.S. Housing Markets: Evidence from a New Wharton Index. Working Paper 26573. Cambridge, MA: National Bureau of Economic Research.
Gyourko, Joseph, Albert Saiz, and Anita Summers. 2006. “The Local Residential Land Use Regulatory Environment across U.S. Housing Markets: Evidence from a New Wharton Index.” Working paper. Philadelphia: Wharton School of the University of Pennsylvania.
Housing Trust Fund Project. 2016. Opening Doors to Homes for All: The 2016 Housing Trust Fund Survey Report. Washington, DC: Center for Community Change.
Jacobus, Rick. 2019. Inclusionary Housing: Creating and Maintaining Equitable Communities. Cambridge, MA: Lincoln Institute of Land Policy.
JCHS (Joint Center for Housing Studies of Harvard University). 2020. The State of the Nation’s Housing 2020. Cambridge, MA: JCHS.
Keep-Barnes, Jai. 2017. “Inclusionary Zoning as a Taking: A Critical Look at Its Ability to Provide Affordable Housing.” Urban Lawyer 49:67.
Kober, Eric. 2020. “De Blasio’s Mandatory Inclusionary Housing Program: What Is Wrong, and How It Can Be Made Right.” New York: Manhattan Institute.
Kontokosta, Constaine E. 2014. “Mixed-Income Housing and Neighborhood Integration: Evidence from Inclusionary Zoning Programs.” Journal of Urban Affairs 36 (4): 716–41. https://doi.org/10.1111/juaf.12068.
Lewis, Paul G., and Nicholas J. Marantz. 2019. “What Planners Know: Using Surveys about Local Land Use Regulation to Understand Housing Development.” Journal of the American Planning Association 85 (4): 445–62. https://doi.org/10.1080/01944363.2019.1643253.
Mawhorter, Sara, and Carolina Reid. 2018. Local Housing Policies across California: Presenting the Results of a New Statewide Survey. Berkeley: University of California, Berkeley, Terner Center for Housing Innovation.
Monkkonen, Paavo. 2019. “The Elephant in the Zoning Code: Single Family Zoning in the Housing Supply Discussion.” Housing Policy Debate 29 (1): 41–43. https://doi.org/10.1080/10511482.2018.1506392.
Pendall, Rolf. 2020. “Knowing What Land Use Regulations Localities Have ‘On the Books’ Can Reveal Regulatory Stringency—and Much More.” Journal of the American Planning Association 86 (2): 264–65. https://doi.org/10.1080/01944363.2020.1725237.
Pendall, Rolf, Lydia Lo, and Jake Wegmann. 2021. “Shifts toward the Extremes: Zoning Change in Major U.S. Metropolitan Areas from 2003 to 2019.” Journal of the American Planning Association. https://doi.org/10.1080/01944363.2021.1894970.
Ramakrishnan, Kriti, Mark Treskon, and Solomon Greene. 2019. “Inclusionary Zoning: What Does the Research Tell Us about the Effectiveness of Local Action?” Washington, DC: Urban Institute.
Sclar, Elliott, Bernadette Baird-Zars, Lauren Ames Fischer, and Valerie Stahl, eds. 2020. Zoning: A Guide for 21st-Century Practice. New York: Routledge.
Shroyer, Aaron. 2020. “Determining In-Lieu Fees in Inclusionary Zoning Policies: Considerations for Local Governments.” Washington, DC: Urban Institute.
Soltas, Evan. 2020. “The Price of Inclusion: Evidence from Housing Developer Behavior.” Working paper. Cambridge: Massachusetts Institute of Technology.

T H E R I S E O F M A R K E T - R E L I A N T A F F O R D A B L E H O U S I N G T O O L S 2 3
Tausanovitch, Chris, and Christopher Warshaw. 2014. “Representation in Municipal Government.” American Political Science Review 108 (3): 605–41.
Thaden, Emily, and Ruoniu Wang. 2017. Inclusionary Housing in the United States: Prevalence, Impact, and Practices. Working Paper WP17ET1. Cambridge, MA: Lincoln Institute of Land Policy.
Trounstine, Jessica. 2018. Segregation by Design: Local Politics and Inequality in American Cities. New York: Cambridge University Press.
Turner, Margery Austin, Leah Hendey, Maya Brennan, Peter A. Tatian, and Kathryn Reynolds. 2019. Meeting the Washington Region’s Future Housing Needs: A Framework for Regional Deliberations. Washington, DC: Urban Institute.
Vale, Lawrence J., and Yonah Freemark. 2019. “The Privatization of American Public Housing: Leaving the Poorest of the Poor Behind.” In The Routledge Handbook of Housing Policy and Planning, edited by Katrin B. Anacker, Mai Thi Nguyen, and David P. Varady, 189–206. New York: Routledge.
Yeganeh, Armin Jeddi, Andrew Patton McCoy, and Steve Hankey. 2019. “Green Affordable Housing: Cost-Benefit Analysis for Zoning Incentives.” Sustainability 11 (22): 1–24. https://doi.org/10.3390/su11226269.
About the Authors
Patrick Spauster is a research analyst in the Metropolitan Housing and Communities Policy Center at
the Urban Institute.
Lydia Lo is a research associate in the Metropolitan Housing and Communities Policy Center.
Yonah Freemark is a senior research associate in the Metropolitan Housing and Communities Policy
Center.
Acknowledgments This brief was funded by the Urban Institute. The views expressed are those of the authors and should
not be attributed to the Urban Institute, its trustees, or its funders. Funders do not determine research
findings or the insights and recommendations of Urban experts. Further information on the Urban
Institute’s funding principles is available at urban.org/fundingprinciples.
We thank Rolf Pendall and Christina Stacy for their comments and review of this brief.
ABOUT THE URBAN INSTITUTE The nonprofit Urban Institute is a leading research organization dedicated to developing evidence-based insights that improve people’s lives and strengthen communities. For 50 years, Urban has been the trusted source for rigorous analysis of complex social and economic issues; strategic advice to policymakers, philanthropists, and practitioners; and new, promising ideas that expand opportunities for all. Our work inspires effective decisions that advance fairness and enhance the well-being of people and places.
Copyright © November 2021. Urban Institute. Permission is granted for reproduction of this file, with attribution to the Urban Institute.
500 L’Enfant Plaza SW Washington, DC 20024
www.urban.org