the role of dairy and plant based dairy alternatives in sustainable … · 2019-03-14 · the role...
TRANSCRIPT

The role of dairy and plant based dairy alternatives in sustainable diets
SLU Future Food – a research platform for a sustainable food system
Future Food Reports 3 Elin Röös, Tara Garnett, Viktor Watz, Camilla Sjörs

The role of dairy and plant based dairy alternatives in sustainable diets
Elin Röös, Tara Garnett , Viktor Watz, Camilla Sjörs
Publication: SLU Future Food Reports 3Publisher: Swedish University of Agricultural Sciences, the research platform Future Food Publication year: 2018
Graphic form: Gunilla Leffler (cover)Photo: ombadesigns, Pixabay, CC0Print: SLU Repro, UppsalaPaper: Scandia 2000 240 g (cover), Scandia 2000 130 g (insert)
IBSN: 978-91-576-9604-5

1
Foreword
Sustainable diets that are nutritionally adequate, environmentally sound, economically viable
and socially and culturally acceptable are gaining increasing attention. The focus has long been
on the role of meat and its association with high environmental pressures, especially greenhouse
gas emissions, and its detrimental health effects at high consumption levels. Much less attention
has been paid to the role of dairy products in sustainable diets. There is currently a rise in plant-
based dairy alternatives, e.g. drinks, yogurt-like products, spreads, ice-cream etc. made of soy,
legumes, seeds, nuts or cereals. These have potentially lower negative impacts than dairy
products but different nutritional profiles, which raises concerns about their role as
replacements or complements to dairy products in sustainable diets. These concerns form the
background to this report.
As a researcher at the Swedish University of Agricultural Sciences (Elin Röös) and director of
the Food Climate Research Network (FCRN) (Tara Garnett), for some years we had spoken
about a need to investigate dairy and plant-based dairy alternatives in diets more specifically
and thoroughly. During summer 2017, we contacted the Danone company for another reason
(looking for data for a LCA on instant baby formula) and ended up in a broader discussion on
the topic of dairy and plant-based dairy alternatives. Danone had recently acquired several
leading plant-based brands (Silk, Vega, Alpro etc.) and nutritionists and environmental
managers from both the dairy and the plant-based alternatives side were asking the same
question as us researchers: What are the respective roles of dairy and plant-based dairy
alternatives in sustainable diets when health, environmental, ethical and social concerns are
taken into account? The purpose of this report is therefore to describe the state of current
research on the broad topic of sustainable diets, dairy and plant-based dairy alternatives, as a
basis for development of a research roadmap to address this research question.
This report was partly funded by Danone, while the remainder of the funding was provided by
SLU Future Food, a strategic platform aimed at stimulating research and collaboration to
develop knowledge, solutions and innovations ensuring a sustainable food system. We would
like to thank Agnes Martin, Beatrice Trotin at Danone, Stephanie De Vriese and Greet van der
Heyden at Alpro and researchers Florent Vieux and Liesbeth Temme for valuable comments on
the text. However, the authors of this report are the sole responsible for the text and
conclusions.
Uppsala, 16 July 2018 London, 16 July 2018
Elin Röös Tara Garnett

2

3
Summary Current food systems are responsible for approximately one-quarter of anthropogenic
greenhouse gas (GHG) emissions and are a leading cause of deforestation, biodiversity loss,
freshwater use and water pollution. They are also insufficiently effective at feeding people
adequately; malnutrition in all its forms (hunger, obesity and micronutrient deficiency) affects
about one-third of the world’s population. At the same time, food systems reflect and exacerbate
inequalities and abuses of power at all levels (international, national, societal, sectoral and
familial), while the treatment of farm animals reared for food and draught purposes raises
serious ethical questions.
There is mounting evidence that a shift towards more sustainable food systems and diets is
necessary and will require profound changes in how and what food we produce and how and
what we consume. This report summarises the current scientifically-grounded state of thinking
on what such a shift might comprise, with particular focus on sustainable diets. More
specifically, it considers the respective roles of dairy and plant-based dairy alternatives in
sustainable diets. Dairy products currently deliver many important nutrients to large population
groups and are highly appreciated. However, rearing ruminant animals is associated with
important negative environmental impacts such as high GHG emissions and large land
requirements. Plant-based dairy alternatives based on soy, legumes, seeds, nuts or cereals are
now on the market and there is increased interest and demand for such products in many
countries. Functionally, these could replace and complement dairy products in the human diet,
potentially reducing the environmental impact of food consumption. However, since dairy
products and plant-based dairy alternatives differ in their nutrient composition and health
impact, the nutritional aspects of such a switch need to be considered.
What is a sustainable diet and how can it be measured?
One of the most commonly cited definitions of sustainable diets comes from FAO/Biodiversity
International (2010) and reads as follows:
“Sustainable diets are those diets with low environmental impacts which contribute to food
and nutrition security and to healthy life for present and future generations. Sustainable diets
are protective and respectful of biodiversity and ecosystems, culturally acceptable, accessible,
economically fair and affordable; nutritionally adequate, safe and healthy; while optimizing
natural and human resources.”
This definition, as well as definitions from other organisations, all acknowledge the multifaceted
aspects of sustainability, including social, economic and environmental aspects. Other
definitions also raise the issue of animal welfare, feasibility of diets and the aspect of good
quality food.
4
To make progress towards sustainable diets, a way to concretise and measure the sustainability
of diets is needed. Several authors provide frameworks that describe components of sustainable
foods or diets, but only a few propose concrete indicators on how these aspects should be
evaluated and quantified and the results displayed. Most current literature on healthy and
sustainable diets commonly only includes one or a few aspects of sustainability, hence
potentially failing to capture both important synergies and goal conflicts. A systematic review of
such studies by Jones et al. (2016) shows that to date, the most commonly used metrics to
evaluate the sustainability of diets are GHG emissions and land use. This lack of
multidimensionality is understandable considering the complexity of assessing multiple impacts
of a large range of foods and the lack of data. That said, rapid progress is being made in this
field.
In order to make indicators practically tangible and to relate outcomes to sustainability targets,
there is a need to define threshold levels of e.g. health and environmental sustainability, i.e. a
level beyond which a system can be said to be unsustainable. Weighting of different
sustainability indicators is also needed if the results are to be presented as an aggregate score in
order to enable comparisons among products or diets. Thresholds and weighting methods will
inherently reflect values and norms. Different weighting strategies have been developed,
including the distance-to-target approach and panels of experts or civilians. The distance-to-
target approach assesses how far a target is from being achieved and distributes weights to
different aspects accordingly. It has become increasingly popular to relate indicator results to
global targets such as the Planetary Boundaries (Rockström et al., 2009; Steffen et al., 2015),
but much more work is needed in this area.
How do dairy products and plant-based dairy alternatives compare in terms of nutrition
and health?
Dairy milk and plant-based alternatives differ in important nutritional ways, although their
energy content is fairly similar if low-fat dairy milk is used as the basis for comparison. Plant-
based drinks are generally lower in protein (<1%) and fat (<1.5%), but have a similar amount of
carbohydrates as milk (3-5%). The exceptions are oat drinks, which contain considerably more
carbohydrates (~7%), and soy drinks, which contain protein in similar amounts to milk (3-4%),
although there are slight differences in protein digestibility and amino acid profile. As regards
micronutrients (vitamins and minerals), the similarity between dairy and plant-based
alternatives is entirely dependent on whether the latter are fortified or not.
Moving from nutrients to health outcomes, epidemiological studies on intake of dairy products
and plant-based dairy alternatives show some clear positive health effects for dairy products
(e.g. lowered risk of type 2 diabetes from low fat and fermented dairy products) and for fortified
soy-based products. There is very little or no literature on the long-term health effects of non-
soy plant-based dairy alternatives specifically, however studies on the raw material itself show
some health benefits (e.g. for oats and almonds).

5
How do dairy products and plant-based dairy alternatives compare in terms of
environmental impacts in a product-to-product comparison?
The environmental impacts of foods are commonly compared on the basis of mass using life
cycle assessment (LCA), which is a well-established quantitative, standardised method for
assessing the environmental impact of goods and services. Many LCA studies have investigated
the GHG emissions from dairy production. Surprisingly, no equivalent studies for plant-based
dairy alternatives have been published in scientific journals, but some LCA studies are reported
in the grey literature. There is also some literature on the environmental impact of the raw
materials used in several plant-based dairy alternatives, making it possible to draw some
conclusions regarding the environmental impacts of the finished products. Based on the
available literature, dairy products generally have a higher environmental footprint per unit
mass than plant-based dairy alternatives when it comes to GHG emissions, total land use (not
considering the type of land), energy use, nitrogen footprint, eutrophication and acidification
potential. Dairy milk production uses more water than soy and oat drinks, but less than almond
drink. For biodiversity impacts more research is needed, especially the need to consider the
positive impacts that grazing animals provide in some circumstances. In general, there is a need
for more systematic comparisons of dairy and plant-based dairy alternatives, as it is difficult to
draw solid conclusions when comparing results from different studies.
Comparisons of the environmental impact on the basis of nutritional content, using a nutrient
density index rather than mass as the unit of comparison, yield variable results depending on
how the index is constructed. If fortified plant-based dairy alternatives are used in the
comparison, these seem to score better in terms of combined nutritional and environmental
aspects than dairy products, but more studies are needed to confirm this. Aspects of protein
quality and digestibility were included in a study by Sonesson et al. (2018) comparing milk,
chicken, pork, bread and pea soup. Milk had the highest climate impact of all these products
when protein quality and digestibility were not considered. The difference between milk and the
other products decreased when protein quality and digestibility were included, due to the
beneficial amino acid profile and slightly higher protein digestibility of milk. However, its
impact was still considerably higher than that of the two plant-based options.
How do dairy products and plant-based dairy alternatives compare in a dietary context?
Comparing foods on a per product basis is of limited value for determining the health outcomes
or environmental impact of eating patterns, as it is the total impact of all foods in the diet that
determines overall outcomes. Numerous studies assessing the potential effects of reducing meat
and/or dairy in the diet and replacing them with plant foods show considerably lower climate
impact and land use from vegetarian or vegan diets. Only a few studies have specifically
investigated the effects of substituting dairy partially or completely in the diet, i.e. without also
considering meat. Two studies found reductions in land use and GHG emissions when dairy was
replaced with plant-based foods, with varying effects on diet quality depending on the substitute
food, while one study found little or no environmental benefit in terms of GHG emissions and
land use.

6
More research is needed on how realistic replacement of meat and of dairy affects the
nutritional and environmental outcomes for different groups of consumers in different
countries, in order to establish the role that dairy and plant-based dairy alternatives can play in
sustainable diets. Basically, two approaches, simulation and optimisation studies, can be
applied.
Simulation studies tend to replace animal products with plant-based foods by mass,
isocalorically or on the basis of protein content, in some cases based on assumptions as to what
a normal and culturally acceptable substitute might be (e.g. replacing cheese with peanut butter,
chocolate spread or jam in the Dutch diet). These studies tend to show favourable outcomes for
intake of saturated fats and fibre, but highlight risks of deficiencies of some micronutrients at
high substitution rates.
Optimisation studies use mathematical models to determine nutritionally adequate diets at
lower environmental (e.g. GHG) cost, while often seeking to keep diets as culturally ‘normal’ as
possible. In such cases, the meat content of the diet declines but use of dairy products often
remains similar to current levels, due to their high calcium content and popularity, and thus
cultural non-negotiability.
What we know and what are the most important further research needs?
Assessing the sustainability of diets is a highly complex undertaking due to the multitude of
sometimes competing concerns inherent in food production and consumption. Individual
research fields have contributed knowledge of different parts of this complex picture. For
example, the field of diet-related health research is vast and has provided overarching and
generally accepted principles of what constitutes a healthy dietary pattern. Studies on the
environmental impact of food have shown that animal-based products generally generate higher
negative impacts than plant-based products. However, these guiding principles have to be
broken down even further to apply to different dietary contexts and population subgroups, and
have to be considered alongside aspects such as diet acceptability and what can be realistically
changed. Promising initial attempts have been made to gather several aspects of sustainable
diets into indicator-based frameworks, in order to provide a way of considering a multitude of
issues and their trade-offs in different types of decision making. More work is needed in this
area to make indicators and frameworks for assessing the sustainability of diets more robust,
transparent, relevant and useful. To enable constructive discussions and sound decision making,
such frameworks have to distinguish, as clearly as possible, between scientific ‘facts’ and
normative decisions (choice of indicators, thresholds and weighting methods). Complexity will
inevitably increase with the number of issues included, which is why trade-offs between
comprehensiveness and comprehension – i.e. the completeness of the information, as opposed
to our ability to make sense of and act on that information – have to be resolved.
Research shows some clear positive health effects for dairy products and for soy-based products.
For other plant-based dairy alternatives, there is very little or no literature on their long-term
health effects, although there is evidence of positive outcomes for some of the raw materials
from which they are made. As regards the environmental impacts of dairy products and plant-

7
based alternatives, the current literature indicates that the environmental impact of dairy milk
from industrialised Western systems is higher than that of plant-based dairy alternatives within
most impact categories. However, the comparison rests on somewhat shaky grounds, as studies
on plant-based dairy alternatives have not yet been published in scientific journals and as
different studies use different methodologies. In order to draw solid conclusions, milk and the
full range of plant-based alternatives need to be compared within the same study, using the
same methodological choices and applying comprehensive sensitivity analysis.
The limited existing research on replacement of dairy products with different types of plant-
based dairy alternatives indicates that the respective benefits of these products are context-
specific. More modelling studies are needed to test a broad set of consequences of including
dairy products, a range of different plant-based alternatives or combinations of these in
different dietary contexts for different types of consumers. To make these studies as relevant as
possible, more research is needed on how people actually, rather than potentially, change their
eating patterns when aiming for a less environmentally damaging and healthier diet.
Finally, what people eat naturally affects what is produced, which in turn affects landscapes and
rural societies. Such socio-economic effects are highly challenging but vital to capture, which is
why methods that enable inclusion of socio-economic issues in sustainability assessments
urgently need to be developed.

8
Table of contents Foreword 1
Summary 3
1. Introduction 10
2. Food system sustainability 13
2.1 Food system challenges 13
2.2 Solutions to decrease environmental pressures on food systems 15
2.3 Food system solutions to improve public health 18
3. Measuring sustainability and health 20
3.1 Sustainability and sustainable development 20
3.2 Sustainability assessment tools 22
3.3 Health indicators at individual level 26
3.4 Health indicators at food and diet level 28
4. Sustainable diets 31
4.1 Definitions of sustainable diets 31
4.2 Frameworks for sustainable diets 32
4.3 Frameworks for sustainable food systems 39
4.4 Studies measuring specific aspects of sustainable diets 42
4.5 Methods for indicator weighting and diet optimisation 45
4.6 Defining rating systems and thresholds for sustainable diets 48
4.7 A ‘livestock-on-leftovers’ approach to sustainable diets 53
4.8 Dietary guidelines and sustainability 56
4.9 Norms, views and perspectives on sustainable diets 58
5. The role of dairy and plant-based dairy alternatives in sustainable diets 60
5.1 Health effects of dairy and plant-based dairy alternatives 61
5.1.1 Nutritional content 62
5.1.2 Health effects 70
5.1.3 Authorised health claims 72
5.1.4 Fortification of dairy and plant-based drinks 72
5.2 Environmental impacts of dairy and plant-based dairy alternatives 73
5.2.1 Comparison on a product-to-product basis 74
5.2.2 Comparison in a diet context 87
5.2.3 Comparison from a production system perspective 93
6. Conclusions and further research needs 95
References 98
Appendix A. Frameworks for sustainable development 109

9
Appendix B. Conceptual frameworks for food systems 115
Appendix C. More on metrics and indicators 120
Appendix D. Review of sustainable diet indicators - an update of Jones et al. 127
Appendix E. Examples of currently used indicators for sustainable diets 129
Appendix F. Sustainable dietary recommendations 136
Appendix G. Fortification 140
References to the appendices 143

10
1. Introduction
Current food systems are responsible for approximately one-quarter of anthropogenic
greenhouse gas (GHG) emissions and are a leading cause of deforestation, biodiversity loss,
freshwater use and water pollution. However, food is essential for human survival and an
important part of ‘the good life’, while also at the heart of the discourse on achieving a
sustainable society. Despite massive investments and developments in food production, current
food systems are unable to adequately feed everyone, as malnutrition in all its forms (hunger,
obesity and micronutrient deficiencies) affects about one-third of the world’s population.
Dairy products are nutrient-dense, highly appreciated and in many countries a common product
in human diets, consumed on a daily basis. Grazing animals can contribute positively to certain
environmental aspects by preserving high nature value pastures and converting non-human
edible biomass into meat and milk. However, rearing ruminant animals is also associated with
large emissions of GHG and high land and water use, as well as other negative environmental
impacts which are highly variable depending on production practices.
An increasing number of plant-based dairy alternatives based on soy, legumes, seeds, nuts or
cereals are now on the market and there is increased interest and demand for such products in
many countries. Available environmental assessments indicate that these products have fewer
negative environmental impacts, but the picture is less clear when nutritional aspects are
included, as the nutritional content of plant-based dairy products differs in terms of both macro-
and micronutrients. This also complicates comparison between dairy and plant-based
alternatives and makes the dietary context, i.e. the diet in which they are consumed, highly
important for the outcome. Furthermore, sustainability encompasses many aspects in addition
to health outcomes and environmental impacts of foods, such as social and cultural aspects, that
have not been extensively studied to date.
This report summarises current knowledge and research regarding the concept of sustainable
diets and ways to measure it. In particular, it examines the role of dairy and plant-based dairy
alternatives in sustainable and healthy diets. The aim is to provide background for a broad
audience of food sustainability stakeholders from different backgrounds and scientific fields.
Therefore, the report provides a broad overview of relevant issues when assessing the
sustainability of diets, rather than a detailed analysis of any specific aspect. Due to the breadth
and complexity of the subject and the rapid developments in this area, the report does not claim
to be exhaustive.
The main focus of the report is on sustainable diets, rather than sustainable food systems, foods,
farms or companies. However, diets are an integral part of food systems, interacting with all
other parts directly or indirectly, and thus a clear-cut division between sustainable diets, the
foods themselves and other food system components is not possible. Fig. 1.1 shows a simple
conceptual diagram of the food system, to illustrate how diets make up one (of several) ‘objects
of assessment’ when studying the aggregated sustainability of food systems.

11
Fig. 1.1. Conceptual picture of the food system. The scope of this report is ‘Diets’.
At an aggregate level, a sustainable and healthy food system includes both consumption (what
and how much that is eaten) and production (how food is produced). At a global level, these
come together, but at a national/regional/local level they are often not fully connected due to
trade. There are several different actors in food systems. On the production side are food
producers (farmers, fisheries etc.), the food industry, retailers, restaurants etc. On the
consumption side are consumers. Policy (in the centre of Fig. 1.1) needs to influence all these in
order to improve production and steer consumption. Connected to the different actors are
several ‘objects of assessment’, i.e. the sustainability of farms, companies, production systems,
food ingredients, food products or diets can be assessed. As can be seen, diets are just one entry
point from which to study food systems.
Although the focus of this report is on sustainable diets as an object of assessment, in order to
provide some context Section 2 takes a look at the impacts of food systems as a whole, some
proposed solutions and the magnitude of these. Section 3 provides a brief overview of the

12
concepts of sustainability and health in general and ways to measure progress towards these. We
then turn to the main topic of this report; sustainable diets. Section 4 reviews current
definitions, frameworks and indicators of sustainable diets. Section 5 exemplifies and attempts
to summarise research specifically on the role of dairy and plant-based dairy alternatives in
sustainable diets, looking at these from three different perspectives: on a product-by-product
basis, in a dietary context and from a production/landscape perspective. Section 6 presents key
conclusions from this review of the literature and highlights further research needs.

13
2. Food system sustainability
2.1 Food system challenges
At present, food systems1 are failing to deliver healthy diets for all and are a major driver of
negative environmental impacts.
Starting with environmental pressures, the Planetary Boundaries developed by Rockström et al.
(2009) refer to nine crucial boundaries for Earth system functioning (Fig. A1 in Appendix A). An
update of the concept by Steffen et al. (2015) concluded that four of the nine Planetary
Boundaries have now been breached: climate change, loss of biosphere integrity, land-system
change and altered biogeochemical cycles (phosphorus and nitrogen flows). Two of these,
climate change and biosphere integrity, are what the scientists call ‘core boundaries’.
Significantly altering either of these core boundaries would “drive the Earth system into a new
state". Professor Will Steffen, lead author of the study, states:
“Transgressing a boundary increases the risk that human activities could inadvertently drive
the Earth System into a much less hospitable state, damaging efforts to reduce poverty and
leading to a deterioration of human wellbeing in many parts of the world, including wealthy
countries [...]”
For public health, the most pressing challenge in high-income settings has long been non-
communicable diseases (NCDs), i.e. cardiovascular diseases, cancer, chronic respiratory
diseases and diabetes. This is reflected in the United Nations (UN) Sustainable Development
Goal (SDG) 3.4: “[...] by 2030, reduce by one third premature mortality from NCDs through
prevention and treatment”. In 2015, NCDs were responsible for 40 million deaths, representing
70% of all deaths worldwide. A large proportion of these deaths were premature; they included
over 15 million people between the ages of 30 and 70, representing 38% of NCD deaths and 27%
of all global deaths (WHO, 2017). Four lifestyle factors are considered to be the most important
contributors: tobacco smoking, alcohol use, physical inactivity and unhealthy diets. NCDs are
not just diseases of the affluent, e.g. in 2008, roughly four out of five deaths caused by NCDs
occurred in low- and middle-income countries (WHO, 2011a). Malnutrition can be divided into
‘undernutrition’ i.e. the burden of hunger and undernourishment, and ‘overnutrition’, i.e. the
burden of overweight and obesity. Many countries are now struggling with both these problems
simultaneously, while micronutrient deficiencies impose an additional burden. Micronutrient
deficiencies in relation to undernutrition have been a known challenge for some time, while the
public health community is now also forced to address the role of micronutrient deficiencies in
1The High Level Panel of Experts on Food Security and Nutrition (HLPE) has adopted the following definition (HLPE, 2014): “a food system gathers all the elements (environment, people, inputs, processes, infrastructures,institutions, etc.) and activities
that relate to the production, processing, distribution, preparation and consumption of food, and the output of these activities,
including socio-economic and environmental outcomes”. Several conceptualisations of ‘food systems’ have been presented by
different authors. For an overview, see Appendix B.

14
individuals who are supposedly ‘overnourished’. Individuals with obesity have been recorded to
have lower levels of a wide array of micronutrients, a factor which may play a role in the
development of obesity-related diseases (Via, 2012). Food systems also struggle with a range of
other social challenges, such as exploitation of farm workers, land grabbing, uneven power
structures among food system actors etc.
Gordon et al. (2017) developed a framework based around the Planetary Boundary concept to
illustrate and quantify the effect of food systems on health (including undernourishment and
overweight), the food system (including food safety, nutrition and volumes) and the biosphere
(land system change, biodiversity, climate change, biochemical flows, persistent pollutants and
water) (Fig. 2.1). By 2015, both biodiversity and biogeochemical flows exceeded Planetary
Boundaries of land system and climate change, with land system change being pushed into the
zone of uncertainty by food systems alone and with an estimated 25% of climate change being
driven by food systems.
In terms of food supply, food systems now produce enough food to feed the global population,
but struggle to provide adequate nutrition for all. In 2016, 815 million people, or one in nine,
were undernourished, while in 2014, 600 million people were obese (FAO, 2017a). Overweight
and obesity now cause more deaths than underweight (WHO, 2009). According to Forouzanfar
et al. (2015), the most important risk factors for loss of disability-adjusted life years (DALYs) are
now reported to be ‘dietary risks’, such as low fruit and vegetable intake, high intake of sodium,
low intake of whole grains and low intake of nuts and seeds.
Fig. 2.1. The food system and its impact (in dark orange) on health and the biosphere, comparing (a) 1961 and (b)
today. From Gordon et al. (2017).

15
2.2 Solutions to decrease the environmental pressures of food
systems
There are basically four overarching ways to decrease the environmental pressures of food
systems (after Bryngelsson et al., 2016):
1. Increases in productivity and efficiency, i.e. producing more food with fewer inputs of
e.g. energy, land, water and nutrients.
2. Implementation of technological solutions, e.g. manure storage that limits methane
emissions or improved management practices such as well-designed crop rotations to
minimise the use of pesticides.
3. Dietary change towards foods with lower impacts.
4. Reducing losses and waste in all steps.
Recent research shows that, without a combination of all these approaches, environmental
targets, e.g. the Paris Agreement on climate change, are unlikely to be reached (Bajzelj et al.,
2014; Bryngelsson et al., 2016; Röös et al., 2017). However, prioritisation among mitigation
options will largely be determined by stakeholders’ values and perspectives on the feasibility and
legitimacy of different approaches, and whether technological approaches should be prioritised
over behaviour change and consumption shifts, or vice versa (Garnett, 2015; see also section
4.9).
Smith et al. (2008) assessed the mitigation potential in terms of lowered GHG emissions from
agriculture through improvements in production. They concluded that the total
technical/biophysical mitigation potential is within the range of current emissions from
agriculture (5-6 Gt CO2e), but that achieving this technical potential will be highly challenging
due to economic and legal barriers. For countries where agriculture is already industrialised, the
mitigation potential achievable via further efficiency gains and implementation of new
technologies is more limited. For example, the Swedish Board of Agriculture has estimated that
emissions of GHG from Swedish agriculture could potentially be reduced by 20% by 2050
through management and technical improvements (SBA, 2012). Mitigation potential also exists
beyond agriculture and across the food system, but this potential has not been quantified.
Strategies include increased efficiency in processing and use of renewable energy. Niles et al.
(2018) provide a review of climate change mitigation options across the food system.
Hallström et al. (2015) performed a systematic review of GHG emissions and land use from
dietary change and concluded that, in areas with affluent diets, GHG emissions and land use can
be reduced by up to 50% through a change to diets containing fewer animal products.
Aleksandrowicz et al. (2016) concluded that, by adopting more sustainable dietary patterns,
reductions as high as 70-80% of GHG emissions and land use, and 50% of water use, are
possible. As regards waste reduction, Bajzelj et al. (2014) show that globally, a 50% reduction in
waste could lower GHG emissions from agriculture by 22-28% and cropland use by 14%
compared with baseline levels.

16
Bryngelsson et al. (2016) assessed combined technical advances, waste reductions and dietary
shifts2 in a study in a Swedish context (Fig. 2.2), and concluded that technical advances can play
a major role in mitigating GHG emissions. Under optimistic assumptions, they found that
emissions of methane and nitrous oxide could be reduced by 50% by 2050, although this alone
would not be sufficient to meet European Union (EU) climate targets. Large reductions (>50%)
in ruminant meat consumption were found to be essential if climate targets are to be met.
Fig. 2.2. Greenhouse gas emissions (by food type) per capita by diet and technology level. For each diet, emissions
are shown for the current technology (left), moderate technology advances (middle), and optimistic technology
advances (right). From Bryngelsson et al. (2016).
2Description of the seven scenarios in Bryngelsson et al (2016): Current diet corresponds to average consumption per capita in
Sweden in 2013. Baseline is continued development of current and recent trends of increasing meat consumption at the expense of
dairy products and carbohydrate-rich food. Less Meat is based on baseline developments, but with all meat consumption (including
fish and eggs) decreased by 50% and legumes, oil, and cereals increased. Dairy Beef is based on baseline developments, but all beef
except that from the dairy sector is replaced by poultry meat, which gives about 80% lower ruminant meat consumption than the
baseline. In the Vegetarian scenario, meat is replaced by legumes, eggs and significant quantities of cheese. Beef from culled dairy
cows is also included in the Vegetarian scenario but, in contrast to the Dairy Beef scenario, surplus dairy calves are culled at birth.
Climate Carnivore does not include any ruminant products. The total meat consumption is equal to Baseline, but ruminant meat is
replaced by poultry and dairy products are replaced mainly by soymilk, but also by vegetable oils. Finally, the Vegan scenario does
not include any animal products. Dairy products are replaced by soy products and vegetable oils. Meat, eggs and seafood are
replaced by vegetable sources of protein, mainly legumes, nuts and seeds. Bryngelsson et al. (2016) corrected diets for energy intake
and macronutrient proportions to be within recommendations. However, they took a ‘conservative approach’ to nutrient adequacy
and modelled diets to be similar to current diets, assuming unchanged preference for non-essential food items and protein and fat
where still in excess as in current diets. Their study should therefore been seen as mainly looking at improving diets from a climate
mitigation perspective, rather than a nutritional perspective.

17
A study by Röös et al. (2017) modelled different scenarios for food production and consumption
based on different perspectives of the ‘food system problem’ (Garnett, 2015). The results
indicated that production improvements, consumption changes and waste reduction must all be
part of the transition to a sustainable food system in order to sustainably meet the growing
demand for food for an increased population by 2050. Table 2.1 shows the global reduction
potential of different mitigation options in that study. Trade-offs and challenges with different
options are also highlighted and discussed by Röös et al. (2017), for example trade-offs in
animal welfare, increased risk of point pollution and use of antibiotics from livestock
intensification.
Table 2.1. Reduction (%) in global land use and greenhouse gas (GHG) emissions from agriculture under different
mitigation scenarios compared with a business-as-usual scenario. From Röös et al. (2017)
Mitigation option Reduction in land
use
Reduction in GHG
emissions
Food waste reduced by 50% 11% 9%
Yield gaps closed by 50% 15% 1%
Livestock intensification1 31% 22%
Livestock intensification1 and dietary shift to a healthy diet2 45% 46%
Dietary shift to plant-based projected diet3 64% 73%
1Livestock production globally assumed to intensify to current levels of intensive production in North-Western Europe. 2Vegetable and fruit consumption set to 123 and 119 kcal per person per day, respectively, in all world regions. Sugar content capped
at 150 kcal per person and day, and vegetable oil at 360 kcal for regions with projections that exceeded that level. Consumption of
red meat capped at 57 kcal per person per day, poultry at 161 kcal, egg at 50 kcal and dairy at 300 kcal. 3Legumes and cereals isocalorically replace all animal products.
Other environmental pressures have been less studied, but some studies indicate positive
outcomes from dietary shifts in other areas, apart from GHG emissions and land use. For
example, Westhoek et al. (2014) showed that nitrogen emissions could be cut by 40% by a 50%
reduction in consumption of meat, dairy and eggs in the European Union. For biodiversity
outcomes, land sparing has been shown to be important (Balmford et al., 2015), strengthening
the case for diets associated with low land use, but on-farm management and landscape
characteristics are also important for biodiversity conservation (Bengtsson et al., 2005).
For mitigation strategies that involve financial gains, rebound effects (i.e. money saved being
spent on other polluting activities) might offset considerable parts of the gains, and have to be
carefully managed. Such effects have been documented e.g. for waste reduction strategies
(Martinez-Sanchez et al., 2016).

18
2.3 Food system solutions to improve public health
In terms of public health, WHO (2016) outlines the following options for policies aimed at
improving health and preventing NCDs:
● “Promote and support exclusive breastfeeding for the first six months of life, continued
breastfeeding until two years old and beyond and adequate and timely complementary feeding.
● Implement WHO’s set of recommendations on the marketing of foods and non-alcoholic
beverages to children, including mechanisms for monitoring.
● Develop guidelines, recommendations or policy measures that engage different relevant
sectors, such as food producers and processors, and other relevant commercial operators, as
well as consumers, to:
● Reduce the level of salt/sodium added to food (prepared or processed).
● Increase availability, affordability and consumption of fruit and vegetables.
● Reduce saturated fatty acids in food and replace them with unsaturated fatty acids.
● Replace trans-fats with unsaturated fats.
● Reduce the content of free and added sugars in food and non-alcoholic beverages.
● Limit excess calorie intake, reduce portion size and energy density of foods.
● Develop policy measures that engage food retailers and caterers to improve the availability,
affordability and acceptability of healthier food products (plant foods, including fruit and
vegetables, and products with reduced content of salt/sodium, saturated fatty acids, trans-fatty
acids and free sugars).
● Promote the provision and availability of healthy food in all public institutions including
schools, other educational institutions and the workplace.
● As appropriate to national context, consider economic tools that are justified by evidence, and
may include taxes and subsidies, that create incentives for behaviours associated with improved
health outcomes, improve the affordability and encourage consumption of healthier food
products and discourage the consumption of less healthy options.
● Develop policy measures in cooperation with the agricultural sector to reinforce the
measures directed at food processors, retailers, caterers and public institutions, and provide
greater opportunities for utilization of healthy agricultural products and foods.
● Conduct evidence-informed public campaigns and social marketing initiatives to inform and
encourage consumers about healthy dietary practices. Campaigns should be linked to
supporting actions across the community and within specific settings for maximum benefit and
impact.
● Create health- and nutrition-promoting environments, including through nutrition education,
in schools, child care centres and other educational institutions, workplaces, clinics and
hospitals, and other public and private institutions.
● Promote nutrition labelling, according to but not limited to, international standards, in
particular the Codex Alimentarius, for all pre-packaged foods including those for which
nutrition or health claims are made.”
The WHO report “Fiscal Policies for Diet and Prevention of NCDs” (2016) reviews the available
evidence for economic tools with regard to diet. The strongest and most consistent evidence is
available for taxes on sugar-sweetened beverages, which could reduce consumption by 20-50%,
and subsidies on fruit and vegetables, which could increase consumption by 10-30%. The
evidence is mixed on the net effect of fruit and vegetable subsidies on net caloric intake and
weight, but overall diet quality improves, thus leading to improvements in health outcomes.

19
There is also growing evidence of the likely effectiveness of combinations of taxes and subsidies,
particularly as a mechanism to reduce potential substitution with unhealthy foods.
A multitude of solutions for ending hunger have been documented (e.g. FAO, 2017b). For
example, UN SDG 2 (zero hunger) concerns the need to increase investment in rural
infrastructure, technology and agricultural research and to correct and prevent trade restrictions
in world agricultural markets and maintain diversity in cultivated plants and domesticated
animals. The High Level Panel of Experts on Food Security and Nutrition (HLPE) provides a
comprehensive list of policy options for improved nutritional outcomes targeted across the
whole food system (HLPE, 2017).

20
3. Measuring sustainability and health
3.1 Sustainability and sustainable development
The Brundtland commission, formally known as the World Commission on Environment and
Development (WCED), was formed in 1984 in response to an urgent call from the UN to address
the increasing deterioration of the environment, declining availability of natural resources and
human inequality. Nine hundred days later, the report ‘Our Common Future’ was released
(WCED, 1987). The report is also known as the Brundtland report, after the WCED’s chair, Gro
Harlem Brundtland.
The report addressed the most pressing issues for humanity and outlined guiding principles for
sustainable development, defining sustainable development as “development that meets the
needs of present generations without compromising the needs of future generations”. It also
defined ‘need’ as a concept that prioritises the needs of the poor. The three pillars, or
dimensions, of sustainability or sustainable development are sometimes mentioned in
association with the Brundtland report, but the concept was in fact first mentioned at the World
Summit of the UN General Assembly in 2005. Its resolution states:
“We reaffirm that development is a central goal in itself and that sustainable development in
its economic, social and environmental aspects constitutes a key element of the overarching
framework of United Nations activities.”
A wide range of definitions and frameworks for sustainability and sustainable development have
been developed within academia and by different organisations. The vagueness of the concept
can be considered an advantage, as it has led to it being widely spread and accepted, but it can
also be considered a disadvantage, as the concept risks being watered down if interpreted too
freely. Appendix A summarises a few conceptual frameworks for sustainability and sustainable
development.
The UN SDGs, the successors of the Millennium Development Goals (MDGs), are the most
recent operationalisation of the concept of sustainability. They describe humanity's needs with
clear goals and provide indicators to evaluate progress towards these goals. The recent FAO
report “Food and Agriculture - Driving Action Across the 2030 Agenda for Sustainable
Development” illustrates how all SDGs are in some way connected to food provisioning (Fig.
3.1). That report has a clear focus on eradicating hunger in low-income settings; the coupling of
SDGs to food systems would look somewhat different in high-income settings, where the
challenges are different.

21
Fig. 3.1. How food provisioning connects to the United Nations Sustainable Development Goals (SDGs). From FAO
(2017b).
In a keynote speech at the Stockholm EAT Forum in 2016, Rockström and Sukhdev presented a
slightly different picture of how the food system connects to the SDGs (Fig. 3.2)3. According to
them, economies and societies have to be seen as embedded parts of the biosphere, rather than
constituting three pillars of similar weight. Rockström and Sukhdev also point to the synergies
of certain SDGs; for example, eradicating poverty (SDG 1) and hunger (SDG 2) requires gender
equality (SDG 5), decent jobs (SDG 8) and reduced inequality (SDG 10). Rockström and
Sukhdev do not present any specific indicators for measuring the sustainability of food systems
3http://www.stockholmresilience.org/research/research-news/2016-06-14-how-food-connects-all-the-sdgs.html

22
or diets. However, the 17 SDGs provide 169 targets and 304 indicators, some of which are
applicable to sustainable diets and food systems.
Fig. 3.2. How food connects all the United Nations Sustainable Development Goals (SDGs). Rockström and Sukhdev
(2016) presented a new way of viewing the SDGs and how they are all linked to food.

23
3.2 Sustainability assessment tools
To work towards greater sustainability, and particularly sustainable diets, ways to concretise
sustainability and ways of measuring it are needed. The concepts ‘metrics’, ‘measures’ and
‘indicators’ are used differently in different contexts and are commonly used interchangeably.
According to the Oxford English dictionary, a metric is used to define “a system or standard of
measurement”; a measure is a value of something related to a standard, e.g. a weight in
kilograms; and an indicator is related to some specific context, e.g. as defined by OECD/DAC
(2010):
“A quantitative or qualitative factor or variable that provides a simple and reliable means to
measure achievement, to reflect changes connected to an intervention, or to help assess the
performance of a development actor”.
Indicators are important tools for enabling data to be handled in a consistent, comprehensive
and understandable way. Indicators are commonly aggregated into composite indices (Fig. C2 in
Appendix C). It is important to remember that indicators are not objective measurements, but
rather context-laden socially constructed values (Mineur, 2007). When choosing indicators or
when developing new indicators and indices, a range of different criteria should be considered,
such as indicators being sensitive to change, possible to verify, objective, easy to use, policy
relevant, comparable, understandable and so on. Appendix C provides more information on
indicator selection and development, a full research field of its own. “The Handbook on
Constructing Composite Indicators” includes valuable guidelines on the development of
composite indicators (OECD and EC, 2008).
An alternative to aggregating indicators into one or only a few indices is to show results for
many indicators (commonly aggregated into ‘themes’) on a common scale, using e.g. a spider
diagram (Fig. 3.3). This is a common approach for evaluating farm-level sustainability (Schader
et al., 2014; Marchand et al., 2014; Rasmussen et al., 2017). Such tools are sometimes termed
integrated indicator-based sustainability assessment frameworks and typically include guidance
on how indicators should be normalised, weighted and aggregated and how results of the
assessment should be presented.

24
Fig. 3.3. Example of the structure
(above) and results (left) of an
integrated indicator-based
sustainability assessment framework
for farms and agribusinesses. The
tool, called SAFA, was developed by
the FAO and includes four
dimensions of sustainability: good
governance, environmental integrity,
economic resilience and social well-
being (FAO, 2014). Under these,
there are 21 high-level sustainability
themes applicable to all areas of
sustainable development. Under
these in turn, there are 58 sub-
themes that specifically target
agriculture and food. A number of
indicators for each sub-theme are
suggested. The SAFA guidelines
further specify how indicators can be
contextualised and how they should
be rated, weighted and aggregated.

25
Another commonly used tool for estimating the environmental impact of products or services is
life cycle assessment (LCA), which is a well-established quantitative and standardised method
(ISO, 2006a, 2006b) structured into four stages (Fig. 3.4). In an LCA, resources used (e.g. raw
materials, energy, land and water) and outputs created (products, by-products, emissions and
waste) are quantified for all steps in the life cycle, starting at raw material extraction and
continuing through to manufacturing, use and finally ending with disposal of the product.
Resource use and emissions are aggregated across life cycle stages and related to one unit of the
product or service under study, the so-called functional unit. Emissions of substances that cause
the same type of environmental impact are characterised according to their ability to cause the
impact in relation to a ‘base’ substance. For example, gases causing global warming are typically
aggregated based on their ability to heat the atmosphere in comparison with carbon dioxide
(CO2) over a set time period. A common method is to determine global warming potential
(GWP), which measures how much heat is trapped in the atmosphere by a certain gas over a
period of time relative to the amount of heat trapped by CO2 (Myhre et al., 2013). An LCA study
typically contains many impact categories (e.g. eutrophication, toxicity, acidification, ozone).
However, due to the interest in climate change and since emissions of GHG have the same
impacts regardless of where they take place, it has become common to limit LCA to emissions of
GHG, in which case the undertaking is called a product carbon footprint (PCF) and is defined in
its own standard (ISO 14067).
Fig. 3.4. The four phases of life cycle assessment.
To date, LCA has been limited to environmental impacts, but efforts have also been made to
develop a method for undertaking social LCA (S-LCA) as well as life cycle costing (LCC) studies
i.e. which also include social and economic perspectives. However, these are applied to a much
lesser extent.

26
LCA is inherently a measurement of environmental ‘efficiency’ as it measures emissions and
resource use per unit of produce (although impacts could also be assessed per area e.g. per
hectare). As such LCA does not in itself provide any ‘sustainability thresholds’ (see section 4.6)
as the total impact depends on the total usage of a specific product. That is, even though a
product might have a low impact per kg of product compared to other products or services
providing the same function, if the use of this product is high, the total impact will be high.
LCA can be applied to a multitude of products and used for answering a wide range of questions.
Therefore the ISO-standard (ISO, 2006a; 2006b) is limited to providing some overarching
guidelines and LCAs can be performed in many different ways. To increase comparability across
studies, the methodology has been further standardised in standards targeting specific products.
The ENVIFOOD Protocol for instance provides guidance on how to perform an LCA on food in
general (FOOD SCP RT, 2013), while the International Dairy Federation (IDF) provides
guidelines on how to calculate the carbon (IDF, 2010) and water footprint (IDF, 2017) of dairy
products more specifically.
In addition to indicators, indices, sustainability assessment frameworks and LCA there are also
other tools aimed at sustainability assessments. For an overview, see for example Gasparatos et
al. (2008).

27
3.3 Health indicators at individual level
WHO defined health as early as 1948 as: “a state of complete physical, mental and social well-
being and not merely the absence of disease or infirmity”. This definition has been criticized for
having too much ‘breath and ambition’, but it still serves as a good point of reference for what
we should strive for. More concretely, health is often estimated in terms of disease outcomes,
like such as mortality rate and morbidity prevalence. However, metrics for estimating the
‘healthfulness’ of a population or person based on self-rated health measurements also exist
(DeSalvo et al., 2005). Since the experience of health or ill-health is ultimately subjective, this
approach of rating one’s experience of health is well suited in some cases. However, this
approach also carries significant methodological problems and is perhaps less helpful when
defining and designing sustainable and healthy diets, although for evaluation purposes it could
play a role. Personal perception of health relies not only on one’s physical condition but is also
affected by many other factors, including how one perceives the healthiness of the food
consumed and the wellbeing (emotional and social) one derives from the eating experience.
Guyonnet et al. (2008) developed a questionnaire designed to measure the perceived impact
and effects of the daily diet on several psychological parameters.
Mortality, as the name implies, describes a condition whose outcome is fatal, i.e. the death rate
in a population. Morbidity, on the other hand, is the rate of disease in a population. Morbidity is
often considered a relevant indicator of health and of the same magnitude as mortality, due to
the suffering, societal and economic cost that morbidity causes. Morbidity can be measured in
two ways, as prevalence and incidence. Prevalence is the total number of people with any given
disease or condition at any given point in time, while incidence is the new number of cases
within a specific time frame (i.e. one year). Prevalence is usually reported as the fraction or
absolute number. Incidence is usually reported as an incidence rate within the population at
risk, i.e. 2800 cases per 100,000 or 0.028%, for a specific time frame, i.e. one year (Willett,
2012).
There are several different health indicators available, with some having more depth and
breadth and others being more specific. The Institute for Health Metrics and Evaluation
(IHME), which together with several other organisations publishes the Global Burden of Disease
study, uses the following indicators to evaluate health (IHME, 2013):
● Mortality
● Years of Life Lost (YLL) - years of life lost due to premature mortality
● Years Lived with Disability (YLD) - years of life lived with any short-term or long-term
health loss
● Disability-Adjusted Life Years (DALY) - the sum of years lost due to premature death
(YLL) and years lived with disability (YLD)
● Healthy Life Expectancy, or Health-Adjusted Life Expectancy (HALE) - the number of
years that a person at a given age can expect to live in good health, taking into account
mortality and disability.

28
In nutritional epidemiology, apart from mortality measurements, one common indicator is body
mass index (BMI), an individual's weight divided by the square of their height, although other
indicators also exist (Gibson, 2005). WHO has produced a comprehensive report on core health
indicators (WHO, 2018).
Indicators such as BMI, DALY and the prevalence and incidence of certain diseases (e.g. lung
cancer) are considered to be indicators with relatively high relevance in clinical applications. For
example, if smoking is shown to increase the risk of lung cancer, this outcome warrants clear
policies or recommendations. However, access to data for these kinds of indicators varies and
epidemiological research therefore often uses indicators of less relevance (similarly to midpoints
in LCA, see Appendix C3). These kinds of indicators are often markers of a potential disease or
disease progression, and are less expensive and more readily available, which makes their use
relatively common. Examples include blood level markers for cholesterol, blood glucose,
hormone levels or mechanical indicators like blood pressure. Naturally, these indicators may not
always affect the life quality of the patient and do not always lead to the diseases or outcomes
associated with the indicators.

29
3.4 Health indicators at food and diet level
When measuring the ‘healthfulness’ of individual food items, nutrient profiling, i.e.
categorisation of foods based on their nutrient content, is the main method (WHO, 2011b). A
common approach in nutrient profiling is to use nutrient adequacy/density scores. Based on the
nutrient content in foods or diets, several indices have been developed to determine the overall
quality of foods and diets (Drewnowski, 2009; Arsenault et al., 2012; Drewnowski and Fulgoni,
2014). However, ranking foods based on their nutritional quality includes both conceptual and
technical challenges and many design decisions are required, e.g. on which nutrients to include,
the basis of calculations (grams, kcal or serving size), the choice of reference daily values,
whether the nutrients should be capped at 100% of recommended daily allowance of nutrients
or not, and which algorithm to use when calculating the actual index (WHO, 2011b; Hallström et
al., 2018). In addition, whether nutrient indices are designed to be used on a specific category of
foods or across all foods is another question. Therefore, results in terms of nutrient quality of
foods or diets using nutrient profiling are highly dependent on the design of the profiling
method. Examples of established nutrient profiling methods are the Swedish Keyhole4, the
European Nutriscore5 and the Australian Five Star6.
Nutrient adequacy/density scores can also be used to measure the healthfulness of diets. Vieux
et al. (2013) used nutrient adequacy scores to rank individual diets according to their nutritional
quality. They used the mean adequacy ratio (MAR), mean excess ratio (MER) and dietary energy
density (DED) to rank diets into four different health categories. These were calculated for 20
nutrients, including protein and key vitamins and minerals, and three harmful nutrients
(saturated fat, sodium and added sugars). MAR was calculated as the sum of all mean
percentages of the daily recommended intake (DRI) for each key nutrient, with the ratio
truncated at 100 so that high intake of some nutrients would not compensate for low intake of
other nutrients. MER was calculated as the sum of intake of each detrimental nutrient divided
by the maximum recommended value, with individual values below 100 truncated to 100 to
avoid compensation from low values. DED is the total weight of the individual diet divided by
the total caloric content (considering only items typically consumed as foods). Lower DED is
expected to be beneficial to health in preventing obesity-associated diseases.
Another approach to measure the healthfulness of diets is to evaluate the quality of diets in
terms of their dietary components rather than their nutrient content, for example consumption
of fruit, vegetables, sugary drinks etc. The Healthy Eating Index (HEI) is one example (Heller et
al., 2013). This can often be combined with certain aspects of nutrient profiling, such as share of
calories derived from sugar or saturated fat. Scoring systems for dietary quality are often based
on pre-existing nutritional guidelines or recommendations, but may also be derived from
specific dietary patterns, such as the Mediterranean Diet Score (Waijers et al., 2007).
4https://www.livsmedelsverket.se/en/food-and-content/labelling/nyckelhalet 5http://www.euro.who.int/en/countries/france/news/news/2017/03/france-becomes-one-of-the-first-countries-in-region-to-recommend-colour-coded-front-of-pack-nutrition-labelling-system 6http://healthstarrating.gov.au/internet/healthstarrating/publishing.nsf/content/home

30
Hallström et al. (2018) reviewed the literature on dietary quality scores for assessing the
sustainability of food and human diets and provide an overview of methodological choices for 20
different dietary quality scores (Fig. 3.5).
Fig. 3.5. Overview of nutrient quality scores used in the literature to assess the sustainability of foods and diets.
From Hallström et al. (2018). (Note that the LIM and SAIN:LIM scores do not have ‘capping of D-Q’ and that MAR
and MER are not applicable to food items.)

31
4. Sustainable diets
4.1 Definitions of sustainable diets
One of the most commonly cited definitions of sustainable diets is the following, from the book
“Sustainable Diets and Biodiversity - Directions and Solutions for Policy, Research and Action”
(FAO and BI, 2010):
“Sustainable diets are those diets with low environmental impacts which contribute to food
and nutrition security and to healthy life for present and future generations. Sustainable diets
are protective and respectful of biodiversity and ecosystems, culturally acceptable, accessible,
economically fair and affordable; nutritionally adequate, safe and healthy; while optimizing
natural and human resources.“
This book was the result of an International Scientific Symposium “Biodiversity and Sustainable
Diets: United Against Hunger” organised jointly by the FAO and Biodiversity International (BI).
It was held at FAO headquarters in Rome in 2010, within the World Food Day/Week
programme, during the International Year of Biodiversity. The definition stated above is
sometimes referred to as the ‘FAO definition’ of sustainable diets.
Table 4.1 gives examples of other definitions of sustainable diets from different organisations
and projects. Most organisations acknowledge the multifaceted aspects of sustainability,
including social, economic and environmental aspects. In summary, all definitions explicitly
state that sustainable diets should be healthy and protective of the environment. Almost all also
include explicit statements on economic aspects, food safety and cultural acceptance. Two
definitions raise the issue of animal welfare, one includes the feasibility of diets (“is practically
feasible in everyday life”) and one the aspect of good quality food (“improve people’s experiences
of good quality food”). Only one of the definitions (sustain org) does not mention explicitly the
human health-promoting dimension of sustainable diets.

32
Table 4.1. Definitions of sustainable diets found in the literature through an iterative search on generic search
engines
Organisation/author Definition
FAO and BI (2010).
Sustainable diets and
biodiversity. Directions and
solutions for policy, research
and action.
“Sustainable diets are those diets with low environmental impacts which contribute to
food and nutrition security and to healthy life for present and future generations.
Sustainable diets are protective and respectful of biodiversity and ecosystems, culturally
acceptable, accessible, economically fair and affordable; nutritionally adequate, safe and
healthy; while optimizing natural and human resources.”
Reisch LA (2010). A definition
of “sustainable food
consumption”: Copenhagen
Business School.
“For food consumption to be sustainable it has to be safe and healthy in amount and
quality; and it has to be realized through means that are economically, socially, culturally
and environmentally sustainable – minimizing waste and pollution and not jeopardizing
the needs of others.”
Sustain (2013). The Sustain
guide to good food: How to
help make our food and
farming system fit for the
future.
“Provide social benefits, such as safe and nutritious products, and improve people’s
experiences of good quality food, for instance by growing and cooking it, which helps to
enrich our knowledge and skills, and our cultural diversity.
Contribute to thriving local economies that create good jobs and secure livelihoods –
both in the UK and, in the case of imported products, in producer countries. Enhance the
health and variety of both plants and animals (and the welfare of farmed and wild
creatures), protect natural resources such as water and soil, and help to tackle climate
change.”
The German Project
Ernährungswende, lead
author Doris Hayn. (Reisch,
2010)
Food consumption is defined to be sustainable only if it:
● is environmentally sound (water, soil, climate, biodiversity, avoidance of
unnecessary risks);
● is health promoting;
● allows for socio-cultural diversity;
● is practically feasible in everyday life.
British Sustainable
Development Commission
(Reisch, 2010)
The commission considers food and drink sustainable if it:
● is safe, healthy and nutritious, for consumers in shops, restaurants, schools, hospitals
etc.;
● can meet the needs of the less well-off people;
● provides a viable livelihood for farmers, processors and retailers, whose employees
enjoy a safe and hygienic working environment whether nationally or abroad;
● respects biophysical and environmental limits in its production and processing, while
reducing energy consumption and improving the wider environment;
● respects the highest standards of animal health and welfare, compatible with the
production of affordable food for all sectors of society;
● supports rural economies and the diversity of rural culture, in particular through an
emphasis on local products that keep food miles to a minimum.

33
4.2 Frameworks for sustainable diets
To our knowledge, there is no commonly used generic, operationalised broad framework for
assessing the sustainability of diets, as there is for assessing the sustainability of farms (Fig. 3.3;
Section 3.2). However, some reports and papers provide conceptual frameworks or indicators
for a specific context, which are exemplified in this section.
Lukas et al. (2016) provides a framework for assessing the sustainability of meals which could
also be applied to diets. The framework includes a set of environmental (carbon, material
footprints, land and water use) and health indicators (intake of energy, sodium, dietary fibre and
saturated fat), threshold levels (further discussed in section 4.6), a way to aggregate the results
into one composite index (the Nutritional Footprint) and a ranking system (‘low’, ‘medium’ and
‘high’ effect). The framework was applied by Lukas et al. (2016) to eight meals and the results
presented as the aggregated nutritional footprint (Table 4.2), and also in a diagram which shows
the impacts for each indicator (Fig. 4.1).
Table 4.2. ‘Nutritional footprint’ of meals. From Lukas et al. (2016)
Menu Nutritional footprint [(subtotal health
+ subtotal env.)/2)]
Nutritional
footprint
Ranking
Menu 1 – Spaghetti bolognese with a small salad [(2.25 + 2.25)/2] 2.25 High
Menu 2 – Classic curry sausage with chips and
mayonnaise
[(2.75 + 1.75)/2] 2.25 High
Menu 3 – Beef roll with potatoes and vegetable in red
wine sauce
[(2 + 3)/2] 2.5 High
Menu 4 – Large mixed salad with a baguette [(1.25 + 1)/2] 1.125 Low
Menu 5 – Breaded sea fish fillet with remoulade sauce,
potato and broccoli
[(2.25 + 1.25)/2] 1.75 Medium
Menu 6 – Veggie, zucchini, spinach and feta lasagne [(1.5 + 1)/2] 1.25 Low
Menu 7 – Vegan – Chili sin carne [(1.25 + 1)/2] 1.125 Low
Menu 8 – Potato pancake [(2 + 1)/2] 1.5 Low

34
Fig. 4.1. Nutritional footprint of a veggie lasagne (left) and a beef roll menu (right). From Lukas et al. (2016).
The framework of Lukas et al. (2016) could potentially be useful for communicating the joint
environmental and health impacts from different meals to e.g. consumers. However, the
usefulness of the tool in this application has not been investigated, a point which those authors
also highlight.
In their framework, the healthfulness of a meal is evaluated based on its energy, salt, fibre and
saturated fat content, which is only a limited set of all the nutrients that are relevant for
nutritionally adequate diets. Potentially, choosing these four is a valid simplification in the case
of consumer communication that provides appropriate boundary conditions for a healthy meal;
ensuring adequate energy intake while limiting salt and saturated fat and ensuring enough
dietary fibre would steer the consumer towards meals rich in whole grains, roots and vegetables.
However, inadequate protein intake could potentially be an issue and the same is true for certain
micronutrients. The appropriateness of using these four health indicators would need to be
tested on a larger set of meals and diets. An additional point that the authors highlight is that
this framework has been developed for use in a high-income setting and might need adapting to
suit another contexts. As regards environmental indicators, the framework lacks consideration
of e.g. use of pesticides and impacts on biodiversity. In addition, as the authors highlight, there
is some overlap between indicators. For example, the use of materials will show up in both the
carbon footprint and the material footprint.
The Lukas et al. (2016) study illustrates several challenges in developing frameworks for
sustainable diets, including the difficulty in choosing a limited and still appropriate set of
indicators, how to aggregate and weight these (further discussed in section 4.5) and how to
define thresholds and rating systems, i.e. what is considered high or low, green or red (see
section 4.6). Inevitably, the design of a framework for sustainable diets includes a range of
normative decisions that will influence the results. In addition, for such assessments to be useful
for different types of decision making, they need to be perceived as understandable and relevant
for involved stakeholders, which means that tools have to be tailored to different users and

35
contexts. For example, a public agency, a researcher or an industry sustainability manager can
handle greater complexity than can (most) consumers.
Heller et al. (2013) provide an interesting conceptual framework that views the damage to
human health of a particular diet as a combined effect of the damage caused by the
environmental impact and the direct effect of consuming a particular diet (Fig. 4.2). To our
knowledge, this framework has never been applied quantitatively.
Fig. 4.2. Conceptual framework for diet-level integration of environmental impact and nutritional quality
assessments. Reprinted with permission from (Heller MC, Keoleian GA, Willett WC. Toward a Life Cycle-Based, Diet-
level Framework for Food Environmental Impact and Nutritional Quality Assessment: A Critical Review.
Environmental Science & Technology. 2013 Nov 19;47(22):12632–47). Copyright 2018 American Chemical Society.
Gazan et al. (2018a) present a method for compiling food metrics related to diet sustainability
relevant for a specific context. They illustrate their methodology using France as a case study,
starting with the selection of diet sustainability dimensions and diet-related indicators, based to
a large extent on data availability (Table 4.3). Data to calculate the metrics were taken from
national and international standard nutrient composition tables and databases, surveys and
scientific literature and stored in a common database. The metrics were then applied to 212
generic French foods. Compilation of these data enables assessment of diets, including health,
cultural, economic and environmental perspectives. However, as the authors acknowledge, the
choice of indicators is largely driven by data availability. For example, for environmental
indicators, water use is missing.
36
Table 4.3. Sustainability dimensions, indicators and metrics used in Gazan et al. (2018)
Sustainability dimension
Diet-related indicator
Food metrics
Nutritional adequacy (sub-domain of the health dimension)
Diet quality ● Energy and nutrient contents ● Content of other substances (e.g. phytate) ● Bio-conversion factors (protein digestibility factor, pro-
vitamin A carotenoid conversion factors) ● Proportion of ingredients of animal/vegetable origin
Food safety (sub-domain of the health dimension)
Toxicological exposure ● Contaminant content
Cultural acceptability Dietary pattern ● Distribution of dietary intakes in the population ● Portion sizes
Economic affordability Diet cost ● Prices
Environmental friendliness Diet-related environmental impact
● Greenhouse gas emission ● Water eutrophication ● Air acidification
One of the more comprehensive compilations of issues related to sustainable diets is that by
Garnett (2014), in which a sustainable diet is described by five core components: 1) society and
ethics, 2) economy and food supply, 3) environment, 4) nutrition and 5) other food-related
health (Fig. 4.3). Garnett (2014) describes how different food groups relate to the issues listed
and discusses this in relation to the value-laden social context of sustainable diets, but does not
provide any concrete metrics to quantitatively assess different diets.

37
Fig. 4.3. Issues to consider when defining a sustainable diet. From Garnett (2014).
Building on the work by FAO and BI, Johnston et al. (2014) present key components,
determinants, factors and processes of sustainable diets (Fig. 4.4). They also highlight the need
to develop indicators for measuring the different aspects and discuss the difficulty with this,
especially in low-income settings due to lack of data and other constraints.

38
Fig. 4.4. Components, determinants, factors and processes of a sustainable diet. From Johnston et al. (2014).
Donini et al. (2016) present what they call a ‘consensus proposal’ of nutrition and health
indicators. These were developed within an informal international working group consisting of
organisations from mainly Mediterranean countries that worked for four years to identify and
choose relevant indicators. The starting point was the so-called traditional Mediterranean diet.
Thirteen indicators in five areas were identified:
● Biochemical characteristics of food (Vegetable/animal protein consumption ratios; Average
dietary energy adequacy; Dietary Energy Density Score; Nutrient density of diet)
● Food Quality (Fruit and vegetable consumption/intake; Dietary Diversity Score)
● Environment (Food biodiversity composition and consumption; Rate of local/regional foods and
seasonality; Rate of eco-friendly food production and/or consumption)
● Lifestyle (Physical activity/physical inactivity prevalence; Adherence to the Mediterranean dietary
pattern)
● Clinical Aspects (Diet-related morbidity/mortality statistics; Nutritional anthropometry).
For each of these, Donini et al. (2016) provide a definition, methodology, background, data
sources, limitations of the indicator and references. For environmental indicators, these do not
describe the actual performance in terms of contributing to different impact categories such as

39
climate impact, water use, eutrophication etc. Instead, potential drivers of such impacts are
used, based on the assumption that local/regional foods and organic foods provide
environmental advantages. While this is true for some aspects, e.g. production of organic foods
is associated with considerably lower use of pesticides than conventional production, it is not
certain that local foods provide environmental benefits, as that depends on how production is
carried out rather than where it is located. None of the environmental indicators suggested by
Donini et al. (2016) would capture the greater environmental impacts generally caused by diets
high in animal products.
Another approach to evaluate the sustainability of diets is through coupled agriculture and
health modelling, in which economic models are used to predict food consumption and their
influence on production and the resulting environmental impacts. For example, Springmann et
al. (2017) used such an approach including a global risk-assessment framework with five disease
states and six dietary and weight-related risk factors to predict health outcomes from dietary
changes induced by placing a tax globally on food in relation to the food’s climate impact.
Downs et al. (2017) present a framework for policy analysis for sustainable diets. It contains a
comprehensive set of issues (compiled from among others Garnett (2014)) related to sustainable
diets structured into five domains (1) nutrition and health; (2) agriculture and food security; (3)
environment and ecosystems; (4) markets, trade and value chains for economic growth; and (5)
sociocultural and political factors. Downs et al. (2017) use the framework to examine three
Nepalese food-related policies by evaluating whether and to what extent these policies address
the different sustainability issues in the framework.

40
4.3 Frameworks for sustainable food systems
Although the focus of the present report is on sustainable diets, below we present some recent
examples of multicriteria frameworks evaluating sustainable food systems, as some metrics and
approaches included in these might also be applicable to diets.
Gustafson et al. (2016) propose a framework based on the concept of ‘sustainable nutrition
security’ (SNS) and consisting of seven different metrics (Fig. 4.5). Within each metric, there are
several indicators that are combined into a single score for each metric. The results can then be
visualised using a spider diagram and serve as a foundation for comparing SNS between
different countries.
. Fig. 4.5. Schematic diagram of the framework presented by Gustafson et al. (2016), incorporating seven metrics for
sustainable food systems.
Chaudhary et al. (2018) applied the SNS framework with some modifications to three alternative
dietary alternatives (healthy global diets, lacto-ovo vegetarian and vegan) in 156 countries, using
the framework to assess differences in food system sustainability depending on different diets.

41
For the Food Nutrient Adequacy metric, two additional indicators were used, the Nutrient
Balance Score (NBS), i.e. the daily average intake amounts of 25 essential (qualifying) nutrients
compared with their Reference Daily Intake values, and the Disqualifying Nutrient Score (DNS),
i.e. the total daily intake of four nutrients to limit (sugar, cholesterol, saturated fat and total fat)
with their Maximal Reference Values. These two replaced the Nutrient Density Score used in
Gustafson et al. (2016). Hence, stronger weight was given to the nutrients to limit, which
decreased the positive bias toward high-income countries. To the Ecosystem Stability metric was
added the Biodiversity Footprint, which uses the methodology in Chaudhary and Kastner (2016)
to account for land use biodiversity impacts associated with international trade.
For comparison between diets, Chaudhary et al. (2018) show results explicitly for the NBS, the
DNS, the PAN (Population Share with Adequate Nutrients) and the carbon and water footprints
for different regions and countries. To give an example, results for Europe and Central Asia are
shown in Table 4.4.
Table 4.4. Impact from different diets on five sustainability indicators for two world regions. From Chaudhary et al.
(2018)
Region Scenario Nutrient Balance Score, NBS1
Disqualifying Nutrient Score, DNS1
Population Share with Adequate Nutrients, PAN1
Carbon footprint (kg CO2e per capita)
Water footprint (L per capita)
Europe and Central Asia
Reference 80 10 82 3.04 303
Healthy diet2 +1 +3 -4 -0.89 -68
Lacto-ovo vegetarian3 0 +10 -5 -1.48 -79
Vegan4 -4 +50 -12 -2.01 -85
Sub-Saharan Africa
Reference 71 38 68 1.48 141
Healthy diet +3 -1 +9 +0.24 +35
Lacto-ovo vegetarian +1 +3 +5 -0.25 +33
Vegan 0 +13 +3 -0.37 +34
1Scaled from 0 to 100, a NBS or DNS value of 100 means perfectly nutritious diet. A PAN score of 100 implies that 100% of the
region’s population is meeting daily nutritional requirements. 2The scenario assumes that people consume just enough calories to maintain a healthy body weight and that food intake complies
with dietary guidelines on healthy eating. The four constraints included for constructing a diet (per day) were: less than 50 g of sugar
and 43 g of red meat, a minimum of five portions (400 g) of fruit and vegetables and 2200-2300 kcal of total energy intake
(depending on the age and sex composition of the population) 3The five constraints applied in this diet scenario (per day) were: less than 50 g of sugar, no red meat, poultry or fish, 2300 kcal of
total energy intake, at least six portions of fruit and vegetables (6 × 80 g), and at least one serving (80g) of legumes/pulses. There
was no constraint or allowable level defined for eggs/dairy intake in this scenario and it was treated in the same way as other food
items such as wheat or rice. 4The constraints in the vegan diet scenario were the same as in the vegetarian diet scenario, except a minimum of seven portions of
fruit and vegetables per day (7×80g) instead of six and also no eggs or dairy.

42
The Barilla Center for Food and Nutrition (BCFN) provides another example of a method for
assessing food system sustainability and for ranking countries, namely the sustainability index
(FSI) (BCFN, 2017). The index includes three pillars; 1) food loss and waste, 2) sustainable
agriculture and 3) nutritional challenges, and is a qualitative and quantitative benchmarking
model that permits country-to-country comparisons. The index consists of 35 indicators and
over 55 sub-indicators. The results for a large number of countries and description of the
methodologies are available on a website7. BCFN provides free and full access to all data and
models, which makes it possible for anyone to use the data and results.
These two very comprehensive tools provide interesting information on an aggregated national
level about food system sustainability. However, comprehensiveness inevitably brings
complexity, making it difficult to grasp the practical relevance of a higher or lower score when so
many factors are taken into consideration. A more detailed analysis of the results and how they
are derived is needed to enable wise decisions based on these tools. The aggregation level may
hide country specific trade-offs such as the importance of grazing animals for biodiversity in
some regions. Consideration of nutrient status on aggregated level hides nutritional challenges
for different groups such as children, women and the elderly. However, these frameworks and
their indicators could be valuable with some modification for studying specific issues in specific
contexts. Depending on the research question, the stakeholders involved and the budget of the
project, a subset of relevant indicators from these frameworks can then be selected.
For more information on initiatives for measuring the sustainability of food systems, Prosperi et
al. (2015) provide a good overview. Furthermore, Heller and Keoleian (2003) suggest a set of
indicators associated with different stages in the food supply chain.
7http://foodsustainability.eiu.com/heat-map/

43
4.4 Studies measuring specific aspects of sustainable diets
The number of studies looking at a limited set of aspects related to the sustainability of diets has
increased substantially during the past decade. Auestad and Fugoni (2015) provide a review of
papers on sustainable diets across academic disciplines (agriculture, nutrition and health,
animal science, environmental sciences, social sciences, economics and policy) published up to
April 2014. Only studies that examined impacts of dietary patterns on at least one indicator of
environmental sustainability were included. The most recent systematic review on sustainable
diets is that by Jones et al. (2016), where lack of metrics and shared approaches in the
assessment of sustainable diets served as the rationale for the study. Jones et al. (2016)
identified 30 ‘components’ of sustainable diets (Table 4.5) from 113 studies in total. They
applied a systematic search method covering 30 databases in the fields of nutrition, public
health, agriculture, ecology, economics, social science, public policy and environmental and
climate change. They also examined references of identified articles, prominent policy reports,
previous literature reviews and archives of selected indexed journals.
To complement the study by Jones et al. (2016) with later research findings, when preparing
this report we conducted an additional search for 2016 and 2017 in 27 databases (through
Pubmed/Medline), using the same search phrases and exclusion criteria as applied by Jones et
al. (2016). Our additional results can be seen together with the results from Jones et al. (2016)
in Table 4.5 (the full list of references and the exclusion criteria used by Jones et al. (2016) are
provided in Appendix D). In addition to the components in Table 4.5, we identified additional
components that were not identified in the review by Jones et al. (2016). These were:
● Material footprint
● Dietary diversity score
● Physical inactivity/activity prevalence
● Adherence to the Mediterranean dietary pattern/Mediterranean diet index
● Nutritional anthropometry
● Resilience
● Socio-cultural wellbeing
● Food safety
● Food affordability and availability
● Employment
● Metabolic food waste
● Metabolic energy density
● Nutrient-scaled carbon footprint.
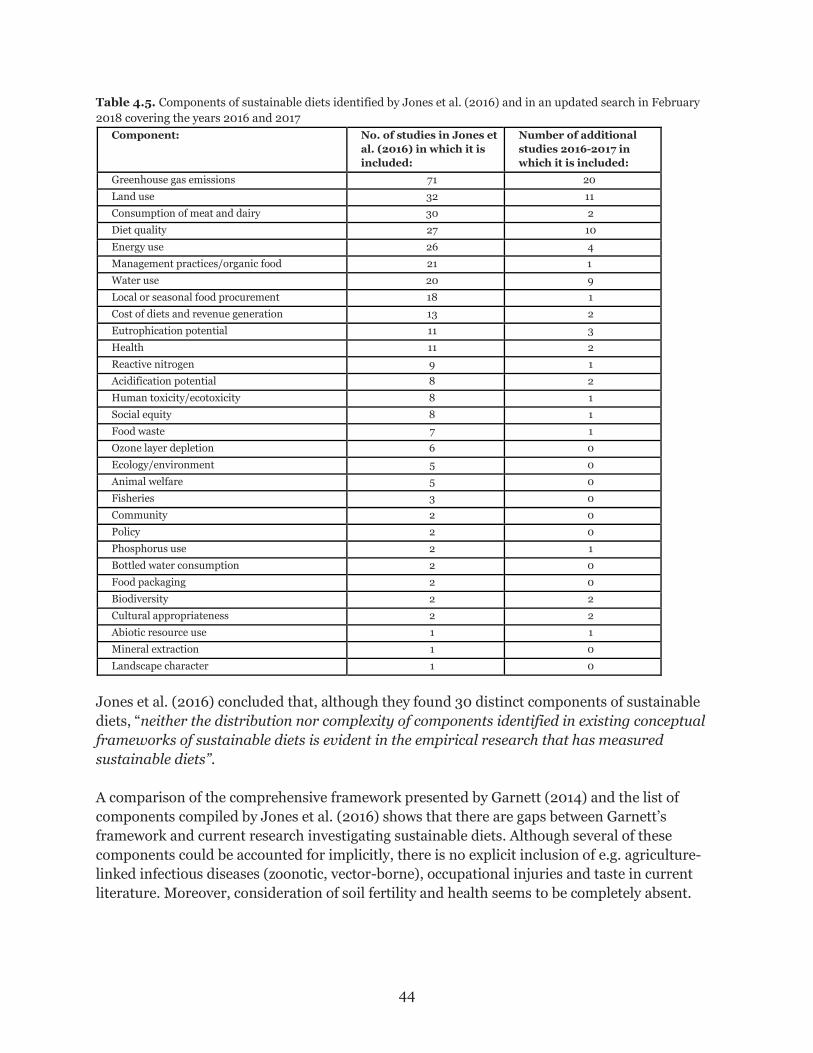
44
Table 4.5. Components of sustainable diets identified by Jones et al. (2016) and in an updated search in February
2018 covering the years 2016 and 2017
Component: No. of studies in Jones et
al. (2016) in which it is
included:
Number of additional
studies 2016-2017 in
which it is included:
Greenhouse gas emissions 71 20
Land use 32 11
Consumption of meat and dairy 30 2
Diet quality 27 10
Energy use 26 4
Management practices/organic food 21 1
Water use 20 9
Local or seasonal food procurement 18 1
Cost of diets and revenue generation 13 2
Eutrophication potential 11 3
Health 11 2
Reactive nitrogen 9 1
Acidification potential 8 2
Human toxicity/ecotoxicity 8 1
Social equity 8 1
Food waste 7 1
Ozone layer depletion 6 0
Ecology/environment 5 0
Animal welfare 5 0
Fisheries 3 0
Community 2 0
Policy 2 0
Phosphorus use 2 1
Bottled water consumption 2 0
Food packaging 2 0
Biodiversity 2 2
Cultural appropriateness 2 2
Abiotic resource use 1 1
Mineral extraction 1 0
Landscape character 1 0
Jones et al. (2016) concluded that, although they found 30 distinct components of sustainable
diets, “neither the distribution nor complexity of components identified in existing conceptual
frameworks of sustainable diets is evident in the empirical research that has measured
sustainable diets”.
A comparison of the comprehensive framework presented by Garnett (2014) and the list of
components compiled by Jones et al. (2016) shows that there are gaps between Garnett’s
framework and current research investigating sustainable diets. Although several of these
components could be accounted for implicitly, there is no explicit inclusion of e.g. agriculture-
linked infectious diseases (zoonotic, vector-borne), occupational injuries and taste in current
literature. Moreover, consideration of soil fertility and health seems to be completely absent.

45
A limitation with the Jones et al. (2016) review is that the ‘components’ presented include
indicators used to assess diets, such as carbon footprint and water use, and other characteristics
of potentially more sustainable diets that were investigated in the studies reviewed, but not
always measured, e.g. management practices/organic food and local and seasonal food.
‘Consumption of meat and dairy’ was a component found in 30 of the studies reviewed, but it
did not appear to have been actually used as an indicator in any of the studies. Instead, studies
were considered to include this component if e.g. they compared diets with different amounts of
meat. However, ‘amount of animal protein’ could be an interesting, albeit coarse, indicator to
use for sustainable diets, as it drives several other environmental aspects and is one important
factor for nutrition. For a more detailed description of some common indicators found in the
Jones et al. (2016) review, see Appendix E. In addition, a recent literature review by van Dooren
et al. (2018) (which included the Jones et al. review) intended “to identify a set of crucial
indicators to assess the most pressing environmental impacts of diets” provides a good
overview of potential indicators for diet sustainability. They conclude that emissions of GHG
and land use address most of the environmental impact of diets well, but that these indicators
should be supplemented with indicators addressing nitrogen and phosphorous efficiency.
In summary, most current literature on healthy and sustainable diets commonly only includes
one or a few issues when assessing the sustainability of diets, hence potentially failing to capture
both important synergies and goal conflicts. This is understandable considering the complexity
of assessing impacts from a large range of foods for many issues. Lack of data is also a major
limitation. However, several studies indicate that in general, GHG emissions and land use are
reasonable proxies for some other, but not necessarily all, environmental pressures (see e.g.
Röös et al., 2013; van Dooren et al., 2018).

46
4.5 Methods for indicator weighting and diet optimisation
Inherently, multi-dimensional assessments of foods and diets give a multitude of results for
different indicators. These results can be presented separately, enabling e.g. the study of trade-
offs and the identification of especially problematic areas. Indicators can also be aggregated to
one or a few indices (section 3.2). In the latter case, the question arises of how indicator results
can be weighted. As assessments of diets often show trade-offs, one might want to optimise the
diet to reach the most optimal result in term of several indicators. This section provides some
information on the issues of weighting and diet optimisation.
Computerised dietary programming (CDP) is one way to optimise diets with regard to several
indicators and has been used to create new, more sustainable dietary recommendations and
guidelines (e.g. Gazan et al., 2018b). In CDP, mathematical optimisation of diets is performed
using linear or quadratic programming. Software programs handle data on several different
variables, such as macro- and micronutrients, GHG emissions and land use, and optimise diets
based on minimising e.g. GHG emissions while meeting nutrient recommendations or keeping
diets as similar as possible to a reference diet (commonly the current diet) while GHG emissions
are reduced. In the EU project SUSDIET (ended in 2017), CDP (a tool developed by MS
Nutrition in France) was used to develop nutritionally adequate diets with low GHG emissions
that deviate as little as possible from current dietary patterns achieved within the EU. Some
results from this project were recently published in a study by Vieux et al. (2018). In that study,
nutritionally adequate diets for each gender were developed using optimisation techniques
starting from average observed diets (gender-specific) in five European countries (France, UK,
Italy, Finland and Sweden) and applying stepwise 10% reductions in GHG emissions. Results
from that study are presented and discussed in section 5.2.2 of this report.
The WWF UK report “Eating for 2 Degrees – New and Updated Livewell Plates”8 describes
another project that used CDP (the Optimeal® program from Blond Consultants). The
Netherlands Nutrition Centre also used CDP to develop their new ‘Wheel of Five’ tool, which
gives examples of healthy dietary patterns (Brink et al., 2017). An example of an ongoing
research project using CDP is Optimat in Sweden9, which aims at optimising Swedish school
meals. The project includes a modelling study to develop food baskets optimised for low
emissions of GHG, adequate nutrient composition, good acceptability and low cost.
CDP is a powerful tool for identifying optimal dietary outcomes considering a set of constraints.
However, it can be difficult to handle a large set of constraints and setting constraints is of
course to some extent normative. All aspects included need to be documented in a quantitative
manner, which might lead to diets that deviate widely from current eating patterns and are
hence unrealistic, although this can be overcome by including criteria on e.g. how much the diet
may deviate from current diets. Interlinkages within food production (e.g. dairy milk is
accompanied by a certain amount of ruminant meat) may be difficult to consider, as these are
8https://www.wwf.org.uk/eatingfor2degrees 9http://ki.se/en/phs/community-nutrition-and-physical-activity 8http://ms-nutrition.com/
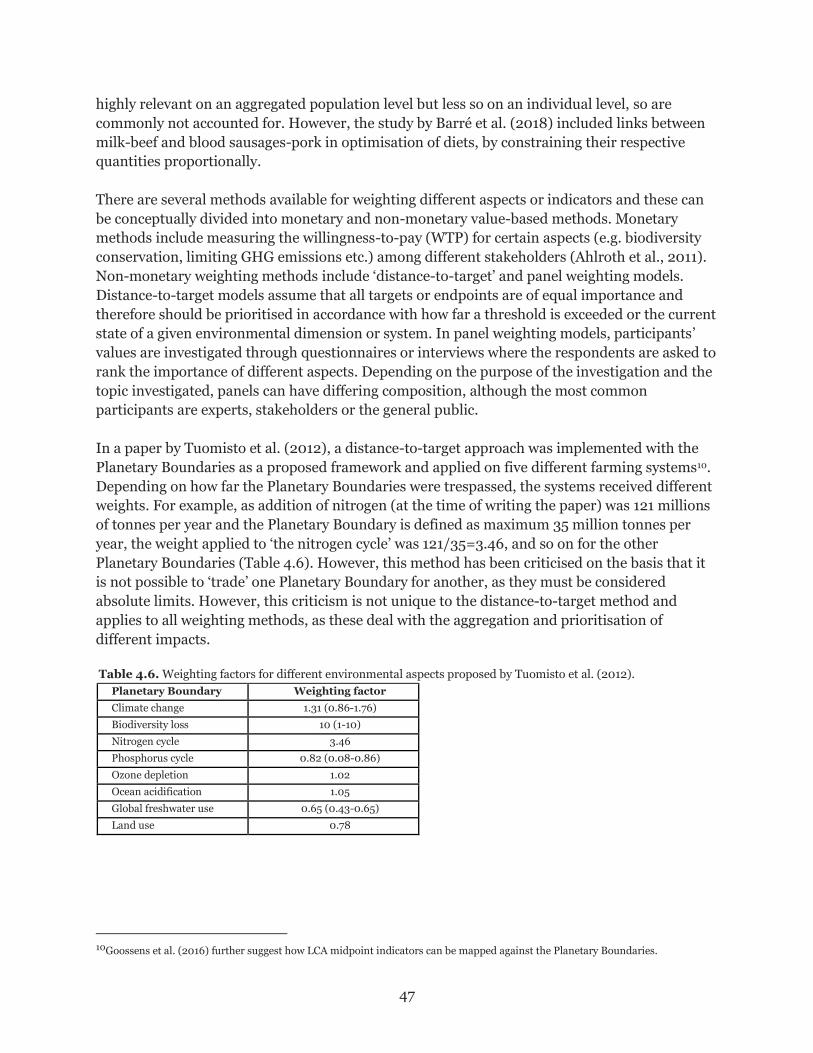
47
highly relevant on an aggregated population level but less so on an individual level, so are
commonly not accounted for. However, the study by Barré et al. (2018) included links between
milk-beef and blood sausages-pork in optimisation of diets, by constraining their respective
quantities proportionally.
There are several methods available for weighting different aspects or indicators and these can
be conceptually divided into monetary and non-monetary value-based methods. Monetary
methods include measuring the willingness-to-pay (WTP) for certain aspects (e.g. biodiversity
conservation, limiting GHG emissions etc.) among different stakeholders (Ahlroth et al., 2011).
Non-monetary weighting methods include ‘distance-to-target’ and panel weighting models.
Distance-to-target models assume that all targets or endpoints are of equal importance and
therefore should be prioritised in accordance with how far a threshold is exceeded or the current
state of a given environmental dimension or system. In panel weighting models, participants’
values are investigated through questionnaires or interviews where the respondents are asked to
rank the importance of different aspects. Depending on the purpose of the investigation and the
topic investigated, panels can have differing composition, although the most common
participants are experts, stakeholders or the general public.
In a paper by Tuomisto et al. (2012), a distance-to-target approach was implemented with the
Planetary Boundaries as a proposed framework and applied on five different farming systems10.
Depending on how far the Planetary Boundaries were trespassed, the systems received different
weights. For example, as addition of nitrogen (at the time of writing the paper) was 121 millions
of tonnes per year and the Planetary Boundary is defined as maximum 35 million tonnes per
year, the weight applied to ‘the nitrogen cycle’ was 121/35=3.46, and so on for the other
Planetary Boundaries (Table 4.6). However, this method has been criticised on the basis that it
is not possible to ‘trade’ one Planetary Boundary for another, as they must be considered
absolute limits. However, this criticism is not unique to the distance-to-target method and
applies to all weighting methods, as these deal with the aggregation and prioritisation of
different impacts.
Table 4.6. Weighting factors for different environmental aspects proposed by Tuomisto et al. (2012).
Planetary Boundary Weighting factor
Climate change 1.31 (0.86-1.76)
Biodiversity loss 10 (1-10)
Nitrogen cycle 3.46
Phosphorus cycle 0.82 (0.08-0.86)
Ozone depletion 1.02
Ocean acidification 1.05
Global freshwater use 0.65 (0.43-0.65)
Land use 0.78
10Goossens et al. (2016) further suggest how LCA midpoint indicators can be mapped against the Planetary Boundaries.

48
In the framework developed by Gustafson et al. (2016) for sustainable food systems (see section
4.3), every metric is symmetrically weighed within each of the seven dimensions, which is a
common approach.
A novel approach for creating weighting factors was presented by Ji and Hong (2016). Through
the use of Google Trends©, which is an open-access browser software for analysing search term
popularity, they managed to compile weighting factors based on search terms relating to global
warming, ozone depletion, resource depletion, photochemical oxidation, eutrophication and
acidification. Since search terms are country-specific, weighting factors for three different
countries are presented by Ji and Hong (2016).
For further reading on weighting factors from the field of LCA, see e.g. Soares et al., (2006),
Agarski et al. (2016), Pizzol et al. (2015), Ahlroth (2014) and Ahlroth et al. (2011). For an
example of a food-related study that used methods from the field of multi-criteria decision
analysis, see Linnemann et al. (2015).

49
4.6 Defining rating systems and thresholds for sustainable diets
If indicator results are to be presented on some type of scale (e.g. in a spider diagram or rated as
high-low, red-yellow-green etc.), a rating system needs to be established. This inevitably
involves making normative decisions and, depending on how the results are to be used, different
strategies make more or less sense. It is possible to differentiate between relative and absolute
sustainability ratings. Relative rating systems compare the object under study (in this case the
food item or the diet) with similar objects, e.g. whether the food item or diet performs better or
worse than average, is among the top 10% performers etc. However, even a system, product or
diet that is ‘best in class’ in a given situation may not be sustainable. To determine whether a
system, product or diet is sustainable, there is a need to establish absolute sustainability
thresholds, which is very difficult.
The Planetary Boundary concept developed by Rockström et al. (2009) and further refined in
Steffen et al. (2015) is one of the most commonly referenced concept of thresholds for
environmental impact (Appendix A). It defines quantified Planetary Boundaries for climate
change, change in biosphere integrity, stratospheric ozone depletion, ocean acidification,
biochemical flows, land-system change, freshwater use, atmospheric aerosol loading and
introduction of novel entities. These boundaries are defined on a global scale and for impacts
from all sectors. Therefore they do not give any guidance on how much of the impact in a
specific category can come from the food system or the diet of a person. However, such food
system-specific boundaries are being developed by the EAT Lancet Commission and are to be
published in the beginning of 201911. Some studies have also broken down the Planetary
Boundaries in order to apply them to diets or agricultural systems. As an example, the
boundaries used by Röös et al. (2016a) for absolute sustainability in a study of Swedish diets
based on the ‘livestock in leftovers’ approach (section 4.7) are shown in Table 4.7.
11https://foodplanethealth.org/the-report/

50
Table 4.7. Boundaries used for ‘absolute sustainability”. From Röös et al. (2016a)
Planetary Boundary Boundary used for the diet in this study
Climate change CO2 concentration of maximum
350 ppm
Since this boundary has been exceeded, production of the diet
should not give any net emissions
Biosphere integrity 10 extinctions per million
species-years
All current semi-natural grassland and arable land in Sweden
preserved (these are the most threatened eco-systems in
Sweden)
Nitrogen cycle 62 Tg of N added per year from
industrial and intentional
biological N fixation
6.5 kg N per capita added per year to produce the diet
(the boundary divided by the global population in 2050)
Phosphorus cycle Maximum of 6.2 Tg mined P
applied to agricultural soils
0.65 kg P added per capita per year to produce the diet
(the boundary divided by the global population in 2050)
Land system change Max 15% of the global land
surface should be converted to
arable
Production of the diet uses maximum 0.21 ha arable land per
person (the boundary divided by the global population in 2050)
Quite a few studies have tried to define thresholds for climate change and land use. For example,
when quantifying GHG emissions, land use and biodiversity impacts for three Swedish diets12,
Röös et al. (2015a) used a boundary for GHG emissions of 750 kg CO2e per person and year,
based on emissions pathways to meet the 2-degree temperature goal and a boundary for land
use of 0.32 ha per person per year based on agricultural land availability in Sweden. By doing so,
they were able to show the environmental impact of the diets on the same scale as the
nutritional content, which was normalised based on recommended intakes (Fig. 4.6).
12The three diets were: SNÖ - a diet corresponding to Nordic recommendations as defined by the Swedish National Food Agency
reflecting food preferences in Sweden; Riksmaten - the current average Swedish diet according to the latest food intake survey;
LCHF (Low-Carb, High-Fat) - a lifestyle diet widely used in Sweden. All diets were adjusted to the same total energy intake level,
10.1 MJ/person/day.

51
Fig. 4.6. Climate impact, agricultural land occupation and nutrient intake for three different Swedish diets (SNÖ
=recommended diet, Riksmaten = current diet, LCHF = low-carb, high-fat diet). The y-axis shows the normalised
values, where 1 corresponds to the per capita ‘sustainable level’ of climate impact and agricultural land occupation as
defined in the study. For nutrients, 1 on the y-axis corresponds to the recommended intake according to the Nordic
Nutrition Recommendations. From Röös et al. (2015a).
Another example is the WWF UK’s Livewell Plate project, which used the UK government’s
commitment to reduce territorial GHG emissions by 61% by 2030 to develop a threshold for
food consumption. It was assumed that half the reduction will be achieved through
improvements in production and the other half through dietary changes, giving a daily per
capita threshold of 4.09 kg CO2e (1.5 tonnes per year) for food in 2030. The Livewell Plate
project also established thresholds for use of cropland and grassland and several dietary and
nutritional constraints regarding macro- and micronutrients and food groups (fish, red and
processed meat, oily fish, fruit and vegetables, beverages). Interestingly, in their One Planet
Plate concept13, WWF Sweden go considerably further, setting the threshold at 11 kg CO2e per
week (590 kg CO2e per year) based on the 1.5 degree climate target and not accounting for
technological advances. Greenpeace’s newly launched food vision aims at limiting emissions
from agriculture to 4 Gt CO2e per year in 2050, corresponding to approximately 400 kg CO2e
per person and year (Greenpeace, 2018). This variation in thresholds illustrates how value-laden
definitions of thresholds are (further discussed in section 4.9).
Lukas et al. (2016) (see section 4.2) define three relative threshold levels for environmental
indicators and nutritional indicators based on nutritional recommendations and literature data
(Table 4.8).
13http://www.wwf.se/press/pressrum/pressmeddelanden/1734329-idag-lanserar-wwf-planetsakra-maltider-one-planet-plate-och-matkalkylatorn.

52
Table 4.8. Basic estimates of threshold levels for environmental indicators. From Lukas et al. (2016)
Proposal for threshold level (per capita & day)
Indicator Strong impact Medium impact Low impact
Material footprint >12 kg 8-12 kg <8 kg
Carbon footprint (CO2e) >3.6 kg 2.4-3.6 kg <2.4 kg
Water footprint >2925 litre 1950-2925 litre <1950 litre
Land use >5.625 m2 3.75-5.625 m2 <3.75 m2
Calorie intake >2500 kcal 2000-2500 kcal <2000 kcal
Sodium >10 g 6-10 g <6 g
Dietary fibre <18 g 18-24 g >24 g
Saturated fat >30 g 20-30 g <20 g
As regards social boundaries, Kate Raworth’s ‘doughnut economics’14 provides a framework for
combining the Planetary Boundaries with those of human prosperity, hence providing a ‘social
foundation’ of what is needed for human well-being and an ‘ecological ceiling’ which has to be
respected for safe Earth system functioning (Fig. 4.7). The social foundation is not limited to
diets, nutrition and health, but also includes aspects such as housing and education. It could be
an interesting exercise to try to establish a social foundation for diets specifically in terms of
‘good enough’ nutrition including nutrient intakes, variety of foods, cultural acceptance etc.
14https://www.kateraworth.com/.
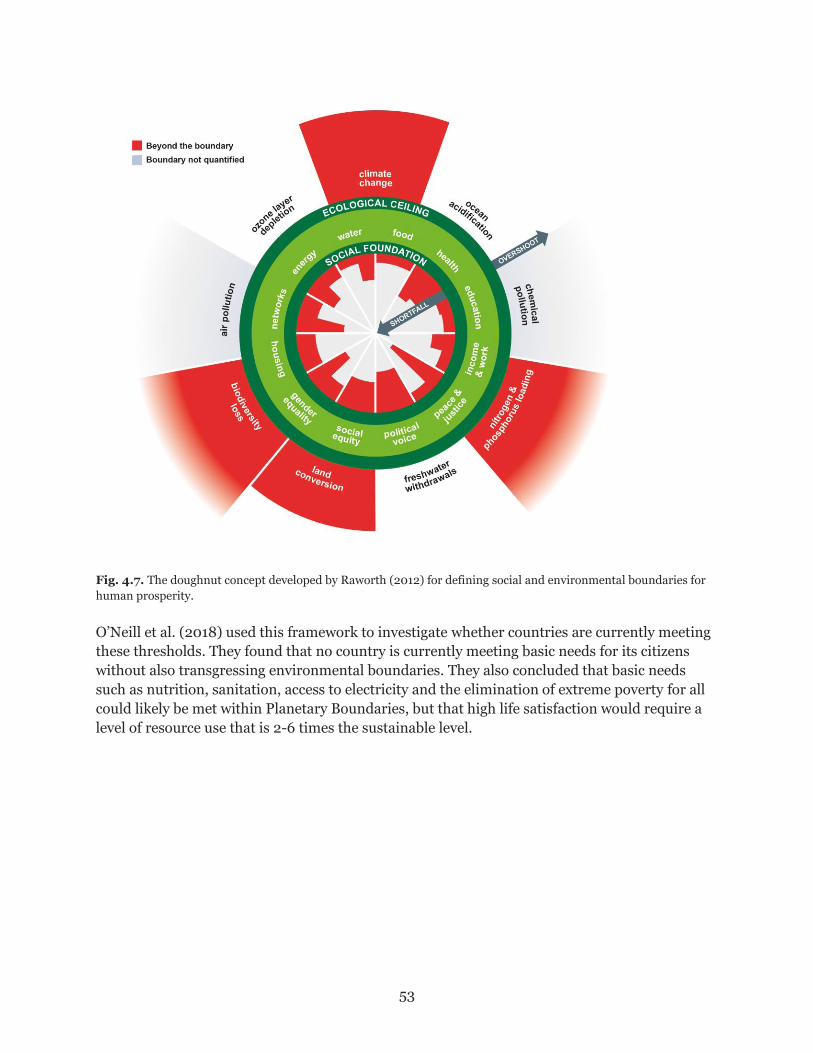
53
Fig. 4.7. The doughnut concept developed by Raworth (2012) for defining social and environmental boundaries for
human prosperity.
O’Neill et al. (2018) used this framework to investigate whether countries are currently meeting
these thresholds. They found that no country is currently meeting basic needs for its citizens
without also transgressing environmental boundaries. They also concluded that basic needs
such as nutrition, sanitation, access to electricity and the elimination of extreme poverty for all
could likely be met within Planetary Boundaries, but that high life satisfaction would require a
level of resource use that is 2-6 times the sustainable level.
54
4.7 A ‘livestock-on-leftovers’ approach to sustainable diets
When assessing the sustainability of diets, the starting point is commonly a specific, actual or
theoretical diet in some situation, e.g. the current diet in a specific country or region, the
Mediterranean diet, a potential or optimised low meat, vegetarian or vegan diet etc. Commonly,
no consideration is given to the capacity to produce this diet.
An alternative approach for designing diets is to start by considering the available land
resources that can be used to produce as much food as possible for the least negative
environmental impact and what kind of diet that would give. In such an approach, livestock
production is limited to resources that are not digestible or not wanted by humans, e.g. biomass
from land unsuited for crop production, by-products from crop production and food waste.
Several studies based on this concept, called e.g. ‘default livestock’ or ‘livestock on leftovers’,
have been published and are summarised in Table 4.9. On average, a daily per capita amount of
animal protein of approximately 21 g could be supplied to all in 2050 while limiting livestock
production to such non-food-competing feed resources (van Zanten et al., 2018). This 21 g
corresponds to e.g. approximately 100 g of raw bone-free meat, or 50 g of meat and 300 mL
milk (or some such combination). It should be noted, however, that much of the animal protein
comes from feeding pigs food waste, a practice which is currently not permitted in the EU. To
supply adequate nutrition (recommended daily protein intake is around 0.8 g/kg of body weight
adult), the omitted animal products in these diets are replaced by cereals, legumes (ensuring
requirements on protein quality are met) and vegetable oil.
The ‘livestock-on-leftovers’ approach provides a land boundary condition for livestock
production (van Zanten et al., 2018). As long as livestock eat human-edible feedstock they do
not contribute to food security, as most of the energy and proteins are lost in the metabolic
process of the animal. However, if they eat non-food biomass, they recycle nutrients back into
the food system and contribute positively. Hence, one could argue that livestock should be
limited to the number needed to consume these ‘leftover’ streams.
However, a food system based on the ‘livestock-on-leftover’ approach would look radically
different from current systems. For example, poultry production would decrease by over 90%,
while ruminant numbers would not be reduced as drastically as they are able to digest cellulose-
rich biomass, most importantly grass. Although a food system based entirely on the ‘livestock-
on-leftover’ approach is far from implementation and current trends are moving in the opposite
direction, it might be useful to include indicators for assessing sustainable diets that account for
food-feed competition, e.g. kg human-edible protein fed to livestock per kg protein in the diet.
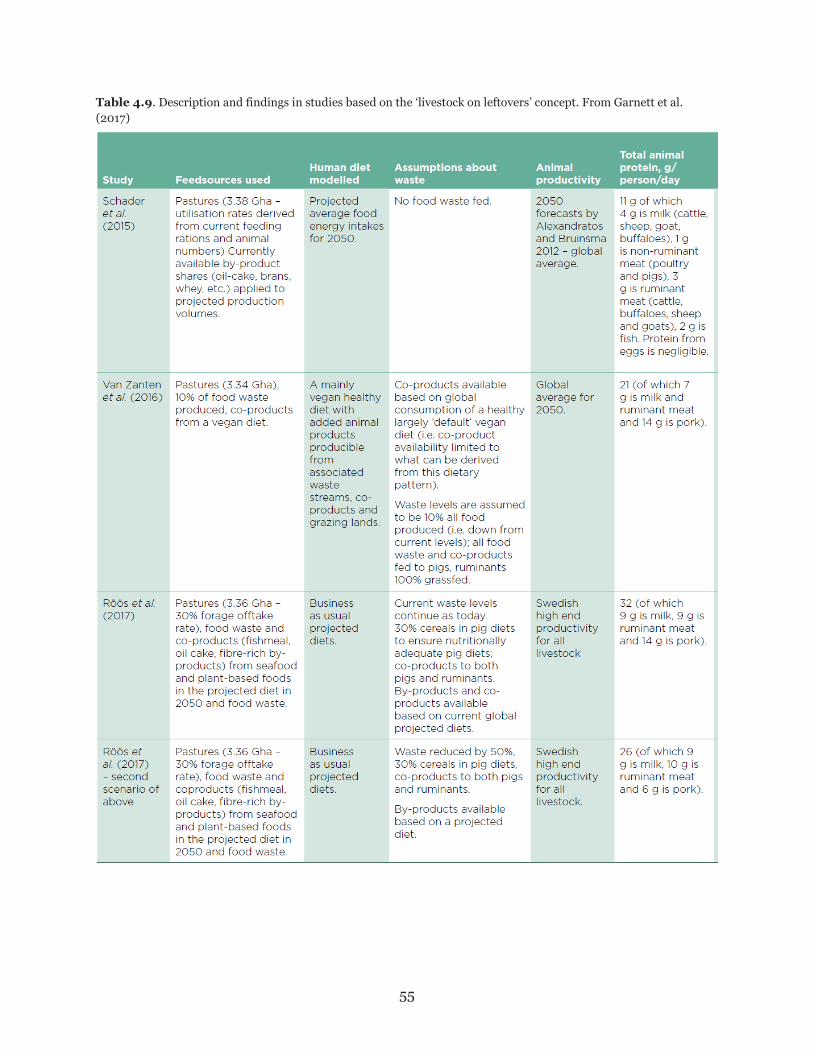
55
Table 4.9. Description and findings in studies based on the ‘livestock on leftovers’ concept. From Garnett et al.
(2017)

56
4.8 Dietary guidelines and sustainability
Dietary guidelines are important tools in guiding towards and informing about sustainable food
choices. The most common approach to dietary guidelines is Food-Based Dietary Guidelines
(FBDG), often targeted towards the healthy population as a whole. FBDG are commonly based
on outcomes in terms of nutritional research, current consumption patterns and the health and
nutritional status in a given population. The guidelines are hence tailored to suit how people are
currently eating, rather than giving recommendations on the ‘optimal’ diet. FBDG are used to
encourage healthier diets that are likely to be accepted and adopted by the majority of the
population. To date, most FBDG are based on nutritional considerations only, but some
progressive countries have incorporated environmental considerations into the guidelines.
Gonzalez-Fischer and Garnett (2016) provide a review of such dietary guidelines, identifying
three different types:
● Official guidelines. These guidelines are formal and represent the country’s ambition to promote
sustainable eating habits at population level.
● Quasi-official guidelines. These guidelines combine health and sustainability messaging and stem
from government agencies or government-funded entities.
● Non-official guidelines. These are guidelines presented by NGOs, academic bodies or
corporations and reflect the views expressed by these entities.
At the time of writing their review, Gonzalez-Fischer and Garnett (2016) found that Sweden,
Brazil, Germany and Qatar in varying ways had national sustainable dietary advice that
explicitly aims to lead consumers to make more sustainable food choices. Quasi-official
guidelines distributed in Germany, the Netherlands, Estonia, the UK, France and Sweden, and
also non-official FBDG that include aspects of sustainability, are summarised in Appendix F.
There have also been attempts at creating sustainable FBDG in the US and Australia, but due to
industry intervention they have been unsuccessful (Gonzalez-Fischer and Garnett, 2016). Since
Gonzalez-Fischer’s and Garnett’s (2016) review, Belgium has also published new
recommendations that include sustainability messages (FIHL, 2017). The Dutch guidelines were
updated in 2016 to include environmental aspects; their new ‘Wheel of Five’ includes e.g.
maximum limits for animal products (Brink et al., 2017).
Below is an excerpt from the executive summary by Gonzalez-Fischer and Garnett (2016) on the
main findings of their review:
“All the countries who do provide guidance on sustainability say broadly similar things despite
differences in emphasis and level of detail provided (Table 1). All highlight that a largely plant-based
diet has advantages for health and for the environment. Sweden is notable in additionally providing
more detailed advice on which plant based foods are to be preferred, recommending for example root
vegetables over salad greens. Most guidelines that include sustainability talk about the high
environmental impact of meat – with the exception of the Qatari guidelines – but the advice often lacks
specificity, and where recommended maximum levels are given, these are in line with recommendations
of solely health-oriented guidelines. The Brazilian guidelines are distinct in emphasising the social and
economic

57
aspects of sustainability, advising people to be wary of advertising, for example, and to avoid ultra-
processed foods that are not only bad for health but are seen to undermine traditional food cultures.
They stand in contrast to the largely environmental definition of sustainability adopted in the other
guidelines. Fish is presented as the main area where health-environment trade-offs arise, but advice is
nevertheless given to continue to consume in quantities consistent with health recommendations. Most
guidelines that include sustainability mention milk and dairy products directly or indirectly but the
nature of the advice is variable. Advice on food waste and energy efficient cooking is patchy and
represent an area with scope for easy ‘win wins.’”
Regarding the environmental impact from following FBDG, a study by Behrens et al. (2017)
assessed the environmental impact of national recommended diets (NRDs) in 37 countries.
When stratifying NRDs for high, high-middle and low-middle income countries, they found that
(on average, but with exceptions) following the NRDs from high and upper-middle income
countries would mean a reduction in environmental impact compared with the current
situation, while following the NRDs from low-middle income countries would mean an increase
in environmental impact. The reduced environmental impact in high-income countries was
driven by recommendations to decrease calories (approx. 54% of the effect) and changes in diet
composition (approx. 46% of the effect). The increased environmental impact in low-middle
income countries was associated with increased intake of animal products and increases in
caloric intake in some cases.
In a study by Ritchie et al. (2018), the recommended diets of six countries (Canada, USA,
Australia, China, Germany and India) were investigated. For India, two types of
recommendations were included, a vegetarian and a non-vegetarian recommendation. The
distinction between these was that the dietary guidelines by default recommend pulses as the
main protein source, but for non-vegetarians an option of replacing one portion of pulses with
one portion of meat, fish or eggs is presented15. The recommendations were evaluated based on
their GHG emissions, not including post-farm emissions and emissions from land use change.
The carbon footprint of the recommended diets was found to vary between 687 and 1579 kg
CO2e per capita per year (Ritchie et al., 2018). Most of the variation was due to differences in
recommendations for dairy intake. Fig. 4.8 shows the carbon footprint of the recommended
diets, together with the total per capita budgets for emissions from all sectors as defined in the
study (see section 4.6 for variation in thresholds). All recommended diets exceeded the limit for
the 1.5 degree climate target, except for India and the WHO diet. All diets stayed below the 2
degree target, but left little room for emissions from other sectors (e.g. energy, transport).
15The Indian diet consisted of 560 g of staples, 90 g of legumes, 300 g of dairy, 30 g of oils, 30 g of sugar and 400 g of fruit and vegetables.

58
Fig. 4.8. Per capita greenhouse gas (GHG) emissions from diets based on World Health Organization (WHO) and
national dietary guidelines. Dashed lines indicate the additional GHG emissions from food waste at household level.
From Ritchie et al. (2018).

59
4.9 Norms, views and perspectives on sustainable diets
As the growing body of research and advocacy on sustainable diets makes clear, there is
increasing recognition of the need for a shift towards diets that are ‘better’ than the status quo,
across various dimensions. However, notwithstanding the many frameworks and indicators
developed and under development, the multidimensional nature of sustainability makes it
difficult to agree on what sustainability actually looks like ‘on the plate’. This is partly for
practical reasons, as some aspects of sustainability are more difficult to measure than others,
but is also largely a matter of differing values and priorities.
For example, there can be very different views on how far current dietary and underpinning
production practices can and should be changed, and how far technological advances will
preclude the need for radical shifts. Many of these differences derive from disagreements on e.g.
the importance of personal responsibility versus state action, the extent to which we should
mitigate rather than adapt to the environmental problems we face, or how far certain desires
(such as the desire for meat) are a socio-cultural construct, as opposed to a biological
imperative.
Linked to this, there are different views as to what the ‘boundary conditions’ – the non
negotiables – for defining sustainable diets should be. For many environmental NGOs and
researchers, the boundary condition is that of environmental limits and the priority is to shrink
our consumption patterns to fit the ‘safe operating space’ available for humanity (Rockström et
al., 2009; Steffen et al., 2015; Appendix A). This points to a need for drastic changes in what we
eat, and in particular to reduced consumption of animal products.
For other stakeholders, the circumscribing boundary conditions are the workings of the global
economy, the inevitability of rising demand or the healthfulness of the human diet. While such
stakeholders recognise that changes in consumption patterns may be possible at the margins
and can be achieved through e.g. improved consumer awareness, fundamentally these groups
rely on technological improvements to come up with solutions, such as product reformulations
to improve the acceptability of healthier or more sustainable foods, the development of methane
inhibitors in the rumen of cattle or the use of renewable energy sources to produce fertilisers or
for processing.
These differences in perspective also manifest themselves in discussions about nutrition and
good health. For example, many environmental campaigners tend to focus more on the
problematic macronutrients (energy, fat) associated with excessive consumption than on the
micronutrients (iron, zinc, calcium) associated with insufficiency, which may skew their
attitudes to the role of meat in the diet. Others, such as nutritionists and members of the food
industry, point to the nutrient density of animal products and warn that a reduction in their
consumption could increase the risk of micronutrient deficiencies. These differing perspectives
play out in their imaginings of what an alternative ‘less meat/dairy’ scenario might look like.
From one perspective, should access to animal products be limited by (for instance) price,
regulation or changing societal norms, this could be a positive development nutritionally. The
assumption here is that less meat or dairy in the diet enables increases in consumption of

60
legumes, nuts, fruit and vegetables. An alternative position might warn of negative
consequences, however, since people will more likely switch to eating refined carbohydrates,
high in sugar and possibly salt, with damaging health consequences.
There are also different perspectives on what constitutes ‘good enough’ nutrition, based on
differing attitudes to risk and to the relative importance of human versus planetary needs. Some
may accept a diet inadequate in certain micronutrients, arguing that these can be met through
fortification strategies. They may also place more emphasis on minimum average nutritional
requirements than on higher ‘safe’ levels – the different calcium recommendations given in
different national dietary guidelines today provide a case in point. Others may take a more
cautious attitude to risk that involves ‘safe’ higher level requirements for key nutrients or argue
that human needs come before the environment. Attitudes to naturalness may also shape ideas
as to the acceptability of fortification versus the consumption of foods naturally rich in certain
nutrients.
In conclusion, ideas about sustainability are shaped by values as much as by science. People’s
values shape which metrics are chosen and prioritised, and what options people believe to be
possible or necessary.

61
5. The role of dairy and plant-based
dairy alternatives in sustainable diets
Dairy products include milk, cheese, yogurt, butter and whey protein. Milk can come from any
mammal, but dairy products used for human consumption are usually provided by (bovine)
cattle, sheep, goats, horses, camels and buffalos, with cattle milk making up 83% of global
production in 2016. Milk consumption varies greatly between regions and countries, with the
global average being 90 kg per capita and year. Western Europe and North America consume
around 250 kg per capita and year, whereas the average consumption in Africa is approximately
44 kg per capita and year (FAOSTAT, 2018).
Plant-based dairy alternatives include a wide range of products, including substitutes for milk,
cheese and cream, yogurt-type products, desserts and spreads, and are made of soy, legumes,
seeds, nuts or cereals. Some soy-based products (e.g. soy drink) have been used for a very long
time, while other products (based on legumes, seeds, nuts and cereals) appeared on the market
only in recent decades. Measured in terms of retail sales, the global dairy alternatives market
was worth an estimated $16 billion in 2016, a 320% increase compared with 2006. The global
milk market in considerably larger than the global milk alternatives market, but the gap has
been closing quickly in the past decade. In 2006, the global milk market was 14.3 times larger
than the dairy alternatives market, whereas in 2016 it was only 6.5 times larger (Wood, 2017).
In this section, we first very briefly summarise existing research on the health effects of dairy
and plant-based dairy alternatives (section 5.1). We then move on to look at the environmental
impacts of the two from different perspectives (section 5.2). Both fields are challenging due to
their complexity, as is illustrated and discussed in this section.

62
5.1 Health effect of dairy and plant-based dairy
alternatives
The ‘healthfulness’ of different foods can be evaluated in different ways, including:
● Evaluation of the nutrient content (e.g. energy, protein, vitamins etc.) and the nutritional
density of the food
● Intervention studies, in which the intervention (e.g. consumption of a certain food)
involves a group of study objects and outcomes are compared with those of a control
group not subject to the intervention. Intervention studies are considered to provide the
most reliable evidence in health research. The most relevant type of intervention study is
the randomised controlled trial (RCT)
● Nutritional epidemiology, in which large amounts of data (e.g. on food intake and
disease prevalence) are collected over extended periods and then used to investigate how
consumption levels of certain foods correlate with disease risk. The most common type
of study in nutritional epidemiology is the prospective cohort study, which follows large
groups of people (the cohort) over long periods before diseases occur (prospective).
Other types of studies exist, such as case-control studies and retrospective cohort
studies.
As it is difficult to isolate the effect of eating a certain food on the outcome, individual
intervention and epidemiological studies may show differing results. Therefore, to draw general
conclusions on the health effect of certain foods from individual studies, the results are gathered
into meta-analyses, which pool together the results and weight them according to the size of the
study. In order for a meta-analysis to be of value, studies should be collected through a
systematic search process.

63
5.1.1 Nutritional content
Data on the nutritional content of different food products are available in different internet-
based databases commonly administered by national food agencies, such as the United States
Department of Agriculture (USDA),16 the Swedish National Food Agency17,the French Food
Safety Agency (ANSES)18, the Dutch Food Composition Database (NEVO)19 and Public Health
England20.
The aims of national food databases can slightly differ and therefore also their structure and
content. For example, the main aim of the Swedish food composition database is to provide
nutrient information on representative foods on the Swedish market, and hence to enable the
food agency to calculate energy and nutrient intakes from diet surveys. Due to cost constraints,
composite samples using similar products, but from different brands, are often analysed to get a
representation of the ‘average product’ on the Swedish market (Öhrvik et al., 2015). The
nutritional value of a product of a specific brand on the market may therefore differ from the
nutritional value reported in the database for the composite sample of the product. The USDA
database is slightly differently constructed, presenting data for a wide variety of brands for any
given food product.
Table 5.1 shows an extract from the Swedish database for milk and unfortified and fortified soy,
oat and almond drink and soy drink from the UK database. On the European market, over 90%
of plant-based dairy alternatives are fortified (Stephanie de Vriese, Alpro, personal
communication 2018). For comparison, Table 5.2 shows the nutrient content of corresponding
products on the US market.
16Link: https://ndb.nal.usda.gov/ndb/search/list 17Link: http://www7.slv.se/SokNaringsinnehall/Home/ToggleLanguage 18Link: https://www.anses.fr/en/content/anses-ciqual-food-composition-table 19Link: https://nevo-online.rivm.nl/Default.aspx 20Link: https://www.gov.uk/government/uploads/system/uploads/attachment_data/file/416932/McCance___Widdowson_s_Composition_of_Foods_Integrated_Dataset.xlsx

64
Table 5.1. Nutritional content of dairy milk and plant-based dairy alternatives according to the Swedish food composition and the UK database. Values are given per 100 grams. N/A=Not analysed, Tr=Traces, RAE=Retinol activity equivalents.
Milk Oat drink Soy drink, Swedish d.b.
Soy drink, UK database
Almond drink
Nutrients Full fat Semi-skim.
Low fat
Fortified
Un-fortified
Fortified
Un-fortified
Fortified+
Unfortifiedψ Fortified
Unfortified
Energy (kcal) 60 47 39 42 41 37 37 43 26 26 26
Carbohydrates (g) 4.7 4.8 4.8 7.1 7.6 3.2 3.2 2.5 0.5 3.5 3.5
Sugars (g) 4.8 4.9 4.9 3.2 4 2.4 2.4 2.2 0.2 3.1 3.1
Fat (g) 3 1.5 0.5 1.1 0.5 1.5 1.5 2.4 1.6 1.3 1.3
Saturated fat (g) 1.92 0.96 0.32 0.09 0.1 0.15 0.15 0.38 0.24 0 0.12
MUFA (g) 0.75 0.37 0.12 0.55 0.2 0.26 0.26 0.51 0.33 0.01 0.81
PUFA (g) 0.07 0.04 0.01 0.32 0.2 0.61 0.61 1.39 1.1 0 0.26
Cholesterol (mg) 10.3 6.1 3.3 0 0 0 0 0 0 0 0
Protein (g) 3.51 3.57 3.6 0.35 0.93 2.57 2.57 3.1 2.4 0 0
Fibre (g) 0 0 0 0.8 0.8 0 0 0.5 0.5 0.2 0.2
Calcium (mg) 120 122 124 120 5 96.5 19 130 13 133 133**
Magnesium (mg) 11 11 11 3.8 4 14.4 14.4 18 15 6.4 6.4
Iron (mg) 0.02 0.02 0.02 0.15 0.1 0.37 0.37 0.31 0.43 0.05 0.05
Phosphorus (mg) 102 104 105 26.2 20 89.7 89.7 89 48 67 67
Potassium (mg) 161 163 165 31.6 30 135 135 119 74 16.5 16.5
Sodium (mg) 39 40 40 40.3 40 37 37 56 32 49.4 49.4
Zinc (mg) 0.43 0.43 0.44 0.09 0.05 0.26 0.26 0.3 0.3 0.04 0.04
Vitamin C (mg) 0.6 0.6 0.6 0 0 0 0 0 0 0 0
Vitamin D (µg) 1 1 1* 1.62 0 0.74 0 0.8 0 0.93 0
Thiamine (mg) 0.05 0.05 0.05 0.03 0.03 0.03 0.03 0.06 0.06 0 0
Riboflavin (mg) 0.15 0.15 0.15 0.24 0 0.21 0.17 0.2 0.05 0.2 0
Niacin eq. (mg) 0.9 0.9 0.9 0.1 0.2 0.6 0.6 0.8 0.7 0.1 0.1
Vitamin B6 (mg) 0.04 0.05 0.05 0.13 0.13 0 0.03 0.03 0.03 0 0
Folate (µg) 14.3 14.6 14.7 17.9 0 16.1 16.1 9 14 0.4 0.4
Vitamin B12 (µg) 0.58 0.59 0.59 0.46 0 0.38 0 0.4 0 0.38 0
Vitamin A, RAE (µg) 27.7 13.8 4.6 36.3 0 0 0 Tr† Tr† 0 0
Vitamin E (mg) 0.08 0.04 0.01 1.34 0 0.16 0.16 0.32 0.32 2.9 0
Iodide (µg) 11.8 12 12.1 0 0.1 0 0 1 1 0 N/A
Selenium (µg) 1.61 1.62 1.63 0 0 0 0 4 4 0 0
*Low fat milk is fortified with vitamin D in Sweden **This value cannot be correct through deductive reasoning, but is presented as
this in the food composition database. †Traces of retinol equivalents. +Sweetened. ψUnsweetened.
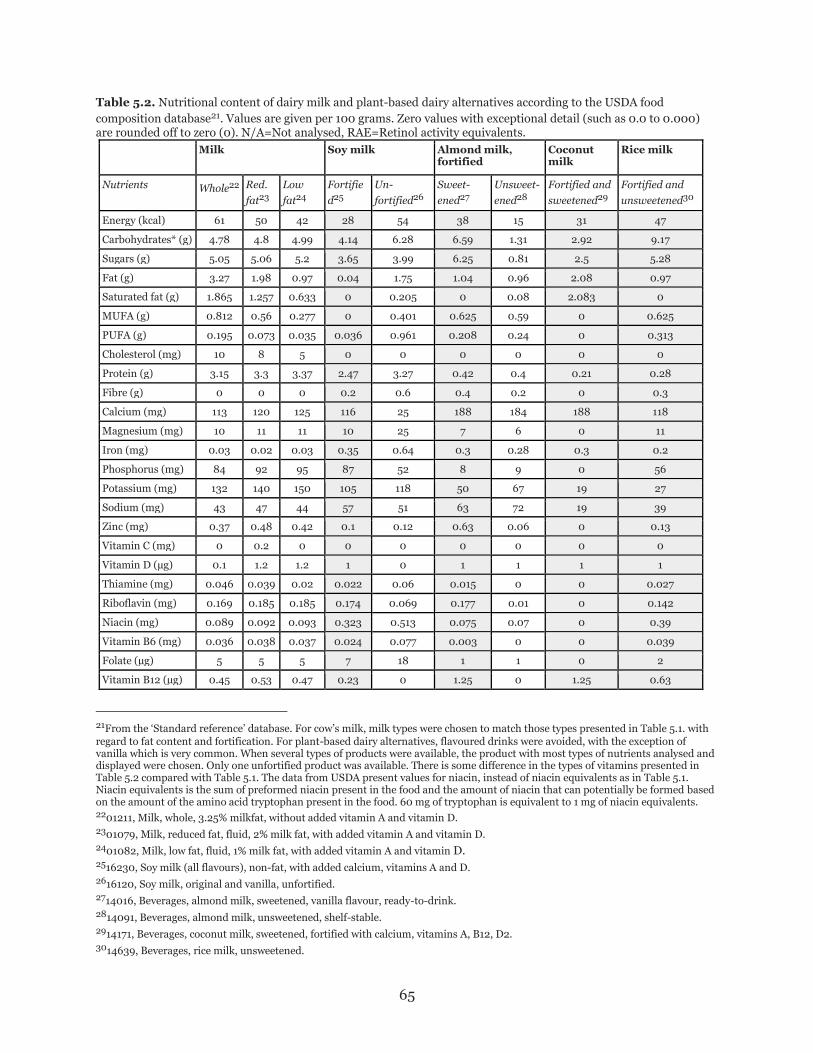
65
Table 5.2. Nutritional content of dairy milk and plant-based dairy alternatives according to the USDA food
composition database21. Values are given per 100 grams. Zero values with exceptional detail (such as 0.0 to 0.000) are rounded off to zero (0). N/A=Not analysed, RAE=Retinol activity equivalents.
Milk Soy milk Almond milk, fortified
Coconut milk
Rice milk
Nutrients Whole22 Red.
fat23
Low
fat24
Fortifie
d25
Un-
fortified26
Sweet-
ened27
Unsweet-
ened28
Fortified and
sweetened29
Fortified and
unsweetened30
Energy (kcal) 61 50 42 28 54 38 15 31 47
Carbohydrates* (g) 4.78 4.8 4.99 4.14 6.28 6.59 1.31 2.92 9.17
Sugars (g) 5.05 5.06 5.2 3.65 3.99 6.25 0.81 2.5 5.28
Fat (g) 3.27 1.98 0.97 0.04 1.75 1.04 0.96 2.08 0.97
Saturated fat (g) 1.865 1.257 0.633 0 0.205 0 0.08 2.083 0
MUFA (g) 0.812 0.56 0.277 0 0.401 0.625 0.59 0 0.625
PUFA (g) 0.195 0.073 0.035 0.036 0.961 0.208 0.24 0 0.313
Cholesterol (mg) 10 8 5 0 0 0 0 0 0
Protein (g) 3.15 3.3 3.37 2.47 3.27 0.42 0.4 0.21 0.28
Fibre (g) 0 0 0 0.2 0.6 0.4 0.2 0 0.3
Calcium (mg) 113 120 125 116 25 188 184 188 118
Magnesium (mg) 10 11 11 10 25 7 6 0 11
Iron (mg) 0.03 0.02 0.03 0.35 0.64 0.3 0.28 0.3 0.2
Phosphorus (mg) 84 92 95 87 52 8 9 0 56
Potassium (mg) 132 140 150 105 118 50 67 19 27
Sodium (mg) 43 47 44 57 51 63 72 19 39
Zinc (mg) 0.37 0.48 0.42 0.1 0.12 0.63 0.06 0 0.13
Vitamin C (mg) 0 0.2 0 0 0 0 0 0 0
Vitamin D (µg) 0.1 1.2 1.2 1 0 1 1 1 1
Thiamine (mg) 0.046 0.039 0.02 0.022 0.06 0.015 0 0 0.027
Riboflavin (mg) 0.169 0.185 0.185 0.174 0.069 0.177 0.01 0 0.142
Niacin (mg) 0.089 0.092 0.093 0.323 0.513 0.075 0.07 0 0.39
Vitamin B6 (mg) 0.036 0.038 0.037 0.024 0.077 0.003 0 0 0.039
Folate (µg) 5 5 5 7 18 1 1 0 2
Vitamin B12 (µg) 0.45 0.53 0.47 0.23 0 1.25 0 1.25 0.63
21From the ‘Standard reference’ database. For cow’s milk, milk types were chosen to match those types presented in Table 5.1. with regard to fat content and fortification. For plant-based dairy alternatives, flavoured drinks were avoided, with the exception of vanilla which is very common. When several types of products were available, the product with most types of nutrients analysed and displayed were chosen. Only one unfortified product was available. There is some difference in the types of vitamins presented in Table 5.2 compared with Table 5.1. The data from USDA present values for niacin, instead of niacin equivalents as in Table 5.1. Niacin equivalents is the sum of preformed niacin present in the food and the amount of niacin that can potentially be formed based on the amount of the amino acid tryptophan present in the food. 60 mg of tryptophan is equivalent to 1 mg of niacin equivalents. 2201211, Milk, whole, 3.25% milkfat, without added vitamin A and vitamin D. 2301079, Milk, reduced fat, fluid, 2% milk fat, with added vitamin A and vitamin D. 2401082, Milk, low fat, fluid, 1% milk fat, with added vitamin A and vitamin D. 2516230, Soy milk (all flavours), non-fat, with added calcium, vitamins A and D. 2616120, Soy milk, original and vanilla, unfortified. 2714016, Beverages, almond milk, sweetened, vanilla flavour, ready-to-drink. 2814091, Beverages, almond milk, unsweetened, shelf-stable. 2914171, Beverages, coconut milk, sweetened, fortified with calcium, vitamins A, B12, D2. 3014639, Beverages, rice milk, unsweetened.

66
Vitamin A, RAE (µg)
46 55 58 61 0 63 0 63 63
Vitamin E (mg) 0.07 0.03 0.01 0.08 0.11 2.81 6.33 0 0.47
Iodide** (µg) N/A N/A N/A N/A N/A N/A N/A N/A N/A
Selenium (µg) 3.7 2.5 3.3 1.8 4.8 0.1 0.1 0 2.2
*Calculated by difference **Not analysed in the USDA's food composition database. Furthermore, iodide is not analysed by the
USDA and therefore not presented in Table 5.2.
Energy
Plant-based drinks generally have a somewhat lower energy content than milk, but this depends
on the fat content of the milk and on the type of plant-based drink that is compared. Although
energy intake should be tailored according to an individual's metabolic need, food with lower
energy density is usually recommended in high- and middle-income settings, as excess energy
intake is generally a major problem.
Protein
Dairy milk contains approximately 3.4% protein31, soy drink approximately 3% and other plant-
based drinks less than 1%. Milk contains all essential amino acids, as does soy protein, although
the amounts of different amino acids vary (Fig. 5.1). As different age groups have different
amino acid requirements (EFSA, 2012), the most favourable product for any given individual
will differ. Cereal-based proteins often have lower lysine content, whereas legume- based
proteins often have lower contents of cysteine and methionine. Soy protein is an exception and
is generally regarded as a complete protein for the adult population. Protein quality can be
determined through various scoring systems, the most readily used and recognised being the
Protein Digestibility-Corrected Amino Acid Score (PDCAAS), because it combines biological
value (completeness) and digestibility. The PDCAAS score for milk, soy and wheat is 100 (121 if
not truncated at 100), 91 and 42, respectively (Schaafsma, 2000).
31Proteins are made up of amino acids. There are 20 different amino acids commonly found in plants and animals. Amino acids can be classified as either essential (indispensable amino acids that cannot be produced during metabolism by the body and therefore must be provided by the diet) or non-essential (dispensable amino acids that can be produced endogenously in the body from other amino acids). Nine amino acids (histidine, leucine, isoleucine, lysine, methionine, phenylalanine, threonine, tryptophan and valine) are considered essential for adults and these nine plus arginine for preterm infants. In addition, there are two semi-essential amino acids that can be metabolised in the body from essential amino acids: Cysteine is made from methionine and tyrosine is made from phenylalanine. When a protein meets the essential amino acid requirements, it has a high biological value. When one or more essential amino acids are present in insufficient amounts to cover human needs, the protein is said to have low biological value. The amino acid that is in shortest supply in relation to need is called the limiting amino acid. Essential amino acid requirements for human growth and health (differentiated for different age groups) are provided by FAO (2012).
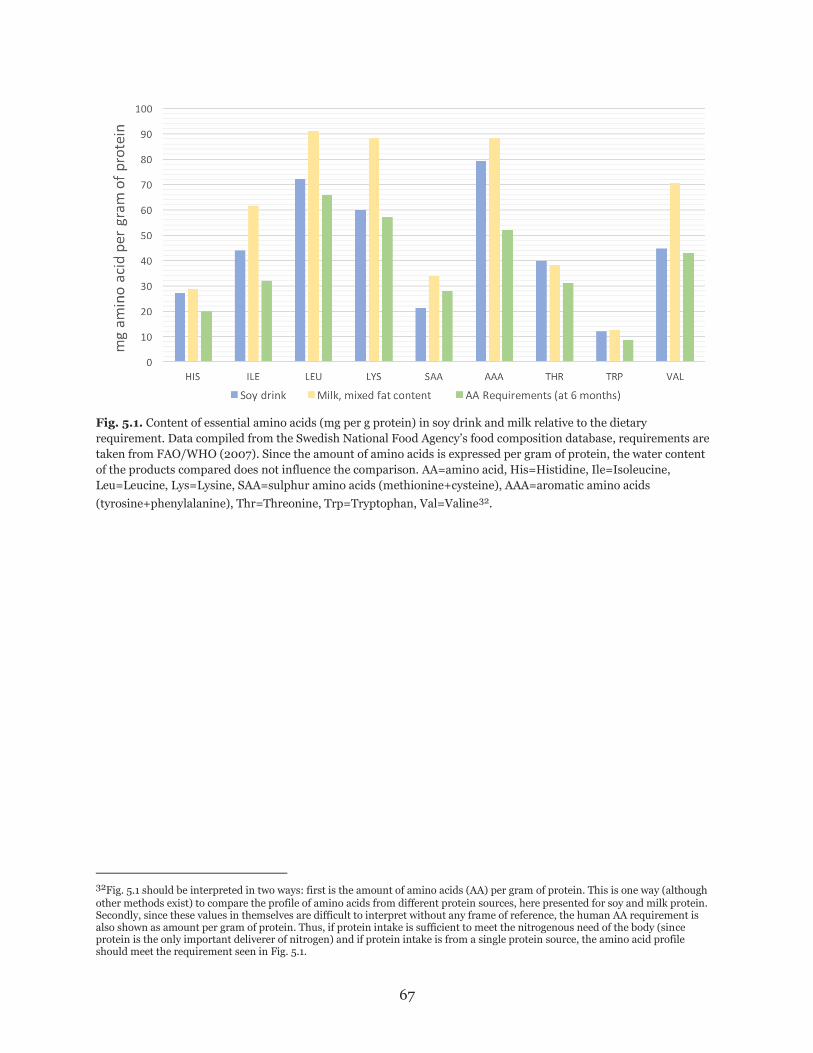
67
Fig. 5.1. Content of essential amino acids (mg per g protein) in soy drink and milk relative to the dietary
requirement. Data compiled from the Swedish National Food Agency’s food composition database, requirements are
taken from FAO/WHO (2007). Since the amount of amino acids is expressed per gram of protein, the water content
of the products compared does not influence the comparison. AA=amino acid, His=Histidine, Ile=Isoleucine,
Leu=Leucine, Lys=Lysine, SAA=sulphur amino acids (methionine+cysteine), AAA=aromatic amino acids
(tyrosine+phenylalanine), Thr=Threonine, Trp=Tryptophan, Val=Valine32.
32Fig. 5.1 should be interpreted in two ways: first is the amount of amino acids (AA) per gram of protein. This is one way (although other methods exist) to compare the profile of amino acids from different protein sources, here presented for soy and milk protein. Secondly, since these values in themselves are difficult to interpret without any frame of reference, the human AA requirement is also shown as amount per gram of protein. Thus, if protein intake is sufficient to meet the nitrogenous need of the body (since protein is the only important deliverer of nitrogen) and if protein intake is from a single protein source, the amino acid profile should meet the requirement seen in Fig. 5.1.

68
In general, foods of animal origin (especially milk and egg protein) have higher biological value
and digestibility than foods of plant origin, although the differences are small. Table 5.3 shows
estimated ‘true ileal digestibility’33 for some different types of food.
Table 5.3. Estimated protein digestibility of different foods.
Several values for a given food indicate results from different studies
Food True ileal digestibility
Milk protein1 95%
Casein1 94.1%
Soy protein1 91.5%
Pea protein1 91.5%
89.4%
90%
Wheat protein1 91.5%
85%
Lupin protein1 90%
Rapeseed protein1 84%
Rice, milled2 88%
Oatmeal2 86%
Peanuts3 94%
Soy flour3 86%
Soy protein isolate3 95%
Wheat gluten3 99% 1FAO (2012) 2Bienvenido (1998) 3FAO and WHO (2007)
Fat
The fat content in dairy products can vary. Low-fat varieties are available for almost all types of
dairy products. The same can be said for plant-based dairy alternatives. The difference is in the
quality of fat34. Dairy products are predominantly high in saturated fat, whereas plant-based
products are low in saturated fat and high in unsaturated fat. The exception is plant-based dairy
alternatives based on coconut.
33Protein digestion starts in the stomach, where proteins are denatured by the acidic environment. Enzymatic digestion also occurs in the stomach. Digestion of peptides continues in the small intestine by several different enzymes. Amino acids (and also to some extent actual peptides) are absorbed by the cell wall and transported into the blood. Some protein remains in the digestive system and reaches the colon, where it is degraded into peptides and amino acids by the gut bacteria. When measuring protein digestibility, the fraction of absorbed protein in the small intestine, called the true ileal digestibility, is often considered the most physiologically relevant (but not always) parameter after ingestion, since colonic proteolysis by bacteria overestimates total protein digestibility. When true ileal digestibility is taken into account, the global quality score is DIAAS, recognised as the best method by WHO, but data are lacking to create a large database of DIAAS for all foods (FAO, 2013) 34The recommendation from most health agencies has long been to limit the intake of saturated fatty acids (SFA). Lately, however, there has been some controversy around this recommendation, as some recent studies found no positive health effects on decreased intakes of SFA, especially if SFA was replaced by carbohydrates. However, the Scientific Advisory Committee on Nutrition in the UK has just completed a major review of all evidence and has concluded that there is no reason to change the recommendation (SACN, 2018). However, its review did not consider the type of SFA and research indicates that there might be considerable differences between different types of SFA (Zelman, 2011).

69
Fibre
Molecularly speaking, fibre35 comprises different combinations of indigestible starch and sugars
and is only present in plant-based food; almost no animal food contains fibre as it is defined
today. The European Food Safety Authority (EFSA) defines fibre as “non-digestible
carbohydrates plus lignin”, with four different classes of fibre. Most plant-based dairy
alternatives are also low in fibre content, as most fibre is lost during processing. However, the
oat drink company Oatly has patented a way to retain loose oat fibre, beta-glucans, in their
products. Beta-glucans have documented health-promoting effects (Chen and Raymond, 2008;
Shen et al., 2016).
Vitamins
When comparing milk with plant-based milk alternatives on the basis of vitamin content, the
fortification status of the plant-based products will have a major impact on the result (see
section 5.1.4 and Appendix G for more information on fortification). Full-fat milk contains the
important vitamins A and D, while low-fat milk is usually fortified with these. All dairy products
also contain B12 in substantial amounts. Unfortified plant-based dairy alternatives lack vitamin
A, D and B12 entirely, although a large percentage of the products on the market are fortified,
hence reaching the same levels as milk for vitamin D and B12 (and vitamin A for fortified oat
drink). Soy drink is unique as it provides more riboflavin, folate, vitamin E and vitamin K than
milk even when unfortified.
Minerals
As with vitamins, the fortification status of plant-based products will have an obvious impact on
the comparison with milk. Unfortified plant-based drinks are low in calcium. Almonds and
soybeans are naturally rich in calcium, but during production (adding water and grinding) some
of the calcium is lost. As regards magnesium, phosphorus, potassium and zinc, all plant-based
drinks are low in these minerals compared with milk, but unfortified soy drink is only slightly
lower than milk for these minerals. All plant products contain more iron than milk, with soy
drink excelling at almost 0.4 mg per 100g. To put this in perspective, if consumers were to
consume soy drink in the same quantity as milk, this would provide 6-11% of their daily
recommended intake of iron. On the other hand, cow’s milk contains more selenium, zinc and
iodide than any of the plant-based products. Calcium is present in fortified plant-based drinks in
similar amounts as in milk. Phytate (or phytic acid) is also a compound that is ubiquitous in
unrefined plant food, which can contribute to lower bioavailability of minerals. However, due to
heating during the production of plant-based dairy alternatives, phytates are removed. The
actual concentration of phytate in soy drink is very low (0.05-0.09%) and is therefore unlikely to
be a major inhibitor of calcium absorption in fortified soy products (Zhao et al., 2005).
35Fibre was long seen as somewhat of an ‘inert’ nutrient, meaning that it only served through its ‘bulking’ effect, leading to eased bowel function and, for viscous fibre, increased satiety and reduced glycaemia and insulinaemia, despite lower energy intake. Today, however, fibre has undergone a ‘renaissance’, since researchers have managed to identify several different types of fibre with distinct physiological effects. This renaissance has occurred concomitantly with increasing knowledge of the human gut microbiota and the role of gut bacteria for human health and development of diseases. Since fibre cannot be broken down by the human digestive system, these compounds pass through down to the gut microbiota, which feed on undigested fibre, supplying the colon with (healthy) by-products from the fermentation of fibre.

70
Sugars
Cow’s milk contains more sugars than the plant-based alternatives listed in Table 5.1. These
sugars come in the form of lactose. The lactose molecule consists of one part glucose and one
part galactose and this configuration of molecules gives lactose a lower glycaemic index (less
pronounced glucose response) than refined sugar (saccharose) (Foster-Powell et al., 2002),
which is used in plant-based dairy alternatives.
Isoflavones
Isoflavones are one of three types of phytoestrogens present in foods, the others being lignans
and coumestans. Isoflavones are present in soya, but they can also be found in legumes such as
chickpeas and lentils. The chemical structure of isoflavones shows similarities to the structure of
oestrogen, but these two have clear differences. There are two types of oestrogen receptor (ER)
in the human body, alpha (ERα) and beta (ERβ) receptors. The hormone oestrogen can bind to
both receptors. Under normal consumption and physiological conditions, isoflavones from soy
bind mainly to Erβ, but at lower affinity than oestrogen (Kuiper et al., 1998). This distinction is
important, since ERα and ERβ have opposing physiological effects, where ERα exhibits an
oestrogen-like effect and ERβ has anti-oestrogen like properties (Oseni et al., 2008’ Messina,
2016). Due to the anti-oestrogenic effects of isoflavones, they are believed to contribute to a
lower risk for cancer in some organs associated with these receptors (such as breast and prostate
cancer) in relation to soy intake (Messina, 2016).
5.1.2 Health effects
An extensive body of research has investigated the health effects of dairy products (Dong et al.,
2011a; Dougkas et al., 2011; Abargouei et al., 2012; Beer, 2012; Chen et al., 2012; Aune et al.,
2012, 2013, 2015; Dror, 2014; Genkinger et al., 2014; de Goede et al., 2015, 2016; Guo et al.,
2015; Alexander et al., 2016; Drouin-Chartier et al., 2016; Gijsbers et al., 2016; Lu et al., 2016a,
2016b; Pimpin et al., 2016; Thorning et al., 2016; Wang et al. 2016a, 2016b; Harrison et al.,
2017; Onvani et al., 2017; Bian et al., 2018). As plant-based alternatives to dairy are a novel
concept, much fewer health studies are available for these products specifically. Soy drinks and
soy products are the exception. These have a very ancient pedigree in South and Southeast Asia,
so epidemiological data on these types of products are more common, including studies on
Western populations (Jacobsen et al., 1998; Shu et al., 2001; Wu et al., 2002, 2008; Cheng et
al., 2005; Fournier et al., 2007; Korde et al., 2009; Harland and Haffner, 2008; Dong and Qin,
2011; Matthews et al., 2011; Taku et al., 2011; Tokede et al., 2015; Li et al., 2016; Tranche et al.,
2016; Yu et al., 2016; Morency et al., 2017; Zhao et al., 2017; Applegate et al., 2018). In this
section, we briefly summarise some of this evidence. While we recognise the need to perform a
more comprehensive review of health effects of dairy products and plant-based dairy
alternatives in order to identify where the potential risks and benefits arise in relation to
different health outcomes, that was a too great a task for this report.
In a recent (non-systematic) review by Thorning et al. (2016), the health effects of dairy
consumption on human health were summarised. Their overall conclusion was that dairy
products provide important nutrients with positive health effects with regards to several non-

71
communicable diseases, e.g. that dairy consumption is correlated with lower risk of obesity in
children (but not in adults) and lower risk of developing type 2 diabetes (especially consumption
of fermented dairy products and cheese). An advantage of dairy consumption on weight loss is
also seen, but only under conditions of energy restriction. High milk consumption (200-300
mL/day) has no effect on the risk of cardiovascular disease, with a positive effect of milk
consumption on the risk of stroke and hypertension. The effect of dairy consumption on bone
health is positive, but only to a certain extent. Dairy consumption have a positive effect on the
bone mineral density of children and adolescents, but no protective effects on fracture risk in
adults (Thorning et al., 2016). The absence of protective effects in adults might be explained by
the fact that there are several important factors for determining bone fracture events (such as
physical activity and intake of vitamin D) and not solely bone mineral density. According to the
World Cancer Research Fund, there is probable evidence that dairy consumption decreases the
risk of colorectal, bladder, gastric and breast cancer, whereas no association has been found for
pancreatic, ovarian or lung cancer. The evidence as regards dairy consumption and prostate
cancer risk is inconsistent. As regards dairy consumption and all-cause mortality, there seems to
be no consistent evidence in either direction.
In a review by Messina (2016), the health effects of soy-based foods were investigated on the
basis of the best available evidence in epidemiological research. Soy protein has been shown to
have beneficial effects on risk factors for cardiovascular disease, including improved lipid levels,
lower blood pressure, improved endothelial function and less arterial stiffness. However, effects
on risk factors do not necessarily translate into lowered incidence of disease in all types of
populations (most studies investigating soy are conducted on women). With regard to coronary
heart disease (CHD) events, there are mixed findings on the effect of soy consumption. There
may be an important interaction between the type of foods soy products replace in the high
consumption category, which might alter the health effects of soy. There is also a possibility that,
due to the unique properties of soy with its high isoflavone content, the health effects of soy
consumption are more pronounced in women than men. Furthermore, soy intake has been
shown to decrease the risk of breast cancer, prostate cancer (Applegate et al., 2018) and
colorectal cancer (Yu et al., 2016). There has been some concern about soy intake by breast
cancer patients, as it has been suggested that the isoflavones in soy might adversely affect the
prognosis for such patients. However, the evidence for this is only derived from animal studies,
whereas some epidemiological studies have found that soy intake could improve the prognosis
in breast cancer patients. In addition to the potential role of soy foods in chronic conditions, as
mentioned above, there may be beneficial effects of soy food in reducing menopause symptoms
and improving mental and skin health (Messina, 2016).
Many plant-based dairy alternatives include functionally active components with health-
promoting properties, such as beta-glucans in oats and alpha-tocopherol in almonds. See Sethi
et al. (2016) for a review of these.

72
5.1.3 Authorised health claims
Food authorities such as the European Food Safety Authority (EFSA) and the US Food and Drug
Administration (FDA) evaluate the available evidence on the ‘healthfulness’ of different foods, in
order to test different health claims that food product manufacturers want to use in marketing.
Health claims related to dairy and plant-based dairy alternatives include the following:
● Improved lactose digestion for yogurt in the EU: Scientific Opinion on the substantiation
of health claims related to live yoghurt cultures and improved lactose digestion (ID 1143,
2976) pursuant to Article 13(1) of Regulation (EC) No 1924/2006)
● Positive health claims for oat beta-glucan in the EU: Scientific Opinion on the
substantiation of a health claim related to oat beta glucan and lowering blood cholesterol
and reduced risk of (coronary) heart disease pursuant to Article 14 of Regulation (EC) No
1924/2006
● A ‘Health claim about Soy Protein and Cholesterol Lowering’ (approved by Health
Canada’s Food Directorate on 23 April 2015). According to Health Canada’s Food
Directorate, scientific evidence exists to support the health claim that consumption of
soy protein helps to lower blood cholesterol levels. The Directorate based its decision on
literature research covering the period January 1980-March 2010. All foods containing
soy protein, such as isolated soy protein, soy protein concentrate, textured soy protein
and soy flour, but also foods made from the whole soy bean, are eligible for the health
claim. Foods containing at least 6 g of soy protein per reference amount and per serving,
and also complying with a list of conditions regarding the presence of recommended
nutrients, maximum levels of cholesterol, alcohol, etc., are allowed to bear the health
claim.
5.1.4 Fortification of dairy and plant-based drinks
Since the nutritional quality of plant-based drinks is dependent on whether they are fortified or
not, the question of fortification is central to comparison between dairy and plant-based dairy
alternatives. The most common nutrients used in fortification are calcium, riboflavin, vitamin D
and vitamin B12. Fortification strategies vary in different countries, based on the nutritional
challenges of a specific population and differences in jurisdiction surrounding the fortification of
products. One example of how micronutrients and fortification are important and context-
specific is provided by the WWF UK Livewell Plate project. In this analysis, cheese consumption
was reduced compared with the current UK diet, while other dairy products were slightly
increased for adults. One of the reasons for this was that dairy products are the most important
source of iodine in the current UK diet, and intake of this trace element is currently below the
requirement. However, in countries where iodised table salt is commonly used (such as Sweden,
Belgium, the Netherlands), iodine would not be a reason to keep a high dairy level in the diet.
There is an ongoing debate on fortification of foods and whether intake of micronutrients
already present in foodstuff is better for health than micronutrients provided through
fortification. Research suggests that whole foods are in general superior in promoting health
than supplements of vitamins and minerals, and that some supplements like vitamin E,

73
selenium and beta-carotene are even associated with an increased rate of cancer in some
populations (Harvie, 2014). This can probably be explained by 1) intake of micronutrients as
part of food not resulting in overconsumption, whereas intake of supplements can result in
overconsumption; and 2) whole foods containing a wide array of bioactive substances, some of
which are still unknown to the medical community. Bioactive compounds can elicit e.g. more
antioxidant power when combined than when evaluated individually. The so-called ‘matrix
effect’ takes into account the structural organisation of whole foods, which elicit different health
effects than nutrients exert on their own (Thorning et al., 2017).
The bioavailability of naturally occurring compounds compared with fortification agents is
another issue, but lower bioavailability can usually be compensated for by higher fortification
levels (further discussed in Appendix G). There are several cases of successful public health
interventions where staple foods have been fortified and have in practice eliminated diseases, as
is the case for iodine fortification of salt in Sweden and goitre. What does raise concern is the
emerging evidence on calcium supplementation and cardiovascular events. In a study by
Bolland et al. (2013), an increased risk of cardiovascular events (non-lethal included) of between
17-31% was seen for calcium supplementation, depending on the outcome. The proposed
mechanism is how calcium is delivered; dietary calcium is incorporated in organic compounds,
whereas calcium supplements are carried by an associated salt, thus being inorganic. This
different molecular context is thought to give rise to high serum concentrations of calcium,
which might then exert detrimental effects on the cardiovascular system. However, a later
review by Weaver (2014) summarised the evidence for calcium supplements and cardiovascular
disease risk and concluded that the totality of the epidemiological evidence does not constitute a
strong case for concern. The National Food Agency in Sweden, America’s USDA, the UK’s
Eatwell Guide, the Wheel of Five in the Netherlands and the healthy living food triangle from
Flanders all recommend fortified plant-based products as an alternative to dairy products.

74
5.2 Environmental impacts of dairy and plant-based
dairy alternatives
In general, scientific studies on the effect of diet on social and economic dimensions are very
scarce, while studies focusing on the impact on the environment in general and climate in
particular have grown rapidly in recent years. Here we summarise and give examples of results
of studies comparing dairy and plant-based dairy alternatives. The section is divided into three
parts; comparison on a product-to-product basis, either per unit mass or based on nutrient
density (section 5.2.1), comparison in a dietary context (5.2.2) and comparison from a
production system perspective (section 5.2.3).
5.2.1 Comparison on a product-to-product basis
The most common way of comparing food products in on the basis of mass, commonly per kg. In
LCA, this unit of comparison is called the functional unit. However, different food products
provide different ‘functions’, e.g. some provide a lot of protein, while others are low in protein
but rich in other nutrients and so on. Therefore comparing foods based on mass has been
criticised for failing to consider the function of foods, leading to ‘unfair’ comparisons
(Notarnicola et al., 2017). An alternative is to compare foods based on their energy or protein
content or their nutrient density. Choice of functional unit can strongly influence the
comparison of different foods (Masset et al., 2015).
The choice of functional unit is not straightforward. For example, as the average protein intake
in many high-income countries is far beyond recommendations and as many consumers also
over-consume food in general, it could be argued that the prime function of food in such settings
is to supply pleasure rather than nutrients, which could justify the use of mass as the functional
unit after all. In addition, when consumers shop for food they shop for quantities rather than
nutrients, for example a serving of sausage in a meal is often the same size as a serving of pure
meat, although the protein content in the sausage might be considerably lower. In low-income
countries, livestock have additional functions to providing food, e.g. providing manure for fuel,
draught power and financial insurance, which needs to be considered in comparisons of
different foods or production systems (Weiler et al., 2014). Hence, the choice of functional unit
is highly dependent on the context and aim of the study.
For LCA on milk, a metric that corrects for the varying fat and protein content of the milk is
commonly used, e.g. energy-corrected milk (ECM) (Sjaunja et al., 1990). For comparisons of
milk with plant-based dairy alternatives, there is no consensus on how that should be done and
studies to date have used comparisons per kg and different nutrient profiling methods.
75
Comparison per kg product
Climate impact
In a meta-analysis and systematic review by Clune et al. (2017), 369 studies were reviewed to
investigate the carbon footprint (measured as the global warming potential (GWP) in CO2e per
kg product) of 168 varieties of produce. The results comprise 1718 individual values, of which
those relevant for dairy and plant-based dairy alternatives are presented in Table 5.4. The
carbon footprint for the dairy product category was based on 90 LCA studies with 341 values for
milk. The carbon footprint included emissions up to the regional storehouse.
Gerber et al. (2013) present estimates of the carbon footprint of dairy, in aggregated form and
separated for ruminant species and place of production (Table 5.4). To compare milk with
differing content of fat and protein, their estimates are fat- and protein-corrected, i.e. they are
converted to a standard with 4% fat and 3.3% protein content. The estimates reported by Gerber
et al. (2013), like those reported by Clune et al. (2017), include post-harvest emissions, such as
transport and processing. However, the contribution of these emissions is small and was
estimated by Gerber et al. (2013) to be 6.1% of the total carbon footprint of cattle milk.
Variations in the carbon footprint of dairy milk between regions reflect the intensity of
production, with more extensive systems releasing more GHG emissions per kg milk produced,
mainly due to lower milk yields.
While Clune et al (2017) compiled results from case study LCAs, Gerber et al. (2013) performed
a global top-down modelling study that covered both extensive and intensive systems. This
explains the large difference in the world average carbon footprint of dairy (2.8 in Gerber et al.
(2013) and 1.39 in Clune et al. (2017)), as LCA on extensive systems are uncommon and thus the
average value in Clune et al. (2017) is biased towards high-income settings. In Clune et al.
(2017), only five studies on milk production systems in Central and South America are included
and only two for Asia and Africa. The same lack of studies applies for milk from other animal
species, and also for processed dairy products like cream and butter.
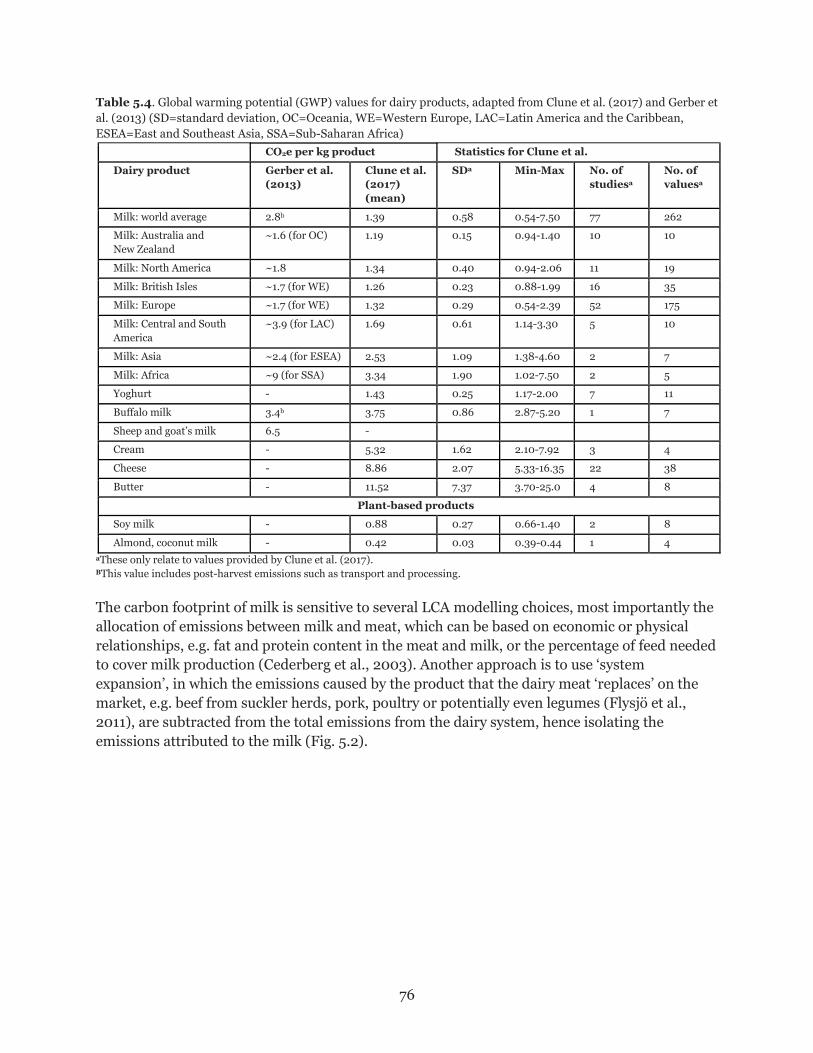
76
Table 5.4. Global warming potential (GWP) values for dairy products, adapted from Clune et al. (2017) and Gerber et
al. (2013) (SD=standard deviation, OC=Oceania, WE=Western Europe, LAC=Latin America and the Caribbean,
ESEA=East and Southeast Asia, SSA=Sub-Saharan Africa)
CO2e per kg product Statistics for Clune et al.
Dairy product Gerber et al.
(2013)
Clune et al.
(2017)
(mean)
SDa Min-Max No. of
studiesa
No. of
valuesa
Milk: world average 2.8b 1.39 0.58 0.54-7.50 77 262
Milk: Australia and
New Zealand
~1.6 (for OC) 1.19 0.15 0.94-1.40 10 10
Milk: North America ~1.8 1.34 0.40 0.94-2.06 11 19
Milk: British Isles ~1.7 (for WE) 1.26 0.23 0.88-1.99 16 35
Milk: Europe ~1.7 (for WE) 1.32 0.29 0.54-2.39 52 175
Milk: Central and South
America
~3.9 (for LAC) 1.69 0.61 1.14-3.30 5 10
Milk: Asia ~2.4 (for ESEA) 2.53 1.09 1.38-4.60 2 7
Milk: Africa ~9 (for SSA) 3.34 1.90 1.02-7.50 2 5
Yoghurt - 1.43 0.25 1.17-2.00 7 11
Buffalo milk 3.4b 3.75 0.86 2.87-5.20 1 7
Sheep and goat’s milk 6.5 -
Cream - 5.32 1.62 2.10-7.92 3 4
Cheese - 8.86 2.07 5.33-16.35 22 38
Butter - 11.52 7.37 3.70-25.0 4 8
Plant-based products
Soy milk - 0.88 0.27 0.66-1.40 2 8
Almond, coconut milk - 0.42 0.03 0.39-0.44 1 4
aThese only relate to values provided by Clune et al. (2017). BThis value includes post-harvest emissions such as transport and processing.
The carbon footprint of milk is sensitive to several LCA modelling choices, most importantly the
allocation of emissions between milk and meat, which can be based on economic or physical
relationships, e.g. fat and protein content in the meat and milk, or the percentage of feed needed
to cover milk production (Cederberg et al., 2003). Another approach is to use ‘system
expansion’, in which the emissions caused by the product that the dairy meat ‘replaces’ on the
market, e.g. beef from suckler herds, pork, poultry or potentially even legumes (Flysjö et al.,
2011), are subtracted from the total emissions from the dairy system, hence isolating the
emissions attributed to the milk (Fig. 5.2).

77
Fig. 5.2. Carbon footprint of milk from New Zealand (NZ) and Sweden (SE), estimated using different methods to
allocate emissions between milk and meat. From Flysjö et al. (2011).
Another issue to consider is that in 2013, the International Panel on Climate Change (IPCC)
changed the factor used to weight methane into the common unit of carbon dioxide equivalents
(CO2e) from 25 to 28 (34 including carbon-climate feedbacks) (100-year perspective; Myhre et
al., 2013). Most studies published to date, including Gerber et al. (2013) and all studies in Clune
et al. (2017), have used the old factor of 25 (or the even older factor of 23). Applying the new
factor of 34 would mean an increase in the carbon footprint of dairy milk of approximately 20%.
There are also other metrics for weighting the different greenhouse gases that can give quite
different results (Persson et al., 2015).
We were unable to find any peer-reviewed studies published in scientific journals on the climate
impact of plant-based dairy alternatives. In the review by Clune et al. (2017), only two studies on
plant-based dairy alternatives were included. One of these, by Feraldi et al. (2012), is from a
conference and to our knowledge not is available online. The other is a report from Tesco in the
UK which lists the carbon footprint of a large set of Tesco products, including six own brand
soya drinks whose carbon footprint ranged from 0.7 kg CO2e for unsweetened soya drink to 1.4
kg for its organic counterpart (Tesco, 2012). We summarise the grey literature we found on the
environmental impact of plant-based dairy alternatives later in this section.
Ecotoxicity impacts
Nordborg et al. (2017) evaluated freshwater ecotoxicity from the production of six different
foods in Sweden; minced pork, chicken fillet, minced beef, milk, wheat bread and pea soup.
They found that Swedish milk had an impact of the same magnitude as cereals and legumes
cultivated in Sweden when compared per kg product (3-4 times higher for milk when compared
per kg protein), while the impact from meat, especially pork and chicken, was almost 100 times
higher, mostly as an effect of the use of heavily sprayed soy as animal feed. In contrast to the
climate impact, the ecotoxicity impacts are a direct consequence of the management of the
production system, rather than whether it is an animal or plant-based product. For example,
organic systems, regardless of the product, have very low ecotoxicity impacts.

78
Impacts on water resources
Mekonnen and Hoekstra (2011) quantified the green (rainwater), blue (surface or groundwater)
and grey (water needed to assimilate pollutants) water footprint of global crop production in a
spatially explicit way for the period 1996-2005. Mekonnen and Hoekstra (2012) assessed the
water footprint of animal products, considering different production systems and feed
composition per animal type and country. Ercin et al. (2012) studied the water footprint of soy
milk produced in Belgium from soy bean grown in Canada and France. Results from these
studies are summarised in Table 5.5, which also presents data on water footprint for almonds,
oats, rice and soybeans. In order to compare drinks made of these commodities with milk and
soy drink, it has to be considered how much of these products are used per ton of drink, as well
as the water footprint from other ingredients (e.g. vegetable oil) and from processing (which is
usually low compared with that of raw material production). For oat drink, approximately 0.2 kg
of oats is needed per kg of oat drink (Florén et al., 2013). Using this value, the data in Table 5.5
indicate, very approximately, that drinks made of oats and soy have a lower blue water footprint
than dairy milk, while the impact of rice drink is of the same magnitude as that of dairy milk and
that of almond drink is considerably higher. However, metrics that take water scarcity into
account show that milk can be produced with very little impact on water resources (Ridoutt et
al., 2010), which shows that where production takes place is crucial for water use impacts. See
Appendix E3 for more on water use methodology.
Table 5.5. Water footprint (m3 per tonne). From Mekonnen and Hoekstra (2011*, 2012**) and Ercin et al. (2011)***
Product Green Blue Grey
Milk: world average grazing** 1087 56 49
Milk: world average mixed** 790 90 76
Milk: world average industrial** 1027 98 82
Soy drink: world average* 35741 1231 651
Soy drink: Belgium*** 276 10 10
Soybeans: world average* 2037 70 37
Oats: world average* 1479 181 128
Rice: world average paddy rice* 1146 341 187
Almonds: world average shelled or peeled* 9264 3816 3015
1These values seem unreasonably high, as the water footprint of soy milk should not be higher than the water footprint of soy bean.
Nitrogen footprint
Leip et al. (2014) modelled the nitrogen footprint of 12 food commodities in the EU and found
that dairy products on average had a nitrogen footprint of approximately 30 g N per kg product,
while the corresponding value for cereals and legumes was approximately 10-20 g N per kg
product, which implies that drinks made of these raw materials have a nitrogen footprint in the
range or 1-4 g N per kg product. Legumes had the lowest ‘nitrogen investment factor’ (quantity of
new reactive nitrogen required to produce one unit of nitrogen in the product) of all foods, i.e. 1-
2 kg N per kg of N in legumes, compared with approximately 6 kg N per kg of N in milk. See
Appendix E5 for more on metrics of impacts on biogeochemical flows.

79
Biodiversity
Quantifying the impact on biodiversity from food production is challenging for many reasons.
For example, biodiversity impacts arise from several impact pathways (e.g. land use, use of
pesticides, water pollution, climate change), biodiversity includes a diversity of ecosystems,
species, breeds and genes, and determining the reference state to which to compare impacts is
often not straightforward. Chaudhary and Kastner (2016) estimated species loss embodied in
global food trade for four vertebrate taxa. Their analysis, based on number of species lost due to
land use, covered 170 crops in 184 countries. For livestock, only the crop part of the feed was
included in their analysis, i.e. biodiversity impacts from livestock grazing were not included. The
results showed the highest impacts for cropland use in tropical regions, followed by temperate
regions and the lowest impacts for boreal regions, with a variation of over six orders of
magnitude. Country-specific biodiversity impacts per ton of crop are presented in Chaudhary
and Kastner (2016). Some results relevant for dairy production and the production of plant-
based dairy alternatives are summarised in Table 5.6.
Table 5.6 Biodiversity impact from one tonne of crop production. From Chaudhary and Kastner (2016)
Product No. of species lost
Almonds: France 1.4 * 10-5
Almonds: USA 1.2 * 10-6
Rice: France 5.8 * 10-7
Rice: Vietnam 3.3 * 10-6
Oats: France 1.6 * 10-7
Oats: Sweden 1.2 * 10-7
Rapeseed: Sweden 2.9 * 10-7
Forage crops: Denmark 6.8 * 10-8
Soy: Brazil 3.0 * 10-7
Soy: China 9.4 * 10-7
Soy: Canada 3.7 * 10-7
Soy: USA 2.9 * 10-7
Chaudhary and Kastner (2016) do not present the impact for animal products explicitly, but
these can be calculated based on the crops in livestock diets. Very approximately, assuming that
a typical dairy system in Europe uses approximately 0.4 kg of cereals, 0.03 kg of soy (from
Brazil) and 0.4 kg of forage crops per kg milk produced (based on data from Sweden; Cederberg
et al., 2009), this gives a biodiversity impact (number of species lost) of 8.4 x 10⁻⁸ based on the
values in Table 5.6. In comparison, oat drink, under the assumption that 0.2 kg of oats and 0.1
kg rapeseed is used per kg of oat drink, gives a biodiversity impact of 5.8 x 10⁻⁸. Hence,
assessments of biodiversity impacts using this methodology yield results of the same magnitude
for dairy milk and oat drink from Europe. However, almond drinks and rice drinks would score
one or two orders of magnitude higher.

80
Studies on plant-based dairy alternatives in the grey literature
Several food manufacturers have commissioned LCA studies on their products for internal or
marketing purposes. These are commonly performed by consulting companies and vary in
quality and transparency. Some are available online. We summarise the results from such
studies in Table 5.7. The climate impacts of plant-based drinks are within the range 0.3-0.6 kg
CO2e per kg or litre of drink, while those of milk are within the range 1.3-1.7 kg CO2e per kg milk
in these studies. There is one exception; the report from Tesco gives considerably higher values
for soy drink.
Milk also shows higher impacts in most other impact categories, with a few exceptions.
Freshwater eutrophication for one type of Swedish oat drink is higher than for Swedish milk,
due to electricity generation in Germany (where the oat drink is produced) emitting phosphate
into waterways. Use of water in Germany, rather than Sweden, also explains the higher water
use for the oat drink compared with milk, since that study accounts for water scarcity in
different countries. Furthermore, water use seems to be higher for almond drink than for milk,
while the LCA commissioned by Alpro on soy drink and milk shows that ionising radiation and
resource depletion36 are lower for milk than for soy drink.
Table 5.7. Summary of the environmental impacts of plant-based dairy alternatives, according to manufacturer- commissioned life cycle assessments (LCA). Highest value for each impact category marked in pink
Study Results
Life Cycle Assessment of
Ripple Non-Dairy Milk
https://www.ripplefoods.c
om/pdf/Ripple_LCA_Rep
ort.pdf (Retrieved May 24
2018)
Impact category
Unit Ripple pea drink
Almond Soy drink Dairy milk
Carbon footprint g CO2e (per kg protein)
387 (11.7)
454 (110)
476 (14.5)
1.467 (44.4)
Oatly Florén et al. (2013). Internal confidential report) Data for 1 L of drink; covers all life cycle stages including waste management of packaging at the consumer
Impact category Unit Aseptic oat
drink Fresh oat drink Milk
Carbon footprint kg CO2e 0.3 0.4 1.3
Primary energy use MJ-eq 7.7 9.2 19.6 Terrestrial eutrophication
molc N eq 0.005 0.006 0.103
Freshwater eu. kg P eq 0.00010 0.0019 0.00008 Marin eu. kg N eq 0.002 0.002 0.006 Acidification mol H+ eq 0.002 0.002 0.024 Ozone formation kg NMVOC eq 0.001 0.002 0.004 Land use m2 0.6 0.6 2.9
Water use m3 water eq 0.0005 0.008 0.0009
Feraldi et al. (2012). Life Cycle Assessment of Coconut Milk and Two Non-Dairy Milk Beverage Alternatives. Franklin Associates.
Impact category Unit Coconut milk Almond drink Soy drink Energy demand MJ eq 1.91 1.39 3.62 Global warming kg CO2e 0.1 0.11 0.61 Ozone depletion kg CFC-11 eq 2.4*10-9 1.8*10-9 3.2*10-9
Water consumption litre H2O eq 6.81 126 50.8 Acidification H+ moles eq 0.057 0.05 0.09
36The higher resource depletion for soy drink is explained by longer transport distances for soy compared with milk and therefore a higher need for lead in the maintenance of trucks and for indium, a metal with a high characterisation factor.

81
http://lcacenter.org/lcaxii/final-presentations/719.pdf (Retrieved March 13 2016). Values are per 0.5 gallon (2.27 L) of drink.
Eutrophication kg N eq 6.7*10-5 4.1*10-4 1.5*10-4
Smog kg NOx eq 8.1*10-4 3.9*10-4 0.0014 Solid waste kg SW eq 0.0087 0.0095 0.023
Ho et al. (2016). Almond milk vs cow milk - Life cycle assessment. Environment 159. Values are per litre of drink. Link: https://www.ioes.ucla.edu/wp-content/uploads/cow-vs-almond-milk-1.pdf (Retrieved May 24 2018)
Impact category Unit Almond drink Cow’s milk Global warming kg CO2e 0.36 1.67 Water consumption litre H2O 6100.6 291.5
Kerkhof and Terlouw (2015). Ecofys. Life Cycle Assessment of Alpro Plain Calcium Soy Drink and Dairy Milk in Belgium, Germany, the Netherlands and the United Kingdom.Values are per litre of drink. Commissioned by Alpro.
Impact category Unit Alpro soy drink Dairy milk UHT Fresh dairy milk Climate change kg CO2e 0.48 1.65 1.69 Ozone depletion kg CFC-11 eq 2.8*10-7 2.67*10-7 3.25*10-7
Human toxicity CTUh 2.98*10-7 3.14*10-6 3.15*10-6
(non cancer) Human toxicity CTUh 2.16*10-8 3.28*10-8 3.4*10-8
(cancer) Particulate matter kg PM2.5 eq 3.26*10-4 1.2*10-3 1.2*10-3
Ionising kBq U235 eq 0.123 0.102 0.105 radiation HH Ionising radiation CTUe 3.32*10-7 3.49*10-7 3.57*10-7
E (interim) Photochemical kg NMVOC eq 1.57*10-3 2.22*10-3 2.23*10-3
ozone formation Acidification molc H+ eq 4.22*10-3 4.48*10-2 4.48*10-2
Terrestrial molc N eq 0.0139 0.196 0.196 eutrophication Freshwater kg P eq 1.04*10-4 2.65*10-4 2.65*10-4
Eutrophication Marine kg N eq 1.59*10-3 1.43*10-2 1.43*10-2 eutrophication Freshwater CTUe 6.75 9.62 10.4 ecotoxicity Land kg C deficit 4.89 12 12 transformation Water resource m3 water eq 1.8*10-3 2.87*10-3 2.91*10-3
depletion Mineral, fossil & kg Sb eq 2.46*10-5 2.09*10-5 1.56*10-5
renewable resource depletion
Tesco (2012). Product Carbon Footprint Summary. Link: https://www.tescoplc.com/assets/files/cms/Tesco_Product_Carbon_Footprints_Summary(1).pdf (Retrieved May 24 2018)
Soy drink product Carbon footprint Tesco fresh sweetened soya milk 1 litre 0.8 kg CO2e Tesco unsweetened soya alternative to dairy 1 litre 0.7 kg CO2e Tesco calcium enriched soya drink 1 litre 0.9 kg CO2e Tesco value unsweetened soya drink 1 litre 0.7 kg CO2e Tesco organic U/SWT soya drink 1 litre 1.2 kg CO2e Tesco organic SWTND soya drink 1 litre 1.4 kg CO2e

82
As an example of a study that jointly evaluated many aspects of milk and plant-based milk
alternatives, here we briefly present results from a report from Healthcare without Harm37
(2017). In that report, the health, environmental, social justice and animal welfare aspects of
dairy and plant-based milk alternatives are assessed. A summary of the results is provided in
Table 5.8. The impact of products is defined as positive (moderate or strong), negative
(moderate or strong), neutral or debated, and is based on how other products perform in the
same category. Rankings are based on the relative per-serving impact of that food group
compared with other food groups. Health rankings are based on the extent of research
demonstrating health benefits or risks associated with consuming that food type. For the social
justice rankings, no product is ranked “positive”, given the generally poor labour standards in
both domestic and international food production. However, foods that have been associated
with serious labour concerns during production are ranked moderately or strongly negative in
the report, depending on the extent of the concerns. For animal welfare rankings, strong
negatives are attributed to food types associated with significant welfare harms; relative
improvements in welfare practices (while taking into consideration new potential harms from
these practices) are noted as moderately negative, neutral, or moderately positive, depending on
the extent of the difference. Inevitably, the classification system is arbitrary to some extent and
rankings are based on subjective norms, although if such classification systems are
transparently described and developed with stakeholder involvement, they may be useful for
evaluating products from many perspectives. However, grouping all plant-based alternatives
into one category is too coarse to give valuable information. In addition, there are many more
alternative dairy systems.
Table 5.8. Comparison between dairy and plant-based milk alternatives (MP=moderately positive, SP=strongly
positive, MN=moderately negative, SN=strongly negative, D=debated, N/A=not applicable). From Healthcare
without Harm (2017).
Dimension Dairy, conventional Dairy, grass-fed Plant-based alternatives
Health MP(D) MP(D) Neutral
Environmental
Climate MN (D) MN (D) SP
Land use MP MP SP
Resource input SN Neutral MN
Biodiversity MN SP MN
Social justice SN Neutral Neutral (SN cashew)
Animal welfare SN Neutral N/A (MN/D coconut)
37Healthcare Without Harm Europe is a non-profit European coalition of hospitals, healthcare systems, healthcare professionals, local authorities, research/academic institutions and environmental and health organisations. It currently has 84 members in 26 countries.

83
Comparison of environmental impact using nutrient density scores
One way to account for the varying nutrient content in dairy milk and different types of plant-
based dairy alternatives when comparing their environmental impacts is to use the nutrient
density of the products as a basis for comparison, rather than comparison per kg of food (section
3.4).
Smedman et al. (2010) designed a Nutrient Density to Climate Impact (NDCI) index to compare
milk, unfortified soy and oat drink, soft drink, orange juice, beer, wine and bottled carbonated
water. They used data on unfortified rather than fortified products in order to minimise error
and to enhance generalisability, and suggest that future studies include fortified drinks in
similar comparisons when data on GHG emissions are available for these products. The nutrient
density score used by Smedman et al. (2010) included three macronutrients (protein,
carbohydrates, fat), and 18 micronutrients (retinol equivalents, vitamin D, vitamin E, thiamin,
riboflavin, ascorbic acid, niacin equivalents, vitamin B6, vitamin B12, folate, phosphorus, iron,
potassium, calcium, magnesium, selenium, zinc, iodine). Fibre was not included. The index did
not include nutrients to be limited, e.g. saturated fat or added sugar. The nutrient density was
calculated by summarising the proportions of recommended daily intake of each nutrient
provided by 100 g of the beverage, multiplied by the proportion of nutrients contributing to
more than 5% of value given in the Nordic Nutrition Recommendations. The nutrient density of
each beverage was then combined with its GHG emissions to create the NDCI index. Smedman
et al. (2010) found that milk had the highest nutrient density in relation to GHG emissions of all
the beverages compared (Table 5.9).
Table 5.9. Nutrient density in relation to climate impact. From Smedman et al. (2010)
Food item Number of nutrients ≥
5% of NNR
Nutrient density Greenhouse gas (GHG) emissions
Nutrient Density to Climate Impact (NDCI) index
Milk 9 53.8 99 0.54
Soft drink 0 0 109 0
Orange juice 4 17.2 61 0.28
Beer 0 0 101 0
Red wine 1 1.2 204 0.01
Mineral water 0 0 10 0
Soy drink 3 7.6 30 0.25
Oat drink 1 1.5 21 0.07
In a letter to the editor, Scarborough and Rayner (2010) expressed concern that the NDCI index
is flawed, as the ranking of the drinks produced by the index is dependent on an arbitrary choice
of threshold for contributing to the Nordic Nutrition Recommendations (NNR). When the
threshold is set at a value lower than 5% of the NNR, soy drink achieves the highest NDCI score.
Milk achieves the highest NDCI score when the threshold is set at 5 or 10% of the NNR. When
the threshold is set at 20% of the NNR, orange juice instead achieves the highest NDCI score.

84
In a recent study, van Dooren et al. (2017b) proposed a nutrient density index that considers the
GHG emissions associated with different foods. Based on the correlation between GHG
emissions and nutritional density, van Dooren et al. (2017b) devised a modified nutritional
index, the Sustainable Nutrient Rich Food (SNRF) index, where only the six most important
nutrients reflecting health and GHG emissions are included: plant protein, saturated fat,
essential fatty acids, sodium, fibre and added sugar. The authors claim that this modified index
reflects a much more relevant correlation between nutrition and environmental impact. It also
creates a foundation for classifying foods into three ‘traffic light’ categories, as shown in Fig. 5.3.
Fig. 5.3. Sustainable nutrient rich food (SNRF) index of different food groups, plotted as a function of greenhouse
gas emissions (GHGE). From van Dooren et al. (2017b).
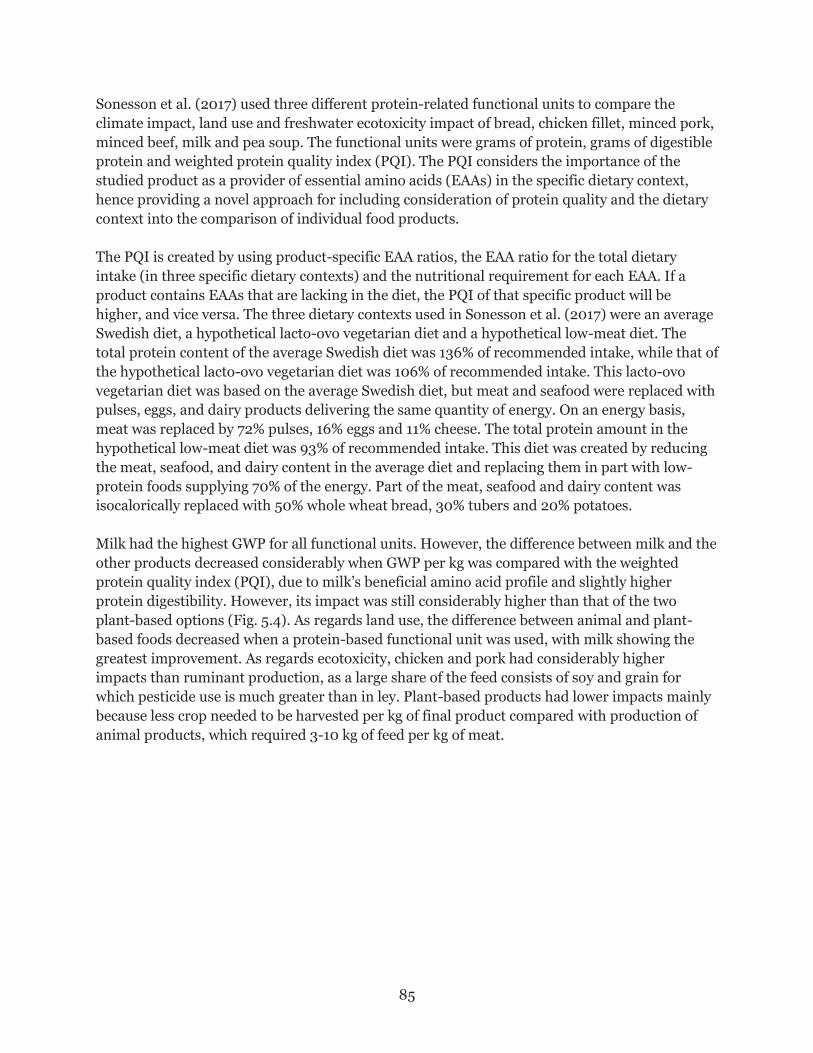
85
Sonesson et al. (2017) used three different protein-related functional units to compare the
climate impact, land use and freshwater ecotoxicity impact of bread, chicken fillet, minced pork,
minced beef, milk and pea soup. The functional units were grams of protein, grams of digestible
protein and weighted protein quality index (PQI). The PQI considers the importance of the
studied product as a provider of essential amino acids (EAAs) in the specific dietary context,
hence providing a novel approach for including consideration of protein quality and the dietary
context into the comparison of individual food products.
The PQI is created by using product-specific EAA ratios, the EAA ratio for the total dietary
intake (in three specific dietary contexts) and the nutritional requirement for each EAA. If a
product contains EAAs that are lacking in the diet, the PQI of that specific product will be
higher, and vice versa. The three dietary contexts used in Sonesson et al. (2017) were an average
Swedish diet, a hypothetical lacto-ovo vegetarian diet and a hypothetical low-meat diet. The
total protein content of the average Swedish diet was 136% of recommended intake, while that of
the hypothetical lacto-ovo vegetarian diet was 106% of recommended intake. This lacto-ovo
vegetarian diet was based on the average Swedish diet, but meat and seafood were replaced with
pulses, eggs, and dairy products delivering the same quantity of energy. On an energy basis,
meat was replaced by 72% pulses, 16% eggs and 11% cheese. The total protein amount in the
hypothetical low-meat diet was 93% of recommended intake. This diet was created by reducing
the meat, seafood, and dairy content in the average diet and replacing them in part with low-
protein foods supplying 70% of the energy. Part of the meat, seafood and dairy content was
isocalorically replaced with 50% whole wheat bread, 30% tubers and 20% potatoes.
Milk had the highest GWP for all functional units. However, the difference between milk and the
other products decreased considerably when GWP per kg was compared with the weighted
protein quality index (PQI), due to milk’s beneficial amino acid profile and slightly higher
protein digestibility. However, its impact was still considerably higher than that of the two
plant-based options (Fig. 5.4). As regards land use, the difference between animal and plant-
based foods decreased when a protein-based functional unit was used, with milk showing the
greatest improvement. As regards ecotoxicity, chicken and pork had considerably higher
impacts than ruminant production, as a large share of the feed consists of soy and grain for
which pesticide use is much greater than in ley. Plant-based products had lower impacts mainly
because less crop needed to be harvested per kg of final product compared with production of
animal products, which required 3-10 kg of feed per kg of meat.

86
Fig. 5.4. Global warming potential (GWP, top), land use (centre) and ecotoxicity (expressed as comparative toxic
units (CTU), bottom) impacts expressed in relation to three different protein-based functional units (g protein, g
digestible protein, kg PQI-weighted food), the latter for three dietary contexts (AD=average Swedish diet, LO=lacto-
ovo diet, LM=low-meat diet). Bread=100%. From Sonesson et al. (2017).

87
As mentioned in section 3.4, there are many design decisions that have to be taken into account
when creating nutrient density scores, including which nutrients to include (both nutrients to
encourage and nutrients to limit), how to weight nutrients (equally as in e.g. the Smedman et al.
(2010) study, or considering which nutrients that are a concern in a specific dietary context),
whether to cap nutrients for which the food item delivers amounts above recommendations and
which algorithm to use for aggregation.
Hence, nutrient density indices can be created in many different ways, which will strongly affect
the results (Saarinen et al., 2017). This is one of the limitations with using nutrient density
indices for comparing the nutritional quality of foods and diets. It is therefore very important
that studies using such scores show, using sensitivity analysis, how the results are affected by
the design of the index, which e.g. the Smedman et al. (2010) study failed to do. More elaborate
indices, e.g. the protein-related functional unit suggested by Sonesson et al. (2017), may provide
valuable information. However, the complexity of such indices makes them more difficult to
interpret. In terms of using nutrient density scores, Hallström et al. (2018) summarise the
following research needs: inclusion of a wider set of sustainability issues (e.g. biochemical flows
or freshwater use), including the dietary context, combining consumption and production
perspectives (e.g. distinguishing between different cultivation and livestock systems, as well as
process settings and preparation methods), including consumer and acceptability aspects,
distinction between populations, further refinement and validation of scores and the application
of methods in society.

88
5.2.2 Comparison in a diet context
Comparing foods on a per product basis has limited value for determining the health outcomes
or environmental impact of eating patterns, as it is the total impact of all foods in the diet that
determines final outcomes. Increasing numbers of studies have investigated the effect on
nutrient intakes, dietary quality and environmental impacts from dietary change, commonly
reducing the consumption of animal-based products and replacing it with plant-based foods.
The reviews by Hallström et al. (2015) (Fig. 5.5), Aleksandrowicz et al. (2016) (Fig. 5.6) and
González-García et al. (2018) provide good overviews of the results from such studies, which in
general show considerably lower climate impact and land use from vegetarian or vegan diets.
However, there are exceptions; Vieux et al. (2012) found that when some meats were replaced
by fruit and vegetables on an iso-caloric basis, no reduction or even an increase in GHG
emissions was observed, due to the large amounts of fruit and vegetables needed.
Fig. 5.5. Relative change (%) in greenhouse gas emissions (kg CO2e per year) brought about by different dietary
changes. From Hallström et al. (2015).

89
Fig. 5.6. Reduction in climate impact, land use and water use from transitioning a vegetarian diet (blue) and from a
vegan diet (green). Based on data from Aleksandrowicz et al. (2016).
Several different approaches for evaluating and designing more healthy and sustainable diets
exist (see Mertens et al. (2017) for an overview). Such studies can roughly be categorised into 1)
simulation studies, in which different pre-defined changes to diets are evaluated, e.g. a certain
reduction in meat consumption or adherence to a certain dietary pattern, and 2) optimisation
studies, in which mathematical methods are used to find a diet that meets several goals, typically
the fulfilment of nutritional recommendations and lowering of GHG emissions while keeping
diets as similar as possible to current diets. We summarise some interesting studies of each type
below.
90
Examples of simulation studies in which both meat and dairy are replaced by plant
based foods
Temme et al. (2013) evaluated how a 30% and 100% decrease in meat and dairy, randomly
replaced by the same amount (mass) of plant-based dairy and meat-replacing foods, affected
land use and nutrient intake of 398 Dutch women aged 19-30 years. Liquid dairy foods were
replaced by soy-based dairy alternatives and meat by a vegetarian meat substitute (43%, three
times weekly), egg (29%, twice weekly), pulses (14%, once weekly) or tofu/tempeh (14%, once
weekly), based on the proportion of these in the current consumption patterns in this group.
Animal-based sandwich toppings were replaced by a combination of peanut butter, chocolate
nut spread, jam and chocolate sprinkles, based on current consumption. This approach was
chosen in order to make the choice of replacement foods as realistic as possible. The results
showed that land use decreased from 3.7 to 1.8 m2 per day when all animal-based foods were
replaced, while for a 30% reduction land use was 3.1 m2 per day. Intake of saturated fatty acids
decreased considerably compared with the current consumption in this group (making three
times the number of women meet the recommendations), and total iron increased by 2.5 mg per
day for 100% replacement and 0.7 mg per day for 30% replacement (from the average 9.5 mg
per day in typical current consumption), although most iron was in less bioavailable form. The
authors comment on this as follows:
“At baseline, however, about 10 % of the total Fe intake was haem-Fe, whereas in the 100 % scenario all
Fe was non-haem. This might be a concern since it is known that non haem-Fe is absorbed less
efficiently than haem-Fe. On the other hand, Fe absorption is tightly regulated by Fe status and body
storage; if Fe storage is depleted, more Fe is absorbed. Cross-sectional studies suggest that vegetarian
women have similar or even higher Fe intakes and similar Hb concentrations than meat-consuming
women.”
Temme et al. (2015) repeated the evaluation for children and concluded that partial replacement
(30%) of meat and dairy by plant-based foods is beneficial for children’s health, as intake of
saturated fatty acids is lowered, fibre intake is increased and intake of micronutrients is similar.
When all animal-based products are replaced, attention is needed to ensure adequate intake of
thiamin, vitamin B12 and zinc. The proportion of girls (4-6 years old) with intake below the
recommendation was 15% for thiamin, 10% for vitamin B12 and 6% for zinc. A similar study was
conducted on Dutch adults (Seves et al., 2017), with similar results (Table 5.10).

91
Table 5.10. Summary of studies by Temme et al. (2013, 2015) and Seves et al. (2017) in which nutrient intake, land
use and greenhouse gas (GHG) emissions (except Temme et al., 2013) were studied for two dietary scenarios: meat
and dairy reduced by either 30% or 100%, and replaced with plant-based foods including fortified plant-based meat
and ‘dairy imitates’. SFA = saturated fatty acids, Fe = iron, Ca = calcium, Zn = zinc
Subjects Studied outcomes Results for 30% reduction in meat and dairy
Results for 100% reduction in meat and dairy
Temme et al. (2013) 398 Dutch women
aged 19-30 years
SFA and Fe intakes Land use
SFA down 8% Fe up 7% Land use down 19%.
SFA down 30% Fe up 26% Land use down 51%.
Temme et al. (2015) 1279 Dutch children aged 2-6 years
Nutrient intakes (energy, protein, SFA, fibre, Ca, Fe, Zn, vitamin B12, thiamin) Land use and GHG emissions for meat and dairy and plant-based replacements only
SFA down 9% Fibre up 8% Similar micronutrient content except for B12
SFA down 26% Fibre up 29% Ca, Zn and thiamin down by 5-13%, and vitamin B12 down by 49%. Total Fe up.
Seves et al. (2017) 2012 Dutch adults aged 19-69 years
Nutrient intakes (energy, protein, SFA, monodisacc., fibre, Na, Ca, Fe, Zn, vitamin A, B12 and D, thiamin and riboflavin) Land use GHG emissions
Beneficial for SFA, Na, fibre and vitamin D intakes, neutral for other nutrients. Land use down 14%. GHG emissions down 14%.
SFA down ~35% NA down ~8% Fibre, Fe and vitamin D increased. Zn, thiamin, vitamins A and B12, and probably Ca, were below recommendations. Land use down 41., GHG emissions down 47%.
Examples of studies using optimisation techniques to design more sustainable diets
A recent study worth highlighting is that by Vieux et al. (2018), in which observed diets from five
countries (France, UK, Sweden, Italy and Finland) were optimised using linear programming
(see section 4.5), with the aim of reducing diet-related GHG emissions while at the same time
ensuring nutrient adequacy. One of restrictions initially applied was that total weight of
modelled diets could vary between 120% and 80% of the original total weight. When just
adjusting diets to achieve nutrient adequacy by replacing items in the category sugar/fat/alcohol
with foods from the fruit and vegetables and starchy foods groups, the GHG emissions of the
diets increased. Once nutrient adequacy was achieved, stepwise reductions in GHG emissions
were modelled (in 10% increments). At 30% reduction, energy coming from dairy products
increased for both men and women in Sweden and France, and it increased in men, but
decreased in women, in Finland, Italy and the UK. The dairy group also contained ‘dairy
imitates’, but these only constituted a minor part of the consumption. It is unclear why these did
not make up a larger part of the diet, but one possible explanation could be that their sugar
content made them a less optimal product.
Kramer et al. (2017) used linear programming to optimise diets for Dutch men and women (9-
69 years old) based on minimal changes to diets, meeting nutritional constraints and stepwise
lowering of environmental impacts (GHG emissions, fossil energy use and land occupation -
accounting for approximately 90% of the total ReCiPe score in food products). Fortified soy
drink, legumes and fortified meat replacers were included as alternatives to animal-based
products. Grams consumed was used as a proxy for popularity; foods for which consumption is
high were given a higher penalty for decreased consumption. Fig. 5.7 shows how the amount of

92
different food groups changed for Dutch men as the requirements for environmental impact
gradually decreased and how the penalty score increased. At the ‘critical point’ in terms of the
penalty score, the consumption of dairy products was relatively unchanged, but the intake of
meat decreased.
Fig. 5.7. Amounts of food groups and penalty score of different environmental impacts (pReCiPe points) for diets for
Dutch men aged 31-50 years. From Kramer et al. (2017).
Studies specifically investigating replacement of dairy
To our knowledge, only a few studies have specifically investigated the effects of substituting
dairy partially or completely with plant-based dairy alternatives in a dietary context, i.e. without
also reducing meat intake. These include studies by Werner et al. (2014), van Dooren et al.
(2014) and Blonk Consultants (2015), as summarised below.
Werner et al. (2014) specifically aimed at investigating the role of dairy in diets in terms of
nutritional value and GHG emissions. The starting point was a constructed baseline diet which
was in agreement with the Danish dietary guidelines, using foods included in the Danish
national dietary survey. For example, to be in line with the Danish recommendations, a fruit and
vegetable intake of 600 g was set where 100 g of fruit were taken to comprise 45.3 g apple, 15.6 g
pear, 16.4 g orange and 22.7 g banana, reflecting the average fruit intake of the population. The
baseline diet included 349.5 g of dairy. Eight dietary scenarios, with different quantities of dairy
products in each, were designed, all with the same energy content. Three diet scenarios excluded

93
dairy entirely, one including instead unfortified soy drink instead of milk, one including soft
drinks instead of milk and marmalade instead of cheese and the third was a vegan diets in which
soy drink and beans replaced animal products. Naturally, the nutritional outcome of the
scenario with soft drink and marmalade replacing dairy products was negative and GHG
emissions were not decreased. The diet in which soy drink replaced dairy lowered GHG
emissions by approximately 20% and the vegan diet lowered them by nearly 50%. Added sugar
was above recommendations for the diet in which soy drink was used, while for the vegan diet
fat content was below the recommendation. As regards micronutrients, both the soy drink and
the vegan diet were below the recommendation for vitamin D (as was the baseline diet) and the
soy drink was also below the recommendation for iron (as was the baseline diet). Both the soy
drink and the vegan diet were below the recommendations for calcium, iodine and selenium.
van Dooren et al. (2014) investigated the GHG emissions, land use and nutritional quality of
diets using 10 different indicators: the amount of fruit and vegetables, total fatty acids, trans-fat,
saturated fatty acids, fibre, sugar, salt, fish and the energy content. They applied these to six
different diets; current average Dutch, official ’recommended’ Dutch, semi-vegetarian,
vegetarian, vegan and Mediterranean. In the vegan diet, milk was replaced with calcium-
enriched soy drink and meat with pulses, nuts and ready-to-eat meat substitutes (e.g. tofu) and
vegetables rich in calcium. The authors highlight that for the vegan diet, products fortified with
B12, vitamin D and calcium should be chosen. The Mediterranean diet scored the highest in
terms of nutritional quality (122), closely followed by the vegan diet (118), the recommended
diet (105), the semi-vegetarian diet (103), the vegetarian diet (100) and the current average
Dutch diet (75). The vegan diet scored higher than the vegetarian diet for all nutrition
indicators. The GHG emissions of the vegan diet were the lowest of all diets, at 2.7 kg CO2e per
day, which was 34% lower than for the current average diet, while the value for the vegetarian
diet was 3.2 kg CO2e per day (22% lower than for the average Dutch diet).
Blonk Consultants (2015) found little or no environmental benefit in terms of GHG emissions
and land use of replacing dairy products with non-dairy foods when using the Optimeal®
optimisation program to perform the analysis, while the outcome for meat was significantly
different. Optimeal® was used to help investigate sustainable and healthy diets. The starting
point was a full diet including a certain amount of dairy. The amount of dairy was varied in steps
of 100 g of milk per day (starting from 0 g and going up to 1 kg) and replaced by other foods
including vegetables, nuts, fortified soy drinks, eggs and fish. As the amounts of dairy products
increased compared with the current diet, the amounts of meat, eggs and nuts were reduced and
the amounts of pulses, vegetables and fruit were increased (Meike van de Wouw, Blonk
Consultants, personal communication 2018). As the environmental impact of the diet at each
optimisation step did not vary greatly, the authors concluded that replacing dairy products with
alternative products had little effect on the GHG emissions.
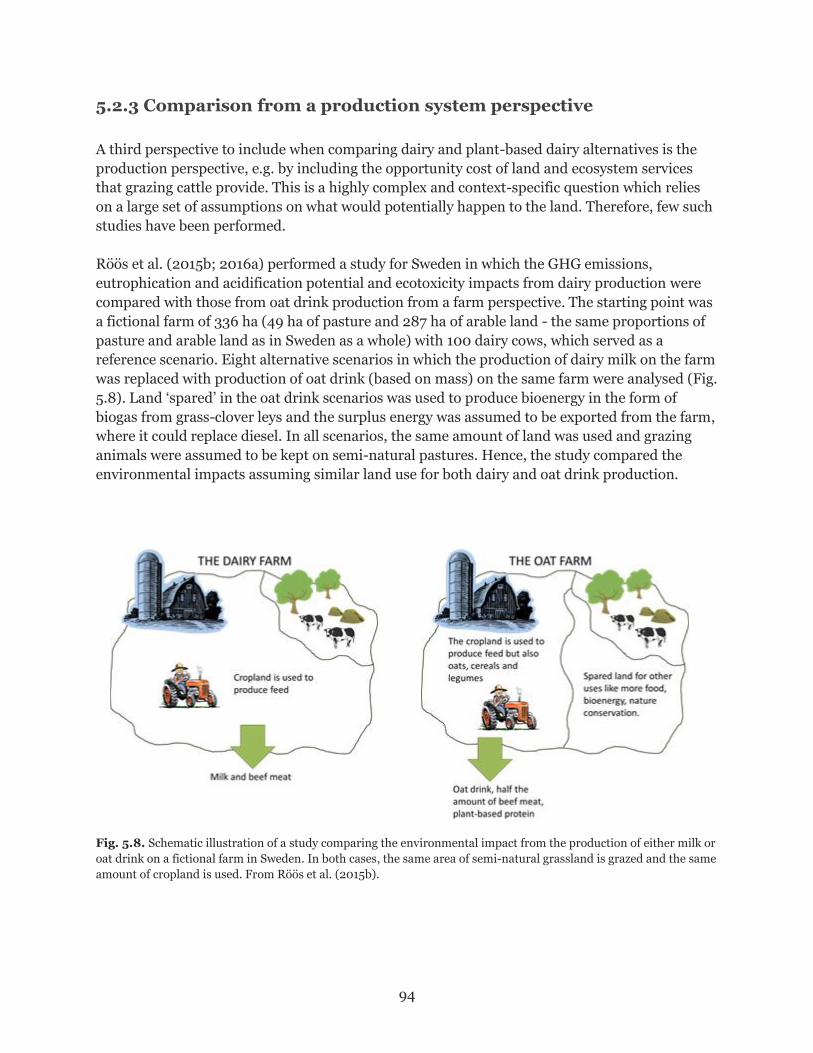
94
5.2.3 Comparison from a production system perspective
A third perspective to include when comparing dairy and plant-based dairy alternatives is the
production perspective, e.g. by including the opportunity cost of land and ecosystem services
that grazing cattle provide. This is a highly complex and context-specific question which relies
on a large set of assumptions on what would potentially happen to the land. Therefore, few such
studies have been performed.
Röös et al. (2015b; 2016a) performed a study for Sweden in which the GHG emissions,
eutrophication and acidification potential and ecotoxicity impacts from dairy production were
compared with those from oat drink production from a farm perspective. The starting point was
a fictional farm of 336 ha (49 ha of pasture and 287 ha of arable land - the same proportions of
pasture and arable land as in Sweden as a whole) with 100 dairy cows, which served as a
reference scenario. Eight alternative scenarios in which the production of dairy milk on the farm
was replaced with production of oat drink (based on mass) on the same farm were analysed (Fig.
5.8). Land ‘spared’ in the oat drink scenarios was used to produce bioenergy in the form of
biogas from grass-clover leys and the surplus energy was assumed to be exported from the farm,
where it could replace diesel. In all scenarios, the same amount of land was used and grazing
animals were assumed to be kept on semi-natural pastures. Hence, the study compared the
environmental impacts assuming similar land use for both dairy and oat drink production.
Fig. 5.8. Schematic illustration of a study comparing the environmental impact from the production of either milk or
oat drink on a fictional farm in Sweden. In both cases, the same area of semi-natural grassland is grazed and the same
amount of cropland is used. From Röös et al. (2015b).

95
In scenario 1, the beef produced in the reference scenario from the dairy cows and their
offspring was replaced with beef from suckler herds. In scenario 2, dairy beef was replaced with
chicken and in scenario 3 with a combination of cereals and grain legumes. In scenario 4, a
combination of dairy milk, oat drink, beef meat and vegetable protein was produced. The other
four scenarios (HP1, HP2, HP3 and HP4) corresponded to scenarios 1-4, with the only
difference being that additional plant protein in the form of cereals and grain legumes was
grown on the farm, so that it produced as much total protein as in the reference scenario.
The results showed that the climate impact was lower for all eight alternative scenarios
compared with the reference scenario, due in particular to reduced methane emissions from
ruminants (Fig. 5.9, left). When the substitution effect of biogas replacing diesel in society at
large was considered, the benefit to the climate from producing oat drink instead of milk was
substantial. Even in scenarios producing the same amount of beef as in the reference case
(scenarios 1 and HP1), the GHG emissions were lower due to lower methane emissions from
suckler cows compared with dairy cows and less need for feed. However, the eutrophication
potential was somewhat higher in the oat drink scenarios and the acidification potential was
substantially higher in scenarios 1-4. This was a consequence of the higher amounts of spared
land in these scenarios, which gave more biogas production and in turn more nitrogen-rich
digestate as a by-product from this production. Handling of digestate can result in considerable
ammonia losses during storage and spreading. The substitution effect of biogas replacing diesel
in society was found to be very small for eutrophication and acidification potential, since it was
assumed that emissions of eutrophying and acidifying substances were about the same for
biogas and diesel.
Fig. 5.9 Impacts on climate change and eutrophication of a Swedish dairy farm and of eight different scenarios
producing oat drink instead of dairy milk on the farm. In all scenarios, the same amount of semi-natural pasture was
grazed and the same amount of arable land was used. From Röös et al. (2016b).

96
6. Conclusions and further research
needs Assessing the sustainability of diets is highly complex, due to the multitude of issues that can be
considered crucial for the sustainability of human eating habits and food systems (health,
different environmental and social issues, use of antibiotics, animal welfare etc.). Individual
research fields have supplied knowledge about parts of this complex picture. For example, the
field of diet-related health research is vast and has identified overarching principles of healthy
eating that most researchers agree upon (diet with plant-based foods, limited intake of salt,
sugars and red and processed meat, use of whole grain and unsaturated fats, use of low-fat
dairy). Studies on the environmental impact of food have shown that animal-based products in
general have higher negative impacts than plant-based foods. Research on animal welfare has
provided knowledge on how different production systems affect animal health and wellbeing,
and so on. However, these guiding principles have to be broken down even further to be
applicable in answering questions on the appropriateness of different diets for different groups
and have to handled alongside aspects such as diet acceptability and what can realistically be
changed. Promising initial attempts have been made to gather several aspects of sustainable
diets into indicator-based frameworks, in order to provide a way to consider a multitude of
issues and their trade-offs in different types of decision making. Much more work is needed in
this area to make indicators and frameworks for assessing the sustainability of diets more
robust, transparent, relevant and useful. To enable constructive discussions and sound decision
making, such frameworks has to, as far as possible, show what are scientific ‘facts’ and what are
normative decisions (choice of indicators, thresholds and weighting methods). Complexity will
inevitably rise with the number of issues included, so trade-offs between comprehensiveness
and comprehension have to be managed.
As regards the role of dairy products and plant-based dairy alternatives in sustainable diets,
research shows some clear positive health effects for dairy products and for fortified soy-based
products. For other plant-based dairy alternatives, there is little or no literature on their long-
term health effects (although there has been some research on the raw material used for some
products, e.g. oats). Hence, epidemiological studies on these products are urgently needed.
However, it will take a long time before there is any solid evidence on this, as consumption of
these products has only begun recently, and therefore information on consumption of these
products is not available in existing cohorts. Unfortunately, there is no time to await such
evidence, as environmental issues need urgent attention.
Regarding the environmental impacts of dairy products and their plant-based alternatives, the
current literature indicates that the climate impact of dairy milk from Western industrialised
systems (a little over 1 kg CO2e per kg milk on average, but with large variation) is twice or three
times higher than for plant-based drinks. However, this comparison rests on somewhat shaky
grounds, as existing studies on plant-based alternatives are not peer-reviewed and as different
studies have used different methodological choices (e.g. in terms of allocation methods). In
order to draw solid conclusions and better understand the drivers behind differences in carbon

97
footprint, dairy and plant-based drinks should be compared within the same study, using the
same methodological choices and applying comprehensive sensitivity analysis. For other
environmental impacts, the data are very limited. The few studies that exist (on water use,
ecotoxicity, nitrogen footprint, eutrophication and acidification potential and negative
biodiversity impacts) indicate higher impact for milk than for most plant-based dairy
alternatives, but the data are too limited to allow any general conclusions to be drawn on the
average magnitude of the differences and the impacts are also highly site- and context-specific.
An important exception to the higher negative impacts of dairy milk is the positive contribution
of grazing animals to some semi-natural pastures, which promotes biodiversity conservation in
those sites, contributes to landscape aesthetics and acknowledges the ability of animals,
especially ruminants, to upgrade low-value biomass streams into nutritious foods for humans,
an aspect that conventional LCA studies have not been able to capture.
Comparisons on a per kg basis might give different results if the health effects of the different
products were taken into account. To date, this has been done only in a few studies and using
nutrient density indices, which inevitably involves a range of normative decisions that strongly
influence the results. More research is needed in this area, applying different nutrient indices to
a range of plant-based dairy alternatives in order to evaluate whether a general pattern can be
distinguished or whether the results are dependent on the design of the nutrient index. If plant-
based alternatives are fortified to resemble dairy milk, they score very similarly to dairy milk in
terms of the nutrient density, and the environmental advantage of plant-based alternatives will
remain. However, it is unclear whether the nutrient content reached by fortification is ‘the same’
as ‘natural’ occurrence of nutrients in the diet. This is another question in need of more
discussion and investigation. In addition, ways are needed to include health effects, rather than
nutritional content, in this comparison, including bioavailability, the ‘matrix-effect’, nutrient
interactions and presence of active compounds.
Ultimately, comparing products on a product-by-product basis, whether per kg product or using
nutrient profiling provides, only provides limited information, as the nutritional benefit depends
on the diet in which the product is placed and the total environmental impact of the product
depends on how much of the product is included in the diet and how the substitution affects
other food categories. The limited existing research on replacement of dairy products with
different types of plant-based dairy alternatives indicates that the benefits of these products are
context-specific. More modelling studies are needed to test a broad set of consequences of
including either dairy products or a range of different plant-based alternatives, or combinations
of these, in different dietary contexts for different types of consumers. To make these as relevant
as possible, more research is needed on how people actually, rather than potentially, change
their eating patterns when aiming for a less environmentally damaging and healthier diet.
Finally, what people eat naturally affects what is produced, which in turn affects landscapes and
rural societies. Such socio-economic effects are highly challenging to capture in conventional
indicators, and therefore methodologies that enable inclusion of socio-economic issues also
need to be developed.
98
References Abargouei AS, Janghorbani M, Salehi-Marzijarani M, Esmaillzadeh A (2012) Effect of dairy consumption
on weight and body composition in adults: a systematic review and meta-analysis of randomized
controlled clinical trials. Int J Obes 36(12):1485–93.
Agarski B, Budak I, Vukelic D, Hodolic J (2016) Fuzzy multi-criteria-based impact category weighting in
life cycle assessment. Journal of Cleaner Production 112:3256–66.
Ahlroth S (2014) The use of valuation and weighting sets in environmental impact assessment. Resour
Conserv Recycl. 85:34–41.
Ahlroth S, Nilsson M, Finnveden G, Hjelm O, Hochschorner E (2011) Weighting and valuation in selected
environmental systems analysis tools – suggestions for further developments. Journal of Cleaner
Production 19(2–3):145–56.
Aleksandrowicz L, Green R, Joy EJM, Smith P, Haines A (2016) The Impacts of Dietary Change on
Greenhouse Gas Emissions, Land Use, Water Use, and Health: A Systematic Review. PLoS ONE
11(11): e0165797. doi: 10.1371/journal.pone.0165797
Alexander DD, Bylsma LC, Vargas AJ, Cohen SS, Doucette A, Mohamed M et al (2016) Dairy consumption
and CVD: a systematic review and meta-analysis. Br J Nutr 115(4),737–50.
Applegate C, Rowles J, Ranard K, Jeon S, Erdman J (2018) Soy Consumption and the Risk of Prostate
Cancer: An Updated Systematic Review and Meta-Analysis. Nutrients 10(1),40.
Arsenault JE, Fulgoni V, Hersey JC, Muth MK (2012) A novel approach to selecting and weighting
nutrients for nutrient profiling of foods and diets. Journal of the Academy of Nutrition and Dietetics
112, 1968-1975.
Auestad N, Fulgoni VL (2015) What current literature tells us about sustainable diets: emerging research
linking dietary patterns, environmental sustainability, and economics. Adv Nutr 6(1):19-36. doi:
10.3945/an.114.005694
Aune D, Lau R, Chan DSM, Vieira R, Greenwood DC, Kampman E, et al. (2012) Dairy products and
colorectal cancer risk: a systematic review and meta-analysis of cohort studies. Ann Oncol Off J Eur
Soc Med Oncol 23(1), 37–45.
Aune D, Navarro Rosenblatt DA, Chan DSM, Vieira AR, Vieira R, Greenwood DC, et al. (2015) Dairy
products, calcium, and prostate cancer risk: a systematic review and meta-analysis of cohort studies.
Am J Clin Nutr 101(1), 87–117.
Aune D, Norat T, Romundstad P, Vatten LJ (2013) Dairy products and the risk of type 2 diabetes: a
systematic review and dose-response meta-analysis of cohort studies. Am J Clin Nutr 98(4),1066–
83.
Bajželj B, Richards KS, Allwood JM, Smith P, Dennis JS (2014) The importance of food demand
management for climate mitigation. Nature Climate Change 4(10), 924-929.
Balmford A, Green R, Phalan B (2015) Land for food and land for nature? Daedalus 144(4): 57–75.
Barré T, Perignon M, Gazan R, Vieux F, Micard V, Amiot M-J, et al. (2018) Integrating nutrient
bioavailability and co-production links when identifying sustainable diets: How low should we
reduce meat consumption? PLoS ONE 13(2): e0191767.
BCFN (2017) Fixing food - towards a more sustainable food system (2017). Barilla Center for Food and
Nutrition. https://www.barillacfn.com/en/food_sustainability_index/
Behrens P, Kiefte-de Jong JC, Bosker T, Rodrigues JFD, de Koning A, Tukker A (2017). Evaluating the
environmental impacts of dietary recommendations. Proc Natl Acad Sci 114(51):13412–7.
Bengtsson J, Ahnström J, Weibull AC (2005) The effects of organic agriculture on biodiversity and
abundance: A meta-analysis. Journal of Applied Ecology, 42(2), 261-269.
Bian S, Hu J, Zhang K, Wang Y, Yu M, Ma J (2018) Dairy product consumption and risk of hip fracture: a
systematic review and meta-analysis. BMC Public Health 18.

99
Bienvenido OJ (1998) Rice in human nutrition. International Rice Research Institute and Food and
Agriculture Organization of the United Nations, Rome, Italy.
http://www.fao.org/docrep/t0567e/T0567E00.htm#Contents
Blonk Consultants (2015) Environmental impact of dairy substitution.
http://www.nzo.nl/sites/default/files/page/attachment/environmental_impact_of_dairy_substitution_
brochure_nzo.pdf
Bolland MJ, Grey A, Reid IR (2013) Calcium supplements and cardiovascular risk: 5 years on. Ther Adv
Drug Saf 4(5), 199–210.
Brink EJ, Postma-Smeets A, Stafleu A, Wolvers D (2017) The Wheel of Five. Fact sheet. Netherlands
Nutrition Centre.
https://mobiel.voedingscentrum.nl/Assets/Uploads/voedingscentrum/Documents/Professionals/Pe
rs/Factsheets/English/Fact%20sheet%20The%20Wheel%20of%20Five.pdf
Bryngelsson D, Wirsenius S, Hedenus F, Sonesson U (2016) How can the EU climate targets be met? A
combined analysis of technological and demand-side changes in food and agriculture. Food Policy
59, 152-164. doi: 10.1016/j.foodpol.2015.12.012
Cederberg C, Stadig M (2003) System Expansion and Allocation in Life Cycle Assessment of Milk and
Beef Production. International Journal of Life Cycle Assessment 8(6), 350-356.
Cederberg C, Sonesson U, Henriksson M, Sund V, Davis J (2009) Greenhouse gas emissions from
Swedish production of meat, milk and eggs 1990 and 2005. SIK, Gothenburg, Sweden.
Chaudhary A, Kastner T (2016) Land use biodiversity impacts embodied in international food trade.
Global Environmental Change 38, 195–204.
Chaudhary A, Gustafson D, Mathys A (2018) Multi-indicator sustainability assessment of global food
systems. Nature Communications, 9(1), 848. doi:10.1038/s41467-018-03308-7
Chen J, Raymond K (2008) Beta-glucans in the treatment of diabetes and associated cardiovascular risks.
Vasc Health Risk Manag 4(6):1265–72.
Chen GC, Szeto IMY, Chen LH, Han SF, Li YJ, van Hekezen R et al (2015) Dairy products consumption
and metabolic syndrome in adults: systematic review and meta-analysis of observational studies. Sci
Rep 5:14606.
Cheng I-C, Shang H-F, Lin T-F, Wang T-H, Lin H-S, Lin S-H (2005) Effect of fermented soy milk on the
intestinal bacterial ecosystem. World J Gastroenterol 11(8),1225–7.
Clune S, Crossin E, Verghese K (2017) Systematic review of greenhouse gas emissions for different fresh
food categories. Journal of Cleaner Production 140, 766–83.
de Beer H (2012) Dairy products and physical stature: a systematic review and meta-analysis of controlled
trials. Econ Hum Biol 10(3), 299–309.
de Goede J, Geleijnse JM, Ding EL, Soedamah-Muthu SS (2015) Effect of cheese consumption on blood
lipids: a systematic review and meta-analysis of randomized controlled trials. Nutr Rev 73(5), 259–
75.
de Goede J, Soedamah-Muthu SS, Pan A, Gijsbers L, Geleijnse JM (2016) Dairy Consumption and Risk of
Stroke: A Systematic Review and Updated Dose-Response Meta-Analysis of Prospective Cohort
Studies. J Am Heart Assoc 20, 5(5).
DeSalvo KB, Fan VS, McDonell MB, Fihn SD (2005) Predicting Mortality and Healthcare Utilization with
a Single Question. Health Serv Res 40(4), 1234–46.
Dong J-Y, Zhang L, He K, Qin L-Q (2011a). Dairy consumption and risk of breast cancer: a meta-analysis
of prospective cohort studies. Breast Cancer Res Treat 127(1), 23–31.
Dong J-Y, Qin L-Q (2011) Soy isoflavones consumption and risk of breast cancer incidence or recurrence:
a meta-analysis of prospective studies. Breast Cancer Res Treat 125(2);315–23.
Donini LM, Dernini S, Lairon D, Serra-Majem L, Amiot MJ, del Balzo V, Berry EM et al. (2016) A Consensus
Proposal for Nutritional Indicators to Assess the Sustainability of a Healthy Diet: The Mediterranean
Diet as a Case Study. Frontiers in Nutrition 3, 37. doi:10.3389/fnut.2016.00037

100
Dougkas A, Reynolds CK, Givens ID, Elwood PC, Minihane AM (2011) Associations between dairy
consumption and body weight: a review of the evidence and underlying mechanisms. Nutr Res Rev
24(1), 72–95.
Downs SM, Payne A, Fanzo J (2017) The development and application of a sustainable diets framework for
policy analysis: A case study of Nepal. Food Policy 70, 40-49. doi: 10.1016/j.foodpol.2017.05.005
Drewnowski A (2009) Defining nutrient density: development and validation of the nutrient rich foods
index. The Journal of the American College of Nutrition, 28, pp. 421S–426S.
Drewnowski A, Fulgoni VL (2014) Nutrient Density: Principles and Evaluation Tools. American Journal of
Clinical Nutrition, 99 (5), 1223S-1228S
Dror DK (2014) Dairy consumption and pre-school, school-age and adolescent obesity in developed
countries: a systematic review and meta-analysis. Obes Rev Off J Int Assoc Study Obes15(6),516–27.
Drouin-Chartier J-P, Brassard D, Tessier-Grenier M, Côté JA, Labonté M-È, Desroches S, et al. (2016)
Systematic Review of the Association between Dairy Product Consumption and Risk of
Cardiovascular-Related Clinical Outcomes. Adv Nutr Bethesda Md 7(6),1026–40.
EFSA (2012) Scientific Opinion on Dietary Reference Values for protein. EFSA Panel on Dietetic Products,
Nutrition and Allergies (NDA). doi: 10.2903/j.efsa.2012.2557
Ercin AE, Aldaya MM, Hoekstra AY (2012) The water footprint of soy milk and soy burger and equivalent
animal products. Ecological Indicators 18, 392-402. doi: 10.1016/j.ecolind.2011.12.009
FAO and BI (2010) Sustainable Diets and Biodiversity, Directions and solutions for policy, research and
action. Burlingame, B.; Dernini, S.(eds.). Food and Agriculture Organization of the United Nations and
Biodiversity International, Rome, Italy.
FAO (2012) The assessment of amino acid digestibility in foods for humans and including a collation of
published ileal amino acid digestibility data for human foods.Food and Agriculture Organization of
the United Nations, Rome, Italy.
FAO (2013) Dietary protein quality evaluation in human nutrition Report of an FAO Expert Consultation.
Food and Agriculture Organization of the United Nations, Rome, Italy.
FAO (2014) Sustainability Assessment of Food and Agriculture systems (SAFA). Guidelines. Version 3.0.
Food and Agriculture Organization of the United Nations, Rome, Italy.
FAO (2017a) World hunger statistics. Food and Agriculture Organization of the United Nations, Rome, Italy.
Link: http://www.fao.org/state-of-food-security-nutrition/en/
FAO (2017b) Food and agriculture. Driving action across the 2030 Agenda for Sustainable development.
Food and Agriculture Organization of the United Nations, Rome, Italy. http://www.fao.org/3/a-
i7454e.pdf
FAO (2018) FAOSTAT. Food and Agriculture Organization of the United Nations, Rome, Italy.
http://www.fao.org/faostat/en/#home
FAO and WHO (2007) Protein and amino acid requirements in human nutrition: report of a joint
WHO/FAO/UNU Expert Consultation, Geneva, Switzerland.
Feraldi R, Huff M, Molen AM, New H (2012) Life Cycle Assessment of Coconut Milk and Two Non-Dairy
Milk Beverage Alternatives. LCA XII. Tacoma, American Center for Life Cycle Assessment 23.
FIHL (2017) FOOD TRIANGLE: Healthy and sustainable eating with the Food Triangle.
https://www.gezondleven.be/files/voeding/Healthy-Living-2017-Food-Triangle.pdf
Florén B, Nilsson K, Wallman M (2013) LCA på färsk och aseptisk havredryck. Confidential report. SIK,
Gothenburg, Sweden.
Flysjö A, Cederberg C, Henriksson M, Ledgard S (2011) How does co-product handling affect the carbon
footprint of milk? Case study of milk production in New Zealand and Sweden. International Journal
of Life Cycle Assessment 16(5), 420-430.
FOOD SCP RT (2013) ENVIFOOD Protocol, Environmental Assessment of Food and Drink Protocol,
European Food Sustainable Consumption and Production Round Table (SCP RT), Working Group 1.
Food SCP Round Table. Brussels, Belgium.

101
Forouzanfar et al. (2015) Global, regional, and national comparative risk assessment of 79 behavioural,
environmental and occupational, and metabolic risks or clusters of risks in 188 countries, 1990–
2013: a systematic analysis for the Global Burden of Disease Study 2013. Lancet 5;386
(10010):2287–323.
Foster-Powell K, Holt S, Brand-Miller JC (2002) International table of glycemic index and glycemic load
values: 2002. Am J Clin Nutr 76:5–56.
Fournier LR, Ryan Borchers TA, Robison LM, Wiediger M, Park JS, Chew BP, et al (2007) The effects of soy
milk and isoflavone supplements on cognitive performance in healthy, postmenopausal women. J
Nutr Health Aging 11(2),155–64.
Garnett T (2014) What is a sustainable healthy diet? A discussion paper. Food climate research network,
University of Oxford, Oxford, UK.
Garnett T (2015) Gut feelings and possible tomorrows: (where) does animal farming fit? Food Climate
Research Network, University of Oxford, Oxford, UK.
Garnett T, Godde C, Muller A, Röös E, Smith P, de Boer I, zu Ermgassen E, Herrero M, van Middelaar C,
Schader C, van Zanten H (2017) Grazed and confused? Ruminating on cattle, grazing systems,
methane, nitrous oxide, the soil carbon sequestration question – and what it all means for
greenhouse gas emissions. Food Climate Research Network, University of Oxford, Oxford, UK.
Gasparatos A, El-Haram M, Horner M (2008) A critical review of reductionist approaches for assessing the
progress towards sustainability. Environmental Impact Assessment Review 28(4–5), 286-311.
doi:10.1016/j.eiar.2007.09.002
Gazan R, Barré T, Perignon M, Maillot M, Darmon N, Vieux F (2018a) A methodology to compile food
metrics related to diet sustainability into a single food database: Application to the French case. Food
Chemistry 238, 125-133. doi: 10.1016/j.foodchem.2016.11.083
Gazan R, Brouzes C, Vieux F, Maillot M, Lluch A, Darmon N (2018b) Mathematical optimization to explore
tomorrow’s sustainable diets: a narrative review. Advances in Nutrition. In press.
Genkinger JM, Wang M, Li R, Albanes D, Anderson KE, Bernstein L, et al. (2014) Dairy products and
pancreatic cancer risk: a pooled analysis of 14 cohort studies. Ann Oncol Off J Eur Soc Med Oncol
25(6), 1106–15.
Gerber P, Steinfeld H, Henderson B, Mottet A, Opio C, Dijkman J, Falcucci A, Tempio G (2013) Tackling
climate change through livestock: a global assessment of emissions and mitigation opportunities.
Food and Agriculture Organization of the United Nations, Rome, Italy..
Gibson RS (2005) Principles of Nutritional Assessment. Oxford University Press, Oxford, UK.
Gijsbers L, Ding EL, Malik VS, de Goede J, Geleijnse JM, Soedamah-Muthu SS (2016) Consumption of dairy
foods and diabetes incidence: a dose-response meta-analysis of observational studies. Am J Clin Nutr
103(4),1111–24.
Gonzales-Fisher C, Garnett T (2016) Plates, pyramids and planets. Developments in national healthy and
sustainable dietary guidelines: a state of play assessment. FAO and Food Climate Research Network,
Oxford University, Oxford, UK.
González-García S, Esteve-Llorens X, Moreira MT, Feijoo G (2018) Carbon footprint and nutritional quality
of different human dietary choices. Science of the Total Environment 644, 77-94.
Goossens Y, Tavernier J, Geeraerd A (2016) 18. A sense of planetary urgency: an environmental index for an
informed food choice. Food futures: ethics, science and culture 127-132. doi:10.3920/978-90-8686-
834-6
Gordon LJ, Bignet V, Crona B, Henriksson PJG, Van Holt T, Jonell M, et al. (2017) Rewiring food systems to
enhance human health and biosphere stewardship. Environmental Research Letters 1;12(10):100201.
Greenpeace (2018) LESS IS MORE Scientific background on the Greenpeace vision of the meat and dairy
system towards 2050. https://storage.googleapis.com/p4-production-content/international/wp-
content/uploads/2018/03/698c4c4a-summary_greenpeace-livestock-vision-towards-2050.pdf

102
Guo Y, Shan Z, Ren H, Chen W (2015) Dairy consumption and gastric cancer risk: a meta-analysis of
epidemiological studies. Nutr Cancer 67(4), 555–68.
Gustafson D, Gutman A, Leet W, Drewnowski A, Fanzo J, Ingram J (2016) Seven Food System Metrics of
Sustainable Nutrition Security. Sustainability 8(3):196.
Guyonnet D, Chassany O, Picard C, Guillemin I, Meunier J, Seignobos E, et al. (2008). Perceived subject
outcomes and impact on health-related quality of life associated with diet using the new Food
Benefits Assessment (FBA©) questionnaire: development and psychometric validation. Public
Health Nutrition 11(11).
Hallström E, Carlsson-Kanyama A, Börjesson P (2015) Environmental impact of dietary change: a systematic
review. Journal of Cleaner Production 91:1–11.
Hallström E, Davis J, Woodhouse A, Sonesson U (2018) Using dietary quality scores to assess sustainability
of food products and human diets: A systematic review. Ecological Indicators 93, 219-230.
doi:10.1016/j.ecolind.2018.04.071 Harland JI, Haffner TA (2008) Systematic review, meta-analysis and regression of randomised controlled
trials reporting an association between an intake of circa 25g soya protein per day and blood
cholesterol. Atherosclerosis 200,13-27.
Harrison S, Lennon R, Holly J, Higgins JPT, Gardner M, Perks C, et al (2017) Does milk intake promote
prostate cancer initiation or progression via effects on insulin-like growth factors (IGFs)? A
systematic review and meta-analysis. Cancer Causes Control CCC 28(6):497–528.
Harvie M (2014) Nutritional supplements and cancer: potential benefits and proven harms. Am Soc Clin
Oncol Educ Book 2014:e478-86. doi: 10.14694/EdBook_AM.2014.34.e478.
Healthcare without Harm (2017) Redefining protein: Adjusting diets to protect public health and conserve
resources.
https://noharm-uscanada.org/sites/default/files/documents-files/4679/Redefining%20Protein%20R eport_4-13-17.pdf
Heller MC, Keoleian GA (2003) Assessing the sustainability of the US food system: a life cycle perspective.
Agricultural Systems 76(3), 1007-1041. doi:10.1016/S0308-521X(02)00027-6
Heller MC, Keoleian GA, Willett WC (2013) Toward a Life Cycle-Based, Diet-level Framework for Food
Environmental Impact and Nutritional Quality Assessment: A Critical Review. Environmental
Science & Technology 47(22), 12632-12647.
HLPE (2014) Food losses and waste in the context of sustainable food systems. A report by the High Level Panel of Experts on Food Security and Nutrition of the Committee on World Food Security, Rome, Italy.
HLPE (2017) Nutrition and food systems. A report by the High Level Panel of Experts on Food Security and
Nutrition of the Committee on World Food Security, Rome, Italy.
IDF (2015) A common carbon footprint approach for the dairy sector. The IDF guide to standard life cycle
assessment methodology. The International Dairy Federation, Brussels, Belgium.
IDF (2017) The IDF guide to Water Footprint Methodology for the Dairy Sector. The International Dairy
Federation, Brussels, Belgium.
IHME (2013) The global burden of disease: generating evidence, guiding policy. Institute for Health Metrics
and Evaluation, University of Washington, Seattle, Washington, USA.
ISO (2006a) ISO 14040 International Standard. In: Environmental management—Life cycle assessment—
Principles and framework. International Organisation for Standardization. Geneva, Switzerland.
ISO (2006b) ISO 14040 International Standard. In: Environmental management—Life cycle assessment—
Requirements and guidelines. International Organisation for Standardization. Geneva, Switzerland.
Jacobsen BK, Knutsen SF, Fraser GE (1998) Does high soy milk intake reduce prostate cancer incidence? The
Adventist Health Study (United States). Cancer Causes Control CCC 9(6):553–7.
Ji C, Hong T (2016) New Internet search volume-based weighting method for integrating various
environmental impacts. Environ Impact Assess Rev 56:128–38.

103
Johnston JL, Fanzo JC, Cogill B (2014) Understanding Sustainable Diets: A Descriptive Analysis of the
Determinants and Processes That Influence Diets and Their Impact on Health, Food Security, and
Environmental Sustainability. Adv Nutr 5(4),418–29.
Jones AD, Hoey L, Blesh J, Miller L, Green A, Shapiro LF (2016) A Systematic Review of the Measurement of
Sustainable Diets. Adv Nutr Int Rev J 1;7(4):641–64.
Korde LA, Wu AH, Fears T, Nomura AMY, West DW, Kolonel LN, et al (2009) Childhood soy intake and
breast cancer risk in Asian American women. Cancer Epidemiol Biomarkers Prev 18(4):1050–9.
Kramer G, Tyszler M, Veer P, Blonk H (2017) Decreasing the overall environmental impact of the Dutch diet:
How to find healthy and sustainable diets with limited changes. Public Health Nutrition 20(9), 1699-
1709. doi:10.1017/S1368980017000349
Kuiper GG, Lemmen JG, Carlsson B et al (1998) Interaction of estrogenic chemicals and phytoestrogens with
estrogen receptor beta. Endocrinology 139, 4252-63.
Leip A, Weiss F, Lesschen JP, Westhoek H (2014) The nitrogen footprint of food products in the European
Union. The Journal of Agricultural Science 152(S1), 20-33. doi:10.1017/S0021859613000786
Li H, Zeng C, Wei J, Yang T, Gao S-G, Li Y-S, et al (2016) Relationship between soy milk intake and
radiographic knee joint space narrowing and osteophytes. Rheumatol Int 36(9),1215–22.
Linnemann AR, Hendrix EMT, Apaiah R, van Boekel TAJS (2015) Food chain design using multi criteria
decision making, an approach to complex design issues. NJAS - Wageningen Journal of Life Sciences
72-73, 13-21. doi:10.1016/j.njas.2014.10.002
Lu W, Chen H, Niu Y, Wu H, Xia D, Wu Y (2016a) Dairy products intake and cancer mortality risk: a meta-
analysis of 11 population-based cohort studies. Nutr J 21,15(1), 91
Lu L, Xun P, Wan Y, He K, Cai W (2016b) Long-term association between dairy consumption and risk of
childhood obesity: a systematic review and meta-analysis of prospective cohort studies. Eur J Clin
Nutr 70(4), 414–23.
Lukas M, Rohn H, Lettenmeier M, Liedtke C, Wiesen K (2016) The nutritional footprint – integrated
methodology using environmental and health indicators to indicate potential for absolute reduction
of natural resource use in the field of food and nutrition. Journal of Cleaner Production 132, 161–70.
Marchand F, Debruyne L, Triste L, Gerrard C, Padel S, Lauwers L (2014) Key characteristics for tool choice in
indicator-based sustainability assessment at farm level. Ecology and Society 19(3). doi:10.5751/ES-
06876-190346
Martinez-Sanchez V, Tonini D, Møller F, Astrup TF (2016) Life-Cycle costing of food waste management in
Denmark: importance of indirect effects. Environmental Science and Technology 50, 4513-4523. doi:
10.1021/acs.est.5b03536
Masset G, Vieux F, Darmon N (2015) Which functional unit to identify sustainable foods? Public Health
Nutrition 18(13), 2488-2497. doi:10.1017/S1368980015000579
Matthews VL, Knutsen SF, Beeson WL, Fraser GE (2011) Soy milk and dairy consumption is independently
associated with ultrasound attenuation of the heel bone among postmenopausal women: the
Adventist Health Study-2. Nutr Res N Y N 31(10),766–75.
Mekonnen MM, Hoekstra AY (2011) The green, blue and grey water footprint of crops and derived crop
products. Hydrology and Earth System Science 15, 1577–1600.
Mekonnen MM, Hoekstra AY (2012) A Global Assessment of the Water Footprint of Farm Animal Products.
Ecosystems 15, 401–415. doi:10.1007/s10021-011-9517-8
Mertens E, Van’t Veer P, Hiddink G, Steijns J, Kuijsten A (2017) Operationalising the health aspects of
sustainable diets: A review. Public Health Nutrition 20(4), 739-757.
doi:10.1017/S1368980016002664
Messina M (2016) Soy and Health Update: Evaluation of the Clinical and Epidemiologic Literature. Nutrients
8(12), 754.

104
Mineur E (2007) Towards sustainable development. Indicators as a tool of local governance. Research report
5. Department of Political Science. Umeå University, Sweden.
Morency M-E, Birken CS, Lebovic G, Chen Y, L’Abbé M, Lee GJ, et al (2017) Association between noncow
milk beverage consumption and childhood height. Am J Clin Nutr 106(2),597–602.
Myhre G, Shindell D, Bréon FM, Collins W, Fuglestvedt J, Huang J, et al. (2013) Anthropogenic and Natural
Radiative Forcing. In: Climate Change 2013: The Physical Science Basis. Contribution of Working
Group I to the Fifth Assessment Report of the Intergovernmental Panel on Climate Change. In:
Stocker, T. F., Qin, D., Plattner, G.-k., Tignor, M., Allen, S. K., Boschung, J., Nauels, a., Xia, Y., Bex,
V. & Midgley, P. M. (eds.).
Mäkinen OE, Wanhalinna V, Zannini E, Arendt EK (2016) Foods for Special Dietary Needs: Non-dairy Plant-
based Milk Substitutes and Fermented Dairy-type Products. Crit Rev Food Sci Nutr 56(3), 339–49.
Niles MT, Ahuja R, Barker T, Esquivel J, Gutterman S, Heller MC, Vermeulen S et al. (2018) Climate change
mitigation beyond agriculture: a review of food system opportunities and implications. Renewable
Agriculture and Food Systems 1-12. doi:10.1017/S1742170518000029
NNR (2014) Nordic Nutrition Recommendations 5th ed. Integrating nutrition and physical activity.
http://www.norden.org/en/theme/former-themes/themes-2016/nordic-nutrition-recommendati
on/nordic-nutrition-recommendations-2012
Nordborg M, Davis J, Cederberg C, Woodhouse A (2017) Freshwater ecotoxicity impacts from pesticide use
in animal and vegetable foods produced in Sweden. Science of The Total Environment 581–582,
448–59.
Notarnicola B, Sala S, Anton A, McLaren SJ, Saouter E, Sonesson U (2017) The role of life cycle assessment
in supporting sustainable agri-food systems: A review of the challenges. Journal of Cleaner
Production 140,399–409.
OECD/DAC (2010) Glossary of Key Terms in Evaluation and Results Based Management.Link:
http://www.oecd.org/development/peer-reviews/2754804.pdf
OECD and EC (2008) Handbook on constructing composite indicators: methodology and user guide. OECD
and JRC European Commission, Brussels, Belgium.
O’Neill DW, Fanning AL, Lamb WF, Steinberger JK (2018) A good life for all within planetary boundaries.
Nature Sustainability 1(2), 88-95. doi:10.1038/s41893-018-0021-4.
Onvani S, Haghighatdoost F, Surkan PJ, Azadbakht L (2017) Dairy products, satiety and food intake: A meta-
analysis of clinical trials. Clin Nutr Edinb Scotl 36(2),389–98.
Oseni T, Patel R, Pyle J, Jordan VC (2008) Selective estrogen receptor modulators and phytoestrogens.
Planta Med 74, 1656–1665.
Persson M, Johansson D, Cederberg C, Hedenus F, Bryngelsson D (2015) Climate metrics and the carbon
footprint of livestock products: where’s the beef? Environmental Research Letters, 10(3), 034005.
Pimpin L, Wu JHY, Haskelberg H, Del Gobbo L, Mozaffarian D (2016) Is Butter Back? A Systematic Review
and Meta-Analysis of Butter Consumption and Risk of Cardiovascular Disease, Diabetes, and Total
Mortality. PloS One. 11(6):e0158118.
Pizzol M, Weidema B, Brandão M, Osset P (2015) Monetary valuation in Life Cycle Assessment: a review.
Journal of Cleaner Production 86:170–9.
Prosperi P, Moragues-Faus A, Sonnino R, Devereux C (2015) Measuring progress towards sustainable food
cities: Sustainability and food security indicators Report of the ESRC financed Project “Enhancing
the Impact of Sustainable Urban Food Strategies”.
Rasmussen LV, Bierbaum R, Oldekop JA, Agrawal A (2017) Bridging the practitioner-researcher divide:
Indicators to track environmental, economic, and sociocultural sustainability of agricultural
commodity production. Global Environmental Change 42, 33-46. doi:
http://dx.doi.org/10.1016/j.gloenvcha.2016.12.001
Reisch LA (2010) A Definition of “Sustainable Food Consumption”. Copenhagen Business School 2010.
Copenhagen, Denmark.

105
Ridoutt BG, Williams SRO, Baud S, Fraval S, Marks N (2010) Short communication: The water footprint of
dairy products: Case study involving skim milk powder. Journal of Dairy Science 93(11), 5114-5117.
doi: 10.3168/jds.2010-3546
Ritchie H, Reay DS, Higgins P (2018) The impact of global dietary guidelines on climate change. Global
Environmental Change 49:46–55.
Rockström J, Steffen W, Noone K, Persson Å, Chapin FS III, Lambin EF et al. (2009) A safe operating space
for humanity. Nature 461, 472–475. doi:10.1038/461472a.
Röös E, Karlsson H, Witthöft C, Sundberg C (2015a) Evaluating the sustainability of diets – combining
environmental and nutritional aspects. Environmental Science & Policy 47:157-166. doi:
10.1016/j.envsci.2014.12.001
Röös E, Sundberg C, Tidåker P, Strid I, Hansson PA (2013) Can carbon footprint serve as an indicator of the
environmental impact of meat production? Ecological Indicators 24, 573-581.
doi:10.1016/j.ecolind.2012.08.004
Röös E, Patel M, Spångberg J (2015b) Miljöpåverkan från mjölk och havredryck. En scenarioanalys
som
inkluderar alternativ markanvändning samt olika infallsvinklar på behovet av nötkött och
protein.
Department of Energy and Technology, Swedish University of Agricultural Sciences, Uppsala,
Sweden.
Röös E, Patel M, Spångberg J, Carlsson G, Rydhmer L (2016a) Limiting livestock production to pasture and
by-products in a search for sustainable diets. Food Policy 58:1-13. doi: 10.1016/j.foodpol.2015.10.008
Röös E, Patel M, Spångberg J (2016b) Producing oat drink or cow's milk on a Swedish farm — Environmental
impacts considering the service of grazing, the opportunity cost of land and the demand for beef and
protein. Agricultural Systems 142, 23-32. doi:10.1016/j.agsy.2015.11.002i
Röös E, Bajželj B, Smith P, Patel M, Little D, Garnett T (2017) Greedy or needy? Land use and climate
impacts of food in 2050 under different livestock futures. Global Environmental Change 47:1-12. doi:
10.1016/j.gloenvcha.2017.09.001
Saarinen M, Fogelholm M, Tahvonen R, Kurppa S (2017) Taking nutrition into account within the life cycle
assessment of food products. Journal of Cleaner Production 149, 828–44.
SACN (2018) Draft report: Saturated fats and health. Scientific consultation: 8 May to 3 July. Scientific
Advisory Committee of Nutrition, UK.
https://assets.publishing.service.gov.uk/government/uploads/system/uploads/attachment_data/fil
e
SBA (2012) Ett klimatvänligt jordbruk 2050. ("Climate friendly agriculture in 2050"). Report 2012:35.
Swedish Board of Agriculture, Jönköping, Sweden.
Scarborough P, Rayner M (2010) Nutrient Density to Climate Impact index is an inappropriate system for
ranking beverages in order of climate impact per nutritional value. Food Nutr Res 19; 54.
Schaafsma G (2000) The protein digestibility-corrected amino acid score. J Nutr 130(7):1865S-7S.
Schader C, Grenz J, Meier MS, Stolze M (2014) Scope and precision of sustainability assessment approaches
to food systems. Ecology and Society 19(3). doi:10.5751/ES-06866-190342
Seves S, Verkaik-Kloosterman J, Biesbroek S, Temme E (2017) Are more environmentally sustainable diets
with less meat and dairy nutritionally adequate? Public Health Nutrition 20(11), 2050-2062.
doi:10.1017/S1368980017000763doo
Sethi S, Tyagi SK, Anurag RK (2016) Plant-based milk alternatives an emerging segment of functional
beverages: a review. J Food Sci Technol 53(9): 3408–3423.
Shen XL, Zhao T, Zhou Y, Shi X, Zou Y, Zhao G (2016) Effect of Oat β-Glucan Intake on Glycaemic Control
and Insulin Sensitivity of Diabetic Patients: A Meta-Analysis of Randomized Controlled Trials.
Nutrients 13, 8(1).

106
Sjaunja L, Baevre L, Junkkarinen L, Pedersen J, Setala J (1990) A Nordic proposal for an energy corrected
milk (ECM) formula. In: 27th session of the International Commission for Breeding and Productivity
of Milk Animals, Paris, France.
Smedman A, Lindmark-Månsson H, Drewnowski A, Edman A-KM (2010) Nutrient density of beverages in
relation to climate impact. Food & Nutrition Research 54(1), 5170.
Smith P, Martino D, Cai Z, Gwary D, Janzen H, Kumar P, et al. (2008) Greenhouse gas mitigation in
agriculture. Philosophical Transactions of the Royal Society B: Biological Sciences 27; 363(1492):
789–813.
Soares SR, Toffoletto L, Deschênes L (2006) Development of weighting factors in the context of LCIA.
Journal of Cleaner Production 14(6):649–60.
Sonesson U, Davis J, Flysjö A, Gustavsson J, Witthöft C (2017) Protein quality as functional unit – A
methodological framework for inclusion in life cycle assessment of food. Journal of cleaner
Production 140, 470–8.
Springmann M, Mason-D/'Croz D, Robinson S, Wiebe K, Godfray HCJ, Rayner M, Scarborough P (2017).
Mitigation potential and global health impacts from emissions pricing of food commodities. Nature
Clim. Change 7, 69–74. doi:10.1038/nclimate3155
Steffen W, Richardson K, Rockström J, Cornell SE, Fetzer I, Bennett EM, et al. (2015) Planetary boundaries:
guiding human development on a changing planet. Science 347(6223):1259855.
Sustain (2013) The Sustain Guide to Good Food: How to help make our food and farming system fit for the
future. Sustain : The alliance for better food and farming, London, UK
Taku K, Melby MK, Nishi N, Omori T, Kurzer MS (2011) Soy isoflavones for osteoporosis: an evidence-based
approach. Maturitas 70(4),333–8.
Temme E, Van der Voet H, Thissen J, Verkaik-Kloosterman J, Van Donkersgoed G, Nonhebel S (2013)
Replacement of meat and dairy by plant-derived foods: Estimated effects on land use, iron and SFA
intakes in young Dutch adult females. Public Health Nutrition 16(10), 1900-1907.
doi:10.1017/S1368980013000232
Temme E, Bakker H, Seves S, Verkaik-Kloosterman J, Dekkers A, Van Raaij J, Ocké M (2015) How may a
shift towards a more sustainable food consumption pattern affect nutrient intakes of Dutch children?
Public Health Nutrition 18(13), 2468-2478. doi:10.1017/S1368980015002426
Tesco (2012) Product carbon footprint summary.
http://www.tescoplc.com/assets/files/cms/Tesco_Product_Carbon_Footprints_Summary%281%29
Thorning TK, Bertram HC, Bonjour J-P, de Groot L, Dupont D, Feeney E, et al (2017) Whole dairy matrix or
single nutrients in assessment of health effects: current evidence and knowledge gaps. The American
Journal of Clinical Nutrition 105(5),1033–45.
Thorning TK, Raben A, Tholstrup T, Soedamah-Muthu SS, Givens I, Astrup A (2016) Milk and dairy
products: good or bad for human health? An assessment of the totality of scientific evidence. Food &
Nutrition Research 60, 10.3402/fnr.v3460.32527. doi:10.3402/fnr.v60.32527
Tokede OA, Onabanjo TA, Yansane A, Gaziano JM, Djousse L (2015) Soya products and serum lipids: a meta-
analysis of randomised controlled trials. Br J Nutr 114,831-43.
Tranche S, Brotons C, Pascual de la Pisa B, Macías R, Hevia E, Marzo-Castillejo M (2016) Impact of a soy
drink on climacteric symptoms: an open-label, crossover, randomized clinical trial. Gynecol
Endocrinol Off J Int Soc Gynecol Endocrinol 32(6):477–82.
Tuomisto HL, Hodge ID, Riordan P, Macdonald DW (2012) Exploring a safe operating approach to weighting
in life cycle impact assessment – a case study of organic, conventional and integrated farming
systems. Journal of Cleaner Production (37):147–53.
van Dooren C, Marinussen M, Blonk H, Aiking H, Vellinga P (2014) Exploring dietary guidelines based on
ecological and nutritional values: A comparison of six dietary patterns. Food Policy 44, 36-46.
doi:10.1016/j.foodpol.2013.11.002

107
van Dooren C, Aiking H, Vellinga P (2018) In search of indicators to assess the environmental impact of
diets. The International Journal of Life Cycle Assessment 23(6), 1297-1314. doi:10.1007/s11367-017-
1371-2
van Dooren C, Douma A, Aiking H, Vellinga P (2017b) Proposing a Novel Index Reflecting Both Climate
Impact and Nutritional Impact of Food Products. Ecological Economics 131, 389-398.
Van Zanten HHE, Herrero M, Van Hal O, Röös E et al. (2018) Defining the planet’s land boundary for
sustainable livestock consumption. Global Change Biology, in press. doi: 10.1111/gcb.14321
Via M (2012) The Malnutrition of Obesity: Micronutrient Deficiencies That Promote Diabetes. ISRN
Endocrinol 2012: 103472. doi:10.5402/2012/103472
Vieux F, Darmon N, Touazi D, Soler LG (2012) Greenhouse gas emissions of self-selected individual diets in
France: Changing the diet structure or consuming less? Ecological Economics 75, 91-101.
Vieux F, Perignon M, Gazan R, Darmon N (2018) Dietary changes needed to improve diet sustainability: are
they similar across Europe? European Journal of Clinical Nutrition. doi:10.1038/s41430-017-0080-z
Vieux F, Soler L-G, Touazi D, Darmon N (2013) High nutritional quality is not associated with low
greenhouse gas emissions in self-selected diets of French adults. Am J Clin Nutr 97(3), 569–83.
Waijers PM, Feskens EJ, Ocke MC (2007) A critical review of ́ predefined diet quality scores. British Journal
of Nutrition 97(02), 219−23.
Wang J, Li X, Zhang D (2016a) Dairy Product Consumption and Risk of Non-Hodgkin Lymphoma: A Meta-
Analysis. Nutrients 8(3),120.
Wang W, Wu Y, Zhang D (2016b) Association of dairy products consumption with risk of obesity in children
and adults: a meta-analysis of mainly cross-sectional studies. Ann Epidemiol (12),870–882.e2.
WCED (1987) Report of the World Commission on Environment and Development: Our Common Future.:
World Commission on Environment and Development, United Nations.
Weaver CM (2014) Calcium Supplementation: Is Protecting Against Osteoporosis Counter to Protecting
against Cardiovascular Disease? Curr Osteoporos Rep 12(2),211–8.
Weiler V, Udo HMJ, Viets T, Crane TA, De Boer IJM (2014) Handling multi-functionality of livestock in a life
cycle assessment: the case of smallholder dairying in Kenya. Current Opinion in Environmental
Sustainability 8, 29-38. doi:10.1016/j.cosust.2014.07.009
Werner LB, Flysjö A, Tholstrup T (2014) Greenhouse gas emissions of realistic dietary choices in Denmark:
the carbon footprint and nutritional value of dairy products. Food Nutr Res 10;58.
Westhoek H, Lesschen JP, Rood T, Wagner S, De Marco A, Murphy-Bokern D, Oenema O (2014) Food
choices, health and environment: Effects of cutting Europe's meat and dairy intake. Global
Environmental Change 26(0), 196-205. doi:10.1016/j.gloenvcha.2014.02.004
WHO (2009) Global health risks: mortality and burden of disease attributable to selected major risks. World
Health Organization, Geneva, Switzerland.
WHO (2011a) Global status report on non-communicable diseases. World Health Organization, Geneva,
Switzerland.
WHO (2016) Fiscal policies for diet and prevention of noncommunicable diseases: technical meeting report,
5-6 May 2015, Geneva, Switzerland.
WHO (2018) 2018 Global Reference List of 100 Core Health Indicators (plus health-related SDGs). Licence:
CC BY-NC-SA 3.0 IGO. World Health Organization, Geneva, Switzerland.
WHO (2011b) Nutrient profiling. Report of a WHO/IASO Technical meeting 4-6 October 2010, London, UK.
Willett W (2012) Nutritional Epidemiology. Third Edition. Oxford University Press, Oxford, New York.
Wood A (2017) Danone and Nestlé: The global opportunities in Milk Alternatives. Bernstein, New York, NY,
USA.
Wu AH, Yu MC, Tseng C-C, Pike MC (2008). Epidemiology of soy exposures and breast cancer risk. British
Journal of Cancer 98(1), 9.
Wu AH, Wan P, Hankin J, Tseng C-C, Yu MC, Pike MC (2002) Adolescent and adult soy intake and risk of
breast cancer in Asian-Americans. Carcinogenesis 23(9), 1491–6.

108
Yu Y, Jing X, Li H, Zhao X, Wang D (2016) Soy isoflavone consumption and colorectal cancer risk: a
systematic review and meta-analysis. Scientific Reports 6(1).
Zelman K (2011) The great fat debate: a closer look at the controversy-questioning the validity of age-old
dietary guidance. J Am Diet Assoc 111(5):655–8.
Zhao Y, Martin BR, Weaver CM (2005) Calcium Bioavailability of Calcium Carbonate Fortified Soymilk Is
Equivalent to Cow’s Milk in Young Women. J Nutr 135(10), 2379–82.
Öhrvik V, Engman J, Grönholm R, Staffas A, Strandler HS, von Malmborg A (2015) Drycker - analys av
näringsämnen. Report no. 20. Swedish National Food Agency, Uppsala, Sweden.
https://www.livsmedelsverket.se/globalassets/rapporter/2015/drycker---analys-av-naringsamnen--
-rapport-20_2015.pdf

109
Appendix A. Frameworks for sustainable development
Fig. A1 shows the updated version of the Planetary Boundaries framework based around nine
critical processes that regulate the functioning of the Earth systems (Rockström et al., 2009;
Steffen et al., 2015). By combining scientific understanding of the processes regulating the
Earth’s functioning with the precautionary principle, the framework identifies different levels of
anthropogenic activities for which the risk of destabilisation of the Earth’s systems is likely to
remain low - called the ‘safe operating space of humanity’. The red zone represent a dangerous
level for the given process, where there is a high risk of serious impacts on earth systems. The
zone in between the safe operating safe and the dangerous level is regarded as a zone of
uncertainty, which still means an increased risk of serious impacts. At the ‘safe’ end of the zone
of uncertainty, current scientific knowledge suggests that there is very low probability of
crossing a critical threshold or substantially destroying the resilience of the earth’s system.
Beyond the ‘danger’ end of the zone of uncertainty, current knowledge suggests a much higher
probability of a change to the functioning of the Earth’s system that could be harmful for human
societies. Application of the precautionary principle means that the Planetary Boundary is set at
the ‘safe’ end of the zone of uncertainty. This does not mean that transgressing a boundary will
instantly lead to an unwanted outcome, but rather that the further the boundary is transgressed,
the higher the risk of potential shifts, destabilised processes, erosion of resilience with fewer
opportunities to prepare for such changes.
Fig. A1. The planetary boundaries defined by Steffen et al. (2015). Question marks represent processes for which
global-level boundaries cannot yet be quantified (atmospheric aerosol loading, novel entities, the functional role of
biosphere integrity). From [Steffen W, Richardson K, Rockström J, Cornell SE, Fetzer I, Bennett EM, et al. (2015)
Planetary boundaries: guiding human development on a changing planet. Science 347(6223):1259855]. Reprinted
with permission from AAAS.

110
Fig. A2 shows the ‘Oxfam doughnut’ created by Raworth (2012). This concept combines the
Planetary Boundaries established by Rockström et al. (2009), here called the ‘environmental
ceiling’ by Raworth (2012), with a ‘social foundation’ based on different governments’ priorities
in terms of sustainable development. These include 11 social endpoints, which can be grouped
into three clusters, focused on enabling people to be:
● Well: through food security, adequate income, improved water and sanitation, and
health care
● Productive: through education, decent work, modern energy services and resilience to
shocks
● Empowered: through gender equality, social equity and having a political voice.
The ‘safe and just space for humanity’ arises between this social foundation and the limitations
on economic activities imposed by the environmental ceiling.
Fig. A2. A framework for incorporating environmental and social boundaries for human development. From Raworth (2012).

111
A framework developed by Whitmee et al. (2015) shows how the proposed UN Sustainable
Development Goals (SDGs) representing human wellbeing (inner circle) are dependent on those
that provide the enabling infrastructure for development (the first ring) and the supporting
natural systems (the outer ring) (Fig. A3). The framework identifies three categories of
challenges that have to be addressed to maintain and enhance human health in the face of
increasingly harmful environmental trends: i) Conceptual failure, such as an over-reliance on
gross domestic product as a measure of human progress. This is a failure since it does not
account for future health and environmental harms over present-day gains, and the
disproportionate effect of the harms on the poor and those in developing nations. ii) Failures of
knowledge, such as the failure to address social and environmental drivers of ill-health, and a
historical lack of transdisciplinary research and funding, together with an unwillingness or
inability to deal with the uncertainty within decision-making frameworks. iii) Implementation
failures, such as how governments and institutions delay recognition and responses to threats,
especially when faced with uncertainties, with failure to pool common resources and time lags
between action and effect. The proposed framework also suggests a need for strong governance
to ensure that infrastructure-related goals are not achieved at the expense of those supporting
natural systems.

112
Fig. A3. Framework for examining interactions between Sustainable Development Goals 1-17. From Whitmee et al. (2015).

113
Broman and Robért (2017) present a framework for strategic sustainable development as a five-
level model, which is shown in Table A1.
Table A1. Summary of the five-level model of framework for strategic sustainable development.
Level Description
1. System The system level includes principles for the functioning of the global system, i.e. the human society within the biosphere, and our knowledge with regard to the planetary and the human condition.
2. Success The success level includes the definition of the sustainability vision. The framework for strategic sustainable development requires any vision to be framed by basic sustainability principles.
3. Strategic guidelines The strategic guidelines level includes guidelines for how to approach the principle-framed vision strategically.
4. Actions The actions level includes the concrete actions that have been prioritised by the specific organisation into a strategic plan, using the strategic guidelines and the vision to inspire, inform, and scrutinise the possible actions.
5. Tools The tools level includes methods, tools and other forms of support that are often required for decision making, monitoring and disclosures of the actions to ensure they are chosen in line with the strategic guidelines to arrive step-by-step at the defined success in the system. Examples in the sustainability context include modelling, simulation, life cycle assessment, management systems, indicators etc.
In order to explain, formulate and visualise the challenges ahead in sustainable development,
Broman and Robért use the metaphor of a funnel (Fig. A4). The detrimental effects that human
society have on the planet are shown by a narrowing of the funnel; as the cross-section of the
funnel decreases, humanity’s potential to fulfil its needs becomes more difficult to achieve, in
terms of social, economic and ecological sustainability. The wall of the funnel represents the
systematic changes that will occur when our civilisations ‘hit the wall’; at this point we will have
no choice but to adapt to the current situation. The slight opening at the end of the funnel
represents the hope of restoring some of the lost potential through restorative actions and
increased freedom and prosperity for future generations.

114
Fig. A4. Funnel metaphor presented by Broman and Robért (2017) to describe the sustainability challenges ahead. A: a sustainability vision is captured. B: the current challenges and assets in relation to the vision are captured. C: possible steps towards the vision are captured. D: steps A-C are prioritised into a strategic plan.

115
Appendix B. Conceptual frameworks for food systems
Several authors provide conceptual frameworks for foods systems. Here we present a few
examples.
A visual representation of the conceptual framework of a food system according the High Level
Panel of Experts on Food Security and Nutrition (HLPE, 2017) is presented in Fig. B1. As can be
seen, the diet is just one part of the food system as a whole. However, diets interact with many
components and activities in the food system more or less directly. For example, diets directly
influence consumer health, as ‘dietary factors’ is a major contributor to declining life expectancy
(Forouzanfar et al., 2015).
Fig. B1. Conceptual framework of food systems developed by the High Level Panel of Experts on Food Security and
Nutrition (HLPE, 2017).
There is also a rather short pathway between diets and the environmental impact from food
production. Even if some environmental dimensions are difficult to assess and couple to
individual food products, the link between diets and its impact on the environment is strong for
other aspects, e.g. emissions of GHG. Diets also impact and are impacted by socio-economic
activities and components. However, the causal pathway for these is associated with a higher
degree of uncertainty and some outcomes are also to a large extent determined by other factors
than explicitly the type of foods in diets. For example, social factors such as working conditions

116
and the fair distribution of food are to a large extent determined by factors independent of the
type of diets. They are more a result of e.g. regulations and public support systems to vulnerable
groups in society.
Furthermore, the HLPE defines a sustainable food system as:
“a food system that ensures food security and nutrition for all in such a way that the economic,
social and environmental bases to generate food security and nutrition of future generations
are not compromised”.
Sustainability aspects can be evaluated on food systems as a whole or on different parts of food
systems, e.g. farms, production systems, food commodities, food products, meals or diets,
depending on the purpose of the study. For example, if the purpose of a study is to compare the
environmental impact of the production of pig meat using either rapeseed cake or soybean meal
as a protein source, comparing the production of 1 kg of pig meat at the farm level is an
appropriate scope. If the purpose is to evaluate e.g. the environmental impacts of diets based on
local food versus globally traded foods, or to compare current dietary patterns with alternative
diets (e.g. recommended diets), it is necessary to assess the whole diet. Fig. B2, taken from
Heller et al. (2013), illustrates in part how the unit of assessment depends on the goal and scope
of the study.

117
Fig. B2. Visual representation of appropriate units for evaluating the sustainability of agriculture, food and diets
depending on the scope of the study. Reprinted with permission from (Heller MC, Keoleian GA, Willett WC. Toward a
Life Cycle-Based, Diet-level Framework for Food Environmental Impact and Nutritional Quality Assessment: A
Critical Review. Environmental Science & Technology. 2013 Nov 19;47(22):12632–47). Copyright 2018 American
Chemical Society.

118
Horton et al. (2016) provide a ‘generic agri-food ecosystem template’ with four components: 1)
the ecosystem, 2) key actors and external factors, 3) food loss and waste and 4) the
environmental and health penalties (Fig. B3). The orange lines represent feedback pathways,
which should be interpreted as damage affecting ecosystems and human health and the public
(people) affecting external factors, such as governments and NGOs.
Fig. B3. A generic agri-food ecosystem template with its relevant components and interactions. From Horton et al. (2016).

119
Kanter et al. (2015) present a visual representation of the links between agriculture, the food
system, nutrition and public health (Fig. B4). In that study, ‘Nutritional outcomes’ were defined
as the following: undernutrition in terms of total energy intake, micronutrient deficiencies or
low-weight-or height-for-age, and overweight and obesity. ‘Agricultural and food policies’ were
defined as: domestic and international policies, and policy-related programmes, private and
public, including trade policies, with some form of agriculture or food system impact.
The framework conceptualises the key influences of agriculture and food systems on nutrition
and public health, while remaining relevant to a range of contexts (e.g. countries with different
income levels and rural and urban settings). The framework was designed as a guide for use by
policymakers.
Fig. B4. A visual representation of the links between agriculture, the food system, nutrition and public health. From
Kanter et al. (2015).

120
Appendix C. More on metrics and indicators
C1. Indicator selection and development
Indicator selection, development and evaluation is a whole research field of its own and several
authors have suggested methods and requirements for this. Here we provide some examples.
According to Bossel (1999), the necessary requirements for finding relevant indicators for
sustainable development include:
● The indicators must represent all important concerns: an ad hoc collection of indicators that just
seem relevant is not adequate. A more systematic approach must look at the interaction of systems
and their environment.
● The number of indicators should be as small as possible, but not smaller than necessary. That is,
the indicator set must be comprehensive and compact, covering all relevant aspects.
● The process of finding an indicator set must be participatory, to ensure that the set encompasses
the visions and values of the community or region for which it is developed.
● Indicators must be clearly defined, reproducible, unambiguous, understandable and practical.
They must reflect the interests and views of different stakeholders.
● From a look at these indicators, it must be possible to deduce the viability and sustainability of
current developments, and to compare with alternative development paths.
● A framework, a process and criteria for finding an adequate set of indicators of sustainable
development are needed.
Like Bossel (1999), Hák et al. (2016), who discuss indicator selection for the Sustainable
Development Goals, also call for a systematic approach for indicator development, especially the
need to start from a theoretical framework of the concept one is assessing rather than ad-hoc
gathering indicators guided by e.g. data availability (see Fig. C1 for an example). They also call
for a “...combination of top-down and bottom-up approaches, in which indicators are
formalised (defined, constructed and assessed) by measurement experts but their choice
depends on political and social preferences…”.

121
Fig. C1. Indicators should be developed within a conceptual framework starting from the goal or target to be reached
and developing indicators that relate to these. From Hák et al. (2016).
Mineur (2007) also provides a set of characteristics that are desired for sustainability indicators,
divided into two types; scientific and functional (Table C1). Scientific criteria aim to guarantee
the scientific approach with high validity and methodological legitimacy. Functional criteria
describe how useful indicators are in a context of politics and policy, where availability of data is
one important functional criterion. It is preferable that indicators are both functional and
scientific, even though that might not always be the case.

122
Table C1. Desired characteristics of sustainability indicators. From Mineur (2007)
Scientific Functional
Sensitivity
Sensitive to changes
Simplicity
Easy to use
Quantification
Possible to quantify
Policy relevant
Support prioritised policies and issues
Measurable
According to standardized methods
Available
Use available data
Verifiable
Possible to verify by third party
Timeliness
Able to be produced in reasonable and appropriate time-
scale
Clear in value
Show a clear direction of possible and negative values
Few
Manageable to handle
Clear in content
Measure what they intend to measure
Comparable
Serve as benchmarking tool
Appropriate in scale
Not over- or under-aggregated
Feasible
Realistic to measure
Objective
Independent of assumptions
Understandable
Possible to understand by all stakeholders
Changeable
Possible to influence
Democratic
People should have input to indicators choice and have
access to results
Comprehensive
Embraces all aspects of the issue
Participatory
Include stakeholders in the measurement process
Moller and MacLeod (2013) provide a review of indicators and measures for sustainability
assessments (Table C2 and C3). Those authors try to identify and present issues that balance
between practicality and complexity. The report was created to support the development of the
New Zealand Sustainability Dashboard, an online sustainability assessment and reporting tool
for the country’s primary industry sectors. The design roadmap is based upon three basic
questions that need to be answered: (1) Why monitor? (2) What to monitor? and (3) How to
monitor? The last question identifies the specific measures and elements used to quantify the
indicators.

123
Table C2. Possible criteria for selecting individual agricultural sustainability indicators. From Moller and MacLeod
(2013)
Criterion Description
Sustainability relevance Indicators should measure key properties of the environment, economy, society or governance
that affect sustainability (e.g. state, pressure, response, use or capability)
Clearly defined and
standardized
Indicators must be based on clearly defined, verifiable and scientifically acceptable data
collected using standardised methods, so that they can be reliably repeated and compared
against each other
Easily communicated
and understood
Easily communicated and understood
Broad acceptance The strength of an indicator depends on its broad acceptance by major stakeholders (e.g.
growers, policy-makers, scientists, customers)
Affordable
measurement
Affordable measurement increases participation and regularity of monitoring or broadens the
scope of what can be measured for overall sustainability assessment
Performance rather
than practice based
It is better to measure actual performance and outcomes rather than just practices that are
expected to promote sustainability and resilience
Sensitivity Indicators should be sensitive (change immediately and a lot if agricultural system status
changes). This helps detect trends or breaches of thresholds within the time frames and on the
scales that are relevant to the management decisions, and before it is too late to correct any
problems
Quantification Indicators should be fully quantified whenever practicable. Counts and continuous variables
(interval and ratio scales) are more favoured than ranks (ordinal scales) or ‘yes/no’ scores
(binary); any form of quantification is preferable to a fully qualitative assessment
Specificity for
interpretability
Indicators should be affected only by a few key drivers (risks, opportunities, causes) of
sustainability, rather than being affected by many things (local context, multiple stressors etc.)
in order for any change in the indicator to be interpretable for sustainability
High precision and
statistical power
Indicators must have sufficient precision and accuracy and sufficiently low natural variance
for monitoring to detect trends and probability that some limit or threshold has been breached
Capacity to upscale Indicators should be designed and measured in a way that allows their aggregation at multiple
spatial and temporal scales for different purposes
Table C3. Possible criteria for balancing the collective set of indicators for agricultural sustainability assessment.
From Moller and MacLeod (2013).
Criterion Description
Participatory co-
development
Indicator sets and frameworks that are co-designed by key stakeholders are more likely to be
relevant, trusted, practical, heeded and used for learning
Wide scope and
integration
The framework and indicator sets must cover and cross-link multiple dimensions of
sustainability and values encompassing environment, economics, social and governance
dimensions
Linked to
targets/thresholds
Indicators should be linked to realisable, action-oriented, measurable and time-delimited
targets or critical thresholds of risk, performance or best professional practice
Transparency and
accessibility
Datasets that are accessible to all stakeholders (including the public) and explain assumptions,
uncertainty and sources are more likely to be trusted and used
Policy relevant and
meaningful
Indicators should send a clear message and provide information at an appropriate level for
policy and management decision-making by assessing changes in the status of and risks to
agricultural sustainability

124
Just enough indicators The fewer the indicators, the better, provided the critical determinants of sustainability have
been covered. Having just enough indicators will result in more participation, improved
accuracy in reporting and clearer communication of the overall picture to farmers,
policymakers and the public
Mix of generalised and
specific
Indicator sets must include enough general indicators to allow cross-comparison between
agricultural sectors, regions, countries and diverse social-ecological systems. However, some
highly specific and locally grounded indicators must be included to guide fine-grained
management adjustments that are especially relevant to one sector or region/country
Balance of current and
future
Monitoring is part of risk management, so it must inform current options and drivers while
preparing actors for future turbulence (shocks and drivers). At least some of the indicators
and measurements should monitor potential new threats and opportunities just over the
horizon
Explanatory and context
info
Management guidance is more focused, effective and reliable and benchmarking is more fair if
additional information is gathered to identify covariates and additional information to
determine why the indicators change
In a study by de Olde et al. (2017), experts were asked to rank which criteria for indicator
selection they considered most important for indicators aimed at measuring sustainable
agriculture. The experts were from the New Zealand Sustainability Dashboard and Temperate
Agriculture Research Network and were intended to represent researchers and consultants with
expert knowledge on sustainability assessments of agricultural systems from many different
regions. The results revealed a great lack of consensus on the criteria deemed most important.
de Olde et al. (2017) explained some of the variation as a result of context, which is determined
to be an important factor when choosing appropriate indicators.

125
C2. The relationship between data, indicators and indices
The ‘information pyramid’ is useful for understanding how concepts such as an index and
indicators relate to each other (Fig. C1).
Fig. C2. The information pyramid. HDI: human development index, GDP: gross domestic product. From Mineur
(2007) and examples added by the authors of the present report.
On moving up towards the top of the information pyramid, information becomes easier to
communicate but at the same time it loses precision about the system it is trying to represent.
The different categories in the pyramid can be defined as follows (Segnestam et al., 2002;
Mineur, 2007):
● Data represent the most basic component of information and thus cannot be broken down to
smaller or individual components. Data can be collected through measurements, surveys,
observations, interviews or other relevant methods.
● Indicators are derived from data and represent or point to the state of a phenomenon. A
commonly used indicator is gross domestic product (GDP).
● Key ratio indicators (also called headline indicators or core indicators) usually comprise well-
selected indicators with high communicative value that indicate trends and prioritised areas. Unlike
indicators, the key ratio indicators require an in-depth and holistic analysis of the system or society in
order to act as the basis for policy decisions.
● Index (or composite indicator) is a set of aggregated or weighted indicators and is often used to
compare or describe the state of systems. Indices are sometimes seen as more political tools for
communication, rather than giving accurate information about the system in question. An example
within the field of sustainable development is the Human Development Index (HDI), which is
frequently used as a reference point of a nation’s wellbeing. HDI is a composite measurement and
comprises three dimensions: health and longevity, level of education and standard of living.

126
C3. Indicators and damage pathways
Indicators can measure different points in the causal chain of the damage pathway. To illustrate
this for environmental issues, here we use the conceptual framework from life cycle impact
assessment (LCIA). Along the impact pathway from resource use and emission of pollutants to
final damage on ecosystems and human health, midpoint and endpoint indicators are defined
which represent different types of impacts. The endpoint indicators try to capture what we
ultimately want to protect, and commonly include: 1) damage to human health, 2) damage to
ecosystems and 3) damage to resource availability, while the midpoint indicators describe
intermediate steps in the cause-effect chain, e.g. human toxicity and global warming. The
endpoint of human health is commonly measured as DALYs, as this is one of the most relevant
endpoints for human health.

127
Appendix D. Review of sustainable diet indicators - an update of
Jones et al.
Table D1 lists the exclusion criteria used by Jones et al. (2016). In order to encompass all
relevant studies, Jones et al. (2016) applied a systematic search method covering 30 databases
in the fields of nutrition, public health, agriculture, ecology, economics, social science, public
policy and environmental and climate change. They also examined references of identified
articles and prominent policy reports, previous literature reviews and archives of select indexed
journals. The search was conducted with a uniform set of search terms with a priori exclusion
criteria and no time period restrictions. Two reviewers then independently performed a first-
stage screening of the title and abstract of English language peer-reviewed articles.
Table D1. Exclusion criterion used in Jones et al. (2016)
Exclusion criterion Description
Non-peer-reviewed
documents
Conference proceedings, non-peer-reviewed grey literature reports and/or discussion papers
Non-empirical study Purely conceptual article with no empirical analytical component (i.e. no primary, secondary, or
simulated data were analysed to examine specific, testable research questions); this included
commentary, perspectives and review papers
Inapplicable use of
“diet”
Use of “diet” was in reference to a weight loss plan
Inapplicable use of
“sustainable”
Use of “sustainable” was in reference to the persistence of an intervention or programme, rather than
the characterisation of diet or consumption patterns
No data on human diets The article addressed animal diets or crop production only
Inapplicable to study
objective
The study centred on the health of the intestinal mucosa (related to the term “econutrition”)
Focus on individual
foods
The article examined environmental impacts of a single food or commodity, rather than overall
dietary patterns or comparative food groups
In the updated search, the following papers were included:
Birney CI, Franklin KF, Davidson FT, Webber ME (2017) An assessment of individual foodprints attributed to diets
and food waste in the United States. Environ Res Lett 1;12(10):105008.
Blas A, Garrido A, Willaarts B (2016) Evaluating the water footprint of the Mediterranean and American diets. Water.
2016 Oct 13;8(10):448.
Donati M, Menozzi D, Zighetti C, Rosi A, Zinetti A, Scazzina F (2016) Towards a sustainable diet combining
economic, environmental and nutritional objectives. Appetite 106:48–57.
Donini LM, Dernini S, Lairon D, Serra-Majem L, Amiot M-J, del Balzo V, et al. (2016) A consensus proposal for
nutritional indicators to assess the sustainability of a healthy diet: The Mediterranean diet as a case study.
Frontiers in Nutrition 3:37.
van Dooren C, Aiking H (2016) Defining a nutritionally healthy, environmentally friendly, and culturally acceptable
Low Lands Diet. Int J Life Cycle Assess 21(5):688–700.
van Dooren C, Douma A, Aiking H, Vellinga P (2017) Proposing a novel index reflecting both climate impact and
nutritional impact of food products. Ecol Econ 131:389–98.
Gustafson D, Gutman A, Leet W, Drewnowski A, Fanzo J, Ingram J (2016) Seven food system metrics of sustainable
nutrition security. Sustainability 23;8(3):196.

128
Hadjikakou M (2017) Trimming the excess: environmental impacts of discretionary food consumption in Australia.
Ecol Econ 131:119–28.
Harris F, Green RF, Joy EJM, Kayatz B, Haines A, Dangour AD (2017) The water use of Indian diets and socio-
demographic factors related to dietary blue water footprint. Sci Total Environ 587–588:128–36.
He X, Qiao Y, Liu Y, Dendler L, Yin C, Martin F (2016) Environmental impact assessment of organic and conventional
tomato production in urban greenhouses of Beijing city, China. J Clean Prod 134:251–8.
Hendrie G, Baird D, Ridoutt B, Hadjikakou M, Noakes M (2016) Overconsumption of energy and excessive
discretionary food intake inflates dietary greenhouse gas emissions in Australia. Nutrients 31;8(12):690.
Horgan GW, Perrin A, Whybrow S, Macdiarmid JI (2016) Achieving dietary recommendations and reducing
greenhouse gas emissions: modelling diets to minimise the change from current intakes. Int J Behav Nutr
Phys Act 13(1)
Hyland JJ, Henchion M, McCarthy M, McCarthy SN (2017) The climatic impact of food consumption in a
representative sample of Irish adults and implications for food and nutrition policy. Public Health Nutr
20(04):726–38.
Lukas M, Rohn H, Lettenmeier M, Liedtke C, Wiesen K (2016) The nutritional footprint – integrated methodology
using environmental and health indicators to indicate potential for absolute reduction of natural resource
use in the field of food and nutrition. J Clean Prod 132:161–70.
Ribal J, Fenollosa ML, García-Segovia P, Clemente G, Escobar N, Sanjuán N (2016) Designing healthy, climate
friendly and affordable school lunches. Int J Life Cycle Assess 21(5):631–45.
Rosi A, Mena P, Pellegrini N, Turroni S, Neviani E, Ferrocino I, et al. (2017) Environmental impact of omnivorous,
ovo-lacto-vegetarian, and vegan diet. Sci Rep 7(1).
Röös E, Patel M, Spångberg J, Carlsson G, Rydhmer L (2016) Limiting livestock production to pasture and by-
products in a search for sustainable diets. Food Policy 58:1–13.
Serafini M, Toti E (2016) Unsustainability of obesity: Metabolic food waste. Front Nutr 3(40).
Sjörs C, Raposo SE, Sjölander A, Bälter O, Hedenus F, Bälter K (2016) Diet-related greenhouse gas emissions
assessed by a food frequency questionnaire and validated using 7-day weighed food records. Environ Health
15(1).
Springmann M, Godfray HCJ, Rayner M, Scarborough P (2016) Analysis and valuation of the health and climate
change cobenefits of dietary change. Proc Natl Acad Sci 113(15):4146–4151.
Tessari P, Lante A, Mosca G (2016) Essential amino acids: master regulators of nutrition and environmental
footprint? Sci Rep 6(1).
Tyszler M, Kramer G, Blonk H (2016) Just eating healthier is not enough: studying the environmental impact of
different diet scenarios for Dutch women (31–50 years old) by linear programming. Int J Life Cycle Assess
21(5):701–9.
Ulaszewska MM, Luzzani G, Pignatelli S, Capri E (2017) Assessment of diet-related GHG emissions using the
environmental hourglass approach for the Mediterranean and new Nordic diets. Sci Total Environ 574:829–
36.
Yue Q, Xu X, Hillier J, Cheng K, Pan G (2017) Mitigating greenhouse gas emissions in agriculture: From farm
production to food consumption. J Clean Prod 149:1011–9.

129
Appendix E. Examples of currently used indicators for sustainable
diets
In this section, we describe in more detail some of the indicators used in different studies (taken
from Jones et al. (2016) and identified in our complementary search) to assess the sustainability
of diets.
E1. Climate change
The most common way to assess the climate impact of a diet is to quantify the total amount of
emissions of GHG (including carbon dioxide, nitrous oxide and methane) associated with
production of the foods in the diet. This is also called the carbon footprint of the diet. Data on
the climate impacts of individual foods are commonly collected from LCA studies and multiplied
by the amount of a specific food in the diet to calculate the total climate impact from the diet.
There are several different types of LCA studies used to calculate the climate impact of different
foods:
● Process-based LCA This is the most common type of LCA and studies the emissions and resource use from a bottom-up
perspective considering the processes involved in the production of a product.
● Consequential LCA Consequential LCA (as opposed to attributional LCA) aims at evaluating the consequences of a change in
demand for a product. Consequential LCA can therefore be more useful in a decision-making process, as it
analyses the consequences of certain activities.
● Input-output model LCA Input-output model LCA uses monetary transactions to determine the environmental impact of goods and
services and how they relate to other industries.
● Hybrid LCA Hybrid LCA combines economic input-output models with process-based LCA.
Instead of using the LCA approach of multiplying the amount of food in the diet by its respective
carbon footprint, emissions of GHG from different diets can also be modelled using biophysical
or economic models that include emissions of different pollutants. This approach was applied by
Westhoek et al. (2014) to model the effect on health and environment of reducing meat and
dairy intake in Europe by 50%. Modelling approaches based on biophysical or economic models
are more complex and less transparent than the LCA approach, but are better able to account for
dependencies in production systems and biophysical and economic limits in production. For
example, when using the LCA approach to calculate the GHG emissions from e.g. a lacto-
vegetarian diet, this would not account for the emissions allocated to the beef meat that is
inevitably produced in the dairy system.

130
E2. Land use
The most common method for determining the requirement for land of a specific food item is as
follows: 1) the agricultural product that forms the basis of a food product is determined (for
pasta this would be wheat), 2) the amount of agricultural product needed for 1 kg of food
product (pasta) is then determined (in the case of pasta, it takes approximately 1.4 kg of wheat
to produce 1 kg of pasta). This value is divided by the yield of the crop (kg/ha), giving the area
needed to produce 1 kg of the given food product (Temme et al., 2013). Similarly, for animal
products, the type and amount of feed are used to calculate the land requirement.
Land use is commonly divided into different land types, although some studies show results of
land use on an aggregated level only. The importance of differentiating between different types
of land is important, as described by Hallström et al. (2014):
“When discussing availability of agricultural land it is necessary to distinguish between
different types of land [...] However, only some 30% of agricultural land available consists of
cropland. Meadows and pastures, which represent the remaining agricultural area, are only
to a limited extent suitable for cultivation. As the majority of current global food supply is
dependent on cultivated land pressure on agricultural land is especially intense on cropland.”
Peters et al. (2007) calculated annual per capita land requirement based on dietary intake, crop
yield and livestock feed requirements. Three types of land use were accounted for: cropland
usable for all crops, cropland limited to perennial crops and pasture, and land limited to
pasture. To account for annual variation in yields, land requirement was calculated using five
years of crop data. In an paper by Meier et al. (2014), land use for German consumption
patterns was analysed using seven land types in total: arable land (domestic or abroad), pastures
(domestic or abroad), permanent culture (domestic or abroad) and forest (wood production for
pallets, paper production for packaging material). Eshel et al. (2014) analysed the
environmental impact of the US diet and for dairy and beef production included three different
land types: pastureland, cropland and processed roughage land. Those authors discuss the
important distinction that these livestock systems use pastureland and not cropland, as these
pasture lands, at least in the western US, are unfit for crop production.
Stehfest et al. (2009) used IMAGE (Integrated Model to Assess the Global Environment), which
includes cropland and grassland as the main land types. For livestock systems, two variants are
included: pastoral and mixed/landless systems. Pastoral systems cover about two-thirds of the
global area of permanent pasture and are dominated by ruminant grazing. Landless ruminant
production systems are included in mixed/landless systems, since they have the same
interrelationships with crop and grass production systems (feed crops, fodder, manure, etc.) as
livestock production in mixed systems.
Arnoult et al. (2010) used a Land Use Allocation Model (LUAM) to analyse the landscape effects
in the UK of a dietary change to a healthy recommended diet according to the UK Department of
Health. Three main land types were identified: arable/grass ley, permanent pasture and rough
pasture.

131
Some studies have used the ‘ecological footprint’ (EF) methodology to describe land use, e.g.
Fairchild and Collins (2011) and Downs and Fanzo (2015). The EF measures how much
biologically productive land and sea is needed to support the consumption by an individual or
region. Biologically productive land and sea include cropland, forest and fishing grounds and
space for infrastructure and the land needed to absorb waste products generated by human
activities. The unit of EF is ‘global hectares’ (gha) and is usually expressed on a yearly basis for a
given population.
E3. Water use
The papers included in the review by Jones et al. (2016) often refer to the definition of a water
footprint (WF) as set out by the Water Footprint Network (Hoekstra et al., 2011). The WF is the
demand for freshwater resources required in all life cycle steps to produce goods and services. It
represents a measure of human appropriation of freshwater, which is measured as volume of
water used. Water use can be direct or indirect, where direct use is the individual’s direct
consumption of water, such as water for cooking, whereas indirect use, sometimes called ‘virtual
water’, is the water needed for all goods and services earlier in the supply chain. In addition,
water is divided into green, blue and grey water. Blue water is surface or groundwater, green
water is rain water or moisture stored in the topsoil layer and grey water is the volume of
freshwater needed to ‘assimilate a load of pollutants’ caused by the activity in question. The grey
water volume is affected by the natural background concentration of pollutions and existing
water quality standards. As blue water in some respect represents water as a finite resource, it is
common to let blue water represent the overall WF (Eshel et al., 2014).
Methodologies to account for differences in the actual impact of water use given regional
differences in water scarcity have also been developed (Ridoutt and Pfister, 2010). Hess et al.
(2015) suggests an indicator called Water Stress Index (WSI) which reflects blue water
availability. The WSI is expressed as a number between 0.01 and 1, where a value <0.01
indicates no water stress, values between 0.1 and <0.2 indicate low water stress, values between
0.2 and <0.4 indicate moderate water stress, values between 0.4 and <0.8 indicate high water
stress and values >0.8 indicate very high water stress. Hess et al. (2015) used the WSI to
calculate a blue water scarcity footprint (WSF) (m3 H20 equivalents) which reflects the
equivalent amount of water withdrawn from a water body at the global average level of water
stress.
There is some controversy as to whether water use quantification or including water stress is
most appropriate. Hoekstra (2016) lists the potential pitfalls and dangers of weighting the water
footprint with water stress or scarcity and argues that the WSI obscures the debate of water
resources, neglects the importance of green water scarcity, is inconsistent with how other
environmental footprints are designed and lacks ‘meaningful physical interpretation’. A recent
consensus building process within the UNEP-SETAC Life Cycle Initiative recommends the use
of the AWARE method which is based on “the quantification of the relative available water
remaining per area once the demand of humans and aquatic ecosystems has been met”
(Boulay et al., 2018).

132
E4. Energy use
One common method for evaluating energy use in relation to diets or food items is the
Cumulative Energy Demand, which corresponds to the primary energy use, i.e. the amount of
energy as it is found in nature before any human-engineered conversion or transformation has
been applied. Davis and Sonesson (2008) analysed different meals using several environmental
impact categories and report results for both primary energy and secondary energy use, where
the latter is energy that has been converted to more ‘convenient forms of energy’ (sic) such as
electricity.
Some studies make a distinction between renewable and non-renewable energy. For example,
He et al. (2016) evaluated energy use of two different agricultural systems using the demand for
non-renewable energy resources. This assessment included energy used to produce fertilisers
and pesticides and the amount of diesel used on farms (evaluated through interviews with
farmers). Energy use was then aggregated into an impact category called ‘Energy depletion’,
which measured energy use (MJ) per tonne of produce.
Several studies have energy use incorporated into aggregate methods, such as the
Ecoindicator95+ or ReCiPe life cycle impact assessment methods, where energy use is combined
with other impact categories to yield an overall environmental score (e.g. Baroni et al., 2007,
2014; Tyszler et al., 2016).
Coley et al. (2009) conducted analyses on different models for consumer shopping habits, where
the distance travelled by car assigned for shopping was compared with a centralised system
where food was instead transported to a semi-local hub of the retailer. Different types of fuel
and energy use were calculated, but were not related to food production specifically, but rather
to consumer activities ‘around’ food.
E5. Biogeochemical flows
One of the most commonly used metrics to assess the impact of foods, meals and diets on
biogeochemical flows is Eutrophication Potential (EP) (Guinée et al., 2002). The EP accounts for
different types of nutrient pollution (including nitrate leaching from fields, emissions of
ammonia from manure management, phosphate runoff from fields etc.) by aggregating their
impact based on how much each substance contributes (in terms of mass) to forming a typical
aquatic organism, commonly an alga. In its simplest form, the EP do not consider any site-
specific issues, e.g. the nutrient that is limiting in a certain waterway or how much of a certain
substance actually reaches the waterway (fate). Such a simple EP method was used by e.g.
Muñoz et al. (2010), while Saarinen et al. (2012) used site-specific factors for Finland. Since the
actual negative impact from the release of nutrients into the environment is highly site-specific,
regional factors that include more relevant factors along the damage pathway are preferable.
However, when looking at diets including many food categories, it is not always possible to trace
products back to the actual sites where production takes place and, even if it is, regional factors
might not be available.

133
Other indicators in this area include ‘added nitrogen’ (Eshel et al., 2014; Gill et al., 2015) and
‘phosphorus use’ (Meier and Christen, 2013; Gill et al., 2015), hence using the amount of ‘new
nutrients’ added into the agricultural system as a proxy for the imbalances caused by agriculture
in terms of biogeochemical flows. The nitrogen footprint is another indicator, defined as “the
total direct N-losses to the environment that occur for the production of one unit of (food)
product, measured in g N/kg food product” (Leip et al., 2014). Leip et al. (2014) also introduce
the ‘nitrogen investment factor’, defined as the external N required to produce one unit of
product in terms of N contained.
Westhoek et al. (2014) modelled decreased consumption of meat and dairy in Europe using
several indicators, including added nitrogen, emissions of nitrate to groundwater and surface
water, emissions of ammonia to air and nitrogen use efficiency.
Similarly to the EP, there is also a method for quantifying the Acidification Potential (AP) that
some studies have used. As the AP from agriculture is dominated by emissions of ammonia,
using ‘ammonia emissions’ as an indicator, as done e.g. by Meier and Christen (2013) and
Westhoek et al. (2014), is a good proxy for the acidification for foods and diets if post-farm
stages do not add considerable amounts of acidifying substances from energy use.
E6. Biodiversity
The review by Jones et al. (2016) included only one paper assessing the impacts of different
diets on biodiversity (Röös et al., 2015a) and our complementary search identified another two
articles (Röös et al., 2016a; Gustafson et al., 2016).
Röös et al. (2015a) investigated biodiversity damage potential (BDP) from land use with a
method developed by de Baan et al. (2012). The method assesses the impact on biodiversity on a
global scale and is based on differences in species richness between land use types. The data
inputs are: hectares of land occupied, classified by land type (annual crops, permanent crops,
pastures and meadows) and biome (natural vegetation type, e.g. temperate broadleaf forest or
tropical savannah). The resulting BDP is based on differences in species richness between
agricultural and natural land use of the biome. One limitation with this method is that the
positive biodiversity effects of semi-natural pasture in Sweden and around Europe are not
included in BDP, nor are potential benefits from organic production. Another limitation is that
positive biodiversity effects by preservation of agricultural land in forest-dominated regions, for
example in Sweden, are not included in the method.
A later paper by Röös et al. (2016a) created three scenarios based on the concept of ‘livestock on
leftovers’ for livestock production (see section 4.7). Biodiversity impacts were not quantitatively
assessed, but the preservation of current semi-natural grassland and arable land in Sweden was
set as a boundary condition.
Gustafson et al. (2016) defined seven metrics (each based on a combination of multiple
indicators) for use in characterising sustainable nutrition outcomes of food systems (section 4.3)
134
and used the indicator ‘Ecosystem Status’, one of five indicators of the metric ‘Ecosystem
Stability’. The data used for the indicator Ecosystem Status are underlying national data for
Environmental Performance Index (EPI)38. The EPI is used to rank countries using 24
performance indicators for environmental health (household solid fuels, PM2.5 exposure and
exceedance, drinking water, sanitation, lead exposure, air and water quality and heavy metals)
and ecosystem vitality (indicators related to biodiversity and habitat, forests, fisheries, climate
and energy, air pollution, water resources and agriculture). Although many of these are related
to food production, many are not directly so, which makes this index a blunt instrument for
describing food system biodiversity impacts. Gustafson et al. (2016) point out that it would be
desirable to include additional measures of ecosystem status, such as desertification,
salinisation and soil degradation, in this indicator. Chaudhary et al. (2018), who applied the SNS
framework, therefore added the indicator Biodiversity Footprint (Chaudhary and Kastner, 2016)
to the Ecosystem Stability metric, which enabled the land use biodiversity impacts associated
with internationally traded foods to be accounted for. Chaudhary and Kastner (2016) quantified
biodiversity impacts from habitat loss/degradation due to land use for cropping by assessing the
species loss by a specific land use compared with the original natural habitat. However, crop
production also leads to negative impacts on biodiversity, from e.g. nutrient leaching from fields
causing eutrophication of waterways and other damage pathways that this method does not
capture. Hence, biodiversity impacts are probably underestimated. Quantifying impacts on
biodiversity from all such pathways is highly challenging.
In the general LCA literature, several methods for capturing the biodiversity impacts from land
use have been suggested (Curran et al. (2016) provide an overview and Chaplin-Kramer et al.
(2017) provide some further interesting advances). However, the review by Jones et al. (2016)
and our follow-up search showed that these have not yet been used extensively in assessing the
sustainability of diets, probably due to lack of data.
E7. Social equity
It is difficult to find an indicator that measures social equity in relation to food and diets in a
straightforward manner. None of the studies investigated explicitly measured social equity.
However, some other concepts might be useful to capture social equity in relation to food, for
example, the distribution of food. Since the FAO has data on the calorie consumption of
different regions, as well as divided between calories from plant and animal products, we can
easily handle calories (and their origin) in the same manner as sociologists and economists
would handle income. Through indicators such as the Gini coefficient and Hoover concentration
index, we can determine the distribution of calories between countries and regions and easily
measure when equity is falling or rising in the world (White, 2000). By relating calorie
consumption to environmental impact of a region's food consumption, we can also measure
whether all countries or regions ‘contribute’ to environmental issues equally. White (2000) also
relates food consumption of a region or a country to its food production, i.e. how much global
land is taken to uphold a country’s consumption level. This also relates to the production
38https://epi.envirocenter.yale.edu/

135
capacity of a country, where countries or regions that produce less than they consume would
contribute to injustice in the distribution and consumption of food. White (2000) also discusses
different indicators for evaluating the diversity of food items in a particular food system, where
large differences in food system diversity could be a relevant indicator of injustice in the
availability of food.
Gustafson et al. (2016) provide metrics for ‘sustainable nutrition security’, where several
indicators might be useful. The dimensions ‘food nutrient adequacy’, ‘food affordability and
availability’ and ‘sociocultural wellbeing’ all have some indicators that try to evaluate certain
aspects of social and nutritional equity in a country or a region. Furthermore, Gustafson et al.
(2016) use indices for child labour, gender equity and respect for community rights to evaluate
sociocultural wellbeing.
There are several labelling schemes to enable consumers to purchase foods that have been
produced with social aspects accounted for, Fairtrade being one of the best known. The studies
included in the review by Jones et al. (2016) only analysed consumer perception in relation to
Fairtrade products, and not the impact of diets containing Fairtrade products on social equity.
E8. Animal welfare
As with the topic of social equity, the few studies that mention animal welfare do this in relation
to consumer behaviour and determinants of food purchases. Gustafson et al. (2016) include the
indicator ‘Animal Protection Index’, which ranks countries from a high ‘A’ to a low ‘G’. However,
as with social equity, this is on a country rather than on a diet basis. Scherer et al. (2017) present
a framework for including animal welfare in LCA and exemplify this for eight products; beef,
pork, poultry, milk, eggs, salmon, shrimps and insects, which could enable inclusion of this
aspect in assessments on dietary level.
E9. Cultural appropriateness
Few studies to date have considered the cultural appropriateness of diets. One rare example is
the study by Wilson et al. (2013), in which the authors constructed ‘familiar’ meals with
constraints regarding cost and GHG emissions. Some studies that have optimised diets for
nutrient adequacy and low environmental impacts have included the constraint that the diets
should resemble current eating patterns in term of amounts of different food types in the diet
(Kramer et al., 2017; Vieux et al., 2018). Capturing the cultural appropriateness of diets is highly
challenging, as diets are constantly changing and highly variable among population groups
(Röös et al., 2016a).

136
Appendix F. Sustainable dietary recommendations
Table F1. Official dietary guidelines that include sustainability
Country, link to more
information
Summary of advice on:
● Sustainability (first bullet)
● Dairy and plant-based dairy alternatives (second bullet)
Germany (2013).
http://www.fao.org/3/a-
i5640e.pdf page 18-20
● The actual text only provides some mention of environmental issues. Each
guideline is followed by a brief paragraph expanding on the particular issue.
While there is no mention of sustainability in the top level messaging, some of
the explanatory paragraphs do contain sentences that refer to sustainability or
the environment.
● Consume milk and dairy products daily. Choose low fat. No advice on plant
based alternatives.
Brazil (2014).
http://www.fao.org/3/a-
i5640e.pdf page 23-28
● Sustainability is a cross-cutting theme in the guidelines, if not always explicitly
articulated. The third principle of the guidelines is: “healthy diets derive from
socially and environmentally sustainable food systems”. Each recommendation
in the ‘Choosing foods’ chapter is followed by the rationale behind the
recommendations, including health, environmental and social implications.
However, the summary of main recommendations only briefly mentions
environmental sustainability.
● Milk drinks and yogurts that have been sweetened, coloured and flavoured are
ultra-processed foods, and as such should be avoided. No advice on plant-based
alternatives.
Sweden (2015).
http://www.fao.org/3/a-
i5640e.pdf page 28-32
● Sustainability is embedded throughout the guidelines – the document actually
begins with a prologue entitled “Sustainable big picture”. On entering the main
website of the NFA, the first, highly visible, subheading on the site is “Food
habits, health and environment”. The document highlights a broad range of
environmental concerns, from climate change to pesticide use and the
eutrophication of water bodies. It touches too on broader sustainability issues,
such as animal welfare and antibiotic use in farm animals. Unlike most of the
other guidelines reviewed, it also considers some of the complexities inherent in
defining sustainability.
● Choose low-fat, unsweetened products enriched with vitamin D. No advice on
plant-based alternatives.
Nordic countries: Nordic
Nutrition Recommendations
(NNR) (2012):
http://norden.org/en/theme/for
mer-themes/themes-
2016/nordic-nutrition-
recommendation/nordic-
nutrition-recommendations-2012
page 137-154
● The Swedish dietary guidelines are based on the Nordic Nutrition
Recommendations (NNR) and the Swedish national dietary survey, which takes
into account the specific dietary pattern of the Swedish population. NNR are
released every eight years and aim to create recommendations on micro- and
macronutrients for the population in the Nordic countries. A chapter on
“sustainable food consumption - environmental issues” was included for the
first time in the latest edition of NNR, released in 2012. The chapter also
included a presentation of possible dietary changes from current consumption
patterns to reach a sustainable diet. The Swedish National Food Agency is the
first, and as of today the only, Nordic stakeholder to translate the sustainable
food recommendations into national dietary guidelines.
● See section 5.2.3
Qatar (2014).
http://www.fao.org/3/a-
i5640e.pdf page 33-35
● The Qatar guidelines include “eat healthy while protecting the environment” as
one of the eight guidelines. The section of the document dedicated to this
guideline starts by justifying the inclusion of sustainability in the
recommendations, describing some of the ways food is linked to the
environment. That section offers advice on how to eat sustainably. Almost all
references to sustainability are limited to this section. The only exception is in
the section about fish, where the guidelines recommend looking in “online
seafood guides” for information about the “healthiest and most environmentally
friendly” products. Most notably, the section on meat and meat alternatives
does not discuss the environmental impact of those products – although it does

137
recommend eating at least one meatless meal per week, limiting red meat
consumption to 500g per week and avoiding processed meats.
● Consume milk and dairy products daily. Choose low fat. If you do not drink
milk or eat dairy products, choose other calcium- and vitamin D-rich foods (e.g.
fortified soy drinks, almonds, chickpeas)
Table F2. Quasi-official guidelines.
Country/guide, link to more
information
Summary of advice on sustainability
Germany.
The Sustainable Shopping Basket (2013).
http://www.fao.org/3/a-i5640e.pdf page 21
https://friendsoftheearth.uk/sites/default/f
iles/downloads/Sustainable_diets_January
_2016_final.pdf
page 25
The German government has supported the development of guidelines to inform
purchasing decisions: The Sustainable Shopping Basket. The recommendations
for reducing meat consumption (to between 300 and 600 g per week) and to
consume 5 servings of fruit and vegetables every day are based on the German
dietary guidelines.
Germany.
AID-Food Pyramid.
http://www.fao.org/3/a-i5640e.pdf page 22
The German Agency for Consumer Information (AID) information service has
developed its own pyramid, based on the German dietary guidelines, but presents
simplified food groups. The AID website has a section on advice on nutrition and
climate protection.
The Netherlands (2011).
Guidelines for a healthy diet: the
ecological perspective.
http://www.fao.org/3/a-i5640e.pdf page
38-41
Environmental analysis of the 2006 Dutch guidelines for a healthy diet
The Netherlands (2015).
Dutch Dietary Guidelines, 2015
Summary (“The guidelines in brief”):
https://www.gezondheidsraad.nl/sites/de
fault/files/guidelines_in_brief_201524ed
utch_dietary_guidelines_2015_0.pdf
Complete publication:
https://www.gezondheidsraad.nl/sites/de
fault/files/201524edutch_dietary_guideli
nes_2015.pdf page 78
The Health Council of the Netherlands published new Dutch dietary guidelines in
2015. The guidelines focus on health. The summary of Dutch dietary guidelines
does not mention any other sustainability consideration except health. The
complete publication also focuses on health, but sustainability considerations are
mentioned in half a page of text about ecological aspects. The Committee has
concluded that: ”as well as having health benefits, following a number of the
recommendations would lead to dietary patterns with ecological benefits...
Generally speaking, a diet that includes less food from animals and more plant-
based food has a lower ecological burden than a conventional Dutch diet. From
that perspective, it is advisable to moderate high dairy product consumption as
well”.
Estonia
http://www.fao.org/3/a-i5640e.pdf page
46
The dietary guidelines (2006) do not mention sustainability. However, the website
that hosts the guidelines presents an updated version of the principles upon which
a healthy diet is based, with the inclusion of the following principle:
“Eat in an environmentally conscious way (this includes: 1) plant based, 2)
biologically diverse and species rich, 3) local, seasonal and traditional, and 4)
produced sustainably”.
United Kingdom (2007)
http://www.fao.org/3/a-i5640e.pdf page
47-51 and
“The principles of healthy and sustainable
eating patterns. Follow-on work to the
Green Food Project, focusing on
sustainable consumption” by Tara Garnett
and Maureen Strong (2014). These
authors also co-chaired the working
groups for this report.
The dietary guidelines (2007) do not mention sustainability. However, the UK
government enabled a multi-stakeholder process, which led to eight “Principles of
healthy and sustainable eating patterns”.
Each principle is communicated by a short headline message, followed by a brief
explanation of the message and the rationale behind it, relevant qualifiers and
caveats to the advice provided and a list of the literature sources to support of each
recommendation.
Note that the principles are not owned or endorsed as such by Government.

138
United Kingdom (2016)
The Eatwell Guide has replaced the
Eatwell Plate and continues to define the
government’s advice on a healthy
balanced diet.
https://www.gov.uk/government/public
ations/the-eatwell-guide
and
https://www.carbontrust.com/resources
/reports/advice/sustainable-diets/
The dietary guidelines (2016) have the headline “Use the Eatwell Guide to help
you get a balance of healthier and more sustainable food”.
The names of the food group segments have been updated to place emphasis on
certain food products within a food group that can be considered more
environmentally sustainable. For example, the pink segment is named ‘‘Beans,
pulses, fish, eggs, meat and other proteins’ to highlight the contribution non-
meat sources make to protein intake. Sustainability issues are also discussed
when it comes to seafood. According to the Carbon Trust analysis, the Eatwell
Guide shows an appreciably lower environmental impact than the current UK
diet. We note that parallel improvements in production efficiency and waste
reduction will help too.
A number of differences contribute to the reduction, such as increasing potatoes,
fish, wholemeal & white bread, vegetables and fruit whilst reducing amounts of
dairy, meat, rice, pasta, pizza and sweet foods.
France (2002)
http://www.fao.org/3/a-i5640e.pdf page
51
The dietary guidelines (2002) do not mention sustainability. However, the
French Agency for the Environment and Energy has produced a set of
recommendations aimed at individuals and “eco-citizens” to promote sustainable
shopping habits. A section of their website called “Mes Achats” (My purchases)
provides three main messages: to promote seasonal products, to ‘adopt diets that
combine health, environment and fun’ (i.e. replace a meat dish with one based on
grains or legumes once a week), ‘buy products with environmental labels’, and
limit food waste.
Sweden, Eat S.M.A.R.T.
http://www.wageningenacademic.com/d
oi/abs/10.3920/978-90-8686-187-3_15
The ‘Eat S.M.A.R.T.’ concept was first released in Sweden in 2001 by Stockholm
County Council and the latest update was in 2008. The concept is still used in
different contexts in Sweden, for example in the Swedish city of Malmö.
(Information in Swedish:
http://folkhalsoguiden.se/amnesomraden/mat/informationsmaterial/smart/)
Healthy and sustainable eating with the
Flemish Food Triangle. The Food
Triangle is based on an extensive
literature review and consultation with
experts. The result is a realistic and
sustainable model that fits perfectly with
Flemish eating culture.
Link:https://www.gezondleven.be/files/
voeding/Healthy-Living-2017-Food-
Triangle.pdf
1. Eat proportionally more foods that are derived from plants than foods
that are derived from animals.
2. Avoid ultraprocessed foods as much as possible
3. Don’t waste food. Moderate your consumption

139
Table F3. Non-official sustainable dietary guidelines
Organisation, link to more
information
Summary of advice on sustainability
WWF UK: LiveWell (2011)
http://www.fao.org/3/a-
i5640e.pdf page 52-53
http://assets.wwf.org.uk/downloa
ds/livewell_report_jan11.pdf
WWF Europe: LiveWell for LIFE
http://livewellforlife.eu/knowledge
-centre
Project initiated by WWF UK, where researchers developed diets that conformed to
the government’s dietary guidelines and also achieved reductions in absolute food-
related greenhouse gas emissions.
The project and its approach were subsequently extended to Sweden, France and
Spain under the name Livewell for LIFE. Although it has no official status, LiveWell
has been instrumental in introducing sustainable diets onto the European political
agenda. Based on the experiences gained, WWF now promotes the “6 Livewell
Principles”.
WWF UK: Eating for 2 degrees –
new and updated Livewell Plates
(2017)
https://www.wwf.org.uk/eatingfor
2degrees
New Livewell report which looks at what we need to eat between now and 2030 to
meet our Paris Agreement commitments. Besides carbon reduction targets, the
report includes further environmental criteria – particularly water use and land
footprint. The report also includes Livewell Plates for adolescents, the elderly and
vegans for the first time.
Barilla Center for Food and
Nutrition (BCFN): Barilla double
pyramid (version 6th: 2015)
http://www.fao.org/3/a-
i5640e.pdf page 53-54
The model presents two pyramids. The first is the familiar food pyramid – in this
case, based on the principles of the Mediterranean diet. The second is inverted and
reclassifies foods according to their environmental impact, with the most damaging
foods placed at the top.
Food Climate Research Network
(FCRN) - Changing what we eat -
http://www.fao.org/3/a-
i5640e.pdf page 55
http://www.fao.org/3/a-
i5640e.pdf Box 1 on page 1
”Characteristics of low
environmental impact diets
consistent with good health”.
Report based on discussions arising from a workshop in April 2014, organised by the
FCRN, funded and hosted by the Wellcome Trust with additional support from the
UK‟ s multi-agency Global Food Security programme. The aim of the workshop was
to bring together academic researchers spanning diverse disciplines, as well as
stakeholders from business & civil society, to consider the state of thinking on
sustainable healthy eating and food systems and begin scoping a research agenda on
how our eating practices might be shifted in healthier and more sustainable
directions. The report includes a list of the 10 general principles of sustainable
healthy diets. The list was previously published in
https://fcrn.org.uk/sites/default/files/fcrn_wellcome_gfs_changing_consumption_
report_final.pdf Box 1 on page 8: “Characteristics of healthier and less GHG- and
land-intensive eating patterns”.
The only quasi-official guidelines that mention dairy and plant-based dairy alternatives are the
UK Green Food Project, which states: “Include milk and dairy products in your diet or seek out
plant based alternatives, including those that are fortified with additional vitamins and
minerals.” Among the non-official guidelines, it can be noted that the Barilla pyramids have
cheese towards the top, while milk and yogurt are in the middle of the pyramid. The FCRN’s
Changing What We Eat report say that dairy products or alternatives, i.e. fortified milk
substitutes and other foods rich in calcium and micronutrients, should be eaten in moderation.

140
Appendix G. Fortification
Calcium
In a systematic review by Rafferty et al. (2007), the question of bioavailability of calcium
supplements and fortification was assessed. The authors concluded that calcium uptake depends
on several factors, such as associated salt, size of calcium load, vitamin D status and the
associated matrix, i.e. calcium suspended in food or liquid. For calcium suspended in a matrix
(as is the case for plant-based dairy alternatives), the absolute absorption fraction varied
between 24 and 40 %. In relation to cow’s milk, calcium uptake varied between 81.7 and 111.4 %.
The most common calcium fortificants for soy milk on the American market are calcium
carbonate (CC) and tricalcium phosphate (TCP) (Zhao et al., 2005). According to Heaney et al.
(2000), TCP in soy milk has 25% lower uptake than calcium from cow’s milk. This was
confirmed by Zhao et al. (2005), who found that CC in soy milk had the same fractional
absorption as that in cow’s milk (both ~21%), whereas TCP in soy milk had lower fractional
absorption (~18%). Zhao et al. (2005) concluded that higher absolute fortification with TCP in
soy milk can compensate for the slightly lower fractional absorption, thus making it a viable
fortification agent.
Vitamin D
Vitamin D is formed from cholesterol in humans when sunlight hits the skin, thus making intake
of vitamin D redundant in theory. In practice, however, vitamin D deficiency is very common in
some populations, especially in the northern hemisphere where the body’s ability to form
vitamin D is inhibited during the winter season (Melina et al., 2016). Dietary intake of vitamin D
is therefore recommended. Vitamin D is present in two different forms, D2 (ergocalciferol) and
D3 (cholecalciferol).
While D2 is exclusively derived from plants, D3 can be derived from both plants and animals
(although the majority of supplements and food fortification agents use D3 derived from
animals). In a systematic review and meta-analysis, Tripkovic et al. (2012) investigated the
effect of D3 and D2 on raising serum levels of vitamin D for bolus doses (large doses given
infrequently) and for all protocols combined, Vitamin D3 was found to be more efficacious than
D2 in raising plasma levels of vitamin D. However, when daily supplementation (25-100 µg per
day) was analysed separately, there was no difference in efficacy between the two forms of
vitamin D. However, the recommended daily intake of vitamin D is defined by most nutrition
authorities to be between 7.5 µg and 15 µg, significantly lower than was investigated in any of the
trials in the systematic review. In a recent trial with the same lead author, Tripovic et al. (2017)
investigated whether smaller daily doses of 15 µg of vitamin D2 versus D3 as a food fortificant
differed in their effect in raising serum levels of vitamin D. Both forms of vitamin D managed to
satisfactorily raise the serum level of vitamin D, but vitamin D3 was twice as efficacious as D2 in
raising serum levels (by 74-75%, compared with 33-34% for vitamin D2. In conclusion, even if
vitamin D2 is satisfactory in raising serum levels of vitamin D, a higher fortification level might
be warranted in order to achieve the same magnitude of effect as with vitamin D3.

141
Iodine
Since dairy products are a source of iodine and plant-based dairy are not, how the individual’s
iodine status is affected by iodine fortification is a relevant question. The literature on iodine
fortification in liquids is scarce, but iodine fortification in general is a more established topic.
Organic iodine biofortification is subject to cooking losses under some circumstances (Cerretani
et al., 2014), although not in the majority of the cases, and the stability of iodised salt in the
form of potassium iodate seems to be stable up to 350 degrees Celsius (Bhatnagar et al., 1997). A
commercial fruit drink (NutriStar™) fortified with several vitamins and minerals (iodine
included) showed excellent bioavailability of all nutrients included (Mehansho et al., 2003).
Riboflavin
Riboflavin plays a small but important part in human energy metabolism. Deficiency leads to
inflammation of the mouth cavity and possibly birth defects if it occurs during pregnancy.
Riboflavin is slightly sensitive to light and humidity, but otherwise considered a stable
micronutrient (Gadient, 1986). Absorption of free riboflavin is estimated to be 50-60% in doses
from 2 to 25 mg (NNR, 2014).
Vitamin B12
Vitamin B12 is a vitamin that is exclusively found in animal-derived foods, such as dairy, meat
and eggs. Inactive analogues may be found in certain plant foods, such as algae. Since these
analogues only block the receptor for the uptake of B12, these types of food should not be taken
simultaneously with B12-rich foods (NNR, 2014). In the early stages, B12 deficiency typically
leads to anaemia and later to nerve cell damage. The most common form of B12 in food
supplements and fortified foods is cyanocobalamin. The different forms of B12 are estimated to
have approximately the same bioavailability (Adam et al., 1971). Vitamin B12 is slightly sensitive
to temperature, oxygen and humidity, but otherwise considered stable (Gadient, 1986).
Environmental impacts from fortification agents
Data on the environmental impact of fortification agents are scarce. In a Master’s project at
Lund University, the environmental impact of fortification agents for oat drink was estimated
and found to be relatively small compared with the impact of the rest of the production (Jarlbo,
2016). More research is needed in this area in order to quantify the magnitude of the
environmental impact from fortification. A relevant contribution to this discussion is that
fortification of dairy cow feed is also common practice, in amounts similar to that of plant-based
dairy alternatives (~140 mg of minerals and 1 mg vitamin per 100 g milk) (Röös et al., 2015b).
However, when ‘processed’ through the animal, the calcium fortified in the feed reaches a higher
quality than the direct fortification in plant beverages.
Fortification and naturalness
When discussing fortification, the question of ‘naturalness’ often arises. ‘Natural’ is a term with
highly positive connotations and is frequently used to label food products. To a large extent, the
use and definition of the term natural is a philosophical question. Sandin (2017) points out that
the term ‘natural’ is both vague and polysemous (several related meanings), which poses a
challenge to anyone who wish to operationalise and define this term.

142
Challenges in developing fortification strategies
Weighting optimal nutrition of the individual against a level of adequate or ‘good enough’
nutrition for the many, for example in developing nutrient recommendations, is challenging.
The requirement of any given nutrient is assumed to be normally distributed, meaning that if
recommendations are set at the mean level of requirement, 50% of population would not have
their nutrient requirements met at the recommended level of intake. The prevailing approach to
this dilemma has been to add at least two standard deviations to the mean requirement and in
that way include at least 95% of the population. However, different demographic groups have
different nutritional requirements, so it has to be decided whether fortification programmes and
nutritional and dietary recommendations should be designed to fit the most vulnerable, or the
average population as a whole. For example, there is a large minority (women and girls of
childbearing age) which has a larger iron requirement than the rest of the population, while at
the same time there is a small minority (0.5%) which is especially sensitive to high iron intake
(people with haemochromatosis). When considering these two groups simultaneously, should
staple foods be fortified with iron? Another consideration is that the adverse effect of excess iron
in the few people with haemochromatosis is far larger than the adverse effects of insufficient
iron intake for many women and girls. Hence, it is not easy to decide which strategy is
preferable, and different countries choose different strategies.

143
References to the appendices
Adams JF, Ross SK, Mervyn L, Boddy K, King P (1971) Absorption of cyanocobalamin, coenzyme B 12 ,
methylcobalamin, and hydroxocobalamin at different dose levels. Scand J Gastroenterol 6(3),
249-52.
Arnoult MH, Jones PJ, Tranter RB, Tiffin R, Traill WB, Tzanopoulos J (2010) Modelling the likely impact
of healthy eating guidelines on agricultural production and land use in England and Wales. Land
Use Policy 27(4), 1046–55.
Baroni L, Berati M, Candilera M, Tettamanti M (2014) Total Environmental Impact of Three Main Dietary
Patterns in Relation to the Content of Animal and Plant Food. Foods 3(3), 443–60.
Baroni L, Cenci L, Tettamanti M, Berati M (2007) Evaluating the environmental impact of various dietary
patterns combined with different food production systems. European Journal of Clinical
Nutrition 61(2), 279.
Bhatnagar A, Maharda NS, Ambardar VK, Dham DN, Magdum M, Sankar R (1997) Iodine loss from
iodised salt on heating. Indian J Pediatr 64(6), 883–5.
Bossel H (1999) Indicators of sustainable development: theory, method, applications. A report to the
Balaton group. International Institute for Sustainable Development, Winnipeg, Canada.
Boulay A-M, Bare J, Benini L, Berger M, Lathuillière MJ, Manzardo A, . . . Pfister S (2018). The WULCA
consensus characterization model for water scarcity footprints: assessing impacts of water
consumption based on available water remaining (AWARE). The International Journal of Life Cycle
Assessment, 23(2), 368-378.
Broman GI, Robèrt K-H (2017) A framework for strategic sustainable development. Journal of Cleaner
Production 140, 17–31.
Cerretani L, Comandini P, Fumanelli D, Scazzina F, Chiavaro E (2014) Evaluation of iodine content and
stability in recipes prepared with biofortified potatoes. Int J Food Sci Nutr 65(7), 797–802.
Chaplin-Kramer R, Sim S, Hamel P, Bryant B, Noe R, Mueller C, Daily G. et al. (2017) Life cycle
assessment needs predictive spatial modelling for biodiversity and ecosystem services. Nature
Communications 8, 15065.
Chaudhary A, Kastner T (2016) Land use biodiversity impacts embodied in international food trade.
Global Environmental Change 38, 195–204.
Chaudhary A, Gustafson D, Mathys A (2018) Multi-indicator sustainability assessment of global food
systems. Nature Communications 9(1), 848. doi:10.1038/s41467-018-03308-7
Coley D, Howard M, Winter M (2009) Local food, food miles and carbon emissions: A comparison of farm
shop and mass distribution approaches. Food Policy 34(2), 150–5.
Curran M, Maia de Souza D, Antón A, Teixeira RFM, Michelsen O, Vidal-Legaz B, . . . Milà i Canals L
(2016). How Well Does LCA Model Land Use Impacts on Biodiversity?—A Comparison with
Approaches from Ecology and Conservation. Environmental Science & Technology 50(6), 2782-
2795.
Davis J, Sonesson U (2008) Life cycle assessment of integrated food chains—a Swedish case study of two
chicken meals. International Journal of Life Cycle Assessment 13(7), 574.
de Baan L, Alkemade R, Koellner T (2013) Land use impacts on biodiversity in LCA: a global approach.
The International Journal of Life Cycle Assessment 18(6),1216–30.
de Olde EM, Moller H, Marchand F, McDowell RW, MacLeod CJ, Sautier M, et al. (2017) When experts
disagree: the need to rethink indicator selection for assessing sustainability of agriculture.
Environment Development Sustainability 19(4), 1327–42.

144
Downs SM, Fanzo J (2015) Is a Cardio-Protective Diet Sustainable? A Review of the Synergies and
Tensions Between Foods That Promote the Health of the Heart and the Planet. Curr Nutr Rep
4(4), 313–22.
Eshel G, Shepon A, Makov T, Milo R (2014) Land, irrigation water, greenhouse gas, and reactive nitrogen
burdens of meat, eggs, and dairy production in the United States. Proceedings of the National
Academy of Sciences 111(33), 11996-12001. doi:10.1073/pnas.1402183111
Fairchild R, Collins A (2011) Serving up Healthy and Sustainable School Meals? An Analysis of School
Meal Provision in Cardiff (UK). Journal of Environmental Policy & Planning 13(3), 209–29.
Forouzanfar et al. (2015) Global, regional, and national comparative risk assessment of 79 behavioural,
environmental and occupational, and metabolic risks or clusters of risks in 188 countries, 1990–
2013: a systematic analysis for the Global Burden of Disease Study 2013. Lancet 5;386
(10010):2287–323.
Gadient M (1986) Effect of pelleting on nutritional quality of feed. In Proc. 1986 Maryland Nutrition
Conference Feed Manufacturers, College Park, Maryland.
Gill M, Feliciano D, Macdiarmid J, Smith P (2015) The environmental impact of nutrition transition in
three case study countries. Food Security 7(3), 493-504. doi:10.1007/s12571-015-0453-x
Guinée JB, Gorrée M, Heijungs R, Huppes G, Kleijn R, Koning A, Huijbregts MAJ et al. (2002) Handbook
on life cycle assessment. Operational guide to the ISO standards. I: LCA in perspective. IIa: Guide.
IIb: Operational annex. III: Scientific background. Kluwer Academic Publishers, ISBN 1-4020-
0228-9, Dordrecht, Holland.
Gustafson D, Gutman A, Leet W, Drewnowski A, Fanzo J, Ingram J (2016) Seven Food System Metrics of
Sustainable Nutrition Security. Sustainability 8(3):196.
Hák T, Janoušková S, Moldan B (2016) Sustainable Development Goals: A need for relevant indicators.
Ecological Indicators 60, 565-573. doi:10.1016/j.ecolind.2015.08.003
He X, Qiao Y, Liu Y, Dendler L, Yin C, Martin F (2016) Environmental impact assessment of organic and
conventional tomato production in urban greenhouses of Beijing city, China. Journal of Cleaner
Production 134, 251–8.
Heaney RP, Dowell MS, Rafferty K, Bierman J (2000) Bioavailability of the calcium in fortified soy
imitation milk, with some observations on method. American Journal of Clinical Nutrition 71(5),
1166–1169.
Heller MC, Keoleian GA, Willett WC (2013) Toward a Life Cycle-Based, Diet-level Framework for Food
Environmental Impact and Nutritional Quality Assessment: A Critical Review. Environmental
Science & Technology 47(22), 12632-12647.
Hess T, Andersson U, Mena C, Williams A (2015) The impact of healthier dietary scenarios on the global
blue water scarcity footprint of food consumption in the UK. Food Policy 50, 1–10.
HLPE (2017) Nutrition and food systems. A report by the High Level Panel of Experts on Food Security
and Nutrition of the Committee on World Food Security, Rome, Italy.
Hoekstra AY (2016) A critique on the water-scarcity weighted water footprint in LCA. Ecological Indicators 66, 564–73.
Hoekstra AY, Chapagain AK, Aldaya MM, Mekonnen MM (2011) The Water Footprint Assessment
Manual: Setting the Global Standard, Water Footprint Network, Earthscan, London &
Washington DC, 224.
Horton P, Koh L, Guang VS (2016) An integrated theoretical framework to enhance resource efficiency,
sustainability and human health in agri-food systems. Journal of Cleaner Production 120, 164–9.
Jarlbo C (2016) Environmental impact of micronutrients for food fortification-Life cycle assessment of
added nutrients in Oatly oat drink. Lund University, Lund, Sweden.
Jones AD, Hoey L, Blesh J, Miller L, Green A, Shapiro LF (2016) A Systematic Review of the
Measurement of Sustainable Diets. Adv Nutr Int Rev J 1;7(4):641–64.

145
Kanter R, Walls HL, Tak M, Roberts F, Waage J (2015) A conceptual framework for understanding the
impacts of agriculture and food system policies on nutrition and health. Food Security 7(4),767–
77.
Kramer G, Tyszler M, Veer P, Blonk H (2017) Decreasing the overall environmental impact of the Dutch
diet: How to find healthy and sustainable diets with limited changes. Public Health Nutrition
20(9), 1699-1709. doi:10.1017/S1368980017000349
Leip A, Weiss F, Lesschen JP, Westhoek H (2014) The nitrogen footprint of food products in the
European Union. The Journal of Agricultural Science 152(S1), 20-33.
doi:10.1017/S0021859613000786
Mehansho H, Mellican RI, Hughes DL, Compton DB, Walter T (2003) Multiple-micronutrient
fortification
technology development and evaluation: from lab to market. Food Nutr Bull 24(4 Suppl), S111-
119.
Meier T, Christen O, Semler E, Jahreis G, Voget-Kleschin L, Schrode A, et al. (2014) Balancing virtual
land imports by a shift in the diet. Using a land balance approach to assess the sustainability of
food consumption. Germany as an example. Appetite 74, 20–34.
Meier T, Christen O (2013) Environmental impacts of dietary recommendations and dietary styles:
Germany as an example. Environmental Science and Technology 47(2), 877-888.
Melina V, Craig W, Levin S. (2016) Position of the Academy of Nutrition and Dietetics: Vegetarian Diets.
J Acad Nutr Diet 116(12),:1970–80.
Mineur E (2007) Towards sustainable development. Indicators as a tool of local governance. Research
report 5. Department of Political Science. Umeå University, Sweden.
Moller H, MacLeod CJ (2013) Design criteria for effective assessment of sustainability in New Zealand’s
production landscapes. NZ Sustainability Dashboard Research Report 13/07. ISSN: 2324-5700.
Muñoz I, Milà I Canals L, Fernández-Alba AR (2010) Life cycle assessment of the average Spanish diet
including human excretion. International Journal of Life Cycle Assessment 15(8), 794-805.
NNR (2014) Nordic Nutrition Recommendations 5th ed. Integrating nutrition and physical activity.
http://www.norden.org/en/theme/former-themes/themes-2016/nordic-nutrition-recommendati
on/nordic-nutrition-recommendations-2012
Peters CJ, Wilkins JL, Fick GW (2007) Testing a complete-diet model for estimating the land resource
requirements of food consumption and agricultural carrying capacity: The New York State
example. Renewable Agriculture and Food Systems 22(2),145–53.
Rafferty K, Walters G, Heaney R (2007) Calcium Fortificants: Overview and Strategies for Improving
Calcium Nutriture of the U.S. Population. Journal of Food Science 72(9), R152–8.
Raworth K (2012) A safe and just space for humanity. Can we live within the doughnut? Oxfam, Oxford,
UK.
Ridoutt BG, Pfister S (2010) A revised approach to water footprinting to make transparent the
impacts of consumption and production on global freshwater scarcity. Global Environmental
Change 20(1), 113–20.
Rockström J, Steffen W, Noone K, Persson Å, Chapin FS III, Lambin EF et al. (2009) A safe operating
space for humanity. Nature 461, 472–475. doi:10.1038/461472a.
Röös E, Karlsson H, Witthöft C, Sundberg C (2015a) Evaluating the sustainability of diets – combining
environmental and nutritional aspects. Environmental Science & Policy 47:157-166. doi:
10.1016/j.envsci.2014.12.001
Röös E, Patel M, Spångberg J (2015b) Miljöpåverkan från mjölk och havredryck. En scenarioanalys som
inkluderar alternativ markanvändning samt olika infallsvinklar på behovet av nötkött och protein.

146
Department of Energy and Technology, Swedish University of Agricultural Sciences, Uppsala,
Sweden.
Röös E, Patel M, Spångberg J, Carlsson G, Rydhmer L (2016a) Limiting livestock production to pasture
and by-products in a search for sustainable diets. Food Policy 58:1-13. doi:
10.1016/j.foodpol.2015.10.008
Saarinen M, Kurppa S, Virtanen Y, Usva K, Mäkelä J, Nissinen A (2012) Life cycle assessment approach to
the impact of home-made, ready-to-eat and school lunches on climate and eutrophication.
Journal of Cleaner Production 28, 177-186. doi:https://doi.org/10.1016/j.jclepro.2011.11.038
Sandin P (2017) How to Label ‘Natural’ Foods: a Matter of Complexity. Food Ethics 1-11.
Scherer L, Tomasik B, Rueda O, Pfister S (2017) Framework for integrating animal welfare into life cycle
sustainability assessment. The International Journal of Life Cycle Assessment.
doi:10.1007/s11367-017-1420-x
Segnestam L, Persson Å (2002) Index, indikatorer, presentationsverktyg och de svenska miljömålen.
Rapport 5206. ISSN 0282-7298. Naturvårdsverket, Stockholm.
Steffen W, Richardson K, Rockström J, Cornell SE, Fetzer I, Bennett EM, et al. (2015) Planetary
boundaries: guiding human development on a changing planet. Science 347(6223):1259855.
Stehfest E, Bouwman L, van Vuuren DP, den Elzen MGJ, Eickhout B, Kabat P (2009) Climate benefits of
changing diet. Climatic Change 95(1–2), 83–102.
Temme E, Van der Voet H, Thissen J, Verkaik-Kloosterman J, Van Donkersgoed G, Nonhebel S (2013)
Replacement of meat and dairy by plant-derived foods: Estimated effects on land use, iron and
SFA intakes in young Dutch adult females. Public Health Nutrition 16(10), 1900-1907.
doi:10.1017/S1368980013000232
Tripkovic L, Lambert H, Hart K, Smith CP, Bucca G, Penson S, et al. (2012) Comparison of vitamin D2
and vitamin D3 supplementation in raising serum 25-hydroxyvitamin D status: a systematic
review and meta-analysis. Am J Clin Nutr 95(6), 1357–64.
Tripkovic L, Wilson LR, Hart K, Johnsen S, de Lusignan S, Smith CP, et al. (2017) Daily supplementation
with 15 μg vitamin D2 compared with vitamin D3 to increase wintertime 25-hydroxyvitamin D
status in healthy South Asian and white European women: a 12-wk randomized, placebo-
controlled food-fortification trial. Am J Clin Nutr 106(2):481–90.
Tyszler M, Kramer G, Blonk H (2016) Just eating healthier is not enough: studying the environmental
impact of different diet scenarios for Dutch women (31–50 years old) by linear programming. The
International Journal of Life Cycle Assessment 21(5), 701–9.
Vieux F, Perignon M, Gazan R, Darmon N (2018) Dietary changes needed to improve diet sustainability:
are they similar across Europe? European Journal of Clinical Nutrition. doi:10.1038/s41430-017-
0080-z
Westhoek H, Lesschen JP, Rood T, Wagner S, De Marco A, Murphy-Bokern D, Oenema O (2014) Food
choices, health and environment: Effects of cutting Europe's meat and dairy intake. Global
Environmental Change 26(0), 196-205. doi:10.1016/j.gloenvcha.2014.02.004
White T (2000) Diet and the distribution of environmental impact. Ecological Economics 34(1), 145–53.
Whitmee S, Haines A, Beyrer C, Boltz F, Capon AG, de Souza Dias BF, et al. (2015) Safeguarding
human health in the Anthropocene epoch: report of The Rockefeller Foundation–Lancet
Commission on planetary health. The Lancet 386(10007):1973–2028.
Wilson N, Nghiem N, Ni Mhurchu C, Eyles H, Baker MG, Blakely T (2013) Foods and Dietary Patterns
That Are Healthy, Low-Cost, and Environmentally Sustainable: A Case Study of Optimization
Modeling for New Zealand. Sun Q, editor. PLoS ONE 8(3), e59648.
Zhao Y, Martin BR, Weaver CM (2005) Calcium Bioavailability of Calcium Carbonate Fortified Soymilk Is
Equivalent to Cow’s Milk in Young Women. J Nutr 135(10), 2379–82.

147


SLU Future Food is a platform for research and collaboration at the Swedish University of Agricultural Sciences aimed at ensuring that the entire food system is characterized by economic, ecological and social sustainability.
The platform identifies key issues, generate science and seek new solutions in collaboration with others.
webb www.slu.se/futurefood
e-mail [email protected]
twitter @SLUFutureFood
newsletter Food for Thought
youtube SLU Future Food
podcast Feeding your mind

Future Food Reports 3