the role of glial cells in the regulation of energy
TRANSCRIPT

The role of glial cells in the regulation of
energy homeostasis
Ph.D. Thesis
Anett Stiftné Szilvásy-Szabó
Semmelweis University
János Szentágothai Ph.D. School of Neuroscience
Institute of Experimental Medicine
Hungarian Academy of Sciences
Supervisor: Csaba Fekete, M.D., D.Sc.
Official reviewers: Árpád Dobolyi, D.Sc.
Balázs Gaszner, M.D., Ph.D.
Head of the Final Examination
Committee: András Csillag, M.D., D.Sc.
Members of the Final Examination
Committee: Krisztina Kovács, D.Sc.
Attila Patócs, M.D., Ph.D.
Budapest
2018
DOI:10.14753/SE.2019.2208

2
Table of contents
Table of contents .............................................................................................................. 2
Abbreviations ................................................................................................................... 6
1. Introduction .............................................................................................................. 9
1.1. The key components of the energy homeostasis .............................................. 9
1.2. The role of vagus nerve in the mediation of the energy homeostasis-related
signals .......................................................................................................................... 9
1.3. The role of blood-born signals in the mediation of energy homeostasis-related
information ................................................................................................................. 10
The central melanocortin system ................................................................................ 15
1.4. The role of ARC in the regulation of feeding and energy metabolism .......... 16
1.4.1. The anorexigenic cell population of the ARC .......................................... 16
1.4.2. The orexigenic cell population of the ARC .............................................. 18
1.4.3. Intra-ARC connections ............................................................................. 19
1.4.4. The perception of the peripheral signals by the ARC neurons ................. 20
1.4.5. Connections of the ARC neurons with second-order neurons of the energy
homeostasis ............................................................................................................. 23
1.5. The role of tanycytes in the regulation of feeding and energy metabolism ... 24
1.5.1. Tanycytes, a special glial cell type of the hypothalamus ......................... 24
1.5.2. General features of tanycytes ................................................................... 24
1.5.3. Tanycytes as barrier forming cells............................................................ 25
1.5.4. The role of tanycytes in the regulation of glucose homeostasis ............... 26
1.5.5. Tanycytes and leptin ................................................................................. 29
1.5.6. Tanycytes and other metabolites .............................................................. 29
1.5.7. Tanycytes as diet-responsive neurogenic niche........................................ 30
1.6. Diet-induced obesity and hypothalamic responses ......................................... 31
DOI:10.14753/SE.2019.2208

3
1.6.1. Diet-induced peripheral and central responses ......................................... 31
1.6.2. Diet induced inflammation in the ARC .................................................... 31
1.6.3. The role of glial cells in the development of the diet- induced
inflammation ........................................................................................................... 32
2. Aims ....................................................................................................................... 35
3. Materials and methods ............................................................................................ 36
3.1. Experimental animals ..................................................................................... 36
3.2. Anesthesia ....................................................................................................... 37
3.3. Transcardial perfusion with fixative ............................................................... 37
3.4. Tissue preparation for light microscopic investigations ................................. 38
3.5. Tissue preparation for electron microscopic investigations ........................... 38
3.6. Embedding for electron microscopic studies ................................................. 39
3.7. Tissue preparation for in situ hybridization (ISH).......................................... 39
3.8. Tissue preparation for laser capture microdissection (LCM) ......................... 39
3.9. Isolation of tanycytes and ARC using LCM .................................................. 40
3.10. RNA isolation and RNA concentration measurements .................................. 40
3.11. Statistical analysis .......................................................................................... 40
3.12. The localization of Cx43 gap junctions and hemichannels in tanycytes ........ 41
3.12.1. Loading the tanycytes with Lucifer yellow (LY) via patch pipette ...... 41
3.12.2. Double-labeling immunofluorescence for Cx43 and vimentin ............. 42
3.12.3. Ultrastructural detection of Cx43-immunoreactivity ............................ 43
3.13. Characterization of the POMC expression in tanycytes ................................. 43
3.13.1. Radioactive ISH .................................................................................... 43
3.13.2. Fluorescent ISH combined with immunofluorescence ......................... 44
3.13.3. Immunofluorescent detection of POMC, β-endorphin, α-MSH and
adrenocorticotropic hormone (ACTH) ................................................................... 45
DOI:10.14753/SE.2019.2208
4
3.13.4. Ultrastructural detection of POMC-immunoreactivity in tanycytes ..... 45
3.13.5. RNA-seq analysis of tanycyte transcriptome ........................................ 47
3.14. Importance of microglia in the development of HFD induced metabolic
changes ....................................................................................................................... 48
3.14.1. Microglia-ablation with PLX5622-pretreatment .................................. 48
3.14.2. Short-term HFD treatment .................................................................... 48
3.14.3. Indirect calorimetric measurements and body composition analysis ... 49
3.14.4. Iba1 immunocytochemistry .................................................................. 49
3.14.5. cDNA synthesis and preamplification from the LCM samples ............ 50
3.14.6. Quantitative TaqMan PCR .................................................................... 50
4. Results .................................................................................................................... 52
4.1. The localization of Cx43 gap junctions and hemichannels in tanycytes ........ 52
4.1.1. Presence of functional gap junctions between tanycytes.......................... 52
4.1.2. Detection of Cx43-immunoreactivity in tanycytes ................................... 53
4.1.3. Ultrastructural localization of Cx43-immunoreactivity in tanycytes ....... 54
4.2. Characterization of the POMC expression in tanycytes ................................. 58
4.2.1. Pomc mRNA expression in non-neuronal cells ........................................ 58
4.2.2. Non-neuronal Pomc mRNA-expressing cells are vimentin-positive
tanycytes ................................................................................................................. 62
4.2.3. Variable POMC protein expression in tanycytes of adult rats ................. 64
4.2.4. Ultrastructural examination of POMC-immunoreactive cells in the ME . 68
4.2.5. Detection of POMC-derived peptides in tanycytes .................................. 69
4.2.6. Expression of POMC-processing enzymes in tanycytes .......................... 71
4.3. Importance of microglia in the development of HFD induced metabolic
changes ....................................................................................................................... 73
4.3.1. Effect of HFD and microglia ablation on the body composition and
metabolic parameters .............................................................................................. 73
DOI:10.14753/SE.2019.2208

5
4.3.2. Verification of the microglia-ablation by Iba1 immunocytochemistry and
PCR .................................................................................................................. 87
5. Discussion ............................................................................................................... 89
5.1. The localization of Cx43 gap junctions and hemichannels in tanycytes ........ 89
5.1.1. The presence of functional gap junctions in tanycytes ............................. 89
5.1.2. The presence of Cx43 hemichannels in tanycytes .................................... 91
5.2. Characterization of the POMC expression in tanycytes ................................. 93
5.2.1. Tanycyte Pomc ISH signal in previous studies ........................................ 93
5.2.2. Diversity of POMC expression by tanycyte-subtypes .............................. 94
5.2.3. Variable POMC levels in tanycytes ......................................................... 94
5.2.4. POMC processing in tanycytes................................................................. 95
5.2.5. Potential functional implications .............................................................. 96
5.3. Importance of microglia in the development of HFD induced metabolic
changes ....................................................................................................................... 97
5.3.1. The metabolic effects of short-term HFD ................................................ 97
5.3.2. The metabolic effects of the absence of microglia ................................... 98
6. Conclusions .......................................................................................................... 100
7. Summary ............................................................................................................... 102
8. Összefoglalás ........................................................................................................ 103
9. References ............................................................................................................ 104
10. List of publications ............................................................................................ 124
10.1. List of publications the thesis is based on .................................................... 124
10.2. Other publications ........................................................................................ 124
11. Acknowledgements ........................................................................................... 125
DOI:10.14753/SE.2019.2208

6
Abbreviations
2-DG 2-deoxy-D-glucose
A20 tumor necrosis factor alpha-induced protein 3
ABC avidin-biotin peroxidase complex
aCSF artificial cerebrospinal fluid
ACTH adrenocorticotropic hormone
AgRP agouti-related peptide
ARC hypothalamic arcuate nucleus
CART cocaine- and amphetamine-regulated transcript
CCK cholecystokinin
CNS central nervous system
CPM counts per million
CSF cerebrospinal fluid
CSF1R colony stimulating factor 1 receptor
CVOs circumventricular organs
Cx43 connexin 43
DAB diaminobenzidine
DAPI 4',6-diamidino-2-phenylindole
DARP-32 dopamine- and cyclic adenosine-monophosphate-regulated phosphoprotein
DEPC diethylpyrocarbonate
DMN dorsomedial hypothalamic nucleus
ERK extracellular regulated kinase
FFAs free fatty acids
GABA gamma-aminobutyric acid
GFAP glial fibrillary acidic protein
GHSR growth hormone secretagogue receptor
GK glucokinase
GLP-1 glucagon-like peptide 1
GLUT1 glucose transporter 1
GLUT2 glucose transporter 2
HFD high-fat diet
DOI:10.14753/SE.2019.2208
7
Iba1 ionized calcium-binding adapter molecule 1
IGLE intraganglionic laminar endings
Ikbkb inhibitor of nuclear factor kappa-B kinase subunit beta
Ikbke inhibitor of nuclear factor kappa-B kinase subunit epsilon
Il6 interleukin 6
ISH in situ hybridization
KATP ATP-inhibited potassium channel
KO knock out
LCM laser capture microdissection
LepR leptin receptor
LH lateral hypothalamic area
LY Lucifer yellow
MCR3 melanocortin receptor 3
MCR4 melanocortin receptor 4
ME median eminence
NF-κB nuclear factor kappa B
NGS next-generation sequencing
NHS normal horse serum
NPY neuropeptide Y
NSC neural stem cell
NTS nucleus tractus solitarii
PB phosphate buffer
PBS phosphate buffered saline
PC1 prohormone convertase 1
PC2 prohormone convertase 2
PFA paraformaldehyde
PI3K phosphatidylinositol-3-kinase
POMC proopiomelanocortin
PVN hypothalamic paraventricular nucleus
PYY peptide YY
SOCS3 suppressor of cytokine signaling 3
STAT3 signal transducer and activator of transcription 3
DOI:10.14753/SE.2019.2208

8
TLR toll-like receptor
TNFα tumor necrosis factor alpha
TRH thyrotropin-releasing hormone
TSH thyroid stimulating hormone
VEGF-A vascular endothelial growth factor A
VMN ventromedial nucleus of the hypotahalmus
WAT white adipose tissue
DOI:10.14753/SE.2019.2208

9
1. Introduction
1.1. The key components of the energy homeostasis
The perception of the status of energy stores and the quality and quantity of the
consumed food by the central nervous system (CNS) plays crucial role in the regulation
of energy homeostasis (Morton et al., 2006, Schwartz et al., 2000). This regulation is
guided by the communication between the peripheral organs and the brain. The two
main routes of this communication are the peripheral nerves (primarily the vagus nerve)
and the blood circulation. The vagus nerve mediates the effects of some gastrointestinal
hormones and the information from chemo- and mechanosensors of the gastrointestinal
tract towards the nucleus tractus solitarii (NTS) in the brainstem (Li, 2007). The
primary central target of peripheral, blood-derived energy homeostasis-related
hormones is the hypothalamic arcuate nucleus (ARC), but these hormones can also
directly influence other brain regions including the NTS (Kanoski et al., 2014) (Figure
1).
1.2. The role of vagus nerve in the mediation of the energy homeostasis-related
signals
The vagus nerve represents the longest nerve of the autonomic nervous system and is
involved in the regulation of the heart, lungs and the digestive tract. The sensory fibers
of the vagus nerve convey afferent information from the mechano- and chemoreceptors
of the gastrointestinal tract and mediates information about changes of local hormonal
signals to the NTS (Schwartz et al., 2000).
The vagal afferent fibers can be found within all layers of the stomach and the small
intestine, however, their location and morphology strongly influences their modality to
mechanical or chemical stimuli. The intraganglionic laminar endings (IGLEs) are
embedded between the longitudinal and circular smooth muscle layers (Berthoud and
Powley, 1992) and being sensitive for both contractions and distensions, IGLEs
represent the first candidates to sense the gastric distension after food consumption.
Besides stomach, IGLEs can be also found in the small intestine. The intramuscular
arrays represent another type of vagus nerve ending either establishing parallel bundles
DOI:10.14753/SE.2019.2208
10
to the lamina muscularis externa or sphincter regions of the stomach (Berthoud and
Powley, 1992) and their function is to sense the length of the stomach (Phillips and
Powley, 2000). The mucosal afferents are both mechano- and chemosensitive
components of the vagal sensory machinery. These afferents extend through the
submucosal layer and can respond to mediators released from the enteroendocrine cells
(Page et al., 2002).
In addition, the vagus nerve can also sense changes of certain hormones by expressing
receptors for gastrointestinal hormones, like cholecystokinin (CCK), glucagon-like
peptide 1 (GLP-1) and peptide YY (PYY) by which the mechanosensitivity of the vagal
afferent fibers also can be modulated (Kentish and Page, 2014). The enteroendocrine
cells of the intestine secrete CCK, which acting through the CCK-receptors of the vagal
afferents inhibits gastric emptying and food intake (Glatzle et al., 2003). GLP-1 released
from the intestinal L-cells was shown to activate both gastric and jejunal vagal afferents
(Gaisano et al., 2010) resulting in decreased food intake. The L-cell derived PYY can
act through PYY-receptors present on both the intestinal vagal afferents and on neurons
of the ARC, indicating, that PYY can reduce food intake via the combination of more
pathways (Broberger et al., 1997, Burdyga et al., 2008).
Thus, vagal afferents mediate the mechanical, chemical and hormonal information of
the gastrointestinal tract and serve information about the quality and quantity of the
consumed food to the NTS which integrates the food-related information. Besides the
NTS, the brainstem contains other fields involved in the vagal sensory complex
establishing the dorsovagal complex, including the chemosenory area, the
circumventricular area postrema (AP) and the dorsal motor nucleus of the vagus, which
integrates the motor and secretory drive of the gastro-intestinal tract (Young, 2012).
1.3. The role of blood-born signals in the mediation of energy homeostasis-
related information
In order to regulate the food intake and energy expenditure, the brain has to sense the
nutritional status and the condition of the peripheral energy stores. Blood-transported
signals, like nutrients, such as glucose, amino and fatty acids, nutrition-dependent
gastrointestinal hormones, like GLP-1, PYY, CCK and ghrelin or adiposity signals, like
DOI:10.14753/SE.2019.2208

11
the white adipose tissue (WAT) derived leptin and the pancreatic insulin (Berthoud,
2008, Schwartz et al., 2000), play critical role in this process.
The main feature of adiposity signals is that their circulating level is proportional to the
size of the adipose tissue and other energy stores. The first described adipostatic
hormone was the insulin. Insulin is produced by the pancreatic beta cells after
carbohydrate intake (Begg and Woods, 2012). Its level is very quickly regulated by the
circulating glucose levels. Thus insulin level is decreased during fasting and very
quickly increased after food intake (Begg and Woods, 2012). This glucose induced
regulation is, however, superimposed on a longer term regulation that makes the
circulating insulin level proportional to the size of adipose depots (Woods, 2013).
Insulin acts through its receptor that is a member of the tyrosine kinase receptor family
(Ebina et al., 1985, Ullrich et al., 1985). High level of insulin receptor is expressed in
the skeletal muscle, where insulin supports the glucose uptake by the cells as energy
source, resulting in decreased blood glucose level (Boucher et al., 2014). In the liver,
insulin also promotes the uptake and the transformation of glucose to glycogen via
glycogenesis and to fat via lipogenesis, moreover, insulin has opposite effect as
glucagon, by inhibiting gluconeogenesis (Saltiel and Kahn, 2001). Similarly to skeletal
muscle and liver, insulin regulates the uptake of glucose by the adipose tissue,
promoting the development of fat depots (Mitrou et al., 2013). Since the changes of the
insulin level in the CSF is relatively slow, it cannot follow the fast, glucose level
induced fluctuation of the circulating insulin level. Therefore, it is likely, that the central
insulin level is primarily regulated by the size of the adipose tissue. While peripheral
administration of insulin indirectly stimulates food intake due to its hypoglycemic
effect, insulin exerts opposite effects in the brain: it inhibits food intake and stimulates
energy expenditure (Woods et al., 1979).
In 1994, the gene coding another adiposity signal, leptin, was identified (Zhang et al.,
1994). Leptin is predominantly produced by the adipocytes of the WAT (Flier, 1998)
and as an adipostatic hormone, the circulating level of leptin is proportional to the size
of the WAT (Schwartz et al., 2000). Leptin was identified as the hormone missing from
the obese ob/ob mouse line (Halaas et al., 1995). Administration of leptin to rodents
with normal body weight results in inhibition of food intake and decrease of body
weight (Halaas et al., 1995). Leptin also regulates energy expenditure as both central
DOI:10.14753/SE.2019.2208

12
and peripheral leptin administration markedly stimulates the basal energy expenditure.
While leptin has potent anorexigenic effect in animals with normal body weight, obese
rodents and humans have high leptin level and develop leptin resistance (Zhou and Rui,
2013). Therefore, leptin is crucial for the normal regulation of energy homeostasis, but
cannot be used to treat obesity. In humans, the mutation of leptin gene causes similar
obese phenotype than in rodents (Farooqi et al., 1998).
GLP-1 is a food intake-related peptide secreted by the L-cells of the small intestine
(Herrmann et al., 1995). In addition, GLP-1 is also synthesized in a neuronal group of
the NTS (Herrmann et al., 1995). By acting in the pancreas, GLP-1 induces insulin
secretion, while it inhibits glucagon release (Holst, 2007), thus, GLP-1 has a crucial role
in the regulation of glucose homeostasis. Peripheral as well as central administration of
GLP-1 was proved to inhibit food intake and increase energy expenditure (Gutzwiller et
al., 1999, Tang-Christensen et al., 1996). Analogues of the hormone, like exendine-4
and liraglutide were also shown to reduce body weight both in rodents and humans
(Edwards et al., 2001, Hayes et al., 2011). GLP-1 and its analogues are able to cross the
blood-brain barrier (BBB) (Hunter and Holscher, 2012) and GLP-1 receptors have been
shown to be present in several brain regions involved in the regulation of energy
homeostasis (Cork et al., 2015). These data together suggest that GLP-1 have important
role in the regulation of energy homeostasis. GLP-1 has, however, a very short half-life
raising the question whether peripheral GLP-1 may reach the CNS in effective dose.
However, the high amount of GLP-1 receptor in the ARC, where relatively few GLP-1
axons can be found suggests that peripheral GLP-1 may influence this nucleus (Personal
observation). This effect of GLP-1 may be enhanced by inhibition of the GLP-1
degrading dipeptidyl peptidase-4 or by administration of the agonists of GLP-1 with
longer half-time. These strategies are widely used in the treatment of type 2 diabetes
and investigated as the targets in the treatment of obesity (Dailey and Moran, 2013,
Lovshin and Drucker, 2009)
PYY is a 36-amino acid peptide released from the distal segments of the gastrointestinal
tract, predominantly from the ileum and colon (Tatemoto, 1982). The main function of
PYY is to inhibit gastric motility and to promote the absorption of water and
electrolytes in the colon (Liu et al., 1996). PYY is secreted from the gut into the blood
circulation in a nutrient-dependent manner. During fasting, PYY level is low, however,
DOI:10.14753/SE.2019.2208

13
during food intake the PYY level is rising (Adrian et al., 1985). It has been shown that
intraperitoneal injection of the predominant circulating form, the PYY3-36, decreases
food intake in rats (Batterham et al., 2002). Additionally, peripheral infusion of PYY3-36
reduces the appetite of non-obese humans (Batterham et al., 2002). Moreover, PYY
knock out (KO) mice are hyperphagic, their food consumption is significantly higher
and show increased subcutaneous and visceral adiposity (Batterham et al., 2006). These
data all confirm the anorexigenic nature of PYY.
CCK is secreted from the enteroendocrine I cells of the small intestine and it has an
important role in the regulation of the exocrine pancreatic secretion, in the modulation
of gastric motility and the digestion of fat by increasing the release of bile from the
gallbladder (Sayegh, 2013, Stengel and Tache, 2011). The secretion of CCK occurs in a
nutrition dependent manner, the peak of the CCK level can be observed 15 min after the
start of the meal in human (Stengel and Tache, 2011). The anorexigenic feature of CCK
was shown several years ago by central administration of the peptide that markedly
reduced the amount of the consumed food. CCK was also shown to decrease food intake
in humans (Goebel-Stengel et al., 2012, Smith et al., 1981). The CCK58 isoform
decreases the consumed food during one meal; nevertheless, it cannot reduce the daily
food intake, as intraperitoneal injection of the peptide increases the frequency of meals
(Goebel-Stengel et al., 2012). While, other nutrition dependent hormones regulate food
intake via crossing the BBB, the main pathway that mediates the effects of CCK is the
vagus nerve-NTS pathway (Smith et al., 1981).
The common feature of the above mentioned gastrointestinal hormones is their
anorexigenic effect, however, in 1999 a new gastrointestinal peptide, ghrelin was
discovered with opposite effect (Kojima et al., 1999, Nakazato et al., 2001).
Ghrelin was shown to be secreted from the mucosa of the stomach (Date et al., 2000)
before and during nutrition and to have potent effect on appetite (Cummings et al.,
2001). The serum level of ghrelin is the highest just before the expected meal time and
decreases after food consumption (Tschop et al., 2001). Ghrelin was named after its ability
to bind to the growth hormone secretagogue receptor (GHSR) and to stimulate the
secretion of growth hormone (Kojima et al., 1999). Both central and peripheral
administration of ghrelin was shown to increase food intake, moreover it results in body
DOI:10.14753/SE.2019.2208

14
weight gain (Tschop et al., 2000). Additionally, intraperitoneal injection of ghrelin
significantly increases the appetite of humans (Wren et al., 2001). According to these
data, ghrelin is the only peripheral hormone with orexigenic effect (Iwakura et al., 2015).
Besides regulating food intake, ghrelin also decreases energy expenditure and the two
processes together lead to the increase of the WAT (Davies et al., 2009).
Figure 1: Schematic illustration of the peripheral adiposity and satiety signals
regulating energy homeostasis
Adiposity signals like leptin and insulin from the adipose tissue and pancreas,
respectively and satiety signals like the anorexigenic GLP-1, PYY and the orexigenic
ghrelin from the gastrointestinal tract are released into the blood and delivered to the
neurons of the ARC. The ARC contains first order neurons of the regulation of energy
homeostasis. These neurons sense the peripheral signals, integrate with neuronal inputs
and transmit this information toward second order neuronal groups, like neurons of the
LH and PVN. The other energy expenditure-related sensory area of the brain is the NTS
integrating the information carried by the vagus nerve from the gastrointestinal tract.
The descending pathways from the hypothalamus can change the sensitivity of the NTS
neurons to the vagal afferents.
Abbreviations: PVN –hypothalamic paraventricular nucleus; LH – lateral hypothalamic
area; ARC – arcuate nucleus; NTS – nucleus tractus solitarii; CCK – cholecysokinin;
GLP-1 – glucagon-like peptide 1; PYY – peptide YY.
Modified from (Schwartz et al., 2000)
DOI:10.14753/SE.2019.2208

15
The central melanocortin system
The central melanocortin system plays a crucial role in the regulation of energy
homeostasis including the mediation of the peripheral signals toward the brain (Cone,
2005, Ellacott and Cone, 2006). The melanocortin system is composed of the 5
melanocortin receptors (MCRs) and their ligands the proopiomelanocortin (POMC)
derived peptide agonists and the endogenous antagonists, like the agouti-related peptide
(AGRP). The melanocortin system of the brain includes the POMC expressing neurons
of the ARC and the NTS, the AGRP neurons of the ARC and the downstream targets of
these neuronal groups expressing MCRs (Cone, 2005).
The role of the melanocortin system in the regulation of energy homeostasis has been
shown by genetic lesions of this signaling pathway. Deletion of the POMC gene in mice
results in obesity (Yaswen et al., 1999), moreover, the loss of either melanocortin
receptor 3 or 4 (MCR3 or MCR4) also cause obese phenotype (Butler et al., 2000,
Huszar et al., 1997).Similarly to rodents, deficiency of the human melanocortin system
has been shown to lead to failures in the regulation of energy homeostasis and thus
obesity (Farooqi et al., 2000, Krude et al., 1998).
The elements of the
melanocortin system.
The POMC serves as a
precursor that is cleaved
by prohormone convertase
enzymes resulting in
smaller tissue-specific
melanocortin peptides. The
melanocortin receptor
family consists of 5 7-
transmembrane G protein-
coupled receptors that have
different tissue specific
expression pattern and
different affinity for their
agonists, melanocortins
and antagonists, like AgRP.
The agonists of the
different receptors are
listed in the order of their
affinity. Modified from
(Dib et al., 2017).
DOI:10.14753/SE.2019.2208
16
1.4. The role of ARC in the regulation of feeding and energy metabolism
The main central target of the above mentioned energy homeostasis related peripheral
hormones is the ARC, containing several elements of the central melanocortin system.
The ARC is located in the vicinity of the BBB free median eminence (ME). This way,
blood-derived hormones and metabolites can easily reach the neurons in this brain area.
The ARC contains at least two feeding-related neuronal populations: the
proopiomelanocortin (POMC) and cocaine- and amphetamine-regulated transcript
(CART) synthesizing anorexigenic neurons and the neuropeptide Y (NPY), agouti-
related peptide (AgRP) and gamma-aminobutyric acid (GABA) producing orexigenic
cell population (Blouet and Schwartz, 2010, Hillebrand et al., 2002). The two distinct
neuronal groups are located in different parts of the ARC, while the POMC/CART
neurons reside in the more lateral parts of the ARC; the NPY/AgRP neurons are located
in the ventromedial part of the nucleus. These two neuronal groups have antagonistic
effects in the regulation of food intake and energy expenditure (Ollmann et al., 1997).
1.4.1. The anorexigenic cell population of the ARC
The anorexigenic neuronal group of the ARC co-synthesizes two peptide precursors, the
POMC and CART (Dhillo et al., 2002, Fekete et al., 2000c).
Proteolytic cleavage of POMC results in biological active peptides that plays crucial
role in the regulation of energy homeostasis (See detailes in The central melanocortin
system textbox). The role of POMC is widely investigated by animal models. Pomc-null
mutant mice have early onset obesity, failure in the adrenal development, and alteration
in hair pigmentation (Challis et al., 2004, Yaswen et al., 1999). Neuronal specific
deletion of POMC results in similar obesity phenotype without effects on adrenal
function and hair pigmentation further demonstrating the role of centrally synthesized
POMC in the regulation of energy homeostasis (Smart and Low, 2003). In contrast,
overexpression of POMC has been shown to prevent the development of obesity in mice
(Mizuno et al., 2003). In the field of energy homeostasis, the most widely studied
POMC derived peptide is α-MSH. Central administration of α-MSH decreases food
intake and markedly stimulates energy expenditure (Murphy et al., 1998). α-MSH
primarily exerts its central effects via two types of MCRs, the MC3R and the MC4R.
DOI:10.14753/SE.2019.2208

17
Similarly to the neuronal absence of POMC, the loss of MC4R leads to increased food
intake, decreased energy expenditure and obesity in mice (Adan et al., 2006, Huszar et
al., 1997). In humans, the mutations of Pomc and Mc4r genes also exist (Challis et al.,
2002, Farooqi et al., 2006, Krude et al., 1998). These mutations can be detected in
approximately 6-10% of the clinically obese patients (Farooqi et al., 2006). Similarly to
rodents, POMC deficiency is characterized by adrenal deficiency, red-hair pigmentation
and early onset obesity in humans (Farooqi et al., 2006, Krude et al., 1998). Mutations
of the Mc4r gene result in increased food intake, decreased energy expenditure and
obese phenotype in humans (Farooqi and O'Rahilly, 2008).
CART is also proteolitically processed in neurons (Douglass et al., 1995). The most
abundant CART peptides in the brain are the CART 55-102 and CART 62-102
(Douglass and Daoud, 1996, Gautvik et al., 1996). Both intracerebroventricular
administration and hypothalamic intranuclear injections of CART can cause inhibition
of food intake (Abbott et al., 2001, Kristensen et al., 1998). Moreover, central
administration of neutralizing CART antibodies leads to hyperphagic response,
demonstrating that not only the exogenous, but also the endogenous CART inhibits food
intake (Kristensen et al., 1998). Interestingly, overexpression of CART in different
neuronal groups of the hypothalamus provided inconsistent data suggesting that in some
neuronal connections CART may have rather orexigenic effect (Kong et al., 2003, Qing
and Chen, 2007). In order to better understand the consequences of the absence of
CART expression, several KO models have been generated, summarized in the work of
Lau and Herzog (Lau and Herzog, 2014). CART KO mice have increased body weight
only after 40 weeks of age when kept on standard chow (Wierup et al., 2005). These
mice have, however, elevated blood insulin level with normal circulating glucose level
suggesting that they develop insulin resistance (Wierup et al., 2005). However, when
CART KO mice are fed with high-fat diet (HFD), they have significantly increased food
intake and body weight and altered behavior (Asnicar et al., 2001). Surprisingly, CART
is not expressed in the POMC neurons of the human infundibular nucleus, the
homologue of the rodent ARC (Menyhert et al., 2007). CART is rather expressed in the
orexigenic AGRP/NPY neurons of the human hypothalamus (Menyhert et al., 2007)
raising the possibility that CART may have different role in humans. However,
polymorphism of the CART gene is associated with reduced metabolic rate,
DOI:10.14753/SE.2019.2208

18
hyperphagia, obesity and increased chance to develop type II diabetes suggesting its
anorexigenic effect even in the human hypothalamus (Banke et al., 2013).
In rodents, the unequivocal proof for the anorexigenic nature of the POMC/CART
neurons is that ablation of these neurons in adult mice results in hyperphagia and weight
gain (Gropp et al., 2005).
1.4.2. The orexigenic cell population of the ARC
The ventromedial part of the ARC contains the orexigenic neurons that express AgRP
and NPY and utilize GABA as classical transmitter (Aponte et al., 2011, Krashes et al.,
2011).
Shortly after the discovery of NPY, its orexigenic effect was also described (Clark et al.,
1985, Levine and Morley, 1984). Intracerebroventricular administration of NPY
stimulates food intake in a dosage dependent manner (Clark et al., 1985). Furthermore,
chronic intrahypothalamic injection of NPY results in increased body weight (Beck et
al., 1992). The NPY release from the terminals of the ARC neurons is regulated by the
nutritional status. NPY release is the highest in the hypothalamic paraventricular
nucleus (PVN) just before the time of the scheduled feeding and continuously decreases
during feeding (Kalra et al., 1991). Animal models with obese phenotype caused for
example by the loss of MCR or by leptin deficiency have elevated NPY levels
(Kesterson et al., 1997). Surprisingly, NPY KO animals have normal body weight and
respond to fasting with regular hyperphagia (Erickson et al., 1996a) suggesting that the
lack of NPY can be compensated. However, if NPY KO mice are crossed with leptin-
deficient mice, the lack of NPY attenuates the obesity of ob/ob mice by reducing the
food intake and stimulating the energy expenditure emphasizing the importance of NPY
in the leptin dependent energy balance pathway (Erickson et al., 1996b). Conversely,
the viral overexpression of NPY causes a marked obesity syndrome with elevated
adiposity and hyperinsulaemia (Lin et al., 2006), further demonstrating the orexigenic
role of NPY.
A great majority of the ARC NPY neurons co-express AgRP, a second orexigenic
peptide (Hahn et al., 1998). Central injection of AgRP increases food intake as an
antagonist of the MC3R and MC4R (Ollmann et al., 1997). Both overexpression of
DOI:10.14753/SE.2019.2208

19
AgRP and the central administration of the peptide cause significant increase in food
intake with simultaneous decrease in energy expenditure (Goto et al., 2003, Korner et
al., 2003). The effect of AGRP on the energy expenditure is mediated at least partly via
the hypothalamic-pituitary-thyroid axis as central administration of AGRP markedly
inhibits the TRH expression of the hypophysiotropic neurons and results in a fall of
peripheral thyroid hormone levels (Fekete et al., 2004). Rodents sensitive to diet-
induced obesity show altered AgRP/NPY expression (Wang et al., 2002a) and similarly
in humans, a strong correlation can be found between body mass index and
hypothalamic AgRP/NPY expression (Alkemade et al., 2012). In spite of the clear
correlation between obese phenotype and the elevated AgRP expression, the lack of
Agrp gene does not induce an obvious phenotype. Similarly to those seen in the case of
NPY KO animals, the inactivation of Agrp gene does not have any effect on the body
weight regulation (Qian et al., 2002). Furthermore, even the NPY/AgRP double KO
mice have normal body composition (Flier, 2006, Qian et al., 2002).
As slow, progressive post-embryonic ablation of the NPY/AgRP neurons results in
moderate reduction of body weight of adult mice (Bewick et al., 2005), however, rapid
ablation of the AgRP neurons in adult animals leads to life threatening anorexia and
weight loss (Gropp et al., 2005), it is likely, that there are compensatory processes that
can balance the absence of these neurons and their transmitters. This is further
supported by the experiments that if the mice are treated for two weeks with GABAA
agonist after the ablation of these neurons, their energy homeostasis can normalize (Wu
and Palmiter, 2011).
1.4.3. Intra-ARC connections
During the last decades, several investigations have substantiated the existence of
neuroanatomical connections between the orexigenic and anorexigenic cell populations
of the ARC. These connections utilize GABA and melanocortin peptides (Bagnol et al.,
1999, Cowley et al., 2001). GABA release from the NPY/AgRP/GABA-containing
nerve terminals induces inhibitory currents and hyperpolarization of the innervated
POMC/CART neurons (Cowley et al., 2001). This way GABA decreases the firing rate
of the POMC/CART cells. On the other hand, POMC/CART neurons were shown to
express MC3R, which specifically binds POMC derivates with high affinity. The
DOI:10.14753/SE.2019.2208

20
activation of POMC/CART neurons evokes elevated release of POMC-products
forming a short autoinhibitory feedback loop through MC3R activation (Cowley et al.,
2001).
1.4.4. The perception of the peripheral signals by the ARC neurons
A critical area of the brain that can sense the energy homeostasis-related hormones and
circulating nutrients is the ARC (Schwartz et al., 2000). Neonatal ablation of ARC
causes obesity and leptin resistance (Morris et al., 1998). Both the NPY/AGRP and the
POMC/CART neurons can sense the peripheral energy homeostasis-related signals
(Schwartz et al., 2000). These neuronal groups express leptin, insulin, ghrelin, PYY and
glucocorticoid receptors and are sensitive to glucose, amino- and fatty acids (Blouet et
al., 2009, Cheng et al., 1998, Corander and Coll, 2011, Hakansson et al., 1996,
Havrankova et al., 1978, Ibrahim et al., 2003, Morton et al., 2006, Willesen et al.,
1999). Thus, changes of the energy availability regulate both neuronal groups of the
ARC. Fasting increases the firing of the NPY/AGRP neurons and stimulates the NPY
and AGRP synthesis in these cells (Takahashi and Cone, 2005). In contrast, fasting
inhibits the anorexigenic neurons and decreases the POMC and CART synthesis in
these cells (Mizuno et al., 1998). Both central and peripheral administration of leptin to
fasted animals completely reverse these fasting induced changes (Takahashi and Cone,
2005).
Leptin has both direct and indirect effects on the POMC neurons (Cowley et al., 2001,
Elias et al., 1999). The POMC neurons express leptin receptors (LepRs) and leptin
directly excites these cells, but the effect of the selective ablation of LepR from the
POMC neurons is relatively modest compared to the effect of the deletion of POMC or
the MC4R (Balthasar et al., 2004) suggesting that other neuronal populations also play
role in the mediation of leptin’s effect on the POMC neurons. As absence of lepR from
glutamatergic neurons has also only mild phenotype, but the lack of this receptor from
GABAergic neurons induces obesity, it was suggested that leptin induced inhibition of
the GABAergic input of POMC neurons is important for the leptin induced activation of
the POMC neurons (Cowley et al., 2001, Elias et al., 1999).
Similarly to leptin, glucose and insulin also stimulates the POMC/CART neurons
(Ibrahim et al., 2003, Schwartz et al., 2000). Interestingly, however, these signals have
DOI:10.14753/SE.2019.2208

21
different effects on the synthesis of POMC and CART when administered to fasted
animals. While leptin stimulates the synthesis of both peptides, glucose and insulin has
stimulatory effect only on the POMC gene (Fekete et al., 2006). This would suggest that
the activation of POMC/CART neurons by different peripheral signals may exert
different effect on the second order neuronal groups.
GHRS1a is also present in a population of POMC neurons; however, data suggest that
the effect of ghrelin on the POMC neurons may be primarily indirect via the
NPY/AGRP neurons (Chen et al., 2004).
The NPY/AGRP neurons are oppositely regulated by peripheral signals compared to the
POMC/CART neurons. Leptin administration hyperpolarizes these neurons and inhibits
their NPY and AGRP synthesis (Vong et al., 2011). Glucose and insulin also inhibit
these cells, but while insulin inhibits only the NPY synthesis in these cells, glucose
influences neither the NPY nor the AGRP synthesis (Fekete et al., 2006). Ghrelin
directly stimulates these neurons (Hewson and Dickson, 2000, Wang et al., 2002b).
The presence of Y2 receptor in the NPY expressing neurons of the ARC suggest, that
besides NPY, PYY can also act directly on these cells (Broberger et al., 1997). Injection
of PYY into the ARC inhibits the nerve terminals of NPY/AGRP neurons (Batterham et
al., 2002) (Figure 2).
The ARC can also sense and respond to the changes of the plasma levels of free fatty
acids (FFAs) (Lam et al., 2005). Increased FFA levels of the plasma in the case of HFD
were shown to be associated with higher levels of FFAs in the orexigenic and
anorexigenic neurons of the ARC. Furthermore, both long-term diet rich in the saturated
fatty acid palmitate or rapid enteral palmitate-rich milk injection leads to the elevation
of FFA levels of ARC, suggesting, that not only prolonged HFD, but also postprandial
elevations of the peripheral FFA levels can be sensed by hypothalamic neurons
(Valdearcos et al., 2014). The sensation of FFAs and the induction of the adaptive
inflammatory response by the ARC neurons can occur by the involvement of receptor-
and metabolism-dependent mechanisms. As ARC neurons express toll-like receptor 2
(TLR2) (Shechter et al., 2013), it is likely, that these neurons are able to directly sense
FFAs. On the other hand, as FFAs are normally unreactive, the esterification of FFAs is
essential in order to initiate lipid signaling pathways (Schmelz and Naismith, 2009). It
DOI:10.14753/SE.2019.2208

22
has been shown, that NPY/AgRP neurons express a key enzyme of FFA metabolism
further proving the involvement of ARC feeding-related neurons in the sensation of
lipids (Andrews et al., 2008).
Figure 2: Schematic illustration of the perception of the peripheral signals by the
ARC neurons, intra-ARC connections and transmission of the signals to second-order
neurons.
The peripheral hormones regulate the activity of the feeding-related neurons by acting
directly on their own receptors. The feeding-related neurons of the ARC, containing
either orexigenic NPY and AgRP or anorexigenic POMC and CART form a well-
organized autoregulatory network. NPY/AgRP neurons also co-express GABA,
inhibiting POMC/CART neurons, while POMC/CART neurons inhibit NPY/AgRP
neurons via MCRs. The signals from the ARC neurons are transmitted to second-order
neurons by activating them via MCRs or Y receptors.
Abbreviations: GABAA – gamma aminobutyric acid receptors A; GHSR – growth
hormone secretagogue receptor; INSR – insulin receptor; LEPR – leptin receptor;
MC3R, MC4R – melanocortin receptor 3 or 4; PYY – peptide YY; Y1R, Y2R –
neuropeptide Y 1 or 2 receptor.
Based on (Cone, 2005) and (Schwartz et al., 2000) after modification.
DOI:10.14753/SE.2019.2208
23
1.4.5. Connections of the ARC neurons with second-order neurons of the
energy homeostasis
The NPY/AGRP and the POMC/CART neurons of the ARC transmit the peripheral
information toward the so-called second-order neurons. These neurons express
melanocortin and NPY receptors. As both the NPY/AgRP and the POMC/CART
neurons have widespread projections, the second order neurons are also found in many
brain areas including the PVN, the hypothalamic dorsomedial nucleus (DMN) and cell
groups of the lateral hypothalamic area (LH) which are also involved in the regulation
of energy homeostasis (Elmquist et al., 1998).
The DMN receives very dense innervations from both AGRP and the POMC neurons
(Gao and Horvath, 2007). In addition to this ARC inputs, de DMN also receives
information from the circadian master regulator, the suprachiasmatic nucleus via relay
neurons of the subparaventricular zone (Huang et al., 2011), thus this nucleus can
integrate the energy homeostasis and circadian information. Besides its projections to
other energy homeostasis related hypothalamic nuclei, like the PVN (Bernardis and
Bellinger, 1998, Gao and Horvath, 2007), the DMN sends a multisynaptic descending
pathway to the brown adipose tissue that has important role in the regulation of
thermogenesis and energy expenditure (Bamshad et al., 1999, Chitravanshi et al., 2016).
The PVN also receives very dense innervations from the two feeding-related neuronal
groups of the ARC and these inputs converge on the very same PVN neurons indicating
that the two antagonistic ARC neuron populations together fine tune the activity of the
PVN neurons (Cone, 2005, Fekete et al., 2000a, Schwartz et al., 2000). In accordance to
the very dense AGRP and α-MSH-containing input of this nucleus, the PVN has the
highest MC4R content among the hypothalamic nuclei (Shukla et al., 2012). The PVN
has critical role in the regulation of energy homeostasis. Hypophysiotropic TRH, CRH
and somatostatin neurons of the PVN regulate energy homeostasis by controlling the
hypothalamic-pituitary-thyroid and adrenal axes and the hypothalamic-somatotrop axis
(Fekete and Lechan, 2014). In addition, descending inputs from the PVN innervates
important vegetative nuclei of the brainstem, thus PVN can also regulate food intake
and energy expenditure via these brainstem connections.
DOI:10.14753/SE.2019.2208

24
The LH is also a target of the of the ARC neurons (Elias et al., 1999). In this
hypothalamic region, the MCH, orexin and neurotensin neurons are the most well
known energy homeostasis related neuronal groups (Schwartz et al., 2000). In addition
to other hypothalamic nuclei, these LH neuronal groups are also interconnected with
reward-related neuronal circuits suggesting their role in the integration of the energy
homeostasis and reward related signals (Stuber and Wise, 2016).
1.5. The role of tanycytes in the regulation of feeding and energy metabolism
1.5.1. Tanycytes, a special glial cell type of the hypothalamus
Tanycytes are specialized glial cells that line the floor and the ventrolateral walls of the
third ventricle between the rostral and caudal limits of the hypothalamic ME. Earlier,
tanycytes were simply considered as supporting and barrier forming cells, but during the
last years number of data was published demonstrating that tanycytes can actively
regulate neuronal functions in the hypothalamus (Lechan and Fekete, 2007).
1.5.2. General features of tanycytes
A dominant feature of tanycytes is their obvious polarization (Bruni, 1974, Rodriguez et
al., 2005). The small cell bodies of tanycytes are located in the ependymal layer of the
third ventricle. Microvilli or bulbous protrusions project from their ventricular surface
into the cerebrospinal fluid (CSF) (Firth and Bock, 1976), while a single, long process
projects into the neuropil of the hypothalamus from their basal surface (Akmayev and
Popov, 1977, Monroe and Paull, 1974).
According to the localization and anatomy of these cells, tanycytes can be classified into
four subtypes (Akmayev and Fidelina, 1976, Akmayev et al., 1973, Akmayev and
Popov, 1977, Rodriguez et al., 1979). The α1- and α2-tanycytes line the ventrolateral
walls of the third ventricle (Akmayev et al., 1973, Rodriguez et al., 1979), β1-tanycytes
line the lateral extensions of the infundibular recess of the third ventricle (Amat et al.,
1999) and β2-tanycytes are situated in the floor of the ventricle. The projection field of
the four subtypes differs. The basal process of α1-tanycytes projects to the DMN and
ventromedial nuclei, the α2-tanycytes project to the ARC, the process of β1-tanycytes
terminate on the surface of the tuberoinfundibular sulcus, while the basal process of β2-
DOI:10.14753/SE.2019.2208

25
tanycytes terminate around the portal capillaries of the ME (Flament-Durand and Brion,
1985, Kozlowski and Coates, 1985, Peruzzo et al., 2000).
By forming tight junctions in the wall of third ventricle, tanycytes are involved in the
formation of the blood-brain barrier separating the CSF from the extracellular fluid of
the BBB free ME (Mullier et al., 2010). Tanycytes are also involved in the formation of
the BBB around the capillaries of the ARC. In addition, tanycytes actively regulate
neuroendocrine functions including the hypothalamic-pituitary-gonadal (Prevot, 2002)
and -thyroid axes (Fekete et al., 2000b, Tu et al., 1997), and play role in the control of
physiological functions such as thermoregulation, feeding and energy balance (Bolborea
and Dale, 2013).
1.5.3. Tanycytes as barrier forming cells
In most brain areas the molecular trafficking is restricted between the blood and the
neuropil by the BBB, built up by tight junctions of the adjacent endothelial cells that
line the capillaries and the surrounding glial end feet (Neuwelt et al., 2011). The
exemptions are the so called circumventricular organs (CVOs) where the endothelium
around microvessels is fenestrated, thus allowing the free passage of the blood-borne
molecules (Ciofi, 2011).
The ME represents one of the CVOs, however, tight junctions among the cell bodies of
β-tanycytes in the ventral wall of the third ventricle act as a shifted physical barrier
between blood and CSF, preventing the uncontrolled diffusion of the blood-borne
molecules to other brain areas. Indeed, β-tanycytes express elements of tight junctions
like zonula occludens 1, occludin and claudin 1 and 5 (Mullier et al., 2010). In contrast,
α-tanycytes do not express claudin 1 and form less organized tight junction pattern of
zonula occludens 1, occluding and claudin 5, thus lack barrier properties (Rodriguez et
al., 2005). On the other hand, tanycytes located on the border of ME and ARC; establish
an interface between the CSF, blood and the ARC promoting the passage of peripheral
signals to the energy homeostasis-related brain regions.
Changes of energy homeostasis are able to restructure the barrier composed of tanycytes
between ME and ARC and thus change the permeability of this barrier (Prevot et al.,
2013). Fasting increases the organization of tight junction proteins and also enhances
DOI:10.14753/SE.2019.2208

26
the fenestration of the capillary loops in the ME and ARC (Langlet et al., 2013). Thus
the permeability of the ARC ME blood vessels increases, but the tanycytes prevent the
leakage of blood born molecules to the CSF and other brain regions. Similarly to
fasting, glucose deprivation and 2-deoxy-D-glucose (2-DG) treatment that inhibits
glucose metabolism cause tight junction reorganization, while intravenous glucose
administration prevents this process (Langlet et al., 2013). Both fasting and 2-DG
treatment result in increased synthesis of vascular endothelial growth factor A (VEGF-
A) in tanycytes. Selective ablation of Vegfa prevents the above mentioned structural
reorganization of tight junctions and the increase of the permeability of microvessels
(Langlet et al., 2013) indicating that VEGF-A is a crucial factor mediating the BBB
rearrangement.
According to these data, the blood-hypothalamus barrier composed by tanycytes is
changing its permeability in response to metabolic challenges, thus, tanycytes might act
as the first line reached by peripheral signals and play a crucial role in the regulation of
the availability of peripheral signals for the ARC neurons.
1.5.4. The role of tanycytes in the regulation of glucose homeostasis
The presence of tight junctions in tanycytes not only ensures the barrier properties for
these special cells, but also regulates the polarity of the cell and the intracellular
trafficking of the blood-borne molecules.
Tanycytes ability to respond to changes of glucose level is indicated by the expression
of the elements of the glucose sensing molecular machinery in these cells (Rodriguez et
al., 2005). α- and β1-tanycytes express glucose transporter 1 (GLUT1), that play a
crucial role in the entry of glucose into the cells (Garcia et al., 2001, Peruzzo et al.,
2000), while glucose transporter 2 (GLUT2) is present in the apical membranes of β1-
and β2-tanycytes (Garcia et al., 2003), making them candidates for sensors of CSF
glucose levels. Moreover, glucokinase (GK), an enzyme that catalyses the
phosphorylation of glucose, was detected in β1-tanycytes by Western blot analysis and
immunocytochemistry. The subcellular distribution of GK is altered depending on the
glycemic status of the animal (Millan et al., 2010). Glucokinase regulatory protein
(GKRP), another key enzyme of glucose metabolism, that controls both the intracellular
localization and the activity of GK, is also present in tanycytes (Salgado et al., 2014).
DOI:10.14753/SE.2019.2208

27
The presence of the above mentioned glucose sensing molecular elements in tanycytes
that are critical for the glucose-sensing in the pancreatic β-cells (Schuit et al., 2001),
suggests that glucose is able to enter into tanycytes through glucose transporters, then it
is phosphorylated by GK. The resultant glucose-6-phosphate enters the Krebs-cycle,
resulting in ATP production and the alteration of ATP-ADP ratio, which leads to the
closure of ATP-inhibited potassium channels (KATP) also present in tanycytes (Thomzig
et al., 2005). The closing of this channels leads to membrane depolarization and the
increase of the intracellular Ca2+
levels (Figure 3A).
Beside the above mentioned process, it is proved that tanycytes perform another, more
complex response to external glucose. Tanycytes of acute brain slices were shown to
respond to glucose and glucose analogue puffs on their cell bodies (Frayling et al.,
2011). Essentially, tanycytes are able to respond to the increase of local glucose levels
with elevated intracellular Ca2+
levels, triggering the release of ATP to their
extracellular space. Tanycytes have the ability of perceiving ATP via purinoreceptor 1
(P2Y1) that supports the propagation of Ca2+
waves to the neighboring tanycytes. This
process allows a rapid response to the changes of glucose levels (Frayling et al., 2011).
This glucose induced ATP release occurs via connexin 43 (Cx43) hemichannels based
on in vitro data of cell cultures derived from one day old rat pups (Orellana et al., 2012).
However, it is currently unknown whether tanycytes of adult animals express Cx43 and
whether this protein form hemichannels, gap junctions or both in tanycytes.
Tanycytes may also utilize other alternative mechanisms of glucose sensing. Glucose
may be taken up by tanycytes via Na+/glucose co-transporters (Bolborea and Dale,
2013). This way, entry of glucose into tanycytes results in an increase of the
intracellular Na+ levels, resulting in depolarization that may lead to the inversal of the
Na+/Ca
2+ exchanger, transporting Na
+ to the extracellular and Ca
2+ to the intracellular
space (Figure 3B). The other proposed mechanism of tanycyte glucosensing is the
activation of a G-protein coupled receptor. This mechanism is proved by the presence of
the heterodimer sweet taste receptor Tas1r2/Tas1r3 in tanycytes (Figure 3C) (Benford
et al., 2017).
DOI:10.14753/SE.2019.2208

28
Figure 3: Schematic illustration of the glucose sensing mechanisms of tanycytes
According to the pancreatic β-cell paradigm (A), glucose is taken up into cells and
converted to glucose-6-phosphate via glucokinases. G-6-P then enters the Krebs-cycle
resulting in ATP production which causes the closure of the ATP-dependent K+-
channels and depolarization, opening the voltage-gated Ca2+
channels and increasing
the intracellular calcium level. As tanycytes express all elements of this mechanism, it is
likely, that tanycytes may sense glucose on the same way like pancreatic cells. B and C
represent alternative mechanisms by which tanycytes may perform glucose sensation.
On B, glucose enters into tanycytes via Na+-linked glucose transporter. The increasing
intracellular Na+ level leads to the reversal of the Na
+-Ca
2+ exchanger, which increases
the intracellular Ca2+
level promoting the release of ATP which can act through P2Y1
receptors and modulate the mobilization of the intracellular Ca2+
stores in the
neighboring tanycytes. C shows that glucose may act through G-protein coupled
receptors like the Tas1r2/Tas1r3 heterodimer sweet taste receptor that leads to direct
increase of intracellular Ca2+
level resulting in further ATP release.
Based on (Benford et al., 2017, Bolborea and Dale, 2013, Dale, 2011) after
modification.
DOI:10.14753/SE.2019.2208

29
1.5.5. Tanycytes and leptin
Leptin regulates energy homeostasis and food intake and can act in the brain via
activation of the LepR (Ahima et al., 2000) initiating several pathways, including the
signal transducer and activator of transcription 3 (STAT3), extracellular regulated
kinase (ERK) and the phosphatidylinositol-3-kinase (PI3K) pathways (Munzberg and
Myers, 2005).
Peripheral administration of the adiposity signal leptin activates the feeding-related
neurons in the ARC along a gradient moving from the ventral to the dorsal site of the
hypothalamus. However, central injection of leptin can access all the hypothalamic
nuclei within a few minutes (Faouzi et al., 2007). It has also been proved by using
fluorescently labeled leptin that this adiposity signal is able to cross the wall of the
fenestrated capillaries in the external zone of the ME (Vauthier et al., 2013) raising the
possibility that tanycytes represent the first line reached by the peripheral leptin. Indeed,
five-minutes after peripheral leptin administration phosphorylated STAT3 is already
present in the tanycytes, but not in the neurons of the ARC (Balland et al., 2014).
Similarly, the fluorescent leptin administered intravenously labeled tanycytes 5 minutes
after injection. As a further proof of the involvement of tanycytes in the leptin signaling,
all LepR isoforms, the a, b, c and e are expressed in the tanycytes, moreover, ERK and
STAT3 phosphorylation have been shown after leptin treatment in tanycyte cell cultures
(Balland et al., 2014) suggesting the presence of the functional LepR signaling in
tanycytes. According to these data, tanycytes represent the first line reached by the
adipostatic leptin, thus tanycytes my act as a conduit also between other peripheral
signals and the brain.
1.5.6. Tanycytes and other metabolites
Besides exploring the role of tanycytes in the perception to leptin or glucose, a few
researchers aimed to explore the potent ability of tanycytes to respond to other
metabolites.
The above mentioned Tas1r2/Tas1r3 heterodimer G-protein coupled sweet-taste
receptor shares a subunit with the special glutamate receptor which is responsible for
the perception of umami taste and can be found in the tongue (Nelson et al., 2002). As
DOI:10.14753/SE.2019.2208

30
tanycytes express the Tas1r2/Tas1r3 receptor and the umami taste receptor differs from
this only in one subunit, the hypothesis was that tanycytes might be able to sense and
respond to amino acids via Tas1r1/Tas1r3 receptor similarly to those, seen in the case of
glucose sensation. Indeed, it has been proved by calcium imaging and ATP biosensing,
that tanycytes can represent the umami taste signaling pathway by expressing the
Tas1r1/Tas1r3 receptor exhibiting the first non-neuronal mechanism of amino acid
sensing (Lazutkaite et al., 2017). Another study points to the potential role of tanycytes
in the sensation of lipids (Hofmann et al., 2017). Tanycytes of obese animals increase
the size of their lipid droplets. In addition, tanycytes have different immune response for
saturated or unsaturated lipids (Hofmann et al., 2017) raising the possibility, that
tanycytes can sense the quality of fatty acids, as well.
1.5.7. Tanycytes as diet-responsive neurogenic niche
In the last years, several publications proved the neural stem cell (NSC) properties of
tanycytes meaning their ability to generate new neurons in adult animals (Kriegstein
and Gotz, 2003). Tanycytes express a series of NSC markers like vimentin, nestin, Sox2
and glial fibrillary acidic protein (GFAP) reviewed by Rodriguez (Rodriguez et al.,
2005). Furthermore, tanycytes were also shown to retain the expression of progenitor
markers Notch1 and 2 and Rax in the adult brain (Lee et al., 2012). Besides the self-
renewing ability of α-tanycytes (Robins et al., 2013a), these cells also produce neurons
that migrate to the ME, ARC and ventromedial nucleus (VMN) (Haan et al., 2013, Lee
et al., 2012). As the ARC and the VMN are involved in the regulation of energy
metabolism, and HFD regulates the number of the newborn neurons, it is likely, that
tanycytes have the ability to renew neuronal populations involved in the regulation of
energy homeostasis. As a further proof of the role of tanycytes in the renewal of energy
homeostasis-related neuronal populations, tanycyte-derived neurons born from
prepubertal period in the ARC respond to leptin with STAT3 phosphorylation (Haan et
al., 2013), moreover, the blockade of tanycyte neurogenesis results in altered weight and
metabolic activity in adult mice (Lee et al., 2012).
DOI:10.14753/SE.2019.2208

31
1.6. Diet-induced obesity and hypothalamic responses
1.6.1. Diet-induced peripheral and central responses
Obesity represents one of the major health problems in both industrialized and emerging
nations. The main reasons that make obesity a worldwide problem can be traced back to
the reduced physical activity partly due to sedentary lifestyle and to the increased
consumption of dietary fats. Obesity can be characterized by the increase of excess body
fat and associated with the elevated risk of type 2 diabetes, cardiovascular disease and
atherosclerosis (Semenkovich, 2006). Previous investigations have shown that, diet-
induced obesity (Thaler et al.) is linked to immune cell-mediated inflammatory
responses initiating insulin resistance in several organs like liver, skeletal muscle and
adipose tissue (Shoelson et al., 2006). Besides peripheral consequences of the HFD, it
was also shown, that the hypothalamus is also affected by diet-induced inflammation,
moreover, the central inflammatory response represents a more rapid process initiated
by the activation of microglia (Thaler et al., 2012c, Tran et al., 2016).
1.6.2. Diet induced inflammation in the ARC
Long-term consumption of 60% fat containing chow can increase the expression of
proinflammatory cytokines in the hypothalamic ARC (De Souza et al., 2005). However,
recent studies demonstrated that the expression of proinflammatory cytokines is very
quickly increased in the ARC by HFD (Thaler et al., 2012c). Only 3 days of HFD is
sufficient to induce inflammation in this nucleus (Thaler et al., 2012c). The initiation of
the inflammation in the ARC is triggered by FFAs resulting in endoplasmatic reticulum
stress (Ozcan et al., 2009, Zhang et al., 2008). The increased production of reactive
oxygen species, then, facilitates the induction of inflammation (Zhang and Kaufman,
2008). This inflammatory process plays important role in the development of the diet
induced obesity. Indeed, specific ablation of the nuclear factor kappa B (NF-κB)
signaling, a key second messenger of cytokine receptors, in the AgRP neurons, results
in resistance to diet induced obesity (Zhang et al., 2008). Thaler and his colleagues
reported the measurable level of markers of the inflammation within 24 hours of HFD
and the neuronal injury associated with reactive gliosis in the first week of HFD (Thaler
et al., 2012c). The expression levels of proinflammatory interleukin-6 (Il6,) tumor
DOI:10.14753/SE.2019.2208

32
necrosis factor alpha (Tnfa), suppressor of cytokine signaling 3 (Socs3), inhibitor of
nuclear factor kappa-B kinase subunit beta (Ikbkb) and epsilon (Ikbke) are rising in the
initiation of the HFD and then stagnating between the days 7 to 14 and elevating again
suggesting the existence of an early adaptive response (Thaler et al., 2012c).
According to all of these data it is likely, that hypothalamic ARC neurons are able to
sense and initiate the appropriate response to elevated levels of dietary fats, however,
the role of other non-neuronal cell types, like glial cells cannot be excluded from the
central inflammatory responses.
1.6.3. The role of glial cells in the development of the diet- induced
inflammation
Glial cells, including microglia, astrocytes, NG2-positive glial cells and tanycytes play a
pivotal role in the homeostatic regulation of the CNS (Jha and Suk, 2013). Moreover,
these cells are also involved in the metabolic sensing within the hypothalamus (Freire-
Regatillo et al., 2017). In physiological conditions, glial cells support the normal energy
homeostasis of the ARC neurons, however, certain conditions, like HFD can lead to
misregulation of this glia-neuron cooperation. HFD induces activation of both
microglial cells and astrocytes in the ARC that is apparent from the morphological and
gene expression changes (Hanisch and Kettenmann, 2007, Pekny and Nilsson, 2005).
This glial activation is claimed to be important in the development of diet induced
obesity and the associated metabolic changes (Horvath et al., 2010, Thaler et al.,
2012c).
Microglia is a special neuroglial cell type located in the spinal cord and the brain and
performs the task like the macrophage cells and monocytes in the peripheral tissues,
namely, the main role of the microglia is to scavenge all the foreign materials and the
damaged cells and to secrete immune factors (Graeber et al., 2011).
In response to HFD, the number of cells expressing the microglia-specific marker, the
ionized calcium-binding adapter molecule 1 (Iba1) (Ito et al., 1998) increases
accompanied by morphological changes of microglia (Thaler et al., 2012c) indicating
that HFD induces microglial activation. The HFD induced microglial activation is
further suggested by the increased expression of the EGF-like module-containing
DOI:10.14753/SE.2019.2208
33
mucin-like hormone receptor-like 1 (Emr1), a marker of activated microglia, in the
ARC (Thaler et al., 2012c), however, the exact role of this process in the initiation of
the central inflammatory process is still contentious (Thaler et al., 2012c, Valdearcos et
al., 2014). According to Thaler (Thaler et al., 2012c), the microglia accumulation and
activation only occurs, when the hypothalamic inflammation has developed, however
the microglial response is still trackable, even when the inflammatory response has
decayed. Based on this interpretation, microglia has neuroprotective effect during HFD
(Thaler et al., 2012c). According to Valdearcos (Valdearcos et al., 2014), however,
during HFD a rapid microglial activation can be observed and the depletion of microglia
perfectly repressed the hypothalamic inflammation, therefore, microglia are responsible
for the HFD-induced hypothalamic inflammation (Valdearcos et al., 2014). In spite of
this, the long-term effect of microglia in the inflammatory process in both
interpretations is similar: prolonged activation of microglial cells leads to high level of
proinflammatory mediators like cytokines and chemokines.
Astroglia represent the other supporting glial cell type of the brain. Astrocytes are
involved in many neuronal homeostatic functions, such as regulation of synaptic
transmission, maintaining the BBB and the fluid and ion homeostasis by spatial
buffering (Abbott et al., 2010, Kofuji and Newman, 2004). Astrocytes seem to be
sensitive for leptin by expressing LepRs, moreover, leptin is essential for their
proliferation (Rottkamp et al., 2015) raising the possibility of their involvement in the
control of appetite. During obesity, astrocytes show significantly altered morphology in
the ARC that is characteristic for astrocyte activation (Pekny and Nilsson, 2005, Thaler
et al., 2012c). The alteration of astrocyte morphology may change the ensheatment of
hypothalamic neurons (Horvath et al., 2010). Moreover, this reactive gliosis causes the
release of proinflammatory cytokines from astrocytes resulting in local inflammation
via IKKβ/NF-κB signaling (Douglass et al., 2017).
NG2-positive cells play a crucial role in the control of hypothalamic function by
contacting neuronal processes (Robins et al., 2013b). A recent study has shown that,
NG2-positive cells directly contact the ARC processes in the ME regulating their
responsiveness to leptin (Djogo et al., 2016).
DOI:10.14753/SE.2019.2208

34
The effect of diet-induced obesity on the hypothalamic ARC and the involvement of
glial cells in the inflammatory process seems to be evident, however, it is still unclear,
which hypothalamic cell population is responsible for the initiation of the hypothalamic
inflammatory response. As tanycytes represent the first line reached by peripheral
signals, thus play a crucial role in the hypothalamic control of metabolism, moreover,
tanycytes are proved to be able to respond to neurotransmitters, glucose and leptin, it is
likely, that these special cells besides other glial cells also play a role in the regulation
of the inflammatory processes in the case of HFD.
DOI:10.14753/SE.2019.2208

35
2. Aims
The neuronal networks involved in the central regulation of energy homeostasis were
intensely studied during the last decades. Recently, however, more and more data
accumulate suggesting that glial cells are also involved in the regulatory apparatus of
energy homeostasis. Tanycytes, a special glial cell type of the hypothalamus represent a
glucose- and leptin-sensitive, diet-responsive neurogenic niche and play an active role
in the transportation of metabolic signals to the hypothalamic neurons involved in the
regulation of food intake and energy balance. Microglia, the resident macrophage cells
of the brain are also involved in the regulation of energy homeostasis, like via the HFD-
related inflammatory processes. However, the exact role of these glial cell types in the
central regulation of energy homeostasis is still unclear.
To better understand how tanycytes and microglia regulate energy metabolism- and
feeding-related mechanisms, the aim of my PhD work was to investigate the
communication and the POMC gene expression of tanycytes and the importance of
microglia in the development of short-term HFD induced metabolic changes.
In order to achieve this, our specific aims were:
1. To investigate the localization of Cx43 gap junctions and hemichannels in
tanycytes.
2. To characterize the POMC expression in tanycytes
3. To determine the importance of the microglia in the mediation of the HFD
induced metabolic changes.
DOI:10.14753/SE.2019.2208

36
3. Materials and methods
3.1. Experimental animals
The experiments were carried out on adult male or female laboratory mice or rats. The
animals used in each experiments and their sources and body weight are listed in Table
1 and Table 2. The animals were housed under standard environmental conditions
(lights on between 06.00 and 18.00 h, temperature 22±1 °C, chow and water ad
libitum). All experimental protocols were reviewed and approved by the Animal
Welfare Committee at the Institute of Experimental Medicine of the Hungarian
Academy of Sciences.
Table 1: The strain, source, sex, body weight and age of animals used in each
experiment.
For the characterization of POMC expression in tanycytes, rats with different age and
body weight were used, see Table 2.Abbreviations: Cx43 - connexin 43, POMC –
proopiomelanocortin, ISH – in situ hybridization, IHC – immunohistochemistry, HFD –
high fat diet, M – male, F – female.
Experiment Species Strain Source Sex Age Body
weight (g)
The localization of Cx43 gap junctions and hemichannels in tanycytes
mouse CD1
Charles
River M 8 weeks 30-35
The characterization of POMC expression in tanycytes
ISH,
fluorescent
IHC
rat Sprague-
Dawley
Taconic
Farms M/F
described in detail in
Table 2
Immuno-
electron
microscopy
rat Wistar ToxiCoop M 8 weeks 250-275
Importance of microglia in the development of HFD induced metabolic changes
mice C57Bl/6J Charles
River M 8 weeks 20-25
DOI:10.14753/SE.2019.2208

37
Table 2: The sex, age and body weight of Sprague-Dawley rats used for the
characterization of the POMC expression in tanycytes.
Abbreviations: POMC – proopiomelanocortin, ISH – in situ hybridization, M – male, F
– female.
Experiment Sex Age Body weight (g) Number of the
used Sprague-
Dawley rats
Adult rats for Pomc ISH
M 8 weeks 240-260 4
M 8-9 weeks 257-284 6
F 9-10 weeks 224-245 6
M 9-10 weeks 286-293 4
M 15 weeks 413-436 6
Adult rats for POMC immunofluorescence
M 10 weeks 290-320 4
M 10 weeks 290-320 4
F 11 weeks 238-258 7
Adolescent rats for Pomc ISH
M 31 days 80-93 4
F 31 days 67-81 4
GENERAL METHODS
3.2. Anesthesia
The anesthesia of the animals was performed either by using intraperitoneal injection of
a mixture of ketamine (50 mg/kg body weight) and xylazine (10 mg/kg body weight) or
by inhalation of isoflurane.
3.3. Transcardial perfusion with fixative
Animals processed for immunocytochemistry were deeply anesthetized by
intraperitoneal ketamine-xylazine injection and transcardially perfused with 10 ml
(mice) or 50 ml (rat) 0.01 M phosphate buffered saline (PBS, pH 7.4) followed by
fixative.
For Cx43 immunocytochemistry, the mice were perfused with 50 ml 4%
paraformaldehyde (PFA) in sodium-acetate buffer (pH 6.0) followed by 50 ml 4% PFA
DOI:10.14753/SE.2019.2208

38
in Borax buffer (pH 8.5). For Iba1 immunocytochemistry, the mice were perfused with
4% PFA in 0.1 M phosphate buffer (PB, pH 7.4). For rat immunofluorescent
experiments, rats were transcardially perfused with 150 ml 4% PFA in 0.1M PB (pH
7.4). For the ultrastructural detection of POMC-immunoreactivity in tanycytes, rats
were transcardially perfused with 150 ml fixative containing 4% acrolein and 2% PFA
in 0.1 M PB, pH 7.4.
After transcardial perfusion, the brains were rapidly removed from the skull and
postfixed.
3.4. Tissue preparation for light microscopic investigations
For light microscopic experiments, the brains were postfixed in 4% PFA for 2 hours. In
order to ensure cryoprotection, the brains were incubated in 30% sucrose in 0.01 M PBS
overnight. After that, the brains were frozen on powdered dry ice and 25 µm thick
coronal sections were cut using a Leica SM2000 R freezing microtome (Leica
Microsystems, Wetzlar, Germany). The sections were placed into antifreeze solution (30%
ethylene glycol; 25% glycerol; 0.05 M PB) and stored at -20 °C until further processing.
The sections were then placed into 0.5% Triton X-100 and 0.5% H2O2 in 0.01 M PBS
for 20 min to improve penetration and block the endogenous peroxidase activity. To
reduce non-specific antibody binding, the sections were incubated in 2% normal horse
serum (NHS) in PBS for 10 min.
3.5. Tissue preparation for electron microscopic investigations
For electron microscopic investigations, the brains were postfixed in 4% PFA in 0.1 M
PB, (pH 7.4), for 24 h at 4°C, then serial 25 µm thick coronal sections of the
hypothalamus were cut on a Leica VT1000 S vibratome (Leica Microsystems, Wetzlar,
Germany). When the fixative contained acrolein, the sections were incubated in 1%
sodium-borohydride dissolved in 0.1 M PB (pH 7.4) for 30 min. In all cases, the
sections were treated in 0.5% H2O2 in PBS for 15 min. After that, the sections were
cryoprotected by incubation in 15% sucrose in 0.01 M PBS for 15 min at room
temperature and in 30% sucrose in PBS overnight at 4°C. Thereafter, the sections were
frozen over liquid nitrogen and thawed quickly three times to improve antibody
DOI:10.14753/SE.2019.2208
39
penetration. To reduce non-specific antibody binding, the sections were incubated in 2%
NHS in PBS for 10 min.
3.6. Embedding for electron microscopic studies
The immunolabeled sections were osmicated using 1% osmium tetroxide in 0.1 M PB
for 1 h. The sections were washed in 50 and 70% ethanol, sequentially, and incubated in
2% uranyl-acetate in 70% ethanol for 30 min. After dehydration of sections in
ascending series of ethanol and in acetonitrile, respectively, sections were embedded in
Durcupan ACM epoxy resin on liquid release agent (Electron Microscopy Sciences)
coated slides and polymerized at 60°C for 48 h.
3.7. Tissue preparation for in situ hybridization (ISH)
Rats were deeply anesthetized with ketamine-xylazine (Section 3.2) and decapitated.
The brains were removed and frozen on powdered dry ice. Coronal, 18 μm thick
sections were cut through the entire extent of the ARC using a Leica CM3050 S cryostat
(Leica Microsystems, Germany), thaw-mounted on Superfrost Plus glass slides (Fisher
Scientific Co.) and air-dried. Sections were collected in 1-in-12 series on a total of 24
(2×12) slides per brain. With 6 hypothalamic sections on each slide, a series containing
every 12th section fit on 2 slides, one containing the rostral, and another, containing the
caudal part of the tanycyte region. The sections were stored at -80°C until processed for
ISH.
3.8. Tissue preparation for laser capture microdissection (LCM)
In order to preserve the integrity of RNA for further gene expression investigations, the
experimental animals were deeply anesthetized (Section 3.2) and transcardially perfused
with ice-cold 10% RNAlater solution (Ambion) diluted in diethylpyrocarbonate (DEPC)
treated 0.1 M PBS. The mice were perfused with 30 ml, while the rats were perfused
with 70 ml 10% RNAlater solution. The brains were quickly removed from the skull
and frozen in -40°C 2-methylbutane. The brains were stored at -80°C until sectioning.
Coronal, 12 µm thick sections between the rostral and caudal limits of the ME were cut
at -18°C using a Leica CM3050 S cryostat (Leica Microsystems, Wetzlar, Germany
Sections were mounted on PEN-membrane covered slides (Zeiss, Germany), thawed
DOI:10.14753/SE.2019.2208

40
and counterstained with 0.6% cresyl violet dissolved in 70% ethanol and dehydrated
with ascending series of ethanol. The slides were thoroughly dried on a 42°C hot plate
and stored at -80°C until LCM.
3.9. Isolation of tanycytes and ARC using LCM
From the RNAlater perfused and preconditioned brain sections (Section 3.8), the
tanycyte containing ventral and lateral walls of the third ventricle and the area of ARC
were microdissected by using Zeiss Microbeam LCM system and PALM software. The
ARC and the-tanycyte samples were pressure-catapulted with a single laser pulse into
0.5 ml tube adhesive caps (Carl Zeiss Microimaging) using a 10 or ×20 objective lenses.
3.10. RNA isolation and RNA concentration measurements
RNA was isolated from the microdissected samples by using Arcturus PicoPure RNA
Isolation Kit (Applied Biosystems) according to the manufacturer’s protocol. DNase
treatment was carried out on the isolation column by using RNase-Free DNase Set
(Qiagen) to digest the potential DNA contamination of the samples. The quality and the
concentration of the isolated RNA samples were measured on Agilent 6000 RNA Pico
chips with Agilent Bioanalyzer using 2100 Expert software (Agilent Technologies).
Samples with RNA integrity number below 5.0 were excluded from further studies.
3.11. Statistical analysis
For the statistical analysis the Statistica 13.1 software was used. The data were
described as mean+SEM. T-test was used for comparison of two groups. The statistical
examination of three or more groups was performed using one-way or factorial
ANOVA followed by Newman–Keuls or Tukey HSD post hoc, respectively.
DOI:10.14753/SE.2019.2208

41
DETAILED METHODS BY PROJECTS
3.12. The localization of Cx43 gap junctions and hemichannels in
tanycytes
3.12.1. Loading the tanycytes with Lucifer yellow (LY) via patch pipette
To demonstrate that the tanycytes are connected via gap junctions, tanycytes were
loaded with the gap junction permeable dye, LY via patch pipette and the spreading of
the dye among tanycytes was studied. These experiments were performed with the help
of Edina Varga.
CD1 mice were deeply anesthetized with isoflurane and decapitated. The brains were
rapidly removed and immersed in ice cold slicing solution (containing 87 mM NaCl, 2.5
mM KCl, 0.5 mM CaCl2, 7 mM MgCl2, 25 mM NaHCO3, 25 mM D-glucose, 1.25 mM
NaH2PO4, 75 mM sucrose saturated with 95% O2/5% CO2 carbogen). Coronal 250 µm
thick slices containing the ME were cut using a vibratome (Leica WT 1200S), then, the
slices were transferred into a holding chamber containing artificial cerebrospinal fluid
(aCSF, containing: 126 mM NaCl, 2.5 mM KCl, 26 mM NaHCO3, 2 mM CaCl2, 2 mM
MgCl2, 1.25 mM NaH2PO4, 10 mM glucose; pH 7.4; 280-300 mOsm/L) at 36°C. Before
uploading tanycytes, the slices were allowed to cool down to room temperature for at
least 1 h. Tanycytes were patched in aCSF at 30–32°C perfused at a rate of 2 ml/min via
perfusion pump. The patch pipettes (OD = 1.5 mm, thin wall, Garner Borosilicate
pipettes, 6–7 MΩ) were filled with intracellular recording solution (110 K-gluconate, 4
mM NaCl, 20 mM HEPES, 0.1 mM EGTA, 10 mM phosphocreatine di(tris) salt, 2 mM
ATP, 0.3 mM GTP; pH 7.25; 280–300 mOsm/L) and 1 mg/ml LY. The tanycytes were
loaded with LY for 20 min at -80–85 mV holding potential.
To demonstrate that the spreading of LY among tanycytes is due to the presence of gap
junctions, tanycytes were loaded with LY in the presence of a gap junction inhibitor,
carbenoxolone (200 µM), in the extracellular solution.
All studied slices were then fixed in 4% PFA dissolved in 0.1 M PB (pH 7.4). Z-stack
images were taken using a Zeiss LSM 780 confocal laser scanning microscope (Carl
Zeiss Microscopy GmbH) with Plan-Apochromat 40x/1.4 Oil DIC M27 objective (Carl
DOI:10.14753/SE.2019.2208

42
Zeiss AG). The sections were scanned for LY using laser excitation line 405 and
emission filter wavelength 477-685 nm. Pinhole sizes were set to obtain the minimal
thickness of optical slices.
3.12.2. Double-labeling immunofluorescence for Cx43 and vimentin
For immunohistochemical detection of Cx43, mice were deeply anaesthetized by
intraperitoneal injection and perfused transcardially as described in sections 3.2 and 3.3,
respectively. Then, the brain tissues were prepared according to section 3.4. and
incubated in rabbit antiserum against Cx43 (1:400, Invitrogen) diluted in PBS
containing 2% NHS and 0.2% sodium-azide (antibody diluent) overnight at room
temperature. This step was followed by direct visualization of the immunoreaction with
incubation in Alexa-488 conjugated donkey anti-rabbit IgG (1:250, Invitrogen).
Vimentin was used as a marker of tanycytes. In order to make the tanycytes and their
processes visible, the sections were transferred into sheep antiserum against vimentin
(1:3000, Santa Cruz Biotech), followed by incubation in biotinylated donkey anti-sheep
IgG (1:500, Jackson ImmunoResearch) for 2 h, then in avidin-biotin-peroxidase
complex (1:000, Vectastain Elite ABC, Vector Laboratories) for 1 h. The
immunoreaction product was amplified with biotinylated tyramide by using the TSA
amplification kit (Perkin Elmer Life and Analytical Sciences, Waltham, MA) according
to the manufacturer’s description. Vimentin was visualized by incubating the sections in
Alexa-594 conjugated Strepavidin (1:500, Invitrogen). The double-labeled
immunofluorescent sections were mounted on glass slides and coverslipped with
Vectashield mounting medium (Vector Laboratories) and examined with Zeiss LSM
780 confocal laser-scanning microscope (Carl Zeiss Microscopy GmbH) with Plan-
Apochromat 10x0.45 M27, 20x 0.8 M27, 40x1.40 Oil DIC M27, 63x1.40 Oil DIC M27
objectives (Carl Zeiss AG). The sections were sequentially scanned for Alexa 488 and
Alexa-594 using laser excitation lines 488 nm for Alexa-488 and 561 nm for Alexa 594
and emission filter wavelength 493–556 nm for Alexa-488 and 586-697 for Alexa 594.
Pinhole sizes were set to obtain the minimal thickness of optical slices.
DOI:10.14753/SE.2019.2208

43
3.12.3. Ultrastructural detection of Cx43-immunoreactivity
For ultrastructural localization of Cx43 in tanycytes, mice were deeply anesthetized
(Section 3.2) and perfused subsequently by 4% PFA at low and high pH (pH 7.4 and 6),
respectively, as described above in Section 3.3. After preconditioning as described in
Section 3.5, the sections were incubated in rabbit antiserum against Cx43 (1:2000) for 4
days, followed by overnight incubation in biotinylated donkey-anti-rabbit IgG (1:500,
Jackson ImmunoResearch) and ABC (1:1000). The immunoreaction was visualized
with nickel-diaminobenzidine developer (0.05% diaminobenzidine (DAB), 0.15%
nickel ammonium sulfate, 0.005% H2O2 in 0.05 M Tris buffer at pH 7.6) and amplified
by silver-intensification by using Gallyas method (Gallyas and Merchenthaler, 1988).
After electron microscopic embedding as described in Section 3.6, 60–70 nm thick
ultrasections were cut with Leica Ultracut UCT ultramicrotome (Leica Microsystems,
Wetzlar, Germany). The ultrathin sections were mounted onto Formvar-coated single
slot grids, contrasted with 2% lead citrate and examined with a Jeol-100 C transmission
electron microscope. The tanycytes were identified based on their characteristic
morphological features, while the tanycyte subtypes were distinguished based on their
localization (Rodriguez et al., 2005).
3.13. Characterization of the POMC expression in tanycytes
The ISH experiments and the immunofluorescent investigations were carried out by
Gábor Wittmann.
3.13.1. Radioactive ISH
Radioactive ISH was performed on serial sections of rats (see Attachment 1 for
sex/age/body weight). The Pomc riboprobe was synthesized in the presence of [35S]-
uridine 5′-(alpha-thio) triphosphate (PerkinElmer), and purified with Mini Quick Spin
RNA columns (Roche Applied Sciences, Basel, Switzerland). The riboprobe template
was mouse cDNA corresponding to bases 532-1007 of mouse Pomc mRNA, GenBank
Acc. No. NM_008895.3 (plasmid provided by Dr. Malcolm J. Low). This sequence is
93% homologous with the rat Pomc sequence (504-935 of NM_139326.2). ISH was
performed on every 12th coronal section per brain, using 50,000 CPM/μl radiolabeled
DOI:10.14753/SE.2019.2208

44
probe concentration. Following stringency washes, sections were dehydrated in
ascending series of ethanol, air-dried, and dipped into Kodak NTB autoradiography
emulsion (Carestream Health Inc., Rochester, NY). The emulsion coated-slides were
placed in light-tight boxes containing desiccant, and stored at 5°C for 8d, when the
autoradiograms were developed using Kodak D19 developer (Eastman Kodak
Company, Rochester, NY). Slides were immersed into 0.0005% Cresyl Violet acetate
(Sigma-Aldrich) for 2 min for fluorescent counterstaining, then dehydrated in ascending
series of ethanol followed by xylene (Sigma-Aldrich), and coverslipped with DPX
mountant (Sigma-Aldrich).
3.13.2. Fluorescent ISH combined with immunofluorescence
Fluorescent ISH was performed on serial sections of 16 adult Sprague-Dawley rats. The
Pomc riboprobe was labeled with digoxigenin-11-UTP (Roche) by in vitro transcription.
ISH was performed on every 12th coronal section, as described previously for fresh
frozen sections (Wittmann et al., 2013). Following the hybridization procedure, sections
were treated with 0.5% Triton X-100/0.5% H2O2 in PBS (pH 7.4) for 15 min, rinsed in
PBS, immersed in maleate buffer (0.1 M maleic acid, 0.15 M NaCl, pH 7.5; 10 min),
and in 1% blocking reagent for nucleic acid hybridization (Roche). The sections were
incubated overnight in Fab fragments of peroxidase-conjugated sheep anti-digoxigenin
antibody (1:100 in 1% blocking reagent, Roche) using CoverWell incubation chambers
(Grace Bio-Labs Inc., Bend, OR). After rinses in PBS, the hybridization signal was
amplified using the TSA Biotin Tyramide system (Perkin Elmer) for 30 min, followed
by Alexa Fluor 488-conjugated Streptavidin (Life Technologies, Grand Island, NY) for
2h, diluted at 1:500 in 1% blocking reagent. Then sections were then incubated in the
mixture of a mouse antibody against the neuronal proteins HuC/HuD (Molecular
Probes) and chicken vimentin antiserum (Millipore). The primary antibodies were
detected with Alexa Fluor 647-conjugated donkey anti-mouse IgG (Jackson
ImmunoResearch Labs) and Cy3-conjugated donkey anti-chicken IgG (Jackson
ImmunoResearch Labs). The antibodies and the used concentrations are listed in Table
3 and Table 4. Sections were coverslipped with Vectashield mounting medium
containing 4',6-diamidino-2-phenylindole (DAPI).
DOI:10.14753/SE.2019.2208

45
3.13.3. Immunofluorescent detection of POMC, β-endorphin, α-MSH and
adrenocorticotropic hormone (ACTH)
Adult Sprague-Dawley rats were deeply anesthetized with ketamine-xylazine (Section
3.2) and then perfused transcardially with 4% PFA (Section 3.3). The brains were
removed and the tissues were preconditioned as described above (Section 3.4).
The following three immunofluorescent preparations were made from each brain, each
on an individual, full series of 1-in-6 coronal sections: triple immunofluorescence for
the N-terminal portion of POMC, vimentin and HuC/D; dual immunofluorescence for
β-endorphin and α-MSH; and single immunofluorescence for ACTH. The antibodies
and the used concentrations are listed in Table 3 and Table 4. For triple-labeling
immunofluorescence, the sections were first incubated in rabbit anti-POMC serum
(Phoenix Pharmaceuticals) for 2d followed by Alexa 488-conjugated donkey anti-rabbit
IgG (Jackson ImmunoResearch Labs) for 2h. Then, the sections were incubated in the
cocktail of chicken anti-vimentin serum and mouse anti-HuC/D antibodies overnight
and then in Cy3-conjugated donkey anti-mouse IgG (Jackson ImmunoResearch Labs)
and Alexa 647-conjugated donkey anti-chicken IgG (Jackson ImmunoResearch Labs)
for 2h. For dual immunofluorescence, sections were incubated in the cocktail of rabbit
anti-β-endorphin (Phoenix Pharmaceuticals) and sheep anti-α-MSH antisera (Millipore)
overnight followed by Cy3-conjugated donkey anti-rabbit IgG (Jackson
ImmunoResearch Labs) and Alexa 488-conjugated donkey anti-sheep IgG (Jackson
ImmunoResearch Labs) for 2h. For single-labeling immunofluorescence for ACTH, the
sections were incubated in rabbit anti-ACTH serum (Phoenix Pharmaceuticals) for 2d
and then in Cy3-conjugated donkey anti-rabbit IgG for 2h. The sections were mounted
and coverslipped with DAPI-containing Vectashield mounting medium (Vector).
3.13.4. Ultrastructural detection of POMC-immunoreactivity in tanycytes
The immune-electron microscopic investigations were carried out with the help of
Erzsébet Hakkel.
Adult male rats were deeply anesthetized with ketamine/xylazine (Section 3.2) and
perfused transcardially as described in Section 3.3. The brains were rapidly removed
and preconditioned for immune-electron microscopic investigation as described in
DOI:10.14753/SE.2019.2208

46
Section 3.5. The sections were incubated in 2% NHS in PBS for 10 min before placed
in rabbit anti-POMC serum (1:15000, Phoenix Pharmaceuticals) diluted in 2% NHS in
PBS for 4 days at 4°C followed by overnight incubation in biotinylated donkey anti-
rabbit IgG (Jackson ImmunoResearch) and then in ABC (1:1000, Vector) for 2h. The
POMC-immunoreactivity was detected with NiDAB developer and the immunoreaction
was intensified by using Gallyas-method for 2 min (Gallyas and Merchenthaler, 1988).
The sections were embedded in Durcupan resin as described in Section 3.6. After
polymerization, 60–70 nm thick ultra-sections were cut with Leica Ultracut UCT
ultramicrotome. The ultrathin sections were mounted onto Formvar-coated single slot
grids, contrasted with 2% lead citrate and examined with a Jeol-100 C transmission
electron microscope.
Table 3: The manufacturer and concentration of the primary antibodies used in the
experiments.
Antibody Immunogen Manufacturer, species,
clonality
Concentration
Cx43 C-terminal portion of rat
connexin 43 peptide
Invitrogen, rabbit
polyclonal
1:400 for
immunofluorescence,
1:2K for immuno-
electron microscopy
vimentin C-terminus of vimentin of
human origin
Santa Cruz Biotech,
sheep monoclonal
1:3K
POMC N-terminal 26 amino acids
of porcine
proopiomelanocortin
peptide
Phoenix
Pharmaceuticals, rabbit
polyclonal
1:20K for
immunofluorescence
1:15K for electron
microscopy
β-
endorphin
rat β-endorphin Phoenix
Pharmaceuticals, rabbit
polyclonal
1:10K
ACTH rat ACTH Phoenix
Pharmaceuticals, rabbit
polyclonal
1:10K
α-MSH α-MSH Millipore, sheep
polyclonal
1:10K
vimentin recombinant vimentin Millipore, chicken
polyclonal
1:4K after ISH; 1:20K
for
immunofluorescence
HuC/HuD human HuC/D Life Technologies,
mouse monoclonal
2 μg/ml after ISH; 1
μg/ml for
immunofluorescence
digoxigenin, digoxigenin, peroxidase
conjugated
Roche, sheep 1:100
Iba1 C-terminus of Iba1 Wako, rabbit
polyclonal
1:2K
DOI:10.14753/SE.2019.2208
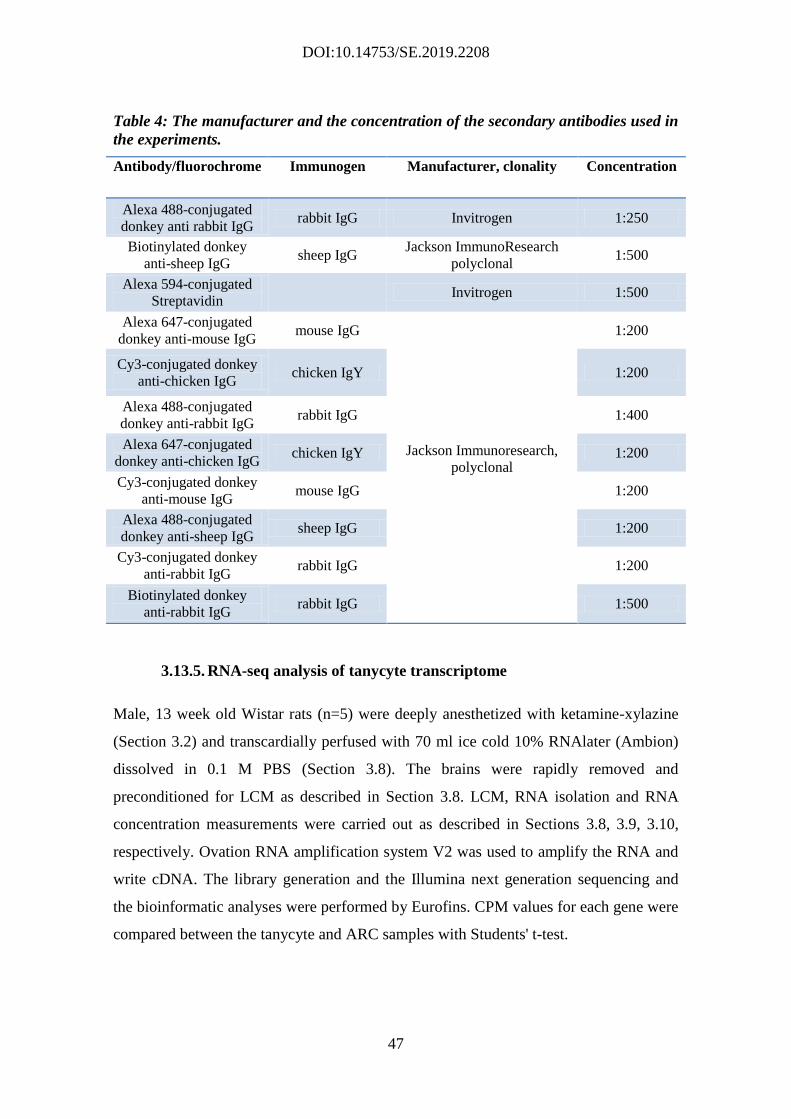
47
Table 4: The manufacturer and the concentration of the secondary antibodies used in
the experiments.
Antibody/fluorochrome Immunogen Manufacturer, clonality Concentration
Alexa 488-conjugated
donkey anti rabbit IgG rabbit IgG Invitrogen 1:250
Biotinylated donkey
anti-sheep IgG sheep IgG
Jackson ImmunoResearch
polyclonal 1:500
Alexa 594-conjugated
Streptavidin Invitrogen 1:500
Alexa 647-conjugated
donkey anti-mouse IgG mouse IgG
Jackson Immunoresearch,
polyclonal
1:200
Cy3-conjugated donkey
anti-chicken IgG chicken IgY 1:200
Alexa 488-conjugated
donkey anti-rabbit IgG rabbit IgG 1:400
Alexa 647-conjugated
donkey anti-chicken IgG chicken IgY 1:200
Cy3-conjugated donkey
anti-mouse IgG mouse IgG 1:200
Alexa 488-conjugated
donkey anti-sheep IgG sheep IgG 1:200
Cy3-conjugated donkey
anti-rabbit IgG rabbit IgG 1:200
Biotinylated donkey
anti-rabbit IgG rabbit IgG 1:500
3.13.5. RNA-seq analysis of tanycyte transcriptome
Male, 13 week old Wistar rats (n=5) were deeply anesthetized with ketamine-xylazine
(Section 3.2) and transcardially perfused with 70 ml ice cold 10% RNAlater (Ambion)
dissolved in 0.1 M PBS (Section 3.8). The brains were rapidly removed and
preconditioned for LCM as described in Section 3.8. LCM, RNA isolation and RNA
concentration measurements were carried out as described in Sections 3.8, 3.9, 3.10,
respectively. Ovation RNA amplification system V2 was used to amplify the RNA and
write cDNA. The library generation and the Illumina next generation sequencing and
the bioinformatic analyses were performed by Eurofins. CPM values for each gene were
compared between the tanycyte and ARC samples with Students' t-test.
DOI:10.14753/SE.2019.2208

48
3.14. Importance of microglia in the development of HFD induced
metabolic changes
3.14.1. Microglia-ablation with PLX5622-pretreatment
In order to ablate microglia in the brain, half of the mice were fed with low fat (10%)
chow containing 1200 mg/kg PLX5622, a specific colony stimulating factor 1 receptor
(CSF1R) inhibitor in microglia for three weeks, while the other half of the mice, as
control group consumed the same low fat (10%) chow without PLX5622. The special
diets were formulated by the Research Diet INC (New Brunswick, NJ). The PLX5622
was kindly provided by Plexxikon Inc (Berkeley, CA).
To monitor the success of microglia ablation in treated mice, sentinel mice were
maintained and treated with PLX5622-containing or PLX5622-free chows and
sacrificed for immunocytochemistry using the microglial marker Iba1 (3.14.4). During
the PLX pretreatment the consumption and the body weight of the experimental mice
was measured every week.
3.14.2. Short-term HFD treatment
In order to investigate the effect of short-term HFD, the half of the mice pretreated with
PLX5622 chow continued consuming the same low-fat (10%) chow containing
PLX5622 (LF+PLX group), while the other half of these mice was switched to high fat
(60%) chow containing 1200 mg/kg PLX5622 (HFD+PLX group) for three days.
Similarly, the half of the control group continued consuming low fat (10%) PLX5622-
free chow (LF group), while the other half of these mice was switched to high fat (60%)
PLX5622-free chow (HFD group). The HFDs were also formulated by the Research
Diet INC (New Brunswick, NJ). Figure 4 illustrates the experimental design.
DOI:10.14753/SE.2019.2208

49
Figure 4: The experimental design of short-term HFD experiments.
In order to ablate microglia, half of the mice were fed with low fat (10%) chow-
containing 1200 mg/kg PLX5622 for three weeks, while the other half of the mice, as
control group consumed the same low fat (10%) chow without PLX5622. In order to
investigate the effect of short-term HFD, the half of the mice pretreated with PLX5622
chow continued consuming the same low-fat (10%) chow containing PLX5622
(LF+PLX group), while the other half of these mice was switched to high fat (60%)
chow-containing 1200 mg/kg PLX5622 (HFPLX group) for three days. Similarly, the
half of the control group continued consuming low fat (10%) PLX5622-free chow (LF
group), while the other half of these mice was switched to high fat (60%) PLX5622-free
chow (HFD group). Abbreviations: LF – low fat diet, HFD – high fat diet.
3.14.3. Indirect calorimetric measurements and body composition analysis
After the PLX pretreatment the experimental animals were transferred to the Metabolic
Phenotyping Center of the Institute of Experimental Medicine, Budapest, Hungary.
Three days before the beginning of the HFD, the mice were placed into training cages in
order to let the animals habituate to the same metabolic cages and to learn the usage of
the special drinking nipples and feeders. In order to evaluate the effect of short-term
HFD on the metabolism of the PLX-treated and control mice, water and food intake,
locomotor activity and indirect calorimetric measurements including oxygen
consumption and carbon-dioxide production were performed with the TSE PhenoMaster
System (TSE Systems GmbH, Bad Homburg, Germany) during the three days of the
HFD. The metabolic data was analyzed with the TSE PhenoMaster software.
Before and after the metabolic measurements, body composition analysis (total body
mass, lean body mass, total and free water content) was performed by using EchoMRI
Whole Body Composition Analyzer (EchoMRI LLC, Houston, TX).
3.14.4. Iba1 immunocytochemistry
In order to verify the microglia ablation, immunocytochemistry against the microglial
marker, Iba1 was performed. For immunohistochemical detection of Iba1, mice were
LF
LF HFD
LF + PLX
LF +
PLX
HFD + PLX
PLX5622 pretreatment (3
weeks)
HFD/LF treatment
(3 days)
DOI:10.14753/SE.2019.2208

50
deeply anaesthetized by intraperitoneal injection and perfused transcardially as
described in sections 3.2 and 3.3, respectively. The brain tissues were prepared
according to section 3.4. After that, sections were incubated in rabbit antiserum against
Iba1 (1:2000, Wako Laboratory Chemicals) diluted in PBS containing 2% NHS and
0.2% sodium-azide overnight at room temperature. On the next day, after washing in
0.01 M PBS, the sections were placed into biotinylated donkey anti-rabbit IgG for 2
hours and then incubated in ABC for 1 hour. The immunoreaction was visualized with
NiDAB developer. The sections were mounted on glass slides dehydrated in ascending
series of ethanol and xylene and coverslipped with DPX. The sections were examined
with a Zeiss Axioimager M2 fluorescent microscope.
3.14.5. cDNA synthesis and preamplification from the LCM samples
The RNA samples prepared as described in Sections 3.8 3.9 and 3.10 were reverse
transcribed by using ViLO Superscript III cDNA Reverse Transcription Kit (Invitrogen)
according to the manufacturer’s protocol. The cDNA concentration was measured with
Qubit® Fluorometer by using Qubit® ssDNA Assay Kit (Invitrogen). The cDNA
product served as a template for preamplification by using Preamp Master Mix Kit
(Applied Biosystems) and the double-stranded DNA concentration was measured with
Qubit® Fluorometer by using Qubit® dsDNA BR Kit.
3.14.6. Quantitative TaqMan PCR
In order to verify the inflammatory process in the ARC, the expression of genes
involved in inflammatory processes were elucidated by MicroAmp Fast Optical 96-
Well Reaction Plates with Barcode and TaqMan® Gene Expression Assays (Applied
Biosystems). See the list of the investigated genes in Table 5. The expression of the
genes of our interest was determined by qPCR. ViiA 7 real-time PCR platform (Life
Technologies) was used for thermal cycles of the qPCR with the usage of Fast-96 well
block and comparative CT method.
DOI:10.14753/SE.2019.2208

51
Table 5: The list of the investigated genes to verify the microglia ablation in the ARC.
MicroAmp Fast Optical 96-Well Reaction Plates with Barcode and TaqMan® Gene
Expression Assays were used to determine the expression of the genes of our interest by
qPCR with ViiA 7 real-time PCR platform. In this experiment Gapdh served as
housekeeping gene.
Assay ID Symbol Gene name
Mm00802529_m1 Emr1 EGF-like module-containing mucin-like hormone receptor-like
1
Mm00479862_g1 Iba1 ionized calcium-binding adapter molecule 1
Mm99999915_g1 Gapdh glyceraldehydes-3-phosphate dehydrogenase
DOI:10.14753/SE.2019.2208

52
4. Results
4.1. The localization of Cx43 gap junctions and hemichannels in tanycytes
4.1.1. Presence of functional gap junctions between tanycytes
The fluorescent dye LY loaded into a single β-tanycyte via patch pipette was able to
spread into a larger group of the adjacent tanycytes and labeled both cell bodies and the
basal processes of these cells. The expansion of the dye was not only apparent by
movement between adjacent tanycyte cell bodies, but it also transported among
contiguous tanycyte end feet process. LY also appeared around blood vessels contacted
by tanycyte processes (Figure 5A-B). To determine whether LY spread through Cx43
gap junctions, the experiment was repeated in the presence of the gap junction inhibitor,
carbenoxolone. The inhibitor completely prevented the spreading of LY from the
patched cell and the fluorescent labeling was only present in the patched cell (Figure
5C).
Figure 5: Presence of functional gap junctions among tanycytes.
Fluorescent microscopic images illustrate the spreading of Lucifer yellow (LY) among
cells in the ME after loading a single β-tanycyte via patch pipette. Note that LY fills a
larger group of neighboring tanycytes (A, B). In addition, LY filled tanycytes through
contacts of their end feet processes in the external zone of median eminence (A). This
phenomenon is illustrated by a backfilled tanycyte process labeled by an arrowhead. LY
also labeled capillaries contacted by tanycyte processes (B, *). The gap junction
inhibitor, carbenoxolone, blocked the spreading of LY from the patched tanycyte to
neighboring cells, resulting in the labeling of only the patched tanycyte (C).
Scale bars = 20 µm. Abbreviations: 3V – third ventricle, ME – median eminence
DOI:10.14753/SE.2019.2208

53
4.1.2. Detection of Cx43-immunoreactivity in tanycytes
Double-labeling immunocytochemistry for Cx43 and vimentin, the latter a molecular
marker of glial cells including tanycytes, demonstrated an abundance of Cx43 in
tanycytes (Figure 6A-C). The highest density of Cx43-immunoreactive puncta was
observed in the cell bodies of tanycytes (Figure 6D), although Cx43 was also
present, but in lower density, in -tanycyte cell bodies lining the floor of the third
ventricle (Figure 6F). The location of Cx43-immunoreactivity in tanycyte cell bodies
appeared to be polarized (Figure 6E-G; I), as the greatest density concentrated primarily
on the ventricular surface of tanycytes, but was also present in lower density on the
lateral surfaces of adjacent tanycyte cell bodies. Cx43-immunoreactivity was also
observed in basal processes of both - and -tanycytes and particularly apparent in the
external zone of the ME (Figure 6G) and ARC where the processes were in close
proximity to small capillaries (Figure 6H).
Figure 6: Distribution of Cx43-immunoreactivity in tanycytes.
Confocal microscopic images (A–C) of sections labeled for Connexin 43 (Cx43, green)
and the tanycyte marker, vimentin (Redecker), illustrate that distribution of Cx43-
immunoreactivity in the different types of tanycytes. (A) shows the vimentin-
immunoreactive tanycytes, while the Cx43-immunoreactivity is illustrated in (B). The
DOI:10.14753/SE.2019.2208
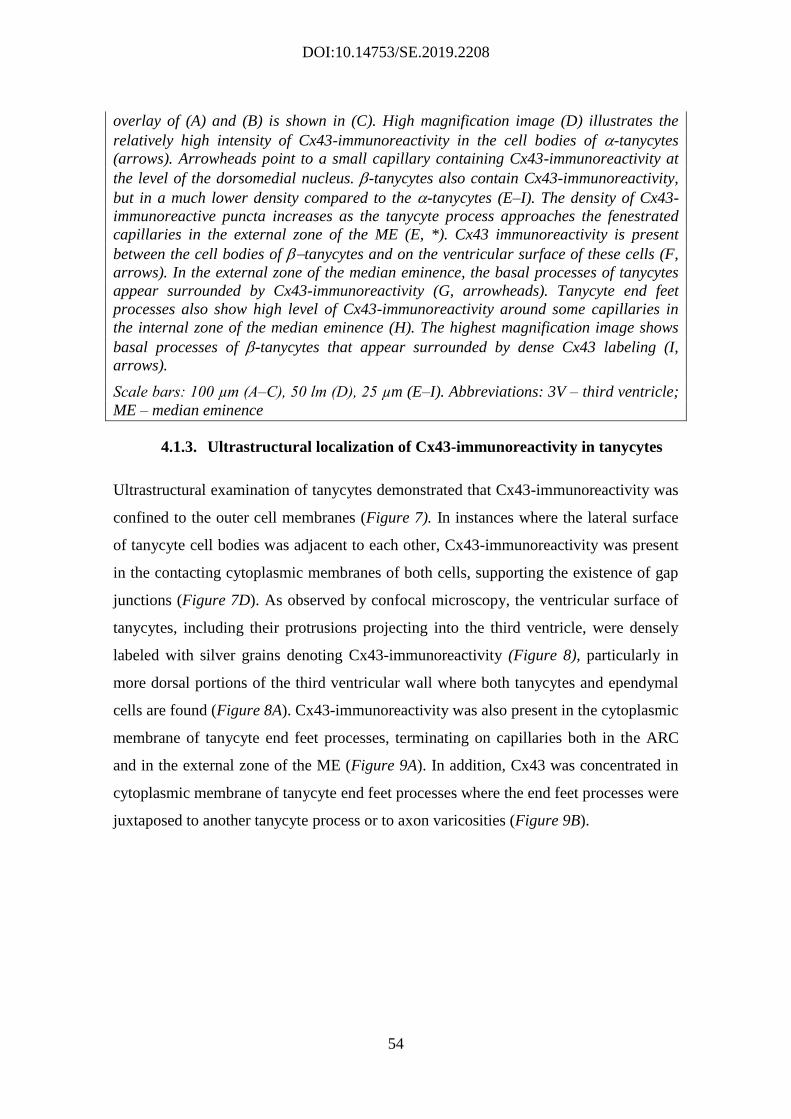
54
overlay of (A) and (B) is shown in (C). High magnification image (D) illustrates the
relatively high intensity of Cx43-immunoreactivity in the cell bodies of -tanycytes
(arrows). Arrowheads point to a small capillary containing Cx43-immunoreactivity at
the level of the dorsomedial nucleus. -tanycytes also contain Cx43-immunoreactivity,
but in a much lower density compared to the -tanycytes (E–I). The density of Cx43-
immunoreactive puncta increases as the tanycyte process approaches the fenestrated
capillaries in the external zone of the ME (E, *). Cx43 immunoreactivity is present
between the cell bodies of tanycytes and on the ventricular surface of these cells (F,
arrows). In the external zone of the median eminence, the basal processes of tanycytes
appear surrounded by Cx43-immunoreactivity (G, arrowheads). Tanycyte end feet
processes also show high level of Cx43-immunoreactivity around some capillaries in
the internal zone of the median eminence (H). The highest magnification image shows
basal processes of -tanycytes that appear surrounded by dense Cx43 labeling (I,
arrows).
Scale bars: 100 µm (A–C), 50 lm (D), 25 µm (E–I). Abbreviations: 3V – third ventricle;
ME – median eminence
4.1.3. Ultrastructural localization of Cx43-immunoreactivity in tanycytes
Ultrastructural examination of tanycytes demonstrated that Cx43-immunoreactivity was
confined to the outer cell membranes (Figure 7). In instances where the lateral surface
of tanycyte cell bodies was adjacent to each other, Cx43-immunoreactivity was present
in the contacting cytoplasmic membranes of both cells, supporting the existence of gap
junctions (Figure 7D). As observed by confocal microscopy, the ventricular surface of
tanycytes, including their protrusions projecting into the third ventricle, were densely
labeled with silver grains denoting Cx43-immunoreactivity (Figure 8), particularly in
more dorsal portions of the third ventricular wall where both tanycytes and ependymal
cells are found (Figure 8A). Cx43-immunoreactivity was also present in the cytoplasmic
membrane of tanycyte end feet processes, terminating on capillaries both in the ARC
and in the external zone of the ME (Figure 9A). In addition, Cx43 was concentrated in
cytoplasmic membrane of tanycyte end feet processes where the end feet processes were
juxtaposed to another tanycyte process or to axon varicosities (Figure 9B).
DOI:10.14753/SE.2019.2208

55
Figure 7: Ultrastructural localization of Connexin 43-immunoreactivity on the
contact surface of tanycytes.
Electron microscopic images demonstrate Connexin 43 (Cx43) immunoreactivity in the
cytoplasmic membrane along the lateral surfaces of -tanycytes (A, arrows) and 1-
tanycytes in the lateral evagination of the third ventricle (B, arrows). Inset of B shows
interwoven 1-tanycytes in higher magnification. Cx43-immunoreactivity is associated
with the contacting surfaces of -tanycyte cell bodies (C) and processes (D). The
presence of silver grains on both contacting surfaces raises the possibility of the
existence of functional gap junctions (arrowheads in C and D). Insets of C and D
demonstrate contacting surfaces of tanycyte cell bodies and processes in higher
magnification.
Scale bars: 500 nm and 200 nm on the insets. Abbreviations: 3v – third ventricle; nu –
nucleus of a tanycyte; p – basal process of a tanycyte.
DOI:10.14753/SE.2019.2208

56
Figure 8: Ultrastructural localization of Connexin 43 (Cx43) -immunoreactivity on
the ventricular surface of tanycytes.
Electron microscopic images illustrate -tanycytes in the wall of the ventral and dorsal
parts of the third ventricle. In the dorsal part of the ventricle (A), ciliated ependymal
cells (marked by e) alternate with tanycytes (marked by t). The latter cell type is
identified by the presence of lipid droplets (marked by ld) in their cytoplasm. The cilia
of the ependymal cells are marked by (c). Cx43-immunoreactivity is labeled by silver
grains. The inset shows higher magnification of Cx43-immunoreactivity in the
cytoplasmic membrane of the ventricular surface of tanycytes and in the cytoplasmic
membrane of their protrusions (arrows). In the ventral part of the ventricle (B, C),
protrusions of the tanycytes show dense Cx43-immunoreactivity (arrows).
Scale bars: 500 nm and 100 nm on the inset. Abbreviations: 3V – third ventricle; c –
cilia; e – ependymal cell; ld – lipid droplet; t – tanycyte.
DOI:10.14753/SE.2019.2208

57
Figure 9: Ultrastructural localization of Connexin 43 (Cx43) -immunoreactivity on
tanycyte end feet processes in the external zone of the median eminence.
Electron micrographs illustrate the localization of Cx43-immunoreactivity (silver
grains, arrows) in the cytoplasmic membrane of a tanycyte end foot contacting a portal
capillary (A). Cx43-immunoreactivity (arrows) is also present in the cytoplasmic
membrane of the tanycyte end foot (marked by t) contacting a hypophysiotropic axon
terminals (marked by at) in the external zone of the ME in the proximity of a fenestrated
capillary (B).
Abbreviations: at – axon terminal, fc – fenestrated capillary, ME – median eminence;
t – tanycyte end foot. Scale bars: 500 nm.
DOI:10.14753/SE.2019.2208

58
4.2. Characterization of the POMC expression in tanycytes
4.2.1. Pomc mRNA expression in non-neuronal cells
By radioactive and fluorescent ISH on serial coronal sections of rats covering the entire
rostrocaudal extent of the tanycyte region and ARC, a large variability between brains
was observed as to the extent and abundance of Pomc expression in tanycytes and
similar non-neuronal cells of the ME and pituitary stalk. Therefore, we categorized the
brains according to the POMC mRNA content of tanycytes: low-, intermediate- or high-
level of non-neuronal Pomc mRNA (Figure 10, Figure 11).
In brains with low-level of non-neuronal Pomc mRNA, the Pomc signal was largely
confined to a population of cells in the pituitary stalk and a caudal subset of β- and the
most ventral α-tanycytes, located between Bregma levels -3.1 and -3.8 mm.
Hybridization signal was also present in several non-neuronal cells in the caudal ME
(Figure 11A, B). Rostral to Bregma level -3.1 mm, only few β tanycytes and non-
neuronal ME cells contained hybridization signal (Figure 10A, B). In these brains, the
hybridization signal in tanycytes was generally much lower than in POMC neurons. In
brains with high-level of non-neuronal Pomc mRNA, the hybridization signal extended
rostro-caudally to virtually the entire β-tanycyte population (between Bregma -1.7 to -
4.0 mm), dorsally to a large portion of α2-tanycytes, and to more non-neuronal cells in
the ME and pituitary stalk (Figure 10D, E, Figure 11D, E). Pomc mRNA was never
observed, however, in the most dorsal tanycyte population, the α1-subtype. In these
“high-level” brains, the intensity of tanycyte hybridization signal approximated that of
POMC neurons. In brains with “intermediate-level” of non-neuronal Pomc mRNA, the
general pattern was similar to “high-level” brains, but the intensity of tanycyte
hybridization signal remained well below that of POMC neurons, particularly in the
rostral half of the tanycyte region (Figure 10C, Figure 11C).
DOI:10.14753/SE.2019.2208

59
Figure 10: Radioactive in situ hybridization of POMC mRNA in the rostral part of
the tanycyte region of 5 adult rats.
Radioactive ISH demonstrates different expression levels of Pomc mRNA in the rostral
part of the tanycyte region in 5 adult rats with different expression levels in tanycytes of
the third ventricle and non-neuronal cells of the ME. A and B show low, C shows
intermediate, while D and E show high Pomc mRNA expression in tanycytes. A, B and
D are male, C and E are female rats, between 8-10 weeks of age. Images from the
caudal part of the tanycyte region from the same brains are presented in Figure 11.
Abbreviation: ME – median eminence. Scale bar: 200 μm.
DOI:10.14753/SE.2019.2208

60
Figure 11: Radioactive in situ hybridization of POMC mRNA in the caudal part of
the tanycyte region of 5 adult rats.
As a continuation of Figure 10., radioactive ISH demonstrates Pomc mRNA in the
caudal part of the tanycyte region in 5 adult rats with different expression levels in
tanycytes of the third ventricle and non-neuronal cells of the ME and infundibular
(pituitary) stalk. A and B show low, C shows intermediate, while D and E show high
Pomc mRNA expression in tanycytes. A, B and D are male, C and E are female rats,
between 8-10 weeks of age. The infundibular stalk appears at different rostro-caudal
levels due to differences in the plane of sectioning.
Abbreviations: ME – median eminence; 3V – third ventricle; Inf – infundibular stalk.
Scale bar: 200μm.
DOI:10.14753/SE.2019.2208

61
This variability was observed in both adult males and females, with similar age and
body weight, which were euthanized together within 2 h of the mid-day period. Among
the total 26 rat brains we analyzed with ISH, 10 brains had low, 5 intermediate and 11
high Pomc mRNA levels in tanycytes. Importantly, variability was observed in both
young adult rats, between ages 8-10 weeks, and in fully adult, 15 week-old rats (Table
6)
Table 6: Number of rats with low-, intermediate- and high-level Pomc mRNA in
tanycytes in the different experiments.
In each experiment rats were euthanized within 2h of the mid-day period.
Experiment Sex Age Pomc mRNA levels
Low Intermediate High
Adult rats for Pomc ISH M 8 weeks 3 1 0
M 8-9 weeks 4 0 2
F 9-10 weeks 1 2 3
M 9-10 weeks 0 0 4
M 15 weeks 2 2 2
Adolescent rats for Pomc ISH M 31 days 4 0 0
F 31 days 4 0 0
To examine whether variability in non-neuronal Pomc mRNA is present before
adulthood, ISH was performed in adolescent, 31 day old male (n=4; BW 80-93g) and
female (n=4; BW 67-81g) rats. Hybridization pattern in all of the 8 young rats was
highly similar to that observed in “low-level” adult rats (Table 6). Moderate signal was
present in the pituitary stalk, as well as in a portion of β1-, β2-, α2- and in tanycytes in
mid and caudal levels of the third ventricle and ME. Signal in the rostral half of the
tanycyte region was occasional and very light (Figure 12). Neuronal Pomc
hybridization signal was also less intense than in adults.
DOI:10.14753/SE.2019.2208

62
Figure 12: Radioactive ISH demonstrates Pomc mRNA distribution in a 31 day-old,
adolescent male rat.
Sections are arranged in rostro-caudal order (A1: most rostral; A8: most caudal), with
∼200 μm distance between consecutive sections. Fluorescent cresyl-violet staining
(Redecker) is overlaid to help identify the location of the third ventricle, ME and
infundibular stalk. Arrows point to non-neuronal signal in α2-, β1-, β2- and tanycytes in
the mid and caudal levels of the ME.
Abbreviations: 3V- third ventricle; ME – median eminence; Inf – infundibular stalk.
Scale bar: 200μm.
4.2.2. Non-neuronal Pomc mRNA-expressing cells are vimentin-positive
tanycytes
To ascertain the identity of non-neuronal cells that express Pomc mRNA and to
unambiguously distinguish them from POMC neurons, we combined fluorescent ISH
with immunofluorescence for the tanycyte/ependymal marker, vimentin, and the
neuronal marker, HuC/D. In general, non-neuronal Pomc mRNA-expressing cells could
be easily distinguished from neurons based solely on different morphology and
appearance of the hybridization signal (Figure 13A, B). In some cases, however, smaller
POMC neurons with less intense signal could be unambiguously identified only by their
HuC/D content (data not shown). While few POMC neurons were regularly found in the
ME and pituitary stalk, occasionally even within the β-tanycyte layer, we did not
observe Pomc mRNA-expressing cells that contained both vimentin and HuC/D (data
not shown). Pomc mRNA-expressing cells in the ventricular wall, corresponding to the
location of β1-, β2- and α2-tanycytes always contained vimentin (Figure 13D, E). The
vast majority of non-neuronal Pomc mRNA-expressing cells that are located below the
β-tanycyte layer throughout the external zone of the ME also contained vimentin
(Figure 13C, D).
DOI:10.14753/SE.2019.2208

63
Figure 13: Pomc mRNA expression in tanycytes demonstrated by fluorescent in situ
hybridization and fluorescent in situ hybridization combined with
immunofluorescence.
A1-3 show low-level, while B1-3 show high-level of Pomc mRNA expression in
tanycytes, demonstrated by fluorescent ISH. A1-3 is the same brain as in Figure 10A
and Figure 11A and B1-3 is the same brain as in Figure 10D and Figure 11D.
Abbreviations: 3v - third ventricle; Inf, infundibular stalk; ME, median eminence. Scale
bar: 100μm.
C-F represent confocal images of boxed areas from A2, A3 and B3 show combined
Pomc ISH (green) and vimentin immunofluorescence (Redecker). Virtually all non-
neuronal Pomc mRNA-expressing cells contain the tanycyte marker vimentin (arrows).
Blue arrowhead on C1 points to a Pomc neuron in the ME. HuC/D immunofluorescence
(not shown) allowed unambiguous identification of Pomc neurons. C, D and E are
projections of multiple confocal planes; F shows a single confocal plane. Scale bar:
25μm.
DOI:10.14753/SE.2019.2208

64
These cells were apparently tanycyte-type cells often with an elongated shape
perpendicular to the ventricular floor, or with a small, round-shaped cell body with
multiple processes. Pomc mRNA-expressing cells in the pituitary stalk had round or
elongated shape with apparent processes and virtually always contained vimentin
(Figure 13A, B, F). Many of these cells were non-ependymal tanycyte-type cells, while
others in the rostral part of the stalk were β-tanycytes bordering the third ventricular
recess. To easily identify and distinguish these cells from the other tanycyte subtypes,
we decided to integrate them into the tanycyte nomenclature and refer to them as
gamma- (γ) tanycytes.
4.2.3. Variable POMC protein expression in tanycytes of adult rats
Immunofluorescence using an antibody against the N-terminal portion of POMC
yielded the same pattern of cellular expression and variability as Pomc ISH
experiments. In “low-level” brains, POMC was present in tanycytes of the pituitary
stalk and a subset of β- and γ-tanycytes between Bregma levels -3.1 and -3.8 mm.
Rostral to this level, POMC was present in some β-tanycyte processes and γ-tanycytes
in the ME, the number of which varied among “low-level” brains (Figure 14).
In “high-level” brains, POMC was present in the vast majority of β- and α2-tanycytes,
and a large number of γ-tanycytes, essentially mirroring Pomc mRNA distribution in
“high-level” brains (Figure 15).
Of 8 adult male brains, 3 had low, 2 intermediate and 3 high POMC levels in tanycytes;
of 7 female brains, 5 had low, 1 intermediate and 1 high POMC levels (Table 7:).
DOI:10.14753/SE.2019.2208

65
Figure 14: POMC immunofluorescence from an adult male rat with low POMC
levels in tanycytes.
POMC is expressed in a small subset of β2- and β1-tanycytes in the wall of the third
ventricle, as well as in γ-tanycytes in the ME and infundibular stalk (A). B1 and B2
show boxed areas in A3 and A4 in higher magnification and show POMC-expressing
β2-tanycytes and γ-tanycytes in the ME. B3 shows boxed area from A4 in higher
magnification and shows the lack of POMC in α2-tanycytes.
Abbreviations: 3V – third ventricle, Inf – infundibular stalk, ME – median eminence.
Scale bar: 100 μm on A and 25μm on B.
DOI:10.14753/SE.2019.2208
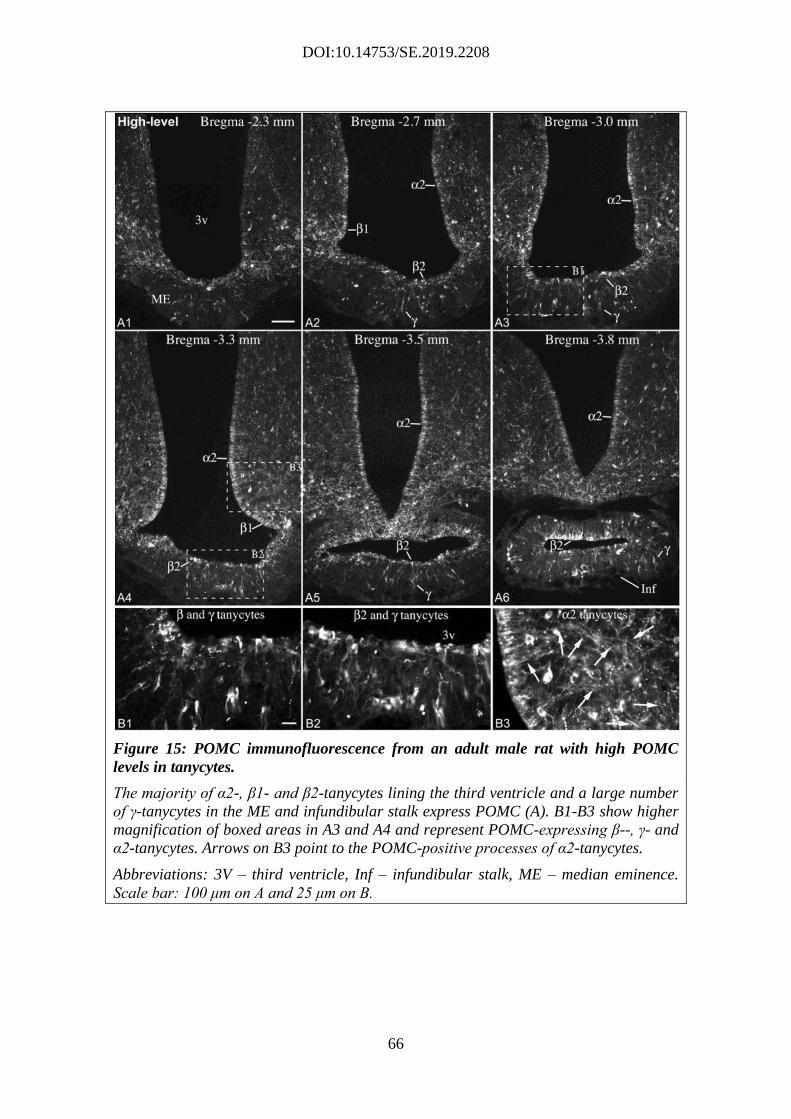
66
Figure 15: POMC immunofluorescence from an adult male rat with high POMC
levels in tanycytes.
The majority of α2-, β1- and β2-tanycytes lining the third ventricle and a large number
of γ-tanycytes in the ME and infundibular stalk express POMC (A). B1-B3 show higher
magnification of boxed areas in A3 and A4 and represent POMC-expressing β--, γ- and
α2-tanycytes. Arrows on B3 point to the POMC-positive processes of α2-tanycytes.
Abbreviations: 3V – third ventricle, Inf – infundibular stalk, ME – median eminence.
Scale bar: 100 μm on A and 25 μm on B.
DOI:10.14753/SE.2019.2208
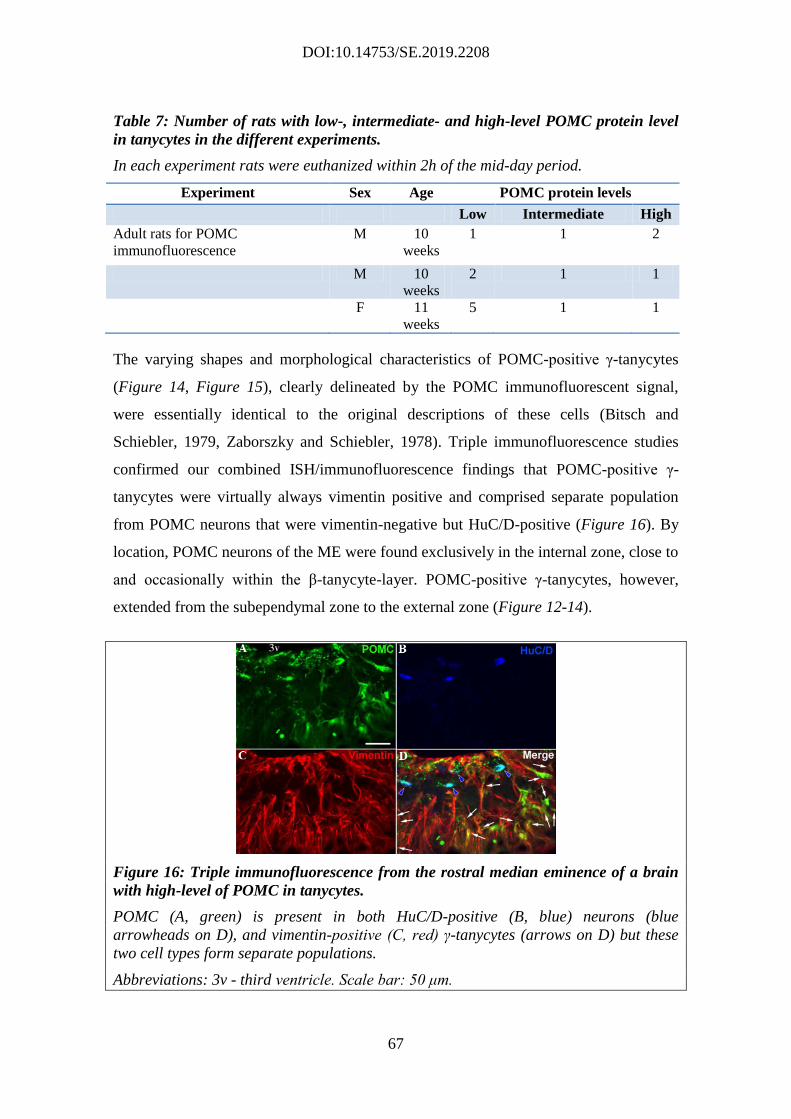
67
Table 7: Number of rats with low-, intermediate- and high-level POMC protein level
in tanycytes in the different experiments.
In each experiment rats were euthanized within 2h of the mid-day period.
Experiment Sex Age POMC protein levels
Low Intermediate High
Adult rats for POMC
immunofluorescence
M 10
weeks
1 1 2
M 10
weeks
2 1 1
F 11
weeks
5 1 1
The varying shapes and morphological characteristics of POMC-positive γ-tanycytes
(Figure 14, Figure 15), clearly delineated by the POMC immunofluorescent signal,
were essentially identical to the original descriptions of these cells (Bitsch and
Schiebler, 1979, Zaborszky and Schiebler, 1978). Triple immunofluorescence studies
confirmed our combined ISH/immunofluorescence findings that POMC-positive γ-
tanycytes were virtually always vimentin positive and comprised separate population
from POMC neurons that were vimentin-negative but HuC/D-positive (Figure 16). By
location, POMC neurons of the ME were found exclusively in the internal zone, close to
and occasionally within the β-tanycyte-layer. POMC-positive γ-tanycytes, however,
extended from the subependymal zone to the external zone (Figure 12-14).
Figure 16: Triple immunofluorescence from the rostral median eminence of a brain
with high-level of POMC in tanycytes.
POMC (A, green) is present in both HuC/D-positive (B, blue) neurons (blue
arrowheads on D), and vimentin-positive (C, red) γ-tanycytes (arrows on D) but these
two cell types form separate populations.
Abbreviations: 3v - third ventricle. Scale bar: 50 μm.
DOI:10.14753/SE.2019.2208

68
4.2.4. Ultrastructural examination of POMC-immunoreactive cells in the
ME
By electron microscopic examination of the ME, POMC-immunoreactivity was
detected in cell bodies and processes of β-tanycytes as well as in γ-tanycytes (Figure
17). γ-tanycytes in the ME had ultrastructural characteristics similar to β-tanycytes,
including numerous elongated mitochondria in their processes, and several large lipid
drops (Akmayev and Fidelina, 1976, Brawer, 1972, Rodriguez et al., 2005, Zaborszky
and Schiebler, 1978). Their processes often terminated on capillaries.
Figure 17: Immuno-electron microscopic detection of POMC in tanycytes.
The ultrastructure of a POMC-immunoreactive γ-tanycyte in the external zone of the
ME (boxed area of A) is shown in B. POMC-immunoreaction is labeled by silver grains.
Note the high concentration of mitochondria in the highly immunolabeled short process
of the γ-tanycyte. C and D illustrate cell bodies of POMC-immunoreactive β-tanycytes
lining the floor of the third ventricle. On E silver grains denoting POMC-
immunoreactivity are associated with microfilaments in a tanycyte process.
Abbreviations: N - nucleus; a - axon varicosity; Tc - tanycyte process. Scale bar: 2 μm.
DOI:10.14753/SE.2019.2208

69
4.2.5. Detection of POMC-derived peptides in tanycytes
β-endorphin immunofluorescence resulted in highly similar patterns and variability as
the POMC staining, but labeled substantially fewer tanycytes in the same brains (Figure
18). Namely, in “low-level” brains, non-neuronal β-endorphin staining was confined to
some γ-tanycytes in the pituitary stalk and ME, as well as few β-tanycyte cell bodies
and processes (Figure 18A, B). In “high-level” brains, β-endorphin staining labeled
many more β- and γ-tanycytes, as well as α2-tanycytes and their processes (Figure 18C,
D). Immunofluorescence using anti-ACTH serum labeled only occasional γ-tanycytes in
the ME and the pituitary stalk (Figure 19A, B). Their number was independent on
whether the brain had low- or high- POMC level in tanycytes; in some brains there were
1-2 cells in each section, while in others there were no clear ACTH-positive γ-
tanycytes. The signal in γ-tanycytes was always much lighter than in neurons or axons
(Figure 19A, B). In addition, in brains with high POMC levels in tanycytes we noted a
very light ACTH-immunoreactivity primarily in α2-tanycyte cell bodies (Figure 19C,
D).
α-MSH immunoreactivity that was clearly above background level was very rare in
tanycytes. Very light signal was observed occasionally in γ-tanycytes in the ME and
pituitary stalk, and in a few tanycyte-processes in brains with high-level POMC in
tanycytes (Figure 19E, F).
DOI:10.14753/SE.2019.2208

70
Figure 18: β-endorphin-immunofluorescence in brains with low-and high-level
POMC in tanycytes
A1-A3 show a β-endorphin-immunoreactivity in a brain with low-level POMC in
tanycytes (the same brain as in Figure 14). B1-B3 show A1-A3 boxed areas with higher
magnification. Arrows in B1 represents β-endorphin immunoreactive β2- tanycyte and
γ-tanycytes in the ME, B2 represents the lack of signal in α2- and β1-tanycytes, B3
shows numerous immunopositive γ-tanycytes in the pituitary stalk.
C1-C3 show β-endorphin-immunofluorescence in a brain with high-level POMC in
tanycytes (same brain as in Figure 15). Arrow on C2 indicates intensely labeled
tanycyte end feet in the lateral ME. D1-D3 show higher magnification of boxed areas in
C1-C3 with β-endorphin-immunoreactive β2-tanycytes and γ-tanycytes in the ME on D1
α2- and β1-tanycyte cell bodies and processes (arrows on D2) and intensively labeled
β2- and γ-tanycytes of the pituitary stalk on D3.
Abbreviations: 3v - third ventricle; Inf - infundibular stalk; ME - median eminence.
Scale bar: 100 μm on A (for A and C); 50 μm on B (for B, D).
DOI:10.14753/SE.2019.2208
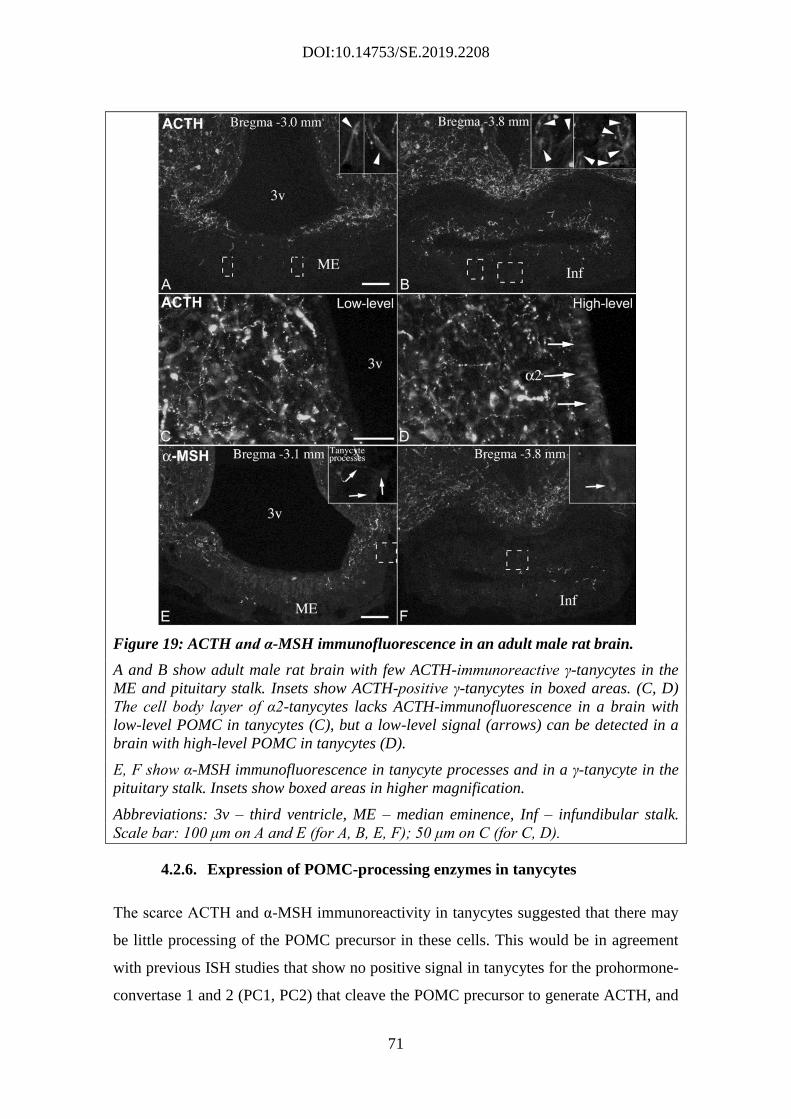
71
Figure 19: ACTH and α-MSH immunofluorescence in an adult male rat brain.
A and B show adult male rat brain with few ACTH-immunoreactive γ-tanycytes in the
ME and pituitary stalk. Insets show ACTH-positive γ-tanycytes in boxed areas. (C, D)
The cell body layer of α2-tanycytes lacks ACTH-immunofluorescence in a brain with
low-level POMC in tanycytes (C), but a low-level signal (arrows) can be detected in a
brain with high-level POMC in tanycytes (D).
E, F show α-MSH immunofluorescence in tanycyte processes and in a γ-tanycyte in the
pituitary stalk. Insets show boxed areas in higher magnification.
Abbreviations: 3v – third ventricle, ME – median eminence, Inf – infundibular stalk.
Scale bar: 100 μm on A and E (for A, B, E, F); 50 μm on C (for C, D).
4.2.6. Expression of POMC-processing enzymes in tanycytes
The scarce ACTH and α-MSH immunoreactivity in tanycytes suggested that there may
be little processing of the POMC precursor in these cells. This would be in agreement
with previous ISH studies that show no positive signal in tanycytes for the prohormone-
convertase 1 and 2 (PC1, PC2) that cleave the POMC precursor to generate ACTH, and
DOI:10.14753/SE.2019.2208

72
further to α-MSH, respectively (Cawley et al., 2016). To further examine whether genes
involved in POMC-processing are expressed in tanycytes, we used RNA-Seq analysis
on the transcriptome of rat tanycytes (α1, α2, β1, β2) that were isolated by LCM.
Expression levels were compared to samples obtained by the same method from the
adjacent ARC. Expression values for PC1, PC2, carboxypeptidase E, peptidylglycine
alpha-amidating monooxygenase and secretogranin V (or 7B2) mRNAs were
significantly lower in tanycyte samples than in the ARC (Table 8), in agreement with
ISH studies that show predominantly neuronal expression patterns for these genes in the
hypothalamus (Cullinan et al., 1991, Schafer et al., 1993). PC2 mRNA had the lowest
value in tanycytes, 7.4 ± 0.4, which was below the cutoff value of 10.0 considered for
positive expression. The second lowest expression, PC1 mRNA with 16.2 ± 0.8, was
only slightly above the cutoff value. Pomc mRNA levels were similar in the tanycyte
sample and the ARC sample (347.2 ± 36.2 in tanycytes vs. 397.2 ± 37.0 in the ARC).
Table 8: Next-Generation sequencing expression values of Pomc and genes involved
in POMC-processing in tanycytes and neighboring ARC.
The samples were collected by laser capture microdissection from 5 male Wistar rats,
statistical comparison was made by Student's t-test.
Tanycytes
Arcuate
nucleus
Description
Mean ± SEM
(normalized
CPM)
Mean ± SEM
(normalized
CPM)
P value
Pomc - proopiomelanocortin 347.2 ± 36.2 397.2 ± 37.0 0.4921
Cpe - carboxypeptidase E 529.8 ± 33.5 1331.6 ± 44.2 < 0.0001
Pcsk1 - proprotein convertase
substilin/kexin type 1 16.2 ± 0.8 51.7 ± 1.5 < 0.0001
Pcsk2 - proprotein convertase
substilin/kexin type 1 7.4 ± 0.4 50.2 ± 4.9 0.0002
Pam - peptydilglicine alpha-amidating
monooxygenase 204.8 ± 9.5 306.1 ± 6.3 0.0002
Scg5 - secretogranin V (7B2 protein) 36.3 ± 9.1 184.0 ± 46.0 < 0.0001
DOI:10.14753/SE.2019.2208

73
4.3. Importance of microglia in the development of HFD induced metabolic
changes
4.3.1. Effect of HFD and microglia ablation on the body composition and
metabolic parameters
After 3 weeks of pretreatment with PLX-containing LF diet to ablate the microglia or
with PLX-free LF chow, half of the animals of each group were switched to a diet with
60% high-fat content, while the other half continued to consume the diet with low-fat
content. This arrangement resulted in four treatment groups: LF, HFD, LF+PLX and
HFD+PLX. At the start of the special diet, there was no significant difference in the
body composition of the animal groups.
During the three days of diet, the change of the lean body mass was influenced by both
the diet (P=0.001) and the PLX treatment (P=0.025), but there was no interaction
between the two factors (P=0.241) by factorial ANOVA. The PLX treatment caused
significant decrease (P=0.02) of the lean body mass of the LF mice (-0.078 ± 0.154 g)
compared to the elevation of the lean body mass of mice on LF without PLX (0.616 ±
0.239). Moreover, significant difference was found between the lean body mass change
of the LF+PLX and HFD+PLX animals (-0.078 ± 0.154 g vs. 0.883 ± 0.134 g; P=0.004).
The change of the total water content and body weight of the mice was influenced only
by the diet (P=0.002 and 0.003 by factorial ANOVA, respectively), however, it was
independent of the PLX treatment (P=0.157 and 0.307 by factorial ANOVA
respectively). The total water content of the HFD+PLX mice had higher increase than
that in the LF+PLX mice vs. (0.821 ± 0.120 vs. -0.109 g ± 0.113 g; P=0.008). Similarly,
the HFD+PLX mice had significantly higher body weight change than the LF+PLX
mice (1.819 ± 0.267 vs.0.436 ± 0.240 g; P=0.03) (Figure 20). HFD had a tendency to
increase the change of the water content and body weight in animals without PLX
treatment, but this change did not reach the level of significance.
DOI:10.14753/SE.2019.2208

74
Figure 20: The changes of the body composition during the short-term LF or HFD
combined with PLX treatment.
The body composition of the mice was measured with EchoMRI after 3 weeks of normal
chow (Kristensen et al.) or normal chow with PLX pretreatment (LF+PLX) and after
switching the half of both groups to HFD for 3 days. The average changes of the body
components of the 4 groups (LF, HFD, LF+PLX, HFD+PLX) were analyzed.
Significant differences were observed between the average change of the lean body
mass of LF and LF+PLX animals and between the changes of lean body mass, total
water and body weight of the LF+PLX and HFD+PLX animals. Data are shown as
Mean ± SEM
*p<0.05; **p<0.01, by one-way ANOVA followed by Newman-Keuls post-hoc test.
The total activity of mice was influenced by both the diet (P=0.00048) and the PLX
treatment (P=0.0004), but there was no interaction between the two factors (P=0.948)
by factorial ANOVA (Figure 21).
During the 3 days of the diet, the mice of the HFD groups had markedly increased
activity compared to the LF groups. The average total activity of the LF vs. HFD mice
was 2405.98 ± 234.68 vs. 3170.24 ± 552.18 beambreaks/h (P=0.013), while the total
DOI:10.14753/SE.2019.2208

75
locomotor activity of the LF+PLX vs. HFD+PLX was 1432.23 ± 244.57 vs. 2246.73 ±
567.09 beambreaks/hour (P=0.01).
The PLX treatment significantly decreased the locomotor activity both in LF+PLX and
HFD+PLX groups compared to groups without PLX. The average total activity of LF
vs. LF+PLX mice was 2405.98 ± 234.68 vs. 1432.23 ± 244.57 beambreaks/hour
(P=0.007), while the average total activity of the HFD vs. HFD+PLX was 3170.24 ±
552.18 vs. 2246.73 ± 567.09 (P=0.009) (Figure 21).
The difference between LF and LF+PLX groups was significant both in the daylight
period and at night, with 1652.92 ± 257.72 vs. 914.79 ± 161.74 (P=0.02) and 3136.05 ±
267.14 vs. 1949.66 ± 347.06 beambreaks/hour, respectively, (P=0.02). However, the
difference between HFD and HFD+PLX was only significant at night (4027.00 ±
435.52 vs. 2668.54 ± 662.20 beambreaks/hour, P=0.009). The HFD significantly
increased the activity of the HFD+PLX mice compared to LF+PLX mice in the daylight
period (P=0.01), while significantly increased the activity of HFD mice compared to LF
mice (P=0.047) at night (Figure 21).
DOI:10.14753/SE.2019.2208

76
Figure 21. The total activity of mice during the short-term LF or HFD combined with
PLX treatment in the X, Y and Z dimensions
The upper part of the figure shows the average total activity pattern per hour. Data are
shown as Mean ± SEM and the purple stripe represents the dark period. On the lower
part, total activity of the mice divided to daylight, night and average components can be
found. Data are shown as Mean+SEM on the bar graphs.
*p<0.05; **p<0.01 by one-way ANOVA followed by Newman-Keuls post-hoc test.
Similar differences between mice on PLX-free and PLX-containing chow groups were
found when the ambulatory and fine activity components of the total locomotor activity
were analyzed. The average ambulatory activity of the mice was influenced by both the
diet (P=0.0004) and the PLX treatment (P=0.011), but there was no interaction between
the two factors (P=0.529) by factorial ANOVA. The average fine activity of mice was
0
1000
2000
3000
4000
5000
6000
7000
8000
9000
10000
12
:00
13
:00
14
:00
15
:00
16
:00
17
:00
18
:00
19
:00
20
:00
21
:00
22
:00
23
:00
0:0
0
1:0
0
2:0
0
3:0
0
4:0
0
5:0
0
6:0
0
7:0
0
8:0
0
9:0
0
10
:00
11
:00
12
:00
Bea
mb
reak
s Total activity (XYZ) per hour
LF HFD LF + PLX HFD + PLX
DOI:10.14753/SE.2019.2208

77
only influenced by the PLX-treatment (P=0.0002), but not by the diet (P=0.427) and
there was no interaction between the two factors (P=0.363) by factorial ANOVA.
During the dark period, the PLX treatment significantly reduced the ambulatory
activities in both LF- and HFD-consuming groups compared to PLX-free groups
(Figure 22, upper part). The ambulatory activity in the case of LF vs. LF+PLX (in
beambreaks/hour) was 1157.71 ± 74.55 vs. 662.54 ± 97.10 (P=0.03) at night, while in
the case of HFD vs. HFD+PLX was (in beambreaks/hour) 679.05 ± 91.17 vs. 403.83 ±
61.42 (P=0.03) in the daylight and 1382.43 ± 126.43 vs. 791.92 ± 123.57 (P=0.008) at
night. The difference between the average ambulatory activity of the HFD and
HFD+PLX mice was also significant (P=0.02) and the diet-induced increase of the
average ambulatory activity was also observed when LF vs. HFD (P=0.009) and
LF+PLX and HFD+PLX (P=0.08) were analyzed.
The fine activity was similarly reduced by PLX-treatment (Figure 22, lower part).
During the daylight the HFD-PLX mice moved less compared to HFD mice (HFD vs.
HFD+PLX (in beambreaks/hour) 245.50 ± 34.25 vs. 148.68 ± 22.06; P=0.02). During
night, both PLX-treated groups moved less compared to the corresponding PLX-free
group: (LF vs. LF+PLX in beambreaks/hour 411.82 ± 22.12 vs.289.46 ± 42.81 (P=0.03)
and HFD vs. HFD+PLX in beambreaks/hour 434.16 ± 57.79 vs. 272.06 ± 38.90
(P=0.03). The average difference between the fine activity of HFD and HFD+PLX mice
was also significant (P=0.004).
DOI:10.14753/SE.2019.2208

78
Figure 22: The ambulatory and fine activity of the mice during the short-term LF or
HFD combined with PLX treatment.
The upper part of the figure shows the ambulatory activity of the mice divided to
daylight, night and average components. Ambulatory activity represents all movement
with greater locomotions. On the lower part, fine activity of the mice divided to
daylight, night and average components can be found. Fine activity represents the small
movements without greater amount of locomotion, including grooming or movements
while standing still. Data are shown as Mean + SEM.
*p<0.05; **p<0.01 by one-way ANOVA followed by Newman-Keuls post-hoc test.
DOI:10.14753/SE.2019.2208

79
The food intake of the HFD group had a tendency to increase during the first day
compared to LF group (P=0.06), however, this difference did not reach the level of
significance and seemed to disappear in later time points. The cumulative food intake of
HFD treated mice was above the consumption of the LF mice independently of the
presence or absence of microglia until the second day of the experiment however, at the
end of the experiment, the cumulative food intake of all four groups was similar (Figure
23).
Figure 23: The cumulative food intake of the mice in grams during the short-term LF
or HFD combined with PLX treatment.
The figure shows the cumulative food intake of the mice divided to 3 daylight and 3
night components. Data are shown as Mean + SEM. No significant difference, only a
tendency was observed by the analysis of the consumed food in g.
P=0.06 by one-way ANOVA followed by Newman-Keuls post-hoc test.
As the energy content of the LF chow was 3.85 Kcal/g and the HFD chow was 5.24
Kcal/g, the HFD groups consumed significantly more calories compared to the calorie
consumption of LF groups (P=0.0000 by factorial ANOVA). This was not influenced
by the PLX treatment (P=0.637) and there was no interaction between the two factors
(P=0.567) by factorial ANOVA). (Figure 24, upper part). The cumulative food intake in
Kcal of the HFD animals were significantly higher compared to LF animals (LF vs.
HFD p<0.01 and LF+PLX vs. HFD+PLX p<0.05) (Figure 24, lower part).
DOI:10.14753/SE.2019.2208

80
Figure 24: Calorie intake of mice during the short-term LF or HFD combined with
PLX treatment
The upper part of the figure shows the cumulative food intake pattern in Kcal. Data are
shown in 9 minutes intervals and the purple stripes represent the dark periods. On the
lower part, the cumulative energy intake of the mice divided to 3 daylight and 3 night
phases can be found. Data are shown as Mean ± SEM on the bar graphs.
*p<0.05; **p<0.01 ***p<0.001 by one-way ANOVA followed by Newman-Keuls post-
hoc test.
0
5
10
15
20
25
30
35
40
45
10
:57
13
:12
15
:27
17
:42
19
:57
22
:12
0:2
7
2:4
2
4:5
7
7:1
2
9:2
7
11
:42
13
:57
16
:12
18
:27
20
:42
22
:57
1:1
2
3:2
7
5:4
2
7:5
7
10
:12
12
:27
14
:42
16
:57
19
:12
21
:27
23
:42
1:5
7
4:1
2
6:2
7
Cu
mu
lati
ve
ener
gy
in
tak
e (K
cal)
Cumulative energy intake pattern of the mice
LF
HFD
LF + PLX
HFD + PLX
DOI:10.14753/SE.2019.2208

81
The energy expenditure of the mice was normalized to the lean body mass of each
animal (Figure 25, upper part). The average total energy expenditure of mice was
influenced by the diet (P=0.0003), but not by the PLX treatment (P=0.162) and no
interaction between the two factors was observed (P=0.917). There was no difference
among the nighttime energy expenditure of the groups (P=0.066 and P=0.073). The
daytime and the whole day energy expenditure were, however, significantly influenced
by the diet. During daytime, the HFD significantly increased the energy expenditure
(P=0.0002) that was not influenced by the PLX-treatment (P=0.162) with no interaction
between the two factors (P=0.647) by factorial ANOVA. Similar differences were
observed in the whole day energy expenditure data. The average energy expenditure of
LF vs. HFD mice was 23.15 ± 1.51 vs. 25.15 ± 0.37 Kcal/kg lean body mass/hour
(P=0.02), while of LF+PLX vs. HFD+PLX animals were 22.34 ± 0.63 vs. 24.25 ± 0.33
Kcal/kg lean body mass/hour (P=0.03) (Figure 25, lower part).
As resting energy metabolism cannot be measured, it was estimated from the energy
expenditure of the time points when the animal eats less than 0.1 g and moves less than
1% of the maximum ambulatory value in the preceding 30 minutes. Similarly to energy
expenditure data, the calculated values were normalized to the lean body mass of the
mice.
The HFD had significant effect on the resting energy expenditure (P=0.0000), while
PLX treatment did not influence it (P=0.903). The two factor had no interaction
(P=0.934) by factorial ANOVA. (Figure 26, upper part). The high-fat content of the
diet caused significant increase in the resting metabolism in both PLX and PLX-free
mice during the daylight, at night and in their average values (Figure 26, lower part).
The average resting metabolism of LF vs. HFD mice was 19.56 ± 1.07 vs. 22.08 ± 0.51
Kcal/kg lean body mass/hour (P=0.0001) and the resting metabolism of LF+PLX vs.
HFD+PLX mice was 19.46 ± 0.65 vs. 22.30 ± 0.43 Kcal/kg lean body mass/hour
(P=0.0001).
DOI:10.14753/SE.2019.2208

82
Figure 25: The energy expenditure of the mice normalized to lean body mass during
the short-term LF or HFD combined with PLX treatment
The upper part of the figure shows the average energy expenditure pattern per hour
normalized to lean body mass. Data are shown as Mean ± SEM and the purple stripe
represents the dark period. On the lower part, energy expenditure of mice, normalized
to their lean body mass divided to daylight, night and average components can be
found. Data are shown as Mean+SEM on the bar graphs.
*p<0.05; **p<0.01 ***p<0,001 by one-way ANOVA followed by Newman-Keuls post-
hoc test.
14
19
24
29
34
12
:00
13
:00
14
:00
15
:00
16
:00
17
:00
18
:00
19
:00
20
:00
21
:00
22
:00
23
:00
0:0
0
1:0
0
2:0
0
3:0
0
4:0
0
5:0
0
6:0
0
7:0
0
8:0
0
9:0
0
10
:00
11
:00
12
:00
En
erg
y e
xp
end
itu
re (
Kca
l)
Energy expenditure normalized to lean body mass (Kcal/kg
lean body mass/hr)
LF
HFD
LF + PLX
HFD + PLX
DOI:10.14753/SE.2019.2208

83
Figure 26: The estimated resting metabolism of the mice normalized to lean body
mass during the short-term LF or HFD combined with PLX treatment
The upper part of the figure shows the average estimated resting metabolism pattern
per hour. Data are shown as Mean ± SEM and the purple stripe represents the dark
period. On the lower part, estimated resting metabolism of the mice divided to daylight,
night and average components can be found. Data are shown as Mean+SEM.
***p<0.001 by one-way ANOVA followed by Newman-Keuls post-hoc test.
10
12
14
16
18
20
22
24
26
28
30 12:0
0
13:0
0
14:0
0
15:0
0
16:0
0
17:0
0
18:0
0
19:0
0
20:0
0
21:0
0
22:0
0
23:0
0
0:0
0
1:0
0
2:0
0
3:0
0
4:0
0
5:0
0
6:0
0
7:0
0
8:0
0
9:0
0
10:0
0
11:0
0
12:0
0
Estimated resting metabolism (Kcal/kg Lean /hr)
LF
HFD
LF + PLX
HFD + PLX
DOI:10.14753/SE.2019.2208

84
The respiratory exchange ratio (RER) is a ratio calculated from volume of the produced
CO2 and the consumed O2, which gives further information about the substrate
utilization of the animals. The diet has significant effect on the RER of the animals,
however, the PLX treatment had not (P=0.0000 and P=0.872, respectively) and there
was no interaction between the two factors (P=0.410) by factorial ANOVA (Figure 27,
upper part).
The RER of the HFD-consuming mice was significantly higher compared to LF-
consuming groups during the 3 days of the experiment. The greatest differences were
observed during the nighttime periods, when the RER of LF vs. HFD mice was 0.99 ±
0.02 vs. 0.79 ± 0.02 (P=0.0001), while the RER of LF+PLX vs. HFD+PLX mice was
0.99 ± 0.02 vs. 0.81 ± 0.01 (P=0.0001). This significance was present in the average
values as well, when both night and daylight data was taken into consideration. The
average RER of LF vs. HFD mice was 0.93 ± 0.01 vs. 0.77 ± 0.01 and the average RER
of LF+PLX vs. HFD+PLX mice was 0.92 ± 0.01 vs. 0.79 ± 0.01(Figure 27, lower part).
As the HFD groups’ fat consumption was far above the LF groups’, not surprisingly
their fatty acid oxidation was significantly higher, as well (P=0.00001), however, the
PLX-treatment did not affect the fatty acid oxidation of the mice (P=0.353) during the
experiment and there was no interaction between the two factors (P=0.167) by factorial
ANOVA (Figure 28, upper part). The average fatty acid oxidation of the HFD animals
was almost four times higher, than in the LF animals: in the LF vs. HFD mice 0.07 ±
0.01 vs. 0.33 ± 0.01 Kcal/hour and in the LF+PLX vs. HFD+PLX mice 0.08 ± 0.01 vs.
0.29 ± 0.01 Kcal/hour (Figure 28. lower part).
DOI:10.14753/SE.2019.2208

85
Figure 27: The respiratory exchange ratio of the mice during the short-term LF or
HFD combined with PLX treatment
The upper part of the figure shows the average respiratory exchange ratio (RER)
pattern of the mice per hour. Data are shown as Mean ± SEM and the purple stripe
represents the dark period. On the lower part, RER of the mice, normalized to their lean
body mass divided to daylight, night and average components can be found. Data are
shown as Mean+SEM on the bar graphs.
***p<0,001 by one-way ANOVA followed by Newman-Keuls post-hoc test.
0.6
0.7
0.8
0.9
1
1.1
1.2
12
:00
13
:00
14
:00
15
:00
16
:00
17
:00
18
:00
19
:00
20
:00
21
:00
22
:00
23
:00
0:0
0
1:0
0
2:0
0
3:0
0
4:0
0
5:0
0
6:0
0
7:0
0
8:0
0
9:0
0
10
:00
11
:00
12
:00
Respiratory exchange ratio (VCO2/VO2)
LF
HFD
LF + PLX
HFD + PLX
DOI:10.14753/SE.2019.2208
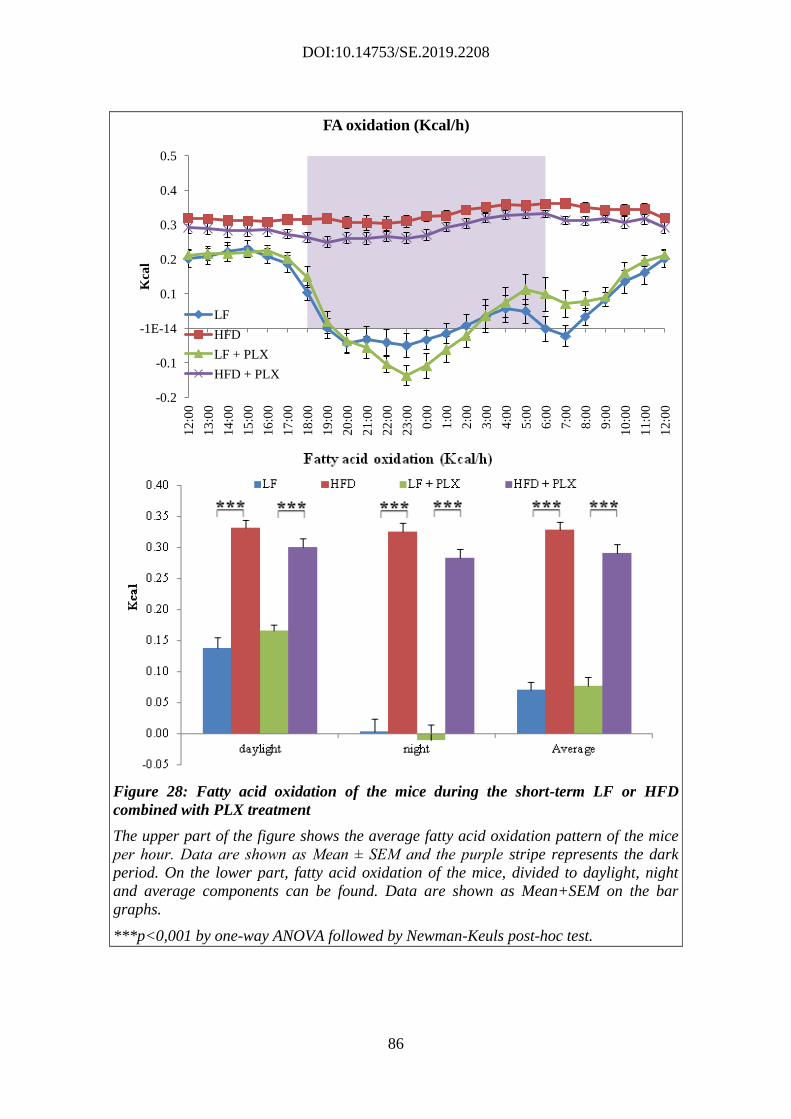
86
Figure 28: Fatty acid oxidation of the mice during the short-term LF or HFD
combined with PLX treatment
The upper part of the figure shows the average fatty acid oxidation pattern of the mice
per hour. Data are shown as Mean ± SEM and the purple stripe represents the dark
period. On the lower part, fatty acid oxidation of the mice, divided to daylight, night
and average components can be found. Data are shown as Mean+SEM on the bar
graphs.
***p<0,001 by one-way ANOVA followed by Newman-Keuls post-hoc test.
-0.2
-0.1
-1E-14
0.1
0.2
0.3
0.4
0.5
12
:00
13
:00
14
:00
15
:00
16
:00
17
:00
18
:00
19
:00
20
:00
21
:00
22
:00
23
:00
0:0
0
1:0
0
2:0
0
3:0
0
4:0
0
5:0
0
6:0
0
7:0
0
8:0
0
9:0
0
10
:00
11
:00
12
:00
Kca
l
FA oxidation (Kcal/h)
LF
HFD
LF + PLX
HFD + PLX
DOI:10.14753/SE.2019.2208

87
4.3.2. Verification of the microglia-ablation by Iba1 immunocytochemistry
and PCR
After only 1 week after the start of the PLX treatment, the 95-100% of the microglia
was ablated in the PLX-treated sentinel mice, according to Iba1 immunolabeling,
proving the effectiveness of the ablation (Figure: 29).
Figure: 29: The effectiveness of the microglia ablation by the Iba1 immunoreactivity
in the ARC of the PLX-free and PLX-treated sentinel mice
The 1 week of PLX-treatment resulted in almost 95% loss of microglia (B) compared to
intact mice (A).
Scale bar: 200 µm. Abrreviations: ARC – arcuate nucleus, Iba1- ionized calcium-
binding adapter molecule 1
Similarly to those observed in the sentinel animals, the microglia ablation of the PLX
pretreated mice was effective, independently from the fat content of the later consumed
food. However, in the case of mice on diet without PLX, where the microglia were not
affected by ablation, difference between the Iba1 immunoreactivity of the low fat and
high fat diet fed mice were experienced.
DOI:10.14753/SE.2019.2208

88
PLX treatment markedly decreased the expression of microglial marker Emr1 and Iba1
in the ARC independently of the fat content of the diet. The Emr1 expression level of
the PLX-treated animals decreased to approximately 20% of the LF group (0.209 ±
0.04; P=0.0001 and 0.223 ± 0.08; P=0.0003; in the LF+PLX and HFD+PLX mice,
respectively), while Iba1 expression fell to 10% of the LF group (0.114 ± 0.01;
P=0.0001 and 0.152 ± 0.06; P=0.0002, in the LF+PLX and HFD+PLX mice,
respectively) (Figure 30).
Figure 30: The relative expression of Emr1 and Iba1 in the ARC of the mice after the
short-term LF or HFD combined with PLX treatment.
The PLX pretreatment was effective as it significantly decreased the expression of the
macrophage marker Emr1 and microglial marker Iba1 in the ARC of the PLX-treated
mice. The expression of both genes was elevated in the case of HFD; however, this
difference did not reach the level of significance. ***p<0.001 by one-way ANOVA
followed by Newman-Keuls post-hoc test, data are shown as Mean ± SEM.
DOI:10.14753/SE.2019.2208

89
5. Discussion
5.1. The localization of Cx43 gap junctions and hemichannels in tanycytes
Tanycytes integrate features of radial glia (Levitt and Rakic, 1980, Redecker, 1989) and
astrocytes (Berger and Hediger, 2001), although also have distinguishing features. They
have long been recognized to be involved in the formation of the BBB and blood-CSF
barriers around the BBB-free ME (Smith and Shine, 1992). The apical surfaces of β-
tanycytes are tightly bound by zonula occludens and tight junctions to form the barrier
between the extracellular space of the ME and the CSF (Rodriguez et al., 2005) such
that proteins cannot pass this barrier (Peruzzo et al., 2000, Rethelyi, 1984). In contrast,
α-tanycytes lining the wall of the third ventricle are joined together by zonula occludens
without the presence of tight junctions, allowing free transport of materials between the
CSF and the neuropil (Akmayev and Popov, 1977). Besides the principal, barrier-
forming function of tanycytes, studies also emphasize their potential role in the
communication between different cell types and different fluid compartments of the
brain (Peruzzo et al., 2004), allowing them to contribute to the regulation of
neuroendocrine systems such as the thyroid and reproductive axes (Bolborea and Dale,
2013, Fekete et al., 2000b, Prevot, 2002, Tu et al., 1997). Gap junctions and connexin
hemichannels may provide the mechanism for this communication.
5.1.1. The presence of functional gap junctions in tanycytes
In astrocytes, oligodendrocytes and microglia, the main gap junction-forming connexin
subtype is Cx43 (Giaume and Theis, 2010). We have also identified Cx43 in our next-
generation sequencing study as the main gap junction protein in the tanycytes.
Furthermore, studies using cell cultures derived from 1 day old rats have shown the
presence of Cx43 in hypothalamic tanycytes using Ethidium uptake, and that Cx43 is
involved in their glucose sensing ability (Orellana et al., 2012).
To further characterize Cx43 in tanycytes, we performed a series of morphological
studies using immunofluorescent and immune-electron microscopic techniques. As a
first step, we demonstrated the existence of functional gap junctions among tanycytes in
adult mice, taking advantage of the fluorescent dye, LY that can be loaded into a single
DOI:10.14753/SE.2019.2208

90
tanycyte via a patch pipette. As gap junctions are permeable in a size-dependent manner
up to a 1 kDa (Saez et al., 2003), and the molecular weight of LY is 457 Da, the dye
readily passes through gap junctions (Stewart, 1981). LY loaded into a single tanycyte
always spread into a larger group of tanycytes. However, when tanycytes were loaded
with LY in the presence of the gap junction inhibitor carbenoxolone, in all cases,
carbenoxolone prevented the spreading of LY among tanycytes, and LY only filled the
patched cell. These data demonstrate that intercellular spreading of LY is indeed
facilitated by gap junctions,
In further support of gap junctions in tanycytes are the immunofluorescent and immune-
electron microscopic studies demonstrating the presence of Cx43 immunoreactivity in
the cytoplasmic membrane of tanycytes, particularly their lateral surfaces where
tanycytes are closely opposed to each other. Interestingly, the density of Cx43-IR
puncta was different among the different tanycyte subtypes, with a much higher density
of Cx43-IR puncta in the cell bodies of α-tanycytes compared to the β-tanycytes. The
basal processes of β-tanycytes were also strongly immunoreactive against Cx43, raising
the possibility that gap junctions may also be located on their juxtaposed end feet
processes, providing an alternative way tanycytes could communicate with each other.
Indeed, in some cases, we observed the retrograde filling of tanycyte basal processes.
Altogether, these data suggest that relatively large groups of tanycytes are
interconnected via gap junctions, indicating that this communication may serve to
coordinate the functioning of these tanycyte networks.
Tanycyte interconnections via gap junctions may enable the intercellular trafficking of a
wide range of small molecules including ions, amino acids and metabolites. As glial
cells contacted by gap junctions have been shown to have similar intracellular Na+
concentrations (Rose and Ransom, 1997), it is possible that coupled tanycytes may also
have a similar intracellular composition, hence forming groups that operate as a single
unit. For example, the synchronized activity of tanycyte groups may contribute to the
pulsatile release of the hypophysiotropic hormones into the portal circulation (Fekete
and Lechan, 2014). This hypothesis is based on the observation that there is a close
anatomical and physiological interaction between hypophysiotropic thyrotropin
releasing hormone (TRH) axon terminals in the ME and tanycyte end foot processes
(Lechan and Fekete, 2007, Rodriguez et al., 2005). Furthermore, since the unimpeded
DOI:10.14753/SE.2019.2208

91
transcellular transport of glucose and lactate via gap junctions in astrocyte networks
ensures an energy source for neurons (Blomstrand and Giaume, 2006, Rouach et al.,
2008) and the release of hormones from hypophysiotropic terminals is an energy
dependent process, tanycyte networks may also be important to provide uniform energy
supply to the large number of hypophysiotropic terminals in the external zone of the
ME. In addition, it is possible that tanycytes are involved in spatial buffering of
potassium ions in the region, similar to those has been described for astrocytes (Rose
and Ransom, 1996). Activation of hypophysiotropic axon terminals would be expected
to result in outward K+
current, increasing the extracellular potassium concentration.
Due to the interconnections among tanycytes, a large reservoir is created by the tanycyte
“syncytium” providing an effective mechanism by which a single tanycyte can remove
K+ from the extracellular space around an activated axon. This may ensure that
potassium can be rapidly removed from the extracellular space without causing
significant changes in the intracellular potassium concentration of tanycytes located
close to the neuronal activity.
5.1.2. The presence of Cx43 hemichannels in tanycytes
Cx43-immunoreactivity was also observed in the external membrane of the ventricular
surface of both - and -tanycytes where gap junctions are not established. The
presence of Cx43 in this location suggests that Cx43 may also form hemichannels,
providing a route for the transport of small molecules between the CSF and the
cytoplasm of tanycytes. Hemichannels may facilitate sensing of the CSF composition.
Since Cx43 hemichannels are glucose permeable, the presence of Cx43 hemichannels
on the ventricular surface of tanycytes may facilitate sensing of CSF glucose levels.
Tanycytes are glucosensitive cells (Rodriguez et al., 2005) , and express KATP channels
(Thomzig et al., 2001) and GLUT2 (Garcia et al., 2003). Glucose increases intracellular
Ca++
concentration in α-tanycytes ex vivo, mediated by ATP via purinergic G-protein
coupled receptor type 1 (P2Y1) (Frayling et al., 2011, Orellana et al., 2012). For this
effect of glucose, the transport of intracellularly generated ATP via Cx43 hemichannels
to the extracellular space where the P2Y1 is located is a critical step (Orellana et al.,
2012).
DOI:10.14753/SE.2019.2208

92
Cx43 immunoreactive puncta were also observed in α-tanycyte end feet where they
terminate on the capillaries of the ARC, and β tanycyte end feet where they terminate
on fenestrated capillaries of the ME. The presence of hemichannels in this area would
enable tanycytes to sense the composition of blood. Furthermore, the presence of Cx43
hemichannels on both the ventricular surface of tanycytes and their end feet processes
may enable a bi-directional communication pathway between the CSF and the
circulation. Presumably, regulation of the opening or closing of the hemichannels on the
tanycyte end feet in the ARC may establish a filter zone in the BBB by allowing or
preventing the passage of molecules from the blood to the neuropil.
Cx43 immunoreactivity was also found where tanycyte end feet processes were
juxtaposed to axon varicosities, indicating that tanycytes might be able to perceive
and/or induce microenvironmental changes of neurons derived from hypothalamic
areas. Astrocytes were shown to exhibit Ca++
waves after glutamate stimuli that
activates PLC-IP3 dependent Ca++
release from intracellular Ca++
stores (Finkbeiner,
1992). Both Ca++
and IP3 can pass through the cells via gap junctions, while astrocytes
also release ATP to the extracellular space, likely through hemichannels, activating
purinergic receptors and evoking additional Ca++
waves. The increasing Ca++
level can
cause glutamate release and this way, astrocytes are able to modulate the excitability of
the circumjacent neurons. Tanycytes might participate in similar way to astrocytes and
secrete ATP, other small molecules and second messengers to their microenvironment,
influencing the secretion of hypophysiotropic neurons.
DOI:10.14753/SE.2019.2208
93
5.2. Characterization of the POMC expression in tanycytes
It has been well known that POMC, rather uniquely among hormones/peptide
transmitters, is expressed by two, very different cell types in the hypothalamic-pituitary
complex: hormone-producing cells of the pituitary and neurons of the ARC. The
findings of this study demonstrate that in rats there is yet a third, POMC-expressing
cell-type in the hypothalamus-pituitary complex, which is the tanycyte. In fact, POMC-
expressing tanycytes in the pituitary stalk effectively bridge the anatomical gap between
pituitary cells and ARC POMC neurons, thus POMC expression from the pituitary to
the hypothalamus is anatomically continuous but distributed in three different cell types.
5.2.1. Tanycyte Pomc ISH signal in previous studies
In preparation for this study we reviewed a wide range of the available literature that
includes Pomc ISH in the rat hypothalamus. The list of these over 200 studies is
reviewed in the Appendix of our study (Wittmann et al., 2017). Of these, 15 papers had
images with very clear Pomc hybridization signal in tanycytes, but this was not
mentioned in the text of most of the papers. The images of these papers collectively
confirm that Pomc mRNA is expressed in tanycytes of different rat strains, both males
and females, and under standard housing conditions. However, in the vast majority of
the papers, Pomc hybridization signal could not be unambiguously identified in
tanycytes. This included cases where tanycytes were clearly negative or the signal was
too light to be considered positive; where background levels were too high, the image
resolution too low, or too little portion of the ventricular wall was included in the image.
It is important to note, however, that in the majority of these papers, the radioactive or
alkaline phosphatase Pomc hybridization signal was light or moderate at best in POMC
neurons. Therefore, tanycytes that generally express less Pomc mRNA than neurons
may appear negative due to the low sensitivity of the detection.
We believe that the varying labeling of tanycytes seen in published papers at least in
part reflects the natural variability of Pomc mRNA levels, which probably contributed
the fact that only few researchers have recognized Pomc mRNA expression by
tanycytes.
DOI:10.14753/SE.2019.2208

94
5.2.2. Diversity of POMC expression by tanycyte-subtypes
The present study reveals an unexpected diversity among tanycytes with respect to their
capacity to express POMC. First, POMC expression was observed in every tanycyte
subtype, except the α1 in which we never observed POMC mRNA or protein. Second,
consistent POMC expression in tanycytes was restricted to a core region that included
the pituitary stalk and the nearby mid-caudal region of the ME and third ventricle. Here
we always observed a substantial population of POMC-expressing tanycytes, mostly
from the β- and γ-subtypes. Outside this region, POMC expression varied among adult
brains from only a few β- and γ-tanycytes to the vast majority of α2- β- and γ-tanycytes.
Therefore, POMC expression in most α2-, β- and γ-tanycytes is conditional and driven
by a yet undetermined factor.
Our results shed new light on a tanycyte-subtype that has received little attention since
its first description. Gamma-tanycytes, described originally as astrocytic tanycytes,
represent the most numerous non-ependymal cell type in the rat ME (Zaborszky and
Schiebler, 1978). As defined by (Rutzel and Schiebler, 1980), these cells belong to the
tanycyte series developmentally, but do not come into contact with the ventricular
surface and morphologically somewhat differ from ventricular tanycytes. Their gene
expression profile, however, is apparently very similar to α- and/or β-tanycytes,
including vimentin, dopamine- and cyclic adenosine-3′:5′-monophosphate- regulated
phosphoprotein (DARPP-32) (Hokfelt et al., 1988), type 2 deiodinase (Tu et al., 1997),
organic anion-transporting polypeptide 1c1 (Wittmann et al., 2015) kainite-preferring
glutamate receptor subunit GluR7 (Eyigor and Jennes, 1998), and POMC, among
others.
5.2.3. Variable POMC levels in tanycytes
To the best of our knowledge, the natural variability of tanycyte POMC mRNA and
protein levels among adult rat brains is a unique phenomenon among most genes
expressed in the hypothalamus. We found that low- and high-level POMC expression in
tanycytes occur with about equal frequency between ages 8 and 15 weeks, ~40% each,
whereas the incidence of intermediate-level expression was lower, ~20%. Interestingly,
Pomc mRNA levels were uniformly low in 8 adolescent rats, suggesting that higher
DOI:10.14753/SE.2019.2208

95
POMC levels in tanycytes may appear only after reaching adulthood. Theoretically, two
possibilities could explain the variation in adult rats. One possibility is that the level of
POMC expression in tanycytes remains constant in a given adult brain, but can
markedly vary from one animal to another. A more intriguing possibility, however, is
that POMC expression in tanycytes is dynamic, with high to low expression levels
occurring periodically in each adult brain. This explanation would imply that Pomc
gene expression in tanycytes is activity dependent, and may be induced by one or more
specific signals that act periodically upon tanycytes. In this regard, it is important to
consider that POMC expression levels in the tanycyte population follow a gradient
pattern. This is especially apparent in intermediate-level brains, where the high mRNA
levels present in the caudal core region decrease gradually in the rostral direction. Based
on this pattern, we can speculate that upon some initiation signal, POMC expression
may “spread” from core region tanycytes to adjacent tanycytes, and ultimately to most
of the tanycyte population. The transmitting signal between tanycytes may be POMC
itself, or it may spread via gap junctions and other cell-cell contacts, which are known
to heavily interconnect tanycytes (Brawer, 1972, Hatton and Ellisman, 1982, Orellana et
al., 2012, Szilvasy-Szabo et al., 2017). Future studies will be necessary to examine these
possibilities. However, we believe that the present results favor the hypothesis of a
spatio-temporally dynamic POMC expression pattern over a constant expression pattern
with marked interindividual differences.
5.2.4. POMC processing in tanycytes
Another interesting feature of tanycyte POMC expression is the very low levels of
ACTH and α-MSH-immunoreactivity that indicates little processing of POMC to these
peptides. This is probably explained by the very low level of PC1 in tanycytes,
according to our RNA-Seq analysis and previous ISH studies (Cullinan et al., 1991,
Schafer et al., 1993). The lack of a substantial amount of ACTH in tanycytes may be of
importance, as its secretion into the portal blood could potentially disrupt the normal
feedback mechanism of cortisol on the hypothalamic-pituitary-adrenocortical axis.
Interestingly, β-endorphin immunoreactivity was substantial in tanycytes, but we did
not detect PC2, which is the primary enzyme that cleaves β-endorphin from POMC
(Cawley et al., 2016). Thus, it is possible that β-endorphin immunoreactivity in
DOI:10.14753/SE.2019.2208

96
tanycytes mostly if not entirely represents the POMC precursor and/or the intermediate
β lipotropin, both of which can be recognized by β-endorphin antibodies (Laurent et al.,
2004, Miller et al., 2003). Alternatively, there may be a PC2-independent mechanism to
produce β-endorphin in tanycytes, the existence of which was suggested by residual β-
endorphin production in the hypothalamus of PC2 knockout mice (Allen et al., 2001).
Future studies are required to determine the full extent of proteolytic POMC processing
in tanycytes.
5.2.5. Potential functional implications
The physiological significance of POMC in rat tanycytes remains to be determined and
at present remains highly speculative. Depending on the potential target cells of
tanycyte-derived POMC, we suggest three potential roles for POMC in tanycytes. One
is regulating the release of hypophysiotropic hormones via acting on hypophysiotropic
axons in the ME. Hypophysiotropic axons in the rat ME contain large amounts of μ
opioid receptors (Abbadie et al., 2000) that bind β-endorphin, and tanycyte-derived β-
endorphin would be the best-positioned ligand to access these receptors. In addition,
radioligand binding studies demonstrated that hypophysiotropic axons in the ME bind
ACTH with high affinity (van Houten et al., 1981, Van Houten et al., 1985). This is
probably due to the presence of MC4R that hypophysiotropic neurons express (Kishi et
al., 2003, Tatro, 1990), although the presence of these receptor proteins on their axons
remains to be determined. Therefore, it is possible that a low amount of ACTH and α-
MSH released from tanycytes may also modulate the activity of hypophysiotropic
axons. A second possible function is that tanycyte-derived POMC, acting in a
paracrine/autocrine manner, may be involved in the proliferative/neurogenic functions
of tanycytes themselves. Recent studies in mice demonstrated that tanycytes have stem
cell properties and are capable of producing new neurons and glial cells during
adulthood (Haan et al., 2013, Lee et al., 2012, Robins et al., 2013a). Studies in rats
suggest a similar neural progenitor function for tanycytes in adulthood (Perez-Martin et
al., 2010, Xu et al., 2005). Interestingly, N-terminal POMC peptides, such as pro-
gamma-MSH, have mitogenic effects on the rat adrenal cortex (Bicknell, 2016), raising
the possibility that N-terminal POMC peptides released from tanycytes may promote
hypothalamic neurogenesis by increasing the proliferation of tanycytes. Lastly, N-
DOI:10.14753/SE.2019.2208
97
terminal POMC peptides secreted by tanycytes into the portal capillaries of the ME may
regulate pituitary functions.
5.3. Importance of microglia in the development of HFD induced metabolic
changes
5.3.1. The metabolic effects of short-term HFD
The effect of chronic consumption of HFD results in significant weight gain,
hypothalamic injury and further consequences like cardiovascular diseases and diabetes
type 2 (Fang et al., 2008, Muoio and Newgard, 2008). In the present study, however, the
effect of short-term, 3 day long HFD was investigated on the body composition and
metabolic parameters when the effect of the food composition can be studied without
the influence of the HFD induced obesity. The cumulative food intake of the HFD mice
was similar to the LF mice; however, due to the different energy content of the chows,
the cumulative energy intake of HFD mice was significantly higher compared to LF
mice during the whole experiment. However, the higher fat consumption did not cause
significant body composition changes of the HFD-consuming mice, suggesting that,
indeed, the short-time HFD cannot cause diet induced obesity. The average locomotor
activity of the HFD mice, primarily its nighttime component exceeded the total activity
of LF mice that might correlate to the higher energy intake of these animals. However,
as the resting energy expenditure was also higher is mice with HFD, it suggests, that
both the increased locomotor activity and the higher resting energy expenditure are
responsible for the higher energy expenditure of the HFD animals. The largest
difference between HFD- and LF-consuming groups was observed in their respiratory
exchange ratio. The RER is the ratio of the produced CO2 and the consumed O2 and
gives information about that type of macronutrient preferentially oxidized by the
animal. If RER is close to 1, it indicates that the main energy source is carbohydrates,
while if the value is close to 0.7, it suggests that lipids are the main utilized substrate.
The RER of HFD animals showed low levels, around 0.7, suggesting, that HFD animals
utilized fat as substrate compared to the higher RER values of LF animals, suggesting
their protein and carbohydrate oxidation. Furthermore, the diurnal/nocturnal
fluctuations of RER observed under physiological conditions seemed to be eliminated
by HFD. These data were strengthened by the fat oxidation data. These data indicate
DOI:10.14753/SE.2019.2208
98
that even the short-time HFD can cause marked changes in the metabolic parameters
that are in agreement with the data published in the literature (Tschop et al., 2011).
5.3.2. The metabolic effects of the absence of microglia
In our experiment, we used PLX5622, a selective CSF1R inhibitor (Elmore et al.,
2014). CSF1R is selectively expressed in microglia and has essential role in the
regulation of survival, proliferation and differentiation of the microglia (Gomez-Nicola
et al., 2013). PLX5622 containing diet was shown to result in an almost complete
disappearance of the microglia specific markers indicating the ablation of this cell type
(Elmore et al., 2014). This treatment has no effect on peripheral macrophages and on
any other studied cell types (Dagher et al., 2015, Elmore et al., 2014). This effect of the
CSF1R inhibition is reversible, thus continuous PLX5622 treatment is necessary to
maintain the absence of microglia (Elmore et al., 2014). Currently, the CSF1R
inhibitors are the most widely used compounds to study the role of microglia (Coniglio
et al., 2012, Dagher et al., 2015).
In our experiment, PLX5622-containing diet already induced microglia depletion after 1
week of treatment and it resulted in an almost complete absence of the microglia at the
end of the experiment as shown by the absence of Iba1-immunoreactivity in the brain.
Despite the remarkable effect of the PLX562 treatment on the number of microglia, it
did not influence the HFD induced changes of metabolic parameters. The treatment
decreased the lean body mass of the LF group without influencing the HFD induced
increase of this parameter. The PLX5622 treatment had also effect on the locomotor
activity. This treatment caused a decrease of the total locomotor activity in both the LF
and HFD groups without preventing the HFD induced increase of this parameter. These
data suggest that the microglia plays role in the regulation of locomotor activity, but the
HFD induced effect is independent from this cell type.
The literature is currently inconsistent regarding the role of microglia in the regulation
of the HFD induced metabolic changes.
Generally, the role of microglia seems to be diverse (Graeber, 2010). Microglia can be
involved in the initiation of local inflammation, thus microglia activation can cause
tissue damage (Dheen et al., 2007). There is, however, a growing amount of evidence,
DOI:10.14753/SE.2019.2208

99
that microglia is a potent regulator and supporter of the normal neuronal functions
(Paolicelli et al., 2011). The neuroprotective role of microglia during demyelinating and
after hypoxic conditions, where neurons are directly affected was also described
(Hanisch and Kettenmann, 2007, Szalay et al., 2016). During the initial phase of the
HFD, the early hypothalamic inflammation was suggested to be independent of the
effect of microglia. It is more likely, that this time microglia have a neuroprotective
role, as the activation of microglia only occurs, when there is detectable inflammation in
the ARC, moreover, the microglial response is persistent even when the local
inflammation is decreased (Thaler et al., 2012b). However, this hypothesis was not
proved by experiments.
Valdearcos et al. (Valdearcos et al., 2017) however, has reported the effects of the
inhibition of microglial function either by pharmacological microglia ablation or by
microglia selective inhibition of the inflammatory NF-κB pathway on the hypothalamic
inflammation and the accompanying changes in the metabolism. According to these
data, after 4 weeks of HFD, the above mentioned PLX-treatment significantly reduces
the body weight of the PLX-treated animals on HFD, compared to control mice.
However, the PLX-treatment has no effect on the body weight of mice on normal chow.
These findings indicate the role of microglia in maintenance of higher caloric intake in
even after longer term HFD. Similar effects were observed when the NF-κB pathway
was selectively silenced in microglia (Valdearcos et al., 2017). It is important to note,
that these measurements were performed a longer period of HFD. Conversely, microglia
activation by microglia specific deletion of the NF-κB regulator tumor necrosis factor
alpha-induced protein 3 (A20) causes diet-independent metabolic dysfunction with
significant increase in the food intake and reduced VCO2 and VO2, further suggesting
the importance of microglia in the metabolic regulation (Valdearcos et al., 2017).
Our data, however, indicate that the metabolic effects of short-term HFD are
independent from the microglia, thus the early microgliosis is rather the consequence
than the cause of these early changes.
DOI:10.14753/SE.2019.2208

100
6. Conclusions
The present Ph.D. work provides an overview how tanycytes and microglial cells are
involved in the regulation of energy homeostasis under physiological conditions and
during short-term HFD.
Our data indicate that tanycytes are interconnected with each other via functional,
Cx43-containing gap junctions, ensuring an effective communication among these cells.
The presence of Cx43 immunoreactivity on the ventricular surface of tanycytes and on
end feet processes terminating on capillaries or axon terminals further suggest that there
could be an active transport of small molecules between tanycytes and different
compartments of extracellular space through Cx43-containing hemichannels. These
findings indicate that tanycytes have far more complicated functions than simply
serving as barrier cells, and support their importance in neuroendocrine regulation by
monitoring the extracellular environment in the ME-ARC region.
The present study also reveals a novel, unique type of POMC expression in tanycytes in
the adult rat hypothalamus and pituitary stalk. Depending on the potential target cells of
tanycyte-derived POMC, we suggest three potential roles for POMC in tanycytes. One
is regulating the release of hypophysiotropic hormones via acting on hypophysiotropic
axons in the ME. A second possible function is that tanycyte-derived POMC, acting in a
paracrine/autocrine manner, may be involved in the proliferative/neurogenic functions
of tanycytes themselves. Lastly, N-terminal POMC peptides secreted by tanycytes into
the portal capillaries of the ME may regulate pituitary functions. However, future
studies will be necessary to investigate the cause of variability, the exact nature of
POMC-processing, the functional significance, and the potential existence of tanycyte
POMC expression in other species.
The effectiveness of microglia ablation via consuming PLX-containing chow was
supported by immunocytochemistry and PCR data, however, the recent work suggest
that the loss of microglia does not influence the majority of the metabolic parameters of
the mice during the short-term HFD. However, even the short time HFD causes marked
metabolic changes in mice, including change of energy expenditure, RER and fat
oxidation and also the elimination of diurnal-nocturnal changes of the metabolic
parameters observed in control animals. As the presence of ARC inflammatory process
DOI:10.14753/SE.2019.2208

101
was not clearly justified, further experiments are needed to evaluate the role of
tanycytes in this process.
DOI:10.14753/SE.2019.2208
102
7. Summary
The perception of the status of energy stores and the quality and quantity of the
consumed food by the central nervous system plays a crucial role in the regulation of
energy homeostasis. This regulation is guided by the communication between the
peripheral organs and the brain. The primary central targets of peripheral, blood-derived
energy homeostasis-related hormones are the orexigenic and anorexigenic cell
populations of the hypothalamic ARC. The mechanisms related to the central regulation
of energy homeostasis are intensively studied; however, the role of glial cell types in
these processes is far less understood.
Thus, the aim of my Ph.D. thesis is to better understand how the special neuroglial cells
of the hypothalamus, tanycytes and the resident macrophages of the brain, the
microglial cells are involved in the regulation of homeostatic processes under
physiological and HFD conditions. To achieve this goal, morphological, functional,
ISH, gene expression and in vivo metabolic experiments were carried out.
According to our data, tanycytes are interconnected via Cx43 gap junctions and the
formed tanycyte syncytium ensures effective communication among these cells.
Furthermore, tanycytes also establish Cx43 hemichannels, by which tanycytes are able
to monitor their extracellular environment that may facilitate the regulation of the
neuroendocrine axes. We also observed non-neuronal expression of the anorexigenic
Pomc gene was in tanycytes. The expression of Pomc gene and the presence of POMC
protein were also detected in non-ependymal tanycyte-types in the external zone of the
ME. We proposed this tanycyte subgroup should be added to the nomenclature of
tanycytes as gamma-tanycytes. The tanycyte-derived POMC might participate in the
modulation of the release of hypophysiotropic hormones, in the regulation of the
pituitary functions and in the autocrine regulation of the proliferative function of
tanycytes. According to our in vivo data, the ablation of the microglia cannot lead to
significant changes of the metabolic parameters during a short-term HFD.
DOI:10.14753/SE.2019.2208

103
8. Összefoglalás
Az energia homeosztázis szabályozásában kritikus szerepet játszik az energiaraktárak
állapotának és a felvett táplálék mennyiségének, minőségének központi idegrendszeri
érzékelése, amit a perifériás szervek és az agy közti kommunikáció biztosít. Az agy
egyik fő energiaháztartással kapcsolatos szenzor területe a hipotalamusz arcuatus magja.
A perifériás, energiaháztartással kapcsolatos hormonok centrális hatásukat elsősorban
az arcuatus mag orexigén és anorexigén idegsejtjeinek közvetítésével fejtik ki. Habár a
centrális energiaháztartást szabályozó neuronhálózatok szerepét igen részletesen
vizsgálják, kevéssé kutatott, hogy az agy glia sejttípusai miként vesznek részt e
folyamatokban.
Doktori értekezésem célja ezért annak morfológiai, funkcionális, in situ hibridizációs,
génexpressziós és in vivo metabolikus vizsgálatokkal történő megértése, hogy a
hipotalamusz speciális glia sejtjei, a taniciták, valamint az agyi makrofágként működő
mikroglia sejtek miként vesznek részt a homeosztatikus folyamatok szabályozásában
fiziológiai és ettől eltérő állapotokban.
Kísérleteink igazolták, hogy a taniciták között Cx43 tartalmú gap junction kapcsolatok
vannak. Az taniciták így funkcionális szincíciumot alkotnak, ami hatékony
kommunikációt biztosít e sejtek között, összehangolva működésüket. A gap junction
kapcsolatok mellett a taniciták felszínén Cx43 hemichannel-ek is találhatók, ami
lehetővé teszi az extracelluláris környezetük állandó monitorozását elősegítve a
neuroendokrin folyamatok szabályozását. További vizsgálatainkkal kimutattuk az
anorexigén Pomc gén expresszióját a tanicitákban, illetve az eminencia mediána külső
zónájában lokalizálódó nem ependimális, tanicita-szerű sejttípusban. Igazoltuk-e sejtek
tanicita jellegét és az nevezéktanához illeszkedően a gamma-tanicita nevet javasoltuk
számukra. A tanicita-eredetű POMC részt vehet a hipofízeotróp hormonok
felszabadulásának modulálásában, a hipofízis funkciójának, valamint új taniciták
proliferációjának szabályozásában. In vivo kísérleteink alapján megállapítottuk, hogy a
mikroglia nem befolyásolja a rövid távú, magas zsírtartalmú diéta metabolikus hatásait.
DOI:10.14753/SE.2019.2208
104
9. References
Abbadie, C., Pan, Y.X., and Pasternak, G.W. (2000) Differential distribution in rat brain
of mu opioid receptor carboxy terminal splice variants MOR-1C-like and MOR-1-
like immunoreactivity: evidence for region-specific processing. J Comp Neurol 419,
244-256.
Abbott, C.R., Rossi, M., Wren, A.M., Murphy, K.G., Kennedy, A.R., Stanley, S.A.,
Zollner, A.N., Morgan, D.G., Morgan, I., Ghatei, M.A., Small, C.J., and Bloom, S.R.
(2001) Evidence of an orexigenic role for cocaine- and amphetamine-regulated
transcript after administration into discrete hypothalamic nuclei. Endocrinology 142,
3457-3463.
Abbott, N.J., Patabendige, A.A., Dolman, D.E., Yusof, S.R., and Begley, D.J. (2010)
Structure and function of the blood-brain barrier. Neurobiol Dis 37, 13-25.
Adan, R.A., Tiesjema, B., Hillebrand, J.J., la Fleur, S.E., Kas, M.J., and de Krom, M.
(2006) The MC4 receptor and control of appetite. Br J Pharmacol 149, 815-827.
Adrian, T.E., Long, R.G., Fuessl, H.S., and Bloom, S.R. (1985) Plasma peptide YY
(PYY) in dumping syndrome. Dig Dis Sci 30, 1145-1148.
Ahima, R.S., Saper, C.B., Flier, J.S., and Elmquist, J.K. (2000) Leptin regulation of
neuroendocrine systems. Front Neuroendocrinol 21, 263-307.
Akmayev, I.G. and Fidelina, O.V. (1976) Morphological aspects of the hypothalamic-
hypophyseal system. VI. The tanycytes: their relation to the sexual differentiation of
the hypothalamus. An enzyme-histochemical study. Cell Tissue Res 173, 407-416.
Akmayev, I.G., Fidelina, O.V., Kabolova, Z.A., Popov, A.P., and Schitkova, T.A.
(1973) Morphological aspects of the hypothalamic-hypophyseal system. IV. Medial
basal hypothalamus. An experimental morphological study. Z Zellforsch Mikrosk
Anat 137, 493-512.
Akmayev, I.G. and Popov, A.P. (1977) Morphological aspects of the hypothalamic-
hypophyseal system. VII. The tanycytes: Their relation to the hypophyseal
adrenocorticotrophic function. An ultrastructural study. Cell Tissue Res 180, 263-
282.
Alkemade, A., Yi, C.X., Pei, L., Harakalova, M., Swaab, D.F., la Fleur, S.E., Fliers, E.,
and Kalsbeek, A. (2012) AgRP and NPY expression in the human hypothalamic
infundibular nucleus correlate with body mass index, whereas changes in alphaMSH
are related to type 2 diabetes. J Clin Endocrinol Metab 97, E925-933.
Allen, R.G., Peng, B., Pellegrino, M.J., Miller, E.D., Grandy, D.K., Lundblad, J.R.,
Washburn, C.L., and Pintar, J.E. (2001) Altered processing of pro-orphanin
FQ/nociceptin and pro-opiomelanocortin-derived peptides in the brains of mice
expressing defective prohormone convertase 2. J Neurosci 21, 5864-5870.
Amat, P., Pastor, F.E., Blazquez, J.L., Pelaez, B., Sanchez, A., Alvarez-Morujo, A.J.,
Toranzo, D., and Amat-Peral, G. (1999) Lateral evaginations from the third ventricle
into the rat mediobasal hypothalamus: An amplification of the ventricular route.
Neuroscience 88, 673-677.
DOI:10.14753/SE.2019.2208

105
Andrews, Z.B., Liu, Z.W., Walllingford, N., Erion, D.M., Borok, E., Friedman, J.M.,
Tschop, M.H., Shanabrough, M., Cline, G., Shulman, G.I., Coppola, A., Gao, X.B.,
Horvath, T.L., and Diano, S. (2008) UCP2 mediates ghrelin's action on NPY/AgRP
neurons by lowering free radicals. Nature 454, 846-851.
Aponte, Y., Atasoy, D., and Sternson, S.M. (2011) AGRP neurons are sufficient to
orchestrate feeding behavior rapidly and without training. Nat Neurosci 14, 351-355.
Asnicar, M.A., Smith, D.P., Yang, D.D., Heiman, M.L., Fox, N., Chen, Y.F., Hsiung,
H.M., and Koster, A. (2001) Absence of cocaine- and amphetamine-regulated
transcript results in obesity in mice fed a high caloric diet. Endocrinology 142, 4394-
4400.
Bagnol, D., Lu, X.Y., Kaelin, C.B., Day, H.E., Ollmann, M., Gantz, I., Akil, H., Barsh,
G.S., and Watson, S.J. (1999) Anatomy of an endogenous antagonist: relationship
between Agouti-related protein and proopiomelanocortin in brain. J Neurosci 19,
RC26.
Balland, E., Dam, J., Langlet, F., Caron, E., Steculorum, S., Messina, A., Rasika, S.,
Falluel-Morel, A., Anouar, Y., Dehouck, B., Trinquet, E., Jockers, R., Bouret, S.G.,
and Prevot, V. (2014) Hypothalamic tanycytes are an ERK-gated conduit for leptin
into the brain. Cell Metab 19, 293-301.
Balthasar, N., Coppari, R., McMinn, J., Liu, S.M., Lee, C.E., Tang, V., Kenny, C.D.,
McGovern, R.A., Chua, S.C., Jr., Elmquist, J.K., and Lowell, B.B. (2004) Leptin
receptor signaling in POMC neurons is required for normal body weight
homeostasis. Neuron 42, 983-991.
Bamshad, M., Song, C.K., and Bartness, T.J. (1999) CNS origins of the sympathetic
nervous system outflow to brown adipose tissue. Am J Physiol 276, R1569-1578.
Banke, E., Riva, M., Shcherbina, L., Wierup, N., and Degerman, E. (2013) Cocaine-
and amphetamine-regulated transcript is expressed in adipocytes and regulate lipid-
and glucose homeostasis. Regul Pept 182, 35-40.
Batterham, R.L., Cowley, M.A., Small, C.J., Herzog, H., Cohen, M.A., Dakin, C.L.,
Wren, A.M., Brynes, A.E., Low, M.J., Ghatei, M.A., Cone, R.D., and Bloom, S.R.
(2002) Gut hormone PYY(3-36) physiologically inhibits food intake. Nature 418,
650-654.
Batterham, R.L., Heffron, H., Kapoor, S., Chivers, J.E., Chandarana, K., Herzog, H., Le
Roux, C.W., Thomas, E.L., Bell, J.D., and Withers, D.J. (2006) Critical role for
peptide YY in protein-mediated satiation and body-weight regulation. Cell Metab 4,
223-233.
Beck, B., Stricker-Krongrad, A., Nicolas, J.P., and Burlet, C. (1992) Chronic and
continuous intracerebroventricular infusion of neuropeptide Y in Long-Evans rats
mimics the feeding behaviour of obese Zucker rats. Int J Obes Relat Metab Disord
16, 295-302.
Begg, D.P. and Woods, S.C. (2012) The central insulin system and energy balance.
Handb Exp Pharmacol, 111-129.
DOI:10.14753/SE.2019.2208

106
Benford, H., Bolborea, M., Pollatzek, E., Lossow, K., Hermans-Borgmeyer, I., Liu, B.,
Meyerhof, W., Kasparov, S., and Dale, N. (2017) A sweet taste receptor-dependent
mechanism of glucosensing in hypothalamic tanycytes. Glia 65, 773-789.
Berger, U.V. and Hediger, M.A. (2001) Differential distribution of the glutamate
transporters GLT-1 and GLAST in tanycytes of the third ventricle. J Comp Neurol
433, 101-114.
Bernardis, L.L. and Bellinger, L.L. (1998) The dorsomedial hypothalamic nucleus
revisited: 1998 update. Proc Soc Exp Biol Med 218, 284-306.
Berthoud, H.R. (2008) Vagal and hormonal gut-brain communication: from satiation to
satisfaction. Neurogastroenterol Motil 20 Suppl 1, 64-72.
Berthoud, H.R. and Powley, T.L. (1992) Vagal Afferent Innervation of the Rat Fundic
Stomach - Morphological Characterization of the Gastric Tension Receptor. J Comp
Neurol 319, 261-276.
Bewick, G.A., Gardiner, J.V., Dhillo, W.S., Kent, A.S., White, N.E., Webster, Z.,
Ghatei, M.A., and Bloom, S.R. (2005) Post-embryonic ablation of AgRP neurons in
mice leads to a lean, hypophagic phenotype. FASEB J 19, 1680-1682.
Bicknell, A.B. (2016) 60 YEARS OF POMC: N-terminal POMC peptides and adrenal
growth. J Mol Endocrinol 56, T39-48.
Bitsch, P. and Schiebler, T.H. (1979) [Postnatal development of the median eminence in
the rat]. Z Mikrosk Anat Forsch 93, 1-20.
Blomstrand, F. and Giaume, C. (2006) Kinetics of endothelin-induced inhibition and
glucose permeability of astrocyte gap junctions. J Neurosci Res 83, 996-1003.
Blouet, C., Jo, Y.H., Li, X., and Schwartz, G.J. (2009) Mediobasal hypothalamic
leucine sensing regulates food intake through activation of a hypothalamus-brainstem
circuit. J Neurosci 29, 8302-8311.
Blouet, C. and Schwartz, G.J. (2010) Hypothalamic nutrient sensing in the control of
energy homeostasis. Behav Brain Res 209, 1-12.
Bolborea, M. and Dale, N. (2013) Hypothalamic tanycytes: potential roles in the control
of feeding and energy balance. Trends Neurosci 36, 91-100.
Boucher, J., Kleinridders, A., and Kahn, C.R. (2014) Insulin receptor signaling in
normal and insulin-resistant states. Cold Spring Harb Perspect Biol 6.
Brawer, J.R. (1972) The fine structure of the ependymal tanycytes at the level of the
arcuate nucleus. J Comp Neurol 145, 25-41.
Broberger, C., Landry, M., Wong, H., Walsh, J.N., and Hokfelt, T. (1997) Subtypes Y1
and Y2 of the neuropeptide Y receptor are respectively expressed in pro-
opiomelanocortin- and neuropeptide-Y-containing neurons of the rat hypothalamic
arcuate nucleus. Neuroendocrinology 66, 393-408.
Brody, D.S., Hahn, S.R., Spitzer, R.L., Kroenke, K., Linzer, M., deGruy, F.V., 3rd, and
Williams, J.B. (1998) Identifying patients with depression in the primary care
setting: a more efficient method. Arch Intern Med 158, 2469-2475.
DOI:10.14753/SE.2019.2208

107
Bruni, J.E. (1974) Scanning and transmission electron microscopy of the ependymal
lining of the third ventricle. Can J Neurol Sci 1, 59-73.
Burdyga, G., de Lartigue, G., Raybould, H.E., Morris, R., Dimaline, R., Varro, A.,
Thompson, D.G., and Dockray, G.J. (2008) Cholecystokinin regulates expression of
Y2 receptors in vagal afferent neurons serving the stomach. J Neurosci 28, 11583-
11592.
Butler, A.A., Kesterson, R.A., Khong, K., Cullen, M.J., Pelleymounter, M.A.,
Dekoning, J., Baetscher, M., and Cone, R.D. (2000) A unique metabolic syndrome
causes obesity in the melanocortin-3 receptor-deficient mouse. Endocrinology 141,
3518-3521.
Cawley, N.X., Li, Z., and Loh, Y.P. (2016) 60 YEARS OF POMC: Biosynthesis,
trafficking, and secretion of pro-opiomelanocortin-derived peptides. J Mol
Endocrinol 56, T77-97.
Challis, B.G., Coll, A.P., Yeo, G.S., Pinnock, S.B., Dickson, S.L., Thresher, R.R.,
Dixon, J., Zahn, D., Rochford, J.J., White, A., Oliver, R.L., Millington, G., Aparicio,
S.A., Colledge, W.H., Russ, A.P., Carlton, M.B., and O'Rahilly, S. (2004) Mice
lacking pro-opiomelanocortin are sensitive to high-fat feeding but respond normally
to the acute anorectic effects of peptide-YY(3-36). Proc Natl Acad Sci U S A 101,
4695-4700.
Challis, B.G., Pritchard, L.E., Creemers, J.W.M., Delplanque, J., Keogh, J.M., Luan, J.,
Wareham, N.J., Yeo, G.S.H., Bhattacharyya, S., Froguel, P., White, A., Farooqi, I.S.,
and O'Rahilly, S. (2002) A missense mutation disrupting a dibasic prohormone
processing site in pro-opiomelanocortin (POMC) increases susceptibility to early-
onset obesity through a novel molecular mechanism. Hum Mol Genet 11, 1997-2004.
Chen, H.Y., Trumbauer, M.E., Chen, A.S., Weingarth, D.T., Adams, J.R., Frazier, E.G.,
Shen, Z., Marsh, D.J., Feighner, S.D., Guan, X.M., Ye, Z., Nargund, R.P., Smith,
R.G., Van der Ploeg, L.H., Howard, A.D., MacNeil, D.J., and Qian, S. (2004)
Orexigenic action of peripheral ghrelin is mediated by neuropeptide Y and agouti-
related protein. Endocrinology 145, 2607-2612.
Cheng, X., Broberger, C., Tong, Y., Yongtao, X., Ju, G., Zhang, X., and Hokfelt, T.
(1998) Regulation of expression of neuropeptide Y Y1 and Y2 receptors in the
arcuate nucleus of fasted rats. Brain Res 792, 89-96.
Chitravanshi, V.C., Kawabe, K., and Sapru, H.N. (2016) Stimulation of the
hypothalamic arcuate nucleus increases brown adipose tissue nerve activity via
hypothalamic paraventricular and dorsomedial nuclei. Am J Physiol Heart Circ
Physiol 311, H433-444.
Ciofi, P. (2011) The arcuate nucleus as a circumventricular organ in the mouse.
Neurosci Lett 487, 187-190.
Clark, J.T., Kalra, P.S., and Kalra, S.P. (1985) Neuropeptide Y stimulates feeding but
inhibits sexual behavior in rats. Endocrinology 117, 2435-2442.
Cone, R.D. (2005) Anatomy and regulation of the central melanocortin system. Nat
Neurosci 8, 571-578.
DOI:10.14753/SE.2019.2208

108
Coniglio, S.J., Eugenin, E., Dobrenis, K., Stanley, E.R., West, B.L., Symons, M.H., and
Segall, J.E. (2012) Microglial stimulation of glioblastoma invasion involves
epidermal growth factor receptor (EGFR) and colony stimulating factor 1 receptor
(CSF-1R) signaling. Mol Med 18, 519-527.
Corander, M.P. and Coll, A.P. (2011) Melanocortins and body weight regulation:
glucocorticoids, Agouti-related protein and beyond. Eur J Pharmacol 660, 111-118.
Cork, S.C., Richards, J.E., Holt, M.K., Gribble, F.M., Reimann, F., and Trapp, S. (2015)
Distribution and characterisation of Glucagon-like peptide-1 receptor expressing
cells in the mouse brain. Mol Metab 4, 718-731.
Cowley, M.A., Smart, J.L., Rubinstein, M., Cerdan, M.G., Diano, S., Horvath, T.L.,
Cone, R.D., and Low, M.J. (2001) Leptin activates anorexigenic POMC neurons
through a neural network in the arcuate nucleus. Nature 411, 480-484.
Cullinan, W.E., Day, N.C., Schafer, M.K., Day, R., Seidah, N.G., Chretien, M., Akil,
H., and Watson, S.J. (1991) Neuroanatomical and functional studies of peptide
precursor-processing enzymes. Enzyme 45, 285-300.
Cummings, D.E., Purnell, J.Q., Frayo, R.S., Schmidova, K., Wisse, B.E., and Weigle,
D.S. (2001) A preprandial rise in plasma ghrelin levels suggests a role in meal
initiation in humans. Diabetes 50, 1714-1719.
Dagher, N.N., Najafi, A.R., Kayala, K.M., Elmore, M.R., White, T.E., Medeiros, R.,
West, B.L., and Green, K.N. (2015) Colony-stimulating factor 1 receptor inhibition
prevents microglial plaque association and improves cognition in 3xTg-AD mice. J
Neuroinflammation 12, 139.
Dailey, M.J. and Moran, T.H. (2013) Glucagon-like peptide 1 and appetite. Trends
Endocrinol Metab 24, 85-91.
Dale, N. (2011) Purinergic signaling in hypothalamic tanycytes: potential roles in
chemosensing. Semin Cell Dev Biol 22, 237-244.
Date, Y., Kojima, M., Hosoda, H., Sawaguchi, A., Mondal, M.S., Suganuma, T.,
Matsukura, S., Kangawa, K., and Nakazato, M. (2000) Ghrelin, a novel growth
hormone-releasing acylated peptide, is synthesized in a distinct endocrine cell type in
the gastrointestinal tracts of rats and humans. Endocrinology 141, 4255-4261.
Davies, J.S., Kotokorpi, P., Eccles, S.R., Barnes, S.K., Tokarczuk, P.F., Allen, S.K.,
Whitworth, H.S., Guschina, I.A., Evans, B.A., Mode, A., Zigman, J.M., and Wells,
T. (2009) Ghrelin induces abdominal obesity via GHS-R-dependent lipid retention.
Mol Endocrinol 23, 914-924.
De Souza, C.T., Araujo, E.P., Bordin, S., Ashimine, R., Zollner, R.L., Boschero, A.C.,
Saad, M.J., and Velloso, L.A. (2005) Consumption of a fat-rich diet activates a
proinflammatory response and induces insulin resistance in the hypothalamus.
Endocrinology 146, 4192-4199.
Dheen, S.T., Kaur, C., and Ling, E.A. (2007) Microglial activation and its implications
in the brain diseases. Curr Med Chem 14, 1189-1197.
Dhillo, W.S., Small, C.J., Stanley, S.A., Jethwa, P.H., Seal, L.J., Murphy, K.G., Ghatei,
M.A., and Bloom, S.R. (2002) Hypothalamic interactions between neuropeptide Y,
agouti-related protein, cocaine- and amphetamine-regulated transcript and alpha-
DOI:10.14753/SE.2019.2208

109
melanocyte-stimulating hormone in vitro in male rats. J Neuroendocrinol 14, 725-
730.
Dib, L., San-Jose, L.M., Ducrest, A.L., Salamin, N., and Roulin, A. (2017) Selection on
the Major Color Gene Melanocortin-1-Receptor Shaped the Evolution of the
Melanocortin System Genes. Int J Mol Sci 18.
Djogo, T., Robins, S.C., Schneider, S., Kryzskaya, D., Liu, X., Mingay, A., Gillon, C.J.,
Kim, J.H., Storch, K.F., Boehm, U., Bourque, C.W., Stroh, T., Dimou, L., and
Kokoeva, M.V. (2016) Adult NG2-Glia Are Required for Median Eminence-
Mediated Leptin Sensing and Body Weight Control. Cell Metab 23, 797-810.
Douglass, J. and Daoud, S. (1996) Characterization of the human cDNA and genomic
DNA encoding CART: a cocaine- and amphetamine-regulated transcript. Gene 169,
241-245.
Douglass, J., McKinzie, A.A., and Couceyro, P. (1995) PCR differential display
identifies a rat brain mRNA that is transcriptionally regulated by cocaine and
amphetamine. J Neurosci 15, 2471-2481.
Douglass, J.D., Dorfman, M.D., Fasnacht, R., Shaffer, L.D., and Thaler, J.P. (2017)
Astrocyte IKKbeta/NF-kappaB signaling is required for diet-induced obesity and
hypothalamic inflammation. Mol Metab 6, 366-373.
Ebina, Y., Ellis, L., Jarnagin, K., Edery, M., Graf, L., Clauser, E., Ou, J.H., Masiarz, F.,
Kan, Y.W., Goldfine, I.D., and et al. (1985) The human insulin receptor cDNA: the
structural basis for hormone-activated transmembrane signalling. Cell 40, 747-758.
Edwards, C.M., Stanley, S.A., Davis, R., Brynes, A.E., Frost, G.S., Seal, L.J., Ghatei,
M.A., and Bloom, S.R. (2001) Exendin-4 reduces fasting and postprandial glucose
and decreases energy intake in healthy volunteers. Am J Physiol Endocrinol Metab
281, E155-161.
Elias, C.F., Aschkenasi, C., Lee, C., Kelly, J., Ahima, R.S., Bjorbaek, C., Flier, J.S.,
Saper, C.B., and Elmquist, J.K. (1999) Leptin differentially regulates NPY and
POMC neurons projecting to the lateral hypothalamic area. Neuron 23, 775-786.
Ellacott, K.L. and Cone, R.D. (2006) The role of the central melanocortin system in the
regulation of food intake and energy homeostasis: lessons from mouse models.
Philos Trans R Soc Lond B Biol Sci 361, 1265-1274.
Elmore, M.R., Najafi, A.R., Koike, M.A., Dagher, N.N., Spangenberg, E.E., Rice, R.A.,
Kitazawa, M., Matusow, B., Nguyen, H., West, B.L., and Green, K.N. (2014)
Colony-stimulating factor 1 receptor signaling is necessary for microglia viability,
unmasking a microglia progenitor cell in the adult brain. Neuron 82, 380-397.
Elmquist, J.K., Maratos-Flier, E., Saper, C.B., and Flier, J.S. (1998) Unraveling the
central nervous system pathways underlying responses to leptin. Nat Neurosci 1,
445-450.
Erickson, J.C., Clegg, K.E., and Palmiter, R.D. (1996a) Sensitivity to leptin and
susceptibility to seizures of mice lacking neuropeptide Y. Nature 381, 415-421.
Erickson, J.C., Hollopeter, G., and Palmiter, R.D. (1996b) Attenuation of the obesity
syndrome of ob/ob mice by the loss of neuropeptide Y. Science 274, 1704-1707.
DOI:10.14753/SE.2019.2208
110
Eyigor, O. and Jennes, L. (1998) Identification of kainate-preferring glutamate receptor
subunit GluR7 mRNA and protein in the rat median eminence. Brain Res 814, 231-
235.
Fang, C.X., Dong, F., Thomas, D.P., Ma, H., He, L., and Ren, J. (2008) Hypertrophic
cardiomyopathy in high-fat diet-induced obesity: role of suppression of forkhead
transcription factor and atrophy gene transcription. Am J Physiol Heart Circ Physiol
295, H1206-H1215.
Faouzi, M., Leshan, R., Bjornholm, M., Hennessey, T., Jones, J., and Munzberg, H.
(2007) Differential accessibility of circulating leptin to individual hypothalamic sites.
Endocrinology 148, 5414-5423.
Farooqi, I.S., Drop, S., Clements, A., Keogh, J.M., Biernacka, J., Lowenbein, S.,
Challis, B.G., and O'Rahilly, S. (2006) Heterozygosity for a POMC-null mutation
and increased obesity risk in humans. Diabetes 55, 2549-2553.
Farooqi, I.S. and O'Rahilly, S. (2008) Mutations in ligands and receptors of the leptin-
melanocortin pathway that lead to obesity. Nat Clin Pract Endocrinol Metab 4, 569-
577.
Farooqi, I.S., Yeo, G.S., Keogh, J.M., Aminian, S., Jebb, S.A., Butler, G., Cheetham,
T., and O'Rahilly, S. (2000) Dominant and recessive inheritance of morbid obesity
associated with melanocortin 4 receptor deficiency. J Clin Invest 106, 271-279.
Farooqi, S., Rau, H., Whitehead, J., and O'Rahilly, S. (1998) ob gene mutations and
human obesity. Proc Nutr Soc 57, 471-475.
Fekete, C. and Lechan, R.M. (2014) Central regulation of hypothalamic-pituitary-
thyroid axis under physiological and pathophysiological conditions. Endocr Rev 35,
159-194.
Fekete, C., Legradi, G., Mihaly, E., Huang, Q.H., Tatro, J.B., Rand, W.M., Emerson,
C.H., and Lechan, R.M. (2000a) alpha-Melanocyte-stimulating hormone is contained
in nerve terminals innervating thyrotropin-releasing hormone-synthesizing neurons
in the hypothalamic paraventricular nucleus and prevents fasting-induced
suppression of prothyrotropin-releasing hormone gene expression. J Neurosci 20,
1550-1558.
Fekete, C., Marks, D.L., Sarkar, S., Emerson, C.H., Rand, W.M., Cone, R.D., and
Lechan, R.M. (2004) Effect of Agouti-related protein in regulation of the
hypothalamic-pituitary-thyroid axis in the melanocortin 4 receptor knockout mouse.
Endocrinology 145, 4816-4821.
Fekete, C., Mihaly, E., Herscovici, S., Salas, J., Tu, H., Larsen, P.R., and Lechan, R.M.
(2000b) DARPP-32 and CREB are present in type 2 iodothyronine deiodinase-
producing tanycytes: implications for the regulation of type 2 deiodinase activity.
Brain Res 862, 154-161.
Fekete, C., Mihaly, E., Luo, L.G., Kelly, J., Clausen, J.T., Mao, Q., Rand, W.M., Moss,
L.G., Kuhar, M., Emerson, C.H., Jackson, I.M., and Lechan, R.M. (2000c)
Association of cocaine- and amphetamine-regulated transcript-immunoreactive
elements with thyrotropin-releasing hormone-synthesizing neurons in the
DOI:10.14753/SE.2019.2208
111
hypothalamic paraventricular nucleus and its role in the regulation of the
hypothalamic-pituitary-thyroid axis during fasting. J Neurosci 20, 9224-9234.
Fekete, C., Singru, P.S., Sanchez, E., Sarkar, S., Christoffolete, M.A., Riberio, R.S.,
Rand, W.M., Emerson, C.H., Bianco, A.C., and Lechan, R.M. (2006) Differential
effects of central leptin, insulin, or glucose administration during fasting on the
hypothalamic-pituitary-thyroid axis and feeding-related neurons in the arcuate
nucleus. Endocrinology 147, 520-529.
Finkbeiner, S. (1992) Calcium waves in astrocytes-filling in the gaps. Neuron 8, 1101-
1108.
Firth, J.A. and Bock, R. (1976) Distribution and properties of an adenosine
triphosphatase in the tanycyte ependyma of the IIIrd ventricle of the rat.
Histochemistry 47, 145-157.
Flament-Durand, J. and Brion, J.P. (1985) Tanycytes: morphology and functions: a
review. Int Rev Cytol 96, 121-155.
Flier, J.S. (1998) Lowered leptin slims immune response. Nat Med 4, 1124-1125.
Flier, J.S. (2006) AgRP in energy balance: Will the real AgRP please stand up? Cell
Metab 3, 83-85.
Frayling, C., Britton, R., and Dale, N. (2011) ATP-mediated glucosensing by
hypothalamic tanycytes. J Physiol 589, 2275-2286.
Freire-Regatillo, A., Argente-Arizon, P., Argente, J., Garcia-Segura, L.M., and Chowen,
J.A. (2017) Non-Neuronal Cells in the Hypothalamic Adaptation to Metabolic
Signals. Front Endocrinol (Lausanne) 8, 51.
Gaisano, G.G., Park, S.J., Daly, D.M., and Beyak, M.J. (2010) Glucagon-like peptide-1
inhibits voltage-gated potassium currents in mouse nodose ganglion neurons.
Neurogastroenterol Motil 22, 470-479, e111.
Gallyas, F. and Merchenthaler, I. (1988) Copper-H2O2 oxidation strikingly improves
silver intensification of the nickel-diaminobenzidine (Ni-DAB) end-product of the
peroxidase reaction. J Histochem Cytochem 36, 807-810.
Gao, Q. and Horvath, T.L. (2007) Neurobiology of feeding and energy expenditure.
Annu Rev Neurosci 30, 367-398.
Garcia, M., Millan, C., Balmaceda-Aguilera, C., Castro, T., Pastor, P., Montecinos, H.,
Reinicke, K., Zuniga, F., Vera, J.C., Onate, S.A., and Nualart, F. (2003)
Hypothalamic ependymal-glial cells express the glucose transporter GLUT2, a
protein involved in glucose sensing. J Neurochem 86, 709-724.
Garcia, M.A., Carrasco, M., Godoy, A., Reinicke, K., Montecinos, V.P., Aguayo, L.G.,
Tapia, J.C., Vera, J.C., and Nualart, F. (2001) Elevated expression of glucose
transporter-1 in hypothalamic ependymal cells not involved in the formation of the
brain-cerebrospinal fluid barrier. J Cell Biochem 80, 491-503.
Gautvik, K.M., deLecea, L., Gautvik, V.T., Danielson, P.E., Tranque, P., Dopazo, A.,
Bloom, F.E., and Sutcliffe, J.G. (1996) Overview of the most prevalent
hypothalamus-specific mRNAs, as identified by directional tag PCR subtraction. P
Natl Acad Sci USA 93, 8733-8738.
DOI:10.14753/SE.2019.2208
112
Giaume, C. and Theis, M. (2010) Pharmacological and genetic approaches to study
connexin-mediated channels in glial cells of the central nervous system. Brain Res
Rev 63, 160-176.
Glatzle, J., Wang, Y., Adelson, D.W., Kalogeris, T.J., Zittel, T.T., Tso, P., Wei, J.Y.,
and Raybould, H.E. (2003) Chylomicron components activate duodenal vagal
afferents via a cholecystokinin A receptor-mediated pathway to inhibit gastric motor
function in the rat. J Physiol 550, 657-664.
Goebel-Stengel, M., Stengel, A., Wang, L., Ohning, G., Tache, Y., and Reeve, J.R., Jr.
(2012) CCK-8 and CCK-58 differ in their effects on nocturnal solid meal pattern in
undisturbed rats. Am J Physiol Regul Integr Comp Physiol 303, R850-860.
Gomez-Nicola, D., Fransen, N.L., Suzzi, S., and Perry, V.H. (2013) Regulation of
microglial proliferation during chronic neurodegeneration. J Neurosci 33, 2481-2493.
Goto, K., Inui, A., Takimoto, Y., Yuzuriha, H., Asakawa, A., Kawamura, Y., Tsuji, H.,
Takahara, Y., Takeyama, C., Katsuura, G., and Kasuga, M. (2003) Acute
intracerebroventricular administration of either carboxyl-terminal or amino-terminal
fragments of agouti-related peptide produces a long-term decrease in energy
expenditure in rats. Int J Mol Med 12, 379-383.
Graeber, M.B. (2010) Changing face of microglia. Science 330, 783-788.
Graeber, M.B., Li, W., and Rodriguez, M.L. (2011) Role of microglia in CNS
inflammation. FEBS Lett 585, 3798-3805.
Gropp, E., Shanabrough, M., Borok, E., Xu, A.W., Janoschek, R., Buch, T., Plum, L.,
Balthasar, N., Hampel, B., Waisman, A., Barsh, G.S., Horvath, T.L., and Bruning,
J.C. (2005) Agouti-related peptide-expressing neurons are mandatory for feeding.
Nat Neurosci 8, 1289-1291.
Gutzwiller, J.P., Goke, B., Drewe, J., Hildebrand, P., Ketterer, S., Handschin, D.,
Winterhalder, R., Conen, D., and Beglinger, C. (1999) Glucagon-like peptide-1: a
potent regulator of food intake in humans. Gut 44, 81-86.
Haan, N., Goodman, T., Najdi-Samiei, A., Stratford, C.M., Rice, R., El Agha, E.,
Bellusci, S., and Hajihosseini, M.K. (2013) Fgf10-expressing tanycytes add new
neurons to the appetite/energy-balance regulating centers of the postnatal and adult
hypothalamus. J Neurosci 33, 6170-6180.
Hahn, T.M., Breininger, J.F., Baskin, D.G., and Schwartz, M.W. (1998) Coexpression
of Agrp and NPY in fasting-activated hypothalamic neurons. Nat Neurosci 1, 271-
272.
Hakansson, M.L., Hulting, A.L., and Meister, B. (1996) Expression of leptin receptor
mRNA in the hypothalamic arcuate nucleus--relationship with NPY neurones.
Neuroreport 7, 3087-3092.
Halaas, J.L., Gajiwala, K.S., Maffei, M., Cohen, S.L., Chait, B.T., Rabinowitz, D.,
Lallone, R.L., Burley, S.K., and Friedman, J.M. (1995) Weight-reducing effects of
the plasma protein encoded by the obese gene. Science 269, 543-546.
Hanisch, U.K. and Kettenmann, H. (2007) Microglia: active sensor and versatile
effector cells in the normal and pathologic brain. Nat Neurosci 10, 1387-1394.
DOI:10.14753/SE.2019.2208

113
Hatton, J.D. and Ellisman, M.H. (1982) The distribution of orthogonal arrays in the
freeze-fractured rat median eminence. J Neurocytol 11, 335-349.
Havrankova, J., Roth, J., and Brownstein, M. (1978) Insulin receptors are widely
distributed in the central nervous system of the rat. Nature 272, 827-829.
Hayes, M.R., Kanoski, S.E., Alhadeff, A.L., and Grill, H.J. (2011) Comparative effects
of the long-acting GLP-1 receptor ligands, liraglutide and exendin-4, on food intake
and body weight suppression in rats. Obesity (Silver Spring) 19, 1342-1349.
Herrmann, C., Goke, R., Richter, G., Fehmann, H.C., Arnold, R., and Goke, B. (1995)
Glucagon-like peptide-1 and glucose-dependent insulin-releasing polypeptide plasma
levels in response to nutrients. Digestion 56, 117-126.
Hewson, A.K. and Dickson, S.L. (2000) Systemic administration of ghrelin induces Fos
and Egr-1 proteins in the hypothalamic arcuate nucleus of fasted and fed rats. J
Neuroendocrinol 12, 1047-1049.
Hillebrand, J.J., de Wied, D., and Adan, R.A. (2002) Neuropeptides, food intake and
body weight regulation: a hypothalamic focus. Peptides 23, 2283-2306.
Hofmann, K., Lamberz, C., Piotrowitz, K., Offermann, N., But, D., Scheller, A., Al-
Amoudi, A., and Kuerschner, L. (2017) Tanycytes and a differential fatty acid
metabolism in the hypothalamus. Glia 65, 231-249.
Hokfelt, T., Foster, G., Schultzberg, M., Meister, B., Schalling, M., Goldstein, M.,
Hemmings, H.C., Jr., Ouimet, C., and Greengard, P. (1988) DARPP-32 as a marker
for D-1 dopaminoceptive cells in the rat brain: prenatal development and presence in
glial elements (tanycytes) in the basal hypothalamus. Adv Exp Med Biol 235, 65-82.
Holst, J.J. (2007) The physiology of glucagon-like peptide 1. Physiol Rev 87, 1409-
1439.
Horvath, T.L., Sarman, B., Garcia-Caceres, C., Enriori, P.J., Sotonyi, P., Shanabrough,
M., Borok, E., Argente, J., Chowen, J.A., Perez-Tilve, D., Pfluger, P.T., Bronneke,
H.S., Levin, B.E., Diano, S., Cowley, M.A., and Tschop, M.H. (2010) Synaptic input
organization of the melanocortin system predicts diet-induced hypothalamic reactive
gliosis and obesity. Proc Natl Acad Sci U S A 107, 14875-14880.
Huang, W., Ramsey, K.M., Marcheva, B., and Bass, J. (2011) Circadian rhythms, sleep,
and metabolism. J Clin Invest 121, 2133-2141.
Hunter, K. and Holscher, C. (2012) Drugs developed to treat diabetes, liraglutide and
lixisenatide, cross the blood brain barrier and enhance neurogenesis. BMC Neurosci
13, 33.
Huszar, D., Lynch, C.A., Fairchild-Huntress, V., Dunmore, J.H., Fang, Q., Berkemeier,
L.R., Gu, W., Kesterson, R.A., Boston, B.A., Cone, R.D., Smith, F.J., Campfield,
L.A., Burn, P., and Lee, F. (1997) Targeted disruption of the melanocortin-4 receptor
results in obesity in mice. Cell 88, 131-141.
Ibrahim, N., Bosch, M.A., Smart, J.L., Qiu, J., Rubinstein, M., Ronnekleiv, O.K., Low,
M.J., and Kelly, M.J. (2003) Hypothalamic proopiomelanocortin neurons are glucose
responsive and express K(ATP) channels. Endocrinology 144, 1331-1340.
DOI:10.14753/SE.2019.2208

114
Ito, D., Imai, Y., Ohsawa, K., Nakajima, K., Fukuuchi, Y., and Kohsaka, S. (1998)
Microglia-specific localisation of a novel calcium binding protein, Iba1. Brain Res
Mol Brain Res 57, 1-9.
Iwakura, H., Kangawa, K., and Nakao, K. (2015) The regulation of circulating ghrelin -
with recent updates from cell-based assays. Endocr J 62, 107-122.
Jha, M.K. and Suk, K. (2013) Glia-based biomarkers and their functional role in the
CNS. Expert Rev Proteomics 10, 43-63.
Kalra, S.P., Dube, M.G., Fournier, A., and Kalra, P.S. (1991) Structure-function
analysis of stimulation of food intake by neuropeptide Y: effects of receptor agonists.
Physiol Behav 50, 5-9.
Kanoski, S.E., Alhadeff, A.L., Fortin, S.M., Gilbert, J.R., and Grill, H.J. (2014) Leptin
signaling in the medial nucleus tractus solitarius reduces food seeking and
willingness to work for food. Neuropsychopharmacology 39, 605-613.
Kentish, S.J. and Page, A.J. (2014) Plasticity of gastro-intestinal vagal afferent endings.
Physiol Behav 136, 170-178.
Kesterson, R.A., Huszar, D., Lynch, C.A., Simerly, R.B., and Cone, R.D. (1997)
Induction of neuropeptide Y gene expression in the dorsal medial hypothalamic
nucleus in two models of the agouti obesity syndrome. Mol Endocrinol 11, 630-637.
Kishi, T., Aschkenasi, C.J., Lee, C.E., Mountjoy, K.G., Saper, C.B., and Elmquist, J.K.
(2003) Expression of melanocortin 4 receptor mRNA in the central nervous system
of the rat. J Comp Neurol 457, 213-235.
Kofuji, P. and Newman, E.A. (2004) Potassium buffering in the central nervous system.
Neuroscience 129, 1045-1056.
Kojima, M., Hosoda, H., Date, Y., Nakazato, M., Matsuo, H., and Kangawa, K. (1999)
Ghrelin is a growth-hormone-releasing acylated peptide from stomach. Nature 402,
656-660.
Kong, W., Stanley, S., Gardiner, J., Abbott, C., Murphy, K., Seth, A., Connoley, I.,
Ghatei, M., Stephens, D., and Bloom, S. (2003) A role for arcuate cocaine and
amphetamine-regulated transcript in hyperphagia, thermogenesis, and cold
adaptation. FASEB J 17, 1688-1690.
Korner, J., Wissig, S., Kim, A., Conwell, I.M., and Wardlaw, S.L. (2003) Effects of
agouti-related protein on metabolism and hypothalamic neuropeptide gene
expression. J Neuroendocrinol 15, 1116-1121.
Kozlowski, G.P. and Coates, P.W. (1985) Ependymoneuronal specializations between
LHRH fibers and cells of the cerebroventricular system. Cell Tissue Res 242, 301-
311.
Krashes, M.J., Koda, S., Ye, C., Rogan, S.C., Adams, A.C., Cusher, D.S., Maratos-
Flier, E., Roth, B.L., and Lowell, B.B. (2011) Rapid, reversible activation of AgRP
neurons drives feeding behavior in mice. J Clin Invest 121, 1424-1428.
Kriegstein, A.R. and Gotz, M. (2003) Radial glia diversity: a matter of cell fate. Glia 43,
37-43.
DOI:10.14753/SE.2019.2208

115
Kristensen, P., Judge, M.E., Thim, L., Ribel, U., Christjansen, K.N., Wulff, B.S.,
Clausen, J.T., Jensen, P.B., Madsen, O.D., Vrang, N., Larsen, P.J., and Hastrup, S.
(1998) Hypothalamic CART is a new anorectic peptide regulated by leptin. Nature
393, 72-76.
Krude, H., Biebermann, H., Luck, W., Horn, R., Brabant, G., and Gruters, A. (1998)
Severe early-onset obesity, adrenal insufficiency and red hair pigmentation caused by
POMC mutations in humans. Nat Genet 19, 155-157.
Lam, T.K., Schwartz, G.J., and Rossetti, L. (2005) Hypothalamic sensing of fatty acids.
Nat Neurosci 8, 579-584.
Langlet, F., Levin, B.E., Luquet, S., Mazzone, M., Messina, A., Dunn-Meynell, A.A.,
Balland, E., Lacombe, A., Mazur, D., Carmeliet, P., Bouret, S.G., Prevot, V., and
Dehouck, B. (2013) Tanycytic VEGF-A boosts blood-hypothalamus barrier plasticity
and access of metabolic signals to the arcuate nucleus in response to fasting. Cell
Metab 17, 607-617.
Lau, J. and Herzog, H. (2014) CART in the regulation of appetite and energy
homeostasis. Front Neurosci 8, 313.
Laurent, V., Jaubert-Miazza, L., Desjardins, R., Day, R., and Lindberg, I. (2004)
Biosynthesis of proopiomelanocortin-derived peptides in prohormone convertase 2
and 7B2 null mice. Endocrinology 145, 519-528.
Lazutkaite, G., Solda, A., Lossow, K., Meyerhof, W., and Dale, N. (2017) Amino acid
sensing in hypothalamic tanycytes via umami taste receptors. Mol Metab 6, 1480-
1492.
Lechan, R.M. and Fekete, C. (2007) Infundibular tanycytes as modulators of
neuroendocrine function: hypothetical role in the regulation of the thyroid and
gonadal axis. Acta Biomed 78 Suppl 1, 84-98.
Lee, D.A., Bedont, J.L., Pak, T., Wang, H., Song, J., Miranda-Angulo, A., Takiar, V.,
Charubhumi, V., Balordi, F., Takebayashi, H., Aja, S., Ford, E., Fishell, G., and
Blackshaw, S. (2012) Tanycytes of the hypothalamic median eminence form a diet-
responsive neurogenic niche. Nat Neurosci 15, 700-702.
Levine, A.S. and Morley, J.E. (1984) Neuropeptide Y: a potent inducer of
consummatory behavior in rats. Peptides 5, 1025-1029.
Levitt, P. and Rakic, P. (1980) Immunoperoxidase localization of glial fibrillary acidic
protein in radial glial cells and astrocytes of the developing rhesus monkey brain. J
Comp Neurol 193, 815-840.
Li, Y. (2007) Sensory signal transduction in the vagal primary afferent neurons. Curr
Med Chem 14, 2554-2563.
Lin, E.J., Sainsbury, A., Lee, N.J., Boey, D., Couzens, M., Enriquez, R., Slack, K.,
Bland, R., During, M.J., and Herzog, H. (2006) Combined deletion of Y1, Y2, and
Y4 receptors prevents hypothalamic neuropeptide Y overexpression-induced
hyperinsulinemia despite persistence of hyperphagia and obesity. Endocrinology
147, 5094-5101.
DOI:10.14753/SE.2019.2208
116
Liu, C.D., Aloia, T., Adrian, T.E., Newton, T.R., Bilchik, A.J., Zinner, M.J., Ashley,
S.W., and McFadden, D.W. (1996) Peptide YY: a potential proabsorptive hormone
for the treatment of malabsorptive disorders. Am Surg 62, 232-236.
Lovshin, J.A. and Drucker, D.J. (2009) Incretin-based therapies for type 2 diabetes
mellitus. Nat Rev Endocrinol 5, 262-269.
Menyhert, J., Wittmann, G., Lechan, R.M., Keller, E., Liposits, Z., and Fekete, C.
(2007) Cocaine- and amphetamine-regulated transcript (CART) is colocalized with
the orexigenic neuropeptide Y and agouti-related protein and absent from the
anorexigenic alpha-melanocyte-stimulating hormone neurons in the infundibular
nucleus of the human hypothalamus. Endocrinology 148, 4276-4281.
Millan, C., Martinez, F., Cortes-Campos, C., Lizama, I., Yanez, M.J., Llanos, P.,
Reinicke, K., Rodriguez, F., Peruzzo, B., Nualart, F., and Garcia, M.A. (2010) Glial
glucokinase expression in adult and post-natal development of the hypothalamic
region. ASN Neuro 2, e00035.
Miller, R., Aaron, W., Toneff, T., Vishnuvardhan, D., Beinfeld, M.C., and Hook, V.Y.
(2003) Obliteration of alpha-melanocyte-stimulating hormone derived from POMC
in pituitary and brains of PC2-deficient mice. J Neurochem 86, 556-563.
Mitrou, P., Raptis, S.A., and Dimitriadis, G. (2013) Insulin action in morbid obesity: a
focus on muscle and adipose tissue. Hormones (Athens) 12, 201-213.
Mizuno, T.M., Kelley, K.A., Pasinetti, G.M., Roberts, J.L., and Mobbs, C.V. (2003)
Transgenic neuronal expression of proopiomelanocortin attenuates hyperphagic
response to fasting and reverses metabolic impairments in leptin-deficient obese
mice. Diabetes 52, 2675-2683.
Mizuno, T.M., Kleopoulos, S.P., Bergen, H.T., Roberts, J.L., Priest, C.A., and Mobbs,
C.V. (1998) Hypothalamic pro-opiomelanocortin mRNA is reduced by fasting and
[corrected] in ob/ob and db/db mice, but is stimulated by leptin. Diabetes 47, 294-
297.
Monroe, B.G. and Paull, W.K. (1974) Ultrastructural changes in the hypothalamus
during development and hypothalamic activity: the median eminence. Prog Brain
Res 41, 185-208.
Morris, M.J., Tortelli, C.F., Filippis, A., and Proietto, J. (1998) Reduced BAT function
as a mechanism for obesity in the hypophagic, neuropeptide Y deficient monosodium
glutamate-treated rat. Regul Pept 75-76, 441-447.
Morton, G.J., Cummings, D.E., Baskin, D.G., Barsh, G.S., and Schwartz, M.W. (2006)
Central nervous system control of food intake and body weight. Nature 443, 289-
295.
Mullier, A., Bouret, S.G., Prevot, V., and Dehouck, B. (2010) Differential distribution
of tight junction proteins suggests a role for tanycytes in blood-hypothalamus barrier
regulation in the adult mouse brain. J Comp Neurol 518, 943-962.
Munzberg, H. and Myers, M.G., Jr. (2005) Molecular and anatomical determinants of
central leptin resistance. Nat Neurosci 8, 566-570.
DOI:10.14753/SE.2019.2208

117
Muoio, D.M. and Newgard, C.B. (2008) Mechanisms of disease:Molecular and
metabolic mechanisms of insulin resistance and beta-cell failure in type 2 diabetes.
Nat Rev Mol Cell Biol 9, 193-205.
Murphy, B., Nunes, C.N., Ronan, J.J., Harper, C.M., Beall, M.J., Hanaway, M.,
Fairhurst, A.M., Van der Ploeg, L.H., MacIntyre, D.E., and Mellin, T.N. (1998)
Melanocortin mediated inhibition of feeding behavior in rats. Neuropeptides 32, 491-
497.
Nakazato, M., Murakami, N., Date, Y., Kojima, M., Matsuo, H., Kangawa, K., and
Matsukura, S. (2001) A role for ghrelin in the central regulation of feeding. Nature
409, 194-198.
Nelson, G., Chandrashekar, J., Hoon, M.A., Feng, L., Zhao, G., Ryba, N.J., and Zuker,
C.S. (2002) An amino-acid taste receptor. Nature 416, 199-202.
Neuwelt, E.A., Bauer, B., Fahlke, C., Fricker, G., Iadecola, C., Janigro, D., Leybaert, L.,
Molnar, Z., O'Donnell, M.E., Povlishock, J.T., Saunders, N.R., Sharp, F.,
Stanimirovic, D., Watts, R.J., and Drewes, L.R. (2011) Engaging neuroscience to
advance translational research in brain barrier biology. Nat Rev Neurosci 12, 169-
182.
Ollmann, M.M., Wilson, B.D., Yang, Y.K., Kerns, J.A., Chen, Y., Gantz, I., and Barsh,
G.S. (1997) Antagonism of central melanocortin receptors in vitro and in vivo by
agouti-related protein. Science 278, 135-138.
Orellana, J.A., Saez, P.J., Cortes-Campos, C., Elizondo, R.J., Shoji, K.F., Contreras-
Duarte, S., Figueroa, V., Velarde, V., Jiang, J.X., Nualart, F., Saez, J.C., and Garcia,
M.A. (2012) Glucose increases intracellular free Ca(2+) in tanycytes via ATP
released through connexin 43 hemichannels. Glia 60, 53-68.
Ozcan, L., Ergin, A.S., Lu, A., Chung, J., Sarkar, S., Nie, D., Myers, M.G., Jr., and
Ozcan, U. (2009) Endoplasmic reticulum stress plays a central role in development
of leptin resistance. Cell Metab 9, 35-51.
Page, A.J., Martin, C.M., and Blackshaw, L.A. (2002) Vagal mechanoreceptors and
chemoreceptors in mouse stomach and esophagus. J Neurophysiol 87, 2095-2103.
Paolicelli, R.C., Bolasco, G., Pagani, F., Maggi, L., Scianni, M., Panzanelli, P.,
Giustetto, M., Ferreira, T.A., Guiducci, E., Dumas, L., Ragozzino, D., and Gross,
C.T. (2011) Synaptic pruning by microglia is necessary for normal brain
development. Science 333, 1456-1458.
Pekny, M. and Nilsson, M. (2005) Astrocyte activation and reactive gliosis. Glia 50,
427-434.
Perez-Martin, M., Cifuentes, M., Grondona, J.M., Lopez-Avalos, M.D., Gomez-Pinedo,
U., Garcia-Verdugo, J.M., and Fernandez-Llebrez, P. (2010) IGF-I stimulates
neurogenesis in the hypothalamus of adult rats. Eur J Neurosci 31, 1533-1548.
Peruzzo, B., Pastor, F.E., Blazquez, J.L., Amat, P., and Rodriguez, E.M. (2004)
Polarized endocytosis and transcytosis in the hypothalamic tanycytes of the rat. Cell
Tissue Res 317, 147-164.
DOI:10.14753/SE.2019.2208

118
Peruzzo, B., Pastor, F.E., Blazquez, J.L., Schobitz, K., Pelaez, B., Amat, P., and
Rodriguez, E.M. (2000) A second look at the barriers of the medial basal
hypothalamus. Exp Brain Res 132, 10-26.
Phillips, R.J. and Powley, T.L. (2000) Tension and stretch receptors in gastrointestinal
smooth muscle: re-evaluating vagal mechanoreceptor electrophysiology. Brain Res
Brain Res Rev 34, 1-26.
Prevot, V. (2002) Glial-neuronal-endothelial interactions are involved in the control of
GnRH secretion. J Neuroendocrinol 14, 247-255.
Prevot, V., Langlet, F., and Dehouck, B. (2013) Flipping the tanycyte switch: how
circulating signals gain direct access to the metabolic brain. Aging (Albany NY) 5,
332-334.
Qian, S., Chen, H., Weingarth, D., Trumbauer, M.E., Novi, D.E., Guan, X., Yu, H.,
Shen, Z., Feng, Y., Frazier, E., Chen, A., Camacho, R.E., Shearman, L.P., Gopal-
Truter, S., MacNeil, D.J., Van der Ploeg, L.H., and Marsh, D.J. (2002) Neither
agouti-related protein nor neuropeptide Y is critically required for the regulation of
energy homeostasis in mice. Mol Cell Biol 22, 5027-5035.
Qing, K. and Chen, Y. (2007) Central CART gene delivery by recombinant AAV vector
attenuates body weight gain in diet-induced-obese rats. Regul Pept 140, 21-26.
Redecker, P. (1989) Postnatal development of glial fibrillary acidic protein (GFAP)
immunoreactivity in pituicytes and tanycytes of the Mongolian gerbil (Meriones
unguiculatus). Histochemistry 91, 507-515.
Rethelyi, M. (1984) Diffusional barrier around the hypothalamic arcuate nucleus in the
rat. Brain Res 307, 355-358.
Robins, S.C., Stewart, I., McNay, D.E., Taylor, V., Giachino, C., Goetz, M., Ninkovic,
J., Briancon, N., Maratos-Flier, E., Flier, J.S., Kokoeva, M.V., and Placzek, M.
(2013a) alpha-Tanycytes of the adult hypothalamic third ventricle include distinct
populations of FGF-responsive neural progenitors. Nat Commun 4, 2049.
Robins, S.C., Trudel, E., Rotondi, O., Liu, X., Djogo, T., Kryzskaya, D., Bourque,
C.W., and Kokoeva, M.V. (2013b) Evidence for NG2-glia derived, adult-born
functional neurons in the hypothalamus. PLoS One 8, e78236.
Rodriguez, E.M., Blazquez, J.L., Pastor, F.E., Pelaez, B., Pena, P., Peruzzo, B., and
Amat, P. (2005) Hypothalamic tanycytes: a key component of brain-endocrine
interaction. Int Rev Cytol 247, 89-164.
Rodriguez, E.M., Gonzalez, C.B., and Delannoy, L. (1979) Cellular organization of the
lateral and postinfundibular regions of the median eminence in the rat. Cell Tissue
Res 201, 377-408.
Rose, C.R. and Ransom, B.R. (1996) Intracellular sodium homeostasis in rat
hippocampal astrocytes. J Physiol 491 ( Pt 2), 291-305.
Rose, C.R. and Ransom, B.R. (1997) Gap junctions equalize intracellular Na+
concentration in astrocytes. Glia 20, 299-307.
DOI:10.14753/SE.2019.2208

119
Rottkamp, D.M., Rudenko, I.A., Maier, M.T., Roshanbin, S., Yulyaningsih, E., Perez,
L., Valdearcos, M., Chua, S., Koliwad, S.K., and Xu, A.W. (2015) Leptin potentiates
astrogenesis in the developing hypothalamus. Mol Metab 4, 881-889.
Rouach, N., Koulakoff, A., Abudara, V., Willecke, K., and Giaume, C. (2008)
Astroglial metabolic networks sustain hippocampal synaptic transmission. Science
322, 1551-1555.
Rutzel, H. and Schiebler, T.H. (1980) Prenatal and early postnatal development of the
glial cells in the median eminence of the rat. Cell Tissue Res 211, 117-137.
Saez, J.C., Berthoud, V.M., Branes, M.C., Martinez, A.D., and Beyer, E.C. (2003)
Plasma membrane channels formed by connexins: their regulation and functions.
Physiol Rev 83, 1359-1400.
Salgado, M., Tarifeno-Saldivia, E., Ordenes, P., Millan, C., Yanez, M.J., Llanos, P.,
Villagra, M., Elizondo-Vega, R., Martinez, F., Nualart, F., Uribe, E., and de Los
Angeles Garcia-Robles, M. (2014) Dynamic localization of glucokinase and its
regulatory protein in hypothalamic tanycytes. PLoS One 9, e94035.
Saltiel, A.R. and Kahn, C.R. (2001) Insulin signalling and the regulation of glucose and
lipid metabolism. Nature 414, 799-806.
Sayegh, A.I. (2013) The role of cholecystokinin receptors in the short-term control of
food intake. Prog Mol Biol Transl Sci 114, 277-316.
Schafer, M.K., Day, R., Cullinan, W.E., Chretien, M., Seidah, N.G., and Watson, S.J.
(1993) Gene expression of prohormone and proprotein convertases in the rat CNS: a
comparative in situ hybridization analysis. J Neurosci 13, 1258-1279.
Schmelz, S. and Naismith, J.H. (2009) Adenylate-forming enzymes. Curr Opin Struct
Biol 19, 666-671.
Schuit, F.C., Huypens, P., Heimberg, H., and Pipeleers, D.G. (2001) Glucose sensing in
pancreatic beta-cells: a model for the study of other glucose-regulated cells in gut,
pancreas, and hypothalamus. Diabetes 50, 1-11.
Schwartz, M.W., Woods, S.C., Porte, D., Jr., Seeley, R.J., and Baskin, D.G. (2000)
Central nervous system control of food intake. Nature 404, 661-671.
Semenkovich, C.F. (2006) Insulin resistance and atherosclerosis. J Clin Invest 116,
1813-1822.
Shechter, R., London, A., Kuperman, Y., Ronen, A., Rolls, A., Chen, A., and Schwartz,
M. (2013) Hypothalamic neuronal toll-like receptor 2 protects against age-induced
obesity. Sci Rep 3, 1254.
Shoelson, S.E., Lee, J., and Goldfine, A.B. (2006) Inflammation and insulin resistance.
J Clin Invest 116, 1793-1801.
Shukla, C., Britton, S.L., Koch, L.G., and Novak, C.M. (2012) Region-specific
differences in brain melanocortin receptors in rats of the lean phenotype. Neuroreport
23, 596-600.
Smart, J.L. and Low, M.J. (2003) Lack of proopiomelanocortin peptides results in
obesity and defective adrenal function but normal melanocyte pigmentation in the
murine C57BL/6 genetic background. Ann N Y Acad Sci 994, 202-210.
DOI:10.14753/SE.2019.2208

120
Smith, G.M. and Shine, H.D. (1992) Immunofluorescent labeling of tight junctions in
the rat brain and spinal cord. Int J Dev Neurosci 10, 387-392.
Smith, G.P., Gibbs, J., Jerome, C., Pi-Sunyer, F.X., Kissileff, H.R., and Thornton, J.
(1981) The satiety effect of cholecystokinin: a progress report. Peptides 2 Suppl 2,
57-59.
Stengel, A. and Tache, Y. (2011) Interaction between gastric and upper small intestinal
hormones in the regulation of hunger and satiety: ghrelin and cholecystokinin take
the central stage. Curr Protein Pept Sci 12, 293-304.
Stewart, W.W. (1981) Lucifer dyes--highly fluorescent dyes for biological tracing.
Nature 292, 17-21.
Stuber, G.D. and Wise, R.A. (2016) Lateral hypothalamic circuits for feeding and
reward. Nat Neurosci 19, 198-205.
Szalay, G., Martinecz, B., Lenart, N., Kornyei, Z., Orsolits, B., Judak, L., Csaszar, E.,
Fekete, R., West, B.L., Katona, G., Rozsa, B., and Denes, A. (2016) Microglia
protect against brain injury and their selective elimination dysregulates neuronal
network activity after stroke. Nature Communications 7.
Szilvasy-Szabo, A., Varga, E., Beliczai, Z., Lechan, R.M., and Fekete, C. (2017)
Localization of connexin 43 gap junctions and hemichannels in tanycytes of adult
mice. Brain Res 1673, 64-71.
Takahashi, K.A. and Cone, R.D. (2005) Fasting induces a large, leptin-dependent
increase in the intrinsic action potential frequency of orexigenic arcuate nucleus
neuropeptide Y/Agouti-related protein neurons. Endocrinology 146, 1043-1047.
Tang-Christensen, M., Larsen, P.J., Goke, R., Fink-Jensen, A., Jessop, D.S., Moller, M.,
and Sheikh, S.P. (1996) Central administration of GLP-1-(7-36) amide inhibits food
and water intake in rats. Am J Physiol 271, R848-856.
Tatemoto, K. (1982) Isolation and characterization of peptide YY (PYY), a candidate
gut hormone that inhibits pancreatic exocrine secretion. Proc Natl Acad Sci U S A
79, 2514-2518.
Tatro, J.B. (1990) Melanotropin receptors in the brain are differentially distributed and
recognize both corticotropin and alpha-melanocyte stimulating hormone. Brain Res
536, 124-132.
Thaler, F., Varasi, M., Carenzi, G., Colombo, A., Abate, A., Bigogno, C., Boggio, R.,
Carrara, S., Cataudella, T., Dal Zuffo, R., Reali, V., Vultaggio, S., Dondio, G.,
Gagliardi, S., Minucci, S., and Mercurio, C. (2012a) Spiro[chromane-2,4'-
piperidine]-based histone deacetylase inhibitors with improved in vivo activity.
ChemMedChem 7, 709-721.
Thaler, J.P., Yi, C.X., Schur, E.A., Guyenet, S.J., Hwang, B.H., Dietrich, M.O., Zhao,
X., Sarruf, D.A., Izgur, V., Maravilla, K.R., Nguyen, H.T., Fischer, J.D., Matsen,
M.E., Wisse, B.E., Morton, G.J., Horvath, T.L., Baskin, D.G., Tschop, M.H., and
Schwartz, M.W. (2012b) Obesity is associated with hypothalamic injury in rodents
and humans. J Clin Invest 122, 153-162.
DOI:10.14753/SE.2019.2208

121
Thaler, R., Spitzer, S., Karlic, H., Klaushofer, K., and Varga, F. (2012c) DMSO is a
strong inducer of DNA hydroxymethylation in pre-osteoblastic MC3T3-E1 cells.
Epigenetics 7, 635-651.
Thomzig, A., Laube, G., Pruss, H., and Veh, R.W. (2005) Pore-forming subunits of K-
ATP channels, Kir6.1 and Kir6.2, display prominent differences in regional and
cellular distribution in the rat brain. J Comp Neurol 484, 313-330.
Thomzig, A., Wenzel, M., Karschin, C., Eaton, M.J., Skatchkov, S.N., Karschin, A.,
and Veh, R.W. (2001) Kir6.1 is the principal pore-forming subunit of astrocyte but
not neuronal plasma membrane K-ATP channels. Mol Cell Neurosci 18, 671-690.
Tran, D.Q., Tse, E.K., Kim, M.H., and Belsham, D.D. (2016) Diet-induced cellular
neuroinflammation in the hypothalamus: Mechanistic insights from investigation of
neurons and microglia. Mol Cell Endocrinol 438, 18-26.
Tschop, M., Smiley, D.L., and Heiman, M.L. (2000) Ghrelin induces adiposity in
rodents. Nature 407, 908-913.
Tschop, M., Weyer, C., Tataranni, P.A., Devanarayan, V., Ravussin, E., and Heiman,
M.L. (2001) Circulating ghrelin levels are decreased in human obesity. Diabetes 50,
707-709.
Tschop, M.H., Speakman, J.R., Arch, J.R., Auwerx, J., Bruning, J.C., Chan, L., Eckel,
R.H., Farese, R.V., Jr., Galgani, J.E., Hambly, C., Herman, M.A., Horvath, T.L.,
Kahn, B.B., Kozma, S.C., Maratos-Flier, E., Muller, T.D., Munzberg, H., Pfluger,
P.T., Plum, L., Reitman, M.L., Rahmouni, K., Shulman, G.I., Thomas, G., Kahn,
C.R., and Ravussin, E. (2011) A guide to analysis of mouse energy metabolism. Nat
Methods 9, 57-63.
Tu, H.M., Kim, S.W., Salvatore, D., Bartha, T., Legradi, G., Larsen, P.R., and Lechan,
R.M. (1997) Regional distribution of type 2 thyroxine deiodinase messenger
ribonucleic acid in rat hypothalamus and pituitary and its regulation by thyroid
hormone. Endocrinology 138, 3359-3368.
Ullrich, A., Bell, J.R., Chen, E.Y., Herrera, R., Petruzzelli, L.M., Dull, T.J., Gray, A.,
Coussens, L., Liao, Y.C., Tsubokawa, M., and et al. (1985) Human insulin receptor
and its relationship to the tyrosine kinase family of oncogenes. Nature 313, 756-761.
Valdearcos, M., Douglass, J.D., Robblee, M.M., Dorfman, M.D., Stifler, D.R., Bennett,
M.L., Gerritse, I., Fasnacht, R., Barres, B.A., Thaler, J.P., and Koliwad, S.K. (2017)
Microglial Inflammatory Signaling Orchestrates the Hypothalamic Immune
Response to Dietary Excess and Mediates Obesity Susceptibility. Cell Metab 26,
185-197 e183.
Valdearcos, M., Robblee, M.M., Benjamin, D.I., Nomura, D.K., Xu, A.W., and
Koliwad, S.K. (2014) Microglia dictate the impact of saturated fat consumption on
hypothalamic inflammation and neuronal function. Cell Rep 9, 2124-2138.
van Houten, M., Khan, M.N., Khan, R.J., and Posner, B.I. (1981) Blood-borne
adrenocorticotropin binds specifically to the median eminence-arcuate region of the
rat hypothalamus. Endocrinology 108, 2385-2387.
Van Houten, M., Khan, M.N., Walsh, R.J., Baquiran, G.B., Renaud, L.P., Bourque, C.,
Sgro, S., Gauthier, S., Chretien, M., and Posner, B.I. (1985) NH2-terminal specificity
DOI:10.14753/SE.2019.2208

122
and axonal localization of adrenocorticotropin binding sites in rat median eminence.
Proc Natl Acad Sci U S A 82, 1271-1275.
Vauthier, V., Derviaux, C., Douayry, N., Roux, T., Trinquet, E., Jockers, R., and Dam,
J. (2013) Design and validation of a homogeneous time-resolved fluorescence-based
leptin receptor binding assay. Anal Biochem 436, 1-9.
Vong, L., Ye, C., Yang, Z., Choi, B., Chua, S., Jr., and Lowell, B.B. (2011) Leptin
action on GABAergic neurons prevents obesity and reduces inhibitory tone to POMC
neurons. Neuron 71, 142-154.
Wang, H., Storlien, L.H., and Huang, X.F. (2002a) Effects of dietary fat types on body
fatness, leptin, and ARC leptin receptor, NPY, and AgRP mRNA expression. Am J
Physiol Endocrinol Metab 282, E1352-1359.
Wang, L., Saint-Pierre, D.H., and Tache, Y. (2002b) Peripheral ghrelin selectively
increases Fos expression in neuropeptide Y - synthesizing neurons in mouse
hypothalamic arcuate nucleus. Neurosci Lett 325, 47-51.
Wierup, N., Richards, W.G., Bannon, A.W., Kuhar, M.J., Ahren, B., and Sundler, F.
(2005) CART knock out mice have impaired insulin secretion and glucose
intolerance, altered beta cell morphology and increased body weight. Regul Pept
129, 203-211.
Willesen, M.G., Kristensen, P., and Romer, J. (1999) Co-localization of growth
hormone secretagogue receptor and NPY mRNA in the arcuate nucleus of the rat.
Neuroendocrinology 70, 306-316.
Wittmann, G., Farkas, E., Szilvasy-Szabo, A., Gereben, B., Fekete, C., and Lechan,
R.M. (2017) Variable proopiomelanocortin expression in tanycytes of the adult rat
hypothalamus and pituitary stalk. J Comp Neurol 525, 411-441.
Wittmann, G., Hrabovszky, E., and Lechan, R.M. (2013) Distinct glutamatergic and
GABAergic subsets of hypothalamic pro-opiomelanocortin neurons revealed by in
situ hybridization in male rats and mice. J Comp Neurol 521, 3287-3302.
Wittmann, G., Mohacsik, P., Balkhi, M.Y., Gereben, B., and Lechan, R.M. (2015)
Endotoxin-induced inflammation down-regulates L-type amino acid transporter 1
(LAT1) expression at the blood-brain barrier of male rats and mice. Fluids Barriers
CNS 12, 21.
Woods, S.C. (2013) Metabolic signals and food intake. Forty years of progress.
Appetite 71, 440-444.
Woods, S.C., Lotter, E.C., McKay, L.D., and Porte, D., Jr. (1979) Chronic
intracerebroventricular infusion of insulin reduces food intake and body weight of
baboons. Nature 282, 503-505.
Wren, A.M., Seal, L.J., Cohen, M.A., Brynes, A.E., Frost, G.S., Murphy, K.G., Dhillo,
W.S., Ghatei, M.A., and Bloom, S.R. (2001) Ghrelin enhances appetite and increases
food intake in humans. J Clin Endocrinol Metab 86, 5992.
Wu, Q. and Palmiter, R.D. (2011) GABAergic signaling by AgRP neurons prevents
anorexia via a melanocortin-independent mechanism. Eur J Pharmacol 660, 21-27.
DOI:10.14753/SE.2019.2208

123
Xu, Y., Tamamaki, N., Noda, T., Kimura, K., Itokazu, Y., Matsumoto, N., Dezawa, M.,
and Ide, C. (2005) Neurogenesis in the ependymal layer of the adult rat 3rd ventricle.
Exp Neurol 192, 251-264.
Yaswen, L., Diehl, N., Brennan, M.B., and Hochgeschwender, U. (1999) Obesity in the
mouse model of pro-opiomelanocortin deficiency responds to peripheral
melanocortin. Nat Med 5, 1066-1070.
Young, A.A. (2012) Brainstem sensing of meal-related signals in energy homeostasis.
Neuropharmacology 63, 31-45.
Zaborszky, L. and Schiebler, T.H. (1978) [Glia of median eminence. Electron
microscopic studies of normal, adrenalectomized and castrated rats ]. Z Mikrosk
Anat Forsch 92, 781-799.
Zhang, K. and Kaufman, R.J. (2008) From endoplasmic-reticulum stress to the
inflammatory response. Nature 454, 455-462.
Zhang, X., Zhang, G., Zhang, H., Karin, M., Bai, H., and Cai, D. (2008) Hypothalamic
IKKbeta/NF-kappaB and ER stress link overnutrition to energy imbalance and
obesity. Cell 135, 61-73.
Zhang, Y., Proenca, R., Maffei, M., Barone, M., Leopold, L., and Friedman, J.M.
(1994) Positional cloning of the mouse obese gene and its human homologue. Nature
372, 425-432.
Zhou, Y. and Rui, L. (2013) Leptin signaling and leptin resistance. Front Med 7, 207-
222.
DOI:10.14753/SE.2019.2208

124
10. List of publications
10.1. List of publications the thesis is based on
Szilvásy-Szabó A, Varga E, Beliczai Z, Lechan RM, Fekete C. (2017) Localization of
connexin 43 gap junctions and hemichannels in tanycytes of adult mice. Brain
Research, 1673:64-71.
Wittmann G, Farkas E, Szilvásy-Szabó A, Gereben B, Fekete C, Lechan RM. (2016)
Variable proopiomelanocortin expression in tanycytes of the adult rat hypothalamus and
pituitary stalk. J Comp Neurol, 525:411-441
10.2. Other publications
Kalló I, Vida B, Bardóczi Z, Szilvásy-Szabó A, Rabi F, Molnár T, Farkas I, Caraty A,
Mikkelsen J, Coen CW, Hrabovszky E, Liposits Z. (2013) Gonadotropin-releasing
hormone neurones innervate kisspeptin neurones in the female mouse brain.
Neuroendocrinology, 98(4):281-289.
Mohácsik P, Füzesi T, Doleschall M, Szilvásy-Szabó A, Vancamp P, Hadadi É, Darras
VM, Fekete C, Gereben B. (2016). Increased thyroid hormone activation accompanies
the formation of thyroid hormone-dependent negative feedback in developing chicken
hypothalamus. Endocrinology, 157:1211-1221.
Zséli G, Vida B, Szilvásy-Szabó A, Tóth M, Lechan RM, Fekete C. (2017) Neuronal
connections of the central amygdalar nucleus with refeeding-activated brain areas in
rats. Brain Struct Funct, 223(1):391-414
DOI:10.14753/SE.2019.2208

125
11. Acknowledgements
First of all I would like to express my sincere thanks to my tutor, Dr. Csaba Fekete,
who greatly supported my improvement, expanded my perspective by sharing his wide
knowledge and technical skills and provided a balanced workplace in his laboratory.
I am grateful to Dr. Balázs Gereben for his constructive recommendations and valuable
technical support.
I also thank to Professor Zsolt Liposits, Head of the Department of Endocrine
Neurobiology for his useful critiques of my research work.
I would like to express my great appreciation to the members of my previous group:
Zsuzsanna Bardóczi, Dr. Imre Kalló, Barna László and Dr. Barbara Vida, who have
launched me on the way of scientific research.
I would like to thank my closest colleagues, Edina and Zizi and the past and present
members of the Lendület Laboratory of Integrative Neurobiology: Dr. Andrea Kádár,
Balázs Kovács, Dóra Kővári, Dr. Zoltán Péterfi, Judit Szabon, Dr. Mónika Tóth,
Alexandra Venczel, Dr. Gábor Wittmann, Dr. Györgyi Zséli, who provided cooperation
and friendly atmosphere and who I acquired several skills from.
I wish to thank the past and present members of the Molecular Cell Metabolism
Laboratory: Dr. Péter Egri, Dr. Petra Mohácsik, Dorottya Németh, Richárd Sinkó for
their help in molecular techniques. I am particularly grateful for the assistance given by
the technicians of the two groups, Ágnes Simon and Andrea Juhász.
I also wish to thank all members of the Laboratories of Endocrine Neurobiology and
Reproductive Neurobiology: Flóra Bálint, Veronika Csillag, Dr. Imre Farkas, Balázs
Götz, Dr. Erik Hrabovszky, Dr. Miklós Sárvári, Dr. Katalin Skrapits, Dr. Szabolcs
Takács, Márta Turek, Dr. Csaba Vastagh.
I would also like to extend my thanks to my friends inside and outside the Institute, who
supported my work and sometimes reminded me of taking a break.
Most importantly, I wish to thank my beloved family, my parents and my sister, who
always encouraged me and supported my studies. And of course, my loving husband,
András, the most patient, who I can count on under all circumstances.
DOI:10.14753/SE.2019.2208