the role of the intrinsic cardiac nervous system in cardiac electrophysiology and disease€¦ ·...
TRANSCRIPT

THE ROLE OF THE INTRINSIC CARDIAC
NERVOUS SYSTEM IN CARDIAC
ELECTROPHYSIOLOGY AND DISEASE
Thesis submitted for the degree of Doctor of Philosophy
at the University of Leicester
by
Emily Wake BSc (Hons)
Department of Cardiovascular Sciences
University of Leicester
May 2017

ii
Abstract
The role of the intrinsic cardiac nervous system in cardiac physiology and disease
Emily Wake
It is well recognised that the complex neuronal hierarchy of the autonomic nervous system is important in the pathology of heart disease. In addition to the peripheral autonomic nerves, there is a dense network of intrinsic cardiac ganglia located at the level of the heart and acting as the final stage in the autonomic regulation of cardiac function. Understanding the role of this network in cardiac function could prove vital in understanding heart disease.
The aims of this study were to characterise the topography and neurochemical phenotype of the rabbit intrinsic cardiac nervous system (ICNS) as well as to investigate the functional effects of electrical stimulation of intrinsic cardiac ganglia on the sinus and AV nodes. A coronary artery ligation heart failure model was used to examine the effects of myocardial infarction (MI) and heart failure (HF) on both the topography of the ICNS and the functional role of the ICNS.
Histochemical staining revealed an intricate network of nerves and ganglia located primarily on the heart hilum. Significant neuronal remodelling was evident following MI, with the enlargement of somata within ganglia that are known to preferentially innervate the ventricles. Heart rate changes occurred primarily as a result of stimulation of ganglia within the right atrial (RA) and right neuronal cluster (RNC) regions. MI resulted in exaggerated bradycardic responses during stimulation of the RA and RNC regions, accompanied by a significant increase in tachycardia responses during stimulation of ganglia within the RA and RNC.
In conclusion, it is becoming increasingly evident that the ICNS is a key network in the cardiac neuronal hierarchy. The ability of the ICNS to function both in normal physiology and also to adapt following MI and HF suggests that the ICNS could be a significant potential therapeutic target for the prevention and treatment of cardiac disease.

iii
Acknowledgements
First and foremost, I would like to thank my supervisors Professor G André Ng and Dr
Richard Rainbow for their continued support and for their expertise, advice and
guidance throughout. My thanks also go to Dr Kieran Brack for providing me with the
opportunity to undertake this PhD and for his expertise and insight in guiding the
direction of my PhD and for teaching me invaluable laboratory skills.
I would also like to extend my appreciation to all of the staff at the Division of Biomedical
Services and in particular to Deborah Bursnall and Lucy Onions for all of their help with
surgical procedures and for their advice and support ensuring the best possible care for
the animals involved. Many thanks also go to Dr Michael Kelly and Justyna Janus for
their assistance and perseverance with preclinical imaging and also to the Department
of Cardiovascular Sciences at the University of Leicester and to the British Heart
Foundation for providing me the foundation and funding to complete this PhD.
Many thanks go to Professor Blair Grubb for all of his advice at the beginning of this
project and in particular for his assistance in teaching me the techniques required for
immunohistochemistry. I would also like to thank past and present members of
Professor Ng’s research group, without whom this project would not have been possible.
Thanks go to Pott Pongpaopattanakul, Reshma Chauhan and also Dr Gabriella Kocsis-
Fodor for their invaluable help and advice during experiments, for their assistance in
surgical procedures and for being a great support throughout my PhD.
Lastly, my warmest thanks go to my family for their love and support and to Luke, for
his constant encouragement and for always believing in me.
iv
Contents
Title i
Abstract ii
Acknowledgments iii
Contents iv
Publications ix
Abbreviations x
Chapter 1: Introduction
1.1 Cardiac function 1
1.2 Cardiac electrophysiology 1
1.2.1 The sinoatrial node action potential 2
1.2.2 The ventricular cardiac action potential 4
1.2.3 Excitation-contraction coupling 8
1.3 Neuronal control of the heart 10
1.3.1 Autonomic control of the heart 13
1.3.1.1 Autonomic cardiac neurons 13
1.3.1.2 Mechanisms of autonomic modulation 15
1.3.1.2.1 Acetylcholine 15
1.3.1.2.2 The physiological effects of acetylcholine acting on M2
muscarinic receptors 16
1.3.1.2.3 Noradrenaline 17
1.3.1.2.4 The physiological effects of adrenergic receptor activation 18
1.3.1.3 Cardiac neuromodulators and neuropeptides 21
1.3.1.3.1 Nitric oxide and neuronal nitric oxide synthase 21
1.3.1.3.2 Additional neuronal modulators 25
1.4 The intrinsic cardiac nervous system 27
1.4.1 The human intrinsic cardiac nervous system 29
1.4.2 The intrinsic cardiac nervous system in experimental mammalian species 35
1.4.3 The morphology of the rabbit intrinsic cardiac nervous system 39

v
1.4.4 Neurochemical phenotype of the ICNS 42
1.5 Autonomic control of cardiac electrophysiology: from peripheral control to the intrinsic cardiac nervous system 47
1.5.1 Peripheral neuronal inputs to the heart 47
1.5.2 The role of the ICNS in cardiac electrophysiology 49
1.6 The clinical relevance of studying the autonomic nervous control of the heart 53
1.6.1 Myocardial infarction and heart failure 53
1.6.2 The effects of myocardial infarction and heart failure on the ICNS 54
1.6.2 Cardiac arrhythmia and the ICNS 58
1.7 Aims 61
Chapter 2: Materials and Methods
2.1 Experimental animals 63
2.1.1 Ethical statement 63
2.2 Coronary artery ligation in the rabbit: a model of heart failure 65
2.2.1 Echocardiography and ex-vivo MRI 67
2.2.2 MRI and imaging processing 68
2.2.3 Organ retrieval and cardiac remodelling 69
2.3 The anatomy and morphology of the rabbit intrinsic cardiac nervous system 70
2.3.1. Non-sectioned pressure-distended heart preparation 70
2.3.2 Whole mount preparation 71
2.3.3 Brightfield microscopy 74
2.4 Whole-mount preparation for immunohistochemistry 74
2.4.1 Fluorescence microscopy 75
2.5 Statistical analysis 75
2.6 Investigating the role of the intrinsic cardiac nervous system on cardiac electrophysiology 77
2.6.1 Isolation of the Langendorff heart preparation 77
2.6.2 Langendorff perfusion 77
2.6.3 Electrical stimulation of intrinsic cardiac ganglionic plexuses 80
2.6.3.1 Experimental protocols for the electrical stimulation of intrinsic cardiac ganglia 82

vi
2.6.3.2 Cardiac constant pacing 82
2.6.4 Pharmacological agents 82
2.6.5 Signal measurements and data analysis 82
2.7 Investigating the interaction between the rabbit ICNS and peripheral autonomic nerves 84
2.7.1 Isolated innervated heart preparation 84
2.7.2 Perfusion and mounting of the preparation 86
2.7.3 Signal measurements 89
2.7.4 Nerve stimulation protocols 89
2.7.4.1 Electrical stimulation protocols 89
2.7.5 Data analysis 90
Chapter 3: Heart failure in the rabbit
3.1 Introduction 91
3.2 Results 92
3.2.1 Cardiac Dysfunction 92
3.2.2 Organ Congestion 92
3.2.3 Cardiac Remodelling 96
3.2.4 MRI and lesion volume in the intact excised heart 98
3.3 Discussion 101
Chapter 4: The effects of heart failure on the anatomy and morphology of the rabbit intrinsic cardiac nervous system
4.1 Introduction 102
4.2 Results 104
4.2.1 Distribution of intrinsic cardiac neurons in the whole rabbit heart 104
4.2.2 Heart failure and the overall distribution of intrinsic cardiac neurons in the whole rabbit heart 107
4.2.2.1 Quantification of rabbit intrinsic cardiac ganglia and the effect of heart failure 108
4.2.3 Distribution of immunohistochemically distinct intrinsic cardiac ganglia and neurons 117
4.3 Discussion 123
4.3.1 Distribution of intrinsic cardiac neurons in the whole rabbit heart 123
4.3.2 The effects of heart failure on the morphology of the rabbit ICNS 125

vii
4.3.3 The immunohistochemical profile of the rabbit ICNS in healthy
rabbits 128
Chapter 5: The functional role of intrinsic cardiac ganglia in the rabbit
5.1 Introduction 132
5.2 Results 134
5.2.1 The effects of electrical stimulation of cardiac intrinsic ganglionated plexuses 134
5.2.1.1 Chronotropic responses to electrical stimulation of intrinsic cardiac ganglia 135
5.2.1.2 Left ventricular pressure and monophasic action potential duration changes 140
5.3 The functional role of the ICNS following MI 142
5.3.1 Chronotropic responses to electrical stimulation of intrinsic cardiac ganglia following MI 142
5.3.2 Left ventricular pressure and monophasic action potential duration changes in the heart failure and sham operated groups 147
5.4 Dromotropic responses to electrical stimulation of intrinsic cardiac ganglia 150
5.5 The effects of heart failure on dromotropic responses to electrical stimulation of intrinsic cardiac ganglia 153
5.6 The effects of pharmacological agents on cardiac responses of electrical stimulation of intrinsic cardiac ganglia 157
5.7 Discussion 159
5.7.1 The effects of electrical stimulation of intrinsic cardiac ganglia on cardiac function 159
5.7.2 The effects of heart failure on the functional role of the ICNS 163
Chapter 6: The interaction between peripheral neuronal inputs and the ICNS
6.1 Introduction 167
6.2 Results 169
6.2.1 Heart rate response characteristics of vagal nerve stimulation 169
6.2.2 The effects of peripheral and intrinsic cardiac stimulation on cardiac chronotropy 172
6.2.3 The effects of peripheral and intrinsic cardiac stimulation on cardiac dromotropy 175

viii
6.2.4 Pharmacological blockade of vagal and ICNS responses to electrical stimulation 177
6.3 Discussion 180
Chapter 7: Concluding remarks 185
Chapter 8: Bibliography 190

ix
Publications
In addition to the work presented in this thesis, I have been first author in a publication reviewing the anatomical and physiological characteristics that define the intrinsic cardiac nervous system.
Wake E, Brack KE. Characterization of the intrinsic cardiac nervous system. Auton Neurosci. 2016 S1566-0702 (16); 30129-1. doi: 10.1016/j.autneu.2016.08.006.
Abstracts
Physiological Society Meeting, Dublin, Ireland, July 2016
Wake E, Chin SH, Brack KE, Ng GA. The neurocardiological effects of autonomic nerve stimulation in a rabbit model of heart failure. Physiology 2016; Poster communication.
Chauhan RA, Coote JH, Wake E, Brack KE, Ng GA. Differential effects from left and right sympathetic nerve stimulation on ventricular electrophysiology and arrhythmia inducibility. Physiology 2016; Poster communication.
Pongpaopattanakul P, Wake E, Kocsis-Fodor GO, Brack KE, Ng GA. Low-level vagus nerve stimulation protects against ventricular arrhythmias in the isolated innervated rabbit heart. Physiology 2016; Poster communication.
3Rs Seminar: Promoting the 3Rs initiatives at University of Leicester, March 2016
Brack KE, Wake E, Chin SH, Ng GA. Refinements in the coronary artery ligation model of heart failure (HF) in the rabbit. University of Leicester.
European Society of Cardiology Meeting, Europace, Milan, Italy, June 2015
Chin SH, Wake E, Brack KE, Ng GA. The Effect of Sympatho-vagal Interaction and Beta-blocker on Heart Rate and Ventricular Refractoriness in Isolated Rabbit Hearts. Europace 2015; 17(suppl 3): iii30-iii55 (doi:http://dx.doi.org/10.1093/europace/euv156)
Chin SH, Wake E, Brack KE, Ng GA. The Effect of Beta-blocker in Modulating Ventricular Fibrillation Inducibility and Electrical Restitution during Sympatho-vagal Interaction in Isolated Rabbit Hearts. Europace 2015; 17(suppl 3): iii237-iii259 (doi:http://dx.doi.org/10.1093/europace/euv182)
Chin SH, Wake E, Brack KE, Ng GA. Modulation of Ventricular Fibrillation Inducibility and Electrical Restitution during Sympatho-vagal Interaction by Beta-Blocker in Isolated Rabbit Hearts. Heart Rhythm 2015; 12(5): S409(doi:http://dx.doi.org/10.1016/j.hrthm.2015.03.052) Physiological Society Meeting, London, UK, July 2014 Monaghan A, Brack KE, Mitcheson J, Wake E, Ng GA. Electrophysiological effects of pharmacologically induced Long QT Syndrome 1 & 2. Physiology 2014 (London, UK) (2014) Proc Physiol Soc 31, PCA023.
Zhang C, Brack KE, Wake E, Ng GA. Effects of ivabradine on the ventricle in isolated guinea pig hearts. Physiology 2014 (London, UK) (2014) Proc Physiol Soc 31, PCA026.
x
Abbreviations
AC Adenylyl cyclase ACh Acetylcholine AChE Acetylcholinesterase AF Atrial fibrillation Ao Aortic root AP Action potential APD Action potential duration ARGP Anterior right ganglionic plexus ATP Adenosine triphosphate AV node Atrioventricular node BRS Baroreceptor stimulation CA Conus arteriosus Ca2+ Calcium ion cAMP Cyclic adenosine monophosphate cGMP Cyclic guanosine monophosphate CGRP Calcitonin gene-related peptide ChAT Choline acetyltransferase CICR Calcium-induced calcium release CS Coronary sinus CV Caudal vein DMV Dorsal motor nucleus of the vagus DRA Dorsal right atrial subplexus DRG Dorsal root ganglia ECC Excitation-contraction coupling ECG Electrocardiogram EDV End diastolic volume EF Ejection fraction ERP Effective refractory period ES Electrical stimulation ESV End systolic volume GalR1 Galanin receptor GC Guanylate cyclase GDP Guanosine diphosphate Gi/Go Inhibitory pertussis toxin sensitive G-protein GP Ganglionic plexus Gs Stimulatory G-protein GTP Guanosine triphosphate HF Heart failure HR Heart rate ICa Calcium current ICG Intrinsic cardiac ganglia ICN Intrinsic cardiac neuron ICNS Intrinsic cardiac nervous system IK1 Inward rectifier potassium current IKACH Inwardly rectifying ACh sensitive potassium channels IKR Delayed outward rectifier potassium current, rapid

xi
IKS Delayed outward rectifier potassium current, slow INa Inward sodium current IR Immunoreactivity IRGP Inferior right ganglionic plexus ITO Transient outward potassium current IVC Inferior vena cava IVC-ILA GP Inferior vena cava-inferior left atrial ganglionic plexus K+ Potassium ion LA Left atrium LAu Left auricle LC Left coronary subplexus LCV Left cranial vein LD Left dorsal subplexus LNC Left neuronal cluster LPV Left pulmonary vein LTCC L-type calcium channel LV Left ventricle LVS Left vagus stimulation LVEF Left ventricular ejection fraction mAChR Muscarinic acetylcholine receptor MAP Monophasic action potential MAPD MAP duration MD Middle dorsal subplexus MI Myocardial infarction MPV Middle pulmonary vein NA Noradenaline Na+
Sodium ion [Na+] Sodium ion concentration nAChR Nicotinic acetylcholine receptor NCX Sodium/calcium exchanger NGF Nerve growth factor NO Nitric oxide NOS Nitric oxide synthase NPY Neuropeptide Y PA Pulmonary artery PAGP Posterior atrial ganglionic plexus PB Phosphate buffer PBS Phosphate buffered saline PDE Phosphodiesterase PFA Paraformaldehyde PGP9.5 Protein gene product 9.5 PKA Protein kinase A PKC Protein kinase C PKG Protein kinase G PLB Phospholamban PS Parasympathetic PT Pulmonary trunk
xii
PV Pulmonary vein PVCV Pulmonary vein-caudal vein PVI Pulmonary vein isolation RA Right atrium RAGP Right atrial ganglionic plexus RAu Right auricle RC Right coronary subplexus RCV Right cranial vein RNC Right neuronal cluster RPV Right pulmonary vein RSPV Right superior pulmonary vein RV Right ventricle RVS Right vagus stimulation RyR Ryanodine receptor SA Node Sinoatrial node SERCA Sarcoplasmic/endoplasmic reticulum calcium ATPase sGC Soluble guanylate cyclase SLGP Superior left ganglionic plexus SNS Sympathetic nervous system SR Sarcoplasmic reticulum SCD Sudden cardiac death SIF Small intensely fluorescent SVC Superior vena cava TH Tyrosine hyroxylase TnC Troponin C TnI Troponin I TnT Troponin T VF Ventricular fibrillation VFT Ventricular fibrillation threshold VIP Vasoactive intestinal peptide VIV-GP Ventral interventricular ganglionic plexus VLA Ventral left atrial subplexus VNS Vagus nerve stimulation VRA Ventral right atrial subplexus

1
Chapter 1: Introduction
Cardiovascular disease remains an unresolved clinical problem, with increasing pressure
being put on the research community to provide prophylactic treatments to control
disease. It is well recognised that dysfunction in the autonomic neuronal control of the
heart is associated with the development of cardiac disease pathology. Abnormalities in
the activity of the autonomic nervous system can have significant repercussions in the
development of congestive heart failure and life-threatening arrhythmias, which can
ultimately result in sudden cardiac death (SCD).
1.1 Cardiac function
The heart is a major organ responsible for the continuous circulation of blood around
the body. It is separated into two functional components; the pulmonary and the
systemic circulation, with the heart being the pump through which blood passes. The
systemic circulatory system collects deoxygenated blood from around the body and
drives it to the heart. The deoxygenated blood is then pumped to the lungs by the
pulmonary circulatory system for gaseous exchange of carbon dioxide and oxygen. The
systemic circulatory system carries the oxygenated blood around the body and on return
to the heart, the now deoxygenated blood is propelled back to the lungs.
The heart is separated into left and right sides, which control the systemic and
pulmonary circulation respectively, with both sides having a thinner walled atrial
chamber acting as a reservoir and a ventricular unit. Blood pumped from the atria into
the muscular ventricles is forcefully ejected to either the lungs or the rest of the body,
with valves throughout preventing bidirectional flow. The heart generates its
mechanistic actions via an electrical conduction system with the co-ordinated
propagation of electrical activity in the form of action potentials (AP) enabling the
efficient contraction of the heart.
1.2 Cardiac electrophysiology
The cardiac cycle is initiated by electrical signals produced at the sinoatrial node (SA
node); a small area located in the right atrium known as the intrinsic cardiac pacemaker,
and is transmitted as a precise wave of excitation through specific routes. This wave of
electricity is propagated across the right, then the left atrium to initiate atrial

2
contraction and ultimately reaches the atrioventricular node (AV node). Following a
short delay period to allow the atria to contract, this wave is transmitted down the
ventricles along the Bundle of His, further diverging along the purkinje fibres to
stimulate a synchronous contraction of both ventricles. Any disruption to any part of the
conduction system can result in cardiac arrhythmia.
1.2.1 The sinoatrial node action potential
In the adult human heart under normal physiological conditions, the SA node is the
dominant structure of the cardiac conduction system due to having the highest rate of
spontaneous depolarisation and is therefore responsible for generating pacemaker
activity. The SA node is a heterogeneous collection of specialised myocytes that
collectively act as the pacemaker for the initiation of the normal heart beat during sinus
rhythm. The automaticity with which cells within the SA node act depends on a specific
electrophysiological profile and the movement of particular ions. In order for a SA nodal
cell to generate an electrical signal, the membrane potential of the cell needs to slowly
depolarise until a specific threshold voltage is reached. SA nodal cells are characterised
as lacking a true stable resting potential, primarily due to the lack of the inward rectifier
K+ channel, IK1. In addition, the depolarising current in SA nodal cells occurs due to the
movement of Ca2+ as opposed to Na+, which is the primary ion involved in depolarisation
in other non-pacemaker action potentials produced by atrial and ventricular cells which
will be described later.
The action potential of SA nodal cells is divided into three phases; phases 4, 0 and 3
(figure 1.1).
Phase 4: spontaneous membrane depolarisation that triggers the action potential when
the threshold voltage is reached (between -40 and -30mV).
Phase 0: the depolarisation phase of the SA node action potential.
Phase 3: the repolarisation phase bought about by the movement of K+.

3
Figure 1.1. The sinoatrial node action potential. An example trace of the action
potential of a SA nodal cell. Spontaneous membrane depolarisation occurs during phase
4, with further rapid depolarisation due to movement of Ca2+ being initiated once the
threshold voltage is reached. Phase 3 or the repolarisation phase ensues due to the
movement of K+. Image modified from Feher (2012).
4
0 3

4
At very negative membrane potentials (approximately -60mV) ion channels open
allowing the conductance of slow depolarising Na+ currents. During this diastolic
depolarisation, one of the most important currents is the “funny current” or If. This
current, first discovered in 1979 (Brown et al., 1979), allows the influx of Na+ via
hyperpolarisation-activated and cyclic nucleotide-gated channels (HCN channels), which
open in response to membrane hyperpolarisation hence why this current is referred to
as the “funny current”. The influx of Na+ causes the membrane to spontaneous
depolarisation and the initiation of phase 4. Subsequently, the membrane potential
increases to reach -50mV, triggering the opening of transient of T-type Ca2+ channels
and the movement of Ca2+ into the cell, causing further depolarisation. As the membrane
potential reaches around -40mV, long lasting or L-type Ca2+ channels including Cav1.3
open, resulting in depolarisation. In addition to the opening of Na+ and Ca2+ channels,
there is a slow decline in the outward movement of K+ following on from phase 3. Upon
reaching the membrane potential threshold, rapid depolarisation occurs primarily
because of the increased movement of Ca2+ through the L-type Ca2+ channels seen as
the upstroke of phase 0. The slope of this upstroke is less steep in comparison to that of
other cardiac cells due to the relatively slower movement of Ca2+ and the lack of large
Na+ currents, which will be described later. Repolarisation of the membrane (phase 3 of
the action potential) occurs due to an increase in K+ permeability and the opening of
voltage-gated K+ channels. This increase in K+ movement, accompanied by the
inactivation and closure of the L-type Ca2+ channels and therefore a reduction in the
inward depolarising currents, leads to hyperpolarisation of the cell.
1.2.2 The ventricular cardiac action potential
In order for the heart to mechanically contract, electrical activation is required. This
comes in the form of the cardiac action potential, which once generated indicates the
start of the excitation-contraction coupling (ECC) process. In order for the heart to
contract in a synchronous manner, the rapid conduction of action potentials is required.
As mentioned, action potentials originate in the pacemaker cells of the SA node,
propagating excitation from myocyte to myocyte through the heart to the ventricles.
The structure of the AP differs depending on the location of the cell across the heart.
The shape of an AP implies a distinct and separate function of the cell propagating it.

5
The AP produced by the cells of the SA and AV nodes is the foundation for a spontaneous
impulse generation compared to the APs seen with atrial and ventricular cells, whose
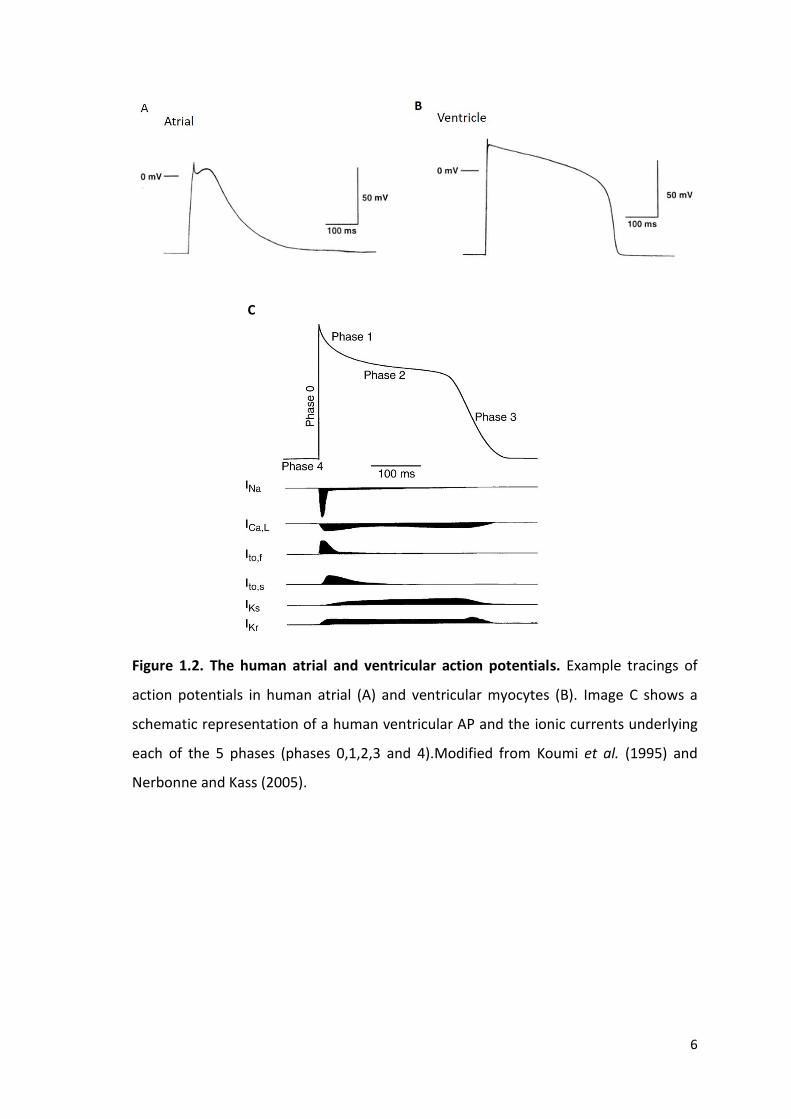
purpose are to enable contraction. The more prominent plateau phase evident with the
ventricular AP is caused by a delay in repolarisation and a maintained depolarisation,
with this longer action potential duration (APD) preventing re-excitation of the cell and
allowing for relaxation before the next stimuli (figure 1.2).
ECC is the cellular process by which a heartbeat occurs, enabling synchrony between
electrical and mechanical function of the heart (Bers, 2006). APs that are passed via the
conduction system, propagate excitation between myocytes via the selective
permeability of sodium ion (Na+), potassium ion (K+) and calcium ion (Ca2+) channels that
are distributed on the cell membrane. The configuration of the ventricular action
potential is divided in to 5 phases; phase 0-4 (figure 1.2).
Phase 4: the membrane potential is in the ‘rest’ phase prior to the generation of an AP.
This phase is maintained by the inward rectifier current, IK1, and in this phase the
cardiomyocyte membrane is preferentially permeable to K+.
Phase 0: membrane depolarisation initiated by an AP triggers the opening of rapidly
activating voltage-gated Na+ channels, NaV1.5, increasing the cells permeability to Na+
and a rapid inward Na+ current (INa) resulting in the upward stroke of the AP.
Phase 1: the early repolarisation phase governed by the closure of the Na+ channels and
activation of the transient outward potassium current (ITO).
Phase 2: during the plateau phase, where there is little change in the membrane
potential, an influx of Ca2+ through voltage gated L-type Ca2+ channels (LTCC) occurs.
This entry of calcium plays a crucial role in ECC and the initiation of contraction.
Phase 3: a decline in LTCC activation and an increase in K+ conductance governed by
repolarising K+ currents (the rapid delayed rectifier potassium current (IKR) and slow
delayed rectifier potassium current (IKS)), which leads to the late/rapid depolarisation
phase.
6
Figure 1.2. The human atrial and ventricular action potentials. Example tracings of
action potentials in human atrial (A) and ventricular myocytes (B). Image C shows a
schematic representation of a human ventricular AP and the ionic currents underlying
each of the 5 phases (phases 0,1,2,3 and 4).Modified from Koumi et al. (1995) and
Nerbonne and Kass (2005).
C

7
The ventricular AP (figure 1.2) is characteristically represented by a steady state resting
membrane potential of around -90mV, termed phase 4. The current responsible for
establishing the resting membrane potential is the inward rectifier potassium current,
IK1. Following cellular excitation an influx of Na+ (phase 0) is triggered. Membrane
depolarisation results in the opening of fast Na+ channels, generating a large inward Na+
current and the rapid upstroke of the AP. During this phase, the outward movement of
K+ remains constant and with the fast Na+ channels inactivating as rapidly as they
activated, the K+ current becomes dominant and repolarisation of the AP begins (phase
1). During phase 1, the closure of fast Na+ channels and the activation of the transient
outward K+ current (ITO) results in a rapid, but short and incomplete phase of
repolarisation. This however is not sufficient enough to return the membrane potential
to that seen during the resting state.
This early period of partial repolarisation through ITO in addition to the L-type Ca2+
current (ICa,L) activated by membrane depolarisation, enables the transfer into the
prolonged plateau phase of the ventricular AP (phase 2). During this plateau phase, a
steady prolonged inward influx of Ca2+ through voltage gated LTCC is balanced by the
potassium efflux by the outward delayed rectifier K+ currents; the rapid delayed rectifier
current (IKR) and the slow delayed rectifier current (IKS) (Bers, 2001). Calcium entry
through LTCCs during this phase is a key player in the ECC (discussed later). During this
period, the sodium calcium exchange current (NCX) also plays a role, albeit much smaller
than the LTCC, in contributing to the entry of Ca2+ into the cell. As LTCCs begin to
inactivate, repolarisation begins to accelerate leading into the final late and rapid
repolarisation phase (phase 3). This repolarisation comes as a result of the reduction of
Ca2+ entry into the cell due to inactivation of the LTCC. As repolarisation progresses,
there is a further increase in IK1 as the depolarisation-induced block is released, leading
to the restoration of the resting membrane potential.
Species variation in ventricular AP morphology due to differences in cardiac ion channel
expression is a vital factor when investigating cardiac electrophysiology in animal
models, in order to enable translation into clinical human studies The larger plateau
phase and presence of the ITO current, both important factors in repolarisation (Wang et
al., 1999), occur in the rabbit ventricular AP. This is in comparison for example to the

8
guinea pig, where ITO currents are absent therefore making this species a less competent
model to compare to human electrophysiology. The rabbit is commonly used as a model
to study cardiac electrophysiology both in whole heart procedures and when studying
single cardiac cells due to the ventricular electrophysiology being comparatively similar
to that seen in humans, as opposed to smaller experimental animals. Recordings of
ventricular action potentials show significant species variation in terms of morphology
and duration, primarily due to differences in the relative contributions of certain
repolarising currents and the variation in the expression of potassium ion channels. In
intermediate and larger animals such as guinea pigs, rabbits and canines, the delayed
repolarisation which occurs as a result of the slowly activating delayed rectifier currents
leads to the dome shaped action potential morphology. In contrast, the ventricular
action potential in small mammals such as mice and rats exhibits a triangular
morphology due to rapid repolarisation via a prominent transient outward current and
therefore a shorter APD. These known factors in cardiac electrophysiology therefore
make the rabbit the preferred animal model to investigate ventricular cardiac
electrophysiology.
1.2.3 Excitation-contraction coupling
The conversion of electrical impulses into myocardial contraction occurs via ECC. For
ECC to take place, a number of key contractile proteins need to be involved. The
sarcomere is the structural unit within cardiomyocytes and is responsible for
contraction. It is composed of a thick myofilament called myosin and a thin myofilament
called actin (figure 1.3). Contraction occurs through a sliding filament mechanism with
an interaction between myosin heads on the myosin filament forming cross bridges with
the actin filament.

9
Figure 1.3. An illustration of the interaction between the actin myofilament, the
troponin complex, which consists of 3 proteins, troponin I (TnI), troponin C (TnC) and
troponin T (TnT) and tropomyosin (A). The sufficient binding of calcium to TnC results
in a conformational change and enabling the binding of the myosin head. The actin and
myosin filaments are unable to bind during diastole (B) due to the inhibitory interaction
between TnI and actin. During systole and as a result of an increase in intracellular
calcium however, active sites on the actin molecule are uncovered, allowing the binding
of myosin and leading to contraction (C). Images modified from (Opie, 2004) and (Batter
et al., 2014).

10
The troponin complex, consisting of 3 proteins, troponin I (TnI), troponin C (TnC) and
troponin T (TnT) interacts with tropomyosin, a contractile protein coupled to the actin
myofilament. TnI acts as an inhibitory protein by preventing the interaction between the
actin and myosin filaments. During diastole i.e. the rest period between contractions,
intracellular [Ca2+] is low and contraction is inhibited due to the strong interaction
between TnI and actin. As such the troponin-myosin complex covers the actin-myosin
binding sites and prevents TnC-TnI interaction.
The influx of calcium ions carried by LTCCs and NCX during the plateau phase of the AP
is generally insufficient to activate contraction but acts as the trigger (Lederer et al.,
1990) for the release of internal Ca2+ from the sarcoplasmic reticulum (SR) in a process
known as calcium-induced calcium release (CICR). SR-Ca2+ release occurs through
ryanodine receptors (RyR) allowing [Ca2+]i to rise. Following this increase in [Ca2+]i during
systole, cytosolic Ca2+ binds to the TnC protein resulting in a conformational change in
the troponin-tropomyosin complex. This change strengthens the interaction of the
troponin complex with TnI and uncovers an active site on the actin molecule to which
myosin can bind, promoting cross bridge-formation and therefore contraction (figure
1.3).
Following contraction it is crucial for cardiomyocyte relaxation to occur in order for the
heart to function. During AP repolarisation [Ca2+]i falls and results in the dissociation of
Ca2+ from the low affinity binding site of TnC, which must be removed from the cytosol.
This process is completed by a number of mechanisms including the sarcoendoplasmic
reticulum Ca2+ ATPase transport pump (SERCA) and NCX. SERCA sequesters calcium back
into the SR in an ATP-dependent manner and is regulated by phospholamban (PLB),
which in its unphosphorylated state acts to inhibit Ca2+ transport and sequestration.
1.3 Neuronal control of the heart
The nervous system is a highly complex and extensive system responsible for the control
of the human body. It is divided into two sections: the central and peripheral nervous
systems, with cardiac activity being modulated by centrally derived parasympathetic
and sympathetic branches of the autonomic nervous system (figure 1.4). It is well known
that the sympathetic nervous system (SNS) has a strong augmentative effect on the

11
heart increasing heart rate (chronotropy), conduction velocity (dromotropy), myocardial
contraction (inotropy) and relaxation (lusitropy). The sympathetic branch innervates
the heart primarily via specific intrathoracic ganglia. Cardiac pregranglionic cell bodies
are located within the grey matter of the intermediolateral column of the first six
segments (T1 – T6) of the upper thoracic spinal cord. Axons exit the spinal cord by the
ventral roots where they join the sympathetic chain via the white rami (Coote and
Chauhan, 2016). Cardiac preganglionic efferent nerves project to postganglionic
neurons in the stellate ganglia (the main supply of postganglionic efferent sympathetic
nerves to the heart) (Kawashima, 2005) and the caudal cervical ganglia (Norris et al.,
1977, Kawashima, 2005, Armour and Hopkins, 1981). Sympathetic postganglionic nerves
extending from the stellate and caudal cervical ganglia enter the heart and extensively
branch to all four chambers of the heart with limited overlap of the left and right
spatially diverse neuronal inputs (Randall, 1977).
In contrast, the parasympathetic branch of the autonomic nervous system exerts an
antagonistic effect to the sympathetic branch, with tonic levels of vagal activity present
during rest, at a more pronounced level than that of the sympathetic branch (Yang and
Levy, 1984). Myelinated parasympathetic preganglionic fibres originate from columns of
cells in the medulla oblongata i.e. the dorsal motor nucleus of the vagus (DMV) (Hopkins
and Armour, 1984) and the nucleus ambiguus (Hopkins and Armour, 1984) in the
midbrain. These fibres are conveyed within the left and right vagus nerves where they
synapse with parasympathetic postganglionic fibres in and around the heart and great
vessels. Direct effects of vagal activation result in the attenuation of both heart rate and
conduction velocity through the hyperpolarization of nodal tissue (Imaizumi et al.,
1990).

12
Figure 1.4. A basic representation of the interactions of extrinsic preganglionic and
postganglionic autonomic nerves and the routes of innervation of the heart. The
parasympathetic input to the heart comes from the left and right vagal nerves whilst
sympathetic innervation is bought about via specific intrathoracic ganglia. Image taken
from http://www.cvpharmacology.com/autonomic_ganglia on 09/02/16.
13
Autonomic modulation is the result of direct and indirect actions of specific
neurotransmitters released from efferent nerve fibres. As a result of the interaction
between these neurotransmitters and their corresponding receptors, a variety of
signalling cascades come into play, ultimately leading to alterations in cardiac
chronotropy and dromotropy. Complex interactions exist between the two divisions of
the autonomic nervous system and contribute to heart health, with disturbances to this
interaction leading to disease (Bibevski and Dunlap, 2011).
1.3.1 Autonomic control of the heart
Neuronal signalling in the control of cardiac function is a complex phenomenon involving
a series of reflex control networks (Ardell and Armour, 2016). The overall network can
be divided into three tiers; 1) the higher control centre encompassing the spinal cord
and medulla, 2) the intrathoracic extracardiac ganglia and 3) the intrinsic cardiac ganglia.
These networks contain afferent, efferent and local circuit neurons, which interact both
locally and also act independently to fine tune the final influence on the heart.
1.3.1.1 Autonomic cardiac neurons
The complex neuronal hierarchy requires a significant level of communication between
all levels of the cardiac innervation, involving a variety of different neuronal subtypes;
namely peripheral sympathetic and parasympathetic pre- and post- ganglionic efferent
neurons, afferent neurons, and local circuit neurons found at the level of the heart itself
termed intrinsic cardiac neurons.
Cardiac motor or efferent neurons carry finely tuned information from the central
nervous system, providing constant feedback in the control of cardiac function. As
mentioned, the sympathetic preganglionic efferent neurons that reside within the
intermediolateral column of the spinal cord, synapse with sympathetic postganglionic
neurons both within intrathoracic and intrinsic cardiac ganglia. The majority of
sympathetic efferent postganglionic neuronal somata located in intrinsic and
intrathoracic ganglia express a phenotype implying the presence of catecholamines such
as noradrenaline (NA) (Baluk and Gabella, 1990). Immunoreactivity (IR) for tyrosine
hydroxylase (TH) was historically believed to be present in populations of small intensely
fluorescent (SIF) cells; however, it is becoming increasingly apparent that larger

14
populations of somata also demonstrate TH-IR and these cells are possibly even principal
neurons (long axoned cells capable of transmitting information over relatively longer
distances) (Rysevaite et al., 2011b, Hoover et al., 2009).
Cardiac afferent nerves are generally associated with neurons that have their cell bodies
in extracardiac ganglia such as the nodose and dorsal root ganglia (DRG) and relay
sensory information to the brain and spinal cord (Hopkins and Armour, 1989).
Alterations in the chemical and mechanical milieu around afferent nerves are detected
by receptors on axons within the myocardium and allow the transduction of sensory
information about blood pressure, blood volume, perfusion and metabolic status
(Ardell, 1994). There are many types of afferent nerves which possess a unique
transduction capability allowing for different sensory information to be relayed to the
central nervous system. The constant feedback provide by afferent neurons residing
within intrinsic cardiac ganglia at the level of the heart provide the precedence for beat-
to-beat control (Fukuda et al., 2015).
A separate population of neurons capable of processing these afferent and efferent
neuronal inputs exists in both intrathoracic and intrinsic cardiac ganglia (Armour, 2007,
Armour, 1991), termed local circuit neurons. These neurons demonstrate the ability to
communicate with neurons within the same ganglia as well with neurons within spatially
diverse ganglia. Intrinsic cardiac local circuit neurons have been shown to receive inputs
from both sympathetic and parasympathetic efferent preganglionic neurons (Armour,
1991) therefore suggesting a significant role of such neuronal subtype in the processing
of sensory and motor information and the eventual influence of cardiodynamics.
Excessive activation of local circuit neurons involved in the transduction of afferent
signals into mechanical efferent effects plays a role in the induction of atrial fibrillation
(AF) (Beaumont et al., 2013). This implication of local circuit neurons involved in cardiac
arrhythmias accompanied by the fact that such arrhythmia susceptibility can be altered
during vagal nerve stimulation (Beaumont et al., 2013) suggests that this population of
neurons may represent a novel therapeutic target.

15
1.3.1.2 Mechanisms of autonomic modulation
Autonomic modulation of the heart relies on the release of specific neurotransmitters
including catecholamines and acetylcholine from sympathetic and parasympathetic
nerves respectively. These bind to specific postsynaptic receptors on the cell membrane
and trigger a variety of signal transduction pathways. The main mechanism of
modulation occurs via the activation of a secondary messenger system. Such pathways
involve sarcolemmal located receptors coupled to guanosine triphosphate (GTP)
regulated proteins, known as G-proteins, which have three subunits (α, β and γ). In
resting conditions the α subunit is bound with guanosine diphosphate (GDP) and so is
closely associated with the β and γ subunit. Upon receptor activation, the exchange of
GTP for GDP is catalysed resulting in the Gα-GTP subunit dissociating from the
membrane bound Gβγ subunit. The activated Gα-GTP subunit initiates the physiological
downstream effects depending upon which cardiac G-protein subtype is involved (figure
1.5).
1.3.1.2.1 Acetylcholine
Cholinergic modulation is predominantly mediated by the release of acetylcholine not
only at the nerve terminals of parasympathetic postganglionic neurons but also at the
preganglionic level, playing a role in both sympathetic and parasympathetic innervation.
Acetylcholine is therefore not only involved at the synaptic junction of vagal
(parasympathetic) neurons, but is also the neurotransmitter released at all cardiac
autonomic ganglia. Cholinergic modulation classically involves 2 receptors; muscarinic-
acetylcholine receptors (mAChRs) of which there are 5 subtypes (M1-M5) and nicotinic-
acetylcholine receptors (nAChRs). Nicotinic receptors can be divided into ganglionic or
somatic muscle nicotinic receptors. Somatic muscle (N1) nicotinic receptors are located
at the neuromuscular junction and allow for the transmission of nerve impulses from
motor nerves to muscle fibres. Ganglionic nicotinic receptors, which play a key role in
the transmission of cholinergic signals in the autonomic nervous system and are
important when understanding the role of acetylcholine in cardiac autonomic ganglia,
are found on the cell bodies of both sympathetic and parasympathetic postganglionic
neurons. When activated by the binding of acetylcholine, the receptors, which are ligand
gated ion channels, undergo a conformational change allowing for the opening of the

16
channel. The nAChR is a non-selective cation channel, meaning a number of ions
including Na+, K+ and Ca2+ can pass through. The movement of cations causes a
depolarisation of the plasma membrane and results in an excitatory postsynaptic
potential in neurons and the transmission of neuronal signals, with such responses being
blocked by the antagonist hexamethonium.
Of the 5 subtypes of mAChRs, the M2 subtype predominates in the heart (Brodde and
Michel, 1999). Cholinergic modulation occurs in 3 ways; 1) the principal mechanism via
activation of mAChRs coupled to an inhibitory pertussis toxin sensitive G-protein (Gi/Go).
The dissociation of this α-subunit complex results in the inhibition of adenylyl cyclase
(AC) which in turn causes a reduction in intracellular cyclic adenosine monophosphate
(cAMP) levels, so leading to a reduced activity of protein kinase A (PKA), (2) direct
activation and opening of inwardly rectifying acetylcholine sensitive potassium
channels, KACh, by the Gβγ subunit, leading to an efflux of K+ and cell hyperpolarization,
and/or (3) via activation of guanylate cyclase (GC) resulting in an increase in cyclic
guanosine monophosphate (cGMP), which in turn activates protein kinase G (PKG),
phosphorylates and modulating the action of various intracellular proteins. Cholinergic
modulation can be regulated at the pre- and post- ganglionic level, with the signalling
molecule nitric oxide (NO) known to play a role in modulating the effect of acetylcholine
at nerve terminals (Herring et al., 2001).
1.3.1.2.2 The physiological effects of acetylcholine acting on M2 muscarinic receptors
The binding of acetylcholine to M2 receptors and subsequent activation of a Gi
mechanism by inhibiting adenylyl cyclase and therefore decreasing cAMP levels. The
resultant reduction in PKA activity prevents the phosphorylation of a number of key
proteins involved in ECC including LTCCs and RyR2. This leads to a decrease in
depolarising currents carried by LTCCs and a decrease in Ca2+ entry into the cell.
Acetylcholine also has a strong inhibitory action on the If current, producing a negative
chronotropic effect. Reduced cAMP causes a consequential shift of the current
activation curve to more negative values and slowing the spontaneous rate of firing of
the pacemaker cells and slowing heart rate. Neurotransmitters such as acetylcholine
specifically act to alter the steepness of diastolic depolarisation rather than to modify

17
the action potential threshold (Bucchi et al., 2007). The spontaneous activity of SA node
pacemaker cells is also slowed down in the presence of ryanodine, suggesting that Ca2+
cycling may also be a mechanism for heart rate regulation (DiFrancesco, 2010).
The rate of depolarisation is also influenced by the modulation of specific K+ channels.
Upon dissociation of the α and βγ subunits, the Gβγ heterodimers directly activate G-
protein-coupled inward rectifying potassium (GIRK) channels, resulting in membrane
hyperpolarisation of cells within the SA and AV nodes. Similarly, the activation of KACh
channels through the Gi pathway leads to membrane hyperpolarisation via a potassium
efflux. Hyperpolarisation of cells means an increase in the cellular threshold for
triggering rapid depolarisation (phase 0 of the SA nodal action potential) and therefore
a reduction in the firing rate.
The physiological effects of M2 receptors are very effectively blocked by muscarinic
receptor antagonists such as atropine, which prevent the binding of acetylcholine and
therefore, the activation of the receptor. Clinically, atropine is used to prevent sinus
bradycardia and AV nodal block caused by the excessive activation of the vagus nerves
innervating the heart. A decrease in vagal tone is known to occur relatively early on in
the development of heart failure. Studies have recorded an attenuation in the activity
of acetylcholinesterase and altered muscarinic receptor densities (Dunlap et al., 2003)
in heart failure, with evidence of blunting of the parasympathetic influence on
sympathetic activity (Azevedo and Parker, 1999).
1.3.1.2.3 Noradrenaline
Sympathetic effects are elicited by the binding of catecholamines such as adrenaline and
noradrenaline to adrenergic receptors. Adrenergic receptors exist in multiple subtypes
and isoforms; the α subtype, of which there are 2 isoforms, and the β subtype, of which
there are 3 (β1-3), with the β1-isoform being the primary cardiac isoform (Brodde and
Michel, 1999). β-adrenoreceptors are also G-protein coupled receptors located on the
cardiomyocyte surface consisting of Gα, Gβ and Gγ subunits. The β1-adrenoreceptor is
coupled to the stimulatory G-protein (Gs), which upon activation stimulates the
dissociation of the Gα subunit to activate the membrane bound protein adenylyl cyclase,
which in turn catalyses the conversion of adenosine triphosphate (ATP) into cAMP. This
18
amplification step triggers several downstream effector processes. The primary target
of cAMP is PKA although cAMP can also alter ion channel function by directly acting on
the channel protein. PKA, a cAMP-dependent phosphorylation enzyme, phosphorylates
multiple downstream effector proteins including the LTCC, PLB, RyR2 and TnI (Bers,
2001), delayed rectifier type K+ channels and voltage-dependent Na+ channels. The Gα
subunit has intrinsic GTPase activity that acts to convert the GTP to GDP, which allows
the re-association of the 3 subunits for further adrenergic activation when required.
1.3.1.2.4 The physiological effects of adrenergic receptor activation
The primary mechanisms thought to underlie sympathetic-induced increases in heart
rate include the effect of cAMP on cardiac pacemaker channels that give rise to the
“funny current” seen in SA and AV nodal cells (Accili et al., 2002) and the effect of PKA
phosphorylation of Ca2+ channels. The direct activation of If by cAMP causes an increase
in the slope of the pacemaker potential, reducing the time required for SA nodal cells to
reach the threshold voltage needed to initiate an action potential and therefore
increasing the frequency at which action potentials are produced. Beta-adrenergic
receptor stimulation also increases If by shifting the activation curve of the current to
more positive voltages through the direct binding of cAMP to channels (DiFrancesco and
Tromba, 1988), the opposite mechanism to parasympathetic stimulation.
The phosphorylation of the LTCC results in a several-fold increase in ICa and a larger Ca2+
influx. The increase in ICa provides a larger trigger for CICR and enhances the amplitude
of the Ca2+ transient. PKA also phosphorylates PLB resulting in a reduction in the
inhibitory effect of PLB on SERCA. This causes an increase in SERCA activity, therefore an
increase in Ca2+ uptake into the sarcoplasmic reticulum and a faster decline in
intracellular calcium concentration (Bers, 2001). Over time, this also results in an
increase in the level of the SR calcium store. The combination of the phosphorylation of
the LTCC, RyR2 and PLB leads to an increase in the firing rate of the SA node and gives
rise to the chronotropic and inotropic effects seen with β1 adrenoreceptor stimulation.
Heart failure results in alterations in this signal transduction mechanism that affect
cardiac chronotropy. Hyperactivity of sympathetic nerves during HF causes an increase
in the release of neurotransmitters such as noradrenaline. This causes a resultant
19
activation of β1-receptor activation enabling the heart to utilise its remaining
chronotropic reserve and hence the clinical use of β-blockers such as metoprolol; used
with the intent of reducing the effects of sympathetic over-activation. Evidence of
hyperphosphorylation of both the LTCCs and RyR2 has been observed in heart failure
(Marx et al., 2000, Schroder et al., 1998), implying HF leads to an increased propensity
for SR Ca2+ release during diastole and therefore an increased susceptibility to
arrhythmia.
Conversely, it is also thought that despite hyperinnervation of the sympathetic nervous
system, mechanisms exist with the aim of providing a protective effect during heart
failure. Studies identifying β-adrenergic desensitisation and a site specific reduction in
β-adrenergic receptor density can lead to uncoupling of Gs from the receptors and result
in the hypophosphorylation of PKA substrates such as PLB and Troponin. This further
confirms the complexitiy of the involvement of the autonomic nervous system in cardiac
disease and heart failure.

20
Figure 1.5. Schematic representation of the mechanisms involved in sympathetic
(adrenergic) and parasympathetic (muscarinic) receptor activation. Binding of
noradrenaline to adrenergic receptors and acetylcholine to muscarinic receptors leads
to the dissociation of the α-subunit complex and the regulation of cAMP. Abbreviations:
AC, adenylyl cyclase; ACh, acetylcholine; ATP, adenosine triphosphate; cAMP, cyclic
adenosine monophosphate; LTCC, L-type calcium channel; NA, noradrenaline; PKA,
protein kinase A; PLB, phospholamban; RyR2, ryanodine receptor.

21
1.3.1.3 Cardiac neuromodulators and neuropeptides
Signal transduction in both the sympathetic and parasympathetic autonomic pathways
is complex and alongside the binding of ‘standard’ neurotransmitters (noradrenaline
and acetylcholine) to receptors to initiate signalling cascades, numerous
neuromodulators and co-transmitters are involved. Emerging research suggests that
these factors influence sympathovagal innervation at the level of the heart, requiring an
intricate interplay between all aspects. Such modulators include NO, neuropeptide Y
(NPY) (Herring et al., 2008, Herring et al., 2002), substance P, calcitonin gene-related
peptide (CGRP) (Rysevaite et al., 2011b) and vasoactive intestinal peptide (VIP) (Parsons
et al., 2006), along with other neuronally released natriuretic peptides that act in a
paracrine manner. Alterations in the presence and involvement of these
neurotransmitters and modulators occur during cardiac disease (Rajendran et al., 2016)
and result in a dysregulation in the autonomic responsiveness of the heart.
1.3.1.3.1 Nitric oxide and neuronal nitric oxide synthase
Nitric oxide, a free radical gaseous signalling molecule, is synthesised by the enzyme
nitric oxide synthase. Of the three cardiac isoforms; neuronal (nNOS), inducible (iNOS
and endothelial (eNOS), this study will focus primarily of nNOS. nNOS, which is
constitutively expressed in autonomic nerves and intracardiac ganglia (Choate and
Paterson, 1999), plays a significant role in producing physiological changes due to its co-
localisation with a number of cholinergic intracardiac neurons (Choate et al., 2001).
Neuronal NO is an important modulator of neuronal function (Herring and Paterson,
2009) acting both postsynaptically (as a co-transmitter) or presynaptically in the
modulation of vagal neurotransmission. The presence of nNOS within the intrinsic
cardiac nervous system (which will be described in detail further on) therefore implies
the intrinsic cardiac ganglia play a role in the modulation and fine tuning of peripheral
vagal inputs.
Nitric oxide acts within both cholinergic and sympathetic ganglia and neurons (figure
1.6). The majority of physiological changes by NO, specifically in terms of cholinergic
control, are considered to be site specific (Herring et al., 2002). NO generated by nNOS
can facilitate the release of acetylcholine with parasympathetic innervation via vagus

22
nerve stimulation (Brack et al., 2007). Within cholinergic neurons, nerve depolarisation
and NO release results in the promotion of vesicular fusion to the neuronal membrane
and Ca2+ induced exocytotic acetylcholine release. NO primarily binds to soluble
guanylate cyclase (sGC) and alters cardiac physiology in both a cGMP dependent and
independent manner. NO binding to sGC results in its activation and an increase in the
conversion of GTP into cGMP so allowing sGC to transmit an NO dependent signal to the
downstream elements of the signalling cascade (Denninger and Marletta, 1999).
Increased levels of cGMP lead to modulation and activation of PKG. PKG is capable of
the direct phosphorylation of components of ECC including the LTCC, causing inhibition
of the LTCC and a reduction in the intracellular Ca2+ concentration, the RyR2, facilitating
Ca2+ leak and PLB, therefore enhancing Ca2+ sequestration. In addition, PKG can lead to
the indirect regulation of PKA via specific phosphodiesterases (PDEs), in particularly via
the inhibition of PDE3. The inhibition of PDE3 results in a local increase in cAMP and
therefore an increase in LTCC (Loscalzo and Vita, 2000). The resultant increase in cAMP-
PKA-dependent phosphorylation of N-type calcium channels ultimately leads to a
calcium-induced exocytotic release of acetylcholine.
Vagus nerve stimulation has been implicated in the protection of the heart against
ventricular fibrillation via cholinergic receptor stimulation. It has been demonstrated
that the anti-fibrillatory action of cholinergic signalling via muscarinic receptors involves
the release of NO, whilst a reduction of NO using NOS inhibitors (Brack et al., 2011)
significantly alters the protective effect of the vagus (Herring and Paterson, 2001, Kalla
et al., 2016).
Conversely, is has been determined that NO, which is also present in the cardiomyocyte,
inhibits the positive chronotropic and inotropic responses evoked by the sympathetic
branch of cardiac control, presumably through stimulation of PDE2 (Choate and
Paterson, 1999, Herring and Paterson, 2009), resulting in a reduction in noradrenaline
release via a cGMP-PDE2-dependent pathway. In terms of cardiac function, cGMP-
mediated PDE2 activation causes a decrease in cAMP. In addition, PDE2 is influential in
pacemaker cells by causing the inhibition of the L-type Ca2+ current, ICa. A recent review
by Herring and Paterson (2009) highlighted the emerging evidence regarding the
involvement of NO and nNOS within sympathetic ganglia, where they illustrated work
23
by Wang et al. (2006) (see figure 1.5). Using the gene transfer of nNOS with non-specific
adenoviral vectors, Wang et al. (2006) provided direct evidence that the targeting of
nNOS to cardiac sympathetic neurons resulted in a decrease in sympathetic
transmission. This correlates with a study by Mongillo et al. (2006) where a functional
coupling between PDE2 and adenylyl cyclase activated by β-adrenoreceptor stimulation
was suggested.
Despite evidence that NO plays a significant role in the modulation of both cholinergic
and adrenergic innervation, the complete mechanism of NO downstream signalling in
regards to neuronal control and modulation is still not completely understood and with
increasing numbers of nNOS positive neuronal somata evident during heart failure
(Nakamura et al., 2016) presumably in the aim of reducing the release of noradrenaline
and dampening down the sympathetic overdrive.

24
Figure 1.6. The actions of NO within both the sympathetic and parasympathetic
branches of the autonomic nervous system. Nitric oxide augments the bradycardic
response to vagal nerve stimulation with an increase in acetylcholine release via a cGMP
and phosphodiesterase 3 pathway. Conversely, NO reduces the release of noradrenaline
via a cGMP-PDE2-dependent pathway. Image A modified from Herring and Paterson
(2009). The cGMP-dependent NO signalling pathway involved is shown in more detail in
B. Abbreviations: ACh, acetylcholine; cAMP, cyclic adenosine monophosphate; cGMP,
cyclic guanosine monophosphate; ECC, excitation-contraction coupling; NA,
noradrenaline; NO, nitric oxide; NOS, nitric oxide synthase; PDE, phosphodiesterase;
PKA, protein kinase A; PKG, protein kinase G.

25
1.3.1.3.2 Additional neuronal modulators
NPY is a neurotransmitter that is primarily synthesised and released by sympathetic
neurons (Lundberg et al., 1991) throughout the autonomic nervous system. It is
abundant within the cardiovascular system and is also known to be present in a variety
of intrinsic cardiac neurons including sensory, sympathetic and interneurons (Herring,
2015). NPY has been described as a major modulator of sympathetic-parasympathetic
interaction and mediates the inhibition of vagal-acetylcholine release during longer
periods of sympathetic stimulation (Yang and Levy, 1992). The varying functions of NPY
are mediated by NPY receptors of which there are five distinct subtypes: Y1, Y2, Y4, Y5
and Y6. These receptors are members of the GPCR receptor family, all of which couple
to pertussis toxin-sensitive Gi/o proteins. Activation of NPY receptors leads to the release
of the Gi subunit and the inhibition of the production of cAMP. The majority of effects
of NPY in the cardiovascular system are mediated through Y1, Y2 and Y5 receptors, with
(Herring et al., 2012) showing that Y2 receptor antagonists can prevent the inhibition of
vagal bradycardia during sympathetic stimulation.
The ability of NPY to act as a prejunctional inhibitor of vagally mediated negative
inotropic responses (Serone and Angus, 1999) is bought about by the modulation of
acetylcholine release at parasympathetic nerve terminals, independent of PKA, but
instead dependent on PKC (Herring et al., 2008). In addition to modulating vagal tone
via the depression of acetylcholine release at parasympathetic nerve terminals, NPY is
also capable of exerting a direct effect on parasympathetic intracardiac neurons leading
to decreased parasympathetic tone via the modulation of calcium channels involved in
myocyte electrophysiology.
Patients with conditions such as myocardial infarction (MI) and congestive heart failure
(HF), where sympathetic drive is high, have an increased plasma level of NPY suggesting
it is necessary to further investigate the role of NPY in cardiac control. It has been
questioned whether this increased level could be due to NPY acting as a sympathetic co-
transmitter reducing vagal activity (Herring and Paterson, 2009). Targeting NPY
receptors pharmacologically may therefore provide a therapeutic target following
myocardial infarction.
26
Recently, markers for vasoactive intestinal peptide, which is known to be co-released
alongside acetylcholine (Kuncova et al., 2003), have been illustrated within the ICNS
(Steele et al., 1994, Parsons et al., 2006). VIP is present in the peripheral and central
nervous systems, with VIP containing neurons being believed to be either intrinsic
neurons involved in local reflexes or postganglionic neurons under nicotinic control.
(Henning and Sawmiller, 2001). The majority of neural structures positive for VIP in
cardiac tissues have been identified in atria with much smaller amounts described in
ventricular myocardium (Weihe and Reinecke, 1981). The effects of VIP are mediated
through VIP receptors of which there are two subtypes; VPAC1 and VPAC2. As with NPY
receptors, VIP receptors are GPCR, which are coupled to the Gs subunit. Binding of VIP
to these receptors results in the activation of adenylyl cyclase and a VIP induced increase
in cAMP concentration. As with the action of acetylcholine and M2 receptors, this
increase in cAMP can activate PKA which goes on to phosphorylate PLB and therefore
increases the sequestration of Ca2+ by the sarcoplasmic reticulum (Murrary, 1990). VIP
is thought to contribute to the regulation of coronary vasomotor tone and alter coronary
artery blood flow, which correlates with the increase in VIP following myocardial
infarction in an attempt to increase coronary blood flow (Hershberger et al., 1988).
Despite the evidence of VIP-positive fibres existing within the ICNS, which will be
discussed, the origin and precise function of these fibres is unclear in relation to cardiac
control.
The final neuropeptide to be discussed herein, but by no means the final
neurotransmitter known to play a role in the autonomic control of the heart, is the
tachykinin, substance P. Substance P is a key target in identifying sensory nerve fibres
(Wake and Brack, 2016) and is widely distributed throughout the central and peripheral
nervous systems. It is primarily produced by C-fibre sensory nerves and is involved in the
regulation of heart rate and blood pressure (Dehlin and Levick, 2014). Substance P acts
primarily by binding to the neurokinin (NK)1 receptor. The NK1 receptor is distributed in
the plasma membrane of cell bodies and dendrites of unstimulated neurons. Following
the binding of substance P to NK1 receptors, the receptor undergoes rapid
internalisation and rapid recycling to the membrane. In the heart, Hoover and Hancock
(1988) described substance P receptors in the parasympathetic ganglia within the

27
epicardium adjacent to the pulmonary trunk, ascending aorta and right atrium.
Substance P-positive fibres are characteristic of afferent nerves and are well known to
have negative inotropic and chronotropic effects (Hoover, 1990). The release of
Substance-P from sensory nerves directly and indirectly modifies neuronal activity and
following the release of the peptide, it is believed to act on nearby vasculature and
endothelial cells triggering the release of substances such as ATP and serotonin. This
corresponds with the distribution of Substance P-positive fibres around coronary
vessels, however they are also present in the atria and ventricles although this appears
to be species dependent (Papka and Urban, 1987). Substance P-positive nerves also play
a role in a multitude of cardiac diseases including HF and AF (Yu et al., 2012).
1.4 The intrinsic cardiac nervous system
Dogma previously stipulated that neurocardiac control originated solely from extrinsic
innervation, however increasing evidence now suggests the contrary, with Randall et al.
(1996) describing the heart’s ‘little brain’. The ICNS, which resides at the level of the
heart, is the final co-ordinator of cardiac function; modulating inputs from higher
neuronal networks including intrathoracic ganglia and peripheral autonomic nerves.
The degree in which the ICNS acts independently of peripheral nerves is poorly
understood, as is the full capability of this highly complex network of neurons in terms
of cardiac function. Neurocardiological control within the ICNS involves a variety of
different neuronal subtypes; namely peripheral sympathetic and parasympathetic pre-
and post- ganglionic efferent neurons, afferent neurons, and neurons found at the level
of the heart itself termed intrinsic cardiac neurons (figure 1.7).

28
Figure 1.7. A simplified model for the intrinsic cardiac neuronal hierarchy. The complex
interactions enabling fine-tuned cardiac feedback to the heart are shown. The ICNS
(consisting of numerous neural subtypes shown in red boxes) is a rich network of cardiac
nerves that converge to form distinct ganglia and extend across the heart. The neural
structures demonstrate complex interactions to modulate cardiac function.
29
The ICNS comprises of collections of neuronal stomata and connecting nerve fibres
known as ganglionic plexuses (GPs) or intrinsic cardiac ganglia (ICG). These plexuses are
known to reside primarily on the surface of the heart on supraventricular tissues.
Traditionally, it was considered that the intrinsic ganglia contained the terminal portion
of postganglionic parasympathetic efferents and that only cholinergic neurotransmitters
and markers such as acetylcholine and choline acetyltransferase (ChAT) would be
present (Langley, 1921). This is not the case and more recent physiological data
produced by Beaumont et al. (2013) demonstrates that the ICNS is not merely a relay
station between effector sites and the central nervous system.
1.4.1 The human intrinsic cardiac nervous system
Despite the knowledge that the autonomic nervous system modulates cardiac dynamics
and electrophysiology, data regarding the involvement of the ICNS remains limited and
only a handful of studies have investigated the gross morphology of the human ICNS.
Clinical studies demonstrate that dysfunction of the ICNS is associated with cardiac
diseases, including atrial and ventricular arrhythmias (Scherlag and Po, 2006, He et al.,
2013), so understanding the gross anatomy and function of the human ICNS is of
increasing importance. Early studies by Worobiew (1925, 1928, 1958 cited by (Pauza et
al., 2000)) examining neuronal cardiac inputs, identified intrinsic cardiac ganglia
localised at fixed regions on the human heart as shown in table 1.1.

30
Neural Ganglionated Plexus Origin Effector Site
Left anterior coronary Roots of Ao and PT Left ventricle
Right anterior coronary Roots of Ao and PT Right ventricle
Right posterior longitudinal Between SVC and RSPV Posterior LA, LV, RV and
RA
Left posterior longitudinal Left atria Posterior LA, LV and RV
Anterior atrial Anterior left and right atria Transverse pericardial
sinus
Haller’s Sinus Superior left atrium Right and left superior PVs
Table 1.1. The location of ganglionated plexi in the human heart according to
Worobiew (1925). Abbreviations: Ao, aortic root; LA, left atria; LV, left ventricle; PT,
pulmonary trunk; PV, pulmonary veins; RA, right atria; RSPV, right superior pulmonary
vein; RV, right ventricle; SVC, superior vena cava.

31
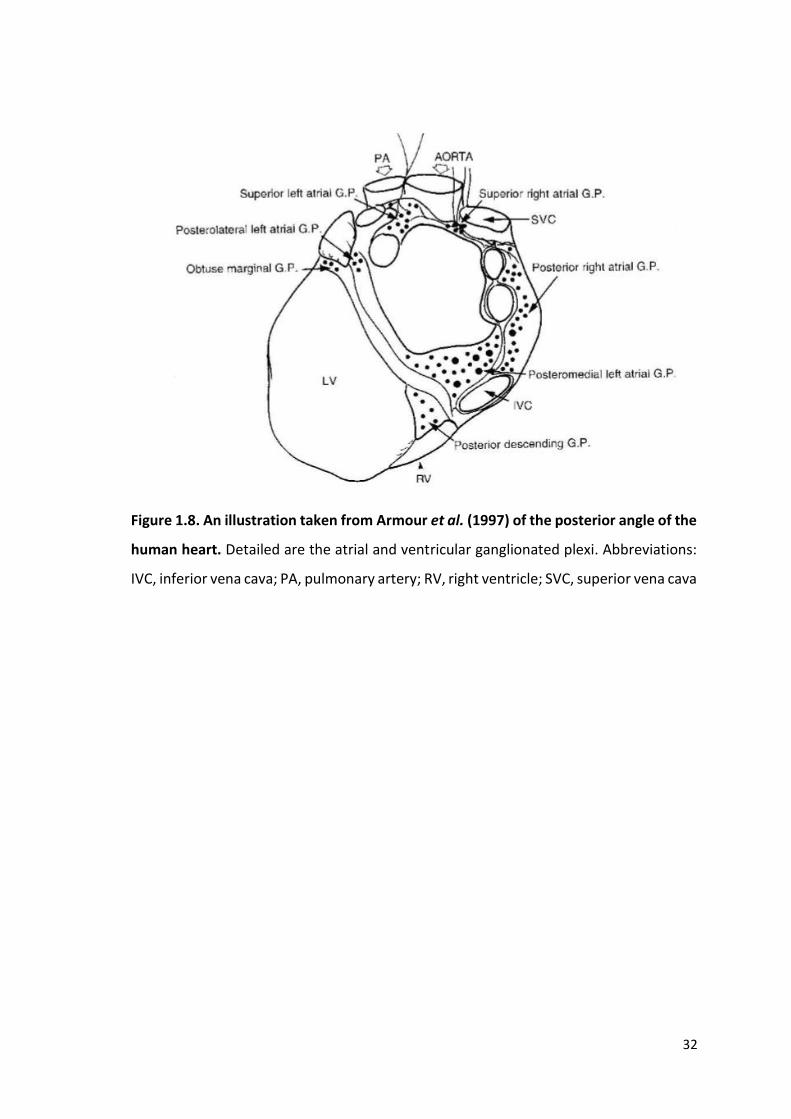
These original studies demonstrated that ganglia are present at specific localities, yet
despite this basic knowledge, a better understanding and gross morphological map was
still needed. Decades later in 1997, Armour et al determined the full extent and
relationship of the human ICNS by examining the gross and microscopic anatomy using
a methylene blue histological stain. The study detailed intrinsic cardiac ganglia linked via
interconnecting nerves to form GPs and which were consistently present at five atrial
(the superior right atrial, superior left atrial, posterior right atrial, posteromedial left
atrial and posterolateral left atrial GPs) and five ventricular locations (the aortic root,
the anterior descending, posterior descending, right acute marginal and obtuse marginal
GPs), illustrated in figure 1.8.
32
Figure 1.8. An illustration taken from Armour et al. (1997) of the posterior angle of the
human heart. Detailed are the atrial and ventricular ganglionated plexi. Abbreviations:
IVC, inferior vena cava; PA, pulmonary artery; RV, right ventricle; SVC, superior vena cava
33
An estimated 14,000 or more neurons reside on the human heart, subdivided into over
550 individual cardiac ganglia, approximately 450 of which are present on the atria
compared to less than 100 on ventricular tissue (Armour et al., 1997). The extensive
distribution of the human ICNS was further characterised by Pauza et al. (2000).
Regardless of differences in the classification and subdivision of ganglia present on
specific regions of the epicardium amongst groups, the general anatomical concept
displays similarities.
Neuronal cell bodies on the heart hilum are either grouped into smaller localised ganglia
or gathered into larger, more dispersed clusters with ganglia sizes ranging from just a
few neurons to a few hundred (Pauza et al., 2000, Armour et al., 1997, Singh et al., 1996).
More recently, fields of ganglionated plexuses present on the epicardial regions have
been split into 7 defined locations (table 1.2), identifying routes of neural input and
outflow from ganglia and incorporating previous anatomical findings.
As is seen in many experimental mammalian species, extrinsic cardiac nerves access the
heart arterially, around the roots of the pulmonary artery (PA) and aortic root (Ao) and
at the venous portion of the heart hilum around the roots of the pulmonary veins (PVs)
and SVC (Batulevicius et al., 2008, Saburkina et al., 2010, Pauza et al., 2002b, Richardson
et al., 2003, Batulevicius et al., 2003). The majority of ganglia across species are found
on the dorsal atrial regions, namely at the superior aspect of the right atrium and
posteromedial aspect of the left atrium, with fewer and comparably smaller ganglia
being found at ventricular regions.

34
Table 1.2. An overview of the organisation of the ICNS according to Pauza et al. (2000).
Abbreviations: Ao, aorta; PT, pulmonary trunk; PV, pulmonary vein; SVC, superior vena
cava.
Ganglionic Subplexus Origin Effector site
Ventral Right Atrial Superior interatrial sulcus Root of SVC
Ventral Left Atrial Between superior interatrial sulcus
and left atrial nerve fold
Ventral inferior left
atria
Left Dorsal Left atrial nerve fold Middle left atria
Middle Dorsal Between right and left superior PVs Middle left atria
Dorsal Right Atrial Between SVC and RSPV Interatrial septum
Left Coronary Ao/PT Left ventricle
Right coronary Ao/PT Right ventricle
35
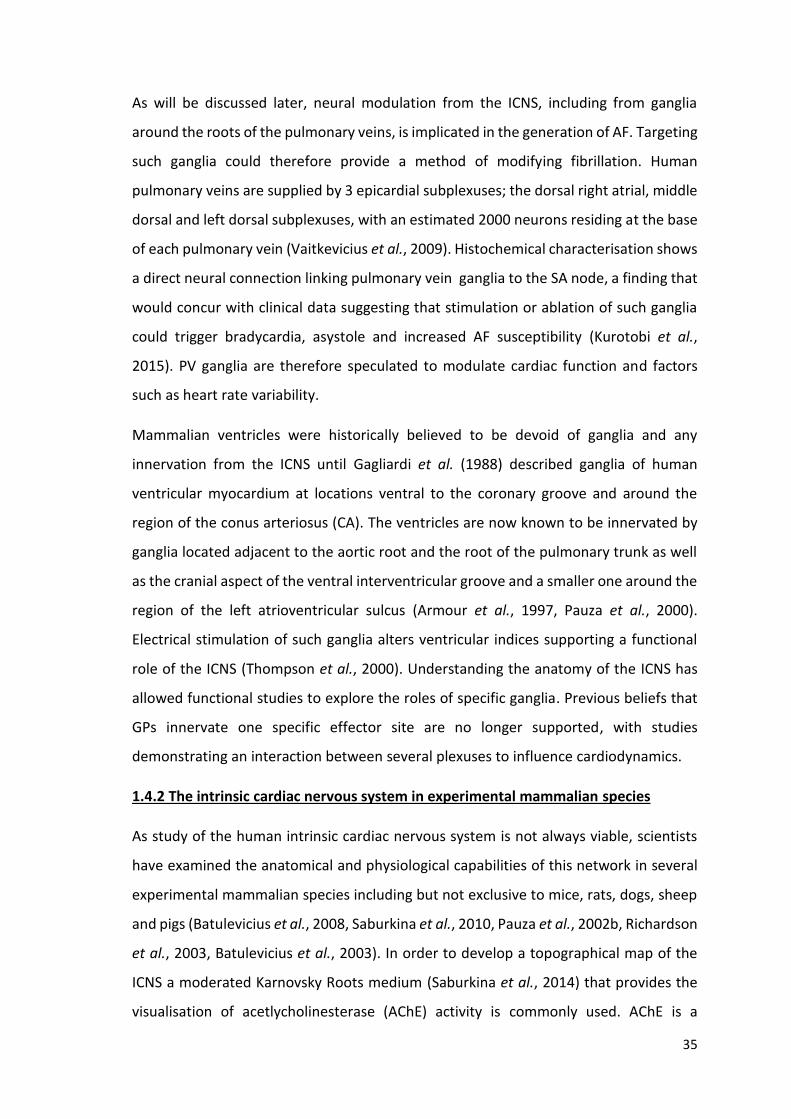
As will be discussed later, neural modulation from the ICNS, including from ganglia
around the roots of the pulmonary veins, is implicated in the generation of AF. Targeting
such ganglia could therefore provide a method of modifying fibrillation. Human
pulmonary veins are supplied by 3 epicardial subplexuses; the dorsal right atrial, middle
dorsal and left dorsal subplexuses, with an estimated 2000 neurons residing at the base
of each pulmonary vein (Vaitkevicius et al., 2009). Histochemical characterisation shows
a direct neural connection linking pulmonary vein ganglia to the SA node, a finding that
would concur with clinical data suggesting that stimulation or ablation of such ganglia
could trigger bradycardia, asystole and increased AF susceptibility (Kurotobi et al.,
2015). PV ganglia are therefore speculated to modulate cardiac function and factors
such as heart rate variability.
Mammalian ventricles were historically believed to be devoid of ganglia and any
innervation from the ICNS until Gagliardi et al. (1988) described ganglia of human
ventricular myocardium at locations ventral to the coronary groove and around the
region of the conus arteriosus (CA). The ventricles are now known to be innervated by
ganglia located adjacent to the aortic root and the root of the pulmonary trunk as well
as the cranial aspect of the ventral interventricular groove and a smaller one around the
region of the left atrioventricular sulcus (Armour et al., 1997, Pauza et al., 2000).
Electrical stimulation of such ganglia alters ventricular indices supporting a functional
role of the ICNS (Thompson et al., 2000). Understanding the anatomy of the ICNS has
allowed functional studies to explore the roles of specific ganglia. Previous beliefs that
GPs innervate one specific effector site are no longer supported, with studies
demonstrating an interaction between several plexuses to influence cardiodynamics.
1.4.2 The intrinsic cardiac nervous system in experimental mammalian species
As study of the human intrinsic cardiac nervous system is not always viable, scientists
have examined the anatomical and physiological capabilities of this network in several
experimental mammalian species including but not exclusive to mice, rats, dogs, sheep
and pigs (Batulevicius et al., 2008, Saburkina et al., 2010, Pauza et al., 2002b, Richardson
et al., 2003, Batulevicius et al., 2003). In order to develop a topographical map of the
ICNS a moderated Karnovsky Roots medium (Saburkina et al., 2014) that provides the
visualisation of acetlycholinesterase (AChE) activity is commonly used. AChE is a

36
hydrolysing enzyme found within cholinergic synapses and is responsible for the
breakdown of acetylcholine. It is therefore considered a pan neuronal marker.
In general, the complexity of ganglionic plexuses on the hearts of smaller mammals such
as mice and rats (Batulevicius et al., 2003, Rysevaite et al., 2011a) is comparatively
similar to that of larger mammals including sheep (Saburkina et al., 2010) and pigs
(Batulevicius et al., 2008). There is a reduced density of innervation by neuronal
cellbodies in smaller mammals when compared to larger mammals, where cardiac
neuronal innervation is much more complex and more liberally distributed across the
hilum of the heart. In larger mammalian species such as sheep, pigs and dogs, extrinsic
mediastinal nerves access the heart at multiple sites, primarily around the root of the
superior vena cava, the origin of the left azygos vein, at the roots of the pulmonary veins
and in some instances between the roots of the aorta and pulmonary trunk (Saburkina
et al., 2010, Batulevicius et al., 2008, Pauza et al., 2002b). The neural sources of these
nerves are the cervicothoracic and thoracic sympathetic ganglia (T2-T6) and the cervical
vagus nerves, with these extracardiac nerves connecting to intrinsic cardiac ganglia and
subplexus routes (Saburkina et al., 2010).
The nerves accessing the arterial region of the heart hilum (i.e around the roots of the
pulmonary trunk and the aorta) extend principally towards the ventricles. In contrast to
humans, dogs and sheep (Saburkina et al., 2010), the extracardiac nerves that access at
the aorta are not visible in the pig, with porcine ventricles receiving innervation from
nerves accessing the atria (Batulevicius et al., 2008). Extrinsic nerves synapse with
specific intrinsic ganglia, although in all species substantial variability between the
location, size and number of ganglia has been noted (Saburkina et al., 2014, Pauza et al.,
2002b).
For example, the total number of ganglia in a sheep heart is on average 769 ± 52
compared to 363 ± 52 and up to 2000 in pig and canine hearts respectively (Pauza et al.,
2002a). The total numbers of neurons per heart also varies between mammalian species
as well as compared to the number thought to be present on the human heart (table
1.3).

37
Table 1.3. A comparison of the average numbers of intrinsic neurons and ganglia
present on individual hearts from a variety of species. N.B. these numbers are taken
from one study per species and numbers do vary between studies.
Species Average number of
intrinsic neurons per
heart
Average number
of intrinsic ganglia
per heart
Investigators
Mice 1082 ± 160 19 ± 3 (Rysevaite et al., 2011a)
Rat 6576 ± 317 Not documented (Batulevicius et al., 2003)
Guinea Pig 2321 ± 215 262 ± 28 (Batulevicius et al., 2005)
Rabbit 2200 ± 262 Unknown (Saburkina et al., 2014)
Dog Estimated 80000 Approx. 2000 (Pauza et al., 2002b),
(Yuan et al., 1994)
Sheep Estimated 17000 769 ± 52 (Saburkina et al., 2010)
Pig Approximately 12000 362 ± 52 (Batulevicius et al., 2008)
Human 43000-94000 836 ± 76 (Armour et al., 1997),
(Pauza et al., 2000)

38
In all species, ganglia are linked via small interconnecting commissural nerves. The
presence of such nerves reiterates the notion that ganglia and even individual neurons
within ganglia can communicate with each other in order to provide autonomic
feedback and ensure the heart as a whole is physiologically functioning efficiently.
The clusters of intrinsic ganglia and neurons that are located on the heart hilum link to
form definitive ganglionated subplexus routes. As seen in humans, individual subplexus
routes extend epicardially to specific effector sites. Even amongst larger mammals,
differences in these routes have been identified with 7 subplexuses noted in canine and
ovine hearts compared to 5 in pigs, because of the absence of innervation of the arterial
portion of the heart hilum.
As is observed in larger mammals, the extracardiac neural sources for nerves entering
the hearts of small mammals are the sympathetic ganglia at the cervicothoracic and
thoracic levels of the spinal cord and the vagus nerves (Rysevaite et al., 2011a).
Preganglionic sympathetic axons originating from neurons in the T1-T5 spinal region
project to sympathetic efferent postganglionic cardiac neurons located in the
sympathetic chain and throughout the superior and middle cervical ganglia (Norris et
al., 1977).
In mice, rats and guinea pigs, accessing nerves from the venous portion of the heart
hilum at the bifurcation of the pulmonary trunk extend epicardially and form two large
ganglionated clusters; the left and right neuronal clusters. Unlike larger mammals where
left and right extrinsic nerves overlap in front of the heart to access the same locations
(Saburkina et al., 2010), in smaller mammals, there is a complete symmetry of
sympathetic and vagal inputs to the heart. In both mice and rats, right sympathetic and
vagal nerves enter the heart hilum at the root of the right cranial vein and the left nerves
enter at the left cranial vein where they form a GP containing two clusters. As in larger
mammals, epicardial nerves extend from both clusters of ganglia to innervate specific
regions of the heart, namely the right and left ventral and dorsal regions of the atria
(Rysevaite et al., 2011a, Batulevicius et al., 2003). In comparison to humans, dogs and
other larger mammals the size and ganglia are much smaller in smaller mammals. The
total number of neurons found within the ICNS varies from 1000 in the mouse to 5500
in the rat (Batulevicius et al., 2005, Batulevicius et al., 2003, Rysevaite et al., 2011a).
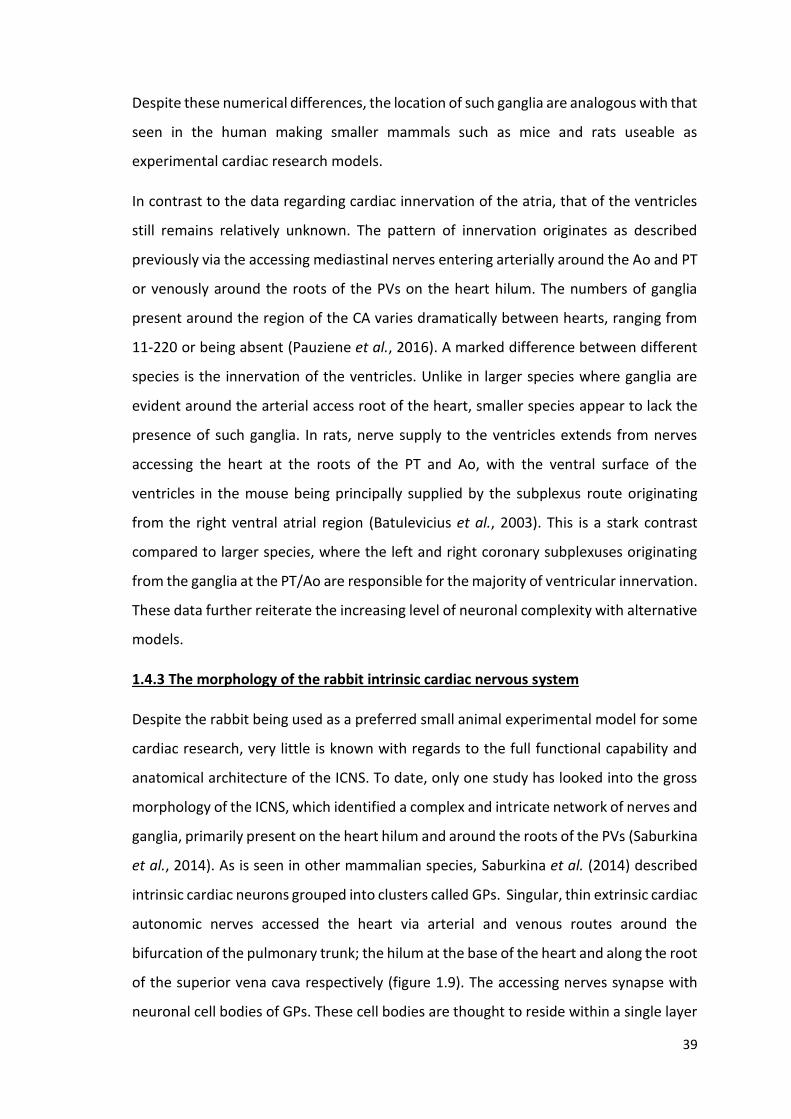
39
Despite these numerical differences, the location of such ganglia are analogous with that
seen in the human making smaller mammals such as mice and rats useable as
experimental cardiac research models.
In contrast to the data regarding cardiac innervation of the atria, that of the ventricles
still remains relatively unknown. The pattern of innervation originates as described
previously via the accessing mediastinal nerves entering arterially around the Ao and PT
or venously around the roots of the PVs on the heart hilum. The numbers of ganglia
present around the region of the CA varies dramatically between hearts, ranging from
11-220 or being absent (Pauziene et al., 2016). A marked difference between different
species is the innervation of the ventricles. Unlike in larger species where ganglia are
evident around the arterial access root of the heart, smaller species appear to lack the
presence of such ganglia. In rats, nerve supply to the ventricles extends from nerves
accessing the heart at the roots of the PT and Ao, with the ventral surface of the
ventricles in the mouse being principally supplied by the subplexus route originating
from the right ventral atrial region (Batulevicius et al., 2003). This is a stark contrast
compared to larger species, where the left and right coronary subplexuses originating
from the ganglia at the PT/Ao are responsible for the majority of ventricular innervation.
These data further reiterate the increasing level of neuronal complexity with alternative
models.
1.4.3 The morphology of the rabbit intrinsic cardiac nervous system
Despite the rabbit being used as a preferred small animal experimental model for some
cardiac research, very little is known with regards to the full functional capability and
anatomical architecture of the ICNS. To date, only one study has looked into the gross
morphology of the ICNS, which identified a complex and intricate network of nerves and
ganglia, primarily present on the heart hilum and around the roots of the PVs (Saburkina
et al., 2014). As is seen in other mammalian species, Saburkina et al. (2014) described
intrinsic cardiac neurons grouped into clusters called GPs. Singular, thin extrinsic cardiac
autonomic nerves accessed the heart via arterial and venous routes around the
bifurcation of the pulmonary trunk; the hilum at the base of the heart and along the root
of the superior vena cava respectively (figure 1.9). The accessing nerves synapse with
neuronal cell bodies of GPs. These cell bodies are thought to reside within a single layer

40
over the epicardium, however, further research involving deeper tissues is warranted.
Data produced by Saburkina et al. (2014) indicated variability between hearts in terms
of the presence of certain ganglia, yet despite this occasional variability, two large
clusters were identified:
1) The left neuronal cluster (LNC), at the roots of the left and middle PV
2) The right neuronal cluster (RNC), at the cranial aspect of the interatrial groove.
Overall the LNC consists of a larger number of cell bodies with approximately 1200 cells
compared to approximately 700 in the RNC. These differences in number of cells per
region could be indicative of the innervation pattern of specific regions of myocardium.
It is estimated that approximately 2000 intrinsic cardiac neurons reside on the hilum of
the rabbit heart (Saburkina et al., 2014), although this number varies between animals.
The majority of these neurons form ganglia ranging from 3 to over 700 cells, the largest
located beneath the PVs. The majority of these neurons show ChAT-IR suggesting
postganglionic cholinergic dominance. Throughout the rabbit intrinsic network, a lack of
Substance P-IR cell bodies is evident, implying a reduced level of neuronal control via
this specific peptide. These data are not in accord with the extensive peptidergic
network found in the rat (Richardson et al., 2003, Rysevaite et al., 2011b). Peptidergic
neuronal structures in the rabbit heart are only present in varicose fibres passing close
to intrinsic neurons. The lack of investigation into the neurotransmitter profile of the
rabbit ICNS is clear and if future physiological data is to be interpreted accurately, it is
vital that investigation into neuronal populations is systematically undertaken.

41
Figure 1.9. A topographical map of the rabbit ICNS taken from Saburkina et al., (2014).
Clusters of intrinsic cardiac ganglia are shown in red on the heart hilum, with subplexus
routes being shown with black arrowed lines. The presence of ganglia consistently
around the roots of the pulmonary veins is shown. Ao, ascending aorta; CS, coronary
sinus; CV, caudal vein; DRA, dorsal right atrial subplexus; ICNs, intrinsic cardiac neurons;
LAu, left auricle; LC, left coronary subplexus; LCV, left cranial vein; LD, left dorsal
subplexus; LNC, left neuronal cluster; LPV, left pulmonary vein; LV, left ventricle; MD,
middle dorsal subplexus; MPV, middle pulmonary vein; PT, pulmonary trunk; RAu, right
auricle; RC, right coronary subplexus; RCV, right cranial vein (superior caval vein); RNC,
right neuronal cluster; RPV, right pulmonary vein; RV, right ventricle; VLA, ventral left
atrial subplexus; VRA, ventral right atrial subplexus.

42
Intrinsic cardiac nerves extend from GPs on the heart epicardially to innervate the atria,
interatrial septum and the ventricles (Pauza et al., 2000, Saburkina et al., 2014). Two
subplexus routes extend from the arterial region of the hilum between the pulmonary
trunk and the aorta, to effector sites on the left and right ventricles: the left and right
coronary subplexuses respectively. Another five subplexuses originate from the venous
region on the heart hilum around the PVs. In general, 1) the dorsal right atrial subplexus
originates from either the right cranial vein (RCV) or the superior vena cava branching
out to supply the SA node and the dorsal region of the right atrium. 2) The middle dorsal
subplexus branching from amongst the pulmonary veins in the direction of the dorsal
coronary groove with neuronal connections with 3) the left dorsal subplexus,
terminating on dorsal left atrial and ventricular regions. Two ventral subplexuses also
exist with the sparse nerves of 4) the ventral left atrial subplexus, beginning ventrally to
the left PV and joining ganglia on the ventral left atrial region and finally, connecting the
ventral right atrium to the ventro-medial region around the superior vena cava, 5) the
right ventral subplexus. These defined routes noted in the rabbit are comparatively
similar to those previously identified in several other mammalian species demonstrating
a common trait for heterogeneous neurocardiac control by the ICNS.
The fact that subplexus neuronal projections branch onto the ventricles, emphasises the
role of the ICNS in ventricular control. Anatomical study of cardiac innervation in the
rabbit shows that small numbers of somata and by definition ganglionic plexuses are
present on sub-atrial and ventricular regions. Nerve fibres extending from ventricular
ganglia, identified at the region of the conus arteriosus extensively distribute across the
ventricular epicardium and endocardium. The widespread innervation by subplexal
neural routes from ventricular ganglia, which are mostly adrenergic (Pauziene et al.,
2016), along with the known ventricular innervation by subplexal nerves extending from
atrial ganglia (Saburkina et al., 2014) suggests a physiological role in the control of
ventricular electrophysiology.
1.4.4 Neurochemical phenotype of the ICNS
Recently, a number of studies have partially determined the neurotransmitter content
of intrinsic cardiac nerves. As mentioned previously, the ICNS was historically believed
to be a simple parasympathetic relay station, investigated using histological staining for

43
AChE. In order to fully understand the neuronal hierarchy within the ICNS, the
development of a complete neurochemical profile between species and different
ganglia within the same species is vital. Several studies have now confirmed the
presence of not only ChAT-IR neurons, indicative of postganglionic parasympathetic
neurons, but also; TH, NPY, SP, nNOS, CGRP, VIP, galanin and protein gene product 9.5
(PGP9.5). Until recently very little research looked into the neurochemical profile of the
rabbit intrinsic cardiac ganglia.
The neuromodulation of cells within cardiac ganglia is bought about by a variety of
neurotransmitters and neuromodulators including those mentioned above, with such
neurotransmitter expression showing possible species dependent expression. Intrinsic
cardiac neurons predominantly manifest as IR for ChAT i.e cholinergic with between 60-
100% of neurons ChAT-IR (Horackova et al., 2000, Hoard et al., 2007, Rysevaite et al.,
2011b, Richardson et al., 2003). Smaller percentages of neurons IR for TH (and therefore
adrenergic) are present within the ICNS however there is currently some debate as to
the actual level of adrenergic innervation (figure 1.10). Within the ICNS there are
numerous cell types including principal neurons and SIF cells (Rysevaite et al., 2011b).
SIF cells display very strong immunoreactivity for TH (figure 1.10) and are generally
located within larger ganglia, grouped into small clusters or dispersed on the walls of
the atria and ventricles (Rysevaite et al., 2011b).

44
Figure 1.10. Microphotographs illustrating the presence of both cholinergic and
adrenergic nerve fibres and neurons. Image taken from (Rysevaite et al., 2011b)
showing the predominance of ChAT-IR within the intrinsic cardiac ganglia.The ganglion
imaged (a-c) also contains biphenotypic cells (arrowheads) reactive for both ChAT and
TH. Small intensely fluorescent cells (white arrows) display very strong TH-IR and were
smaller than TH-IR nerve cells. Baskets of ChAT positive neural terminals surround
neurons (d-f). Neurons exclusively positive to TH are indicated by white crosses, positive
to ChAT only by asterisks and biphenotypic cells by white diamonds.

45
Despite the significant cholinergic dominance within intrinsic cardiac neurons, the
phenotype of the nerve fibres appears to be regionally specific. Nerves accessing the
heart are predominantly adrenergic (TH-IR), with fewer ChAT-IR nerves evident. Within
the intrinsic neural plexus at the level of the heart hilum, the majority of nerve fibres
are cholinergic, including those interconnecting individual intrinsic ganglia. This
cholinergic dominance is particularly evident within the dense meshwork of ChAT-IR
nerve fibres at the SA and AV nodal regions (Richardson et al., 2003, Rysevaite et al.,
2011b). Such dense cholinergic input to the regions around the SA and AV nodes shows
a correlation with vagal nerve stimulation activating the SA node through cholinergic
ganglia and interconnecting nerve fibres and causing a decrease in heart rate as a result
(Randall et al., 1985). In contrast to the cholinergic dominance at regions innervating
the SA and AV nodes, adrenergic fibres are more abundant within the left and right
coronary subplexuses (the neural supply of innervation to the ventricles) (Pauziene et
al., 2016).
Despite studies demonstrating ICNS-cholinergic dominance, it is also evident that there
is a high level of neurochemical variability throughout the ICNS. The neuromodulator
nNOS is localized in a smaller subpopulation of cells within cardiac ganglia and nerve
fibres (Klimaschewski et al., 1992) and commonly co-localised with ChAT-IR neurons
(Richardson et al., 2003, Hoover et al., 2009, Herring et al., 2002). This data is in accord
with functional studies where it has been shown that nNOS acts as a co-transmitter
either postsynaptically or presynaptically to modulate vagal effects (Herring et al., 2002,
Herring and Paterson, 2001, Herring et al., 2001). Neurons expressing nNOS exhibit
morphological differences allowing for the possibility that nNOS neurons may serve
different physiological functions dependent upon location and morphology. As well as
the axons from specific nNOS – IR neurons projecting to and from specific ganglia, fibres
from neurons are also distributed within specific ganglia and acting as interneurons,
suggesting the existence of possible crosstalk between neurons within specific ganglia
(Hoover et al., 2009).
The presence of populations of adrenergic neurons, shown using IR for TH, suggests the
possibility of selective GP involvement in the functional effects from sympathetic
activation. The overall proportion of TH-IR neurons in experimental models is under

46
debate with numbers varying greatly between studies (Richardson et al., 2003, Hoover
et al., 2009, Rysevaite et al., 2011b). Currently, data is not in accord regarding the
presence of principal cells IR for TH with some studies reporting a complete lack of
principal cells with a catecholaminergic phenotype (Richardson et al., 2003) compared
to others indicating catecholaminergic ganglionic neurons of larger diameter (20-40µm)
(Horackova et al., 2000, Slavikova et al., 2003) There are also reports of small
populations of biphenotypic GP neurons e.g. neurons showing both ChAT-IR and TH-IR,
which represent between 10-20% of all neurons. These data are in accord with the
electrophysiology of isolated intrinsic cardiac neurons responsive to the application of
noradrenaline in vitro (Xu and Adams, 1993) and implies that the role of an adrenergic
input to cholinergic neurons needs further investigation.
There is increasing evidence for the presence of a diverse range of neuropeptides and
neurotransmitters within the ICNS, raising questions to the extent and functional roles
of these chemicals. Recently markers for VIP have been identified in the ICNS. VIP, which
is now known to be co-released alongside acetylcholine (Kuncova et al., 2003), has been
shown to be present in fibres and cells distributed across the hilum of the heart in
several mammalian species (Steele et al., 1994, Parsons et al., 2006). As much as 100%
of the nerve fibres within a ganglia can be immunoreactive for VIP (Parsons et al., 2006,
Hoover et al., 2009, Steele et al., 1996), whilst the presence of VIP in neuronal somata
remains inconclusive. The origin of these fibres is unclear but it has been suggested that
such fibres originate from sources extrinsic to the heart i.e. the central nervous system.
CGRP and Substance P, peptidergic nociceptive afferent cardiac substances, enable the
detection of chemical signals and sensory information. In several mammalian species,
CGRP and Substance P nerve fibres are most abundant adjacent to the heart hilum.
(Rysevaite et al., 2011b). The pattern of innervation of CGRP is similar to that seen with
Substance P, although in a lesser abundance (Rysevaite et al., 2011b), with studies
showing that the majority of nerves positive for Substance P are also positive for CGRP.
The absence of ganglia demonstrating somata that are immunoreactive for either CGRP
or Substance P implies the source of these sensory nerves is external to the intrinsic
cardiac ganglia and that these nerve fibres extend from extrinsic sensory ganglia and
form varicosities around principal neurons within the ICNS (Li et al., 2014).

47
A study by Herring et al. (2012) investigated the role of the sympathetic co-transmitter,
galanin; released during high frequency sympathetic stimulation. The presence of
galanin has not been studied in depth in relation to the ICNS but the galanin receptor,
GalR1 has been localised on intrinsic cholinergic neurons at the level of the SA node,
suggesting a putative role in the ICNS. This is made furthermore intriguing by the ability
of galanin to alter vagal control of heart rate via a presynaptic pathway involving AChE,
in a way similar to NPY (Herring et al., 2012).
1.5 Autonomic control of cardiac electrophysiology: from peripheral control to the
intrinsic cardiac nervous system
As mentioned previously, the heart generates its mechanistic actions via an electrical
conduction system. The sympathetic and parasympathetic nervous systems play a
crucial role in the control of cardiac function, ultimately determining cardiac
chronotropy, dromotropy, inotropy and lusitropy.
1.5.1 Peripheral neuronal inputs to the heart
Extrinsic cardiac innervation involves postganglionic sympathetic nerve fibres and vagal
efferent fibres. These fibres are now known to interact with ganglia on the ICNS to
modulate cardiac function, however the precise extrinsic-intrinsic interaction is
currently unclear.
The interactions between sympathetic and vagal stimulation are complex, with
stimulation of both branches resulting in a heart rate change different from the algebraic
sum of stimulation of each branch individually (Brack et al. 2003). Background vagal
stimulation reduces the positive chronotropic effect of sympathetic stimulation and
background sympathetic stimulation enhances the negative chronotropic effect of vagal
stimulation (Brack et al. 2003). This relationship demonstrates the complex underlying
mechanisms involving sympatho-vagal interaction in the modulation of cardiac control.
Parasympathetic nerves densely innervate the atria, SA and AV nodes and conducting
tissue (Randall, 1984). The cervical vagi, which contain a mixture of both afferent and
efferent axons (Hoover et al., 2008, Seki et al., 2014) impact multiple cardiac electrical
and mechanical functions when stimulated including decreased heart rate and systemic
pressure (Ardell et al., 2015). The vagus nerves are thought to be diverse in their roles

48
in cardiac control. Greater innervation of the SA node comes from the right vagus nerve
in comparison to the left, with the left vagus being shown to produce a more significant
change in cardiac dromotropy when compared to the right (Ardell and Randall, 1986,
Brack et al. 2003), demonstrating the functional importance of vagal innervation of the
heart. Furthermore, reduced activity of the vagus is a key factor in sudden cardiac death
and life threatening arrhythmias, with therapy involving the stimulation of the vagus
recently being translated into a novel treatment for heart failure; INOVATE-HF
(Hauptman et al., 2012). Despite this, the precise mechanism by which patient outcome
could be improved using vagal stimulation is yet to be fully understood.
Vagus nerve stimulation (VNS) provides protection against induced VF, demonstrated
by an increase in VF threshold (VFT) (Ng et al., 2007). Dogma states that this protection
occurs via ACh and muscarinic receptors but the discovery that this increase in VFT was
maintained during muscarinic receptor blockade (Brack et al., 2011) showed that the
anti-fibrillatory effects were mediated via alternative mechanisms. In a recent review of
the cardiac vagus nerve, three mechanisms of influencing the myocardium were
described (Coote, 2013). The first mechanism involves direct interaction with
sympathetic nerves, the second: an independent vagal action and third and most
relevant for this work, through an interaction with neurons of the intrinsic cardiac nerve
plexus.
The involvement of the peripheral autonomic nervous system in the control of certain
cardiodynamics including action potential duration restitution, VFT and heart rate has
been shown in vitro using an isolated innervated Langendorff rabbit model (Brack et al.,
2013), in turn providing a significant insight into mechanisms of cardiac regulation.
Similar to that seen with vagal nerve stimulation, functional heterogeneity between the
left and right sympathetic paravertebral chains is well documented and quantification
in the comparison between the outputs of both nerve supplies, confirms functional and
electrophysiological differences in response to nerve stimulation and denervation
(Winter et al., 2012). Nerves arising from the left sympathetic chain influence left
ventricular contractility and electrical conduction via the atrioventricular node to a
greater degree than the right, whilst the nerves arising from the right hand side have a
more significant effect on sinus rate via the SA node (Winter et al., 2012). It is now a
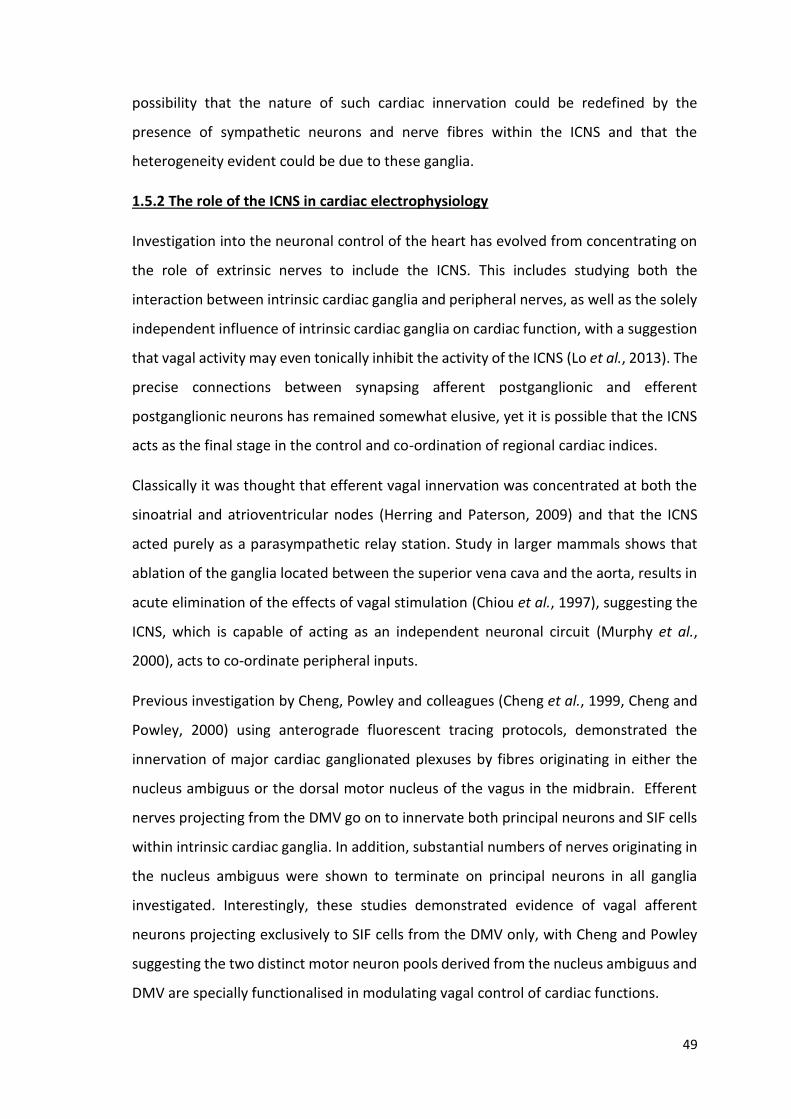
49
possibility that the nature of such cardiac innervation could be redefined by the
presence of sympathetic neurons and nerve fibres within the ICNS and that the
heterogeneity evident could be due to these ganglia.
1.5.2 The role of the ICNS in cardiac electrophysiology
Investigation into the neuronal control of the heart has evolved from concentrating on
the role of extrinsic nerves to include the ICNS. This includes studying both the
interaction between intrinsic cardiac ganglia and peripheral nerves, as well as the solely
independent influence of intrinsic cardiac ganglia on cardiac function, with a suggestion
that vagal activity may even tonically inhibit the activity of the ICNS (Lo et al., 2013). The
precise connections between synapsing afferent postganglionic and efferent
postganglionic neurons has remained somewhat elusive, yet it is possible that the ICNS
acts as the final stage in the control and co-ordination of regional cardiac indices.
Classically it was thought that efferent vagal innervation was concentrated at both the
sinoatrial and atrioventricular nodes (Herring and Paterson, 2009) and that the ICNS
acted purely as a parasympathetic relay station. Study in larger mammals shows that
ablation of the ganglia located between the superior vena cava and the aorta, results in
acute elimination of the effects of vagal stimulation (Chiou et al., 1997), suggesting the
ICNS, which is capable of acting as an independent neuronal circuit (Murphy et al.,
2000), acts to co-ordinate peripheral inputs.
Previous investigation by Cheng, Powley and colleagues (Cheng et al., 1999, Cheng and
Powley, 2000) using anterograde fluorescent tracing protocols, demonstrated the
innervation of major cardiac ganglionated plexuses by fibres originating in either the
nucleus ambiguus or the dorsal motor nucleus of the vagus in the midbrain. Efferent
nerves projecting from the DMV go on to innervate both principal neurons and SIF cells
within intrinsic cardiac ganglia. In addition, substantial numbers of nerves originating in
the nucleus ambiguus were shown to terminate on principal neurons in all ganglia
investigated. Interestingly, these studies demonstrated evidence of vagal afferent
neurons projecting exclusively to SIF cells from the DMV only, with Cheng and Powley
suggesting the two distinct motor neuron pools derived from the nucleus ambiguus and
DMV are specially functionalised in modulating vagal control of cardiac functions.

50
Previous beliefs surfaced around the idea that individual GPs were solely responsible for
the innervation of a specific adjacent region of the heart, e.g. the right atrial GP (RAGP)
to innervate and affect the SA node and the inferior vena cava-inferior left atrial GP (IVC-
ILA GP) regulating the atrioventricular node (Lazzara et al., 1973). It is now well
documented that GPs innervate adjacent regions but can also alter cardiac outputs
further afield, via intra- and interganglionic communication (Hou et al., 2007a, Liao et
al., 2015). The co-ordination of neuronal inputs and outputs within the ICNS depends
upon the nature of the afferent nerve supply, the efferent neuronal inputs received from
the central / peripheral sympathetic and parasympathetic nerves and the intrinsic
connections within the ICNS via local circuit neurons.
Using both electrical and chemical stimulation of ganglia and neurons, possible intra-
ganglionic interactions have been identified. The principal excitatory neurotransmitter
in intracardiac ganglionic synapses (Priola et al., 1977) is acetylcholine, with responses
evoked through nicotinic receptors (Smith, 1999). Chemical stimulation of specific GPs
through an injection of nicotine to simulate activation, elicits 3 typical responses: 1)
bradycardia alone, 2) tachycardia alone and 3) a biphasic response of bradycardia
followed by tachycardia (Cardinal et al., 2009). This functional data implies the presence
of both catecholaminergic and adrenergic neurons within the same loci to produce such
a biphenotypic response that corresponds with anatomical and neurochemical data
previously discussed (section 1.4.4).
Whilst the role of the right atrial and inferior vena cava-inferior left atrial ganglionic
plexuses in chronotropy and AV node conduction has been confirmed by multiple
studies of the same group (Ardell and Randall, 1986, Cardinal et al., 2009, Randall et al.,
2003), it is now evident that intrinsic cardiac neurons from all GPs at the atrial level of
the heart are involved in some sort of cardiac regulation (figure 1.11). Selective ablation
of specific ganglia within the ICNS leads to a disruption in neuronal modulation of the
heart (Randall et al., 2003, Randall et al., 1992). Under normal circumstances, stress
leads to a biphasic increase in heart rate (Randall et al., 1998) with an initial rapid
acceleration followed by a prolonged further increase. Original hypotheses led to the
idea that such a heart rate response would be diminished or even abolished when the
right atrial GP were ablated. This however is not the case, with ablation of this GP only

51
blunting the initial acceleration phase and being ineffective at impacting on the
prolonged phase (Randall et al., 1998). Multiple intrinsic ganglia therefore innervate the
same region i.e. the RAGP and the posterior atrial GP (PAGP) innervating the sinoatrial
node. As a result of this complex interaction between individual ganglia within the ICNS
as well as with central neuronal networks (Armour, 2011), it is important that all ganglia
are examined in concert in order to develop a comprehensive understanding of the
functional role of the ICNS in cardiac control. This is further reiterated by anatomical
data demonstrated by (Gray et al., 2004) showing the complex level of interaction not
only between functional cardiac regions but also between individual ganglia.
Although the functional role of the ICNS is of increasing interest as the final stage of
control of cardiac function (Armour, 2004), gaps are still evident in the information and
data available demonstrating the need for further study of the ICNS as a whole. All
regions of the ICNS are capable of producing changes in cardiac chronotropy and
dromotropy when stimulated, with the ICNS recently being attributed to preventing
further damage during central neuronal dysregulation in disease and protecting the
heart against the central predisposition to increased susceptibility of cardiac
arrhythmias.

52
Figure 1.11. The functional interactions of the ICNS. A summary of the proposed
functional interconnections between the anterior right GP (ARGP), the inferior right GP
(IRGP) and the superior left GP (SLGP) during control of sinoatrial and atrioventricular
nodal function in a canine model (Hou et al., 2007a).

53
1.6 The clinical relevance of studying the autonomic nervous control of the heart
The high burden of cardiovascular disease means it is vital that potential and relevant
treatments are constantly being investigated. It is well recognised that the ANS plays a
role in the development of cardiac diseases including cardiac arrhythmias, MI and HF (La
Rovere et al., 1998, Ng, 2016, Nolan et al., 1998) . The potential involvement of the ICNS
could provide putative links to develop prophylactic treatments.
1.6.1 Myocardial Infarction and heart failure
‘Normal’ cardiac function implies a certain level of co-ordination of the heart in order to
provide a significant enough hydraulic power for it to fulfil its purpose of sufficiently
maintaining circulation and cardiac output. Following myocardial infarction, ‘normal’
cardiac function begins to fail. Myocardial infarction, often caused by disease of the
coronary artery, results in significant deleterious effects on cardiac function including a
reduction in the number of functional myocytes in the heart and abnormal regional wall
motion. To try and compensate for reduced pump efficiency and in an aim to maintain
cardiac output and blood pressure (Poole-Wilson, 1993), structural and functional
remodelling of the heart and also systemic remodelling occurs. Increased wall tension
due to abnormal contraction of the ventricle produces local changes to the heart
including significant cardiac and in particular, left ventricular hypertrophy. Pressure
overload due to obstruction of outflow and reduced ventricular contraction causes
increased back pressure from the left ventricle. In turn this leads to pulmonary
congestion, right ventricular overload and hepatic congestion (Ng et al., 1998).
In concert with and often preceding these structural and functional changes at the organ
level, is a dysregulation in the cardiac autonomic control of the heart. Heart failure sees
an increased level of sympathetic drive to preserve cardiac output (Triposkiadis et al.,
2009a) alongside a withdrawal of parasympathetic tone. The primary mechanism
involved in increased sympathoexcitation is the reduced sensitivity of reflexes including
the arterial baroreflex and cardiopulmonary reflexes (Zucker et al., 2009) accompanied
by alterations in circulating and local hormonal factors e.g. nitric oxide.
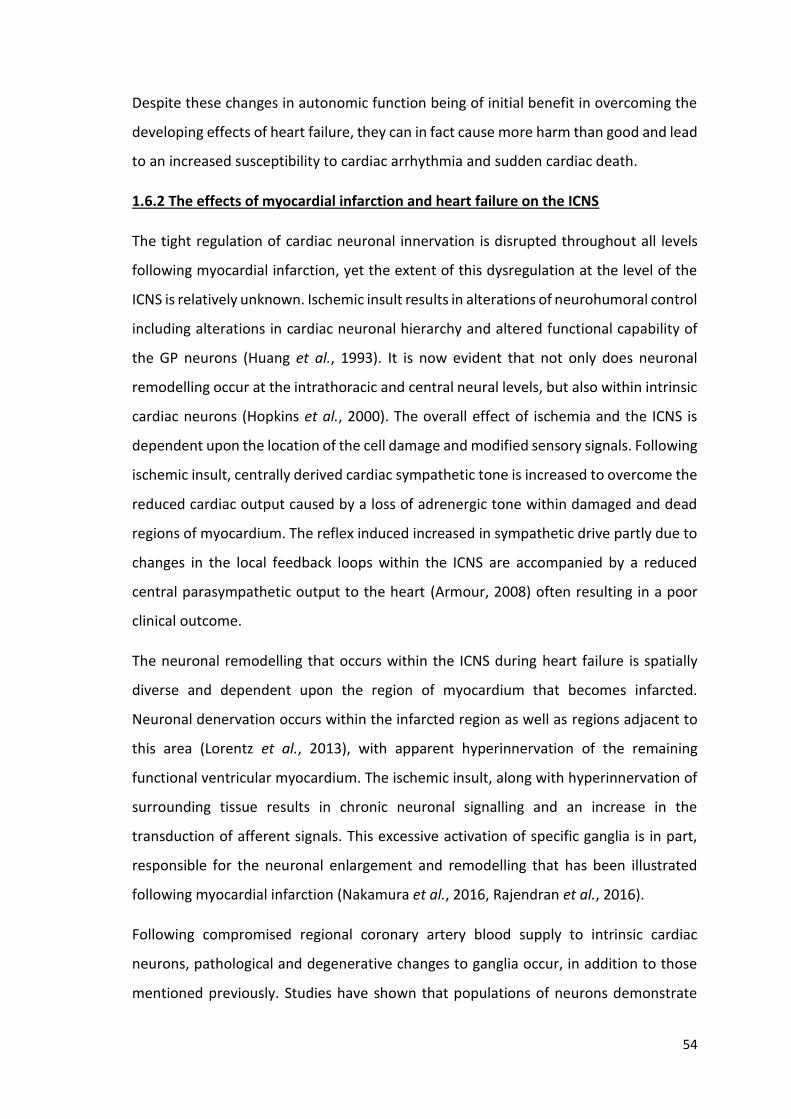
54
Despite these changes in autonomic function being of initial benefit in overcoming the
developing effects of heart failure, they can in fact cause more harm than good and lead
to an increased susceptibility to cardiac arrhythmia and sudden cardiac death.
1.6.2 The effects of myocardial infarction and heart failure on the ICNS
The tight regulation of cardiac neuronal innervation is disrupted throughout all levels
following myocardial infarction, yet the extent of this dysregulation at the level of the
ICNS is relatively unknown. Ischemic insult results in alterations of neurohumoral control
including alterations in cardiac neuronal hierarchy and altered functional capability of
the GP neurons (Huang et al., 1993). It is now evident that not only does neuronal
remodelling occur at the intrathoracic and central neural levels, but also within intrinsic
cardiac neurons (Hopkins et al., 2000). The overall effect of ischemia and the ICNS is
dependent upon the location of the cell damage and modified sensory signals. Following
ischemic insult, centrally derived cardiac sympathetic tone is increased to overcome the
reduced cardiac output caused by a loss of adrenergic tone within damaged and dead
regions of myocardium. The reflex induced increased in sympathetic drive partly due to
changes in the local feedback loops within the ICNS are accompanied by a reduced
central parasympathetic output to the heart (Armour, 2008) often resulting in a poor
clinical outcome.
The neuronal remodelling that occurs within the ICNS during heart failure is spatially
diverse and dependent upon the region of myocardium that becomes infarcted.
Neuronal denervation occurs within the infarcted region as well as regions adjacent to
this area (Lorentz et al., 2013), with apparent hyperinnervation of the remaining
functional ventricular myocardium. The ischemic insult, along with hyperinnervation of
surrounding tissue results in chronic neuronal signalling and an increase in the
transduction of afferent signals. This excessive activation of specific ganglia is in part,
responsible for the neuronal enlargement and remodelling that has been illustrated
following myocardial infarction (Nakamura et al., 2016, Rajendran et al., 2016).
Following compromised regional coronary artery blood supply to intrinsic cardiac
neurons, pathological and degenerative changes to ganglia occur, in addition to those
mentioned previously. Studies have shown that populations of neurons demonstrate

55
abnormal appearance compared to those seen in control conditions, with neurons
becoming enlarged (Hopkins et al., 2000, Rajendran et al., 2016), degenerative changes
to dendrites and axons and frequently with an increased presence of cytoplasmic
inclusions, a resemblance of results commonly seen in patients with neuronal
degeneration disorders (Singh et al., 2013). The pathological changes to and
hypertrophy of intrinsic cardiac neurons caused by HF (figure 1.12), leads to an increased
possibility of neurons failing to reach their excitability threshold and is potentially a
cause of parasympathetic withdrawal (Singh et al., 2013).

56
Figure 1.12. Micrographs showing examples of representative neurons taken from
ganglia in human hearts. A and B show neurons of normal hearts and C and D are taken
from a heart where ischemic heart failure was evident. Neurons in ischaemic human
hearts demonstrate significant enlargement with evidence of oedema compared to
those seen in normal hearts. Neurons examined in the failing heart also appeared much
paler than those in normal hearts with a notably lighter cytoplasm. Image taken from
Singh et al. (2013). Scale bars = 20µm.
57
MI is known to alter the ability of afferent intrinsic cardiac neurons to transduce
mechanosensitive inputs. Afferent nerve activity from infarcted regions of tissue are
generally reduced, whilst intracardiac local circuit neurons become hyperactive to
transduce both afferent and efferent inputs from the remaining healthy myocardium
(Rajendran et al., 2016).
Significant phenotypic change is evident throughout the ICNS as a result of heart failure.
The reorganisation and remodelling of the ICNS, demonstrated in part to be triggered
by spinal cord neurons, is linked to the increased intrinsic cardiac neuronal excitability.
Neuronal remodelling is thought to be most dynamic within the first 7 days following an
MI and is accompanied by increased adrenergic sensitivity and increased nNOS
expression within parasympathetic postganglionic intrinsic cardiac neurons (Hardwick
et al., 2014). Neuronal remodelling occurs primarily within regions of non-infarcted
myocardium, presumably enabling the ICNS to cope with the damage caused and
allowing cardiac function to be maintained. It has been hypothesised that this increase
in nNOS expression has evolved in order to provide a protective purpose, reducing the
initial increase in sympathetic drive and increasing the capabilities of the
parasympathetic neuronal inputs (Hardwick et al., 2014) . Ganglia known to innervate
the ventricles (including the ventral interventricular GP (VIV-GP) in the dog), with a likely
connection to infarcted and damaged myocardium, show an MI-induced decrease in
cholinergic phenotype (Huang et al., 1993), correlating with the central withdrawal of
parasympathetic tone.
Overall the functional connectivity within the ICNS is significantly altered, potentially
decreasing the capacity of the neuronal control of the heart to maintain cardiac stability.
One important question remains relatively unanswered: does the remodelling seen
following MI affect the communication between extrinsic and intrinsic cardiac neurons
therefore altering the ability of the heart to cope with reduced function and leading to
further injury? Evidence so far suggests that following damage and cardiac insult,
adaptation of the neurons and neuronal connections within the ICNS occurs in an
attempt to maintain the sympathovagal balance (Singh et al., 2013, Rajendran et al.,
2016), with the aim of a reduction in the destabilising factors that arise from such
events.

58
1.6.3 Cardiac arrhythmia and the ICNS
There is increasingly strong evidence that impairment in cardiac autonomic control leads
to an increased susceptibility to lethal arrhythmias (Shen and Zipes, 2014). Due to an
incomplete understanding of these complex multifactorial diseases, atrial and
ventricular arrhythmias and the resultant SCD have a high mortality rate to which there
is currently no effective prophylactic treatment.
An increase in sympathetic drive, accompanied by a withdrawal of parasympathetic tone
significantly increases the susceptibility of the heart to cardiac arrhythmias. Previous
study by Verrier et al. (1974) demonstrated that an increase in sympathetic stimulation
via the stellate ganglion increased the vulnerability of the heart to ventricular fibrillation.
Conversely, it was demonstrated by Einbrodt (1859) more than 100 years ago with the
aid of an inductorium (a means of delivering repetitive stimuli), that stimulation of vagal
nerves can lead to an increase in the threshold to ventricular fibrillation, therefore
implying a reduced susceptibility to VF.
Current treatment of autonomic dysfunction in clinical patients includes the
administration of beta-blockers in order to reduce the increasing sympathetic drive.
Treatment of arrhythmia with beta-blockers however is crude and is not always
successful due to the lack of understanding of the underlying mechanisms resulting in
arrhythmia.
Atrial fibrillation is the most common cardiac arrhythmia, with preventative measures
currently including cardiac ablation. Cardiac ablation is continually evolving in the aim
of improving patient outcome, however this technique is not without its limitations. The
role of the intrinsic cardiac ganglia in the initiation and maintenance of atrial fibrillation
has become increasingly apparent with the continual development in the understanding
of the anatomy and functional capabilities of such ganglia. In spite of ablation therapy
commonly being used to try and prevent recurrent AF, such therapy doesn’t account for
the significant level of remodelling that can occur within the nerves and ganglia of the
ICNS (Yu et al., 2012). Changes following ablation therapy which include increased levels
of adrenergic/sympathetic neurons in atrial ganglionic plexuses and an increased
density of acetylcholine positively labelled neurons (notably in the ventral left atrial

59
region) could alter the effects of ablation therapy and render it inadequate in controlling
the initiation of AF.
The ability of the ICNS to function independently to extrinsic neural inputs provides the
basis for the intrinsic cardiac ganglia playing a possible role in the initiation of
arrhythmogenesis. This independent function and the ability of the ICNS to remodel also
lead us to ask the question as to what the role of the ICNS is in the transplanted heart.
Unfortunately to date, little is known with regards to answering the question, although
the fact that the peripheral neural inputs are no longer ‘connected’ suggests that the
ICNS is key to enable the continuing functioning of the heart.
With a widening appreciation of the role of ICNS in cardiac control, questions have
emerged as to whether it is possible to utilise this system for prophylactic measures in
terms of cardiac fibrillation? Liao et al. (2015) investigated the role of the ICNS in AF
suppression and found that during low level baroreceptor BRS, ganglia in the superior
right and anterior right regions of the heart showed reduced neural activity. Despite this,
only two regions of ganglia were investigated and it is likely that when targeting clusters
of neuronal somata, selective targeting may not be possible. It is known from the
anatomical studies individual cells and ganglia are linked via thinner commissural nerves
and local circuit neurons (Saburkina et al., 2014, Armour, 2007). Therefore, it is possible
that a direct correlation between functional neural activities is not a direct outcome of
the stimulation of specific ganglia.
Despite the knowledge that hot spots of electrical activity or “nest sites” (Chang et al.,
2014) are primarily located around atrial/PV junctions and that selective ablation
significantly reduces AF inducibility, ablation does not completely abolish AF in all cases.
There is also potential to denervate the ventricles. In addition, although GP ablation
substantially increases the success rate in freedom from AF, isolation of a specific GP i.e.
without PVI or circumferential isolation, can lead to early recurrence of AF. Subsequent
and additive PVI is often required to reduce recurrence, indicating that understanding
the precise locations and functionality of individual GP are crucial in helping to develop
a prophylactic treatment. Despite ablation becoming increasingly common, it is not
without its pitfalls. This was demonstrated by both Osman et al. (2010), who reported
that patients undergoing pulmonary vein isolation for treatment of AF have gone on to

60
develop VF and by He et al. (2013) who showed that ablation of GPs during PVI in
patients with structural heart disease actually increase the likelihood of lethal cardiac
arrhythmias. This therefore emphasises further the multiple underlying mechanisms of
cardiac arrhythmia that still require investigation and the complexity of treating such
diseases.
The majority of studies to date have concentrated on the role of the ICNS in atrial
fibrillation, with limited study investigating the influence of the ICNS on ventricular
electrophysiological properties (He et al., 2013). Activation of GPs by electrical
stimulation results in a prolongation of the ventricular effective refractory period (ERP)
i.e. the period following on from a previous action potential where there is an
insufficient magnitude of depolarisation to reach the threshold for the generation of the
following action potential. However, GP ablation in the same mammalian model in
healthy hearts also leads to a prolongation in ventricular ERP, with no corresponding
change in the VFT (He et al., 2013). In comparison, GP ablation of corresponding regions
of ganglia in a model of acute myocardial infarction significantly promotes ventricular
arrhythmia, presumably as a result of the reduction of intrinsic parasympathetic
neurons adding to the central reduction in parasympathetic tone.

61
1.7 Aims
The ICNS, a heterogeneous collection of nerves and ganglionic plexuses is the final stage
of cardiac neuronal control, playing a vital role in the regulation of cardiac chronotropy
and dromotropy. Despite this and the fact that the rabbit is commonly used to
investigate cardiac electrophysiology, there is very little knowledge regarding the
anatomy and topography of the ICNS and also the functional role of the intrinsic cardiac
ganglia in cardiac control in the rabbit.
The aims and objectives of this study were therefore:
1) To characterise the coronary artery ligation model of heart failure in the rabbit
This model, which was first developed and characterised by Pye et al. (1996), has
recently been used to assess the autonomic modulation on various aspects of
cardiac electrophysiology in a rabbit heart failure model. To ensure the
development of comparable degrees of heart failure and dysfunction similar to
those described previously, this coronary artery model of heart failure will firstly
be characterised.
2) To examine the anatomy and topography of the ICNS and investigate the
effects of heart failure
The main aim of this study will be to determine the gross anatomy of the rabbit
ICNS. To date, only one study has investigated the anatomy of the rabbit ICNS
(Saburkina et al., 2014). To ensure further investigation done within this project
correlated with previous publication and therefore advancing current knowledge
of the ICNS, histological staining for acetylcholinesterase in a pressure distended
whole heart preparation will be carried out.
It is proposed that the ICNS undergoes structural and functional remodelling as
a result of myocardial infarction and heart failure (Rajendran et al., 2016,
Nakamura et al., 2016). Furthermore, dysregulation of the central autonomic
nervous system is known to occur following MI. Despite this, the information
regarding the involvement of the ICNS in HF is lacking. The next stage of this
study will therefore be to extend pre-existing knowledge of the rabbit ICNS by

62
investigating the effects of MI and HF on the gross anatomy of the rabbit ICNS in
the coronary artery ligation model of heart failure initially characterised.
Current literature demonstrates that the ICNS is not merely a parasympathetic
relay station with numerous studies in several mammalian species showing that
not only sympathetic and parasympathetic neurons are present, but the ICNS
also consists of numerous other neuromodulators and neuropeptides. In order
to understand the functional role of the ICNS in cardiac control, a more
comprehensive and detailed map of the intricate nerve plexuses is needed. The
next part of this study will therefore be to characterize the neurochemical
phenotype of the rabbit ICNS using immunofluorescent markers for ChAT, TH and
nNOS.
3) To determine the functional role of the ICNS
The final part of this study will be designed to determine the functional role of
the rabbit ICNS in controlling specific cardiac indices including heart rate and
atrioventricular conduction and in particular, investigating alterations in such
control during HF.
63
Chapter 2: Materials and Methods
2.1 Experimental animals
Adult male New Zealand white rabbits were used throughout this study. Animals used
solely for terminal procedures were obtained directly from Envigo (Harlan Laboratories,
Loughborough, UK) whilst those used as part of the study of heart failure in a rabbit
model were originally obtained from Charles River Laboratories, France and housed in
environmentally controlled rooms (lights on from 06:00 to 18:00) within the University
of Leicester Preclinical Research Facility (PRF) for a minimum of three weeks prior to
surgery (figure 2.1). Food and water were provided ad libitum.
2.1.1 Ethical statement
All procedures were undertaken in accordance with the UK Animals (Scientific
Procedures) Act 1985 and the Guide for the Care of Use of Laboratory Animals Published
by the US National Institutes of Health (NIH Publication No. 85-23, revised 1985) and the
European Union directive on the protection of animals for scientific research
(2010/63/EU). Local ethics approval was obtained from the University of Leicester
animal welfare review board (AWERB) under the Home Office Project Licence PPL
70/8501.

64
Figure 2.1. The process of experimental protocols used within this study. The order in
which various parts of this study were conducted are illustrated in the above flow chart.
Animals used in the control group, where no surgery was carried out prior to terminal
experiments, are illustrated with blue lines. Those used in the HF and sham operated
groups are illustrated using black lines.
65
2.2 Coronary artery ligation in the rabbit: a model of heart failure
Numerous animal models have been used previously with the aim of studying heart
failure (Dawson et al., 2008, Hardwick et al., 2014, Ng et al., 1998, Olivas et al., 2016) all
resulting in varying final states of heart failure. With the aim of providing a potential
insight into clinical heart failure in humans and determining the level of involvement of
the intrinsic cardiac nervous system, a suitable and comparable animal model is
necessary. A rabbit coronary artery ligation model of heart failure previously established
in the Department of Cardiology, Glasgow Royal Infirmary by Dr Maurice Pye and Prof.
Stuart Cobbe (Pye et al., 1996) and further developed and modified by Prof G Andre Ng
and Dr S H Chin (Chin, 2017) in the department of Cardiovascular Sciences, University of
Leicester was used throughout this study.
The animal model described in this study induces heart failure through the induction of
an apical infarct. The use of complete coronary artery ligation to induce myocardial
infarction results in a variable loss of myocardial function dependent upon the initial size
of the infarct. Accompanied by the development of left ventricular dilatation, increased
filling pressures and a reduction in systolic function (Pye et al., 1996, Sabbah et al.,
1991), characteristics echoing those seen in heart failure patients (Cohn et al., 2000)
make this model clinically relevant.
Adult male New Zealand White rabbits (2.9-3.5kg) were premedicated with Ketaset
(ketamine, 0.15ml/kg, Fort Dodge, UK), Sedator (medetomidine hydrochloride,
0.2 ml/kg, Dechra, UK) and Torbugesic (butorphanol, 0.01 ml/kg, Fort Dodge, UK) via
subcutaneous injection. Following stable sedation, the marginal ear vein was cannulated
with a 1F-butterfly infusion needle and 5ml saline administered. Perioperative
prophylactic antibiotics were given via subcutaneous injection of Baytril (enrofloxacin,
0.2ml/kg) along with an injection of Metacam (meloxicam, 0.2mg/kg, 2mg/ml)
subcutaneously for the relief of pain and inflammation. The rabbit was ventilated with
4% oxygen through a small animal mask whilst the anterior chest wall was shaved and
further sedation was administered subcutaneously containing Ketaset (ketamine,
75µl/kg, Fort Dodge, UK) and Sedator (medetomidine hydrochloride, 0.1ml/kg. Dechra,
UK).
66
Rabbits were intubated with a size 2.5 – 3.0 cuffed endotracheal tube inserted over a
soft-tipped wire introducer with the aid of a laryngoscope. The endotracheal tube was
inserted to approximately 14 – 15cm to the level of the incisors and the cuff fully inflated
to secure the tube and prevent movement and irritation of the trachea. Following
transfer of the rabbit to the operating table the endotracheal tube was connected to a
Harvard small animal ventilator. The rabbit was ventilated with a mixture of oxygen and
1-2% isofluorane at a tidal volume of 15ml at a rate of 30 breaths per minute.
Body temperature was monitored and maintained throughout by means of a
thermostatically controlled heated table. Heart rate and levels of oxygen saturation
were monitored using an animal pulse oximeter and heart rate monitor attached to the
ear of the rabbit.
The shaved anterior region of the chest wall was cleaned and sterilised using a
chlorhexidine scrub, followed by a final wash with iodine solution. Following local
analgesia injection (Marcain, (bupivacaine), 0.1ml at each injection site) at ribs 2-5, a left
thoracotomy was performed through the 4th intercostal space. Upon entry of the pleural
cavity, the deflated left lung was gently retracted and the cavity packed with swabs to
prevent damage to the lungs. An incision was made into the pericardium at the level of
AV groove and extended laterally. Following excision, a clamp was placed at the apical
region of the pericardium and used to evert the heart. A tie placed through the apex of
the ventricle for control of heart manipulation. The large marginal branch of the left
circumflex coronary artery which supplies the left ventricular apex and the majority of
the left ventricular free wall was identified and ligated using 4/0 Monocryl suture.
Ligation was carried out midway between the left atrial appendage and the cardiac apex,
resulting in a homogeneous transmural apical infarct occupying approximately 30- 40%
of the LV myocardium. Following occlusion, a period of 20 minutes observation was
carried out in order to monitor the occurrence of cardiac arrhythmia. Ventricular
fibrillation occurred in 4% of cases at approximately 16 minutes following coronary
artery occlusion and defibrillation undertaken with a 3J DC shock via small sterilised
paddles applied directly on the epicardial surface of the heart.
Once the animal was deemed to be stable, the collapsed left lung was reinflated by
occluding the ventilator outlet and the chest closed using 3 x 1/0 interrupted sutures in

67
the deep muscle layer bringing the ribs together. The remaining muscle layers were
closed using 3/0 interrupted sutures and finally 6/0 Vicryl suture was used to close the
skin with a continuous subcuticular mattress suture. A total of 20ml saline was
administered intravenously throughout surgery with 5ml being given at approximately
30 minute intervals to replace perioperative fluid losses.
Following wound closure, reversal of sedation was achieved using a subcutaneous
injection of Atipam (atipamezole hydrochloride, 0.2ml/kg) along with the subcutaneous
administration of analgesia; 0.05mg/kg Vetergesic (buprenorphine hydrochloride
0.3mg/ml. Once stable, the animals were allowed to recover in a warm, clean, quiet
environment with necessary monitoring for any signs of distress.
The animals were monitored closely for a 5 days with a further 4 doses (morning and
evening) of Vetergesic being given subcutaneously alongside morning oral doses of
Metacam for 5 days following surgery. Heart failure was allowed to develop and the
animals allowed to recover for up to 8 weeks, at which time terminal experimental
studies were carried out.
Sham operated animals underwent comparable surgery including thoracotomy,
pericardium incision and the same manipulation of the heart to position a tie at the apex
of the left ventricle but without the ligation of the coronary artery. These animals were
used as controls for age and weight and the overall impact of the surgical procedure
however without the development of coronary ligation induced heart failure. As with
the animals that underwent coronary artery ligation, the terminal experimental studies
were carried out 8 weeks following recovery.
2.2.1 Echocardiography and ex-vivo MRI
Ultrasound and echocardiography were first recorded in the 1950’s, with Swedish
investigators Edler and Hertz (1954) being the first to record cardiac structure
movements. Echocardiography is commonly used in clinical situations as a method for
non-invasive imaging and as a diagnostic tool to assess the structural, functional and
haemodynamic status of the cardiovascular system. Using echocardiography, clinicians
are able to assess sizes of cardiac chambers, evaluate the performance of the ventricles
and to investigate valvular function. Data produced using echocardiography can provide

68
a reasonable visual estimate of ventricular performance and using two-dimensional
measurements of left ventricular end diastolic and systolic volume, left ventricular
ejection fraction (LVEF) can be calculated. LVEF is commonly used as an indicator of
heart failure with an ejection fraction of 40% or less indicating moderate or severe
ventricular dysfunction. The correlation between heart failure development and a
depression in ejection fraction has previously been characterised in a rabbit model using
coronary artery ligation, with a close association between the infarct size and level of
ventricular dysfunction being shown (Pye et al., 1996).
Echocardiography was performed by Pott Pongpaupattanakul, 8 weeks following
coronary ligation surgery, prior to sacrifice for the experimental studies, in order to
assess in vivo cardiac performance. This was performed using a L125 array 50nm probe
with a Philips HDI 5000 sonograph. Animals were pre-medicated with Ketaset (ketamine,
0.15ml/kg, Fort Dodge, UK), Sedator (medetomidine hydrochloride, 0.2 ml/kg, Dechra,
UK) and Torbugesic (butorphanol, 0.01 ml/kg, Fort Dodge, UK) via subcutaneous
injection. The anterior chest wall was shaved to provide a reasonable echo window and
the animal positioned in a left lateral position. Ejection fraction (EF) was assessed using
a parasternal short axis view at a level just below the tips of the mitral valve leaflets. The
endocardial border was outlined in frames captured during the end-diastolic and end-
systolic phases and the enclosed area automatically computed.
EF was calculated as:
EF = stroke volume (end-diastolic volume (EDV) – end systolic volume (ESV)) / EDV
This calculation was based upon the assumption that the LV is ellipsoid and therefore
the estimation of the area calculated was translated into the ejection fraction; a
measurement of volume.
2.2.2 MRI and image processing
Ex-vivo MRI was carried out at the state-of-the-art University of Leicester Central
Research Facility by Dr Michael Kelly, Preclinical Imaging Manager. Hearts were
retrieved following Langendorff perfusion following on from terminal functional
experimental procedures and were fixed and stored in PFA (4%) until imaging. Prior to
imaging, intact excised rabbit hearts were placed in test tubes filled with a proton-free
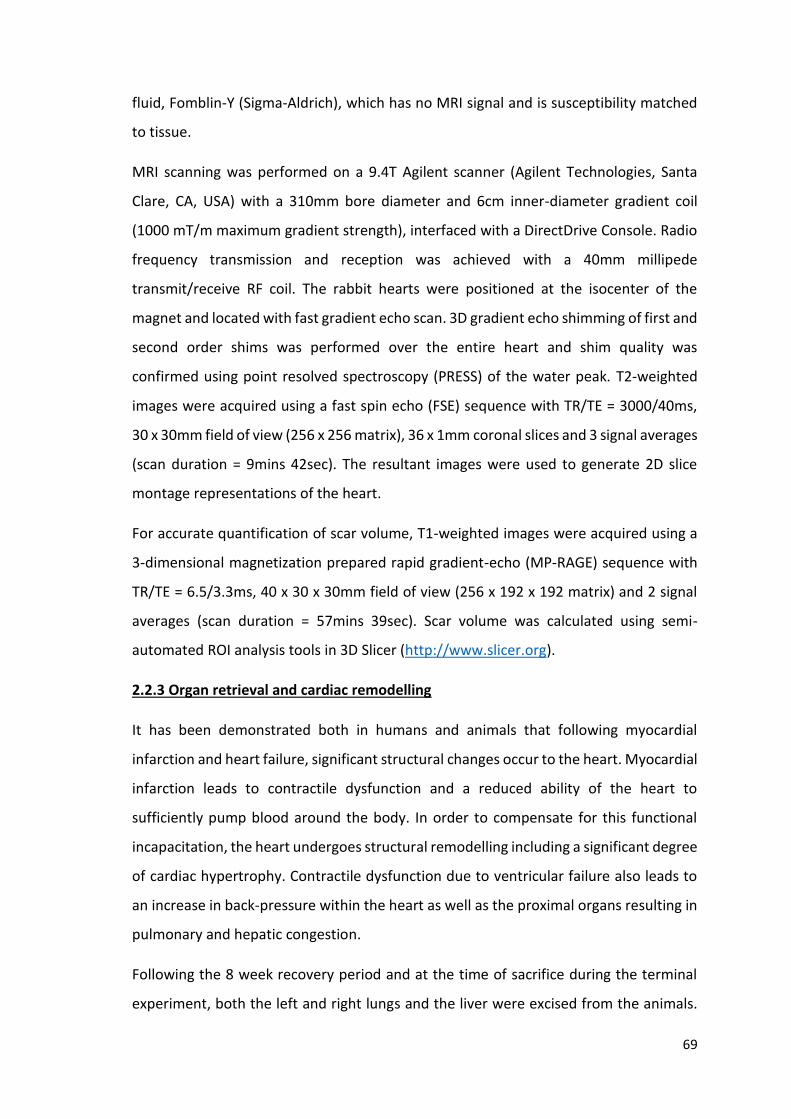
69
fluid, Fomblin-Y (Sigma-Aldrich), which has no MRI signal and is susceptibility matched
to tissue.
MRI scanning was performed on a 9.4T Agilent scanner (Agilent Technologies, Santa
Clare, CA, USA) with a 310mm bore diameter and 6cm inner-diameter gradient coil
(1000 mT/m maximum gradient strength), interfaced with a DirectDrive Console. Radio
frequency transmission and reception was achieved with a 40mm millipede
transmit/receive RF coil. The rabbit hearts were positioned at the isocenter of the
magnet and located with fast gradient echo scan. 3D gradient echo shimming of first and
second order shims was performed over the entire heart and shim quality was
confirmed using point resolved spectroscopy (PRESS) of the water peak. T2-weighted
images were acquired using a fast spin echo (FSE) sequence with TR/TE = 3000/40ms,
30 x 30mm field of view (256 x 256 matrix), 36 x 1mm coronal slices and 3 signal averages
(scan duration = 9mins 42sec). The resultant images were used to generate 2D slice
montage representations of the heart.
For accurate quantification of scar volume, T1-weighted images were acquired using a
3-dimensional magnetization prepared rapid gradient-echo (MP-RAGE) sequence with
TR/TE = 6.5/3.3ms, 40 x 30 x 30mm field of view (256 x 192 x 192 matrix) and 2 signal
averages (scan duration = 57mins 39sec). Scar volume was calculated using semi-
automated ROI analysis tools in 3D Slicer (http://www.slicer.org).
2.2.3 Organ retrieval and cardiac remodelling
It has been demonstrated both in humans and animals that following myocardial
infarction and heart failure, significant structural changes occur to the heart. Myocardial
infarction leads to contractile dysfunction and a reduced ability of the heart to
sufficiently pump blood around the body. In order to compensate for this functional
incapacitation, the heart undergoes structural remodelling including a significant degree
of cardiac hypertrophy. Contractile dysfunction due to ventricular failure also leads to
an increase in back-pressure within the heart as well as the proximal organs resulting in
pulmonary and hepatic congestion.
Following the 8 week recovery period and at the time of sacrifice during the terminal
experiment, both the left and right lungs and the liver were excised from the animals.

70
Excess blood and fluid was blotted from the organs and the wet weights were measured.
After each experiment in which the heart was used for the isolated Langendorff perfused
method (see section 2.6), the heart was also blotted of excess fluid and the wet weight
measured. Hearts were weighed free from excess fat and pulmonary vessels. All organs
were then dried in an oven heated to 50˚C and the weight measured every 7 days until
the weight of the organ plateaued and the dry weight was obtained.
2.3 The anatomy and morphology of the rabbit intrinsic cardiac nervous system
The following protocols describe the methods used to further describe the anatomy and
morphology of the rabbit intrinsic cardiac nervous system and to understand what
happens to these ganglia during heart disease.
2.3.1 Non-sectioned pressure-distended heart preparation
In order to expose the heart for histological examination, animals were pre-medicated
with Ketaset (ketamine, 0.15ml/kg, Fort Dodge, UK), Sedator (medetomidine
hydrochloride, 0.2 ml/kg, Dechra, UK) and Torbugesic (butorphanol, 0.01 ml/kg, Fort
Dodge, UK) via subcutaneous injection. Following stable sedation demonstrated by the
absence of corneal and pedal reflexes, the marginal ear vein was cannulated with an IF-
butterfly infusion needle to administer intravenous pre-operative Heparin (1000 IU,
Wockhardt UK Ltd, UK) in order to prevent coagulation and thromboembolism.
Euthanasia was established via the same cannular using Pentoject (pentobarbitone
sodium, 111ml/kg, Animalcare Ltd, UK). Death was confirmed with the absence of
respiration as well as the cessation of circulation.
A midline incision was made through the skin, at the level of the clavicle and extended
mid-way down the abdomen to expose the chest. A second horizontal incision extending
the width of the torso was then made at the base of the chest (approximately at the
level of the 10th rib) to allow for the retraction of the skin, allowing exposure of the
ribcage and the superior forelimbs. A bilateral thoracotomy was performed and the
anterior portion of the ribcage removed to expose the lungs and the heart. The
pericardium was cut for access to the heart. The caudal vena cava (vena cava caudialis;
‘inferior vena cava’) was identified and cannulated and tied off using silk sutures (Size 0,
Harvard Apparatus, UK) therefore providing perfusate to the right side of the heart. A

71
small incision was subsequently made at the superior edge of the left atrium and a
cannula inserted and secured, thereby perfusing the left side of the heart. To prevent
the continuation of blood flow from the body and head back into the heart, the right
cranial vena cava (vena cava cranialis dextra; superior vena cava) and left cranial vein
(vena cava cranialis sinistra) were clamped.
The heart was perfused using ice-cold (4 oC) phosphate buffered saline (PBS; pH 7.4) via
both the left atrial and caudal vena cava cannulae until flushed of blood, followed by in
situ pressure inflation of the atria and ventricles with a 20% gelatin solution. Once the
gelatin solution was set, the heart was removed from the chest and immediately
immersed into ice cold PBS. Any remaining excessive pulmonary vessels, mediastinal fat
and pericardium were then dissected away from the heart using a Leica M80 microscope
at x5 magnification (Leica Microsystems, Germany). Following dissection, the heart was
fixed using a solution of 4% paraformaldehyde (PFA) in 0.01M phosphate buffer (PB,
pH7.4, 4°C, 30 minutes) and to increase tissue permeability, immersed into a
hyaluronidase solution in PBS (0.5mg/100ml, 4°C, 60 minutes).
To provide insight into the location of nerve fibres and plexuses within the intrinsic
cardiac nervous system, the heart was histochemically stained for AChE (Saburkina et
al., 2014). Hearts were immersed in a modified medium first described by Karnovsky
and Roots (1964) and containing the following (in mM): Sodium Acetate 60,
Acetlythiocholine Iodide 2, Sodium Citrate 15, CuSO4 3, K3Fe(CN)6 0.5, iso-OMPA 0.5,
Triton-X 1% and Hyaluronidase 0.5mg/100ml to further increase tissue permeability, for
4 hours at 4°C (pH5.6). Following staining, whole hearts were post-fixed for long-term
storage until imaging, using PFA (4%).
2.3.2 Whole mount preparation
Neural structures were visualised from flattened atrial tissue prepared from pressure
distended whole hearts; a technique commonly used in similar study’s by Danius Pauza’s
group in Lithuania (Saburkina et al., 2014, Batulevicius et al., 2008, Rysevaite et al.,
2011a). The whole heart was illuminated by a fibre optic light guide system (KL1500 LCD,
Schott UK) and imaged using a Leica M80 microscope at magnifications ranging from
x0.75 to x6 (Leica Microsystems, Germany).

72
The heart was microdissected into several atrial regions (figure 2.2): the precise
anatomy of each being dependent upon the topography of the intrinsic cardiac neurons
demonstrated by the AChE staining. In general these regions were;
1. The heart hilum (the region above the base of the heart around the pulmonary
vessels)
2. The region at the base of the pulmonary trunk and aortic root known as the
conus arteriosus
3. The region ventral to the roots of the left, middle and right pulmonary veins
4. The root of the right cranial vein
Each section was removed from adjacent tissue and placed into glass dishes. Sections
were dehydrated through a series of graded ethanol solutions (70%, 90% and 100%) and
then submerged in xylene (Fisher, UK) for between 30 mins and 2 hours dependent upon
the thickness of the section. Each section was flattened, mounted onto a microscope
slide using Histomount mounting medium (National Diagnostics, UK) and covered with
a thin coverslip for microscopic analysis.
73
Figure 2.2. Map outlining the regions dissected in hearts stained histologically and
immunohistochemically. The heart hilum outlined in red, the region ventral to the roots
of the left, middle and right pulmonary veins outlined in blue, the root of the right
cranial vein outlined in green and the region of the conus arteriosus in orange. Ao, aorta;
CS, coronary sinus; IVC, inferior vena cava; LAu, left auricle; LCV, left cranial vein; LPV,
left pulmonary vein; MPV, middle pulmonary vein; PT, pulmonary trunk; RAu, right
auricle; RCV, right cranial vein; RPV, right pulmonary vein; RV, right ventricle.

74
2.3.3 Brightfield microscopy
Cardiac sections were examined and imaged using an upright microscope (Axio, Carl
Zeiss Microscopy, UK) and images were captured using a digital camera (Axiocam, Carl
Zeiss Microscopy, UK). Stereoscopic examination was achieved between x20-40
magnification by transiently directing fibre optic illuminators at the section of tissue.
Overall topography was constructed offline and image examination and analysis was
completed using ZEN software (Carl Zeiss Microscopy, UK) and Image J 1.49v software.
Neurons were identified, counted and individually measured using x20 magnification
images with Image J 1.49v software.
2.4 Whole-mount preparation for immunohistochemistry
To investigate the neurotransmitter profile of the ICNS, hearts were examined
immunohistochemically using antibodies specific for various neuronal indicators
following brief staining for AChE (a method adapted from those previously used by
Pauza’s and Grubb’s groups (Pauza et al., 2014, Fryatt et al., 2009). Whole hearts were
perfused with PBS (pH7.4) as mentioned previously for whole heart non-sectioned
preparations and pressure inflated in situ using a 20% gelatin solution. Hearts were
removed from the chest, placed into ice-cold PBS (pH 7.4, 4 oC) and the surrounding
pericardium, mediastinal fat and excessive pulmonary vessels were removed. As
described above, hearts were prefixed using 4% PFA (0.01M PB, pH7.4) for 30 minutes,
followed by incubation in Hyaluronidase solution (PBS, 0.5mg/100ml) for 60 minutes. In
order to optimally visualise and dissect the atrial regions where intrinsic cardiac neurons
reside, whole hearts were pre-treated in the modified Karnovsky-Roots medium
(described above) for a maximum of 30 minutes to provide a faint stain and guide micro-
dissection.
The heart was dissected into several atrial regions as described previously (section
2.3.2). Each section was removed from the adjacent tissue and pinned flat into a custom
made silicone based dissecting dish to allow for subsequent washes (3 x 10 minutes) in
ice cold PB (0.01M, pH.4, 4oC). In order to prevent non-specific protein binding, each
section was incubated in a blocking buffer of 0.01M PB containing 10% normal horse
serum (Vector Laboratories, UK) and 0.5% Triton X-100 (Sigma Aldrich, UK) for 30

75
minutes. Preparations were then incubated in a double primary antibody mixture (Table
2.1) (antibodies were diluted in a solution of 0.01M PB containing 10% normal horse
serum and 0.5% Triton X-100) for 48 hours at 4˚C in a humidity chamber.
After a washing step (3 x 10 minute washes in 0.01M PB), all sections were incubated in
the correct combination of corresponding secondary antibodies (Table 2.1) for 2 hours
in a dark humid chamber at room temperature. After a final wash step (3 x 10 minute
washes in 0.01M PB) each atrial region was mounted using Vectashield Hardset
Mounting Medium (Vector Laboratories), covered with a coverslip and sealed using clear
nail varnish ready for microscopic analysis.
2.4.1 Fluorescence microscopy
Immunohistochemically stained neural structures were visualised and imaged using an
upright fluorescence microscope (Axio, Carl Zeiss Microscopy, UK). Images were
captured using a digital camera (Axiocam, Carl Zeiss Microscopy, UK). Stereoscopic
examination was achieved between x10-40 magnification. Sections were examined
using 2 fluorescence filters; 1) Alexa Fluor 594- conjugated antibodies absorb light at
around 591nm and fluoresce with light emitted with a peak around 614nm and 2) FITC
(fluorescein isothiocyanate) conjugated antibodies which absorb light maximally at
492nm and fluoresce maximally at 520nm. Overall topography was constructed offline
and image examination and analysis was completed using ZEN software (Carl Zeiss
Microscopy, UK) and Image J 1.49v software.
2.5 Statistical analysis
Data analysis was performed using both Origin Lab software (v.2015; OriginLab,
Northampton, MA, USA) and GraphPad Prism 6 software (v6.04, GraphPad, CA, USA).
Data are expressed as mean ± standard error of mean (SEM). Statistical analysis was
performed using an unpaired t test with differences being considered statistically
significant at P<0.05.

76
Table 2.1. Antibodies used during whole-mount immunohistochemistry.
Primary Antibody Host Species Dilution Catalogue Number and Supplier
ChAT Goat 1:100 AB144P Merck Millipore
TH Mouse 1:2000 22941 Immunostar
nNOS Mouse 1:300 SC-5302 Santa Cruz
nNOS Sheep 1:1000 Gift from Prof Trevor Batten
Secondary Antibody
Anti-goat (AlexaFluor594) Donkey 1:300 Jackson Immunoresearch
Anti-goat (FITC) Donkey 1:100 Jackson Immunoresearch
Anti-mouse (AlexaFluor594) Donkey 1:300 Jackson Immunoresearch
Anti-mouse (FITC) Donkey 1:100 Jackson Immunoresearch

77
2.6 Investigating the role of the intrinsic cardiac nervous system on cardiac
electrophysiology
2.6.1 Isolation of the Langendorff heart preparation
Animals from each of the three groups (control, heart failure and sham-operated) were
pre-medicated with Ketaset, Sedator and Torbugesic as in section 2.3.1 with a
subcutaneous injection. Following stable sedation demonstrated by the absence of
corneal and pedal reflexes, the marginal ear vein was cannulated with an IF- butterfly
infusion needle to administer intravenous pre-operative Heparin (1000 IU, Wockhardt
UK Ltd, UK). Euthanasia was established via the same cannular using Pentoject
(pentobarbitone sodium, 111ml/kg, Animalcare Ltd, UK). Death was confirmed with the
absence of respiration as well as the cessation of circulation.
After confirmation of death in accordance with the UK ASPA 1985, the thoracic cavity
was opened with a transverse incision anterior to the diaphragm. Lateral incisions were
made along both sides of the rib cage and the chest wall was removed in order to expose
the mediastinal contents. The heart was rapidly removed following incisions made at
the great vessels, both lung hila and the inferior vena cava, with care being taken to
ensure the length of the ascending aorta was adequate for cannulating. The excised
heart was submerged into ice cold Tyrode’s solution containing (in mM): Na+ 138.0; K+
4.0; Ca2+ 1.8; Mg2+ 1.0; HCO3- 24.0; H2PO4
- 0.4; Cl- 124.0; Glucose 11.0, (chilled to 4˚C) to
reduce metabolic rate.
The heart was cannulated onto the perfusion apparatus via the ascending aorta and held
in place using a bulldog clip. The aorta was secured using silk sutures in order to ensure
the retrograde free flow of perfusate and the bulldog clip removed. A small incision was
made in the pulmonary artery to allow the flow of coronary effluent following the
resumption of contraction.
2.6.2 Langendorff perfusion
Hearts were retrogradely perfused through the ascending aorta in conditions of
constant flow Langendorff mode (40 ml/min) using a Gilson Minipulse 3 peristaltic pump
(Anachem, Luton, UK), with care being taken to ensure no air bubbles were present
within the perfusion system to prevent embolism in the heart. Retrograde perfusion of

78
the heart involves the forced closing of the aortic valve, redirecting perfusate into the
coronary vasculature and supplying cardiac tissue with the necessary components to
continue to function (figure 2.3). Tyrode’s solution was maintained at a constant
temperature of 37°C and pH of 7.4 by continuous bubbling with Carbogen [95% O2/5%
CO2] and the use of water baths for heating the solution as well as continuously
supplying warm water to the water jackets in the perfusion glassware to reduce loss of
heat.
A 1mm ID, 2mm OD polypropylene catheter (Porlex, Kent, UK) was inserted through the
left ventricular apex for Thebesian venous effluent drainage. Left intraventricular
pressure was monitored using a fluid-filled latex balloon inserted and secured at the left
atrial appendage and connected with a 3F cannula to a pressure transducer (MLT0380/D
ADinstruments Ltd, UK). LV end diastolic pressure was maintained between 0 and 5
mmHg. Aortic perfusion pressure was recorded with a second solid state pressure
transducer connected in series to the aortic cannula. Both pressure transducers were
calibrated using a sphygmomanometer to a 2-point calibration prior to each experiment.
Prior to further instrumentation, the dissection of any remaining pulmonary vessels,
mediastinal fat or pericardium was completed down to the plane at which the intrinsic
cardiac ganglia are known to be located. A pair of platinum pacing hook electrodes
(Grass Instruments, USA) were inserted into the right atrial appendage for constant
atrial pacing. Monophasic action potentials (MAPs) were measured at regions of the
apex and base using contact electrodes (73-0150, Harvard Apparatus, Kent, UK) applied
to the epicardial surface of the heart and the signal was amplified using a custom made
DC-coupled high input impedance differential amplifier (Joint Biomedical Workshop,
University of Leicester, UK).

79
Figure 2.3. Langendorff heart preparation for investigating the role of the ICNS on
cardiac electrophysiology. Electrical stimulation of intrinsic cardiac ganglia was
performed on Langendorff perfused hearts (A) using a custom made bipolar silver
electrode with an insulated tip (B).
GP STIMULATING ELECTRODE
A
B

80
2.6.3 Electrical stimulation of intrinsic cardiac ganglionic plexuses
Stimulation of epicardial ganglia was performed at four sites (figure 2.4). These sites
were determined using the topographical map previously produced by Saburkina et al.
(2014) along with the data represented in chapter 4 and included; 1) the left neuronal
complex (LNC), 2) the right neuronal complex (RNC), 3) the right atrial ganglia region
(RAGP) and 4) the region between the middle pulmonary veins and the caudal vena cava
(vena cava caudialis; ‘inferior vena cava’) (PVCV).
Regions known to contain intrinsic cardiac neurons were stimulated epicardially using a
custom-made bipolar silver electrode (0.5mm diameter, Advent research materials,
Oxford, UK). The tip of the electrode was insulated in order to prevent unwanted
electrical spread and to allow a more precise application of stimulation (figure 2.3).
Electrical stimulation of intrinsic cardiac ganglia was achieved using a single-channel
constant voltage square-pulse stimulator (SD9, Grass Instruments, Astro-Med),
connected in sequence to a constant current stimulator (DS7A Constant Current
Stimulator, Digitimer Ltd, UK). The stimulating electrode was placed on the heart at
locations known to contain ganglia and the cardiac pacing threshold was determined at
3V, 4Hz and with a 0.1ms pulse (He et al. 2013), in an attempt to limit the stimulus to
neuronal somata. Responses of intrinsic cardiac ganglia to electrical stimulation both
during sinus rhythm and during constant atrial pacing were recorded between 10 and
50Hz stimulation frequencies at 50% of the cardiac pacing threshold. When the change
in HR reached a plateau or the change in atrioventricular delay stabilised, stimulation
was stopped and the heart was allowed to recover to baseline.

81
Figure 2.4: Ventral (a) and dorsal (b) view of the heart indicating the regions for
electrical stimulation of the intrinsic cardiac ganglia. Abbreviations: Ao, aorta; CS,
coronary sinus; CV, caudal vein; DRA, dorsal right atrial subplexus; LAu, left auricle; LC,
left coronary subplexus; LCV, left cranial vein; LD, left dorsal subplexus; LNC, left
neuronal cluster; LPV, left pulmonary vein; LV, left ventricle; MD, middle dorsal
subplexus; MPV, middle pulmonary vein; PT; pulmonary trunk; RAu, right auricle; RC,
right coronary subplexus; RCV, right cranial vein; RNC, right neuronal cluster; RPV, right
pulmonary vein; RV, right ventricle; VLA, ventral left atrial subplexus; VRA, ventral right
atrial subplexus.
82
2.6.3.1 Experimental Protocols for the electrical stimulation of intrinsic cardiac ganglia
2.6.3.2 Cardiac Constant Pacing
A pair of platinum pacing electrodes positioned at the right atrial appendage were used
to pace the heart at a predetermined and fixed heart rate. Throughout all experiments,
hearts were paced at a cycle length of 240ms resulting in a constant heart rate of
250bpm. A cycle length of 240ms was chosen to account for the maximum anticipated
increase in heart rate (HR) observed during preliminary investigations. The diastolic
pacing threshold was determined prior to each protocol and then doubled to ensure
constant cardiac pacing was maintained throughout.
2.6.4 Pharmacological agents
At each site of the ICNS investigated, the cardiac response in control conditions (normal
Tyrode’s solution only) was determined at 20Hz and at half the cardiac pacing threshold.
To determine which specific autonomic receptors were involved in the cardiac
responses produced by electrical stimulation, protocols were repeated in the presence
of the muscarinic (M2) receptor antagonist, atropine (0.1 μM (Ng et al., 2001)), a β-
adrenergic receptor blocker, metoprolol (1.8 μM (Ng et al., 2001)) and the autonomic
ganglionic blocker, hexamethonium (0.5 mM (Brack et al., 2011, Winter et al., 2012).
Each pharmacological blocker was dissolved into a small volume of Tyrode’s solution.
The preparation was perfused with each agent for 5-10 minutes until a stable response
was recorded. Measurements were recorded during sinus rhythm and constant atrial
pacing followed by a period of washout using normal Tyrode’s solution. Washout
periods of a minimum of 15 minutes ensured the confirmation that any diminished/
eliminated response was a result of the application of a pharmacological agent.
2.6.5 Signal measurements and data analysis
Functional parameters including LV pressure, perfusion pressure and ECG were
recorded using a Powerlab 16 channel system (ADinstruments Ltd, Chalgrove, UK) and
digitised at 2kHz using LabChart software version 7 and Scope software (ADInstruments
Ltd). Data analysis was completed using LabChart software version 8. MAP duration was
measured at 90% repolarisation (MAPD90) using custom-made NewMap analysis
software (Dr F Burton, University of Glasgow). To determine atrioventricular delay

83
during constant atrial pacing data parameters were measured from averaged data using
Scope software (ADinstruments Ltd). Atrioventricular delay, measured in milliseconds,
was calculated as the time from the cardiac pacing stimuli to the activation of the
ventricular electrical signal. HR and LV pressure were measured and calculated from an
average of 10 cardiac cycles during baseline and subsequently during the steady state
response.

84
2.7 Investigating the interaction between the rabbit ICNS and peripheral autonomic
nerves
As part of the continuing research aimed at determining the overall role and
involvement of the intrinsic cardiac nervous system in the control and influence of
specific cardiodynamics, it is crucial not only to understand what the ICNS is capable of
independent of peripheral neuronal input, but also how it can modulate extrinsic
neuronal stimulation. A number of preliminary experiments were conducted in order
to evaluate this interaction using a modified version of a novel neurocardiological
preparation; the dual innervated Langendorff perfused heart preparation. This
preparation, originally developed and reported in 2001 (Ng et al., 2001) allows the study
of the effects of either direct sympathetic or vagal nerve stimulation on whole heart
electrophysiology and mechanical performance without the confounding effects of
circulating hormones and in vivo reflexes.
2.7.1 Isolated innervated heart preparation
Animals were pre-medicated with Ketaset, Sedator and Torbugesic as in section 2.3.1
via subcutaneous injection. Following stable sedation demonstrated by the absence of
corneal and pedal reflexes, the marginal ear vein was cannulated with an IF- butterfly
infusion needle for the intravenous introduction of pre-operative Heparin (1000 IU,
Wockhardt UK Ltd, UK) and for the injection of Propofol (10mg/ml, Zoetis, London,UK)
for the maintenance of surgical anaesthesia . The limbs of the animal were restrained
and the anterior torso of the rabbit was shaved from the mandible to the abdomen. The
depth of anaesthesia and pain threshold was tested by checking the pedal reflex and a
subsequent cervical midline incision was made. The superficial muscle layers were
dissected and the trachea identified. Further blunt dissection allowed the trachea to be
isolated and the cannulated with a 5mm diameter plastic tube and secured using silk
suture (size 0-0, Harvard apparatus, UK) to enable ventilation. Ventilation was sustained
with positive pressure via a small animal ventilator (Harvard Apparatus Ltd, Edenbridge,
Kent, UK; 50-60 breaths/min). Following ventilation, general anaesthesia was
maintained with bolus injections of Propofol, taking care not to affect cardiac function.
The common carotid arteries were identified and isolated using silk sutures with

85
attention being given to avoid damaging the delicate vagus nerves lying in close
proximity.
The midline incision was extended along the chest wall and subsequent lateral incisions
at the level of the lower intercostal spaces resulted in exposure of the ribcage. Further
incision was made through the pectoral muscles down to the surgical plane just below
the pectoralis minor. Prior to the ligation of the larger subclavian vessels, a bolus
injection of Propofol was administered to eliminate pain. Ties were placed around the
neurovascular bundle which was ligated and the plane between the pectoral muscles
and the portion of the sternocleidomastoid muscles nearest the clavicular head was
identified and the jugular vein also ligated. Although the intercostal vascular bundle
which is located below the trapezius muscle only has a small artery running through it,
numerous smaller vessels are present and if left can result in an unwanted decrease in
perfusion pressure and hence was also ligated.
Just prior to sacrifice of the animal both vagus nerves were carefully dissected in order
to prevent damage during the final portion of surgery. Both vagi were identified, running
parallel to the previously tied carotid arteries. The sternomastoid muscles were cut and
separated from the underlying tissues. The vagus nerves were isolated from the carotid
arteries using careful blunt dissection and in a way that the nerves were not directly
handled with forceps. The nerves were then transected proximally as close to the
nodose ganglia as possible.
Another 1000IU heparin was administered prior to animal sacrifice, which was
accomplished with an overdose of pentobarbitone sodium (111ml/kg, Animalcare Ltd,
UK). Ventilation was stopped and the tracheal tube removed. The thoracic cavity was
exposed and the anterior portion of the ribcage removed. Immediately after exposure
of the mediastinal contents, ice-cold Tyrode was applied and the thorax packed with ice
in order to lower the temperature of the preparation and therefore the metabolic rate.
The internal mammary vessels were isolated as proximally as possible and tied off with
suture. The lower thoracic portion of the descending aorta was isolated from
surrounding tissues and cannulated level with the apex of the heart with a custom made
flanged 5mm diameter plastic tube. The distal portion of the descending aorta was also

86
closed to minimise blood loss. An incision was made in the pericardium which was
peeled back from the heart. The pulmonary artery was cut to allow the flow of perfusate
out of the right of the heart. A dual vertebral ostectomy was performed at the level of
the 12th thoracic vertebra and the 1st cervical vertebra and the preparation was
dissected from surrounding tissue and excised from the neck to the thorax, ready for
mounting. All of the preceding steps were taken rapidly in the aim of reducing ischemia.
2.7.2 Perfusion and mounting of the preparation
Prior to surgery the perfusion system was primed with Tyrode’s solution as outlined for
preparation of the Langendorff system described in section 2.6.2. The preparation was
transferred to the perfusion rig and positioned on the mounting platform and pinned in
place. The descending aorta cannula was connected to the perfusion system and being
careful to ensure no air bubbles were present the preparation was perfused in
conditions of constant flow (100ml/min). Both lungs were tied off and removed to
prevent air being sucked back into the heart and following a very short period of
perfusion with warm Tyrode’s solution, the heart would begin to beat steadily.
Perfusion flow rate was reduced to 50% and the preparation cooled down in order to
reduce heart rate and contraction and therefore damage during the insertion of a
catheter and balloon into the left ventricle. A small incision was made in the left atrium
and a 1mm ID, 2mm OD polypropylene catheter (Porlex, Kent, UK) was inserted through
the LV apex for Thebesian venous effluent drainage. Left intraventricular pressure was
monitored using a fluid-filled latex balloon connected with a 3F cannula to a pressure
transducer (MLT0380/D ADinstruments Ltd, UK). LV end diastolic pressure was
maintained between 0 and 5 mmHg. The flow rate was returned to 100ml/min and
aortic perfusion pressure was recorded with a second solid state pressure transducer
connected in series to the aortic cannula. Both pressure transducers were calibrated
using a sphygmomanometer to a 2-point calibration prior to each experiment (figure
2.5C).
Once the preparation had stabilised, further dissection was done in order to gain access
to the region of the heart where the ganglia of the right neuronal cluster are known to

87
reside. The pericardium was dissected and as much of the ribcage removed as possible
without interrupting the ties previously made around the internal mammary vessels.
The thymus was blunt dissected from any remaining pericardium and carefully pinned
back to expose the ascending aorta and pulmonary artery.
The pulmonary artery was fully transected and the left and right branches dissected
away from the region at the base of the heart known as the heart hilum. The right cranial
vena cava was identified and a loose loop of suture placed around it in order to ease
manipulation during the placement of the stimulation electrode. All manipulation and
blunt dissection was done with great care to avoid damage to any peripheral neural
connections and intrinsic cardiac ganglia (figure 2.5).

88
Figure 2.5. Representation (adapted from Ng et al 2001) of the dual innervated heart
preparation. A illustrates the innervated preparation with GP stimulating electrode
position with the boxed region representing the area magnified in B. The innervated
preparation was used to investigate the interaction between the intrinsic cardiac
nervous system and the vagus nerves along with sample experimental recordings of LVP,
PP and monophasic action potentials (C). Abbreviations: LA, left atrium; LV, left ventricle;
RA, right atrium; RV, right ventricle; LVNS, left vagus nerve stimulation; RAEG, right atrial
electrogram; MAP, monophasic action potential; LVP, left ventricular pressure; PP,
aortic perfusion pressure).

89
2.7.3 Signal measurements
As was described previously (section 2.6.3.2) a pair of platinum pacing electrodes (Grass
Instruments, USA) were inserted into the right atrial appendage for constant atrial
pacing. Monophasic action potentials were measured at regions of the apex and base
(see figure 2.5) using contact electrodes. Similar to the Langendorff preparation,
functional parameters including LV pressure, perfusion pressure and ECG were recorded
using a Powerlab 16 channel system (ADinstruments Ltd, Chalgrove, UK) and digitised at
2kHz using LabChart software version 7 and Scope software (ADInstruments Ltd).
2.7.4 Nerve stimulation protocols
Vagus nerves were stimulated individually (left or right) using a custom made silver
chloride bipolar electrode. To determine the stimulation parameters to be used during
each experiment, the effect of nerve stimulation was examined using a 2ms pulse width
at a fixed frequency (5Hz) and a changing stimulus strength. HR reductions were
recorded at incremental voltages ranging from 1V to 20V. The stimulus strength that
produced a heart rate equivalent to 80% of the maximal response was used throughout
the study. Using this stimulus strength (voltage), the effect of changing the frequency of
stimulation was examined at 5, 7 and 10Hz. The frequency that produced a reduction
in HR to between 70 and 100bpm was used throughout the remainder of the study.
When the reduction in HR during vagal stimulation reached a stable plateau, stimulation
was stopped and the heart rate allowed to return to baseline.
2.7.4.1 Electrical stimulation protocols
Regions within the right neuronal cluster of the ICNS were stimulated epicardially using
a custom-made bipolar silver electrode (0.5mm diameter, Advent research materials,
Oxford, UK). Electrical stimulation was achieved using the previously described method
(section 2.6.3.1). In brief, the cardiac pacing threshold at each site was determined at
3V, 4Hz and with a 0.1ms pulse. At sites where changes in HR were recorded, the ganglia
were stimulated at 50% of the cardiac pacing threshold at a frequency of 20Hz.

90
At each site responses to the following were recorded:
1) Vagus nerve stimulation
2) RNC GP electrical stimulation (GP ES)
3) GP ES followed by vagus nerve stimulation
4) Vagus nerve stimulation followed by GP ES
Stimulation was applied until a stable plateaued response was observed before either
ending stimulation or adding the second level of stimulation.
2.7.5 Data analysis
As in section 2.6.5, data analysis was completed using LabChart software version 8. MAP
duration was measured at 90% repolarisation (MAPD90) using custom-made NewMap
analysis software (Dr F Burton, University of Glasgow). To determine atrioventricular
delay during constant atrial pacing data parameters were measured from averaged data
using Scope software (ADinstruments Ltd). HR and LV pressure were measured and
calculated from an average of 10 cardiac cycles during baseline and subsequently during
the steady state response.

91
Chapter 3: Heart failure in the rabbit
3.1 Introduction
Myocardial infarction leads to contractile dysfunction and a reduced ability of the heart
to sufficiently pump blood around the body. Clinically, the majority of pathology that
occurs with heart failure, develops as a result of the body trying to counteract the
functional incapacitation. Various animal models have been used to investigate the
effect of heart failure including models of chronic pressure overload (Beaumont et al.,
2016), acute myocardial infarction (He et al., 2013) and chronic myocardial infarction
(Ng et al., 1998). It has been shown that following surgically induced MI in an animal
model, significant structural changes occur to the heart including remodelling and a
significant degree of cardiac hypertrophy (Ng et al., 1998). Contractile dysfunction due
to ventricular failure resulted in an increase in back-pressure within the heart along with
an increase in left ventricular end-diastolic pressure. The increased back pressure in the
pulmonary vasculature resulted in pulmonary congestion and oedema; well recognised
features in the clinical syndrome of heart failure.
The most commonly used diagnostic tool for assessing the severity and progression of
heart failure is echocardiography and the measurement of ejection fraction. Clinically,
an ejection fraction of between 50 and 75% is characterised as normal and an ejection
fraction of lower than 50% is an early sign of heart failure and left ventricular
dysfunction.
In order to determine the mechanisms responsible for this decline in cardiac function,
the use of animal models is imperative and of particular importance are models of
cardiac failure due to MI. It has been demonstrated that ligation of the coronary artery
in the rabbit results in both local and systemic changes, similar to those seen clinically
in heart failure (Ng et al., 1998, Pye et al., 1996).
Therefore, the aim of this chapter was to validate the animal model of coronary artery
ligation in order to ensure comparable data with previous work and to ensure
differences in parameters examined at a later date were solely due to the development
of heart failure and not due to the surgical procedure itself.
92
3.2 Results
3.2.1 Cardiac Dysfunction
Coronary artery ligation surgery, where the large marginal branch of the left circumflex
coronary artery was ligated (see chapter 2 section 2.2) was performed in a total of 17
animals. In addition, sham surgical procedures (where similar surgery was conducted
minus the ligation of the left coronary artery) were done in a total of 8 animals.
Approximately 8 weeks following surgery, in vivo echocardiography was performed
using a parasternal short axis view in order to compute ejection fraction. Due to the
availability of technical support, echocardiography was only completed in a total of 12
animals from the heart failure group compared to 4 rabbits in the sham operated group.
Echocardiographic data demonstrated evidence of significant cardiac dysfunction with
the measured ejection fraction being significantly lower in rabbits in the heart failure
group compared to the sham operated group, 34.9 ± 1.1 vs 62.2 ± 1.2 respectively (see
table 3.1).
3.2.2 Organ congestion
Clinically, heart failure originating from damage to the left ventricle, can lead to
pulmonary congestion and oedema, with instances of right ventricular failure and
therefore hepatic congestion developing. For that reason and to determine the systemic
effects of myocardial infarction and heart failure, liver and lung weights were measured
in a total of 25 rabbits (17 from the HF group and 8 from the sham operated group).
Both liver and lung weights from rabbits in the heart failure group were significantly
increased in comparison to sham operated animals (table 3.1).
The wet weights of hearts from both the HF and sham operated groups were compared.
Dry heart weights were unavailable during this study due to the hearts being used for
imaging studies. Hearts from the HF group were significantly enlarged when compared
to those from the sham operated group (14.6 ± 0.2 vs 11.9 ± 0.1, p < 0.0001). When the
weights of the RV and LV free wall were examined between both groups, there was
evidence of a significant increase in weight in the HF group (table 3.1). Increased lung
weights when corrected for overall body weight and compared with EF showed a
negatively correlated trend, however this was not significant. In comparison, liver

93
weights (when corrected for body weight) were significantly correlated with ejection
fraction, as were corrected RV weights (figures 3.1A, B and C) further reiterating the
presence of ventricular hypertrophy. Clinically, RV dysfunction leads to hepatic
congestion. To determine whether this was the case in the rabbit model, right
ventricular weights and liver weights were examined. When values were corrected for
body weight, RV and liver weights were significantly correlated (figure 3.1D) (r = 0.60, p
< 0.01).

94
Heart Failure
n = 17
Sham
n = 8
P Value
Body weight (kg) 3.8 ± 0.1 3.9 ± 0.1 Ns
Ejection fraction (%) 34.9 ± 1.1 62.2 ± 1.2 <0.0001
Liver wet weight (g) 116.3 ± 3.6 94.4 ± 4.5 0.0013
Lung wet weight (g) 25.4 ± 1.9 20.0 ± 1.6 0.0429
Heart wet weight (g) 14.6 ± 0.2 11.9 ± 0.1 <0.0001
RA wet weight (g) 0.6 ± 0.0 0.4 ± 0.0 0.0004
LA wet weight (g) 0.8 ± 0.1 0.4 ± 0.0 0.0079
Ventricle wet weight (g) 11.4 ± 0.2 9.8 ± 0.1 0.0003
RV free wall wet weight (g) 2.7 ± 0.2 2.3 ± 0.1 0.0412
LV free wall wet weight (g) 5.2 ± 0.2 4.3 ± 0.0 0.0146
Liver dry weight (g) 32.5 ± 0.8 27.4 ± 1.8 0.0068
Lung dry weight (g) 2.7 ± 0.1 2.6 ± 0.2 ns
Table 3.1: Comparison of organ weights and in vivo functional parameters (ejection
fraction) between animals from the heart failure and sham operated groups. Data is
presented as mean ± SEM, statistical significance determined using unpaired t-test. (LA
– left atrium, LV-left ventricle, RA- right atrium, RV-right ventricle).

95
2 0 4 0 6 0
0
5
1 0
1 5
E je c t io n F r a c t io n (% )
Co
rre
cte
d l
un
g w
eig
ht
(g.k
g-1
) r = -0 .1 0
p = n s
2 0 4 0 6 0
1 0
2 0
3 0
4 0
5 0
E je c t io n F r a c t io n (% )
Co
rre
cte
d l
ive
r w
eig
ht
(g.k
g-1
) r = -0 .4 5
p < 0 .0 0 5
2 0 4 0 6 0
0 .5
0 .6
0 .7
0 .8
0 .9
E je c t io n F r a c t io n (% )
Co
rre
cte
d R
V w
eig
ht
(g.k
g-1
) r = -0 .6 8
p < 0 .0 1
A B
C D
1 5 2 0 2 5 3 0 3 5 4 0
0 .5
0 .6
0 .7
0 .8
0 .9
C o r r e c t e d l iv e r w e ig h t (g .k g- 1
)
Co
rre
cte
d R
V w
eig
ht
(g.k
g-1
) r = 0 .6 0
p < 0 .0 1
Figure 3.1: The relationship between organ weights and ventricular function measured
as ejection fraction. Plots of lung (A), liver (B) and right ventricular weights (C) corrected
for body weight against ejection fraction in heart failure ( ) and sham operated ( )
groups. The relationship between ventricular dysfunction and hepatic congestion was
examined (D) by plotting right ventricular weight and liver weight, both corrected for
body weight. Solid red lines represent the linear regression when the correlation
between both parameters was determined with correlation coefficients (r) and slope
significance values (p) shown.

96
3.2.3 Cardiac remodelling
As mentioned, the wet weight of the left ventricular free wall was significantly increased
in animals from the heart failure group when compared to sham operated animals. In
addition, there was also a significant correlation (r = -0.59, p < 0.01) between left
ventricular weight and ejection fraction (when LV weight was corrected for body weight)
(figure 3.2), suggesting myocardial infarction initiates significant compensatory
mechanisms including hypertrophy in an attempt to counteract left ventricular
dysfunction.

97
2 0 4 0 6 0
0 .8
1 .0
1 .2
1 .4
1 .6
1 .8
E je c t io n F r a c t io n (% )
Co
rre
cte
d L
V w
eig
ht
(g.k
g-1
) r = -0 .5 9
p < 0 .0 1
Figure 3.2: A plot showing the negative correlation between the weight of left
ventricular tissue (corrected for bodyweight) and ejection fraction in the heart
failure ( ) and sham operated ( ) groups. The solid red line represents the linear
regression when correlation between the two parameters was determined with the
correlation coefficient (r) and slope significance value (p) shown.
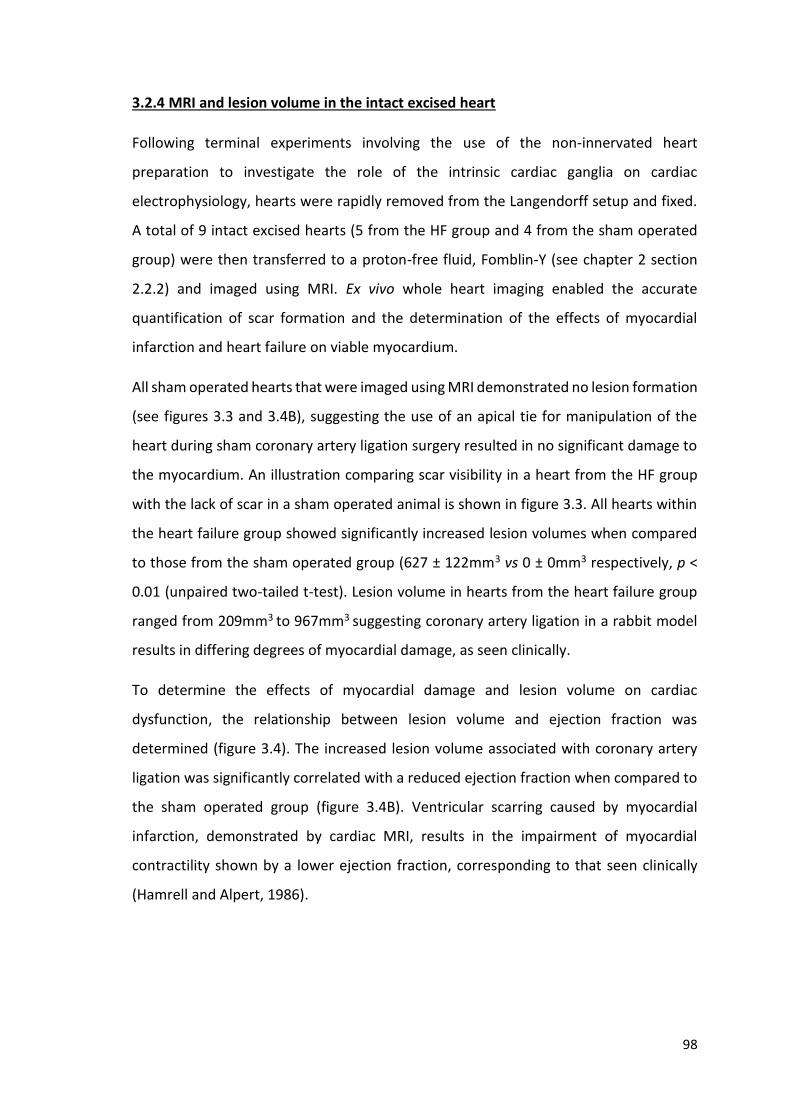
98
3.2.4 MRI and lesion volume in the intact excised heart
Following terminal experiments involving the use of the non-innervated heart
preparation to investigate the role of the intrinsic cardiac ganglia on cardiac
electrophysiology, hearts were rapidly removed from the Langendorff setup and fixed.
A total of 9 intact excised hearts (5 from the HF group and 4 from the sham operated
group) were then transferred to a proton-free fluid, Fomblin-Y (see chapter 2 section
2.2.2) and imaged using MRI. Ex vivo whole heart imaging enabled the accurate
quantification of scar formation and the determination of the effects of myocardial
infarction and heart failure on viable myocardium.
All sham operated hearts that were imaged using MRI demonstrated no lesion formation
(see figures 3.3 and 3.4B), suggesting the use of an apical tie for manipulation of the
heart during sham coronary artery ligation surgery resulted in no significant damage to
the myocardium. An illustration comparing scar visibility in a heart from the HF group
with the lack of scar in a sham operated animal is shown in figure 3.3. All hearts within
the heart failure group showed significantly increased lesion volumes when compared
to those from the sham operated group (627 ± 122mm3 vs 0 ± 0mm3 respectively, p <
0.01 (unpaired two-tailed t-test). Lesion volume in hearts from the heart failure group
ranged from 209mm3 to 967mm3
suggesting coronary artery ligation in a rabbit model
results in differing degrees of myocardial damage, as seen clinically.
To determine the effects of myocardial damage and lesion volume on cardiac
dysfunction, the relationship between lesion volume and ejection fraction was
determined (figure 3.4). The increased lesion volume associated with coronary artery
ligation was significantly correlated with a reduced ejection fraction when compared to
the sham operated group (figure 3.4B). Ventricular scarring caused by myocardial
infarction, demonstrated by cardiac MRI, results in the impairment of myocardial
contractility shown by a lower ejection fraction, corresponding to that seen clinically
(Hamrell and Alpert, 1986).

99
Figure 3.3. Comparison of lesion formation between hearts from the heart failure and
sham operated groups using MRI. Two individual hearts analysed using MRI (HF (A-D)
and Sham (E-H)). Two-dimensional MRI images of different orientations showing lesion
development in a heart from the HF group (A, C and D) (black region at the apex of hearts
in images C and D illustrates infarcted tissue). Image B represents a 3D reconstruction
of an infarcted heart with the pink region indicating the lesion area analysed. E, G and H
represent a sham operated heart with no evidence of infarct and F illustrates a three-
dimensional reconstruction of a sham operated heart.

100
2 5 3 0 3 5 4 0 4 5
0
2 0 0
4 0 0
6 0 0
8 0 0
1 0 0 0
E je c t io n F r a c t io n (% )
Le
sio
n V
olu
me
(m
m3
)r = 0 .4 8
p = n s
4 0 6 0
-5 0 0
0
5 0 0
1 0 0 0
E je c t io n F r a c t io n (% )Le
sio
n V
olu
me
(m
m3
)
r = -0 .6 1
p < 0 .0 5
A
B
Figure 3.4: The correlation between lesion volume and ejection fraction. A. Plot
comparing lesion volume (mm3) with cardiac dysfunction measured as ejection fraction
(%) within the heart failure group only (n=5). B. Plot of lesion volume against ejection
fraction in heart failure ( ) and sham operated groups ( ). Both solid red lines represent
the linear regression when correlation between the two parameters was determined
with the correlation coefficient (r) and slope significance value (p) shown.

101
3.3 Discussion
The evidence of local and systemic changes in relation to heart failure as a result of
coronary artery ligation were investigated in the rabbit. Changes in the structure of the
heart as a result of coronary artery ligation were demonstrated, with an overall increase
in weight and more specifically hypertrophy of the left ventricle being evident. This
structural change was also accompanied by an increase in systolic dysfunction as a result
of the inability of the left ventricle to contract sufficiently enough to maintain cardiac
output demonstrated by a significant reduction in ejection fraction. Coronary artery
ligation leads to deleterious effects on myocardial tissue, illustrated by the significant
lesion formation and evidence of infarcted myocardium. In order to compensate for the
reduced ability of the damaged heart to maintain cardiac output and blood pressure
(Poole-Wilson, 1993), significant ventricular hypertrophy develops, again shown in this
study.
Following on from the initial cardiac insult and despite local changes to the heart in order
to continue functioning at full capacity, the continued development of heart failure
results in further downstream systemic changes. These changes include pulmonary
oedema and hepatic congestion. As a result of increased back pressure in the left
ventricle due to left ventricular dysfunction, pulmonary congestion develops. If left to
develop, heart failure leads to further ventricular failure and right ventricular overload,
which in turn results in hepatic congestion. Previous studies investigating the effects of
myocardial ischemia and heart failure in similar animal models, including the rabbit (Pye
et al., 1996, Ng et al., 1998), have shown the production of these systemic changes
equivalent to those seen in humans. Data presented here also correlates with this
research showing both increased lung weights as well as significantly increased liver
weights suggesting the development of pulmonary oedema and hepatic congestion.
The data presented in this chapter further reiterates the use of the rabbit coronary
artery ligation model as a clinically relevant model of myocardial infarction and heart
failure. The changes in cardiac function as well as the organ congestion observed as a
downstream effect suggest the use of this model should deliver structural and functional
changes reflecting those expected in the equivalent clinical and human scenario.

102
Chapter 4: The effects of heart failure on the anatomy and morphology of the rabbit
intrinsic cardiac nervous system
4.1 Introduction
Despite previous hypotheses that neurocardiac control originated solely from sources
of extrinsic innervation, it is becoming increasingly apparent that the ICNS plays a
significant role in the control of cardiac function. In order to fully understand the
functional importance of the ICNS, the overall anatomy and morphology firstly need to
be determined in detail. The rabbit is commonly used as a preferred small animal
experimental model, yet despite this, to date only one study has investigated the gross
morphology of the rabbit ICNS (Saburkina et al., 2014) to date.
These data showed comparable topography with both smaller rodent models including
mice (Pauza et al., 2013, Rysevaite et al., 2011a) and rats (Batulevicius et al., 2003), as
well as larger mammals such as sheep (Saburkina et al., 2010) and pigs (Batulevicius et
al., 2008): albeit simpler in structure. In general, the ICNS is described as a complex and
intricate network of nerves and ganglia, primarily present at the level of the atria on the
heart hilum and around the roots of the pulmonary veins (Saburkina et al., 2014, Yuan
et al., 1994). Numerous studies have investigated the neurochemical profile of the ICNS
of multiple mammalian models and confirmed the presence of not only choline
acetyltransferase (ChAT) IR neurons, indicative of postganglionic parasympathetic
neurons, but also; tyrosine hydroxylase (TH), neuropeptide Y (NPY), substance P (subP),
nNOS and calcitonin gene related peptide (CGRP) and the generic neuronal marker
protein gene product 9.5 (PGP9.5) (Richardson et al., 2003, Rysevaite et al., 2011b,
Steele et al., 1994, Hoover et al., 2009).
Understanding the overall morphology of the ICNS prior to any disease provides a
foundation for investigating the role, if any, that this collection of nerves and ganglia has
during cardiac diseases such as heart failure. It is well known that autonomic imbalances
following myocardial infarction increase the potential for sudden cardiac death (Ng,
2016, Fukuda et al., 2015). Following MI, the ICNS undergoes neuronal remodelling
including spatially diverse intrinsic cardiac neuronal enlargement, in particular within
ganglia which exert preferential influence over the ventricles (Rajendran et al., 2016,

103
Nakamura et al., 2016). This along with neuronal degeneration, the development of
inclusions and vacuoles (Hopkins et al., 2000) within neuronal somata and adaptive
changes in the neurochemical profile (Hardwick et al., 2014) indicates a pathological
involvement of the ICNS following cardiac insult.
The aims of this chapter were two-fold;
Firstly, to further describe the overall topology of the rabbit ICNS, advancing on
work previously done in the rabbit (Saburkina et al., 2014) by including
investigation of the neurochemical profile.
Secondly, to investigate the effects of myocardial infarction and heart failure on
the structure of the rabbit ICNS, of which there is currently very limited
information.

104
4.2 Results
4.2.1 Distribution of intrinsic cardiac neurons in the whole rabbit heart
To determine the distribution of intrinsic cardiac neurons present in the rabbit heart, 11
hearts were examined from control rabbits i.e. no prior surgery had been undertaken.
This was done using the pan neuronal AChE stain described previously (chapter 2).
The majority of neurons were found to lie on supraventricular tissues, particularly on
the venous part of the heart hilum and the epicardial surface of the heart. Intrinsic
cardiac ganglia were also identified at the region of the conus arteriosus at the root of
the pulmonary trunk, termed ventricular neurons (figure 4.1). The distribution of nerves
and intrinsic cardiac neuronal somata as well as the size and shape of the intrinsic
cardiac ganglia showed variation between hearts, however in all hearts somata existed
either grouped into ganglia (defined as a collection of 3 or more neurons), as single cells
or as pairs of cells (figure 4.2).
Extrinsic cardiac nerves accessed the heart at both the arterial and venous portions of
the heart. Nerves extended from the root of the bifurcation of the pulmonary trunk
across the heart to the region of the heart hilum. Nerves also accessed the ICNS at the
venous portion of the heart hilum, particularly around the roots of the pulmonary veins,
the right inferior and the right superior caval veins and extended to numerous ganglia
both on the heart hilum and around the roots of the middle and right pulmonary veins.
Extrinsic nerves extended to numerous ganglia, the distribution of which varied between
all hearts making direct comparisons difficult. However, in all hearts, 2 large clusters of
neurons were identified as the left and right neuronal clusters (LNC and RNC) (figure
4.2). In general, the RNC was located at the cranial aspect of the interatrial groove at the
anterior region of the root of the right cranial vein (superior vena cava) and dorsal to
the root of the right pulmonary vein. The location of the LNC was more diverse in
comparison but was commonly found dorsal to the roots of the left and middle
pulmonary veins (figure 4.2).

105
Figure 4.1. Summary of the morphological pattern of distinct intrinsic cardiac ganglia
from 11 rabbit hearts. Clusters of intrinsic cardiac neurons (indicated in blue) visible on
the dorsal view of the heart. Abbreviations: CV, caudal vein; Lau, left auricle; LCV, left
cranial vein; LPV, left pulmonary vein; MPV, middle pulmonary vein; Rau, right auricle;
RCV, right cranial vein; RPV, right pulmonary vein.

106
Figure 4.2. Macrographs of the rabbit heart illustrating the location of the intrinsic
cardiac nerve plexus in control animals. The boxed area on the rabbit heart in A is
enlarged in B. Images C and D demonstrate examples of ganglia from the right neuronal
cluster. Black arrows indicate extrinsic nerves accessing the nerve plexus on the heart
hilum in A and B. White arrowheads indicate examples of intrinsic cardiac neurons with
black arrowheads showing interconnecting commissural nerves. Asterisks in D indicate
examples of SIF cells located within larger ganglia. Abbreviations: LCV, left cranial vein;
LNC, left neuronal cluster; LPV, left pulmonary vein; MPV, middle pulmonary vein; RCV,
right cranial vein; RNC, right neuronal cluster; RPV, right pulmonary vein.
MPV
LPV RPV
LCV
RCV
RNC
C
D
C D
A
B
LNC
* *

107
Smaller ganglia were also identified at the region of the sinus node, at the root of the
right pulmonary vein, ventral to the middle pulmonary veins and on the dorsal aspect of
the inferior caudal vein (i.e. the inferior vena cava) (figure 4.1). Solitary neuronal somata
and small ganglia were identified at the root of the pulmonary trunk on the conus
arteriosus in 7 out of 11 hearts. Numerous intrinsic cardiac nerves extended from these
ganglia into the anterior walls of the left and right ventricles.
Thinner commissural nerves connected both ganglia within these clusters as well as
behaving as interconnecting nerves between spatially separated ganglia (figure 4.2).
These nerves connected the two larger LNC and RNCs, as well as linking smaller
epicardial ganglia to these larger ganglia in 100% of hearts.
4.2.2 Heart failure and the overall distribution of intrinsic cardiac neurons in the whole
rabbit heart
Remodelling of the ICNS has previously been shown in larger mammal experimental
models (Singh et al., 2013, Rajendran et al., 2016).With the aim of determining the
morphological changes to the rabbit ICNS during heart failure, whole heart AChE staining
experiments were repeated using animals from a coronary artery ligation model.
Experiments were repeated in a further 11 animals (7 from the heart failure group and
4 from the sham operated group).
Ventricular innervation in control animals arises from nerves accessing the arterial part
of the heart hilum (Saburkina et al., 2014). These nerves spread across the ventricles,
branching into numerous subplexuses and extend onto both the left and right ventricles.
Following myocardial infarction, studies have shown evidence of significant denervation
adjacent to and at the region of infarcted tissue (Lorentz et al., 2013) therefore the
neuronal innervation of the ventricles in the rabbit heart failure group were examined
epicardially. Extensive scar tissue was evident in all hearts from the heart failure group
at the region of the left coronary artery ligation as well as peri-infarct. A complete loss
of neuronal innervation was evident within the scar region yet when hearts from the HF
group were compared to the sham operated and control groups, an observable increase
in the number and density of visibly stained nerves was evident.

108
Small ganglia and individual ventricular neuronal somata were identified at the region
of the conus arteriosus in sham operated and HF groups, with ganglia size ranging from
0 – 115 and 0 – 129 cells respectively.
The overall topography and distribution of ganglia was compared within the control,
sham operated and heart failure groups. In 100% of hearts, neuronal somata were
distributed epicardially; primarily on the heart hilum and at the roots of the pulmonary
veins. A large number of neuronal somata were grouped into two clusters in both the
sham and HF groups, as was seen in the control group, again termed the left and right
neuronal clusters. There was no distinct difference in the overall spatial distribution of
cardiac nerves and ganglia between all 3 groups.
4.2.2.1 Quantification of rabbit intrinsic cardiac ganglia and the effect of heart failure
A breakdown of the distribution of intrinsic cardiac neurons within distinct regions of
the rabbit heart is detailed in table 4.1. Control rabbit hearts were studied and overall
there were on average 1632 ± 216 neuronal somata per heart ranging from 1194 to
2229. In hearts from the control group, the majority of intrinsic cardiac neuronal somata
were found on the atria; particularly on the heart hilum and around the roots of the
pulmonary veins. Ventricular ganglia were identified in 7 out of the 11 hearts examined
with a significantly (P<0.0001) smaller number of neurons being found compared to the
ganglia found on the atria (table 4.1). On average there were 19 ±14 neurons present on
the conus arteriousus, yet this number varied between hearts and ranged from being
completely absent on the ventricles in 4/11 hearts up to 153 somata suggesting that
ventricular innervation does not solely arise from ventricular ganglia. The total number
of ganglia ranged from 37-91 with the smallest ganglia consisting of just 3 cells compared
to the largest ganglia containing 199 neurons. Ganglia were predominantly smaller in
size with fewer large ganglia containing more than 100 cells per heart.

109
Table 4.1. Cell numbers showing the overall distribution of intrinsic neuronal somata
in the whole rabbit heart in animals from the control, sham operated and heart failure
groups. Table showing the average number of somata on hearts from hearts from each
of the three groups investigated. This was divided into the total number of atrial and
ventricular neurons per heart. The total number of singular and paired neurons was also
noted. Data is presented as mean ± SEM. Statistical analysis performed with repeated
measures two-way ANOVA to compare conventional vs HF and sham vs HF, ***p < 0.001
and ****p < 0.0001.
Control
(n=11)
Sham
(n=4)
Heart failure
(n=7)
Body weight (kg) 2.4 ± 0.2 3.8 ± 0.1 3.9 ± 0.1
Number of somata per
heart
1632 ± 216 1760 ± 133 1159 ± 101****
Number of ganglia per
heart
63 ± 7 89 ± 25 58 ± 8
Atrial neurons 1603 ± 197 1744 ± 141 1146 ± 110****
Ventricular neurons 19 ± 14 19 ± 17 14 ± 9
Singular neurons 28 ± 11 26 ± 11 10 ± 4
Pairs of neurons 19 ± 5 15 ± 4 8 ± 2
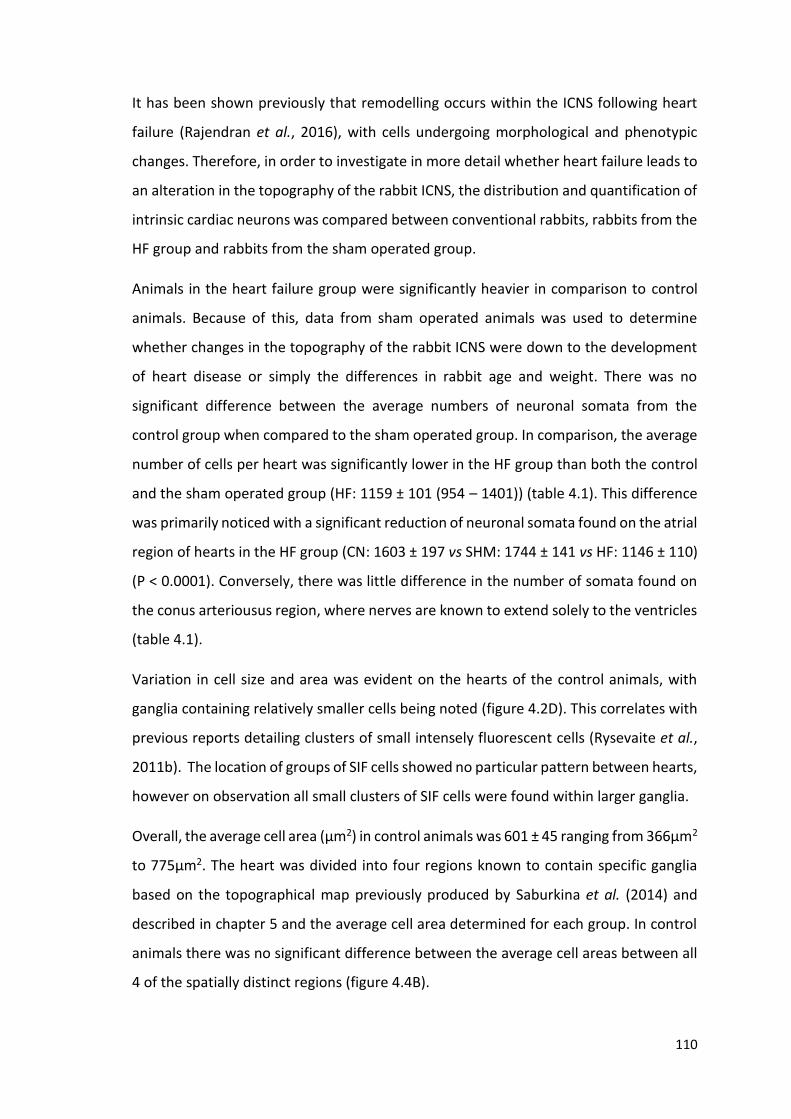
110
It has been shown previously that remodelling occurs within the ICNS following heart
failure (Rajendran et al., 2016), with cells undergoing morphological and phenotypic
changes. Therefore, in order to investigate in more detail whether heart failure leads to
an alteration in the topography of the rabbit ICNS, the distribution and quantification of
intrinsic cardiac neurons was compared between conventional rabbits, rabbits from the
HF group and rabbits from the sham operated group.
Animals in the heart failure group were significantly heavier in comparison to control
animals. Because of this, data from sham operated animals was used to determine
whether changes in the topography of the rabbit ICNS were down to the development
of heart disease or simply the differences in rabbit age and weight. There was no
significant difference between the average numbers of neuronal somata from the
control group when compared to the sham operated group. In comparison, the average
number of cells per heart was significantly lower in the HF group than both the control
and the sham operated group (HF: 1159 ± 101 (954 – 1401)) (table 4.1). This difference
was primarily noticed with a significant reduction of neuronal somata found on the atrial
region of hearts in the HF group (CN: 1603 ± 197 vs SHM: 1744 ± 141 vs HF: 1146 ± 110)
(P < 0.0001). Conversely, there was little difference in the number of somata found on
the conus arteriousus region, where nerves are known to extend solely to the ventricles
(table 4.1).
Variation in cell size and area was evident on the hearts of the control animals, with
ganglia containing relatively smaller cells being noted (figure 4.2D). This correlates with
previous reports detailing clusters of small intensely fluorescent cells (Rysevaite et al.,
2011b). The location of groups of SIF cells showed no particular pattern between hearts,
however on observation all small clusters of SIF cells were found within larger ganglia.
Overall, the average cell area (µm2) in control animals was 601 ± 45 ranging from 366µm2
to 775µm2. The heart was divided into four regions known to contain specific ganglia
based on the topographical map previously produced by Saburkina et al. (2014) and
described in chapter 5 and the average cell area determined for each group. In control
animals there was no significant difference between the average cell areas between all
4 of the spatially distinct regions (figure 4.4B).

111
In all hearts examined from the HF group, there was significant neuronal enlargement
(figure 4.3), with the overall average cell area being significantly larger in comparison to
both the control (P<0.0001) and sham operated groups (P<0.001) (figure 4.4A). There
was no significant difference in the overall cell area between control animals and sham
operated animals, (601 ± 45µm2 vs 564 ± 50µm2 respectively) indicating changes in cell
size were as a result of the prior coronary artery ligation and heart failure.

112
Table 4.2: The size of neurons from rabbit hearts stained histochemically for AChE
from animals from the control, sham operated and heart failure groups. The average
cell area per heart was compared between all three groups with significant enlargement
of neurons from hearts within the heart failure group being evident. In addition the
average long and short axis of all cells on the heart were compared with evidence of
significant enlargement in the heart failure group being noted.
Control
(n=11)
Sham
(n=4)
Heart failure
(n=7)
Cell area ( µm2) 601 ± 45 564 ± 50 1035 ± 63****
Cell long axis (µm) 29.1 ± 1.4 30.2 ± 2.1 42.0 ± 1.8****
Cell short axis (µm) 24.3 ± 0.9 24.7 ± 1.7 34.7 ± 1.7***

113
Figure 4.3. Macrographs illustrating the neuronal enlargement of somata in heart
failure. Evidence of neuronal enlargement seen in the heart failure group (A and B) when
compared to the control group (C and D). B and D illustrate the boxed regions in A and
C with black arrows identifying individual neuronal somata. Images show ganglia within
the right neuronal cluster regions from representative hearts in the heart failure (A and
B) and control (C and D) groups.

114
Despite neuronal enlargement being observed within all regions, the level of
enlargement was spatially diverse. The most significant difference seen in the HF group
when compared to the control and sham operated groups was within the region of the
heart hilum (CN: 632 ± 60µm2 vs SHM: 652 ± 50µm2 vs HF: 1185 ± 31µm2) (figure 4.4B),
with a similar level of enlargement observed at the conus arteriosus (CN: 627 ± 50µm2
vs SHM: 521 ± 30µm2 vs HF: 1143 ± 109µm2). In comparison, neuronal somata measured
from the right atrial region of hearts from the HF group showed no significant
enlargement when compared to both the control and sham groups (CN: 567 ± 68µm2 vs
SHM: 496 ± 32µm2 vs HF: 752 ± 132µm2) (figure 4.4B). This suggests that neuronal
enlargement of cells following heart failure occurs within regions where ganglia exert
preferential influence over the site of injury, in agreement with previous morphological
studies (Rajendran et al., 2016, Nakamura et al., 2016).
In addition to measuring the cell area, the length of both the short and long axis of all
individual cells was measured (figure 4.5). There was no significant difference in both
the average length of short and long axis between the control and sham operated
groups (figure 4.5A). The average short axis of all cells within the heart failure group was
significantly larger than that of both the control and sham operated groups (CN: 24.3 ±
0.9µm vs SHM: 24.7 ± 1.7µm vs HF: 34.7 ± 1.7µm). The overall average long axis was also
significantly increased in the HF group when compared to both the control and sham
operated groups (CN: 29.1 ± 1.4µm vs SHM: 30.2 ± 2.1µm vs HF: 42.0 ± 1.8µm) (table
4.2).
When neurons from 4 different regions known to contain ganglia were compared in the
control and sham operated groups, there was no significant difference in the length of
short and long axis between all 4 regions. The average short and long axis of cells within
these 4 regions was then compared within the HF group. There was no significant
difference between the lengths of the short and long axis of cells found on the heart
hilum, conus arteriosus region and the region ventral to the pulmonary veins however
there were significant differences between the cell lengths of the hilum, CA and ventral
PV region when compared to the right atrial region (figure 4.5B), corresponding to the
data shown for the average cell area within these regions.

115
C o n t r o l S h a m H e a r t F a ilu r e
0
2 0 0
4 0 0
6 0 0
8 0 0
1 0 0 0
1 2 0 0
1 4 0 0
Av
era
ge
ce
ll a
rea
(µ
m2
)
* * * *
* * * *
P V s H ilu m C A R A
0
2 0 0
4 0 0
6 0 0
8 0 0
1 0 0 0
1 2 0 0
1 4 0 0
Av
era
ge
ce
ll a
rea
(µ
m2
)
C o n t r o l
S h a m
H e a r t F a i lu r e
* * * *
* * * *
n s
n s
*
* *
* * * *
* * *
A
B
Figure 4.4. MI induces morphological changes in neuronal somata within the rabbit
ICNS. The average overall cell area was quantified and compared between hearts
from control, sham operated and heart failure animals (A). The average cell area was
increased significantly in all regions examined apart from the region of the right atrial
ganglionated plexus (B). Data are represented as mean ± SEM. Statistical analysis
performed with repeated measures two-way ANOVA, ns = no significance, *p < 0.05,
**p < 0.01, ***p < 0.001, ****p < 0.0001.

116
0 2 0 4 0 6 0 8 0
0
2 0
4 0
6 0
8 0
1 0 0
S h o r t a x is ( m )
Lo
ng
ax
is (
m)
0 2 0 4 0 6 0 8 0
0
2 0
4 0
6 0
8 0
1 0 0
S h o r t a x is ( m )
Lo
ng
ax
is (
m)
0 2 0 4 0 6 0 8 0
0
2 0
4 0
6 0
8 0
1 0 0
S h o r t a x is ( m )
Lo
ng
ax
is (
m)
C E G
B D F
S h o r t a x is L o n g a x is
1 0
2 0
3 0
4 0
5 0
Le
ng
th (
m)
H ilum
R A
C A
vP V
* * *
* * * * * * * *
* * * *
* * * ** * * *
S h o r t a x is L o n g a x is
1 0
2 0
3 0
4 0
5 0
Le
ng
th (
m)
H ilum
R A
C A
vP V
S h o r t a x is L o n g a x is
1 0
2 0
3 0
4 0
5 0
Le
ng
th (
m)
H ilum
R A
C A
vP V
C o n tro l S h a m H F
* * * *
* * * ** * *
* * * *
S h o r t a x is L o n g a x is
1 0
2 0
3 0
4 0
5 0
Av
era
ge
le
ng
th (
m)
A
Figure 4.5. MI induced morphological changes in cell size. A illustrates the increase
in overall average cell size within the HF group (red bars) when compared to hearts
from both control (green bars) and sham operated groups (blue bars). The lengths of
the short and long axis were compared within regions of the heart in all groups (B, D
and E). There was no significant difference in the lengths of the short and long axes
between all regions in the control (B) and sham groups (D). The lack of neuronal
enlargement within the right atrial region in the HF group is demonstrated in F.
Representations of the distribution of cell size are shown in C (control), E (sham
operated) and G (HF group) showing the increased neuronal size in the HF group.
Data are represented as mean ± SEM. Statistical analysis performed with repeated
measures two-way ANOVA, ns = no significance, ***p < 0.001, ****p < 0.0001.

117
4.2.3 Distribution of immunohistochemically distinct intrinsic cardiac ganglia and
neurons
In order to provide a more detailed and comprehensive map of the intrinsic cardiac
ganglia in the rabbit, the distribution of cholinergic and adrenergic neurons was studied.
The neurochemical profile of the ICNS was investigated solely in conventional animals
and not in those that had undergone coronary artery ligation due to time constraints
within this study. Using the technique of whole mount atrial preparation and carefully
selected combinations of primary antibodies, immunohistochemistry was performed.
Cholinergic structures were identified using antibodies to ChAT and TH for adrenergic
structures.
The immunohistochemistry of the rabbit ICNS was investigated in a total of 16 control
animals (1.5-2.5kg). The location of ganglionic cells positive for ChAT and/or TH and/or
nNOS was reproducible from animal to animal with ganglia and cell size varying between
hearts for all antibodies tested. Neurons immunoreactive for purely ChAT, TH or nNOS
were consistently located on the heart hilum, at the root of the pulmonary veins and at
the root of the right caudal vein, corresponding to the neurons identified previously
using histological staining for AChE. ChAT immunoreactive neurons were significantly
more abundant than all other phenotypes studied, with an average of 1946 ± 668
neuronal somata per heart (59 ± 5% of neurons per heart) (table 4.3). ChAT-IR somata
formed a large proportion of 2 large clusters previously identified as the LNC and RNC
as well as significant proportions of smaller ganglia (figure 4.6). Neurons IR for TH only
(10 ± 3% of neurons per heart) were often found dispersed throughout larger ganglia
containing numerous cell phenotypes (figure 4.6).
In addition to singularly labelled cells (i.e. ChAT only, TH only or nNOS only), numerous
ganglia contained neuronal somata that were biphenotypic (figures. 4.6 and 4.7).
Neurons positive for both ChAT and TH made up 18 ± 2% of all neurons, with ChAT and
nNOS positive neurons making up 6 ± 2% compared to just 3 ± 1% of neurons being
positive for both TH and nNOS. Neuronal somata of differing phenotype were examined
in more detail with all cells being measured to determine cell area along with the length
of both the short and long axis of each cell. Overall, there was no significant difference
in the average cell area between all cell types studied. This was further confirmed by no
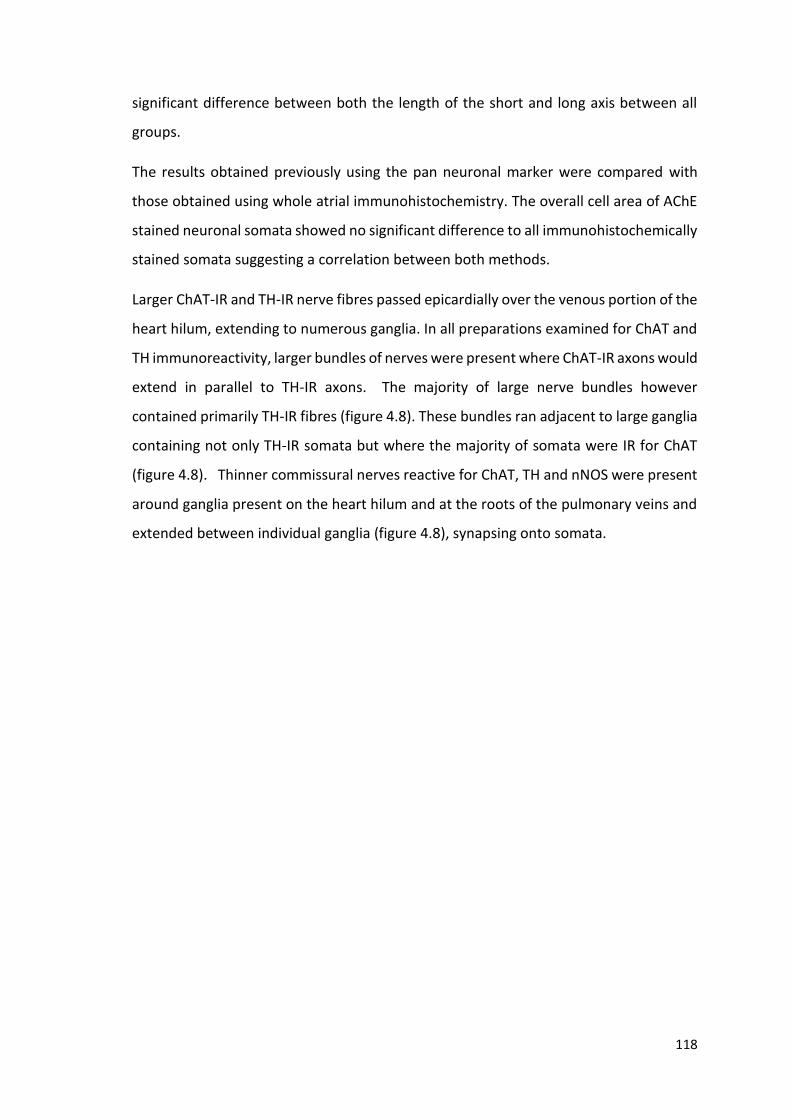
118
significant difference between both the length of the short and long axis between all
groups.
The results obtained previously using the pan neuronal marker were compared with
those obtained using whole atrial immunohistochemistry. The overall cell area of AChE
stained neuronal somata showed no significant difference to all immunohistochemically
stained somata suggesting a correlation between both methods.
Larger ChAT-IR and TH-IR nerve fibres passed epicardially over the venous portion of the
heart hilum, extending to numerous ganglia. In all preparations examined for ChAT and
TH immunoreactivity, larger bundles of nerves were present where ChAT-IR axons would
extend in parallel to TH-IR axons. The majority of large nerve bundles however
contained primarily TH-IR fibres (figure 4.8). These bundles ran adjacent to large ganglia
containing not only TH-IR somata but where the majority of somata were IR for ChAT
(figure 4.8). Thinner commissural nerves reactive for ChAT, TH and nNOS were present
around ganglia present on the heart hilum and at the roots of the pulmonary veins and
extended between individual ganglia (figure 4.8), synapsing onto somata.

119
Figure 4.6. Intrinsic cardiac neurons demonstrate cholinergic or adrenergic or
biphenotypic phenotypes. Images of ganglia double labelled to show ChAT (C and E)
and TH (B and F). Neuronal cell bodies were predominantly IR for ChAT however
evidence of possible colocalisation is apparent (white arrows). Scales bars represent
100µm in all images.
A B
C
D E F
TH
ChAT
TH ChAT

120
Table 4.3. The average number of neurons of specific neurochemical phenotypes seen
in the whole atrial preparation. Data is represented as mean ± SEM and range.
ChAT
n = 9
TH
n = 10
nNOS
n = 9
Average number of somata per
heart 1946 ± 668 326 ± 106 111 ± 20
Average number of somata per
heart (range) 1014 - 3240 35 - 854 54 - 193
Area of neurons (µm2) 557 ± 31 507 ± 35 478 ± 32
Short axis (µm) 25.0 ± 0.9 22.6 ± 1.1 23.1 ± 1.3
Long axis (µm) 32.2 ± 1.4 29.4 ± 1.6 29.6 ± 1.7
ChAT/TH
n = 4
ChAT/nNOS
n = 3
TH/nNOS
n = 5
Average number of somata per
heart 616 ± 161 203 ± 58 112 ± 36
Average number of somata per
heart (range) 340 - 899 107 - 308 22 – 211
Area of neurons (µm2) 515 ± 30 600 ± 48 519 ± 45
Short axis (µm) 23.2 ± 0.4 25.9 ± 1.7 22.6 ± 1.1
Long axis (µm) 31.0 ± 1.0 32.2 ± 2.7 29.6 ± 1.6

121
Figure 4.7. Microphotographs illustrating intrinsic cardiac neurons IR for nNOS and, TH
as well as biphenotypic neurons. A, C and E: Images illustrating the presence of both
TH-IR and nNOS-IR neurons on the root of the right cranial vena cava. B, D and F: An
illustration of a smaller ganglion located in close proximity to the ganglia shown in A, C
and E containing solely nNOS positive neurons and the absence of TH-IR neural
structures shown in B. Panels E and F illustrate dual labelling where evident. Ganglia
purely IR for nNOS were connected by thin commissural neurons (white arrows). Scale
bars represent 100µm in all images.
A
C
B
D
E F
TH TH
nNOS nNOS

122
Figure 4.8. Microphotographs illustrating the predominance of TH fibres throughout
the rabbit ICNS. A-F: Large TH-IR nerve bundles run adjacent to ganglia containing not
only TH-IR neuronal somata, but also ChAT-IR somata. G-I: Microphotographs
illustrating nerves accessing the heart on the medial side of the right cranial vein orifice,
where TH-IR nerves fibres predominate. Scale bars represent 100µm.

123
4.3 Discussion
Understanding the anatomy and morphology of the ICNS is vital if future research is not
only going to determine its functional capacity but also the ability of the ICNS to function
during diseases such as heart failure. The work detailed in this chapter provides further
insight into the overall anatomy and morphology of the ICNS in the rabbit; a model
commonly used to study cardiac electrophysiology.
4.3.1 Distribution of intrinsic cardiac neurons in the whole rabbit heart
The morphological pattern of the intrinsic cardiac nervous system was revealed in whole
heart preparations using histological AChE staining. Some investigators consider
histological staining for AChE a method specific to visualising cholinergic
(parasympathetic) neural structures only (Crick et al., 1996, Crick et al., 1999, Hoover et
al., 2004). Earlier findings by Koelle and colleagues (Koelle et al., 1987) however,
demonstrated staining according to Karnovsky and Roots (1964) stains both adrenergic
and cholinergic neurons and nerves, including SIF cells. Nonetheless, sympathetic neural
structures have less AChE activity than cholinergic fibres (Koelle et al., 1987, Saburkina
et al., 2010). The majority of research conducted prior to the last decade examined
individual ganglia such as the right atrial ganglionated plexus (Hoover et al., 2009) and
ganglia within the posterior atrial region (Hopkins et al., 2000). More recently it has
become increasingly important that the topography of the ICNS in its entirety is
understood. The recent evidence of possible remodelling within the ICNS during cardiac
disease (Rajendran et al., 2016) and the functional role that regions of the ICNS is
thought to play in arrhythmias including atrial fibrillation (Zhao et al., 2015) suggests
that the ICNS is significantly involved in disease. In order to understand how this system
changes, if at all, with disease, a comprehensive understanding of the anatomy and
topography of the ICNS is needed. Utilisation of the whole heart preparation in this study
allowed the overall topography of neural structures to be examined without the damage
that other techniques such as cryostat sectioning may cause.
It was shown in this chapter that despite interindividual variability in the overall
morphology of the rabbit ICNS, neuronal somata lie epicardially with the majority of
ganglia being distributed on the cardiac hilum. Ganglia were also commonly found

124
located around the roots of the pulmonary veins; a finding comparable to previously
published work in other species including mice, rats and guinea pigs (Batulevicius et al.,
2003, Rysevaite et al., 2011a, Leger et al., 1999) as well as data in the rabbit (Saburkina
et al. 2014). Despite the overall number of neurons appearing to be species specific (with
larger mammals tending to exhibit larger numbers of neurons), the overall distribution
of the ICNS in the hearts of smaller mammals such as mice and rats (Batulevicius et al.,
2003, Rysevaite et al., 2011a) are comparatively similar to that of larger mammals
(Saburkina et al., 2010, Yuan et al., 1994). This correlates with the data shown within
this chapter where the topography of the rabbit ICNS appears comparative to other
mammalian species.
The presence of larger nerves accessing both the arterial and venous portions of the
intrinsic cardiac nervous system correlates with previous studies suggesting that the
ICNS is not an isolated neuronal loop but part of the complex neuronal hierarchy
including intrathoracic extracardiac ganglia (Kember et al., 2011). Thinner commissural
nerves linked between and appeared to connect individual ganglia, suggesting intrinsic
cardiac ganglia may have the ability to generate complex feedback loops dependent
upon not only the sensory inputs but also cardiac efferent signals. As well as these
thinner connecting nerves, larger nerves extended from ganglia and larger neuronal
clusters to innervate specific cardiac regions. These neural pathways, previously
described as subplexal routes (Batulevicius et al., 2008, Saburkina et al., 2014) are
known to be similar in several mammalian species, including the rabbit as demonstrated
within this study.
Despite a large proportion of neurons being concentrated within the heart hilum,
approximately 1% of neurons were described as ventricular i.e. located at the region of
the conus arteriosus. Ganglia that were identified at the region of the conus arteriosus
were relatively smaller, especially when compared to the larger ‘clusters’ identified.
These findings correlate with numerous mammalian studies where nerves extend from
these ganglia onto the ventral and lateral surfaces of both the left and right ventricles
emphasising the importance of the ICNS in the control of ventricular function.
The study by Saburkina et al. (2014) reported there to be on average 2200 intrinsic
cardiac neurons, yet the number estimated for within this study was slightly lower with

125
there being approximately 1000-2000 intrinsic cardiac neurons within the rabbit nerve
plexus. Slight discrepancies in these values however may be a reflection of differences
in experimental and analytical techniques. Neurons histologically stained within some
neuronal clusters are arranged into compact ganglia with individual cells sometimes not
being fully discernible. As a result of this and to avoid over-estimation, some neurons
may not have been counted leading to an underestimation of cell numbers.
Overall, the data presented here with regards to the morphology of the rabbit intrinsic
cardiac nervous system corresponds with that shown in a previous study (Saburkina et
al., 2014) suggesting that the rabbit ICNS is comparative to that seen in humans and can
therefore be used to investigate clinically important defects and diseases including heart
failure.
4.3.2 The effects of heart failure on the morphology of the rabbit ICNS
This is the first study to investigate the effect of myocardial infarction and heart failure
on the gross morphology of the rabbit ICNS. Examination of the overall topography of
the rabbit ICNS during heart failure was compared with that of a control group and an
older (age matched) sham operated group. Overall, the distribution of ganglia showed
no obvious differences. Neuronal somata, as seen in the control and sham operated
groups, lay on the epicardial surface of the heart. Somata were commonly grouped into
ganglia (containing 3 or more neurons) with these ganglia primarily residing on the heart
hilum and at the roots of the pulmonary veins.
Despite this similarity in the overall distribution of the intrinsic cardiac nervous system
in animals with heart failure as a result of myocardial infarction, notable differences
were evident. It is well recognised that myocardial infarction and heart failure lead to a
disruption in cardiac autonomic control at the peripheral/extrinsic level. Compromised
cardiac contractility during heart failure leads to neurohumoral activation in an attempt
to stabilise cardiac output. During the acute phase of heart failure there is an increase
in the overall sympathetic drive and a reduction in parasympathetic tone (Triposkiadis
et al., 2009b, Schwarts and Ferrari, 2011). To date however, relatively little is known as
to whether changes in the intrinsic cardiac nervous system contribute to this.
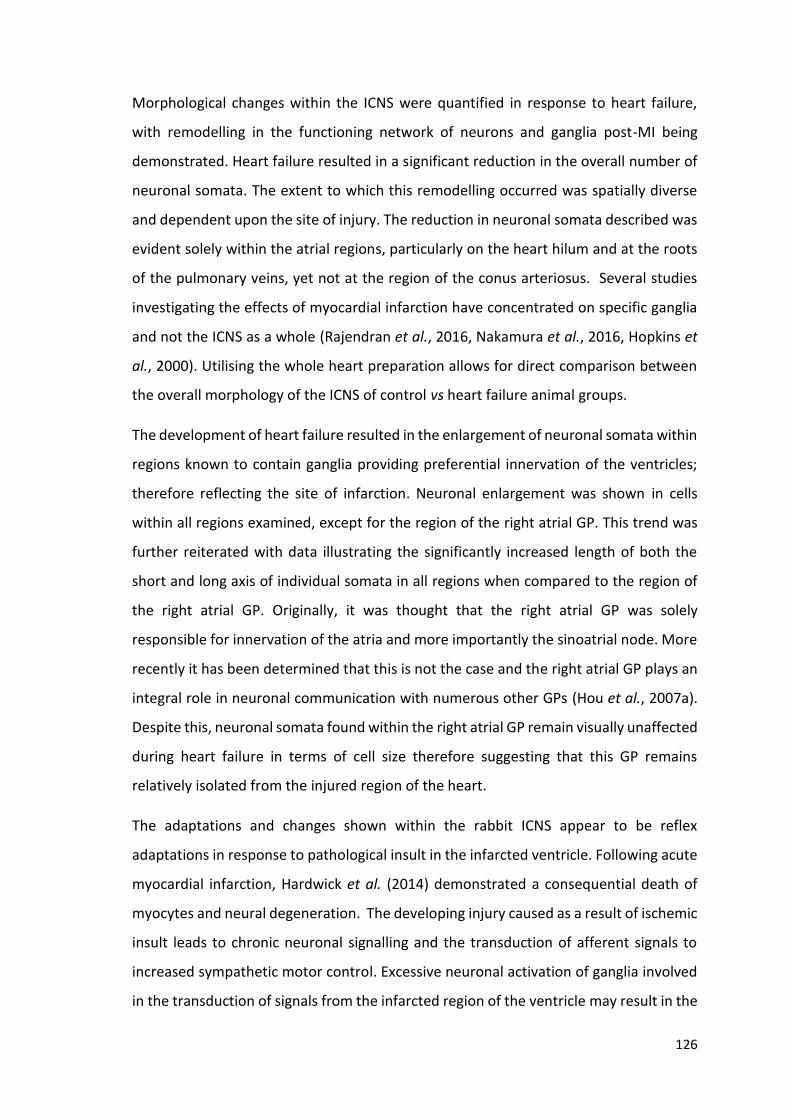
126
Morphological changes within the ICNS were quantified in response to heart failure,
with remodelling in the functioning network of neurons and ganglia post-MI being
demonstrated. Heart failure resulted in a significant reduction in the overall number of
neuronal somata. The extent to which this remodelling occurred was spatially diverse
and dependent upon the site of injury. The reduction in neuronal somata described was
evident solely within the atrial regions, particularly on the heart hilum and at the roots
of the pulmonary veins, yet not at the region of the conus arteriosus. Several studies
investigating the effects of myocardial infarction have concentrated on specific ganglia
and not the ICNS as a whole (Rajendran et al., 2016, Nakamura et al., 2016, Hopkins et
al., 2000). Utilising the whole heart preparation allows for direct comparison between
the overall morphology of the ICNS of control vs heart failure animal groups.
The development of heart failure resulted in the enlargement of neuronal somata within
regions known to contain ganglia providing preferential innervation of the ventricles;
therefore reflecting the site of infarction. Neuronal enlargement was shown in cells
within all regions examined, except for the region of the right atrial GP. This trend was
further reiterated with data illustrating the significantly increased length of both the
short and long axis of individual somata in all regions when compared to the region of
the right atrial GP. Originally, it was thought that the right atrial GP was solely
responsible for innervation of the atria and more importantly the sinoatrial node. More
recently it has been determined that this is not the case and the right atrial GP plays an
integral role in neuronal communication with numerous other GPs (Hou et al., 2007a).
Despite this, neuronal somata found within the right atrial GP remain visually unaffected
during heart failure in terms of cell size therefore suggesting that this GP remains
relatively isolated from the injured region of the heart.
The adaptations and changes shown within the rabbit ICNS appear to be reflex
adaptations in response to pathological insult in the infarcted ventricle. Following acute
myocardial infarction, Hardwick et al. (2014) demonstrated a consequential death of
myocytes and neural degeneration. The developing injury caused as a result of ischemic
insult leads to chronic neuronal signalling and the transduction of afferent signals to
increased sympathetic motor control. Excessive neuronal activation of ganglia involved
in the transduction of signals from the infarcted region of the ventricle may result in the
127
neuronal enlargement and remodelling within the ICNS itself. The cardiac injury, along
with chronic neuronal signalling as a result of MI, has been linked to an elevation in the
concentration of transcardiac nerve growth factor (NGF) (Singh et al., 2013, Zhou et al.,
2004) resulting in the hypertrophy observed in neuronal somata. In addition, NGF has
also been linked to an involvement in the neural remodelling of ventricular innervation
following myocardial infarction (Singh et al., 2013), with increased protein levels of NGF
noted at the peri-ischemic region.
Previous studies, as well as the data shown within this study, show that ventricular
innervation extends from numerous ganglia located not only at the ventricular region of
the conus arteriosus but also from ganglia located on the venous portion of the heart
hilum and at the roots of the pulmonary veins (Saburkina et al., 2014, Batulevicius et al.,
2008, Pauza et al., 2002b). Nerves extend epicardially from these ganglia via numerous
routes including by the arterial part of the heart hilum and between the roots of the
aorta and pulmonary trunk as well as via dorsal routes extending from larger ganglia on
the venous portion of the heart. Extensive scar tissue was clearly visible following
myocardial infarction. This scar formation extended from the region of the original
coronary artery ligation at the left coronary artery, creating a peri-infarct region.
Neuronal denervation was noted within this region, similar to data shown by Lorentz et
al. (2013), where denervation occurred adjacent to and at the region of the original
insult. This was accompanied with an observable increase in the number and density of
visibily stained nerves on the remainder of the ventricular epicardium.
Intrinsic cardiac ganglia containing afferent neurons transduce sensory inputs arising
from diverse regions of the heart. The sensory transduction of chronically infarcted
ventricular tissue is likely to be responsible for a large proportion of pathological
changes including the apparent hyperinnervation of the remaining ventricular nerve
fibres in an attempt to compensate for the neuronal loss as a result of scar formation.
The only differing factor between animals in the sham-operated group and the heart
failure group was the coronary artery ligation during surgery, resulting in the observable
scar formation. It can therefore be assumed that the structural or function changes
noted within the ICNS are as a result of MI. Older and heavier animals survived coronary
artery ligation surgery more readily, therefore sham operated animals were used to
128
further ensure that any variation in results was due to MI and HF. One key factor to take
into account is the local damage likely to be caused to nerves spanning the ventricles
during the ligation of the coronary artery. This damage, which would not exist in the
sham operated group, is unfortunately unavoidable when using this heart failure model.
Further modification is therefore required to eliminate such damage, possibly with the
utilisation of microspheres or polystyrene beads (Sabbah et al., 1991).
Comparison of the anatomy of the ICNS along with quantification of intrinsic neuronal
somata in the rabbit whole-mount preparation between the conventional and sham-
operated group showed there to be little or no modulation of the ICNS due to age,
weight or the experience of surgery. This data is supported by a previous study done by
Saburkina et al. (2014), where a comparison was made of the intrinsic nerve plexus
between juvenile (ranging from 2-6 months old and weighing 2.6 ± 0.4kg) and aged
rabbits (ranging from 3-4 years old and weighing 4.9 ± 0.2kg).
4.3.3 The immunohistochemical profile of the rabbit ICNS in healthy rabbits
The ICNS is a crucial part of the cardiac neuroaxis which functions to control cardiac
electrical and mechanical function. In order to maintain this control, a balance between
stimulatory sympathetic and inhibitory parasympathetic is crucial. Despite the
histological staining method used in this study producing an overall map of the intrinsic
cardiac nervous system, the AChE stain is not suitable to determine in greater detail the
full phenotype of the ICNS. In order to delve deeper into the makeup of the ICNS, more
reliable and more specific markers were used including immunohistochemical labels for
ChAT, TH and nNOS.
The data within this chapter describes and characterises the distribution of cholinergic
and adrenergic intrinsic neurons of the rabbit heart of control animals, as well as the
distribution of the neuromodulator nNOS. Neurons immunoreactive for ChAT were
significantly more abundant compared to those immunoreactive for both TH and nNOS.
Choline acetyltransferase is the enzyme involved in the biosynthesis of acetylcholine,
primarily at nerve terminals. Cholinergic neurons express ChAT making anti-ChAT
antibodies useful in the specific targeting of such neurons. Studies in various mammalian
species show that between 60 and 100% of cardiac neurons are ChAT immunoreactive.

129
These ChAT-IR neuronal somata are often accompanied by an abundance of cholinergic
nerve fibres, particularly around the sinoatrial and atrioventricular nodal regions
(Inokaitis et al., 2016, Hoover et al., 2009). These studies, along with the data presented
within this study supports the idea that the majority of neuronal somata within the ICNS
play a role in the inhibitory control of cardiac function, computing downstream neuronal
inputs from the cardiac vagus.
Intrinsic cardiac ganglia consisted of numerous phenotypically distinct neurons, as seen
in previous studies (Rysevaite et al., 2011b, Hoover et al., 2009).This confirms the ever-
increasing complexity of the ICNS and further demonstrates that the ICNS is not merely
a parasympathetic relay station for efferent postganglionic neurons. Numerous
neuronal somata IR for TH have been illustrated in this study. Tyrosine hydroxylase, the
rate limiting enzyme involved in the biosynthesis of catecholamines including
noradrenaline and dopamine, symbolising a sympathetic role. Generally, neuronal
somata immunoreactive for TH exist as principal neurons, inter and intra-ganglionic
nerves and SIF cells (Rysevaite et al., 2011b). SIF cells, identified within this study to be
involved in the rabbit ICNS, were found to be located within larger ganglia or grouped
into small clusters. As their name suggests, SIF cells were recognisable by their more
intense staining, however in comparison these neurons were much smaller compared
to all other cell phenotypes (cell lengths of approximately 10µm). Despite these cells
being identified previously within the ICNS of other mammalian species and it being
hypothesised that these neurons act as interneurons within ganglia, their precise
function still remains unknown. Relatively larger neuronal somata expressing TH were
described in this study suggesting a sympathetic adrenergic role within the ICNS and the
possibility of the involvement of these ganglia in the functional effects of sympathetic
activation.
It is likely that the ChAT positive neurons within this study are innervated by efferent
vagal fibres, however the problem of understanding role and innervation of TH-positive
neurons remains unresolved. A study by Rysevaite et al. (2011a) reported for the first
time the presence of a population of intrinsic neurons exclusively positive for TH in the
mouse heart. Although it is possible that TH expressing neurons could function in a
similar manner to those within the intrathoracic ganglia including the stellate ganglia,
130
this is still an area under some debate. Fukuda et al. (2015) described the innervation of
sympathetic efferent neurons within the ICNS as coming from postganglionic efferent
nerve fibres originating from either the T1-T4 region of the spinal cord directly or via the
sympathetic efferent neurons within extracardiac intrathoracic ganglia such as the
stellate and middle cervical ganglia suggesting that such neurons within the ICNS do play
a role in sympathetic control of the heart. In contrast to the presence of TH within
intrinsic neurons, Hoard et al. (2007) suggested that TH is made but not exported to
terminal varicosities, hence the observation that many TH-positive neurons within
intrinsic cardiac ganglia stained more intensely than noradrenergic neurons of the
stellate ganglia.
Data presented in this study also illustrate the presence of neurons IR for nNOS.
Neuronal nitric oxide synthase is known to be localised in intrinsic cardiac vagal neurons
(Habecker et al., 2016). Parasympathetic control of the heart implemented by the
cardiac vagus nerve is hypothesised to be associated with neurons with the ICNS (Lo et
al., 2013). NO has been shown to facilitate the release of acetylcholine and induce
bradycardia during activation of the vagus nerve (Herring and Paterson, 2001) via a
cGMP pathway (Herring et al., 2001). The abundant presence of ChAT within the ICNS
and the idea that the innervation from the vagus nerves is transmitted via the ICNS
would therefore imply that nNOS and NO would be expressed alongside these ganglia.
It is now well known that the ICNS does not solely consist of cholinergic and adrenergic
neurons and nerve fibres. Over recent years it has been shown using
immunohistochemical techniques that an increasing number of neurochemicals are
presented within the ICNS. As well as the 3 neurochemicals investigated throughout this
chapter, studies have shown the presence of sensory neurons reactive for substance P,
CGRP, NPY and VIP.
Unfortunately, due to time constraints, study of the immunohistohemical profile of the
rabbit ICNS during heart failure was not possible. In terms of the neurochemical profile
of the ICNS following myocardial infarction and heart failure, very little is known. Of the
few studies to have investigated the morphological remodelling of neurons within the
ICNS, little has been determined about the overall change in phenotype. Based on
studies where differentiation of the neurochemical phenotype has been examined

131
within intrinsic cardiac ganglia (Rajendran et al., 2016) and cardiac neurons (Olivas et
al., 2016), significant alterations and differences would be expected throughout the
ICNS following MI. Following MI, there is a transient increase in the cardiac acetylcholine
content (Olivas et al., 2016). This is due to an increase in the acetylcholine released from
transdifferentiated cardiac sympathetic neurons which prior to injury were primarily
involved in the release of noradrenaline and functioned in a sympathetic manner.
These findings suggest a significant role of the ICNS during heart failure in the aim of
counteracting the centrally mediated parasympathetic withdrawal, however it is also
feasible that this mechanism is spatially divergent and dependent upon the regions of
intrinsic cardiac ganglia directly affected by myocardial infarct. MI has also been shown
to induce a decrease in the cholinergic phenotype of ganglia within the ventral
interventricular GP (VIV GP) (Rajendran et al., 2016) along with regional increases in
adrenergic sensitivity and nNOS expression (Hardwick et al., 2014). Despite evidence
suggesting increased nNOS expression occurs following MI, this is not the case in the
right atrial GP (Dawson et al., 2008), correlating with the regional effects of heart failure
demonstrated within this study.
Heart failure also results in changes in the presence of VIP, known to be a modulator of
cardiac function and involved in the vasodilation of cardiac vasculature. The study by
Parsons et al. (2006) demonstrated that fibres immunoreactive for VIP were present in
approximately 70% of ganglia in the guinea pig. Significant increases in the expression
VIP independent of ganglia positioning within the ICNS has been described as a result of
myocardial infarction (Rajendran et al., 2016); a likely consequence of the reduced
ability of the heart to maintain cardiac output and blood pressure.
Overall, it can therefore by hypothesised that the ICNS is highly involved in cardiac
autonomic adaptation to preserve cardiac function and counteract the damage caused
by myocardial infarction and heart failure. In order to fully determine the role of the
ICNS, further study is required into the phenotypical divergence of intrinsic cardiac
ganglia during heart failure as well as any phenotypic changes of nerve fibres innervating
the ventricles.
132
Chapter 5: The functional role of intrinsic cardiac ganglia in the rabbit
5.1 Introduction
Until recently, very little research had been conducted into the functional capability of
the ICNS in terms of the cardiac control of electrophysiology. With the increased interest
in the ICNS over the past decade and the development of comprehensive morphological
maps, more and more studies have been aimed at determining the functional role of
individual ganglia as well as the way in which specific ganglia interact to produce both
local and remote cardiac changes (Cardinal et al., 2009, Butler et al., 1990, Hou et al.,
2007a).
The ICNS is thought to be the final stage of control of cardiac function involving the
processing of sensory inputs as well as parasympathetic and sympathetic efferent inputs
(Armour, 2004). Historically, it was believed that the right atrial GP was solely
responsible for chronotropic regulation and the inferior vena cava-inferior left atrial GP
solely involved in dromotropic regulation. More recently however, studies have
demonstrated an increased level of complexity with ganglia within all regions of the ICNS
demonstrating some chronotropic and dromotropic regulatory capacity (Cardinal et al.,
2009).
Heart failure induces morphological changes to neurons within the ICNS (Nakamura et
al., 2016, Rajendran et al., 2016). Limited information regarding how these changes
affect the ability of the ICNS to control cardiac indices is currently available. During heart
failure, the ability of the heart and the ICNS to transduce afferent signals displays
increased levels of heterogeneity with afferent signals from the injury site becoming
attenuated in comparison to neurons at the border or away from the infarcted region
(Rajendran et al., 2016). This reduction in the functional connectivity of the ICNS
following MI, along with the centrally mediated parasympathetic withdrawal evident
within the ICNS neurons, leads to an increased propensity for the induction of cardiac
arrhythmias including ventricular tachyarrhythmia.
Understanding the various aspects of the cardiac neuronal hierarchy, right down to the
precise roles of the intrinsic cardiac ganglia in altering cardiac electrophysiology, enables
the potential development of neuromodulation therapies for cardiac diseases including

133
ventricular tachyarrhythmia and atrial fibrillation. The stimulation or ablation of ganglia
within the ICNS could aid in the potential treatment of cardiac diseases including heart
failure where autonomic imbalance plays a significant role in the development of
potentially lethal arrhythmias.
To date, little or no investigation has been aimed at determining the influences of
spatially divergent ganglionic plexuses within the ICNS on cardiac electrophysiology in
the rabbit, despite the rabbit often being used to investigate such factors. The primary
aim of this chapter was therefore to determine the functional capabilities of specific
ganglia within the rabbit ICNS using electrical stimulation, therefore activating both
parasympathetic and sympathetic neurons when present. Following on from this, the
effects of MI and heart failure on the ability of the ICNS to function in response to
electrical stimulation were investigated utilising the coronary artery ligation model in
the rabbit described previously.

134
5.2 Results
The interaction between ganglia within the ICNS is complex and involves numerous
feedback loops. The following experiments were conducted with the aim of quantifying
the functional capability of these ganglia in a rabbit model.
The Langendorff whole heart preparation was used to investigate the effect of electrical
stimulation of intrinsic cardiac neurons on numerous electrophysiological parameters
including heart rate and atrioventricular delay. In brief, ganglia were stimulated at 50%
of the cardiac pacing threshold in either sinus rhythm or under constant atrial pacing.
Changes in heart rate, left ventricular pressure, MAP duration (MAPD) and
atrioventricular delay were recorded at each site. In order to allow for specific
stimulation at the sites indicated in figure 5.1 and to limit the spread of electrical
stimulation, small current strengths were used at a very short pulse duration of 0.1ms.
5.2.1 The effects of electrical stimulation of cardiac intrinsic ganglionated plexuses
The effect of electrical stimulation of intrinsic cardiac ganglia was examined in 14
animals (weighing 2 – 2.5kg). Ganglionated plexuses were stimulated within the regions
shown in figure 5.1 with the RNC, located medially to the root of the RCV and dorsally
to the root of the RPV being examined in all 14 animals. Intrinsic ganglia located within
the LNC, right atrial GP and PVCV regions were investigated in fewer animals (8/14, 9/14
and 8/14 respectively).

135
Figure 5.1. Ventral (a) and dorsal (b) view of the heart indicating the regions for
electrical stimulation of the intrinsic cardiac ganglia. Abbreviations: Ao, aorta; CS,
coronary sinus; CV, caudal vein; DRA, dorsal right atrial subplexus; LAu, left auricle;
LC, left coronary subplexus; LCV, left cranial vein; LD, left dorsal subplexus; LNC,
left neuronal cluster; LPV, left pulmonary vein; LV, left ventricle; MD, middle
dorsal subplexus; MPV, middle pulmonary vein; PT; pulmonary trunk; RAu, right
auricle; RC, right coronary subplexus; RNC, right neuronal cluster; RPV, right
pulmonary vein; RV, right ventricle; VLA, ventral left atrial subplexus; VRA, ventral
right atrial subplexus.

136
5.2.1.1 Chronotropic responses to electrical stimulation of intrinsic cardiac ganglia
The effects of electrical stimulation of intrinsic cardiac ganglia on heart rate during sinus
rhythm were examined at a total of 56 sites. Three specific types of response were
noted; i) bradycardia alone, ii) tachycardia alone and iii) bradycardia followed by
tachycardia (figure 5.2). The development of tachycardia occurred on average ~5s post-
stimulation commencement compared to bradycardia responses which occurred almost
instantly (figure 5.2). Significant heart rate changes were evoked in 2 out of the 4 regions
when the frequency of stimulation was 20Hz or more: the RA and the RNC (figure 5.3).
Stimulation of plexuses within the LNC and PVCV regions at all frequencies up to 50Hz
resulted in only small reductions in heart rate (-6 ± 11bpm and -11 ± 7bpm respectively).
Overall, electrical stimulation induced tachycardia alone at 5% of sites tested (3/14
animals), all at sites within the RA region around the root of the right pulmonary vein.
On the other hand, bradycardia responses were produced by electrical stimulation in all
regions examined (figure 5.4). The most pronounced bradycardia responses during
stimulation at 50Hz were produced in response to stimulation of the hilum region of the
RNC (figure 5.4) and the RA region, with the change in heart rate (bpm) ranging from 0
to -110bpm and 0 to -101bpm respectively (average change -25.5 ± 4.2% and -21 ± 12.0%
respectively). Bradycardia followed by tachycardia was recorded in one animal and only
at 1 loci; within the RNC (155 to 145 to 160 bpm during stimulation at 10Hz).
At all loci where a heart rate response was recorded during electrical stimulation, the
level of heart rate change, whether a bradycardia or tachycardia, altered in a frequency
dependent manner (figure 5.4). The average change in bradycardic heart rate responses
increased progressively as the frequency of electrical stimulation applied to all regions
increased up to 50Hz. There was no significant difference in the average change in all
regions at when stimulated at 10Hz. The average reduction in heart rate during electrical
stimulation at the RNC was significantly different at 20Hz (p < 0.01), 30Hz (p < 0.01),
40Hz (p < 0.001) and 50Hz (p < 0.0001) and at the RA region at 20Hz, 30Hz, 40Hz (p<0.05)
and 50Hz (p < 0.01). In comparison, despite small reductions in heart rate being noted,
no statistically significant changes in HR were observed at the LNC and PVCV regions
when stimulation occurred between 10 and 50 Hz.
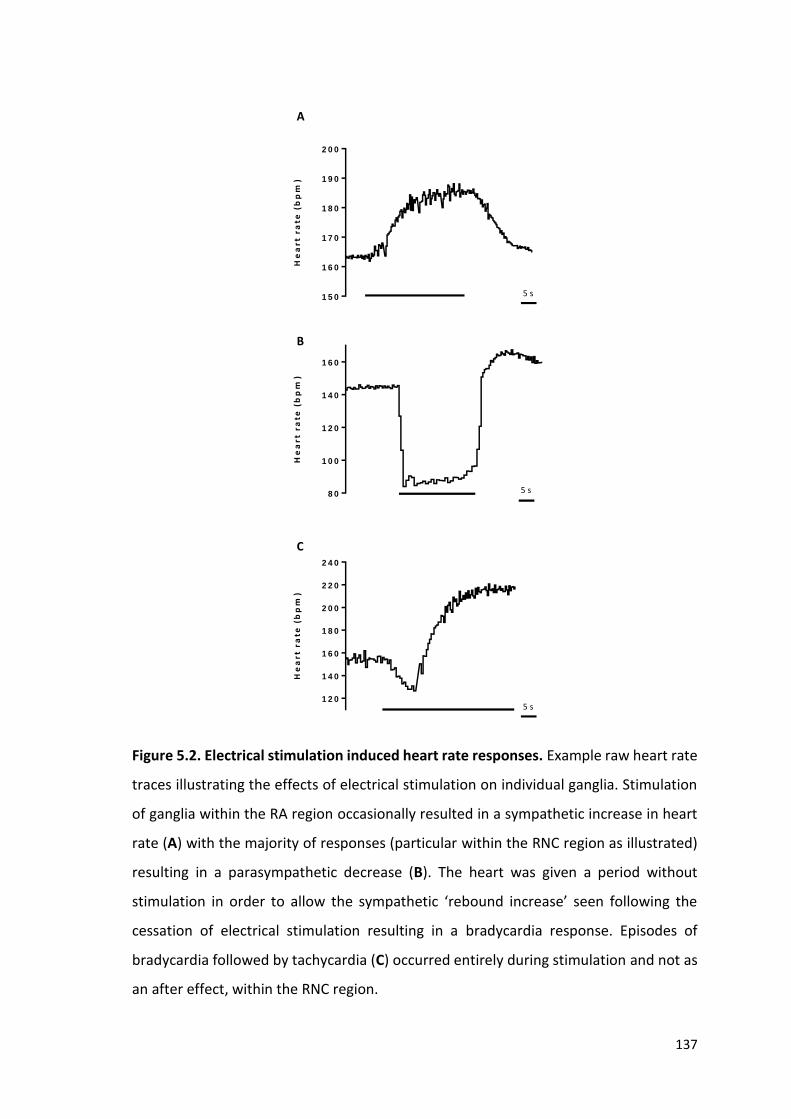
137
1 5 0
1 6 0
1 7 0
1 8 0
1 9 0
2 0 0
He
ar
t r
ate
(b
pm
)5 s
8 0
1 0 0
1 2 0
1 4 0
1 6 0
He
ar
t r
ate
(b
pm
)
5 s
1 2 0
1 4 0
1 6 0
1 8 0
2 0 0
2 2 0
2 4 0
He
ar
t r
ate
(b
pm
)
5 s
A
B
C
Figure 5.2. Electrical stimulation induced heart rate responses. Example raw heart rate
traces illustrating the effects of electrical stimulation on individual ganglia. Stimulation
of ganglia within the RA region occasionally resulted in a sympathetic increase in heart
rate (A) with the majority of responses (particular within the RNC region as illustrated)
resulting in a parasympathetic decrease (B). The heart was given a period without
stimulation in order to allow the sympathetic ‘rebound increase’ seen following the
cessation of electrical stimulation resulting in a bradycardia response. Episodes of
bradycardia followed by tachycardia (C) occurred entirely during stimulation and not as
an after effect, within the RNC region.

138
Figure 5.3. A map of the dorsal view of the heart illustrating the percentage change in
heart rate from baseline during electrical stimulation of regions within the rabbit ICNS.
BL, baseline; IVC, inferior vena cava; LAu, left auricle; LPV; left pulmonary vein; MPV,
middle pulmonary vein; RAu, right auricle; RPV, right pulmonary vein; SVC, superior vena
cava.

139
B L M IN B L M A X
5 0
1 0 0
1 5 0
2 0 0
2 5 0H
ea
rt r
ate
(b
pm
)
*
B L M IN B L M A X
5 0
1 0 0
1 5 0
2 0 0
2 5 0
He
art
ra
te (
bp
m)
**
B L M IN B L M A X
5 0
1 0 0
1 5 0
2 0 0
2 5 0
He
art
ra
te (
bp
m)
*
**
B L M IN B L M A X
5 0
1 0 0
1 5 0
2 0 0
2 5 0
He
art
ra
te (
bp
m)
*
***
**
****
B L M IN B L M A X
5 0
1 0 0
1 5 0
2 0 0
2 5 0
He
art
ra
te (
bp
m)
R A
R N C
L N C
P V C V
A B
C D
E
1 0 H z 2 0 H z
3 0 H z 4 0 H z
5 0 H z
Figure 5.4. Heart rate responses induced by electrical stimulation at sites in RA,
RNC, LNC and PVCV in control animals. At all sites where electrical stimulation of
intrinsic cardiac ganglia produced a bradycardic response, the average reduction in
heart rate hearts was compared to the average baseline heart rate. At sites where
electrical stimulation produced a tachycardic response, the average baseline heart
rate prior to stimulation of these loci was also compared with the average increase
in heart rate. Mean data is shown at 10Hz (A), 20Hz (B), 30Hz (C), 40Hz (D) and 50Hz
(E). Data represents mean ± SEM. BL = baseline. N= 56 (14 animals). Two-way ANOVA
was used to compare baseline with minimum and maximum values. * p < 0.05, ** p
< 0.01, *** p < 0.001, **** p < 0.0001.

140
5.2.1.2 Left ventricular pressure and monophasic action potential duration changes
Mean data illustrating baseline and peak left ventricular pressure (LVP) during sinus
rhythm are shown in figure 5.5A along with the mean percentage change in LVP from
baseline (figure 5.5B). There was no significant difference in mean LVP during electrical
stimulation when compared to baseline between each of the 4 regions tested as well as
no significant difference in the percentage change in LVP when each group was
compared. There was no significant difference in LVP response during stimulation of
sites that induced a bradycardia when compared to sites where a tachycardia response
was noted.
Monophasic action potential duration (MAPD) was recorded in all experiments. No
significant difference in the percentage change in MAPD from baseline was seen in any
loci stimulated even when significant changes in heart rate were noted (figure 5.5C and
D).

141
B L E S
4 0
5 0
6 0
7 0P
ea
k L
VP
(m
mH
g)
R A
R N C
L N C
P V C V
R A R N C L N C P V C V
-2 5
-2 0
-1 5
-1 0
-5
0
Pe
rce
nta
ge
ch
an
ge
in
pe
ak
LV
P f
rom
ba
se
lin
e
B L E S
1 2 0
1 3 0
1 4 0
1 5 0
1 6 0
MA
PD
90
(ms
)
R A
R N C
L N C
P V C V
R A R N C L N C P V C V
-5
0
5
1 0
1 5
Pe
rce
nta
ge
ch
an
ge
in
MA
PD
90
fro
m b
as
eli
ne
A B
C D
Figure 5.5. LVP and MAPD responses during electrical stimulation at sites in RA,
RNC, LNC and PVCV. The effects of electrical stimulation of intrinsic cardiac ganglia
on the average peak left ventricular pressure (A) and percentage change from
baseline (B) where no significant change was recorded. Electrical stimulation on
intrinsic cardiac ganglia resulted in no significant change in MAPD90 compared to
baseline (C) with no significant difference in the percentage change in MAPD90 from
baseline when compared between all four regions investigated (D). n = 47 (10
animals).

142
5.3 The functional role of the ICNS following MI
The data presented in the previous chapter along with data from previous studies
demonstrates that chronic myocardial infarction induces neuronal remodelling. The true
extent with which this morphological alteration occurs in a rabbit model of heart failure
was discussed previously but understanding the effects of this change on cardiac
electrophysiology could provide a crucial insight into understanding clinical implications
following an incidence of MI.
5.3.1 Chronotropic responses to electrical stimulation of intrinsic cardiac ganglia
following MI
Following on from the results obtained in the control group of animals, experiments
were repeated in a further 11 animals; 7 that had undergone coronary artery ligation
surgery (3.9 ± 0.3 kg) and 4 from the sham operated group (3.8 ± 0.1 kg). The effects of
electrical stimulation were again examined at the 4 regions shown in figure 5.1 at
frequencies ranging from 10 - 50Hz. Chronotropic responses to electrical stimulation
altered in frequency dependent manner in both the sham operated (figure 5.6) and
heart failure groups (figure 5.7).
Only small reductions in heart rate (1-6 bpm) were noted at all frequencies when ganglia
were stimulated within the LNC and at the PVCV region in the sham operated group,
correlating with the changes evident in the control group. During electrical stimulation,
tachycardia responses were noted in just 1 out of the 4 sham operated animals (25%)
compared to 3 out of 14 control animals (21%). There was no significant between the
average increase in the heart rate during stimulation within all regions in both the
control and sham operated groups.
No significant difference being noted in either the average heart rate change or the
percentage change in HR between all 3 groups examined (control, sham and heart
failure). As with the sham operated group, only small reductions in heart rate (1-6bpm)
were noted at all frequencies when ganglia were stimulated within the LNC and PVCV
region in the heart failure group. During electrical stimulation, tachycardia responses

143
were noted in 3 out of the 7 (43%) animals that had undergone coronary artery ligation
surgery compared to just 25% previously described in the sham operated group. As with
the control animals, episodes of bradycardia followed by tachycardia were recorded at
one loci in an animal from the heart failure group as well as one animal from the sham
operated group, both within the RNC.

144
B L M IN B L M A X
5 0
1 0 0
1 5 0
2 0 0
2 5 0
He
art
ra
te (
bp
m)
**
B L M IN B L M A X
5 0
1 0 0
1 5 0
2 0 0
2 5 0
He
art
ra
te (
bp
m)
****
B L M IN B L M A X
5 0
1 0 0
1 5 0
2 0 0
2 5 0
He
art
ra
te (
bp
m)
****
B L M IN B L M A X
5 0
1 0 0
1 5 0
2 0 0
2 5 0
He
art
ra
te (
bp
m)
******
B L M IN B L M A X
5 0
1 0 0
1 5 0
2 0 0
2 5 0
He
art
ra
te (
bp
m)
R A
R N C
L N C
P V C V
*****
A B
C D
E
1 0 H z 2 0 H z
3 0 H z 4 0 H z
5 0 H z
Figure 5.6. Heart rate responses induced by electrical stimulation at sites in RA,
RNC, LNC and PVCV in the sham operated group. At all sites where electrical
stimulation of intrinsic cardiac ganglia produced a bradycardic response, the average
reduction in heart rate hearts was compared to the average baseline heart rate. At
sites where electrical stimulation produced a tachycardic response, the average
baseline heart rate prior to stimulation of these loci was also compared with the
average increase in heart rate. Mean data is shown at 10Hz (A), 20Hz (B), 30Hz (C),
40Hz (D) and 50Hz (E). Data represents mean ± SEM. BL = baseline. N = 22 (4 animals).
Two - way ANOVA was used to compare baseline with minimum and maximum
values. * p < 0.05, ** p < 0.01, *** p < 0.001, **** p < 0.0001.

145
B L M IN B L M A X
5 0
1 0 0
1 5 0
2 0 0
2 5 0
He
art
ra
te (
bp
m)
**
**
***
B L M IN B L M A X
5 0
1 0 0
1 5 0
2 0 0
2 5 0
He
art
ra
te (
bp
m)
*
***
****
B L M IN B L M A X
5 0
1 0 0
1 5 0
2 0 0
2 5 0
He
art
ra
te (
bp
m)
***
****
B L M IN B L M A X
5 0
1 0 0
1 5 0
2 0 0
2 5 0
He
art
ra
te (
bp
m) ***
*****
B L M IN B L M A X
5 0
1 0 0
1 5 0
2 0 0
2 5 0
He
art
ra
te (
bp
m)
R A
R N C
L N C
P V C V
***
****
*
A B
C D
E
1 0 H z 2 0 H z
3 0 H z 4 0 H z
5 0 H z
Figure 1: Heart failure
Figure 5.7. Heart rate responses induced by electrical stimulation at sites in RA,
RNC, LNC and PVCV in the heart failure group. At all sites where electrical stimulation
of intrinsic cardiac ganglia produced a bradycardic response, the average reduction
in heart rate hearts was compared to the average baseline heart rate. At sites where
electrical stimulation produced a tachycardic response, the average baseline heart
rate prior to stimulation of these loci was also compared with the average increase
in heart rate. Mean data is shown at 10Hz (A), 20Hz (B), 30Hz (C), 40Hz (D) and 50Hz
(E). Data represents mean ± SEM. BL = baseline. N = 44 (7 animals). Two-way ANOVA
was used to compare baseline with minimum and maximum values. * p < 0.05, ** p
< 0.01, *** p < 0.001, **** p < 0.0001.

146
The average bradycardic response was larger in animals from the heart failure group at
all frequencies examined compared with the sham operated group, when ganglia within
the RNC were stimulated. Significant differences in the average heart rate increase were
noted in both the RA region (at 10Hz, p < 0.05) and within the RNC (at all frequencies
tested) (figure 5.7) of the HF group compared to the sham operated group.
The percentage change in heart rate was calculated for each loci tested for both
bradycardic and tachycardic responses. The average percentage change (presented as
mean ± SEM) within each of the 4 regions (RA, RNC, LNC and PVCV) was compared
between the control, sham operated and heart failure groups. There was no significant
difference in the percentage heart rate change within all regions when the control group
was compared with the sham operated group. This was also the case when the results
produced during electrical stimulation of the LNC and PVCV regions were compared
between all three groups investigated, with no significant difference being evident.
Conversely, changes in heart rate as a result of stimulation at RNC and RA were
significantly different in hearts from the heart failure group when compared to both the
control and sham operated groups. The largest difference seen following myocardial
infarction in the effects of electrical stimulation on intrinsic cardiac ganglia was recorded
at loci within the RNC. The average percentage decrease in heart rate was noticeably
larger in the heart failure group and at frequencies between 20 – 50Hz this decrease was
significantly different when compared to both the control and sham-operated groups
(figure 5.8).
A larger increase in heart rate during stimulation of particular loci within the RA and
primarily the RNC regions was seen in the heart failure group when compared to both
the controls and sham operated groups.. Tachycardia as a result of electrical stimulation
within the RNC was significantly increased at all frequencies and the average change in
heart rate was significantly different to that of the control and sham operated group
(figure 5.8). Conversely, tachycardic responses as a result of stimulation of loci within
the RA of hearts within the heart failure group showed a decrease with increasing
frequency of stimulation, reiterating the overall complexity of the rabbit ICNS and the
functional capability of the neurons within it.

147
5.3.2 Left ventricular pressure and monophasic action potential duration changes in
the heart failure and sham operated groups
As with the control group, the left ventricular pressure and the MAPD were measured
in sinus rhythm during electrical stimulation of ganglia. The was no significant difference
in the average maximum LVP measurements between the control and sham operated
groups (51.0 ± 0.6 mmHg vs 53.8 ± 0.9 mmHg respectively). When compared to the
results from the heart failure group, there was a significant difference in the average
maximum LVP (HF: 37.9 ± 7.0) (p < 0.05). Despite this difference, there was no significant
difference in the average LVP during baseline when compared to the average LVP during
electrical stimulation at loci within all regions tested.
The previous data regarding changes in MAPD during electrical stimulation was
compared to data from both the sham operated and heart failure groups, with results
from both groups showing no evidence of a significant change in MAPD during electrical
stimulation at all frequencies investigated (10 – 50Hz).

148
R A R N C L N C P V C V
-6 0
-4 0
-2 0
0P
erc
en
tag
e c
ha
ng
e i
n H
R(b
pm
)
fro
m b
as
eli
ne
A B
C D
E
R A R N C L N C P V C V
-6 0
-4 0
-2 0
0
Pe
rce
nta
ge
ch
an
ge
in
HR
(bp
m)
fro
m b
as
eli
ne
* * * *
* * * *
R A R N C L N C P V C V
-6 0
-4 0
-2 0
0
Pe
rce
nta
ge
ch
an
ge
in
HR
(bp
m)
fro
m b
as
eli
ne
* * * *
* * * *
R A R N C L N C P V C V
-6 0
-4 0
-2 0
0
Pe
rce
nta
ge
ch
an
ge
in
HR
(bp
m)
fro
m b
as
eli
ne
* * * *
* * * *
R A R N C L N C P V C V
-6 0
-4 0
-2 0
0
Pe
rce
nta
ge
ch
an
ge
in
HR
(bp
m)
fro
m b
as
eli
ne
* * * *
* * * *
H e a rt F a ilu re
S h am
C o n tro l
E
1 0 H z 2 0 H z
3 0 H z 4 0 H z
5 0 H z
Figure 5.8. The percentage change in HR reductions during electrical stimulation
of intrinsic cardiac ganglia. Mean data showing the average percentage change in
bradycardic HR responses during electrical stimulation within all regions at 10Hz
(A), 20Hz (B), 30Hz (C), 40Hz (D) and 50Hz (E). Data represents mean ± SEM. Two-
way ANOVA was used to compare data between control, sham and HF groups. * p <
0.05, ** p < 0.01, *** p < 0.001, **** p < 0.0001.
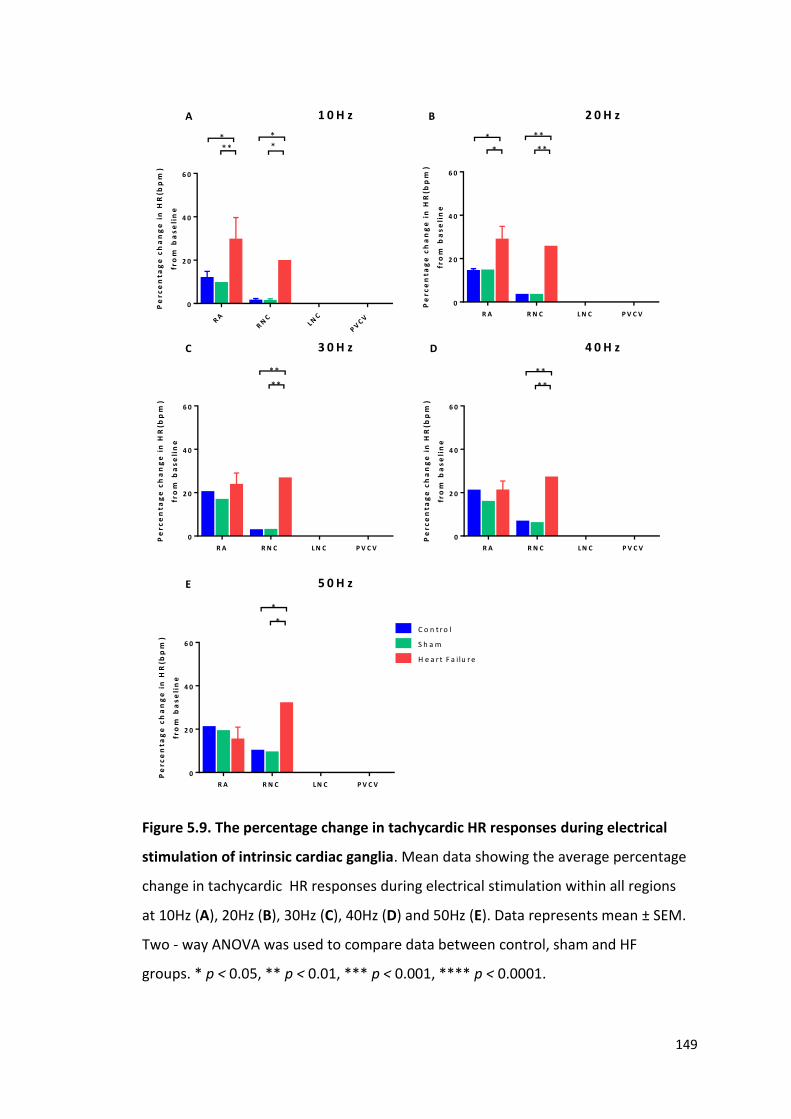
149
RA
RN
C
LNC
PV
C V
0
2 0
4 0
6 0
Pe
rce
nta
ge
ch
an
ge
in
HR
(bp
m)
fro
m b
as
eli
ne
***
**
R A R N C L N C P V C V
0
2 0
4 0
6 0
Pe
rce
nta
ge
ch
an
ge
in
HR
(bp
m)
fro
m b
as
eli
ne
*
*
**
**
R A R N C L N C P V C V
0
2 0
4 0
6 0
Pe
rce
nta
ge
ch
an
ge
in
HR
(bp
m)
fro
m b
as
eli
ne
**
**
R A R N C L N C P V C V
0
2 0
4 0
6 0
Pe
rce
nta
ge
ch
an
ge
in
HR
(bp
m)
fro
m b
as
eli
ne
**
**
R A R N C L N C P V C V
0
2 0
4 0
6 0
Pe
rce
nta
ge
ch
an
ge
in
HR
(bp
m)
fro
m b
as
eli
ne
C o n t r o l
S h a m
H e a r t F a i lu r e
*
*
A B
C D
E
1 0 H z 2 0 H z
3 0 H z 4 0 H z
5 0 H z
Figure 5.9. The percentage change in tachycardic HR responses during electrical
stimulation of intrinsic cardiac ganglia. Mean data showing the average percentage
change in tachycardic HR responses during electrical stimulation within all regions
at 10Hz (A), 20Hz (B), 30Hz (C), 40Hz (D) and 50Hz (E). Data represents mean ± SEM.
Two - way ANOVA was used to compare data between control, sham and HF
groups. * p < 0.05, ** p < 0.01, *** p < 0.001, **** p < 0.0001.

150
5.4 Dromotropic responses to electrical stimulation of intrinsic cardiac ganglia
Atrioventricular conduction was measured during constant atrial pacing by measuring
the interval between the pacing stimulus and the ventricular monophasic action
potential recorded from the left ventricle. In order to account for increases in HR during
electrical stimulation, the heart was constantly paced at a cycle length of 300ms
corresponding to a heart rate of 200bpm.
Significant AV prolongation (an example of which is illustrated in figure 5.10) occurred
during electrical stimulation of at least one site within 3 out of the 4 regions examined,
with only stimulation within the LNC eliciting no significant AVC changes at any of the
sites tested. Changes in AV conduction were measured during electrical stimulation at
54 sites. At 45/54 sites, no significant change in AVC was measured, with the level of
prolongation during stimulation at the remaining 9 sites ranging from 15ms to AVB. The
most significant changes in AV conduction occurred within the RNC; the only region
where electrical stimulation elicited atrioventricular block (AVB) (6/27 sites). Significant
prolongation also occurred within the PVCV region (2/9 sites) (figure 5.11).
Atrial tachyarrhythmia/fibrillation was elicited following electrical stimulation of
neurons within the LNC-MPV region in only one instance.

151
1 0 0 m s
Figure 5.10. Electrical stimulation induced effects on atrioventricular conduction.
Example monophasic action potential recordings illustrating the effect of electrical
stimulation of intrinsic cardiac ganglia on atrioventricular delay during constant atrial
pacing (the arrow illustrating the constant pacing trigger).

152
B L E S
5 0
1 0 0
1 5 0
2 0 0
Atr
iov
en
tric
ula
r d
ela
y (
ms
)
****
B L E S
5 0
1 0 0
1 5 0
2 0 0
Atr
iov
en
tric
ula
r d
ela
y (
ms
)
**
B L E S
5 0
1 0 0
1 5 0
2 0 0
Atr
iov
en
tric
ula
r d
ela
y (
ms
)
***
******
B L E S
5 0
1 0 0
1 5 0
2 0 0
Atr
iov
en
tric
ula
r d
ela
y (
ms
)
*
****
B L E S
5 0
1 0 0
1 5 0
2 0 0
Atr
iov
en
tric
ula
r d
ela
y (
ms
)
R A
R N C
L N C
P V C V
**
A B
C D
E
1 0 H z 2 0 H z
3 0 H z 4 0 H z
5 0 H z
Figure 5.11. The effects of electrical stimulation on atrioventricular conduction in
the control group. Mean data representing the average changes in AV delay during
electrical stimulation in the control group at 10Hz (A), 20Hz (B), 30Hz (C), 40Hz (D)
and 50Hz (E). Data represents mean ± SEM. BL = baseline, ES = electrical stimulation.
N = 54 (7 animals). Two-way ANOVA was used to compare baseline with values during
electrical stimulation. * p < 0.05, ** p < 0.01, *** p < 0.001.
153
5.5 The effects of heart failure on dromotropic responses to electrical stimulation of
intrinsic cardiac ganglia
The effects of heart failure on cardiac dromotropy during electrical stimulation were
investigated. Atrioventricular delay was determined at a further 39 sites: 15 within the
sham operated group (3.8 ± 0.1kg) and 24 within the heart failure group (3.9 ± 0.3 kg).
Stimulation of intrinsic cardiac ganglia within hearts from the heart failure group
appeared to produce a markedly different effect on cardiac dromotropy and
atrioventricular delay (figure 5.12) when compared with the control and sham operated
groups (figure 5.13)
Slight AV delay prolongation was evident during stimulation of loci within the PVCV
region (figure 5.12) in the heart failure group. This prolongation however, was not
significant. Electrical stimulation of loci in the RA, RNC and LNC regions also resulted in
no significant AV delay prolongation at all frequencies tested (figure 5.12). Further
evidence of the reduced capacity of the ICNS to alter cardiac dromotropy included the
complete lack of incidences of AV block during stimulation of ganglia within the heart
failure group compared with AV block seen during stimulation of 12% and 18% of sites
within the control and sham operated groups respectively.
On comparing the average percentage change in AV delay (from baseline) within the 3
groups (control, HF and sham), the level of prolongation was significantly reduced in
both the RA and RNC regions in the heart failure group (at 10, 20 and 30Hz) (figure 5.14).
However, the average change in AV delay prolongation appeared to be increased when
loci within the PVCV region of hearts from the HF group were stimulated (figure 5.14) at
all frequencies (10 - 50Hz) when compared to the control and sham operated groups.
No significant difference in atrioventricular delay was evident between the control and
sham operated groups, with this data being reinforced when the average percentage
change in AV delay within all regions was compared (figure 5.14). Atrioventricular block
occurred during stimulation of 3/15 sites within the sham operated group, all within the
RNC similar to the data shown from the control group.
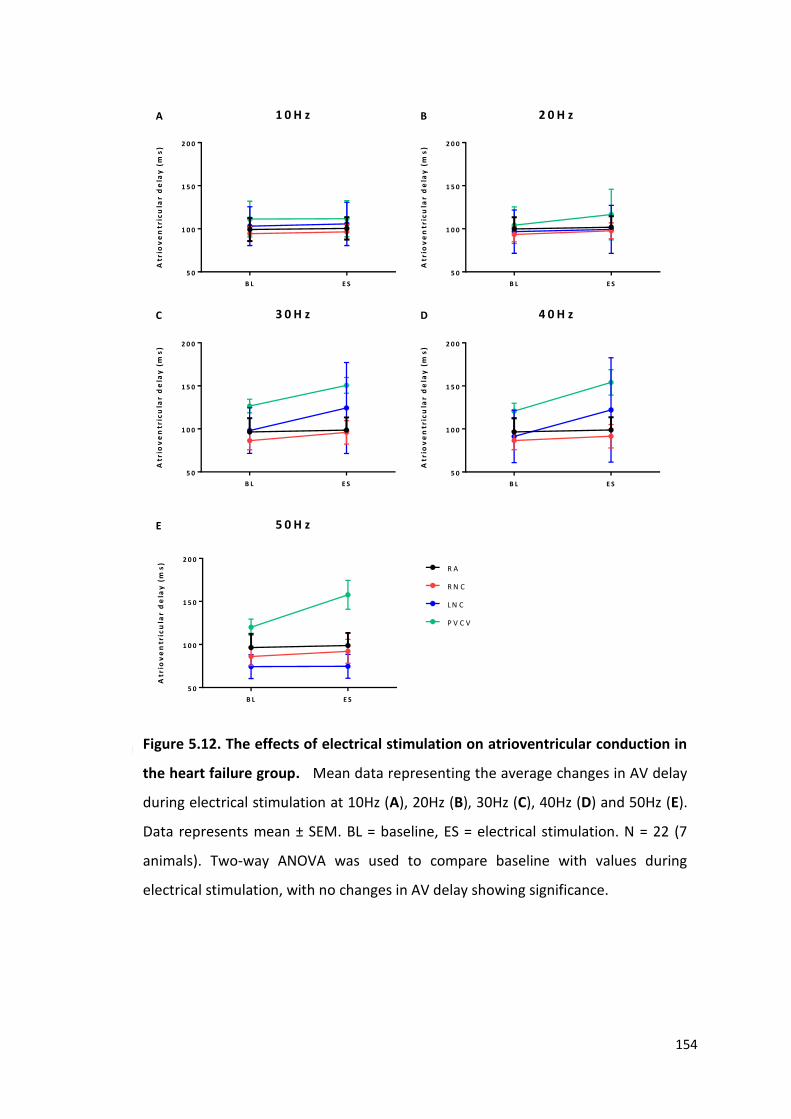
154
B L E S
5 0
1 0 0
1 5 0
2 0 0
Atr
iov
en
tric
ula
r d
ela
y (
ms
)
B L E S
5 0
1 0 0
1 5 0
2 0 0
Atr
iov
en
tric
ula
r d
ela
y (
ms
)
B L E S
5 0
1 0 0
1 5 0
2 0 0
Atr
iov
en
tric
ula
r d
ela
y (
ms
)
B L E S
5 0
1 0 0
1 5 0
2 0 0
Atr
iov
en
tric
ula
r d
ela
y (
ms
)
B L E S
5 0
1 0 0
1 5 0
2 0 0
Atr
iov
en
tric
ula
r d
ela
y (
ms
)
R A
R N C
L N C
P V C V
A B
C D
E
1 0 H z 2 0 H z
3 0 H z 4 0 H z
5 0 H z
Figure 2. Heart failure
Figure 5.12. The effects of electrical stimulation on atrioventricular conduction in
the heart failure group. Mean data representing the average changes in AV delay
during electrical stimulation at 10Hz (A), 20Hz (B), 30Hz (C), 40Hz (D) and 50Hz (E).
Data represents mean ± SEM. BL = baseline, ES = electrical stimulation. N = 22 (7
animals). Two-way ANOVA was used to compare baseline with values during
electrical stimulation, with no changes in AV delay showing significance.

155
B L E S
5 0
1 0 0
1 5 0
2 0 0
Atr
iov
en
tric
ula
r d
ela
y (
ms
)
B L E S
5 0
1 0 0
1 5 0
2 0 0
Atr
iov
en
tric
ula
r d
ela
y (
ms
)
*
*
B L E S
5 0
1 0 0
1 5 0
2 0 0
Atr
iov
en
tric
ula
r d
ela
y (
ms
)
*****
B L E S
5 0
1 0 0
1 5 0
2 0 0
Atr
iov
en
tric
ula
r d
ela
y (
ms
)
***
B L E S
5 0
1 0 0
1 5 0
2 0 0
Atr
iov
en
tric
ula
r d
ela
y (
ms
)
R A
R N C
L N C
P V C V
*****
A B
C D
E
1 0 H z 2 0 H z
3 0 H z 4 0 H z
5 0 H z
Figure 5.13. The effects of electrical stimulation on atrioventricular conduction in
the sham operated group. Mean data representing the average changes in AV delay
during electrical stimulation at 10Hz (A), 20Hz (B), 30Hz (C), 40Hz (D) and 50Hz (E).
Data represents mean ± SEM. BL = baseline, ES = electrical stimulation. N = 14 (4
animals). Two - way ANOVA was used to compare baseline with values during
electrical stimulation. * p < 0.05, ** p < 0.01, *** p < 0.001, **** p < 0.0001.
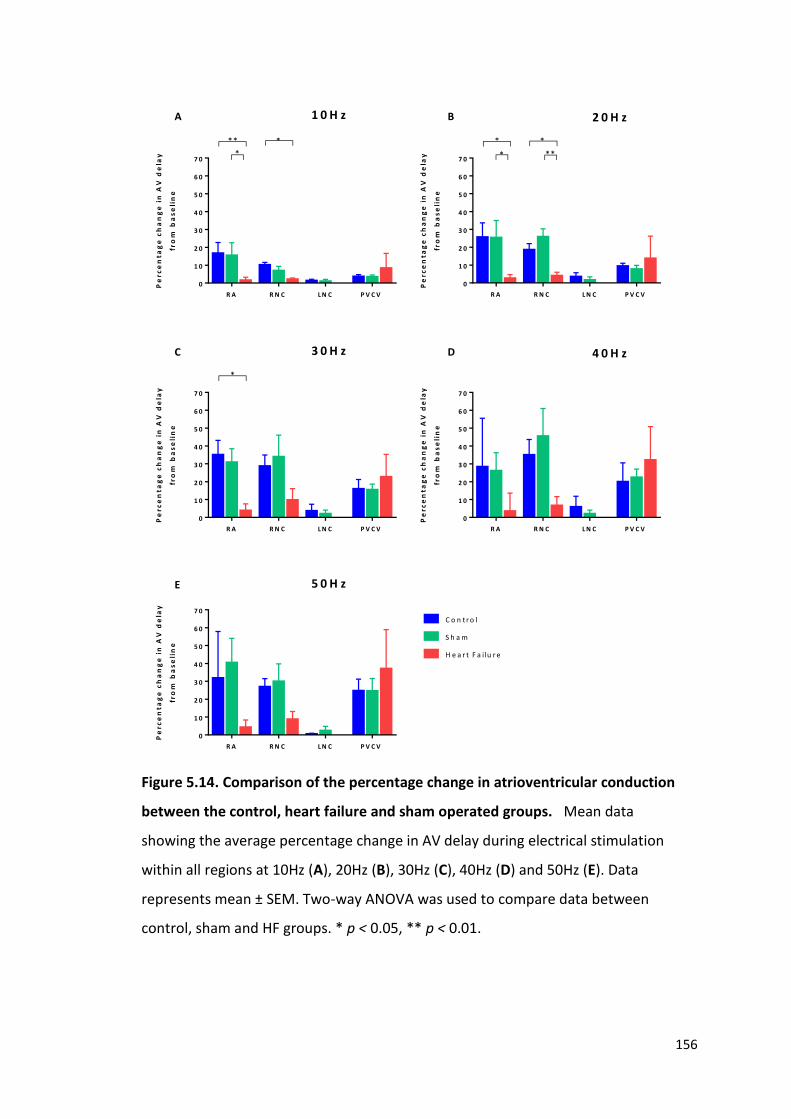
156
*
R A R N C L N C P V C V
0
1 0
2 0
3 0
4 0
5 0
6 0
7 0P
erc
en
tag
e c
ha
ng
e i
n A
V d
ela
y
fro
m b
as
eli
ne
** *
R A R N C L N C P V C V
0
1 0
2 0
3 0
4 0
5 0
6 0
7 0
Pe
rce
nta
ge
ch
an
ge
in
AV
de
lay
fro
m b
as
eli
ne
*
*
*
**
R A R N C L N C P V C V
0
1 0
2 0
3 0
4 0
5 0
6 0
7 0
Pe
rce
nta
ge
ch
an
ge
in
AV
de
lay
fro
m b
as
eli
ne
*
R A R N C L N C P V C V
0
1 0
2 0
3 0
4 0
5 0
6 0
7 0
Pe
rce
nta
ge
ch
an
ge
in
AV
de
lay
fro
m b
as
eli
ne
R A R N C L N C P V C V
0
1 0
2 0
3 0
4 0
5 0
6 0
7 0
Pe
rce
nta
ge
ch
an
ge
in
AV
de
lay
fro
m b
as
eli
ne
C o n t r o l
S h a m
H e a r t F a i lu r e
A B
C D
E
1 0 H z 2 0 H z
3 0 H z 4 0 H z
5 0 H z
Figure 5.14. Comparison of the percentage change in atrioventricular conduction
between the control, heart failure and sham operated groups. Mean data
showing the average percentage change in AV delay during electrical stimulation
within all regions at 10Hz (A), 20Hz (B), 30Hz (C), 40Hz (D) and 50Hz (E). Data
represents mean ± SEM. Two-way ANOVA was used to compare data between
control, sham and HF groups. * p < 0.05, ** p < 0.01.

157
5.6 The effects of pharmacological agents on cardiac responses of electrical
stimulation of intrinsic cardiac ganglia
To determine the types of autonomic receptors involved in the development of both the
chronotropic and dromotropic responses to electrical stimulation of intrinsic cardiac
ganglia, protocols were repeated in the presence of the autonomic ganglionic blocker
hexamethonium and atropine (a muscarinic (M2) receptor antagonist) or metoprolol (a
β-adrenergic receptor blocker) in all three groups (conventional, sham operated and
heart failure).
The effects of pharmacological blockers were investigated at a total of 98 sites (33 in the
control group, 21 in the sham operated group and 44 in the heart failure group).
Previous data within this chapter showed that significant chronotropic changes occurred
at 20Hz or more, therefore all stimulation of intrinsic cardiac ganglia during the
investigation of pharmacological blockers was done at 20Hz. All heart rate responses
(both bradycardic and tachycardic responses) to electrical stimulation were abolished
by hexamethonium (figure 5.15).
Atropine abolished all reductions in heart rate (figure 5.15) during electrical stimulation
of ganglia. In the presence of atropine, no significant difference was noted in the
induction of tachycardic responses evoked by electrical stimulation within the RA and
RNC when heart rate responses were compared to control. Increases in heart rate
evident during electrical stimulation of ganglia within the RA and RNC regions were
eliminated in the presence of the metoprolol (figure 5.15 A and B).

158
*
BL
MIN
MA
X
BL
MIN
MA
X
BL
MIN
MA
X
BL
MIN
MA
X
8 0
1 0 0
1 2 0
1 4 0
1 6 0
1 8 0
2 0 0
2 2 0
He
art
ra
te (
bp
m)
Co
ntr
ol
He
xa
me
tho
niu
m
Atr
op
ine
Me
top
rolo
l
*
*
*
BL
MIN
MA
X
BL
MIN
MA
X
BL
MIN
MA
XB
L
MIN
MA
X
8 0
1 0 0
1 2 0
1 4 0
1 6 0
1 8 0
2 0 0
2 2 0
He
art
ra
te (
bp
m)
* * * *
* * * * * * *
* * * *
* *
Co
ntr
ol
He
xa
me
tho
niu
m
Atr
op
ine
Me
top
rolo
l
BL
MIN
MA
X
BL
MIN
MA
X
BL
MIN
MA
X
BL
MIN
MA
X
8 0
1 0 0
1 2 0
1 4 0
1 6 0
1 8 0
2 0 0
2 2 0
He
art
ra
te (
bp
m)
Co
ntr
ol
He
xa
me
tho
niu
m
Atr
op
ine
Me
top
rolo
l
BL
MIN
MA
X
BL
MIN
MA
X
BL
MIN
MA
X
BL
MIN
MA
X
8 0
1 0 0
1 2 0
1 4 0
1 6 0
1 8 0
2 0 0
2 2 0
He
art
ra
te (
bp
m)
S h am
H e a rt F a ilu re
C o n tro l
Co
ntr
ol
He
xa
me
tho
niu
m
Atr
op
ine
Me
top
rolo
l
A B
C D
R A R N C
L N C P V C V
Figure 5.15. The effects of pharmacological blockers on heart rate responses to
electrical stimulation. Mean data comparing heart rate changes in control conditions
as well as in the presence of hexamethonium, atropine and metoprolol in all 4 regions
examined; A) RA, B) RNC, C) LNC, D) PVCV. BL = baseline. Comparisons between
control (n=33), sham (n=21) and HF groups (n=44) were made using two-way ANOVA.
* p < 0.05, *** p < 0.001 and **** p < 0.0001.
159
5.7 Discussion
Despite the increasing appreciation amongst scientists that the intrinsic cardiac nervous
system plays a crucial role in the control of cardiac function and electrophysiology, data
investigating this role is limited. The aim of this chapter was therefore to investigate the
functional role of intrinsic cardiac ganglia in a rabbit model, using electrical stimulation.
5.7.1. The effects of electrical stimulation of intrinsic cardiac ganglia on cardiac
function
To date, this is the first study to investigate the functional role of the ganglia within the
ICNS in the rabbit. Electrical stimulation resulted in spatially diverse changes in both
cardiac chronotropy and dromotropy. Utilising the anatomical data shown in chapter 4,
allowed for a directed approach of electrical stimulation at regions known to commonly
contain intrinsic cardiac ganglia. Stimulation of these regions primarily resulted in
bradycardic changes in heart rate, yet despite this, incidences of tachycardia were
recorded. In addition to pure bradycardic and tachycardic responses, stimulation of loci
also resulted in biphasic responses which were characterised as a bradycardia followed
by a tachycardia during the period of stimulation. The incidence of biphasic effects is
unsurprising since stimuli were applied to ganglia in which networks of connected
neurons are present and have been demonstrated using histological study (see chapter
4). In the particular environment being investigated, the spread of electrical current
from a bipolar electrode would be difficult to restrict. It is therefore not entirely possible
to accurately determine whether these biphasic responses were due to the stimulation
of multiple ganglia or a result of the stimulation of isolated ganglia containing numerous
neuronal phenotypes.
Bradycardic responses occurred almost instantaneously following the initiation of
electrical stimulation. In comparison, tachycardia responses demonstrated a longer lag
time following the commencement of stimulation before the development of the heart
rate change. These findings correlate with data shown by Ng et al. (2001) who attributed
this gradual increase in heart rate during sympathetic stimulation to the slow release of
noradrenaline from nerve terminals. Conversely, the almost instantaneous
parasympathetic response comes as a result of rapid muscarinic receptor activation by

160
acetylcholine (Levy and Martin, 1996). One interesting observation was the slower
initiation and development of the bradycardic change during biphasic heart rate
responses. One explanation for the delay in this parasympathetic response, could be the
concurrent activation of sympathetic neurons although further investigation would be
required to determine the molecular reasons for such a phenomenon.
Reductions in heart rate as a response to electrical stimulation of intrinsic cardiac ganglia
altered in a frequency dependent manner with increasing frequency of stimulation
resulting in a greater bradycardia. This was also the case for episodes of tachycardia;
with an increase in the frequency of stimulation leading to a more pronounced
tachycardia. In contrast, when a biphasic response was noted, an increase in the
frequency of stimulation resulted in a greater decrease in heart rate during the
bradycardic phase, accompanied by a reduction in the tachycardia response.
One plausible reason for such frequency dependent behaviour during a biphasic
response to electrical stimulation is the known combination of both cholinergic and
adrenergic neurons within ganglia of the ICNS. As shown previously, the neurochemical
composition of intrinsic cardiac ganglia demonstrates the presence of both
parasympathetic neurons (immunoreactive for the cholinergic marker ChAT) as well as
neurons immunoreactive for the adrenergic marker tyrosine hydroxylase. The functional
capacity of these TH positive neurons is under constant debate, however it is becoming
increasingly likely that these neurons do indeed function in a sympathetic manner and
therefore are involved in increases in sinus rate.
In healthy control animals, the most significant changes in heart rate came as a result of
electrical stimulation of ganglia within the RNC, followed closely by stimulation of
ganglia within the RA. Conversely, stimulation of sites within the regions of the PVCV
and LNC appeared to produce very little change in heart rate when stimulated. This
apparent lack of response during stimulation of these regions does not necessarily mean
that the animals where a response was not recorded were unable to elicit such a
response, more that the neuronal population may not have been electrically stimulated.
Anatomical studies show that intrinsic cardiac ganglia are often located on the heart
hilum and around the pulmonary veins. There is however notable variation in the overall
distribution of neurons and ganglia between individual hearts, making electrical

161
stimulation of precise ganglia difficult to achieve. Butler et al. (1990) previously
demonstrated the absence of detectable cardiac changes during electrical stimulation
at regions shown to contain intrinsic cardiac ganglia. This could therefore imply the need
for differential stimulation of specific ganglia dependent upon the role and function they
play in cardiac control and show that even though no change in heart rate was observed,
the ganglia being stimulated may still play a significant role in the control of differing
cardiac indices.
The findings reported herein demonstrate a predominant control of heart rate from
ganglia within the RNC and the RA regions. Past hypotheses proposed a selective role of
individual ganglia in specific cardiac indices, with the right atrial GP being solely linked
to regulation of SA nodal function (Lazzara et al., 1973). More recently however, it has
been demonstrated in canines that GPs act to integrate autonomic innervation, with
multiple GPs communicating as part of a neuronal network to fine tune cardiac
responses (Hou et al., 2007a). Despite ganglia within such studies demonstrating
predominant roles in either chronotropic or dromotropic regulation, it is becoming
increasingly obvious that all ganglia within the ICNS act in a cardiac regulatory capacity.
The similarity of the present data would appear to strengthen previous conclusions
made in anaesthetised dogs (Cardinal et al., 2009, Zarzoso et al., 2013). Electrical current
activates not only nearby neuronal somata and dendrites but also afferent and efferent
axons traversing the ganglia. This data was therefore compared to previous unpublished
data from our group where the action of nicotine, a postsynaptic receptor stimulant,
was tested. Both nicotine and electrical stimulation applied at discrete sites of the ICNS
in the rabbit evoked similar kinds of cardiac effects such as increases in heart rate alone,
decreases in heart rate alone or a biphasic response as well as decreases in
atrioventricular conduction. It therefore appears likely that the effects of electrical
stimulation on cardiac activity were caused by the activation of ICNS neurons rather than
extrinsic nerve terminals. This predominance of certain ganglia in the control of specific
cardiac indices is consistent with evidence for the presence of topographically distinct
groups of chronotropic and dromotropic parasympathetic preganglionic neurons in the
nucleus ambiguus (Gatti et al., 1996).

162
This study demonstrates the involvement of ganglia within the majority of regions
(minus those within the LNC) in the control of atrioventricular conduction. Significant
prolongation in atrioventricular delay during constant atrial pacing occurred during
electrical stimulation of ganglia within the RA, RNC and PVCV regions. In contrast, no
signification changes in AV conduction were identified during stimulation of the LNC.
Two to one atrioventricular block occurred only during stimulation of loci within the
RNC.
The innervation of the atrioventricular node is thought to be primarily via the inferior
right GP (Hou et al., 2007a) also documented as the inferior vena cava- inferior atrial GP
(Yuan et al., 1994). Ablation of this GP, located at the origin of the inferior vena cava
(IVC) and documented mainly in canines (Yuan et al., 1994, Hou et al., 2007a) has been
shown to significantly reduce the effect of vagal nerve stimulation on cardiac ventricular
rate. However, it is important to understand that this GP alone (or corresponding GPs
located around the root of the IVC in other species) is not solely responsible in the
selective innervation of the AV node. This GP rather, acts more as an integration centre
for extrinsic cardiac neural inputs and an intricate intrinsic neural pathway involving
numerous other ganglia such as those at the anterior right atrial and superior left atrial
regions (Hou et al., 2007a).
In comparison to the effects of stimulation of IC ganglia on cardiac chronotropy, one
noteworthy difference was the influence of ganglia within the PVCV region on
atrioventricular conduction with significant AV prolongation within this region
(commonly around the origin of the inferior vena cava) being evident in the rabbit. This
suggests, along with the lack of change in heart rate during stimulation of this region,
that these ganglia play a dominant role in AV nodal innervation and not SA nodal control.
Despite this, changes in heart rate were evident at the PVCV region, albeit relatively
smaller than those seen in other regions. This correlates with the data described
previously (Hou et al., 2007a) and indicates that neuronal innervation occurs via
communication between numerous ganglia to alter cardiac function.
Previous investigation into the functional effects of intrinsic cardiac ganglia has shown
the ganglia to be capable of influencing both sinus rate and atrioventricular conduction
(Moss et al., 2013, Cardinal et al., 2009, Hou et al., 2007a), correlating with data shown

163
within this study. Based on this study, electrical stimulation applied to the ganglia within
the RNC appears to show a predominant influence on both heart rate and
atrioventricular conduction when compared to other regions investigated. This is partly
supported by anatomical data from studies completed in the rabbit identifying nerves
extending from the RNC and innervating the region of the SAN (Saburkina et al., 2014,
Inokaitis et al., 2016, Zarzoso et al., 2013). During investigation of the innervation of
sinoatrial nodal cells in the rabbit, Inokaitis et al. (2016) concluded that the innervation
of the SA node is extremely complex, even in comparison to that of the atrioventricular
node. The potential influence of ganglia within the RA, RNC and PVCV regions shown
within this study however, suggests that the innervation of the AV node is equally as
complex.
The synaptic interaction and junctional receptor transmission involved in cardiac
responses to electrical stimulation were tested. The effects of electrical stimulation
were dependent on cholinergic nicotinic ganglion transmission. The abolition of
responses to electrical stimulation with atropine and metoprolol further indicates the
involvement of both cholinergic muscarinic receptors and postganglionic beta
adrenoreceptor sites in the mediation of bradycardic and tachycardic effects
respectively. The data from this study further confirms the notion that ganglia located
at a distance to structures such as the SA and AV nodes have a significant effect on
cardiac electrophysiology and highlight the importance of intrinsic cardiac ganglia in the
functional control of cardiac indices. Studies investigating the modification of neuronal
activity within the ICNS with either electrical stimulation or pharmacological
intervention (Thompson et al., 2000, Butler et al., 1990, Cardinal et al., 2009, Armour et
al., 1993) further demonstrate the complexity of the neuronal hierarchy involved in co-
ordinating responses. However, this study has not taken into account the involvement
of central and peripheral neuronal inputs, which add further complexity and in turn,
further questions as to the complete mechanisms involved in neuronal cardiac control.
5.7.2. The effects of heart failure on the functional role of the ICNS
There is limited information currently available regarding the functional capacity of the
ICNS following myocardial infarction. Significant neuronal morphological and
phenotypic remodelling occurs as a result of the injury caused by MI therefore one of
164
the aims of this study was to determine the effect of this remodelling on the interaction
and function of ganglia during electrical stimulation.
As indicated in chapter 4, sham operated animals were used similarly to controls and to
ensure that the differences, if any, in the functional capabilities within the ICNS were as
a result of coronary artery ligation and the subsequent myocardial infarction and not a
consequence of the stresses of the initial surgery. No differences were observed
between the sham-operated group and the control group therefore suggesting
differences observed within the heart failure group could be attributable to heart failure
and damage due to myocardial infarct. Heart failure results in an increase in beat to beat
heart rate variation, which is under the tonic influence of the vagal control of the SA
node. It is likely that heart rate variability due to alterations in autonomic modulation of
the heart could therefore explain the variability in baseline heart rate shown in figure
5.12 when compared to control.
Little change in heart rate was evident during electrical stimulation of ganglia within the
regions of the LNC and PVCV, similar to that in control animals. As described previously,
this is likely to be due to a non-dominant role of ganglia within this regions in the control
of cardiac chronotropy. The average bradycardic response to stimulation of ganglia
within the RNC however, was greater at all frequencies investigated. This was
accompanied by a significant increase in tachycardia responses during stimulation of
ganglia within both the RA and the RNC.
The reduced blood supply to regions of the ventricular myocardium has a direct effect
on the neuronal innervation in that area. Ganglia within the ICNS transduce this
information, with neuronal remodelling occurring to counteract the damage and
potentially to alter cardiac function in order to maintain cardiac output. As mentioned
previously, heart failure results in an increase in sympathetic drive and a
parasympathetic withdrawal. As well as an increase in the bradycardic response to
ganglia stimulation, the overall percentage of sites where tachycardia was noted
increased in comparison to that seen in control and sham operated animals. This
increase is likely to be associated with the central increase in sympathetic tone. The data
shown within this study suggests that the intrinsic cardiac nervous system plays two
different roles in the control of cardiac function in heart failure: 1) increasing

165
sympathetic activity to counteract the failing of the heart and the overall deleterious
effects on cardiac output and 2) trying to compensate for these central autonomic
changes by increasing the level of parasympathetic activity. This hypothesis correlates
with data shown by Rajendran et al. (2016) who demonstrated an MI-induced decrease
in the cholinergic phenotype of neurons within the ventral interventricular GP (VIV-GP),
a ganglionic region known to innervate the ventricles and therefore linked to the
infarcted ventricular region. This decrease in cholinergic phenotype along with excessive
and chronic activation of intrinsic cardiac neurons involved in the transduction of
afferent signals from damaged myocardium (Huang et al., 1993, Arora et al., 2003)
contributes further to the dysregulation of cardiac control and further suggests a role of
the ICNS in the contribution to the increase in sympathetic drive.
Alongside the differences observed in the control of heart rate of from the ICNS
following MI, significant differences in atrioventricular conduction were noted
compared to healthy control animals. Out of all loci stimulated, the only ganglia to
induce a change in AV delay were located within the PVCV region. This alteration in the
control of atrioventricular conduction coincides with the morphological remodelling
seen as a result of MI and although speculative, could suggest a protective adaptation
with the neuronal connections linking ganglia around the PVCV, the region primarily
involved in AV-delay prolongation, with ganglia located elsewhere within the ICNS being
altered.
Subpopulations of neurons within the ICNS termed local circuit neurons receive both
afferent and efferent inputs. These neurons integrate and process information even in
the heart failure state (Rajendran et al., 2016) indicating the capacity of the ICNS to
continue processing information during MI. Significant changes in the level of afferent
neuronal inputs not only targets ganglia innervating the regions of infarcted tissue but
multiple populations of intrinsic cardiac neurons (Arora and Armour, 2003) therefore
stimulating remodelling throughout a large proportion of the ICNS.
There is an increase in the percentage of neurons that receive efferent sympathetic and
parasympathetic inputs following MI (Rajendran et al., 2016). It has been described that
the main priority of the central autonomic nervous system following MI is the processing
of central demands for blood flow and cardiac output. The increase in efferent

166
communication alongside the intricate neuronal remodelling that occurs within the ICNS
provides a platform for the ICNS to provide a level of protection against the central
neuronal alterations and the increasing susceptibility to the development of cardiac
arrhythmias.
Ganglia within the ICNS play a role in the initiation and maintenance of arrhythmias such
as atrial fibrillation (Zhou et al., 2007) with selective ablation of ganglia being shown to
reduce any predisposition to such arrhythmias. The effects of GP stimulation of
ventricular electrophysiology however, have not been studied here and remains
unknown amongst scientists. He et al. (2013) showed that GP stimulation can prolong
ventricular ERP and significantly decrease the slope of the ventricular APD restitution
curve, suggesting that stimulation of intrinsic cardiac ganglia may provide a level of
protection against ventricular arrhythmia, however further study is need to determine
the true extent of this protection in the rabbit and during heart failure.
Despite the data from this study clearly showing the individual capabilities and overlap
of specific regions of ganglia on spatially divergent regions, it is important to
acknowledge the need for further investigation to fully determine the precise
connections between ganglia and singular sites.
167
Chapter 6: The interaction between peripheral neuronal inputs and the ICNS
6.1 Introduction
Autonomic cardiac innervation involves a complex interaction between both the
extrinsic cardiac neuronal inputs and the intrinsic cardiac nervous system. Relatively few
studies have delved into the precise interactions between these extrinsic inputs
including the vagus nerves and central sympathetic inputs and the network of
ganglionated plexi that reside at the level of the heart itself.
It is well known that parasympathetic vagal stimulation exerts a negative chronotropic
and dromotropic effect on the heart. Preganglionic vagal efferent fibres synapse with
postganglionic fibres at the level of the heart and, upon stimulation, rapid muscarinic
receptor activation via the release of acetylcholine results in changes in cardiac
electrophysiology. Previous work by our group further characterised the effects of vagal
nerve stimulation in the dual innervated heart preparation (Ng et al., 2001, Brack et al.,
2004), noting that stimulation of the right vagus nerve produces a greater change in
heart rate when compared to the left vagus nerve. On the other hand, stimulation of
the left vagus nerve produces greater effects on AV conduction than the right. These
difference have been attributed to the selective distribution of vagal fibres to both the
AV and SA nodes.
GPs have been shown to be regions of neuronal integration with vagal neuronal
innervation travelling through multiple plexuses before accessing the sinoatrial and
atrioventricular nodes and modulating sinus rate and atrioventricular conduction (Hou
et al., 2007b). The GP located between the superior vena cava and the aorta has been
described as the primary region of interaction between the extrinsic and intrinsic cardiac
nervous systems and that ablation of this GP region results in the elimination of the
effects of vagus nerve stimulation. This suggests therefore, that vagus nerve stimulation
of the SA node requires an interaction with the GPs of the ICNS.
Previous investigation has demonstrated the involvement of both the peripheral
neuronal inputs such as the vagosympathetic trunk and the intrinsic cardiac ganglia in
the initiation and development of atrial fibrillation. Understanding these complex

168
interactions if therefore crucial in order to understand the development of cardiac
disease.
The majority of studies to date that have investigated the interactions between the
extrinsic and intrinsic cardiac nervous system have been conducted in larger mammals,
primarily canines (Lo et al., 2013, Hou et al., 2007b). The objective of this study was
therefore to conduct preliminary investigations into the interactions between part of
the extrinsic cardiac nervous system (the vagus nerves) and the ICNS in a rabbit model
by examining the effects of electrical stimulation on heart rate and atrioventricular
conduction.

169
6.2 Results
The functional interaction between the vagal nerves and the intrinsic cardiac ganglia was
investigated using the dual innervated perfused heart preparation. Experiments were
completed using adult male New Zealand white rabbits (n= 7, 2.3 ± 0.1kg). To determine
the interaction between the vagal nerves and intrinsic cardiac ganglia, ganglia were
stimulated at 50% of the cardiac pacing threshold either in the presence of background
vagus nerve stimulation (described throughout this chapter as VS_GP) or prior to the
addition of vagus nerve stimulation (GP_VS). Changes in heart rate and atrioventricular
delay were recorded for each site investigated.
6.2.1 Heart rate response characteristics of vagal nerve stimulation
Prior to examining the interaction between both the left and right vagus nerves and the
intrinsic cardiac ganglia, the effects of vagal nerve stimulation on heart rate were
investigated. To determine the stimulation parameters for vagal stimulation during GP
and vagal interaction protocols, the effect of changing stimulus strength at a fixed
frequency was examined followed by the effect of changing frequency at a fixed voltage
in a total of 7 preparations. Vagal nerve stimulation caused an instantaneous reduction
in heart rate which reached a steady-state plateau. This steady state was maintained
and the heart rate value used for determining the effects of stimulation on heart rate.
Following nerve stimulation, the heart was allowed to recover and heart rate allowed to
return to a stable baseline.
Vagal nerve stimulation at increasing voltages at a fixed frequency of 5Hz resulted in a
reduction in heart rate from a baseline value of 160 ± 8.6bpm to 99 ± 10.8bpm (RVS)
and 98 ± 6.3bpm (LVS) at 20V. Significant heart rate changes during VNS when compared
to baseline occurred at 3 – 20V. The voltage-dependent reduction in heart rate
plateaued on average at around 5V during stimulation of the RVS and 10V with LVS
stimulation (figure 6.1A). Frequency dependent responses were examined at the voltage
that produced a heart rate equivalent to 80% of the maximal response of stimulation of
the right and left vagi (6 ± 1V and 7 ± 1V respectively).
There were progressively greater reductions in heart rate with increasing frequencies
up to 10Hz (figure 6.1B). Previous studies have demonstrated stimulation at frequencies

170
higher than 10Hz can trigger sinus arrest (Ng et al., 2001) hence the maximum frequency
investigated was 10Hz. Heart rate reductions were greater with RVS compared to LVS
however this difference was not significant. The average frequencies of stimulation that
produced heart rates between 70 and 100bpm were 8 ± 1Hz (RVS) and 8 ± 1Hz (LVS).

171
0 5 1 0 1 5 2 0
6 0
8 0
1 0 0
1 2 0
1 4 0
1 6 0
1 8 0
V o lt a g e ( V )
He
art
ra
te (
bp
m)
4 5 6 7 8 9 1 0
6 0
8 0
1 0 0
1 2 0
1 4 0
1 6 0
1 8 0
F r e q u e n c y ( H z )
He
art
ra
te (
bp
m)
R V S
L V S
B L
A
B
Figure 6.1: Voltage and frequency dependent changes in heart rate during vagus
nerve stimulation. A. Graph showing mean heart rate data with left and right vagal
nerve stimulation relative to baseline at various voltages at a constant frequency
(n=7). B. Graph showing mean heart rate data during left and right vagus nerve
stimulation compared to baseline at various stimulation frequencies at a constant
voltage (n=7).
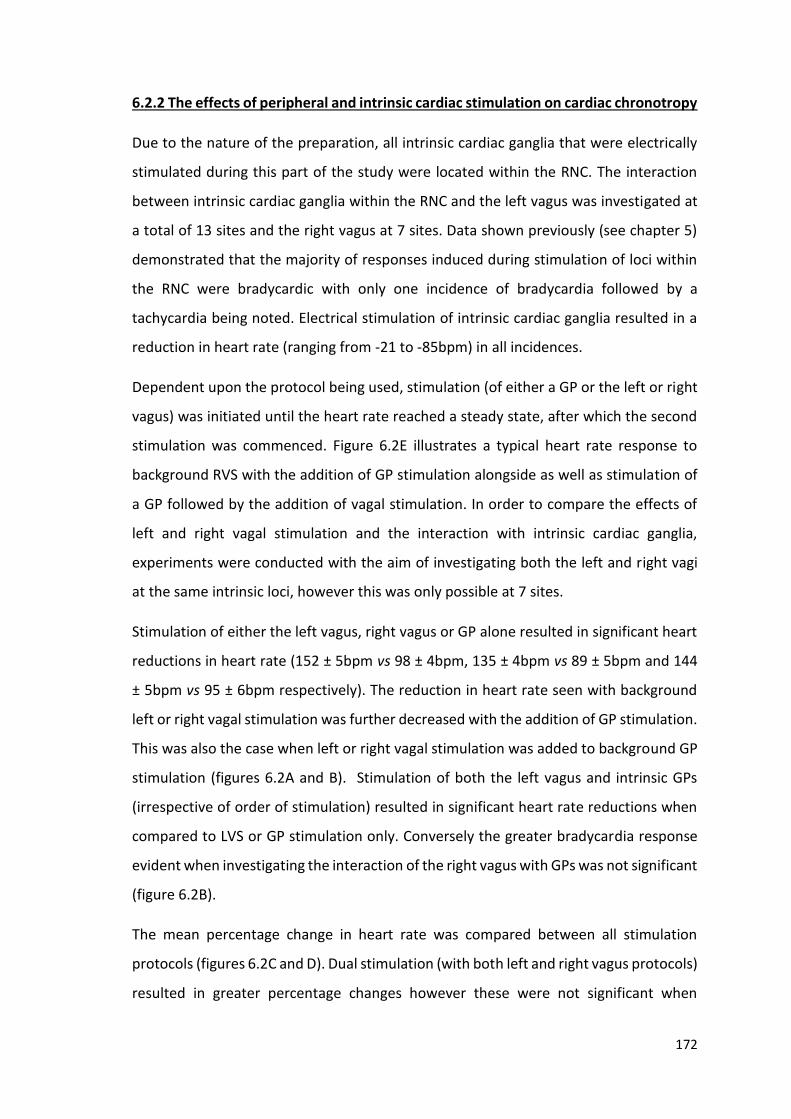
172
6.2.2 The effects of peripheral and intrinsic cardiac stimulation on cardiac chronotropy
Due to the nature of the preparation, all intrinsic cardiac ganglia that were electrically
stimulated during this part of the study were located within the RNC. The interaction
between intrinsic cardiac ganglia within the RNC and the left vagus was investigated at
a total of 13 sites and the right vagus at 7 sites. Data shown previously (see chapter 5)
demonstrated that the majority of responses induced during stimulation of loci within
the RNC were bradycardic with only one incidence of bradycardia followed by a
tachycardia being noted. Electrical stimulation of intrinsic cardiac ganglia resulted in a
reduction in heart rate (ranging from -21 to -85bpm) in all incidences.
Dependent upon the protocol being used, stimulation (of either a GP or the left or right
vagus) was initiated until the heart rate reached a steady state, after which the second
stimulation was commenced. Figure 6.2E illustrates a typical heart rate response to
background RVS with the addition of GP stimulation alongside as well as stimulation of
a GP followed by the addition of vagal stimulation. In order to compare the effects of
left and right vagal stimulation and the interaction with intrinsic cardiac ganglia,
experiments were conducted with the aim of investigating both the left and right vagi
at the same intrinsic loci, however this was only possible at 7 sites.
Stimulation of either the left vagus, right vagus or GP alone resulted in significant heart
reductions in heart rate (152 ± 5bpm vs 98 ± 4bpm, 135 ± 4bpm vs 89 ± 5bpm and 144
± 5bpm vs 95 ± 6bpm respectively). The reduction in heart rate seen with background
left or right vagal stimulation was further decreased with the addition of GP stimulation.
This was also the case when left or right vagal stimulation was added to background GP
stimulation (figures 6.2A and B). Stimulation of both the left vagus and intrinsic GPs
(irrespective of order of stimulation) resulted in significant heart rate reductions when
compared to LVS or GP stimulation only. Conversely the greater bradycardia response
evident when investigating the interaction of the right vagus with GPs was not significant
(figure 6.2B).
The mean percentage change in heart rate was compared between all stimulation
protocols (figures 6.2C and D). Dual stimulation (with both left and right vagus protocols)
resulted in greater percentage changes however these were not significant when

173
investigating the right vagus. Stimulation of the LVS alongside GP stimulation however,
produced significant increases in the average percentage change in HR. The effects of
left vagus interaction with GPs were compared with those of the right vagus with no
significant difference between all protocols being evident.

174
BL
LV
SB
LG
PB
LG
P
GP
_L
VS
BL
LV
S
LV
S_G
P
5 0
1 0 0
1 5 0
2 0 0
He
art
ra
te (
bp
m)
**** ****
****
**
****
**
BL
RV
SB
LG
PB
LG
P
GP
_R
VS
BL
LV
S
RV
S_G
P
5 0
1 0 0
1 5 0
2 0 0
He
art
ra
te (
bp
m)
**** ***
****
n s
****
n s
L V S G P G P _ L V S L V S _ G P
-6 0
-4 0
-2 0
0
Pe
rce
nta
ge
ch
an
ge
in
HR
fro
m b
as
eli
ne
* *
*
*
* *
R V S G P G P _ R V S R V S _ G P
-6 0
-4 0
-2 0
0
Pe
rce
nta
ge
ch
an
ge
in
HR
fro
m b
as
eli
ne
B C
D E
Figure 6.2. The effects of vagus nerve stimulation and electrical stimulation of intrinsic
cardiac ganglia on heart rate. A raw heart rate trace (A) illustrating the effect of RVS
(green block) either stimulated prior to the addition of RVS or added to background GP
stimulation (purple block). B represents the changes in heart rate during stimulation of
the left vagus, intrinsic cardiac ganglia, GP stimulation with added LVS (GP_LVS) and LVS
stimulation with added GP stimulation (LVS_GP). C represents the average HR during
stimulation of protocols involving the right vagus nerve. Statistical analysis performed to
determine any significant difference in HR when compared to BL and then whether
additional stimulation resulted in a further significant change. D and E represent that
average percentage change in HR with all stimulation protocols. All data is represented
as mean ± SEM. Statistical analysis performed with one- way ANOVA and unpaired two-
tailed t-test (* p < 0.05, **p < 0.01, ***p < 0.001 and ****p < 0.0001).
A
GP
th
en R
VS

175
6.2.3 The effects of peripheral and intrinsic cardiac stimulation on cardiac dromotropy
The effects of left vagus nerve and GP stimulation on atrioventricular conduction were
examined in 7 hearts at a total of 10 sites with the interaction with the right vagus being
examined at 6 sites. Atrioventricular conduction was measured during constant atrial
pacing at a cycle length of 300ms (heart rate of 200bpm).
Significant AV-delay prolongation occurred during stimulation of the left vagus nerve
(121 ± 7ms vs 152 ± 6ms) yet RVS did prolong AV delay but this prolongation was not
significant (133 ± 8ms vs 146 ± 6ms). Slight AV-delay prolongation was also noted during
stimulation of all intrinsic loci. The addition of GP stimulation to both left and right vagal
stimulation as well as the addition of left and right vagal stimulation to background GP
stimulation resulted in further AV-delay prolongation (figure 6.3) although this increase
in prolongation was relatively small.
The effects of dual stimulation were greater during stimulation of the LVS and ICG when
compared to those seen in with the RVS and ICG. In contrast to the similar heart rate
changes seen when all left and right vagal protocols were compared, there were
significant differences in the interaction between the left and right vagus nerves with
the ganglia within the RNC (LVS vs RVS (p < 0.01), GP_LVS vs GP_RVS (p < 0.01) and
LVS_GP vs RVS_GP (p < 0.01).
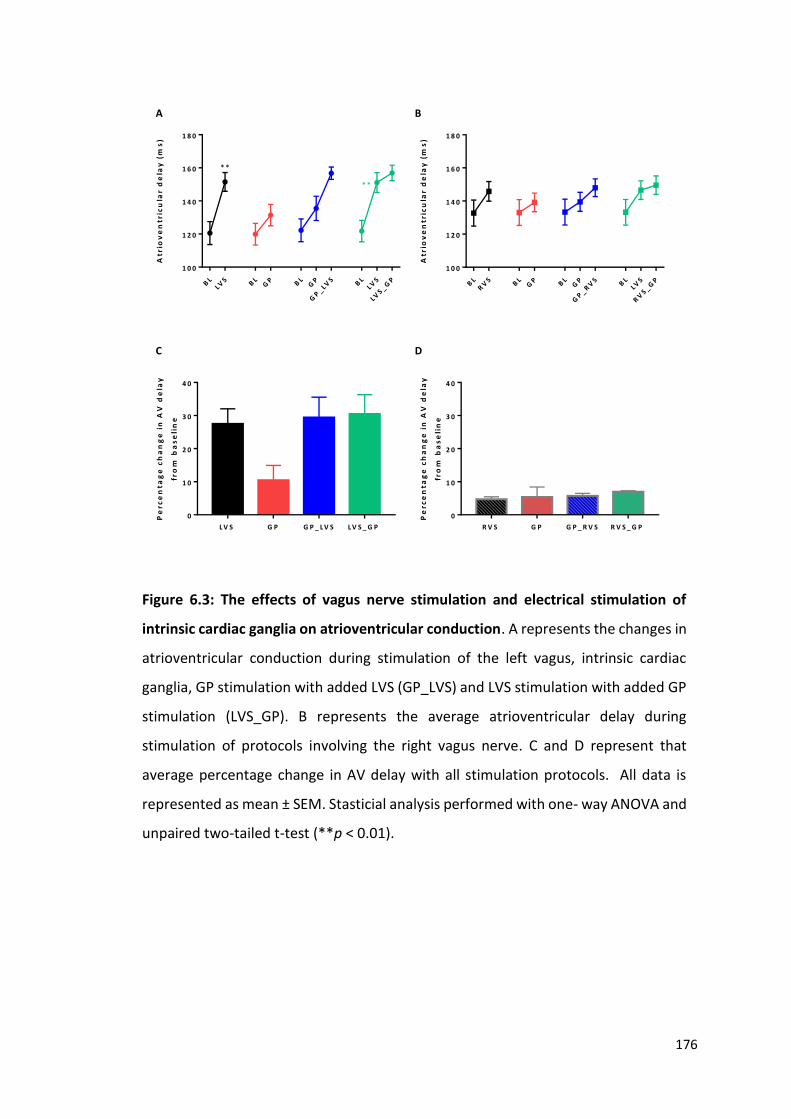
176
BL
LVS B
LG
P BL
GP
GP
_ LVS
BL
LVS
LVS _ G
P
1 0 0
1 2 0
1 4 0
1 6 0
1 8 0
Atr
iov
en
tric
ula
r d
ela
y (
ms
)* *
* *
BL
RV
SB
LG
P BL
GP
GP
_ RV
S BL
LVS
RV
S _ GP
1 0 0
1 2 0
1 4 0
1 6 0
1 8 0
Atr
iov
en
tric
ula
r d
ela
y (
ms
)
L V S G P G P _ L V S L V S _ G P
0
1 0
2 0
3 0
4 0
Pe
rce
nta
ge
ch
an
ge
in
AV
de
lay
fro
m b
as
eli
ne
R V S G P G P _ R V S R V S _ G P
0
1 0
2 0
3 0
4 0
Pe
rce
nta
ge
ch
an
ge
in
AV
de
lay
fro
m b
as
eli
ne
A B
C D
Figure 6.3: The effects of vagus nerve stimulation and electrical stimulation of
intrinsic cardiac ganglia on atrioventricular conduction. A represents the changes in
atrioventricular conduction during stimulation of the left vagus, intrinsic cardiac
ganglia, GP stimulation with added LVS (GP_LVS) and LVS stimulation with added GP
stimulation (LVS_GP). B represents the average atrioventricular delay during
stimulation of protocols involving the right vagus nerve. C and D represent that
average percentage change in AV delay with all stimulation protocols. All data is
represented as mean ± SEM. Stasticial analysis performed with one- way ANOVA and
unpaired two-tailed t-test (**p < 0.01).

177
6.2.4 Pharmacological blockade of vagal and ICNS responses to electrical stimulation
Figures 6.4 and 6.5 summarise the data obtained during pharmacological blockade using
hexamethonium (LVS; n = 9 and RVS; n = 5) and atropine (LVS; n = 7 and RVS; n = 5).
Hexamethonium abolished both GP and vagally mediated effects on heart rate (figure
6.4) and atrioventricular delay (figure 6.5) without affecting baseline values in
unstimulated conditions. Ganglionic inhibition with hexamethonium significantly
reduced the average percentage heart rate change during all stimulation parameters
(figures 6.4C and D) (using 2-way ANOVA and comparing the average percentage change
in HR between control vs hexamethonium). For example, the mean percentage change
in heart rate during LVS_GP stimulation decreased from -47.1 ± 2.1% to -0.3 ± 0.4% as
well as RVS_GP stimulation changing from -47.0 ± 2.6% to -0.1 ± 0.2%. This suggests that
intrinsic cardiac ganglia play a role in the integration between the extrinsic and intrinsic
cardiac nervous system and that the vagus nerves act through GPs.
Muscarinic receptor blockade with atropine also resulted in eradication of all changes in
heart rate irrespective of which vagus nerve or intrinsic cardiac ganglia was involved in
stimulation. This was also the case with all changes in atrioventricular delay being
abolished with atropine (figure 6.5). Significant reductions in the average percentage
change in atrioventricular delay occurred with all stimulation protocols excluding during
GP stimulation when investigating the interaction with the left vagus.
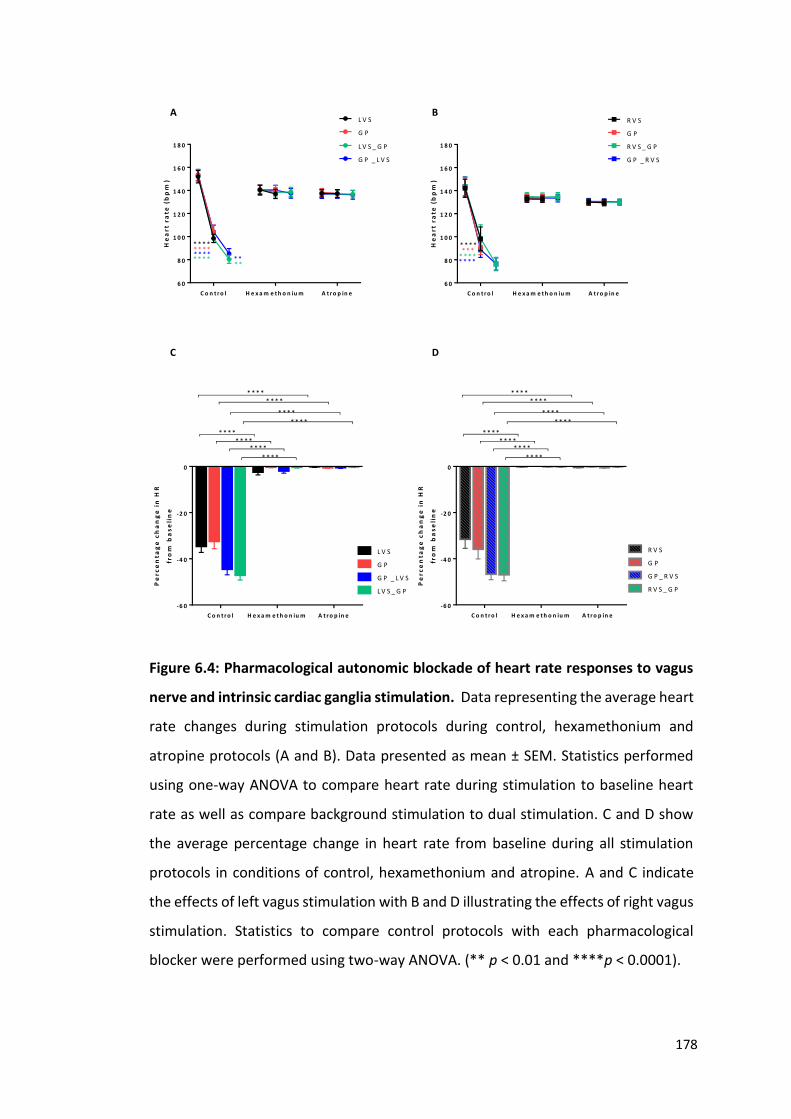
178
C o n t r o l H e x a m e t h o n iu m A t r o p in e
6 0
8 0
1 0 0
1 2 0
1 4 0
1 6 0
1 8 0
He
art
ra
te (
bp
m)
L V S
G P
L V S _ G P
G P _ L V S
* * * ** * * ** * * ** * * *
* ** *
C o n t r o l H e x a m e t h o n iu m A t r o p in e
6 0
8 0
1 0 0
1 2 0
1 4 0
1 6 0
1 8 0
He
art
ra
te (
bp
m)
R V S
G P
R V S _ G P
G P _ R V S
* * * *
* * * ** * *
* * * *
C o n t r o l H e x a m e t h o n iu m A t r o p in e
-6 0
-4 0
-2 0
0
Pe
rce
nta
ge
ch
an
ge
in
HR
fro
m b
as
eli
ne
L V S
G P
G P _ L V S
L V S _ G P
* * * *
* * * *
* * * *
* * * *
* * * *
* * * *
* * * *
* * * *
C o n t r o l H e x a m e t h o n iu m A t r o p in e
-6 0
-4 0
-2 0
0
Pe
rce
nta
ge
ch
an
ge
in
HR
fro
m b
as
eli
ne
R V S
G P
G P _ R V S
R V S _ G P
* * * *
* * * *
* * * *
* * * *
* * * *
* * * *
* * * *
* * * *
A B
C D
Figure 6.4: Pharmacological autonomic blockade of heart rate responses to vagus
nerve and intrinsic cardiac ganglia stimulation. Data representing the average heart
rate changes during stimulation protocols during control, hexamethonium and
atropine protocols (A and B). Data presented as mean ± SEM. Statistics performed
using one-way ANOVA to compare heart rate during stimulation to baseline heart
rate as well as compare background stimulation to dual stimulation. C and D show
the average percentage change in heart rate from baseline during all stimulation
protocols in conditions of control, hexamethonium and atropine. A and C indicate
the effects of left vagus stimulation with B and D illustrating the effects of right vagus
stimulation. Statistics to compare control protocols with each pharmacological
blocker were performed using two-way ANOVA. (** p < 0.01 and ****p < 0.0001).

179
C o n t r o l H e x a m e t h o n iu m A t r o p in e
1 0 0
1 2 0
1 4 0
1 6 0
1 8 0A
trio
ve
ntr
icu
lar
de
lay
(m
s)
L V S
G P
G P _ L V S
L V S _ G P
* ** *
C o n t r o l H e x a m e t h o n iu m A t r o p in e
1 0 0
1 2 0
1 4 0
1 6 0
1 8 0
Atr
iov
en
tric
ula
r d
ela
y (
ms
)
R V S
G P
G P _ R V S
R V S _ G P
C o n t r o l H e x a m e t h o n iu m A t r o p in e
0
1 0
2 0
3 0
4 0
Pe
rce
nta
ge
ch
an
ge
in
AV
de
lay
fro
m b
as
eli
ne
L V S
G P
G P _ L V S
L V S _ G P
* * * *
* * * *
* * * ** * * *
* * * ** * * *
C o n t r o l H e x a m e t h o n iu m A t r o p in e
0
1 0
2 0
3 0
4 0
Pe
rce
nta
ge
ch
an
ge
in
AV
de
lay
fro
m b
as
eli
ne
R V S
G P
G P _ R V S
R V S _ G P
* *
* *
* * *
* * * *
* * ** * * *
* *
* *
A B
C D
Figure 6.5: Pharmacological autonomic blockade of dromotropic responses to
vagus nerve and intrinsic cardiac ganglia stimulation. Data representing the average
change in atrioventricular delay during stimulation protocols in control,
hexamethonium and atropine (A and B). Data presented as mean ± SEM. Statistics
performed using one-way ANOVA to compare AV delay during stimulation to
baseline heart rate as well as compare background stimulation to dual stimulation. C
and D show the average percentage change in AV delay from baseline during all
stimulation protocols in conditions of control, hexamethonium and atropine. A and
C indicate the effects of left vagus stimulation with B and D illustrating the effects of
right vagus stimulation. Statistics to compare control protocols with each
pharmacological blocker were performed using two-way ANOVA. (** p < 0.01, ***p
< 0.001 and ****p < 0.0001).

180
6.3 Discussion
In this study, the interactions between peripheral autonomic nerves and the intrinsic
cardiac nervous system and the role they play in the modulation of heart rate and
atrioventricular conduction were investigated.
It has previously been shown that the use of the isolated perfused rabbit heart with
intact dual autonomic innervation allows the study of the effects of the extrinsic cardiac
nerves on cardiac electrophysiology (Ng et al., 2001). This preparation was therefore
used to characterise the effects of these neuronal inputs with those now known to
reside at the level of the heart within the ICNS itself.
Stimulation of the vagus nerves at varying voltages and frequencies was completed to
determine the level of stimulation required to produce comparatively similar changes in
heart rate between all experiments. Electrical stimulation of both the left and right vagus
nerves was shown to produce both a voltage and frequency dependent reduction in
heart rate. The abrupt changes in heart rate during stimulation come about as a result
of the rapid activation of muscarinic receptors by acetylcholine (Levy et al., 1993), which
is quickly broken down following the cessation of stimulation by acetylcholinesterase.
In this study, greater decreases in heart rate were observed during stimulation of the
right vagus nerve when compared to that of the left, during stimulation at higher
frequencies. This correlates with previous data shown by Ng et al. (2001) and has been
attributed to the predominance of the right vagus nerve at the sinoatrial node (Ardell
and Randall, 1986).
This study investigated the interaction of the vagus nerves with the ganglia within the
right neuronal cluster only. The right neuronal cluster is a collection of neurons and
ganglia known to be located at the cranial aspect of the interatrial groove, extending to
the root of the superior vena cava and right pulmonary vein (Saburkina et al., 2014).
Stimulation at all loci within the RNC in this instance resulted in a bradycardic change in
heart rate. It has previously been reported (chapter 5) that stimulation of the ganglia
within the RNC can result in a biphasic response, however, this was not evident during
this study. Despite this absence of sympathetic response, it is likely still that ganglia

181
within the ICNS of these animals are capable of producing such a response, however, in
this instance, the specific ganglia necessary to do so were not stimulated.
The data within this study demonstrates that the bradycardic response seen as a result
of electrical stimulation of intrinsic cardiac ganglia is greater in the presence of either
left or right vagal nerve stimulation, independent of the order of stimulation. This
suggests that postganglionic vagal nerve fibres potentially synapse with neurons within
the intrinsic cardiac ganglia, which act as a gating centres to determine the level of
output and therefore innervation of the sinoatrial node.
Stimulation of the left vagus in addition to GP stimulation resulted in greater reductions
in heart rate when compared to those seen during stimulation of the right vagus. Based
on the understanding that the right vagus is predominant in the control of heart rate via
the SA node, this result is contrary to what is currently known. The most likely
explanation for this difference in heart rate change between the left and right vagi
regards the involvement of specific ganglia within the ICNS. Experiments were
completed with the aim of investigating the stimulation of both vagus nerves with the
same intrinsic cardiac loci. Unfortunately due to experimental issues such as nerve
damage or the movement of the stimulating electrode prior to the completion of
stimulation protocols, this was not always possible. It could therefore be plausible that
the ganglia examined in collaboration with the right vagus nerve played a slightly
different role in cardiac control compared to those stimulated alongside the left vagus.
One noteworthy point to mention is the variation in the baseline heart rate when
comparing the effects of stimulation of either the left vagus, right vagus or GP alone.
Unfortunately a direct comparison between all methods of stimulation within the same
preparations could not be made due to technical difficulties in electrode placement and
nerve damage. This could also explain why although similar heart rate effects were seen
when the left and right vagus nerves alongside GP stimulation were compared (figure
6.2), the data when examining the right vagus stimulation was not statistically
significant.
Stimulation of all loci examined resulted in prolongation of atrioventricular delay. As
shown with heart rate, this effect was further increased with the addition of vagus nerve
stimulation. Stimulation of the left vagus resulted in a significantly larger delay in

182
atrioventricular conduction when compared to the right vagus, correlating with previous
data demonstrating the left vagus plays a predominant role in the innervation of the
atrioventricular node (Ng et al., 2001).
Classically it was thought that efferent vagal innervation was concentrated at both the
sinoatrial and atrioventricular nodes (Herring and Paterson, 2009) and that the ICNS
acted purely as a parasympathetic relay station. This has been shown to not be the case
however, with the ICNS now being documented as the third tier of neuronal circuitry
alongside the spinal cord and medulla and extracardiac neurons such as the stellate
ganglia (Armour, 2007). Ganglia within the ICNS, which is capable of functioning as an
independent neuronal circuit (Armour et al., 1998, Murphy et al., 2000), communicate
to co-ordinate peripheral reflex function. This correlates with the data shown
throughout this chapter illustrating a significant level of crosstalk between vagal efferent
nerves and the intrinsic cardiac ganglia.
Study in larger mammals shows that ablation of the ganglia located between the
superior vena cava and the aorta, corresponding to the location of the RNC in the rabbit,
results in the acute elimination of the effects of vagal stimulation (Chiou et al., 1997). It
was proposed that this GP was the ‘head station’ between the extrinsic and intrinsic
cardiac nervous systems (Lo et al., 2013), playing a crucial role in cardiac function and
more importantly, the initiation of autonomic arrhythmias. Previous studies have
demonstrated that individual ganglia do not necessarily have select functions in cardiac
control but instead initiate complex central and local reflexes via the recruitment of
cholinergic and adrenergic efferent postganglionic neurons (Armour, 2011). It is because
of this interaction between ganglionic plexuses and central neuronal command centres,
as well as with neuronal somata within other ganglia of the ICNS (Armour, 2011), that
all ganglia must be examined together in order to understand the true effects of vagal
nerve stimulation on the ICNS.
The data shown herein demonstrates that the induction of both cardiac bradycardia and
AV delay prolongation during combined electrical stimulation of the vagus nerves and
intrinsic cardiac ganglia within the RNC is abolished in the presence of both
hexamethonium and atropine. This data correlates with that shown previously where
vagal nerve stimulation was abolished in the presence of both atropine and

183
hexamethonium (Cardinal et al., 2009, Ng et al., 2001, Brack et al., 2011), without
altering cardiac function in unstimulated conditions and suggests that vagus nerve
stimulation activates subpopulations of intrinsic cardiac neurons thereby modulating
vagal input to both the sinoatrial and atrioventricular nodes.
Nicotinic blockade using hexamethonium leads to compromised synaptic efficacy within
the ICNS, which has previously been shown to reduce cardiac susceptibility to
arrhythmia during episodes of autonomic dysfunction (Gibbons et al., 2012). The
intricacy of the ICNS was further confirmed by Lo et al. (2013) who found that ablation
of the GP located between the superior vena cava and aorta increased susceptibility to
atrial fibrillation, suggested that activity of the extrinsic cardiac nerves including the vagi
may tonically inhibit rather than stimulate the activity of the ICNS.
Despite the data shown here demonstrating a significant interaction between the vagal
nerves and the intrinsic cardiac nervous system, the precise influence of the intrinsic
cardiac ganglia on extrinsic autonomic postganglionic nerve terminal still requires
clarification. Although the isolated innervated heart preparation enables the study of
extrinsic innervation, it does not necessarily provide the ideal platform for investigating
the full ICNS. Traditional Langendorff perfusion via the aorta allows for dissection down
to the level of the heart known to contain the intrinsic cardiac ganglia (Saburkina et al.,
2014, Yuan et al., 1994, Pauza et al., 2002a). Due to the orientation of the heart within
the preparation and connections via the ascending aorta, precise stimulation of intrinsic
cardiac ganglia was difficult to achieve, hence stimulation at only the RNC region being
achievable. Future study would therefore require modification of this preparation to
allow access to the intrinsic cardiac nervous system via the dorsal region of the thorax.
A limiting factor in determining the functional role of the intrinsic cardiac nervous
system using electrical stimulation, is determining the precise positioning of the
stimulating electrode and understanding specifically which ganglia are involved in the
production of the cardiac responses seen. In order to develop a thorough and complete
understanding of the complex involvement of the ICNS in cardiac control, it is vital that
further investigation be done not only to identify the connections between individual
ganglia but also at a more central level, to determine the complete interaction of all

184
levels of neuronal hierarchy from the central command of the brainstem and spinal cord
right down to individual ganglia within the ICNS.

185
Chapter 7: Concluding remarks
Over the past two decades, there has been increasing recognition for the functional role
of the intrinsic cardiac nervous system in the autonomic control of cardiac function. The
location of the ICNS in the rabbit at the level of the heart hilum and at the roots of the
pulmonary veins, correlating with that of the ICNS in humans, suggests that this network
may act as a final stage in the regulation of cardiac control. Previously, only one study
has been aimed at determining the anatomical distribution of the rabbit ICNS (Saburkina
et al., 2014), the data of which correlates with the data from that in this thesis. By
replicating and modifying the methods used in the study from 2014, the effects of
myocardial infarction and heart failure could be investigated.
This is the first study to investigate the functional effects of activating sites within ganglia
of the ICNS in rabbit hearts. Unlike previous in vivo studies conducted in dogs, the tests
carried out in this study were performed on a Langendorff perfused heart preparation
to avoid the influence of extrinsic autonomic nerves and circulatory factors and
therefore demonstrating the functional independence of the nerves and ganglia within
the rabbit ICNS. This study shows that the electrical effects observed were dependent
on cholinergic nicotinic ganglion transmission and that bradycardiac effects were
mediated by cholinergic muscarinic receptors whilst tachycardiac effects were mediated
via postganglionic beta adrenoreceptor sites, correlating with immunohistochemical
data showing the wide phenotypic complexity of the ICNS. Of particular importance are
the clear demonstration of neurons immunoreactive solely for nNOS, with nerve fibres
synapsing with neurons in connecting ganglia. Earlier studies in isolated innervated
rabbit heart preparations showed that stimulation of the cervical vagus nerve produced
an anti-arrhythmic effect on ventricular contraction dependent solely upon nitrergic
postganglionic fibres (Brack et al., 2011, Coote, 2013). This study provides histological
support for this concept and exploration of the physiology of these neurons is required.
The intrinsic cardiac ganglia act not as singular entities, but as part of a larger neuronal
network providing constant finely tuned feedback in the control of cardiac function
(figure 7.1). The continued growing interest of the functional complexity of the ICNS
and the interaction of the ICNS with the remainder of the autonomic neuronal hierarchy,

186
provides numerous avenues for further investigation and the possible utilisation of this
interaction in reversing the damage and dysfunction caused by cardiac disease.
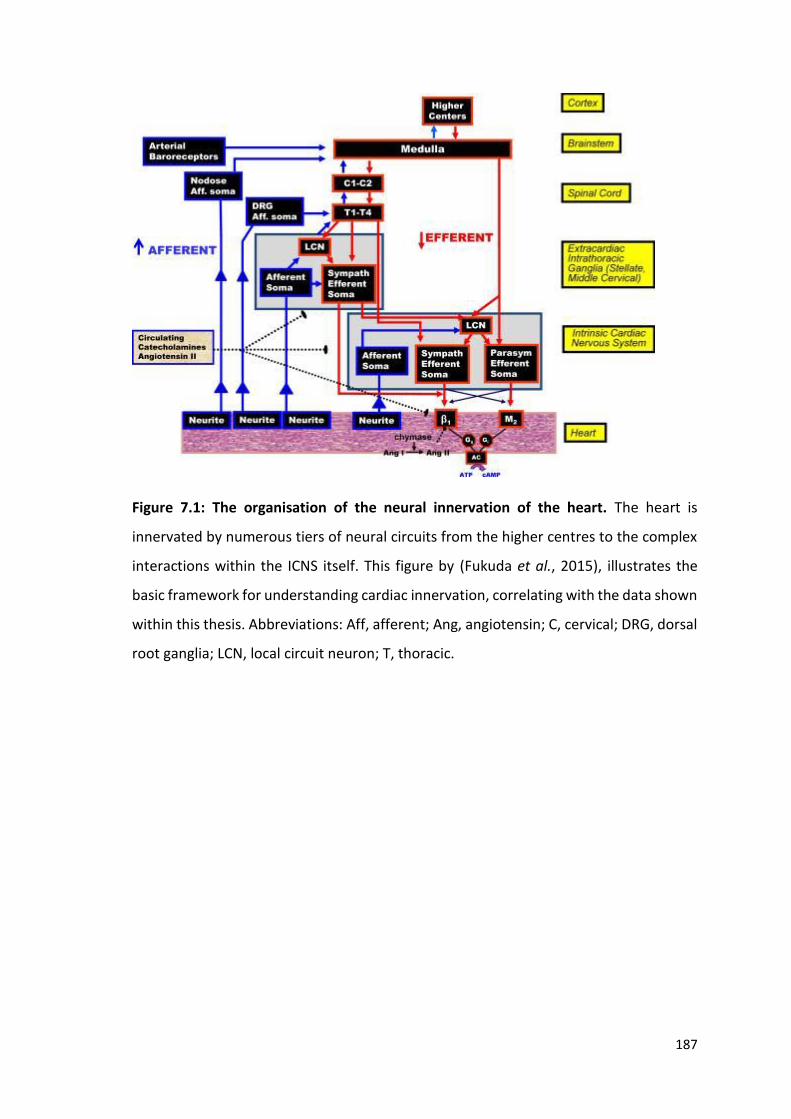
187
Figure 7.1: The organisation of the neural innervation of the heart. The heart is
innervated by numerous tiers of neural circuits from the higher centres to the complex
interactions within the ICNS itself. This figure by (Fukuda et al., 2015), illustrates the
basic framework for understanding cardiac innervation, correlating with the data shown
within this thesis. Abbreviations: Aff, afferent; Ang, angiotensin; C, cervical; DRG, dorsal
root ganglia; LCN, local circuit neuron; T, thoracic.

188
Since the discovery of the ICNS, studies have implicated the involvement of this neuronal
network in not only normal physiology but also in the development of disease
pathology. Heightened sympathetic tone, a recognised pro-arrhythmic marker, along
with an increase in parasympathetic withdrawal indicates a significant involvement of
the autonomic nervous system in heart failure. The significant structural and functional
remodelling of the ICNS also seen as a consequence of MI suggests that one function of
this network is to protect the heart against central neuronal dysregulation and to reduce
the susceptibility of the heart to the development of potentially lethal arrhythmias.
Based on these findings and current literature, the ICNS could be a significant potential
therapeutic target for cardiac diseases with a known involvement of the autonomic
nervous system.
The induction of alterations in the neurochemical phenotype of neurons as a result of
MI is regionally diverse. Recent literature has failed to investigate this alteration within
the ICNS in its entirety. In order to fully understand the significance and link between
these changes in phenotype and the resultant changes in functional capabilities, a
complete phenotypic map of the ICNS in a heart failure needs to be developed. Using
the immunohistochemical techniques detailed within this study with the inclusion of
additional neurochemical markers, in animals that have undergone coronary artery
ligation, would provide an insight into the adaptation and remodelling that occurs within
the ICNS in order to counteract the overall failing of the heart seen in heart failure.
This study has examined the basic functional capabilities of individual ganglionic
plexuses, yet literature suggests this is far from the complete story. In order to
determine the precise interactions between spatially divergent ganglia, further
investigation using pharmacological activation as well as ablation of specific ganglia is
necessary.
The experiments shown in this study also demonstrate an interaction between the
neurons within the intrinsic cardiac nervous system and peripheral neuronal inputs to
the heart. To date, this is the first study to investigate the interactions between the
vagus nerve and the ICNS in the rabbit using a novel modification of the dual innervated
heart preparation. As with the Langendorff preparation, this model allows for the
investigation of this important neural interaction, whilst eliminating the effects of
189
circulatory hormonal factors. The evidence shown herein suggesting that postganglionic
vagal fibres synapse with intrinsic cardiac neurons, supports previous in vivo findings
and highlights the importance of this study. Understanding this important neural
interaction improves our knowledge of cardiac innervation and neural control, with
further investigation being necessary to understand the functional role of the autonomic
nervous system in cardiac diseases including in heart failure and lethal arrhythmias.
One significant difficulty in determining the precise interaction between the spatially
and functionally diverse intrinsic cardiac ganglia and the peripheral nerves was the
accessibility and visualisation of the region of the heart known to contain the ICNS. This
experimental drawback came as a result of the orientation of the heart within the dual
innervated heart preparation. Further investigation into the precise interaction between
specific individual ganglia and the extrinsic neuronal hierarchy would therefore require
modification of the preparation and potentially the development of an alternative
experimental setup to enable access to the region of the heart hilum.
In conclusion, based upon currently available literature and the findings shown within
this study, the ICNS plays a vital role in the control and regulation of cardiac function.
However, in order to fully elucidate the precise involvement of the ICNS in autonomic
control, further research is needed.

190
Chapter 8: Bibliography
ACCILI, E. A., PROENZA, C., BARUSCOTTI, M. & DIFRANCESCO, D. 2002. From funny current to HCN channels: 20 years of excitation. News Physiol Sci, 17, 32-7.
ARDELL, J. L. 1994. Structure and function of mammalian intrinsic cardiac neurons In: ARMOUR, J. A. & ARDELL, J. L. (eds.) Neurocardiology. New York: Oxford University Press.
ARDELL, J. L. & ARMOUR, J. A. 2016. Neurocardiology: Structure-Based Function. Compr Physiol, 6, 1635-1653.
ARDELL, J. L., RAJENDRAN, P. S., NIER, H. A., KENKNIGHT, B. H. & ARMOUR, J. A. 2015. Central-peripheral neural network interactions evoked by vagus nerve stimulation: functional consequences on control of cardiac function. Am J Physiol Heart Circ Physiol, 309, H1740-52.
ARDELL, J. L. & RANDALL, W. C. 1986. Selective vagal innervation of sinoatrial and atrioventricular nodes in canine heart. Am J Physiol, 251, H764-73.
ARMOUR, J. A. 1991. Anatomy and function of the intrathoracic neurons regulating the mammalian heart. In: ZUCKER, I. H. & GILMORE, J. (eds.) Reflex Control of the Circulation. Boca Raton, Fl: CRC Press.
ARMOUR, J. A. 2004. Cardiac neuronal hierarchy in health and disease. Am J Physiol Regul Integr Comp Physiol, 287, R262-71.
ARMOUR, J. A. 2007. The little brain on the heart Cleveland Clinic Journal of Medicine 74, S48-51.
ARMOUR, J. A. 2008. Potential clinical relevance of the 'little brain' on the mammalian heart. Exp Physiol, 93, 165-76.
ARMOUR, J. A. 2011. Physiology of the intrinsic cardiac nervous system. Heart Rhythm, 8, 739.
ARMOUR, J. A., COLLIER, K., KEMBER, G. & ARDELL, J. L. 1998. Differential selectivity of cardiac neurons in separate intrathoracic autonomic ganglia. Am J Physiol, 274, R939-49.
ARMOUR, J. A. & HOPKINS, D. A. 1981. Localization of sympathetic postganglionic neurons of physiologically identified cardiac nerves in the dog. J. Comp. Neurol, 169-184.
ARMOUR, J. A., HUANG, M. H. & SMITH, F. M. 1993. Peptidergic modulation of in situ canine intrinsic cardiac neurons. Peptides, 14, 191-202.
191
ARMOUR, J. A., MURPHY, D. A., YUAN, B. X., MACDONALD, S. & HOPKINS, D. A. 1997. Gross and microscopic anatomy of the human intrinsic cardiac nervous system. Anat Rec, 247, 289-87.
ARORA, R. C. & ARMOUR, J. A. 2003. Adenosine A1 receptor activation reduces myocardial reperfusion effects on intrinsic cardiac nervous system. . Am J Physiol Regul Integr Comp Physiol, 284, R1314-21.
ARORA, R. C., CARDINAL, R., SMITH, F. M., ARDELL, J. L., DELL'ITALIA, L. J. & ARMOUR, J. A. 2003. Intrinsic cardiac nervous system in tachycardia induced heart failure. Am J Physiol Regul Integr Comp Physiol, 285, R1212-23.
AZEVEDO, E. R. & PARKER, J. D. 1999. Parasympathetic control of cardiac sympathetic activity: normal ventricular function versus congestive heart failure. Circulation, 100, 274-9.
BALUK, P. & GABELLA, G. 1990. Some parasympathetic neurons in the guinea-pig heart express aspects of the catecholaminergic phenotype in vivo. Cell Tissue Res, 261, 275-85.
BATTER, C., VEIGEL, C., HOMSHER, E. & SELLERS, J. R. 2014. To understand muscle you must take it apart. Front Physiol, 11, 90.
BATULEVICIUS, D., PAUZIENE, N. & PAUZA, D. H. 2003. Topographic morphology and age-related analysis of the neuronal number of the rat intracardiac nerve plexus. Ann Anat, 185, 449-59.
BATULEVICIUS, D., PAUZIENE, N. & PAUZA, D. H. 2005. Architecture and age-related analysis of the neuronal number of the guinea pig intrinsic cardiac nerve plexus. Ann Anat, 187, 225-43.
BATULEVICIUS, D., SKRIPKA, V., PAUZIENE, N. & PAUZA, D. H. 2008. Topography of the porcine epicardiac nerve plexus as revealed by histochemistry for acetylcholinesterase. Auton Neurosci, 138, 64-75.
BEAUMONT, E., SALAVATIAN, S., SOUTHERLAND, E. M., VINET, A., JACQUEMET, V., ARMOUR, J. & ARDELL, J. L. 2013. Network interactions within the canine intrinsic cardiac nervous system: implications for reflex control of regional cardiac function. J Physiol, 591, 4515-33.
BEAUMONT, E., WRIGHT, G. L., SOUTHERLAND, E. M., LI, Y., CHUI, R., KENKNIGHT, B. H., ARMOUR, J. A. & ARDELL, J. L. 2016. Vagus nerve stimulation mitigates intrinsic cardiac neuronal remodelling and cardiac hypertrophy induced by chronic pressure overload in guinea pig. . Am J Physiol Heart Circ Physiol, 310, H1349-59.

192
BERS, D. M. 2001. Excitation-contraction coupling and cardiac contractile force, London, Kluwer Academic.
BERS, D. M. 2006. Altered cardiac myocyte Ca regulation in heart failure. Physiology (Bethesda), 21, 380-387.
BIBEVSKI, S. & DUNLAP, M. E. 2011. Evidence for impaired vagus nerve activity in heart failure. Heart Fail Rev, 16, 129-35.
BRACK, K. E., COOTE, J. H. & NG, G. A. 2004. Interaction between direct sympathetic and vagus nerve stimulation on heart rate in the isolated rabbit heart. Exp Physiol, 89, 128-39.
BRACK, K. E., COOTE, J. H. & NG, G. A. 2011. Vagus nerve stimulation protects against ventricular fibrillation independent of muscarinic receptor activation. Cardiovasc Res, 91, 437-46.
BRACK, K. E., PATEL, V. H., COOTE, J. H. & NG, G. A. 2007. Nitric oxide mediates the vagal protective effect on ventricular fibrillation via effects on action potential duration restitution in the rabbit heart. J Physiol, 583, 695-704.
BRACK, K. E., WINTER, J. & NG, G. A. 2013. Mechanisms underlying the autonomic modulation of ventricular fibrillation initiation--tentative prophylactic properties of vagus nerve stimulation on malignant arrhythmias in heart failure. Heart Fail Rev, 18, 389-408.
BRODDE, O.-E. & MICHEL, M. C. 1999. Adrenergic and muscarinic receptors in the human heart. Pharmacological Reviews, 51, 651-690.
BROWN, H. F., DIFRANCESCO, D. & NOBLE, S. J. 1979. How does adrenaline accelerate the heart? Nature, 280, 235-236.
BUCCHI, A., BARUSCOTTI, M., ROBINSON, R. B. & DIFRANCESCO, D. 2007. Modulation of rate by autonomic agonists in SAN cells involves changes in diastolic depolarization and the pacemaker current. . J Mol Cell Cardiol, 43, 39-48.
BUTLER, C. K., SMITH, F. M., CARDINAL, R., MURPHY, D. A., HOPKINS, D. A. & ARMOUR, J. A. 1990. Cardiac responses to electrical stimulation of discrete loci in canine atrial and ventricular ganglionated plexi. Am J Physiol 259, H1365-H1373.
CARDINAL, R., PAGE, P., VERMEULEN, M., ARDELL, J. L. & ARMOUR, J. A. 2009. Spatially divergent cardiac responses to nicotinic stimulation of ganglionated plexus neurons in the canine heart. Auton Neurosci, 145, 55-62.

193
CHANG, H. Y., LO, L. W., LIN, Y. J., LEE, S. H., CHIOU, C. W. & CHEN, S. A. 2014. Relationship between intrinsic cardiac autonomic ganglionated plexi and the atrial fibrillation nest. . Circ J, 78, 922-8.
CHENG, Z. & POWLEY, T. L. 2000. Nucleus ambiguus projections to cardiac ganglia of rat atria: an anterograde tracing study. . J Comp Neurol, 424, 588-606.
CHENG, Z., POWLEY, T. L., SCHWABER, J. S. & DOYLE, F. J. R. 1999. Projections of the dorsal motor nucleus of the vagus to cardiac ganglia in rat atria: an anterograde tracing study. . J Comp Neurol, 410, 320-41.
CHIN, S. H. 2017. Autonomic modulation in a rabbit model of heart failure Doctor of Philosophy, University of Leicester.
CHIOU, C. W., EBLE, J. N. & ZIPES, D. P. 1997. Efferent vagal innervation of the canine atria and sinus and atrioventricular nodes. The third fat pad. . Circulation, 95, 2573-84.
CHOATE, J. K., DANSON, E. J., MORRIS, J. F. & PATERSON, D. J. 2001. Peripheral vagal control of heart rate is imparied in neuronal NOS knockout mice. Am J Physiol Heart Circ Physiol, 281, H2310-H2317.
CHOATE, J. K. & PATERSON, D. J. 1999. Nitric oxide inhibits the positive chronotropic and inotropic responses to sympathetic nerve stimulation in the isolated guinea-pig atria. . J Auton Nerv Syst, 75, 100-108.
COHN, J. N., FERRARI, R. & SHARPE, N. 2000. Cardiac remodeling - concepts and clinical implications: a consensus paper from an international forum on cardiac remodeling. . J Am Coll Cardiol, 35, 569-82.
COOTE, J. H. 2013. Myths and realities of the cardiac vagus. J Physiol, 591, 4073-85.
COOTE, J. H. & CHAUHAN, R. A. 2016. The sympathetic innervation of the heart: Important new insights. Autonomic Neuroscience, 199, 17-23.
CRICK, S. J., SHEPPARD, M. N., ANDERSON, R. H., POLAK, J. M. & WHARTON, J. 1996. A quantitative study of nerve distribution in the conduction system of the guinea pig heart. J Anat, 188, 403-16.
CRICK, S. J., SHEPPARD, M. N., HO, S. Y. & ANDERSON, R. H. 1999. Localisation and quantitation of autonomic innervation in the porcine heart 1: conduction system. . J Anat, 195 (pt3), 341-57.
DAWSON, T. A., LI, D., WOODWARD, T., BARBER, Z., WANG, L. & PATERSON, D. J. 2008. Cardiac cholinergic NO-cGMP signalling following acute myocardial infarction and nNOS gene transfer. Am J Physiol Heart Circ Physiol, 295, H990-998.

194
DEHLIN, H. M. & LEVICK, S. P. 2014. Substance P in heart failure: the good and the bad. . Int J Cardiol, 170, 270-7.
DENNINGER, J. W. & MARLETTA, M. A. 1999. Guanylate cylcase and the NO/cGMP signalling pathway Biochim Biophys Acta, 1411, 334-350.
DIFRANCESCO, D. 2010. The role of the funny current in pacemaker activity. Circ Res, 106, 434-46.
DIFRANCESCO, D. & TROMBA, C. 1988. Muscarinic control of the hyperpolarization-activated current (if) in rabbit sino-atrial node myocytes. J Physiol, 405, 493-510.
DUNLAP, M. E., BIBEVSKI, S., ROSENBERRY, T. L. & ERNSBERGER, P. 2003. Mechanisms of altered vagal control in heart failure: influence of muscarinic receptors and acetylcholinesterase activity. Am J Physiol 285, H1632-H1640.
EDLER, I. & HERTZ, C. H. 1954. The use of ultrasonic reflectoscope for the continuous recording of the movements of heart walls. Clinical Physiology and Functional Imaging 24, 118-136.
EINBRODT 1859. Ueber Herzeizung und ihr Verhaeltnis zum Blutdruck. Akad. Wiss. Sitzungsber, 38, 345-359.
FEHER, J. 2012. The cardiac action potential Quantitative Human Physiology Elsevier
FRYATT, A. G., VIAL, C., MULHERAN, M., GUNTHORPE, M. J. & GRUBB, B. D. 2009. Voltage-gated sodium channel expression in rat spiral ganglion neurons Molecular and Cellular Neuroscience 42, 399-407.
FUKUDA, K., KANAZAWA, H., AIZAWA, Y., ARDELL, J. L. & SHIVKUMAR, K. 2015. Cardiac innervation and sudden cardiac death. Circ Res, 116, 2005-19.
GAGLIARDI, M., RANDALL, W. C., BIEGER, D., WURSTER, R. D., HOPKINS, D. A. & ARMOUR, J. A. 1988. Activity of in vivo canine cardiac plexus neurons. Am J Physiol, 255, H789-800.
GATTI, P. J., JOHNSON, T. A. & MASSARI, V. J. 1996. Can neurons in the nucleus ambiguus selectively regulate cardiac rate and atrio-ventricular conduction? . J Auton Nerv Syst, 57, 123-7.
GIBBONS, D. D., SOUTHERLAND, E. M., HOOVER, D. B., BEAUMONT, E., ARMOUR, J. A. & ARDELL, J. L. 2012. Neuromodulation targets intrinsic cardiac neurons to attentuate neuronally mediated atrial arrhythmias. . Am J Physiol Regul Integr Comp Physiol, 302, R357-64.

195
GRAY, A. L., JOHNSON, T. A., ARDELL, J. L. & MASSARI, V. J. 2004. Parasympathetic control of the heart. II. A novel interganglionic intrinsic cardiac circuit mediates nerual control of heart rate. J Appl Physiol (1985), 96, 2273-8
HABECKER, B. A., ANDERSON, M. E., BIRREN, S. J., FUKUDA, K., HERRING, N., HOOVER, D. B., KANAZAWA, H., PATERSON, D. J. & RIPPLINGER, C. M. 2016. Molecular and cellular neurocardiology: developement and cellular and molecular adaptations to heart disease. . J Physiol, 594, 3853-75.
HAMRELL, B. B. & ALPERT, N. R. 1986. Cellular basis of the mechanical properties of hypertrophied myocardium. . In: FOZZARD, H. A., HABER, E., JENNINGS, R. B., KATZ, A. M. & MORGAN, H. E. (eds.) The heart and cardiovascular system New York (NY): Raven Press.
HARDWICK, J. C., RYAN, S. E., BEAUMONT, E., ARDELL, J. L. & SOUTHERLAND, E. M. 2014. Dynamic remodeling of the guinea pig intrinsic cardiac plexus induced by chronic myocardial infarction. Auton Neurosci, 181, 4-12.
HAUPTMAN, P. J., SCHWARTZ, P. J., GOLD, M. R., BORGGREFE, M., VAN VELDHUISEN, D. J., STARLING, R. C. & MANN, D. L. 2012. Rationale and study design of the increase of vagal tone in heart failure study: INOVATE-HF. Am Heart J, 163, 954-962 e1.
HE, B., LU, Z., HE, W., WU, L., CUI, B., HU, X., YU, L., HUANG, C. & JIANG, H. 2013. Effects of ganglionated plexi ablation on ventricular electrophysiological properties in normal hearts and after acute myocardial ischemia. Int J Cardiol, 168, 86-93.
HENNING, R. J. & SAWMILLER, D. R. 2001. Vasoactive intestinal peptide: cardiovascular effects. . Cardiovasc Res, 49, 27-37.
HERRING, N. 2015. Autonomic control of the heart: going beyond the classical neurotransmitters. . Exp Physiol, 100, 354-8.
HERRING, N., CRANLEY, J., LOKALE, M. N., LI, D., SHANKS, J., ALSTON, E. N., GIRARD, B. M., CARTER, E., PARSONS, R. L., HABECKER, B. A. & PATERSON, D. J. 2012. The cardiac sympathetic co-transmitter galanin reduces acetylcholine release and vagal bradycardia: implications for neural control of cardiac excitability. J Mol Cell Cardiol, 52, 667-76.
HERRING, N., DANSON, E. J. & PATERSON, D. J. 2002. Cholinergic control of heart rate by nitric oxide is site specific. News Physiol Sci, 17, 202-6.
HERRING, N., LOKALE, M. N., DANSON, E. J., HEATON, D. A. & PATERSON, D. J. 2008. Neuropeptide Y reduces acetylcholine release and vagal bradycardia via a Y2 receptor-mediated, protein kinase C-dependent pathway. J Mol Cell Cardiol, 44, 477-85.

196
HERRING, N. & PATERSON, D. J. 2001. Nitric oxide-cGMP pathway facilitates acetylcholine release and bradycardia during vagal nerve stimulation in the guinea-pig in vitro. J Physiol, 535, 507-18.
HERRING, N. & PATERSON, D. J. 2009. Neuromodulators of peripheral cardiac sympatho-vagal balance. Exp Physiol, 94, 46-53.
HERRING, N., ZAMAN, J. A. & PATERSON, D. J. 2001. Natriuretic peptides like NO facilitate cardiac vagal neurotransmission and bradycardia via a cGMP pathway. Am J Physiol Heart Circ Physiol, 281, H2318-27.
HERSHBERGER, R. E., ANDERSON, F. L. & BRISTOW, M. R. 1988. The vasoactive intestinal peptide receptor in failing human ventricular myocardium exhibits increased affinity and decreased density. Circ Res, 65, 283-94.
HOARD, J. L., HOOVER, D. B. & WONDERGEM, R. 2007. Phenotypic properties of adult mouse intrinsic cardiac neurons maintained in culture. Am J Physiol Cell Physiol, 293, C1875-83.
HOOVER, D. B. 1990. Effects of substance P on rate and perfusion pressure in the isolated guinea pig heart. J Pharmacol Exp Ther, 252, 179-84.
HOOVER, D. B., GANOTE, C. E., FERGUSON, S. M., BLAKELY, R. D. & PARSONS, R. L. 2004. Localization of cholinergic innervation in guinea pig heart by immunohistochemistry for high-affinity choline transporters. Cardiovasc Res, 62, 112-21.
HOOVER, D. B. & HANCOCK, J. C. 1988. Distribution of substance P binding sites in guinea-pig heart and pharmacological effects of substance P. J Auton Nerv Syst, 23, 189-97.
HOOVER, D. B., ISAACS, E. R., JACQUES, F., HOARD, J. L., PAGE, P. & ARMOUR, J. A. 2009. Localization of multiple neurotransmitters in surgically derived specimens of human atrial ganglia. Neuroscience, 164, 1170-9.
HOOVER, D. B., SHEPHERD, A. V., SOUTHERLAND, E. M., ARMOUR, J. A. & ARDELL, J. L. 2008. Neurochemical diversity of afferent neurons that transduce sensory signals from dog ventricular myocardium. Auton Neurosci, 141, 38-45.
HOPKINS, D. A. & ARMOUR, J. A. 1984. Localization of sympathetic postganglionic and parasympathetic preganglionic neurons which innervate different regions of the dog heart. J Comp Neurol, 229, 186-98.
HOPKINS, D. A. & ARMOUR, J. A. 1989. Ganglionic distribution of afferent neurons innervating the canine heart and cardiopulmonary nerves. J Auton Nerv Syst, 26, 213-22.

197
HOPKINS, D. A., MACDONALD, S. E., MURPHY, D. A. & ARMOUR, J. A. 2000. Pathology of intrinsic cardiac neurons from ischemic human hearts. Anat Rec, 259, 424-36.
HORACKOVA, M., SLAVIKOVA, J. & BYCZKO, Z. 2000. Postnatal development of the rat intrinsic cardiac nervous system: a confocal laser scanning microscopy study in whole-mount atria. Tissue Cell, 32, 377-88.
HOU, Y., SCHERLAG, B. J., LIN, J., ZHOU, J., SONG, J., ZHANG, Y., PATTERSON, E., LAZZARA, R., JACKMAN, W. M. & PO, S. S. 2007a. Interactive atrial neural network: Determining the connections between ganglionated plexi. Heart Rhythm, 4, 56-63.
HOU, Y., SCHERLAG, B. J., LIN, J., ZHOU, J., SONG, J., ZHANG, Y., PATTERSON, E., LAZZARA, R., JACKMAN, W. M. & PO, S. S. 2007b. Interactive atrial neural network: Determining the connections between ganglionated plexi. . Heart Rhythm, 4, 56-63.
HUANG, M. H., ARDELL, J. L., HANNA, B. D., WOLF, S. G. & ARMOUR, J. A. 1993. Effects of transient coronary artery occlusion on canine intrinsic cardiac neuronal activity. Integr Physiol Behav Sci, 28, 5-21.
IMAIZUMI, S., MAZGALEV, T., DREIFUS, L. S., MICHELSON, E. L., MIYAGAWA, A., BHARATI, S. & LEV, M. 1990. Morphological and electrophysiological correlates of atrioventricular nodal response to increased vagal activity. . Circulation, 82, 951-64.
INOKAITIS, H., PAUZIENE, N., RYSEVAITE-KYGUOLIENE, K. & PAUZA, D. H. 2016. Innervation of sinoatrial nodal cells in the rabbit. Ann Anat, 205, 113-21.
KALLA, M., CHOTALIA, M., COUGHLAN, C., HAO, G., CRABTREE, M. J., TOMEK, J., BUB, G., PATERSON, D. J. & HERRING, N. 2016. Protection against ventricular fibrillation via cholinergic receptor stimulation and the generation of nitric oxide. J Physiol, 594, 3981-3992.
KARNOVSKY, M. J. & ROOTS, L. 1964. A "Direct-Coloring" Thiocholine Method for Cholinesterases. J Histochem Cytochem, 12, 219-21.
KAWASHIMA, T. 2005. The autonomic nervous system of the human heart with special reference to its origin, course and peripheral distribution. Anat. Emybryol, 425-438.
KEMBER, G., ARMOUR, J. A. & ZAMIR, M. 2011. Neural control of heart rate: the role of neuronal networking. J Theor Biol, 277, 41-7.
KLIMASCHEWSKI, L., KUMMER, W., MAYER, B., COURAUD, J. Y., PREISSLER, U., PHILIPPIN, B. & HEYM, C. 1992. Nitric oxide synthase in cardiac nerve fibers and neurons of rat and guinea pig heart. Circ Res, 71, 1533-7.

198
KOELLE, G. B., MASSOULIE, J., EUGENE, D., MELONE, M. A. & BOULLA, G. 1987. Distributions of molecular forms of acetylcholinesterase and butrylcholinesterase in nervous tissue of the cat. . Proc Natl Acad Sci U S A, 84, 7749-52.
KOUMI, S., BACKER, C. L. & ARENTZEN, C. E. 1995. Characterization of Inwardly Rectifying K+ Channel in Human Cardiac Myocytes. Alterations in channel behaviour in myocytes isolated from patients with idiopathic dilated cardiomyopathy. . Circulation, 92, 164-74.
KUNCOVA, J., SLAVIKOVA, J. & REISCHIG, J. 2003. Distribution of vasoactive intestinal polypeptide in the rat heart: effect of guanethidine and capsaicin. Ann Anat, 185, 153-61.
KUROTOBI, T., SHIMADA, S., KINO, N., ITO, K., TONOMURA, D., YANO, K., TANAKA, C., YOSHIDA, M., TSUCHIDA, M. & FUKUMOTO, H. 2015. Features of intrinsic ganglionated plexi in both atria after extensive pulmonary isolation and their clinical significance after catheter ablation in patients with atrial fibrillation. Heart Rhythm, 12, 470-6.
LA ROVERE, M. T., BIGGER JR, J. T., MARCUS, F. I., MORTARA, A. & SCHWARTZ, P. J. 1998. Baroreflex sensitivity and heart rate variability in prediction of total cardiac mortality after myocardial infarction. Lancet, 351, 478-484.
LANGLEY, G. 1921. The Autonomic Nervous System Cambridge, UK., Cambridge University Press
LAZZARA, R., SCHERLAG, B. J., ROBINSON, M. J. & SAMET, P. 1973. Selective in situ parasympathetic control of the canine sinoatrial and atrioventricular nodes. Circ Res, 32, 393-401.
LEDERER, W. J., BERLIN, J. R., COHEN, N. M., HADLEY, R. W., BERS, D. M. & CANNELL, M. B. 1990. Excitation-contraction coupling in heart cells. Roles of the sodium-calcium exchange, the calcium current, and the sarcoplasmic reticulum. Ann N Y Acad Sci, 588, 190-206.
LEVY, M. N. & MARTIN, P. J. 1996. Autonomic control of cardiac conduction and automaticity. In: SHEPHERD, J. T. & VATNER, S. F. (eds.) Nervous Control of the Heart. Amsterdam: Harwood Academic Publishers.
LEVY, M. N., YANG, T. & WALLICK, D. W. 1993. Assessment of beat-by-beat control of heart rate by the autonomic nervous system: molecular biology technique are necessary, but not sufficient. J Cardiovasc Electrophysiol, 4, 183-193.
LI, L., HATCHER, J. T., HOOVER, D. B., GU, H., WURSTER, R. D. & CHENG, Z. J. 2014. Distribution and morphology of calcitonin gene-related peptide and substance P immunoreactive axons in the whole-mount atria of mice. Auton Neurosci, 181, 37-48.
199
LIAO, K., YU, L., ZHOU, X., SAREN, G., WANG, S., WANG, Z., HUANG, B., YANG, K. & JIANG, H. 2015. Low-level baroreceptor stimulation suppresses atrial fibrillation by inhibiting ganglionated plexus activity. Can J Cardiol, 31, 767-74.
LO, L. W., SCHERLAG, B. J., CHANG, H. Y., LIN, Y. J., CHEN, S. A. & PO, S. S. 2013. Paradoxical long-term proarrhythmic effects after ablating the "head station" ganglionated plexi of the vagal innervation to the heart. Heart Rhythm, 10, 751-7.
LORENTZ, C. U., PARRISH, D. C., ALSTON, E. N., PELLEGRINO, M. J., WOODWARD, W. R., HEMPSTEAD, B. L. & HABECKER, B. A. 2013. Sympathetic denervation of peri-infarct myocardium requires the p75 neurotrophin receptor. . Exp Neurol, 249, 111-119.
LOSCALZO, J. & VITA, J. A. 2000. Nitric Oxide and the Cardiovascular System Humana Press.
LUNDBERG, J. M., FRANCO-CERECEDA, A., LACROIX, J. S. & PERNOW, J. 1991. Release of vasoactive peptides from autonomic and sensory nerves. Blood Vessels, 28, 27-34.
MARX, S. O., REIKEN, S., HISAMATSU, Y., JAYARAMAN, T., BURKHOFF, D., ROSEMBLIT, N. & MARKS, A. R. 2000. PKA phosphorylation dissociates FKBP12.6 from the calcium release channel (ryanodine receptor): defective regulation in failing hearts. . Cell 101, 365-76.
MONGILLO, M., TOCCHETTI, C. G., TERRIN, A., LISSANDRON, V., CHEUNG, Y. F., DOSTMANN, W. R., POZZAN, T., KASS, D. A., PAOLOCCI, N., HOUSLAY, M. D. & ZACCOLO, M. 2006. Compartmentalized phosphodiesterase-2 activity blunts beta-adrenergic cardiac inotropy via an NO/cGMP-dependent pathway. . Circ Res, 98, 226-234.
MOSS, E., CARDINAL, R., YIN, Y. & PAGE, P. 2013. Bilateral atrial ganglionated plexus involvement in atrial responses to left-sided plexus stimulation in canines. Cardiovasc Res, 99, 194-202.
MURPHY, D. A., THOMPSON, G. W., ARDELL, J. L., MCCRATY, R., STEVENSON, R. S., SANGALANG, V. E., CARDINAL, R., WILKINSON, M., CRAIG, S., SMITH, F. M., KINGMA, J. G. & ARMOUR, J. A. 2000. The heart reinnervates after transplantation. Ann Thorac Surg, 69, 1769-81.
MURRARY, K. J. 1990. Cyclic AMP and mechanisms of vasodilation. Pharmacol Ther, 47, 329-45.
NAKAMURA, K., AJIJOLA, O. A., ALIOTTA, E., ARMOUR, J. A., ARDELL, J. L. & SHIVKUMAR, K. 2016. Pathological effects of chronic myocardial infarction on peripheral neurons mediating cardiac neurotransmission. . Auton Neurosci, 197, 34-40.

200
NERBONNE, J. M. & KASS, R. S. 2005. Molecular Physiology of Cardiac Repolarization. Physiol Rev, 85, 1205-1253.
NG, G. A. 2016. Neuro-cardiac interaction in malignant ventricular arrhythmia and sudden cardiac death. Auton Neurosci, 199, 66-79.
NG, G. A., BRACK, K. E. & COOTE, J. H. 2001. Effects of direct sympathetic and vagus nerve stimulation on the physiology of the whole heart - a novel model of isolated Langendorff perfused rabbit heart with intact dual autonomic innervation. . Exp Physiol, 86, 319-29.
NG, G. A., BRACK, K. E., PATEL, V. H. & COOTE, J. H. 2007. Autonomic modulation of electrical restitution, alternans and ventricular fibrillation initiation in the isolated heart. Cardiovasc Res, 73, 750-60.
NG, G. A., COBBE, S. M. & SMITH, G. L. 1998. Non-uniform prolongation of intraceullar Ca2+ transients recorded from the epicardial surface of isolated hearts from rabbits with heart failure Cardiovasc Res, 37, 489-502.
NOLAN, J., BATIN, P. D., ANDREWS, R., LINDSAY, S. J., BROOKSBY, P., MULLEN, M., BAIG, W., FLAPAN, A. D., COWLEY, A., PRESCOTT, R. J., NEILSON, J. M. & FOX, K. A. 1998. Prospective study of heart rate variability and mortality in chronic heart failure: results of the United Kingdom heart failure evaluation and assessment of risk trial (UK-heart). Circulation, 98, 1510-6.
NORRIS, J. E., LIPPINCOTT, D. & WURSTER, R. D. 1977. Responses of canine endocardium to stimulation of the upper thoracic roots. Am J Physiol, 233, H655-9.
OLIVAS, A., GARDNER, R. T., WANG, L., RIPPLINGER, C. M., WOODWARD, W. R. & HABECKER, B. A. 2016. Myocardial infarction causes transient cholinergic transdifferentiation of cardiac sympathetic nerves via gp130. J Neurosci, 36, 479-88.
OPIE, L. H. 2004. Heart physiology: from cell to circulation, Lippincott Williams and Wilkins.
OSMAN, F., KUNDU, S., TUAN, J., JEILAN, M., STAFFORD, P. J. & NG, G. A. 2010. Ganglionic plexus ablation during pulmonary vein isolation - predisposing to ventricular arrhythmias? Indian Pacing Electrophysiol J, 10, 104-107.
PAPKA, R. E. & URBAN, L. 1987. Distribution, origina and sensitivity to capcaicin of primary afferent substance P-immunoreactive nerves in the heart. Acta Physiol Hung, 69, 459-68.
PARSONS, R. L., LOCKNAR, S. A., YOUNG, B. A., HOARD, J. L. & HOOVER, D. B. 2006. Presence and co-localization of vasoactive intestinal polypeptide with neuronal nitric
201
oxide synthase in cells and nerve fibers within guinea pig intrinsic cardiac ganglia and cardiac tissue. Cell Tissue Res, 323, 197-209.
PAUZA, D. H., PAUZIENE, N., PAKELTYTE, G. & STROPUS, R. 2002a. Comparative quantitative study of the intrinsic cardiac ganglia and neurons in the rat, guinea pig, dog and human as revealed by histochemical staining for acetylcholinesterase. Ann Anat, 184, 125-36.
PAUZA, D. H., RYSEVAITE-KYGUOLIENE, K., VISMANTAITE, J., BRACK, K. E., INOKAITIS, H., PAUZA, A. G., RIMASAUSKAITE-PETRAITIENE, V., PAUZAITE, J. I. & PAUZIENE, N. 2014. A combined acetylcholinesterase and immunohistochemical method for precise anatomical analysis of intrinsic cardiac neural structures. Ann Anat, 196, 430-40.
PAUZA, D. H., SABURKINA, I., RYSEVAITE, K., INOKAITIS, H., JOKUBAUSKAS, M., JALIFE, J. & PAUZIENE, N. 2013. Neuroanatomy of the murine cardiac conduction system: a combined stereomicroscopic and fluorescence immunohistochemical study. Auton Neurosci, 176, 32-47.
PAUZA, D. H., SKRIPKA, V. & PAUZIENE, N. 2002b. Morphology of the intrinsic cardiac nervous system in the dog: a whole-mount study employing histochemical staining with acetylcholinesterase. Cells Tissues Organs, 172, 297-320.
PAUZA, D. H., SKRIPKA, V., PAUZIENE, N. & STROPUS, R. 2000. Morphology, distribution, and variability of the epicardiac neural ganglionated subplexuses in the human heart. Anat Rec, 259, 353-82.
PAUZIENE, N., ALABURDA, P., RYSEVAITE-KYGUOLIENE, K., PAUZA, A. G., INOKAITIS, H., MASAITYTE, A., RUDOKAITE, G., SABURKINA, I., PLISIENE, J. & PAUZA, D. H. 2016. Innervation of the rabbit cardiac ventricles. J Anat, 228, 26-46.
POOLE-WILSON, P. A. 1993. Heart failure. Unfinished business - a possible role for vasodilators. . Int J Cardiol, 40, 1-6.
PRIOLA, D. V., SPURGEON, H. A. & GEIS, W. P. 1977. The intrinsic innervation of the canine heart: a functional study. Circ Res, 40, 50-56.
PYE, M. P., BLACK, M. & COBBE, S. M. 1996. Comparison of in vivo and in vitro haemodynamic function in experimental heart failure: use of echocardiography. Cardiovasc Res
31, 873-81.
RAJENDRAN, P. S., NAKAMURA, K., AJIJOLA, O. A., VASEGHI, M., ARMOUR, J. A., ARDELL, J. L. & SHIVKUMAR, K. 2016. Myocardial infarction induces structural and functional remodeling of the intrinsic cardiac nervous system. J Physiol, 594 (2), 321-341.

202
RANDALL, D. C., BROWN, D. R., LI, S. G., OLMSTEAD, M. E., KILGORE, J. M., SPRINKLE, A. G., RANDALL, W. C. & ARDELL, J. L. 1998. Ablation of posterior atrial ganglionated plexus potentiates sympathetic tachycardia to behavioral stress. Am J Physiol, 275, R779-87.
RANDALL, D. C., BROWN, D. R., MCGUIRT, A. S., THOMPSON, G. W., ARMOUR, J. A. & ARDELL, J. L. 2003. Interactions within the intrinsic cardiac nervous system contribute to chronotropic regulation. Am J Physiol Integr Comp Physiol, 285, 1066-75.
RANDALL, D. C., RANDALL, W. C., BROWN, D. R., YINGLING, J. D. & RAISCH, R. M. 1992. Heart rate control in awake dog after selective SA-nodal parasympathectomy. Am J Physiol, 262, H1128-35.
RANDALL, W. C. 1977. Sympathetic Control of the Heart. In: RANDALL, W. C. (ed.) Neural Regulation of the Heart New York: Oxford University Press.
RANDALL, W. C., ARDELL, J. L. & BECKER, D. M. 1985. Differential responses accompanying sequential stimulation and ablation of vagal branches to dog heart. Am J Physiol, 249, H133-40.
RANDALL, W. C., WURSTER, R. D., RANDALL, D. C. & XI-MOY, S. X. 1996. From cardioaccelerator and inhibitory nerves to a heart brain: an evolution of concepts. In: J.T., S. & VAINER, S. F. (eds.) Nervous Control of the Heart Amsterdam: Hardwood Academic Publishers.
RICHARDSON, R. J., GRKOVIC, I. & ANDERSON, C. R. 2003. Immunohistochemical analysis of intracardiac ganglia of the rat heart. Cell Tissue Res, 314, 337-50.
RYSEVAITE, K., SABURKINA, I., PAUZIENE, N., NOUJAIM, S. F., JALIFE, J. & PAUZA, D. H. 2011a. Morphologic pattern of the intrinsic ganglionated nerve plexus in mouse heart. Heart Rhythm, 8, 448-54.
RYSEVAITE, K., SABURKINA, I., PAUZIENE, N., VAITKEVICIUS, R., NOUJAIM, S. F., JALIFE, J. & PAUZA, D. H. 2011b. Immunohistochemical characterization of the intrinsic cardiac neural plexus in whole-mount mouse heart preparations. Heart Rhythm, 8, 731-8.
SABBAH, H. N., STEIN, P. D., KONO, T., GHEORGHIADE, M., LEVINE, T. B., JAFRI, S., HAWKINS, E. T. & GOLDSTEIN, S. 1991. A canine model of chronic heart failure produced by multiple sequential coronary microembolizations. Am J Physiol Heart Circ Physiol, 260, H1379-1384.
SABURKINA, I., GUKAUSKIENE, L., RYSEVAITE, K., BRACK, K. E., PAUZA, A. G., PAUZIENE, N. & PAUZA, D. H. 2014. Morphological pattern of intrinsic nerve plexus distributed on the rabbit heart and interatrial septum. J Anat, 224, 583-93.

203
SABURKINA, I., RYSEVAITE, K., PAUZIENE, N., MISCHKE, K., SCHAUERTE, P., JALIFE, J. & PAUZA, D. H. 2010. Epicardial neural ganglionated plexus of ovine heart: anatomic basis for experimental cardiac electrophysiology and nerve protective cardiac surgery. Heart Rhythm, 7, 942-50.
SCHERLAG, B. J. & PO, S. 2006. The intrinsic cardiac nervous system and atrial fibrillation. Curr Opin Cardiol, 21, 51-4.
SCHRODER, F., HANDROCK, R., BEUCKELMANN, D. J., HIRT, S., HULLIN, R., PRIEBE, L., SCHWINGER, R. H., WEIL, J. & HERZIG, S. 1998. Increased availability and open probability of single L-type calcium channels from failing compared with nonfailing human ventricle. Circulation, 98, 969-76.
SCHWARTS, P. J. & FERRARI, G. M. 2011. Sympathetic-parasympathetic interaction in health and disease: abnormalities and relevance in heart failure. Heart Fail Rev, 16, 101-107.
SEKI, A., GREEN, H. R., LEE, T. D., HONG, L., TAN, J., VINTERS, H. V., CHEN, P. S. & FISHBEIN, M. C. 2014. Sympathetic nerve fibers in human cervical and thoracic vagus nerves. Heart Rhythm, 11, 1411-7.
SERONE, A. P. & ANGUS, J. A. 1999. Neuropeptide Y is a prejunctional inhibitor of vagal but not sympathetic inotropic responses in guinea-pig isolated left atria. Br J Pharmacol, 127, 383-90.
SHEN, M. J. & ZIPES, D. P. 2014. Role of the autonomic nervous system in modulating cardiac arrhythmias. Circ Res, 114, 1004-1021.
SINGH, S., JOHNSON, P. I., LEE, R. E., ORFEI, E., LONCHYNA, V. A., SULLIVAN, H. J., MONTOYA, A., TRAN, H., WEHRMACHER, W. H. & WURSTER, R. D. 1996. Topography of cardiac ganglia in the adult human heart. J Thorac Cardiovasc Surg, 112, 943-53.
SINGH, S., SAYERS, S., WALTER, J. S., THOMAS, D., DIETER, R. S., NEE, L. M. & WURSTER, R. D. 2013. Hypertrophy of neurons within cardiac ganglia in human, canine, and rat heart failure: the potential role of nerve growth factor. J Am Heart Assoc, 2, e000210.
SLAVIKOVA, J., KUNCOVA, J., REISCHIG, J. & DVORAKOVA, M. 2003. Catecholaminergic neurons in the rat intrinsic cardiac nervous system. Neurochem Res, 28, 593-8.
SMITH, F. M. 1999. Extrinsic inputs to intrinsic neurons in the porcine heart in vitro. Am J Physiol 276, R455-R467.
STEELE, P. A., GIBBINS, I. L. & MORRIS, J. L. 1996. Projections of intrinsic cardiac neurons to different targets in the guinea-pig heart. J Auton Nerv Syst, 56, 191-200.

204
STEELE, P. A., GIBBINS, I. L., MORRIS, J. L. & MAYER, B. 1994. Multiple populations of neuropeptide-containing intrinsic neurons in the guinea-pig heart. Neuroscience, 62, 241-50.
THOMPSON, G. W., COLLIER, K., ARDELL, J. L., KEMBER, G. & ARMOUR, J. A. 2000. Functional interdependence of neurons in a single canine intrinsic cardiac ganglionated plexus. J Physiol, 528, 561-71.
TRIPOSKIADIS, F., KARAYANNIS, G., GIAMOUZIS, G., SKOULARIGIS, J., LOURIDAS, G. & BUTLER, J. 2009a. The sympathetic nervous system in heart failure physiology, pathophysiology, and clinical implications. . J Am Coll Cardiol, 54, 1747-62.
TRIPOSKIADIS, F., KARAYANNIS, G., GIAMOUZIS, G., SKOULARIGIS, J., LOURIDAS, G. & BUTLER, J. 2009b. The sympathetic nervous system in heart failure: physiology, pathophysiology and clinical implications. J Am Coll Cardiol, 54, 1747-1762.
VAITKEVICIUS, R., SABURKINA, I., RYSEVAITE, K., VAITKEVICIENE, I., PAUZIENE, N., ZALIUNAS, R., SCHAUERTE, P., JALIFE, J. & PAUZA, D. H. 2009. Nerve supply of the human pulmonary veins: an anatomical study. Heart Rhythm, 6, 221-8.
VERRIER, R. L., THOMPSON, P. L. & LOWN, B. 1974. Ventricular vulnerability during sympathetic stimulation: role of heart rate and blood pressure Cardiovasc Res, 8, 602-610.
WAKE, E. & BRACK, K. 2016. Characterization of the intrinsic cardiac nervous system Auton Neurosci, 199, 3-16.
WANG, L., LI, D., PLESTED, C. P., DAWSON, T. D., TESCHEMACHER, A. & PATERSON, D. J. 2006. Noradrenergic neuron-specific overexpression of nNOS in cardiac sympathetic nerves decreases neurotransmission. J Mol Cell Cardiol, 41, 364-370.
WANG, Z., FENG, J., SHI, H., POND, A., NERBONNE, J. M. & NATTEL, S. 1999. Potential molecular basis of different physiological properties of transient outward K+ current in rabbit and human atrial myocytes. Circ Res, 84, 551-61.
WEIHE, E. & REINECKE, M. 1981. Peptidergic innervation of the mammalian sinus nodes: vasoactive intestinal peptide, neurotensin, substance P. Neurosc Lett, 26, 283-288.
WINTER, J., TANKO, A. S., BRACK, K. E., COOTE, J. H. & NG, G. A. 2012. Differential cardiac responses to unilateral sympathetic nerve stimulation in the isolated innervated rabbit heart. Auton Neurosci, 166, 4-14.
WOROBIEW, W. P. 1925. Die Nerven des menschlichen und tierischen Herzens. Deutsche Medizin Wochenschift, 36, 1509-1535.
205
XU, Z. J. & ADAMS, D. J. 1993. Alpha-adrenergic modulation of ionic currents in cultured parasympathetic neurons from rat intracardiac ganglia. J Neurophysiol, 69, 1060-70.
YANG, T. & LEVY, M. N. 1984. The phase-dependency of the cardiac chronotropic responses to vagal stimulation as a factor in sympathetic-vagal interactions. Circ Res, 54, 703-10.
YANG, T. & LEVY, M. N. 1992. Sequence of excitation as a factor in sympathetic - parasympathetic interactions in the heart. Circ Res, 71, 898-905.
YU, Y., LIU, L., JIANG, J. Y., QU, X. F. & YU, G. 2012. Parasympathetic and sustance P-immunoreactive nerve denervation in atrial fibrillation models. . Cardiovasc Pathol, 21, 39-45.
YUAN, B. X., ARDELL, J. L., HOPKINS, D. A., LOSIER, A. M. & ARMOUR, J. A. 1994. Gross and microscopic anatomy of the canine intrinsic cardiac nervous system. Anat Rec 239, 75-87.
ZARZOSO, M., RYSEVAITE, K., MILSTEIN, M. L., CALVO, C. J., KEAN, A. C., ATIENZA, F., PAUZA, D. H., JALIFE, J. & NOUJAIM, S. F. 2013. Nerves projecting from the intrinsic cardiac ganglia of the pulmonary veins modulate sinoatrial node pacemaker function. Cardiovasc Res, 99, 566-75.
ZHAO, Q., DENG, H. J., X., DAI, Z., WANG, X., WANG, X., GUO, Z., HU, W., YU, S., YANG, B., TANG, Y. & HUANG, C. 2015. Effects of intrinsic and extrinsic cardiac nerves on atrial arrhythmia in experimental pulmonary artery hypertension. Hypertension, 66, 1042-9.
ZHOU, J., SCHERLAG, B. J., EDWARDS, J., JACKMAN, W. M., LAZZARA, R. & PO, S. S. 2007. Gradients of atrial refractoriness and inducibility of atrial fibrillation due to stimulation of ganglionated plexi. . J Cardiovasc Electrophysiol, 18, 83-90.
ZHOU, S., CHEN, L. S., MIYAUCHI, Y., MIYAUCHI, M., KAR, S., KANGAVARI, S., FISHBEIN, M. C., SHARIFI, B. & CHEN, P. S. 2004. Mechanisms of cardiac nerve sprouting after myocardial infarction in dogs. Circ Res, 95, 76-83.
ZUCKER, I. H., SCHULTZ, H. D., PATEL, K. P., WANG, W. & GAO, L. 2009. Regulation of central angiotensin type 1 receptors and sympathetic outflow in heart failure. Am J Physiol Heart Circ Physiol, 297, H1557-66.